Article

A Study on Maximizing the Performance of a Concrete-Based TiO2 Photocatalyst Using Hydrophilic Polymer Dispersion

1
Korea Institute of Convergence Textile, Iksan 54588, Republic of Korea
2
Global Prodigy Academy, Jeonju 55069, Republic of Korea
3
SKKU Advanced Institute of Nanotechnology (SAINT), Sungkyunkwan University, Suwon 16419, Republic of Korea
4
Institute of Carbon Technology, Jeonju University, Jeonju 55069, Republic of Korea
*
Authors to whom correspondence should be addressed.
Catalysts 2025, 15(10), 935; https://doi.org/10.3390/catal15100935
Submission received: 22 August 2025 / Revised: 24 September 2025 / Accepted: 24 September 2025 / Published: 1 October 2025
(This article belongs to the Special Issue Catalysis Accelerating Energy and Environmental Sustainability)

Abstract

This study investigated the correlation between the dispersion stability and photocatalytic efficiency of titanium dioxide (TiO2) nanoparticles for the development of self-cleaning functional concrete. After pretreatment of P25 TiO2 with aqueous solutions of polyvinyl alcohol (PVA), polyethylene glycol (PEG), and polyethylene glycol methyl ether (PEGME), dynamic light scattering (DLS) and zeta potential measurements were performed, and as a result, a 0.1 wt% PVA solution was optimal for inhibiting aggregation, with an average hydrodynamic diameter of 1.4 µm and a zeta potential of −11 mV. In methylene blue photolysis, the reaction rate constant (k_app) was 1.71 × 10⁻² min−1 (R2 = 0.98), which was improved by 11.4 times compared to the control group, and was about twice as high in the concrete specimen experiment. X-ray diffraction (XRD), scanning electron microscopy (SEM), and Brunauer–Emmett–Teller (BET) analyses confirmed an anatase-to-rutile ratio of 81:19 particle sizes of 10–30 nm, and a specific surface area of 58.985 m2·g−1. As a result, it is suggested that PVA pretreatment is a practical method to effectively improve the photocatalytic performance of TiO2-based self-cleaning concrete.

Graphical Abstract

1. Introduction

In modern society, the efficiency of the transportation and industrial sectors has improved significantly due to the rapid development of science and technology, but at the same time, the emission of greenhouse gases and air pollutants is causing climate change and ecosystem disturbance. In particular, according to statistics from the Ministry of Environment in 2020, road travel pollutants account for 37% of nitrogen oxide (NOx) emissions, and an increase in vehicles and an increase in the ratio of old diesel vehicles are decisive factors in the deterioration of air quality. Since fine dust (PM2.5) and NOx increase the risk of respiratory and cardiovascular diseases and lead to a decrease in the quality of life of residents in areas near industrial complexes, innovative measures to improve the air environment are urgently needed. TiO2 P25 is frequently employed as a powerful photocatalyst to eliminate these contaminants. This is due to the fact that P25 shows a comparatively high degree of activity in a variety of photocatalytic reaction systems [1].
In this context, a technology that imparts self-cleaning and NOx decomposition capabilities by introducing a photocatalytic function to concrete structures is attracting attention. Photocatalysts form electron–hole (e–h+) pairs on the reaction surface when irradiated with ultraviolet rays (UV) and produce active oxygen species such as •OH·, •O2·, etc., underwater and in the atmosphere to perform multiple functions such as decomposition of harmful substances, antibacterial, sterilization, and superhydrophilicity [2,3,4].
Among these photocatalytic materials, TiO2 is widely studied because of its excellent activity and chemical and thermal stability. There are three crystalline forms, Anatase, Rutile, and Brookite, and Anatase can absorb UV areas with a bandgap of 3.2 eV and Rutile of 3.0 eV [5]. Although Brookite is found only in natural minerals and its commercial use is limited, a mixed phase (complex) of Anatase and Rutile is known to increase deep light absorption and charge separation efficiency [1,6,7].
According to scientific research, a number of attempts were conducted to improve the NOx removal rate by mixing nano TiO2 in concrete based on concentration [8], and we confirmed that the NOx removal rate increased by 5.2–11.3% when TiO2 was incorporated at 3–7 wt% compared to the weight of cement; we also reported a maximum reduction of 17.33% when the anatase–rutile ratio was 85:15 nano TiO2 5 wt%. However, this concentration-based mixing method has limitations in terms of aggregation inhibition and dispersion uniformity, and excessive TiO2 addition is accompanied by concerns about deteriorating structural strength and durability [8,9].
Accordingly, wastewater sludge-derived low-cost TiO2 synthesis [10,11,12], N-doping and visible light activation [9,13], and polymer/TiO2 composite research [4,5] have been actively conducted as pretreatment techniques to improve dispersion stability, but integrated studies on the correlation between dispersion uniformity, weather resistance, and self-purification performance in direct application of concrete are insufficient [14,15]. TiO2 photocatalysis has also been investigated recently for the selective recovery of valuable metals. For example, Chen et al. demonstrated the photocatalytic dissolution of precious metals [16] and TiO2-driven selective recovery by Z-scheme [17]. Accordingly, other research has suggested polymer-assisted TiO2 nano-composites and porous hybrid materials as viable approaches to improve photocatalytic performance and dispersion stability in environmental systems [18]. Even though these methods have demonstrated notable gains in membrane and adsorbent system performance, little is known about how directly they may be applied to large-scale structural materials like concrete. In particular, Wang et al. (2015) and Irie et al. (2003) improved catalytic activity through chemical surface treatment, but it is necessary to simplify the process for field applicability and application to large structures [11,12].
In addition, changes in ion concentration (calcium hydroxide, sulfate, chloride, etc.) that occur during the concrete mixing process affect the TiO2 surface charge distribution to accelerate aggregation, which leads to a decrease in photoactivity and deterioration of structure esthetics and durability [19,20,21,22]. Therefore, it is essential to develop a pretreatment technology that can be easily applied to the field and comprehensively improve dispersion stability and photoactivity.
This study aimed to secure aggregation inhibition and dispersion stability by pretreating TiO2 in an aqueous solution using three hydrophilic polymers such as polyvinyl alcohol (PVA), polyethylene glycol (PEG), and polyethylene glycol methyl ether (PEGME), and to identify optimal pretreatment conditions through methylene blue photolysis experiments and self-purified concrete specimen photocatalyst performance evaluation. In addition, by presenting the dispersion process and parameters applicable to the field through the analysis of the dispersion mechanism and comparison of previous studies, it is intended to provide basic data for the development of self-purifying functional concrete.

2. Results

2.1. Analysis of TiO2 Properties

2.1.1. XRD Analysis

For X-ray diffraction (XRD) analysis, the crystal structure of the TiO2 sample was analyzed using SmartLab, Rigaku Co., Ltd. (Tokyo, Japan) (Cu–Kα, λ = 1.5412 Å). Data were collected at a scan rate of 6°·min−1 in the range of 2θ = 20–80°.
From the obtained diffraction pattern (Figure 1a), it was confirmed that the main peak around 2θ = 25.2° corresponds to the anatase 101 plane and the peak around 2θ = 27.3° corresponds to the rutile 110 plane. In addition to these main peaks, various diffraction peaks appeared, such as the (004), (200), (105) plane of the anatase and the (101), (211), and (220) plane of the rutile, which are in good agreement with the standard JCPDS data (the anatase of PDF Card No. 5000223, 7,206,075 and the rutile of No. 9004143; Figure 1b,c). Therefore, it can be seen that in commercial P25, two phases of anatase and rutile exist together and each exhibits several characteristic diffraction peaks. The ratio of anatase and rutile was calculated based on the relative peak intensity, and the results are summarized in Table 1.
As a result of calculating the relative mass fraction of anatase and rutile using the Spurr–Myers equation, this specimen showed a ratio of anatase–rutile ≈ 81:19, which is in good agreement with the average composition (≈80:20) of commercial P25 TiO2 [1]. Therefore, it can be seen that the sample used in this study reflects the typical crystal characteristics of P25 TiO2 well, as summarized in (Table 1).

2.1.2. SEM Analysis

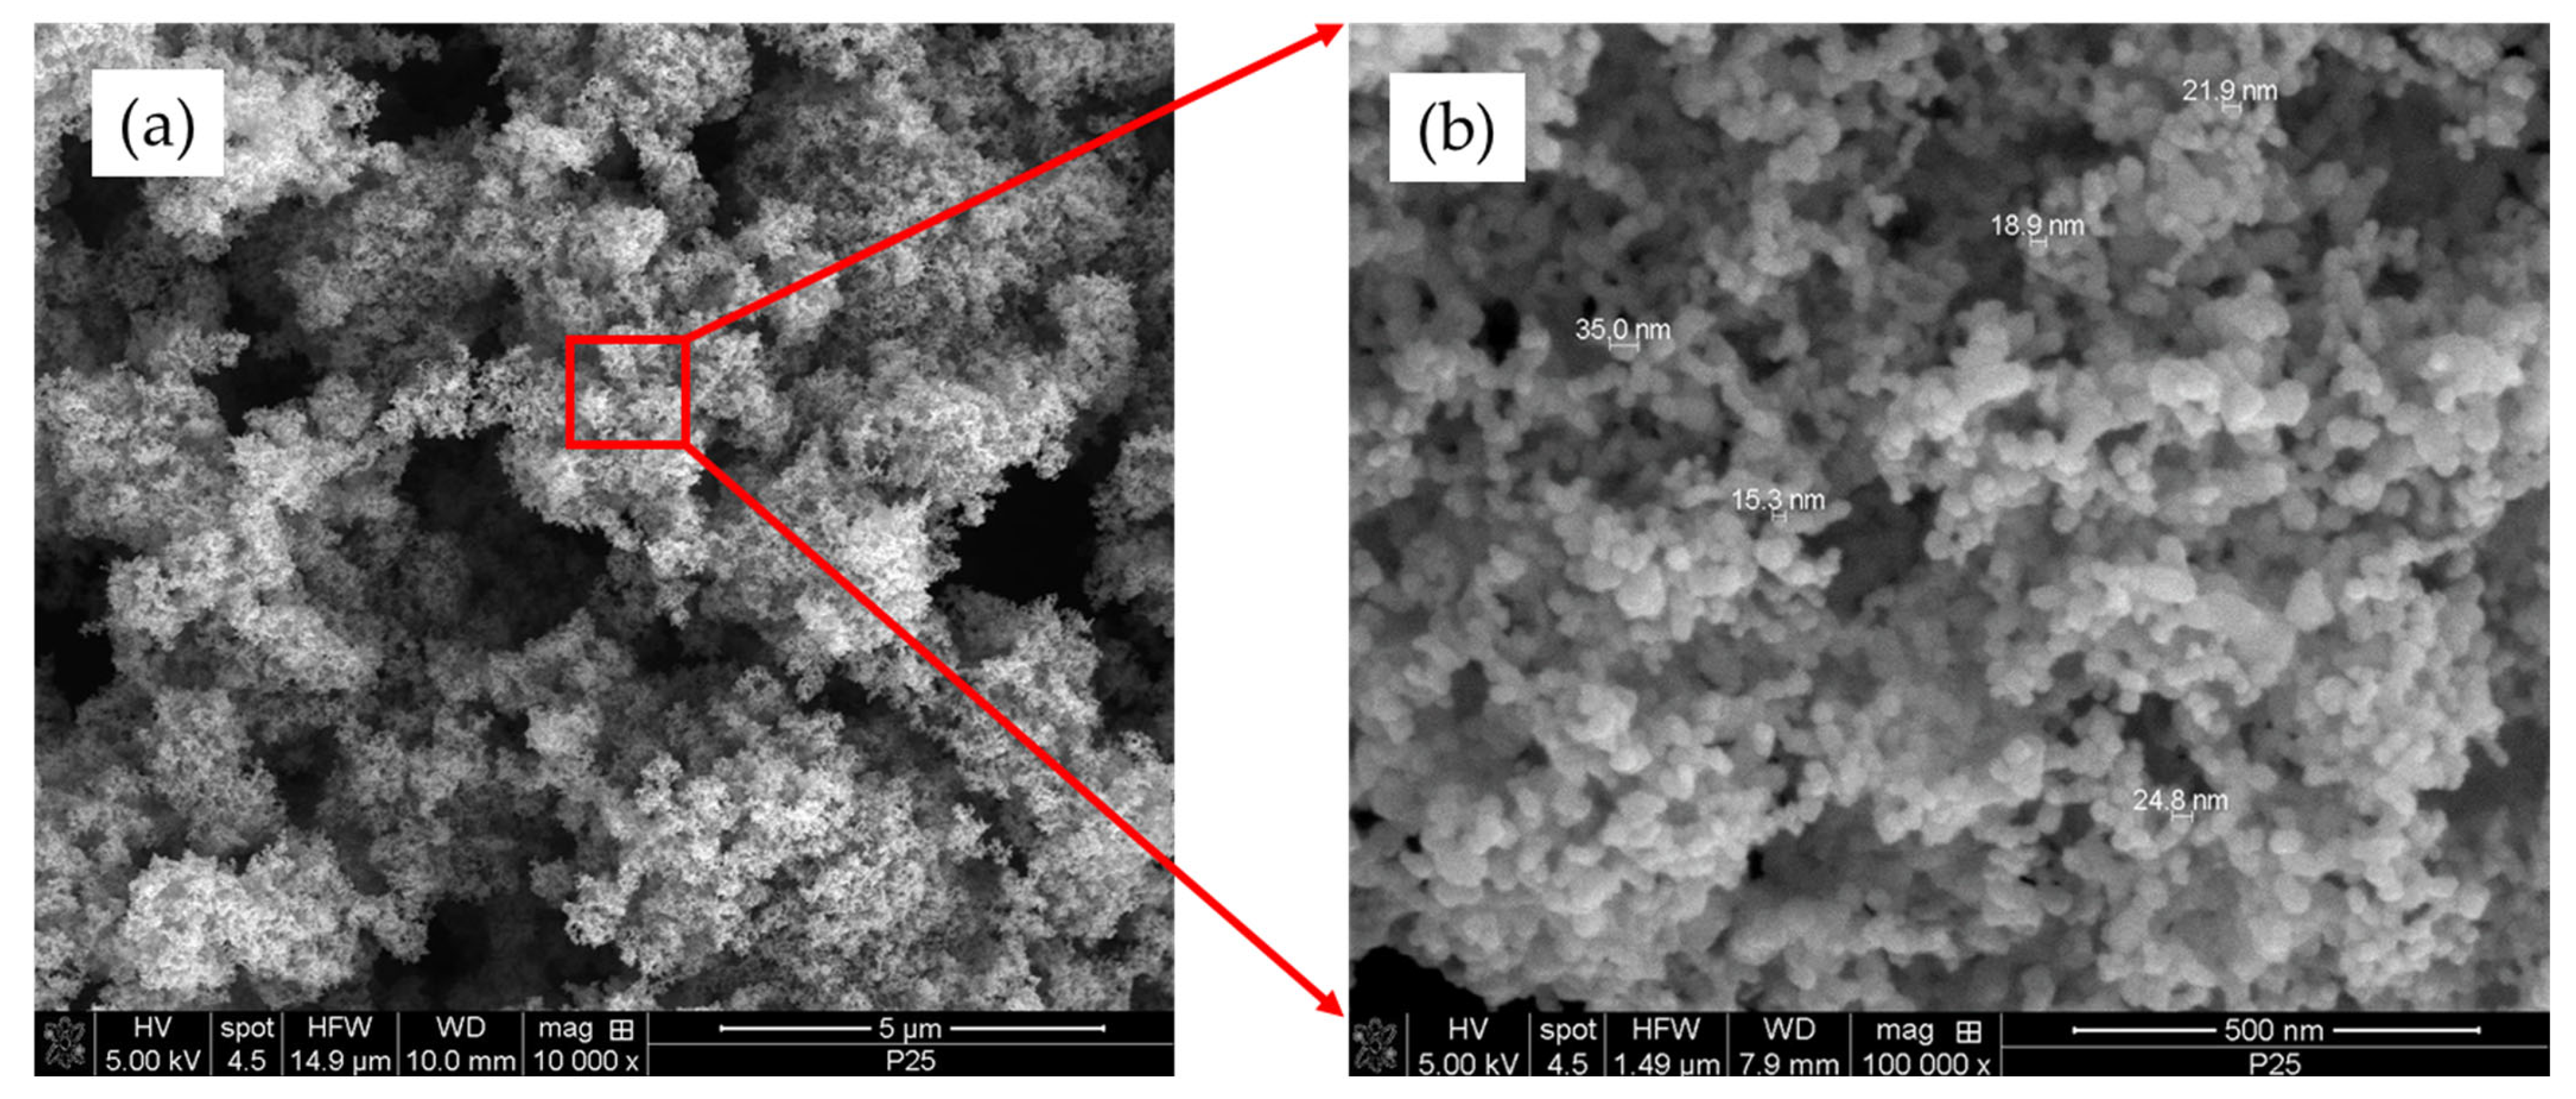
As a result of SEM (Figure 2) observation, TiO2 particles are spherical in shape and have an average diameter of 15 to 35 nm. A portion of the particles also showed an aggregated particle structure, which can reach a size of about ~100 nm. Figure 2a shows the overall particle agglomeration structure observed at 10,000 times magnification, and Figure 2b shows the detailed shape of the nanoparticles observed at 100,000 times. These results imply that individual nanoparticles are aggregated by mechanical and electrostatic bonding, and thus suggest that strategies are needed to suppress self-agglomeration.

2.1.3. BET and BJH Analysis

The specific surface area and pore characteristics of the TiO2 powder were analyzed by the Brunauer–Emmett–Teller (BET) method and the Barrett–Joyner–Halenda (BJH) method, respectively. Nitrogen adsorption–desorption isotherm showed a typical IV-type curve and H1 hysteresis loop Figure 3a, which indicates the presence of a mesoporous structure. Based on the adsorption/desorption curve, 58.985 cm2/g was determined to be the BET specific surface area. Using the BJH approach, the cumulative pore area based on the average pore diameter was calculated from the desorption curve. The average pore diameter (D_avg) was roughly 31.389 nm (Figure 3b). The pore area was 21.315 cm2/g when the average particle diameter was approximately 1.9 nm, and 7.025 cm2/g when it was approximately 2.2 nm. In general, the pore area dropped as the average particle diameter increased. These results show that P25 TiO2 has a high specific surface area and a developed mesoporous structure.

2.2. Comparison of Polymer Preprocessing Dispersion Stability

By incorporating TiO2 in the form of dispersion in the concrete manufacturing process, particle agglomeration and sedimentation were minimized, and photoactivity was improved through uniform distribution. PVA, PEG, and PEGME were used as dispersants at a concentration of 0.1 wt%, and the physical and chemical interaction between the polymer and TiO2 particles was induced through ultrasonic treatment (40 kHz, 3 min). For the evaluation of dispersion stability, the average hydrodynamic diameter was measured with dynamic light scattering (DLS) using Otsuka ELSZ-2000ZS (Otsuka Electronics Korea Co., Ltd., Seongnam-si, Republic of Korea), and the zeta potential was measured with the electrophoresis light scattering method.

2.2.1. Particle Size Ratio Analysis by Distribution Range with PVA, PEG, and PEGME

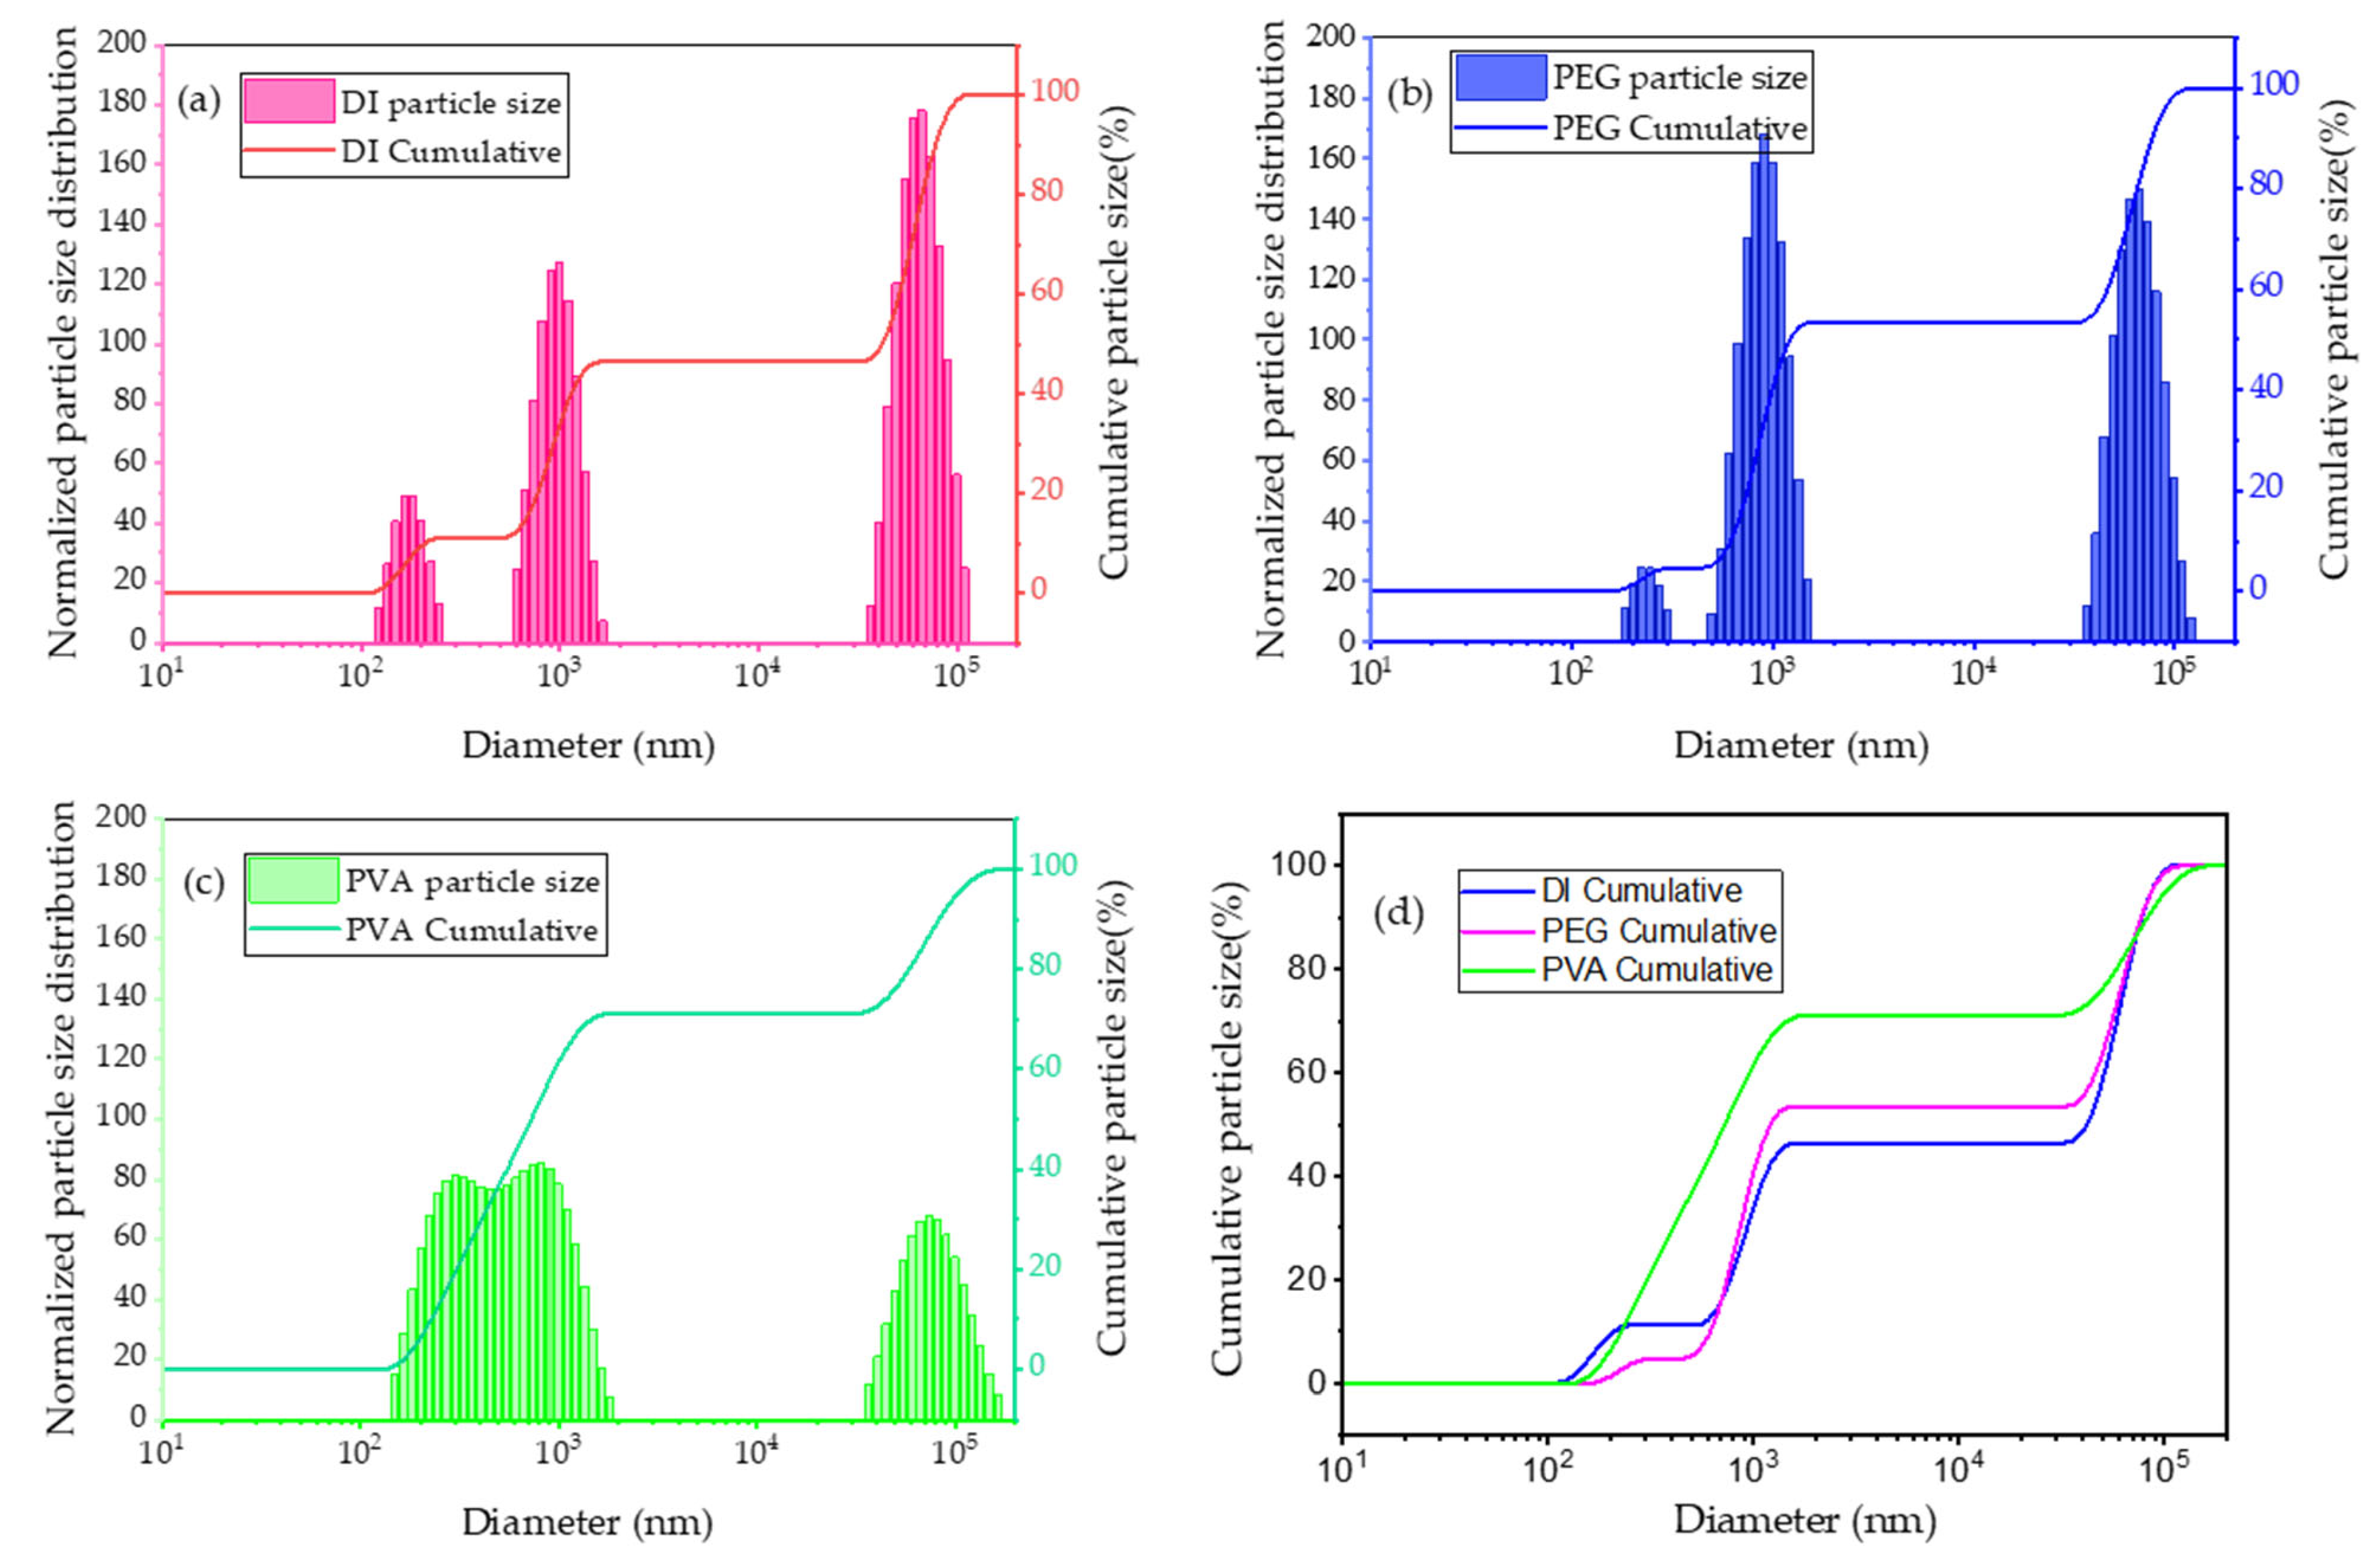
When compared to DI (deionized water), the nano-micron size distribution in PEG and PVA-pretreated TiO2 dispersions changes (Figure 4a–d and Table 2). DI > PEG > PVA was the order of the percentage of big particles greater than 2 microns. The PVA aqueous solution had the lowest proportion, suggesting that TiO2 particle aggregation was inhibited. It is assumed that the polymer chains adsorbed on the surface of TiO2 particles either alter the surface charge to improve electrostatic repulsion or increase steric repulsion between particles. The polymer pretreatment raised the fraction of smaller particles (100–2000 nm) and lowered the fraction of very large aggregates (20,000–200,000 nm), according to a quantification of the distribution ratio by particle size region based on the DLS intensity distribution.
When PVA was pretreated, the fraction of the 100~2000 nm region increased to 66.7%, showing excellent fine dispersion, and the 20,000~200,000 nm region was significantly reduced to 33.3%. PEG pretreatment is 53.4% in the 100~2000 nm section, which has an improvement effect compared to DI (46.5%), but does not reach PVA. This finding suggests that the PVA polymer aqueous solution works well to enhance particle dispersion stability by interacting chemically and physically with TiO2.

2.2.2. Analysis of Dispersion Characteristics According to the Polymer/TiO2 Ratio

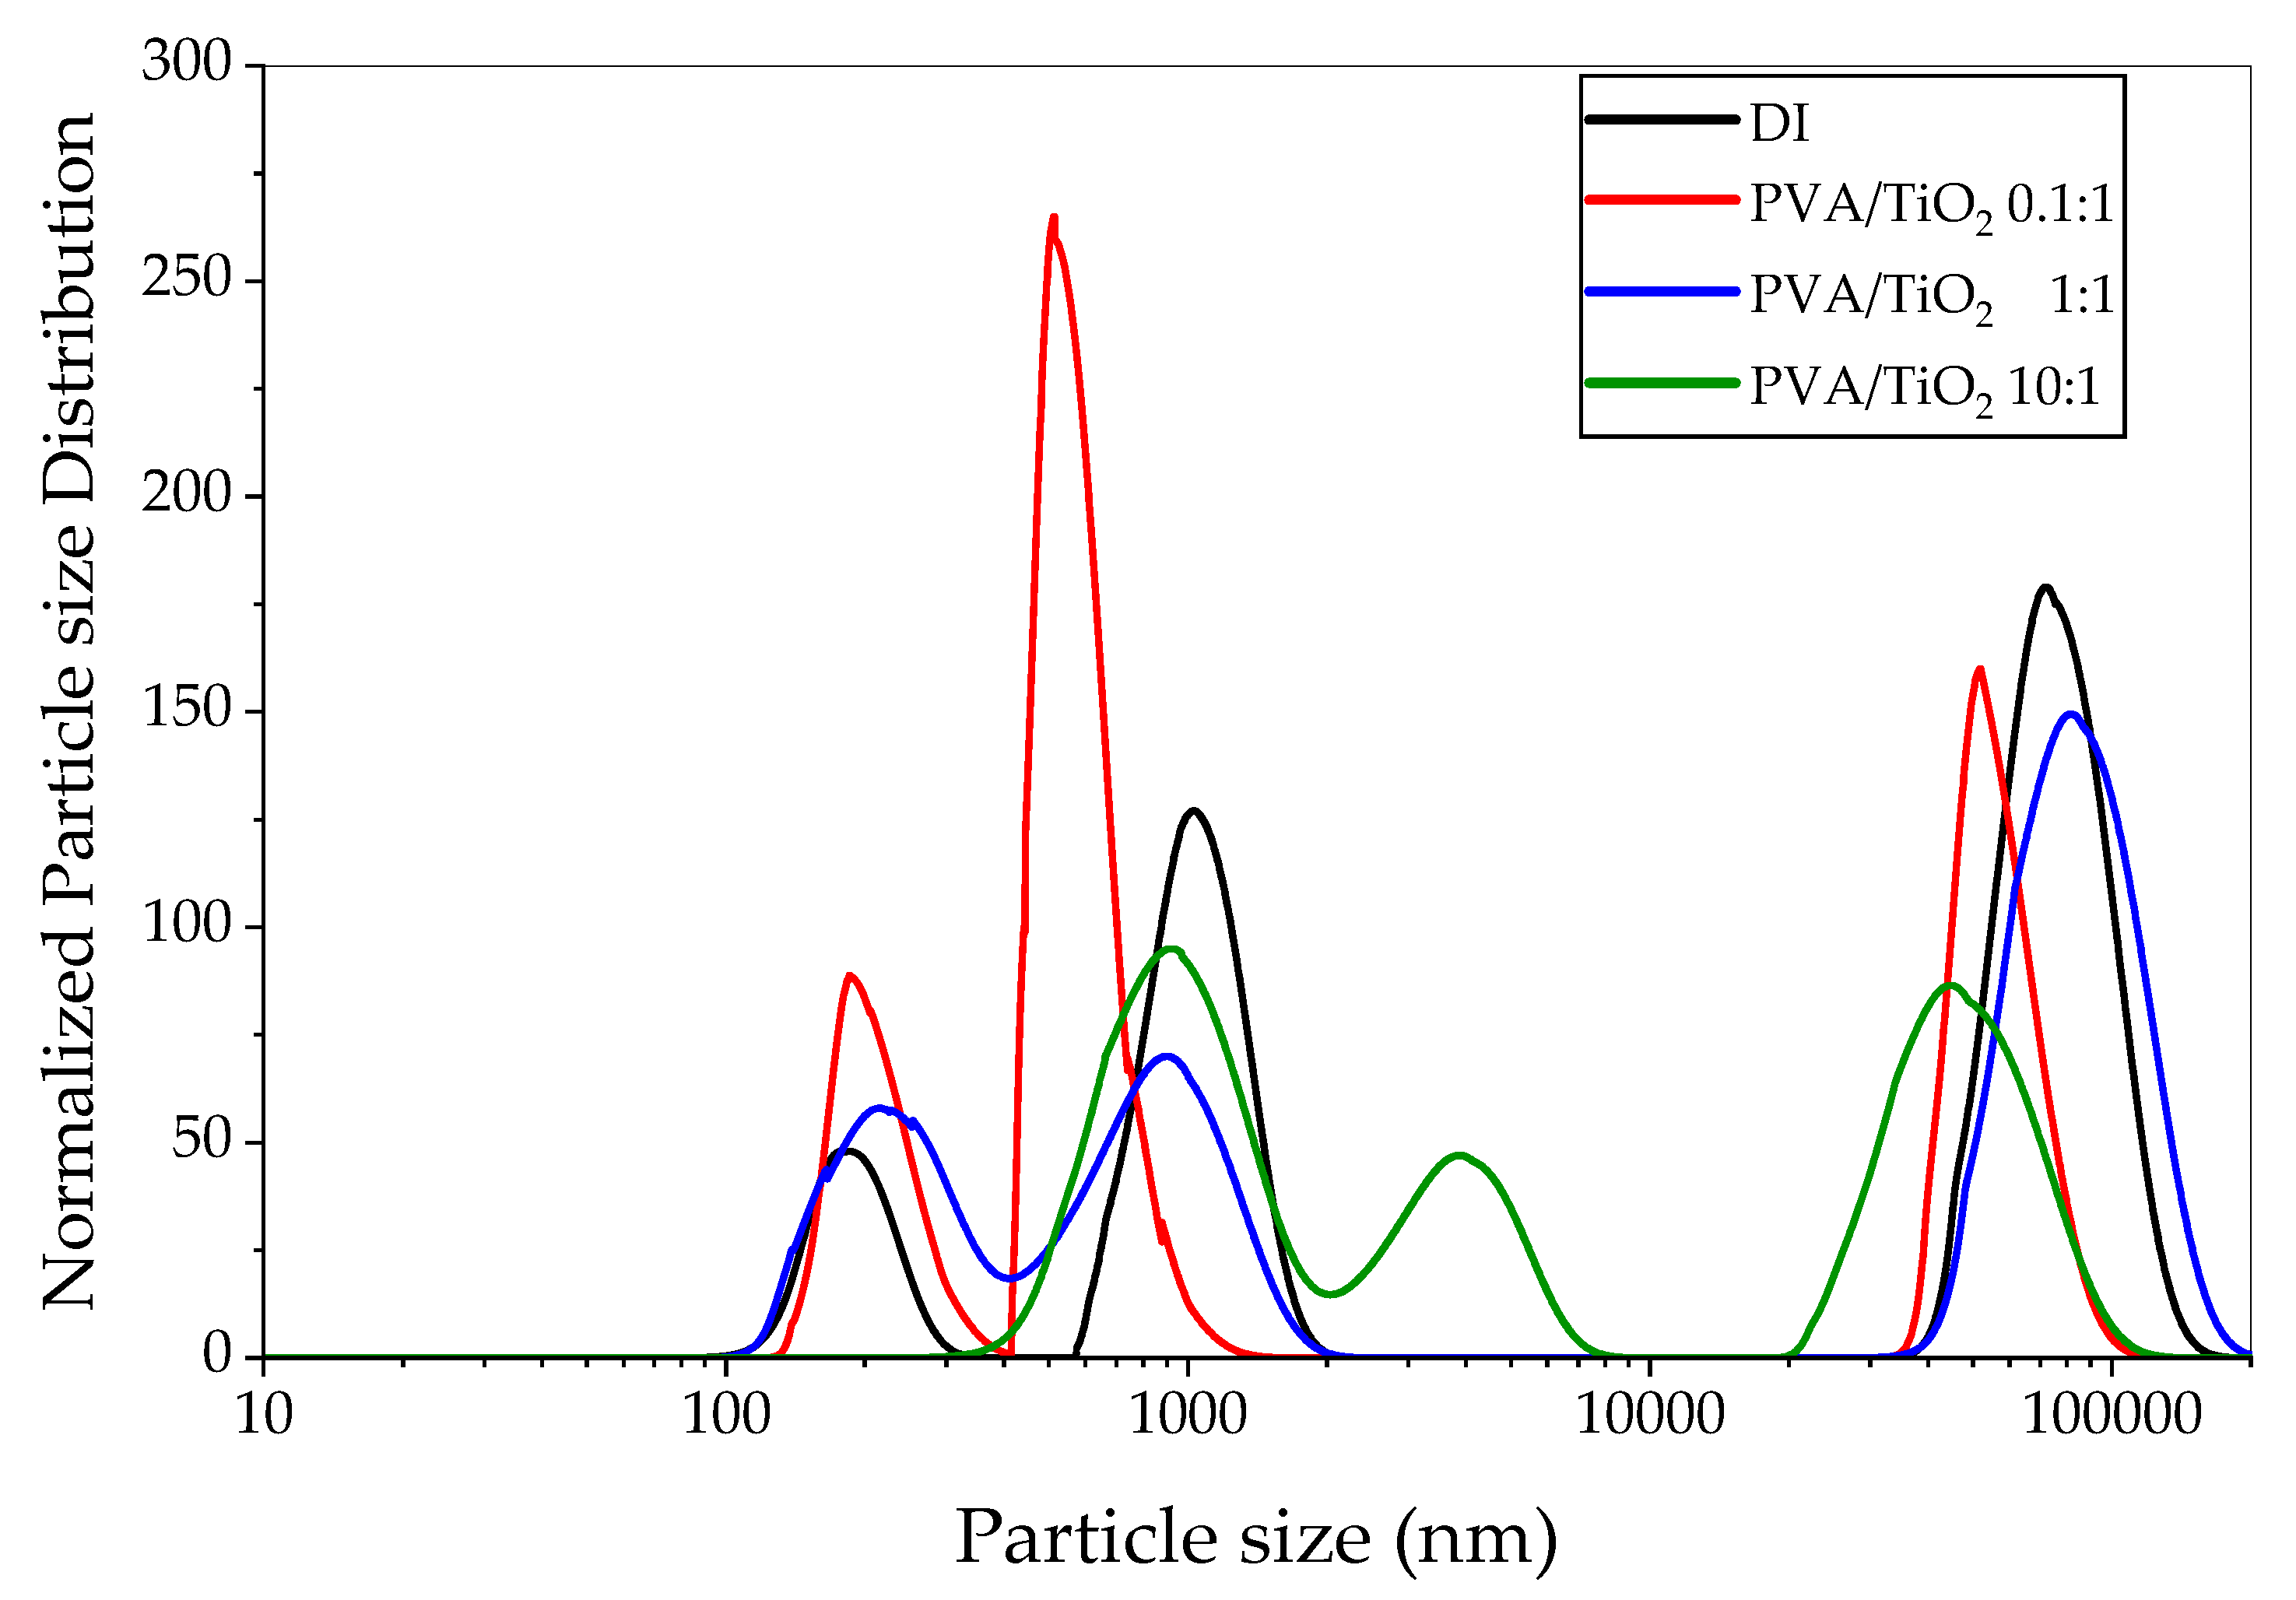
In order to find the optimal mixing ratio for each concentration of the polymer, the PVA:TiO2 ratio was set to DI, 0.1:1, 1:1, and 10:1 for comparative analysis. The average particle size and zeta potential observed at each ratio are summarized in Figure 5 and Table 3.
At the 0.1:1 ratio, the particle size was the smallest (≈1.4 μm), and the zeta potential absolute value increased (ζ = −10.90 mV), confirming that stability due to electrical repulsion was improved. When the PVA ratio was increased to 1 or more, the particle size increased rapidly, suggesting that excessive polymer concentration caused re-aggregation.
Table 3 presents the average particle size, polydispersity index (PDI) and zeta potential for various PVA:TiO2 mixing ratios, including the standard deviation (SD) from three repeated measurements (n = 3). At a ratio of 0.1:1, the dispersion exhibited a notable increase in particles smaller than 2 μm, suggesting this condition offers optimal stabilization. The particle dispersion is indicated by the PDI. The ideal dispersion condition, PVA:TiO2, had the lowest PDI value at 0.1:1. The result confirmed that PVA enhances dispersibility. Zeta potential values across all samples were negative, approximately −10 mV—twice the magnitude observed under deionized water (DI) conditions, yet still below the commonly accepted threshold of ±30 mV for electrostatic stability. Despite the low zeta potential, stabilization appears to result from steric repulsion due to polymer adsorption rather than electrostatic forces. Compared to the primary TiO2 particle size (10–50 nm), the dispersed nanoparticles were over five times larger, indicating agglomeration. TiO2 (P25), known for its high density, showed a strong tendency to settle even in aqueous polymer solutions, leading to cohesion. However, in civil engineering applications such as concrete, mechanical stirring and the rearrangement during hardening can maintain adequate dispersion—even in the presence of some agglomerates.

2.2.3. UV-Vis Analysis of TiO2 Dispersion

In order to confirm the change in the light absorption characteristics of TiO2, the UV-Vis absorption spectrum was measured using a SHIMADZU UV-1800 spectrophotometer (Kyoto, Japan). The experiment was performed on the DI dispersion and the PVA pretreatment dispersion, and the wavelength range was set to 200–800 nm and the scan rate was set to 2 nm·s −1.
Figure 6 shows the results of comparing the UV-Vis absorption spectrum of the TiO2 dispersion under different pretreatment and ultrasonic treatment conditions. In all samples, strong absorption was observed in the bandgap region around 380 nm (3.2 eV). The PVA (0.1 weight percent) processed dispersion had a greater absorbance overall than the DI dispersion. This may be explained by the decreased light scattering loss and the increased surface area made possible by the enhanced particle uniformity brought about by polymer pretreatment. Furthermore, the maximum absorption peak intensity in the ultrasonic-treated samples rose more than it did prior to the treatment, demonstrating that the ultrasonic waves enhanced dispersion stability and promoted particle separation, which in turn boosted the light absorption efficiency.

2.2.4. Comparison of TiO2 Dispersion and Photoreaction Rate

Methylene blue (MB) photolysis experiment was performed to compare photocatalytic performance. Luzchem LZC-4X (254 nm, low-pressure Hg UV-C lamp, 8 W) (Gloucester, ON, Canada) was used for the experiment, a TiO2 dispersion (50 mg TiO2) was added to 70 mL of 0.1 mM MB solution, and UV irradiation was performed for 300 min while stirring at 500 rpm. A dark adsorption step was included before the experiment to precisely measure photocatalytic degradation and prohibit photodegradation from initially adsorption. The materials were placed in to a darkened environment for 60 min prior to the start of the photodegradation experiment. The concentration change was measured by SHIMADZU UV-1800 (Kyoto, Japan) for absorbance at 660 nm, and the apparent reaction rate constant (k_app) was calculated through ln(C/C0) versus time (t) linear regression. The primary absorption peak of methylene blue (MB) was detected at approximately 660 nm when the wavelength range was measured from 400 nm to 800 nm in the Hanif et al. research when methylene blue was photodecomposed using ZnO [23].
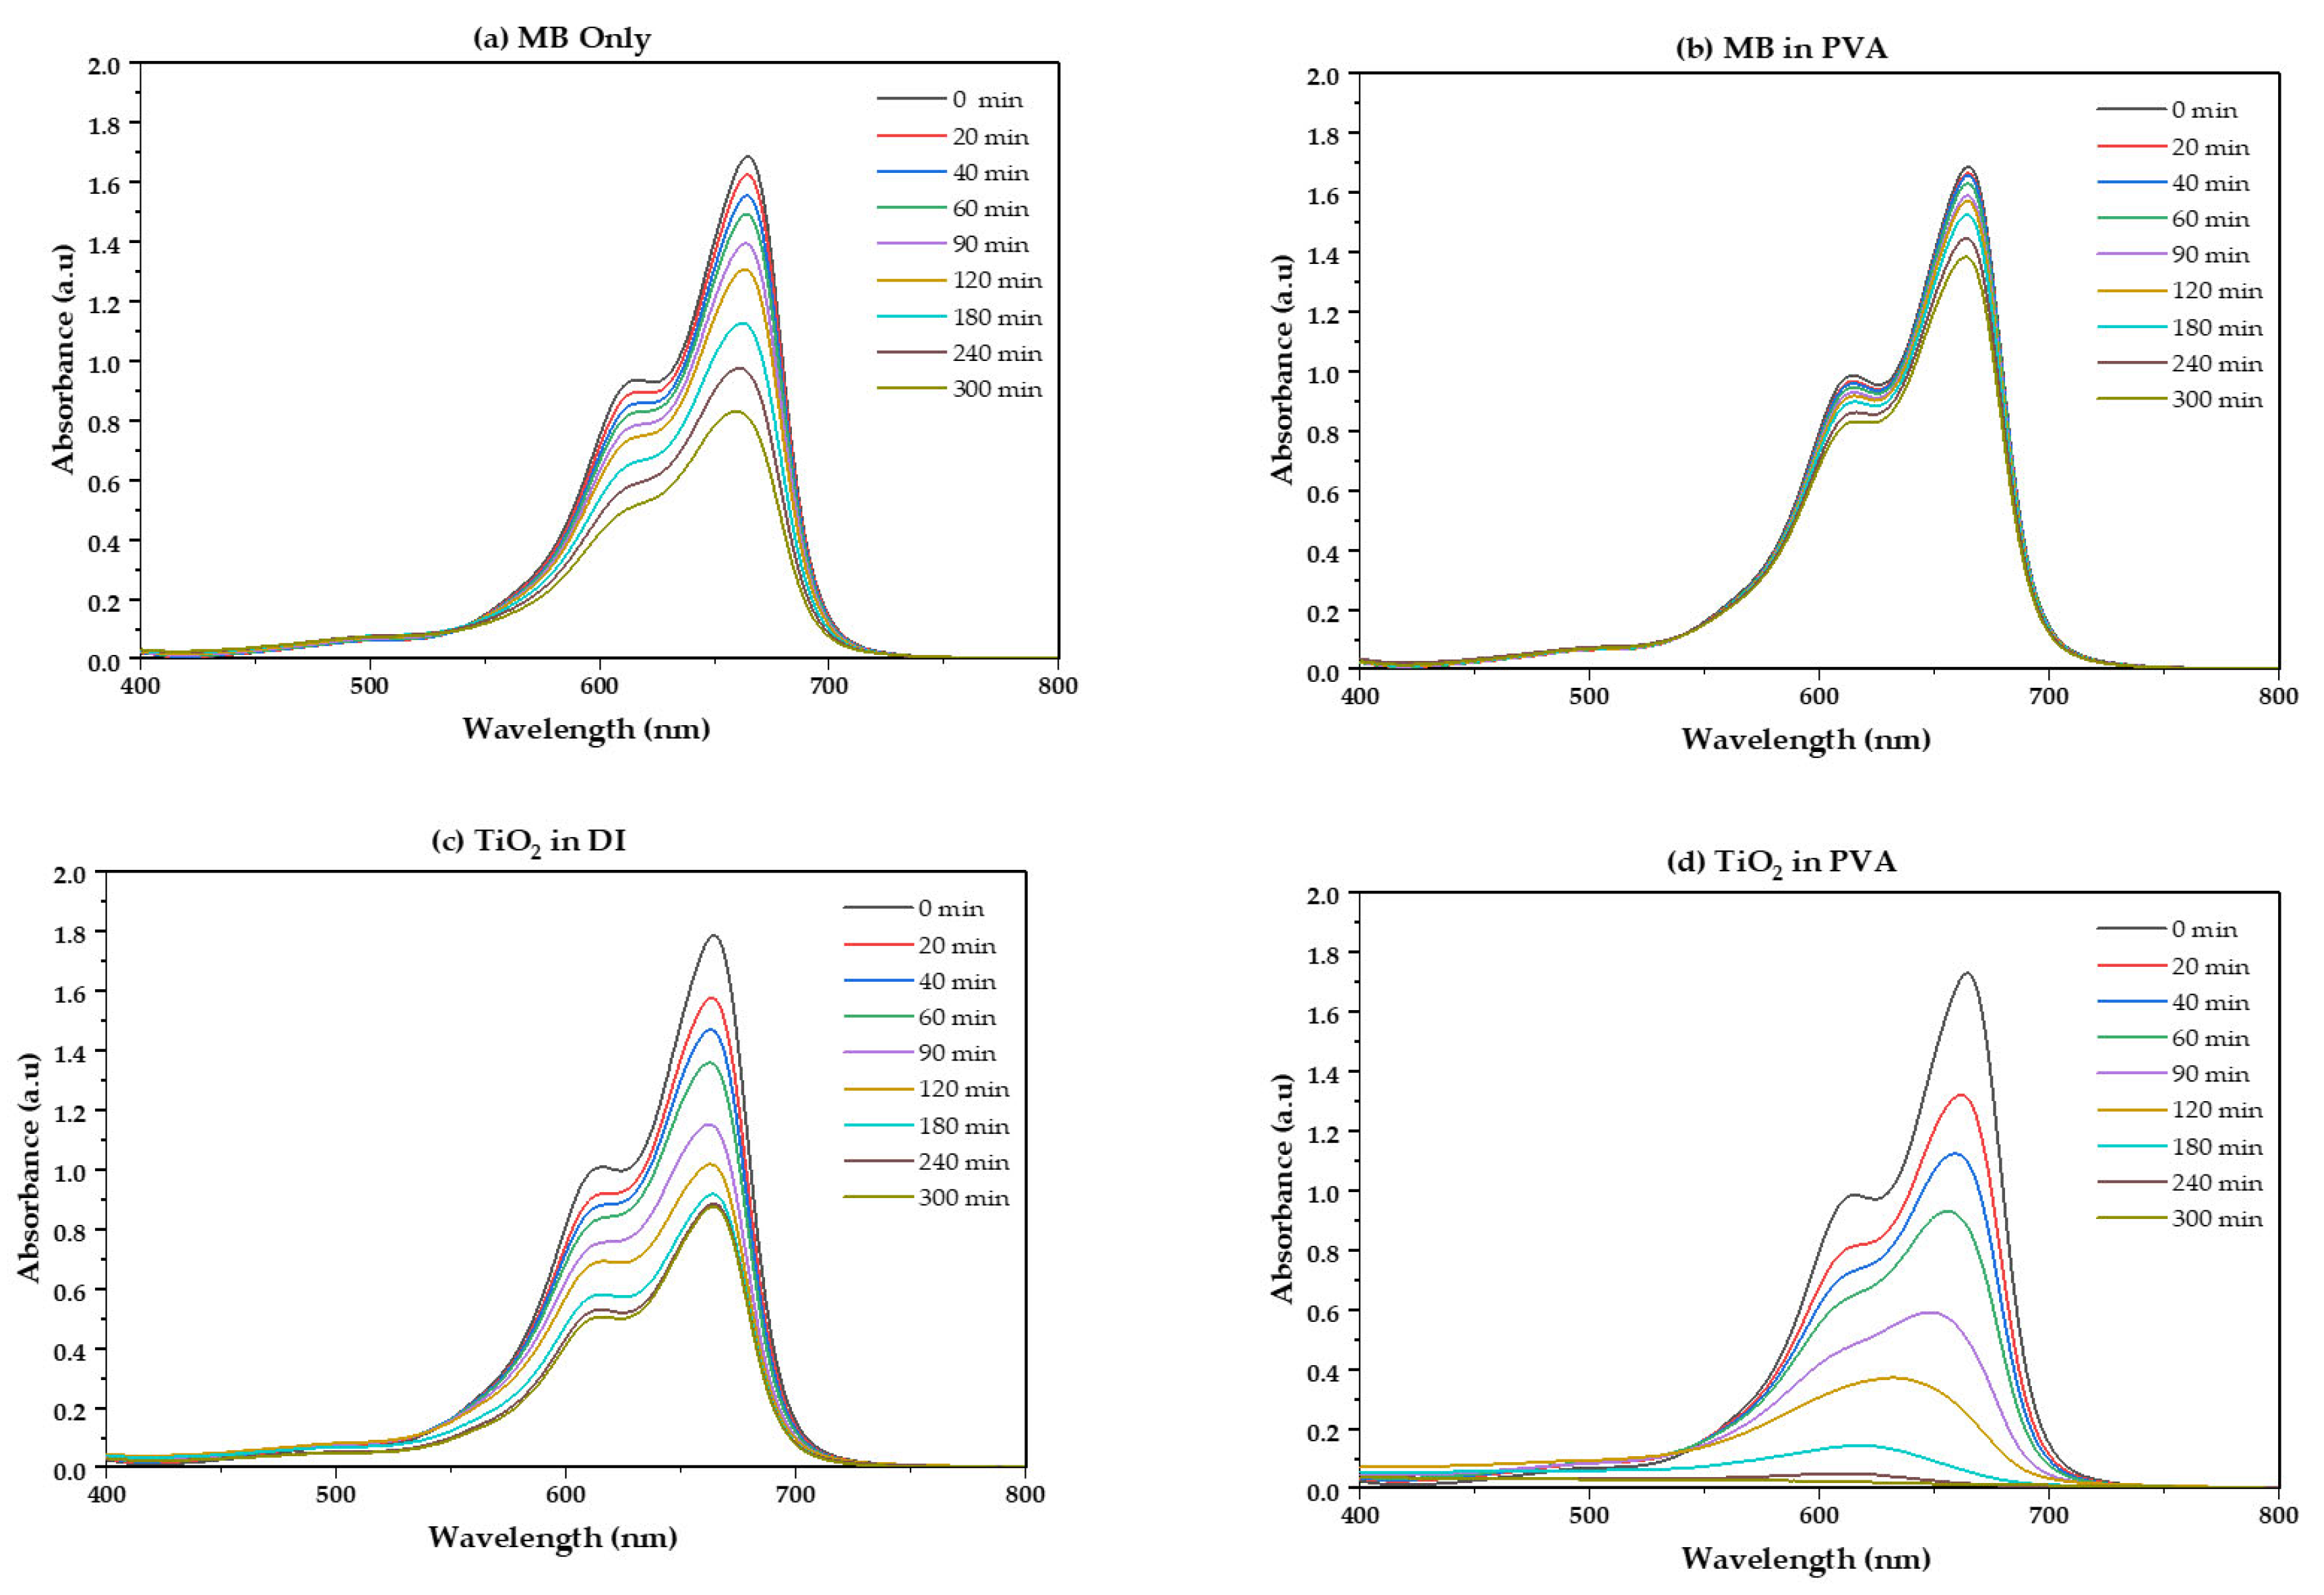
Figure 7a shows the UV-Vis spectrum change over time of MB alone solution. As little change in absorbance was observed for 300 min, it was confirmed that photolysis did not occur. Figure 7b shows the spectral changes in MB in a PVA solution without TiO2. The absorbance barely changed, indicating that PVA itself did not decompose MB. The absorbance of the 660 nm peak gradually decreased over time, but at a relatively slow rate. Figure 7c shows the spectral changes when TiO2 was dispersed under DI conditions. Figure 7c with the addition of TiO2 verified that photodegradation proceeded quickly because of the photoreactivity of TiO2 in contrast to the cases with only MB in Figure 7a,b. The results of an experiment where TiO2 distributed in a PVA solution are shown in Figure 7d. As the irradiation time increased, the 660 nm peak rapidly decreased in comparison to Figure 7a–c. These findings verify that the photocatalytic decomposition occurs ten times faster when TiO2 is dispersed in a PVA solution than when it is dispersed in distilled water (DI) without PVA.
The ln(C/C0)–time graph for the three conditions (MB alone, DI, and PVA) is displayed in Figure 7d. The ln(C/C0) versus time graph in Figure 7d was computed using the pseudo-first-order Langmuir-Hinshelwood rate equation to achieve linearity.
Straightness was hardly seen in MB alone, and in the case of DI dispersion TiO2, the reaction rate constant (k_app) was calculated as 0.15 × 10⁻² min−1 (R2 = 0.85) in Table 4. On the other hand, PVA pretreatment TiO2 was 1.71 × 10⁻² min−1 (R2 = 0.98), which was about 11.4 times improved compared to DI conditions. This is interpreted as a result of the polymer pretreatment contributing to the suppression of charge recombination and maintaining the spacing between particles, effectively increasing the photoreactive site.

2.2.5. Comparison of Concrete Surface Powder Photoreaction

In order to examine the field applicability, an MB photolysis test was conducted from the surface powder of the concrete specimen mixed with dispersed TiO2. Concrete was prepared using water that contained 1% and 0.1% of TiO2 and PVA by weight, respectively. In order to manufacture concrete, cement and water (with TiO2 and PVA added) were combined in a weight ratio of 1:2. The specimen was produced at a ratio of sand–cement–water = 2:1:0.5, and the upper 2 mm was pulverized after curing for 30 days. As a result of measurement under the same photolysis conditions (254 nm, 8 W, 300 min), it was confirmed that the apparent rate constant increased by ~1.9 × (2.7 × 10−3 → 5.2 × 10⁻³ min−1) compared to the DI dispersed specimen (2.7 × 10⁻³ min−1, R2 = 0.90) with k_app = 5.2 × 10⁻³ min−1 (R2 = 0.98), as shown in Table 5. This enhancement indicates improved photocatalytic activity due to the stabilized dispersion of TiO2 within the concrete matrix.
The photolysis performance of the concrete surface powder was reduced by about one-third compared to the aqueous solution test. This was due to light attenuation within the matrix and the reduction in the TiO2 exposure area. Nevertheless, the PVA pretreatment technique significantly improved the actual structural surface self-cleaning performance. The k_app of DI-dispersed TiO2 was 0.15 × 10⁻² min−1 (R2 = 0.85), whereas the PVA-pretreated dispersed TiO2 improved by about 11.4 times to 1.71 × 10⁻² min−1 (R2 = 0.98). The k_app of PEG- and PEGME-dispersed TiO2 was 0.85 × 10⁻² and 0.92 × 10⁻² min−1, respectively, similar to the [4] study (0.8–1.1 × 10⁻² min−1).

2.2.6. Evaluation of Time and Alkali Stability of TiO2 Dispersion

To confirm dispersion stability effectiveness, the DI, PEG, PEGME, and PVA (0.1 wt%) dispersions were evaluated for changes in time elapsed (0/24/72 h) and in an alkaline pore solution (pH ≈ 12–13; Ca(OH)2 saturation + diluted NaOH). For time stability, the average hydrodynamic diameter (d_h) and Polydispersity Index (PDI) were tracked using DLS, and in parallel, the A600 (turbidity) and interface height of the precipitation tube supernatant were recorded. Alkali stability was measured again after immersing the same specimen in the pore solution for 24–72 h, and changes in d_h, PDI, and ζ were re-measured. The degree of catalytic function preservation was determined by the MB photolysis retention rate (=k_app, after/k_app, before × 100%) before and after exposure. This observation is consistent with the principles of colloidal science. In colloidal science, the higher the absolute zeta potential value, the higher the electrostatic repulsion between particles, resulting in better dispersion stability. According to Hunter [19], the higher the absolute value of the zeta potential in colloidal science, the stronger the electrostatic repulsion between particles, thereby improving dispersion stability. This principle explains the stabilization effect observed in this study.
The PVA pretreatment dispersion had the lowest d_h increase rate and turbidity change over time, and the deformation of the size distribution was limited even under high pH and Ca2+ conditions. This likely occurs because the PVA adsorption layer provided steric protection along with electronic repulsion (increasing the absolute value of ζ), effectively suppressing re-aggregation compared to pure charge stabilization, which is cation-sensitive. On the other hand, PEG/PEGME had an initial micronization effect, but the increases in d_h and supernatant turbidity were relatively large when exposed to high pH. This difference in stability was consistent with the photoactivity maintenance observed in the subsequent UV–Vis and k_app evaluations (§2.2.3–§2.2.5), and is considered a design advantage leading to preservation of the active area on the exposed surface when applied to a concrete matrix (§2.2.5, §2.3).

2.3. Comparison of the Self-Cleaning Performance of Concrete Specimens

As a result of the concrete powder experiment, the PVA-pretreated TiO2 specimen showed a more than two-fold improvement, with k_app = 5.2 × 10⁻³ min−1 (R2 = 0.98), whereas the DI dispersion showed k_app = 2.7 × 10⁻³ min−1 (R2 = 0.90) (Table 5). This is qualitatively consistent with, or better than, the nanofiber-based photolysis study of [8] and the NOx reduction study of [24], demonstrating improved self-purification performance when applied to concrete.

2.4. Comparative Analysis and Mechanism

As a result of comparing the results of this study with existing studies [5,18,25], the PVA pretreatment dispersion technique showed the best composite improvement effect in terms of dispersion stability, photoactivity, and durability compared to simple incorporation. It is judged that the polymer dispersant increases the cohesive energy barrier by forming an adsorption layer on the particle surface, and maintains dispersion uniformity even during drying/curing by forming a temporary hydration crosslinking network.

3. Discussion

3.1. Correlation of Dispersion and Photoactivity According to Polymer Type

Among the three types of hydrophilic polymers (PVA, PEG, and PEGME) used in this study, PVA showed the highest dispersion stability (average hydrodynamic diameter ≈ 1.4 μm, ζ = −11 mV). This is because a large number of –OH groups of PVA formed hydrogen bonds with hydroxyl on the TiO2 surface to form a thin adsorption layer, and this layer increased the minimum approach distance between particles to impart steric stabilization. At the same time, a weak negative charge remained to assist electrostatic repulsion, thereby achieving steric + electrostatic stabilization. On the other hand, PEG and PEGME had great chain flexibility, but their surface interaction (adsorption energy) was relatively weak, so their effect of inhibiting aggregation at the same concentration was limited. These results are also consistent with the work of Sakarkar et al. [25], who reported that the PVA-based composite showed stronger dispersion stability and improved photocatalytic performance compared to the PEG-based system.
According to Kim et al., the photocatalytic effectiveness was 20% greater when TiO2 was well dispersed and less agglomerated using ultrasonic than when it was agglomerated and undispersed [26]. Consequently, a greater photocatalytic effect was obtained with well-dispersed TiO2 with PVA. TiO2 nanoparticles were added to PVA-based hydrogels in the Surkatti et al., which showed that improved nanoparticle dispersion improved the hydrogel’s structural stability and functional performance [27]. In particular, mechanical strength and durability enhanced when TiO2 was uniformly distributed. These results reveal that TiO2 functional characteristics can change based on its dispersion state rather than just acting as a catalyst. In order to optimize TiO2 photocatalytic performance, in this study also concentrated on assuring dispersion. Photocatalytic efficiency was increased by dispersion stability, which increased the number of surface reaction sites and inhibited electron-hole recombination. The result that consistent nanoparticle dispersion is a crucial component of catalytic activity are thus supported by the Surkatti paper’s results, which are comparable to the TiO2 particle dispersion approach used in this investigation.

3.2. Impact of Mixing Ratio (TiO2:PVA) and Re-Aggregation Threshold

At PVA:TiO2 = 0.1:1 (mass ratio), particle size minimization was observed, but at 1:1 or higher, rapid re-aggregation to tens of μm appeared. This is interpreted as the result of a combination of bridging flocculation between polymer chains and a decrease in shear peeling efficiency due to an increase in solution viscosity. Therefore, in the pretreatment for concrete, ‘polymer excess’ is not always advantageous, and it is desirable to set the lean area before adsorption saturation as a process window. A similar phenomenon was reported in a study by Rasteiro et al. [28], where excessive polymer electrolyte input induced bridging flocculation, reducing the re-aggregation ability in turbulent environments, thus emphasizing the importance of setting the optimal polymer-particle ratio.

3.3. UV–Vis Spectrum Analysis

The PVA pretreatment dispersion increased the absorption intensity near the band gap ≈ 380 nm (3.2 eV), but there was no change in the peak position. This suggests a decrease in light scattering and an increase in light harvesting according to an increase in effective volume concentration, not an electron structure change. The reason that the maximum absorbance further increased in the before-and-after ultrasound comparison is that ultrasound cavitation decomposed the lump aggregates, reducing scattering and absorption losses in the transmission path. Ahmed and Mohamed [29] also reported similar results, which revealed that ultrasonic auxiliary dispersion effectively decomposes TiO2 aggregates and increases surface area, resulting in improved photocatalytic efficiency.

3.4. Pseudo-Primary (Langmuir–Hinshelwood) Velocity and Half-Life

Methylene blue photolysis was well described with a similar first-order rate in the initial concentration range Equation (1), [4]. The half-life t1/2 = ln 2/k_app: DI = 462 min was calculated with k_app = 0.0015 min−1 for the DI dispersion (=0.15 × 10⁻²), and the PVA pretreatment gave t1/2 = 40.5 min with k_app = 0.0171 min−1 (=1.71 × 10⁻²). That is, the reaction rate was improved by about 11.4 times, which is due to (i) an increase in the active surface area, (ii) suppression of surface recombination, and (iii) an extension of the optical path in the solution. The regression coefficient of determination (R2) was as high as 0.98, suggesting that surface reaction domination prevailed over external mass transfer resistance. Similar results were also reported by Hoffmann et al. [2] that photocatalytic activity in the water system is mainly dominated by surface reaction rather than bulk diffusion. In addition, Linsebigler et al. [3] emphasized that effective charge separation and suppression of electron-hole recombination are key to improving photocatalytic efficiency, which is consistent with the results of this study.
ln(C0/C) = k_app × t

3.5. Causes of Degradation in Concrete Matrix

In the concrete powder, k_app was reduced to about one-third of the solution (2.7 × 10⁻³ → 5.2 × 10⁻³ min−1, PVA pretreatment standard). The causes were (a) light shielding and shading by cement hydration products (C–S–H, Ca(OH)2), (b) partial occlusion in the capillary pores of TiO2, (c) a decrease in effective concentration due to non-selective adsorption of MB on the cement surface, and (d) weakening of surface negative charge due to carbonation (CaCO3 formation). Nevertheless, the relative advantage (approximately twofold) of PVA pretreatment was maintained, confirming that the advantage of pretreatment offset the matrix effect. Similarly, Alshabander and Abd-Alkader [30] reported that the photocatalytic decomposition efficiency was greatly affected by the shielding effect by the hydration product when TiO2 nanoparticles were introduced into cement. In addition, Chen et al. [17] emphasized that the surface coating and light transmission are key factors influencing the performance of TiO2 in cement-based composites.

3.6. Literature Comparison and Performance Positioning

In a number of reports, the MB decomposition k_app of powder or support-based TiO2 ranged from 0.006 to 0.012 min−1 and was close to the upper limit for the anatase/rutile ratio and appropriate surface treatment. The 1.71 × 10⁻² min−1 of this study corresponds to the upper-rank value that can be achieved when commercial P25 is pretreated with a simple water-soluble polymer. The 5.2 × 10⁻³ min−1 based on concrete powder is also competitive as a value obtained from a composite matrix. A similar decomposition rate has been reported in recent studies. Alshabander and Abd-Alkader [30] explained that the MB decomposition rate in the cement-based matrix falls within a similar range to this study, which is greatly affected by the composition of the crystal phase. Chen et al. [31] also suggested the reason why the results of this study and the literature values match by changing the active surface of TiO2 by cement hydration by-products.

3.7. Uncertainty and Reproducibility

This experiment presented an average of n ≥ 3 repetitions per condition. The factors of variation were identified as (i) ultrasonic treatment deviation (±10 s), (ii) light source flux change (±3%), and (iii) centrifuge supernatant collection location difference (±0.5 mL), which dominated the ±5–8% confidence interval of the derived k_app. In the future, introducing a standardized operating protocol (SOP) and in situ absorption tracking can further reduce errors. These results are consistent with previous reports emphasizing the need for standardized procedures to ensure reproducibility of experiments. Rasteiro et al. [28] showed that controlling the agglomeration and re-aggregation behavior in suspension-based systems is effective in reducing volatility, suggesting that it is an important approach to securing reproducibility even in photocatalytic experiments.

3.8. Mechanism Schematic and Design Implications

PVA pretreatment works as a chain of (1) adsorption layer formation → (2) steric and electrostatic stabilization → (3) reduction in aggregation → (4) increase in active surface and light capture → (5) radical generation/surface reaction promotion. Design recommendations are as follows: (i) PVA 0.1 wt% pretreatment, (ii) ultrasound 3 min, (iii) aging 24 h before mixing, (iv) controlling the mixture/binder ratio (based on liquid by weight).

4. Materials and Methods

4.1. Materials

In this study, Evonik P25 titanium dioxide (TiO2) was bought from Degussa (Frankfurt, Germany). Polyvinyl alcohol (PVA, Sigma-Aldrich, St. Louis, MO, USA, purity 99%, Cas. No. 9002-89-5) with a molecular weight of about 80 kDa, polyethylene glycol (PEG, Sigma-Aldrich, 98% purity, Cas. No. P5413) with a molecular weight of 8 kDa, and polyethylene glycol methyl ether (PEGME, Steinheim, Germany, purity 95%, Cas. No. 9002-89-5) were used as dispersants, all of which were supplied by Sigma-Aldrich, St. Louis, MO, USA. Portland cement (Korean Agency for Technology and Standards, Seoul, Republic of Korea) in the KS L 5201 standard [32] was used for cement, and standard ISO 679 standard [33] was used for fine aggregates. Methylene blue (MB) used in the photocatalytic performance test was a product with a purity of 98% or higher and was purchased from TCI (Tokyo Chemical Industry, Tokyo, Japan) and used in the experiment.

4.2. Dispersion Preparation Procedure

The polymer solution (0.1/1.0 wt%) was used after complete dissolution by adding a dispersant to 1 L of ultrapure water and stirring at 300 rpm for 24 h. TiO2 was added to 100 mL of polymer solution, uniformly dispersed with an ultrasonic cleaner (40 kHz, 3 min), and then used for analysis [11,19].

4.3. Physical Properties Analysis Equipment and Methods

X-ray diffraction analysis (XRD) was performed using a SmartLab (Rigaku Co., Ltd., Tokyo, Japan) instrument, and Cu–Kα (λ = 1.5418 Å) was used as the X-ray source. The measurement range was set to 2θ = 20–80°, and the scanning speed was 6°·min−1. The ratio of anatase to rutile was calculated by applying the Spurr-Myers method [6,7]. Scanning electron microscope (SEM) observation was performed using JEOL JSM-7600F (Jeol Ltd., Tokyo, Japan) equipment, and gold coating with a thickness of 5 nm was applied to the surface of the specimen. The acceleration voltage was set in the range of 5–15 kV to observe the particle shape and the aggregation structure. The specific surface area and pore distribution analysis were performed using BELSORP-MAX (MicrotracBEL Co., Osaka, Japan) equipment, and the sample was degassed at 250 °C for 3 h, and the specific surface area was calculated by BET method by measuring the N2 adsorption/desorption isotherm under the 77 K condition. Dynamic light scattering (DLS) and zeta potential (ζ) were measured using Otsuka ELSZ-2000ZS (Otsuka Electronics Korea Co., Ltd., Seongnam-si, Republic of Korea) equipment, and the wavelength was set at 655 nm and the output was set at 70 mW. The average value was calculated by performing repeated measurements three times for each specimen.

4.4. Methylene Blue Photolysis Test in Aqueous Solution

The test involved 300 min irradiation with Luzchem LZC–4X and 254 nm low-pressure Hg UV–C lamps (Luzchem, Gloucester, ON, Canada), 8 W by adding 50 mg of dispersed TiO2 to 70 mL of 0.1 mM MB. After sampling (20, 40, 60, 120, 240, 300 min), samples were centrifuged at 5000 rpm for 10 min, and absorbance at 660 nm was measured with SHIMADZU UV–1800 (SHIMADZU Co., Kyoto, Japan). The concentration change was calculated as a first-order velocity constant (k_app) in an ln(C/C0) vs. t plot [8,11].

4.5. Concrete Specimen Manufacturing and Self-Purification Performance Evaluation

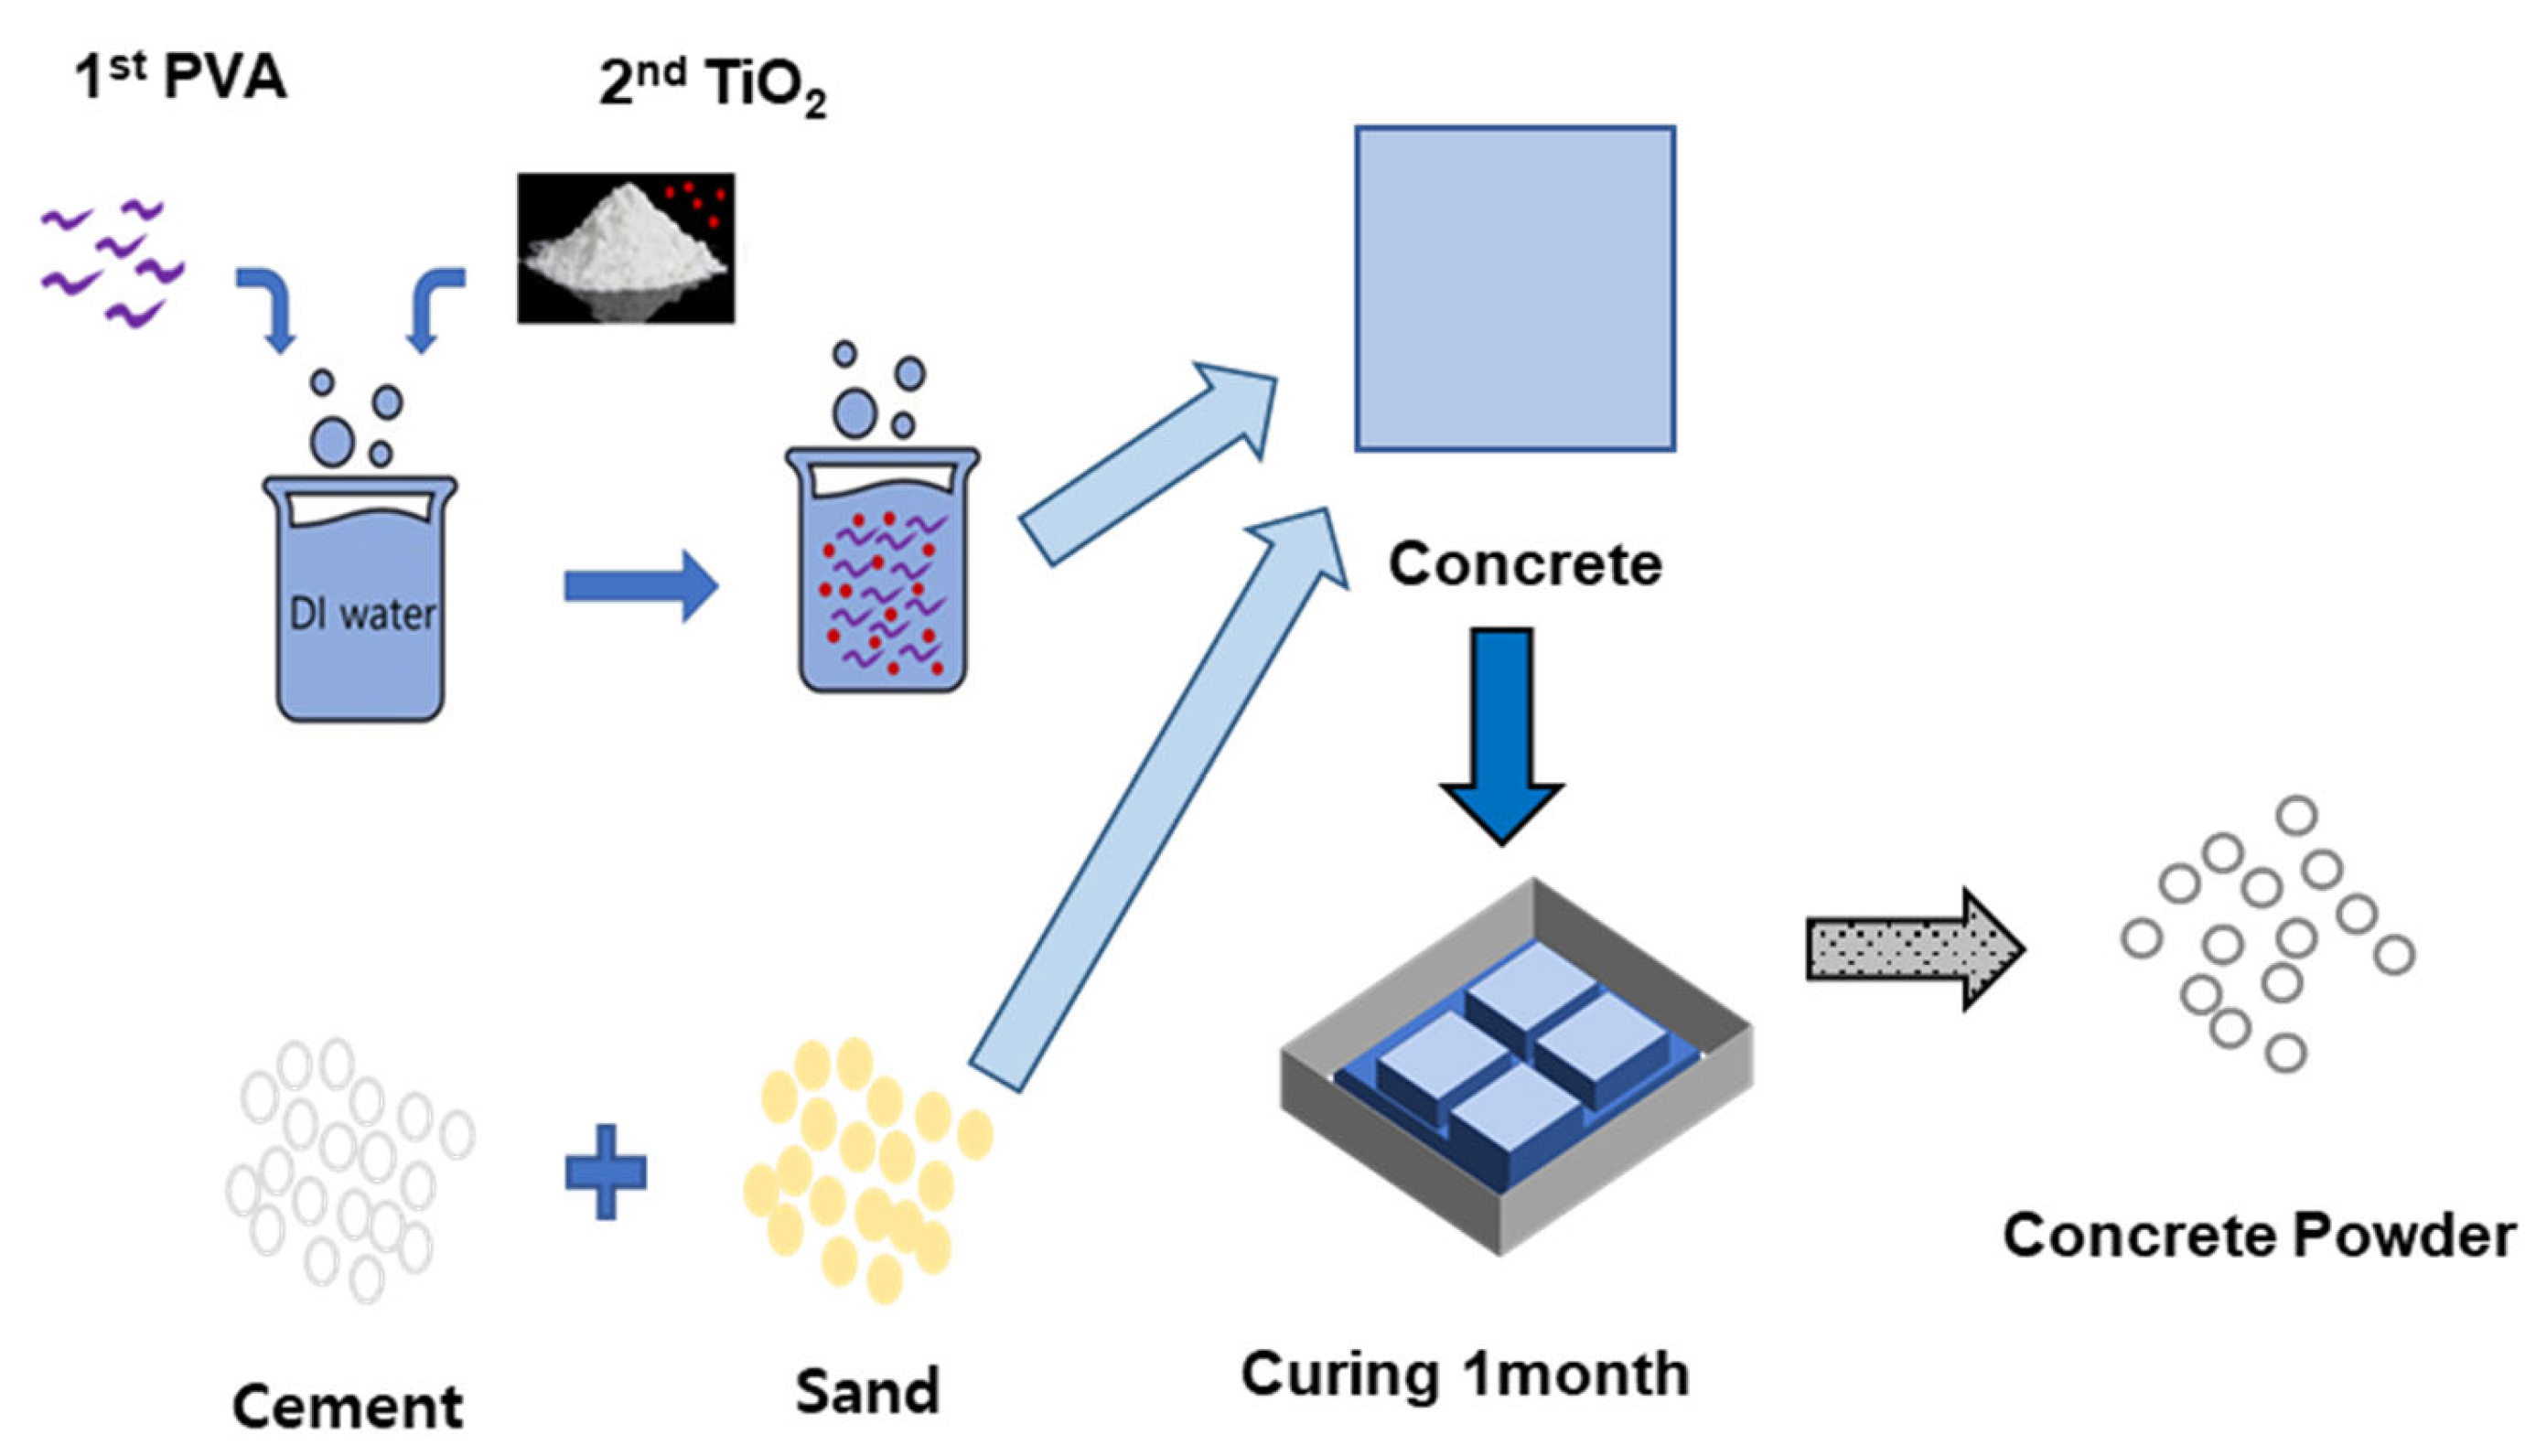
Mixing ratio: sand–cement–water = 2:1:0.5 (by weight), liquid was TiO2 dispersion (including 2.5 g TiO2) and specimens were dried for 48 h at 25 °C and RH 60% after mold injection, then cured underwater for 30 days. The concrete sample was poured into a 5 cm × 5 cm × 5 cm mold, and the mold was tamped down and up to remove any pores. The upper 2 mm surface was pulverized and photolysis tests were carried out in the same manner as the aqueous solution test [24]. The entire manufacturing process of TiO2 concrete specimens treated with PVA is schematically shown in (Figure 8), which shows the powdering process for dispersing distilled water of nanoparticles, mixing with cement and sand, molding, curing, and evaluating photocatalyst performance step by step. After coating a TiO2 dispersion to a cement-based substrate, Fregni et al. investigated abrasion, rainwater washout, and other mechanical durability aspects [34]. Their research demonstrated that a direct TiO2 coating on a building surface reduced durability. Therefore, this study used the addition of a TiO2 dispersion to the concrete mix to solve the problem of decreased durability of TiO2 surface coatings.

5. Conclusions

In this study, the effect of water-soluble polymer pretreatment on the dispersion stability and photocatalytic performance of TiO2 was systematically investigated for the application of self-cleaning functional concrete. As a result of comparing PVA, PEG, and PEGME as dispersants, it was confirmed that optimizing the type and concentration of the polymer effectively suppresses particle aggregation, improves light absorption capacity, and increases photocatalytic activity in both aqueous and concrete matrices. The results of this study suggest a practical, scalable and economical process for integrating photocatalytic functions into concrete structures and can contribute to urban air purification and maintenance of surface cleanliness.
  • The characteristics of photocatalytic TiO2 (P25) were examined using BET, SEM, and XRD. With a particle size of 10–30 nm and a surface area of approximately 55–57 cm2/g, the anatase–rutile ratio was 81:19. Furthermore, it was found that this powder aggregated in the aqueous solution when it was dispersed there, with the particle size being more than five times larger.
  • In order to investigate dispersibility, water-soluble polymers such as PVA, PEG, and PEGMA were used. PVA showed great dispersibility.
  • The PVA:TiO2 concentration ratio of 0.1:1 achieved the best dispersibility.
  • When compared to TiO2 dispersed in DI, TiO2 dispersed in PVA showed better MB photodegradation ability.
  • PVA-dispersed TiO2 samples demonstrated a stronger photodegradation effect in concrete powder examination, maintaining about 1.9 times the performance increase compared to DI. PVA increases activity by a different mechanism than better colloidal stability.
Although this work shows good performance at the laboratory scale, more considerations are required for practical application. It is important to carefully consider the expense of adding PVA, the energy usage of ultrasonic processing, and the difficulties in incorporating these processes into large-scale concrete production (such as continuous mixing or industrial-scale dispersion systems). Therefore, in order to evaluate the scalability and feasibility of the suggested approach, our future research will incorporate techno-economic analysis and process optimization.

Author Contributions

Conceptualization, J.S.K., D.Y. and Y.S.K.; methodology, J.S.K. and D.Y.; software, K.S. and J.K.; validation, D.Y., K.S. and J.K.; formal analysis, K.S., J.K. and H.-J.K.; investigation, H.-J.K. and H.G.K.; resources, J.S.K.; data curation, K.S. and J.K.; writing—original draft preparation, K.S. and J.K.; writing—review and editing, J.S.K., K.S. and J.K.; visualization, K.S. and J.K.; supervision, J.S.K. and Y.S.K.; project administration, H.G.K.; funding acquisition, H.G.K. All authors have read and agreed to the published version of the manuscript.

Funding

This work was supported by Innopolis Foundation through 2025 Research and Development (R&D) Special Zone of the Ministry of Science and ICT in Republic of Korea (Project Name: Demonstration of medium- and large-sized ships and special multipurpose watertight door ships using hybrid lightweight composite materials using carbon fiber and flame-retardant reinforced materials, Project No.: RS-2025-02222810.

Data Availability Statement

The data presented in the paper are available upon request.

Acknowledgments

This work also was supported by the Sanhakyeon Collabo R&D Program (RS-2025-02323137) funded by the Ministry of SMEs and Startups in Republic of Korea (Small and Medium-sized Enterprises, Korea).

Conflicts of Interest

The authors declare no conflicts of interest.

References

  1. Ohtani, B.; Prieto-Mahaney, O.O.; Li, D.; Abe, R. What is Degussa (Evonik) P25? Crystalline composition analysis, reconstruction from isolated pure particles and photocatalytic activity test. J. Photochem. Photobiol. A 2010, 216, 179–182. [Google Scholar] [CrossRef]
  2. Schneider, J.; Matsuoka, M.; Takeuchi, M.; Zhang, J.; Horiuchi, Y.; Anpo, M.; Bahnemann, D.W. Understanding TiO2 photocatalysis: Mechanisms and materials. Chem. Rev. 2014, 114, 9919–9986. [Google Scholar] [CrossRef] [PubMed]
  3. Linsebigler, A.L.; Lu, G.; Yates, J.T., Jr. Photocatalysis on TiO2 Surfaces: Principles, Mechanisms, and Selected Results. Chem. Rev. 1995, 95, 735–758. [Google Scholar] [CrossRef]
  4. Fujishima, A.; Zhang, X.; Tryk, D.A. TiO2 Photocatalysis and Related Surface Phenomena. Surf. Sci. Rep. 2008, 63, 515–582. [Google Scholar] [CrossRef]
  5. Wiśniewska, M.; Terpiłowski, K.; Chibowski, S.; Urban, T.; Zarko, V.I.; Gun’ko, V.M. Effect of polyacrylic acid (PAA) adsorption on stability of mixed alumina-silica oxide suspension. Powder Technol. 2012, 224, 241–247. [Google Scholar] [CrossRef]
  6. Spurr, R.A.; Myers, H. Quantitative Analysis of Anatase–Rutile Mixtures with an X-Ray Diffractometer. Anal. Chem. 1957, 29, 760–762. [Google Scholar] [CrossRef]
  7. Diebold, U. The Surface Science of Titanium Dioxide. Surf. Sci. Rep. 2003, 48, 53–229. [Google Scholar] [CrossRef]
  8. Kujawa, W.; Didyk-Mucha, A.; Olewnik-Kruszkowska, E.; Gierszewska, M.; Rudawska, A. Synergistic Effect of Combined Polymorphs Anatase-Rutile Nano-Modified Lightweight Concrete on Photocatalytic Reduction of NOx, Self-Cleaning Performance, and Antimicrobial Properties. Buildings 2023, 13, 1736. [Google Scholar] [CrossRef]
  9. Kosmulski, M. The significance of the difference in the point of zero charge between rutile and anatase. Appl. Surf. Sci. 2002, 199, 368–371. [Google Scholar] [CrossRef]
  10. Zerga, A.Y.; Tahir, M.; Alias, H.; Mohamed, A.R. Sludge-derived biochar nanotexture to construct BC/TiO2 composite with metallic elements influential effect for efficient photocatalytic hydrogen evolution. Fuel 2024, 362, 131678. [Google Scholar] [CrossRef]
  11. Wang, X.; Huang, S.; Zhu, N.; Lou, Z.; Yuan, H. Facile synthesis of porous TiO2 photocatalysts using waste sludge as the template. Appl. Surf. Sci. 2015, 359, 944–952. [Google Scholar] [CrossRef]
  12. Irie, H.; Watanabe, Y.; Hashimoto, K. Nitrogen-Concentration Dependence on Photocatalytic Activity of TiO2−xNx Powders. J. Phys. Chem. B 2003, 107, 5483–5486. [Google Scholar] [CrossRef]
  13. Asahi, R.; Morikawa, T.; Ohwaki, T.; Aoki, K.; Taga, Y. Visible-Light Photocatalysis in Nitrogen-Doped Titanium Oxides. Science 2001, 293, 269–271. [Google Scholar] [CrossRef]
  14. Hanif, M.A.; Shin, H.; Chun, D.; Kim, H.G.; Kwac, L.K.; Kim, Y.S. Photocatalytic VOCs Degradation Efficiency of Polypropylene Membranes by Incorporation of TiO2 Nanoparticles. Membranes 2023, 13, 50. [Google Scholar] [CrossRef]
  15. Hanif, M.A.; Shin, H.; Chun, D.; Kim, H.G.; Kwac, L.K.; Han, S.-W.; Kang, S.-S.; Kim, Y.S. Development of Highly Ultraviolet-Protective Polypropylene/TiO2 Nonwoven Fiber. J. Compos. Sci. 2024, 8, 86. [Google Scholar] [CrossRef]
  16. Chen, Y.; Xu, M.; Wen, J.; Wan, Y.; Zhao, Q.; Cao, X.; Ding, Y.; Wang, Z.L.; Li, H.; Bian, Z. Selective Recovery of Precious Metals through Photocatalysis. Nat. Sustain. 2021, 4, 618–626. [Google Scholar] [CrossRef]
  17. Chen, Y.; Guan, S.; Ge, H.; Chen, X.; Xu, Z.; Yue, Y.; Yamashita, H.; Yu, H.; Li, H.; Bian, Z. Photocatalytic Dissolution of Precious Metals by TiO2 through Photogenerated Free Radicals. Angew. Chem. Int. Ed. 2022, 61, e202213640. [Google Scholar] [CrossRef] [PubMed]
  18. Guo, Y.; Li, Q.; Zhou, Y.; Zhang, L.; Zhao, Y. Enhanced Photocatalytic Activity of TiO2 Nanoparticles Modified with Polyacrylamide via Surface Grafting for Water Purification. ACS Appl. Mater. Interfaces 2020, 12, 25494–25502. [Google Scholar] [CrossRef]
  19. Hunter, R.J. Zeta Potential in Colloid Science: Principles and Applications; Academic Press: London, UK, 1981. [Google Scholar]
  20. Ifang, S.; Gallus, M.; Liedtke, S.; Kurtenbach, R.; Wiesen, P.; Kleffmann, J. Standardization methods for testing photocatalytic air remediation materials: Problems and solution. Atmos. Environ. 2014, 91, 154–161. [Google Scholar] [CrossRef]
  21. Folli, A.; Pochard, I.; Nonat, A.; Jakobsen, U.H.; Shepherd, A.M.; Macphee, D.E. Engineering photocatalytic cements: Understanding TiO2 surface chemistry to control and modulate photocatalytic performances. J. Am. Ceram. Soc. 2010, 93, 3360–3369. [Google Scholar] [CrossRef]
  22. Boonen, E.; Beeldens, A. Recent Photocatalytic Applications for Air Purification in Belgium. Coatings 2014, 4, 553–573. [Google Scholar] [CrossRef]
  23. Hanif, M.A.; Kim, Y.S.; Ameen, S.; Kim, H.G.; Kwac, L.K. Boosting the Visible Light Photocatalytic Activity of ZnO through the Incorporation of N-Doped for Wastewater Treatment. Coatings 2022, 12, 579. [Google Scholar] [CrossRef]
  24. Hüsken, G.; Hunger, M.; Brouwers, H.J.H. Experimental study of photocatalytic concrete products for air purification. Build. Environ. 2009, 44, 2463–2474. [Google Scholar] [CrossRef]
  25. Sakarkar, S.; Muthukumaran, S.; Jegatheesan, V. Tailoring the Effects of Titanium Dioxide (TiO2) and Polyvinyl Alcohol (PVA) in the Separation and Antifouling Performance of Thin-Film Composite Polyvinylidene Fluoride (PVDF) Membrane. Membranes 2021, 11, 241. [Google Scholar] [CrossRef]
  26. Kim, S.-Y.; Lee, T.-G.; Hwangbo, S.-A.; Jeong, J.-R. Effect of the TiO2 Colloidal Size Distribution on the Degradation of Methylene Blue. Nanomaterials 2023, 13, 302. [Google Scholar] [CrossRef] [PubMed]
  27. Surkatti, R.; van Loosdrecht, M.C.M.; Hussein, I.A.; El-Naas, M.H. PVA-TiO2 Nanocomposite Hydrogel as Immobilization Carrier for Gas-to-Liquid Wastewater Treatment. Nanomaterials 2024, 14, 249. [Google Scholar] [CrossRef] [PubMed]
  28. Rasteiro, M.G.; Garcia, F.A.; Hunkeler, D.; Pinheiro, I. Evaluation of the Performance of Dual Polyelectrolyte Systems on the Re-Flocculation Ability of Calcium Carbonate Aggregates in Turbulent Environment. Polymers 2016, 8, 174. [Google Scholar] [CrossRef] [PubMed]
  29. Ahmed, M.A.; Mohamed, A.A. Advances in Ultrasound-Assisted Synthesis of Photocatalysts and Sonophotocatalytic Processes: A Review. iScience 2023, 26, 108583. [Google Scholar] [CrossRef]
  30. Alshabander, B.; Abd-Alkader, M.B. Photocatalytic Degradation of Methyl blue by TiO2 Nanoparticles Incorporated in Cement. Int. J. Phys. 2023, 2, 1042. [Google Scholar] [CrossRef]
  31. Chen, X.; Qiao, L.; Zhao, R.; Wu, J.; Gao, J.; Li, L.; Chen, J.; Wang, W.; Galloni, M.G.; Scesa, F.M.; et al. Recent Advances in Photocatalysis on Cement-Based Materials. Cem. Concr. Res. 2022, 161, 106984. [Google Scholar] [CrossRef]
  32. KS L 5201; Portland Cement. Korean Agency for Technology and Standards (KATS): Seoul, Republic of Korea, 2021.
  33. KS L ISO 679; Methods of Testing Cements-Determination of Strength. Korean Agency for Technology and Standards (KATS): Seoul, Republic of Korea, 2022.
  34. Fregni, A.; Venturi, L.; Franzoni, E. Evaluation of the Performance and Durability of Self-Cleaning Treatments Based on TiO2 Nanoparticles Applied to Cement-Based Renders and Boards. Coatings 2023, 13, 990. [Google Scholar] [CrossRef]
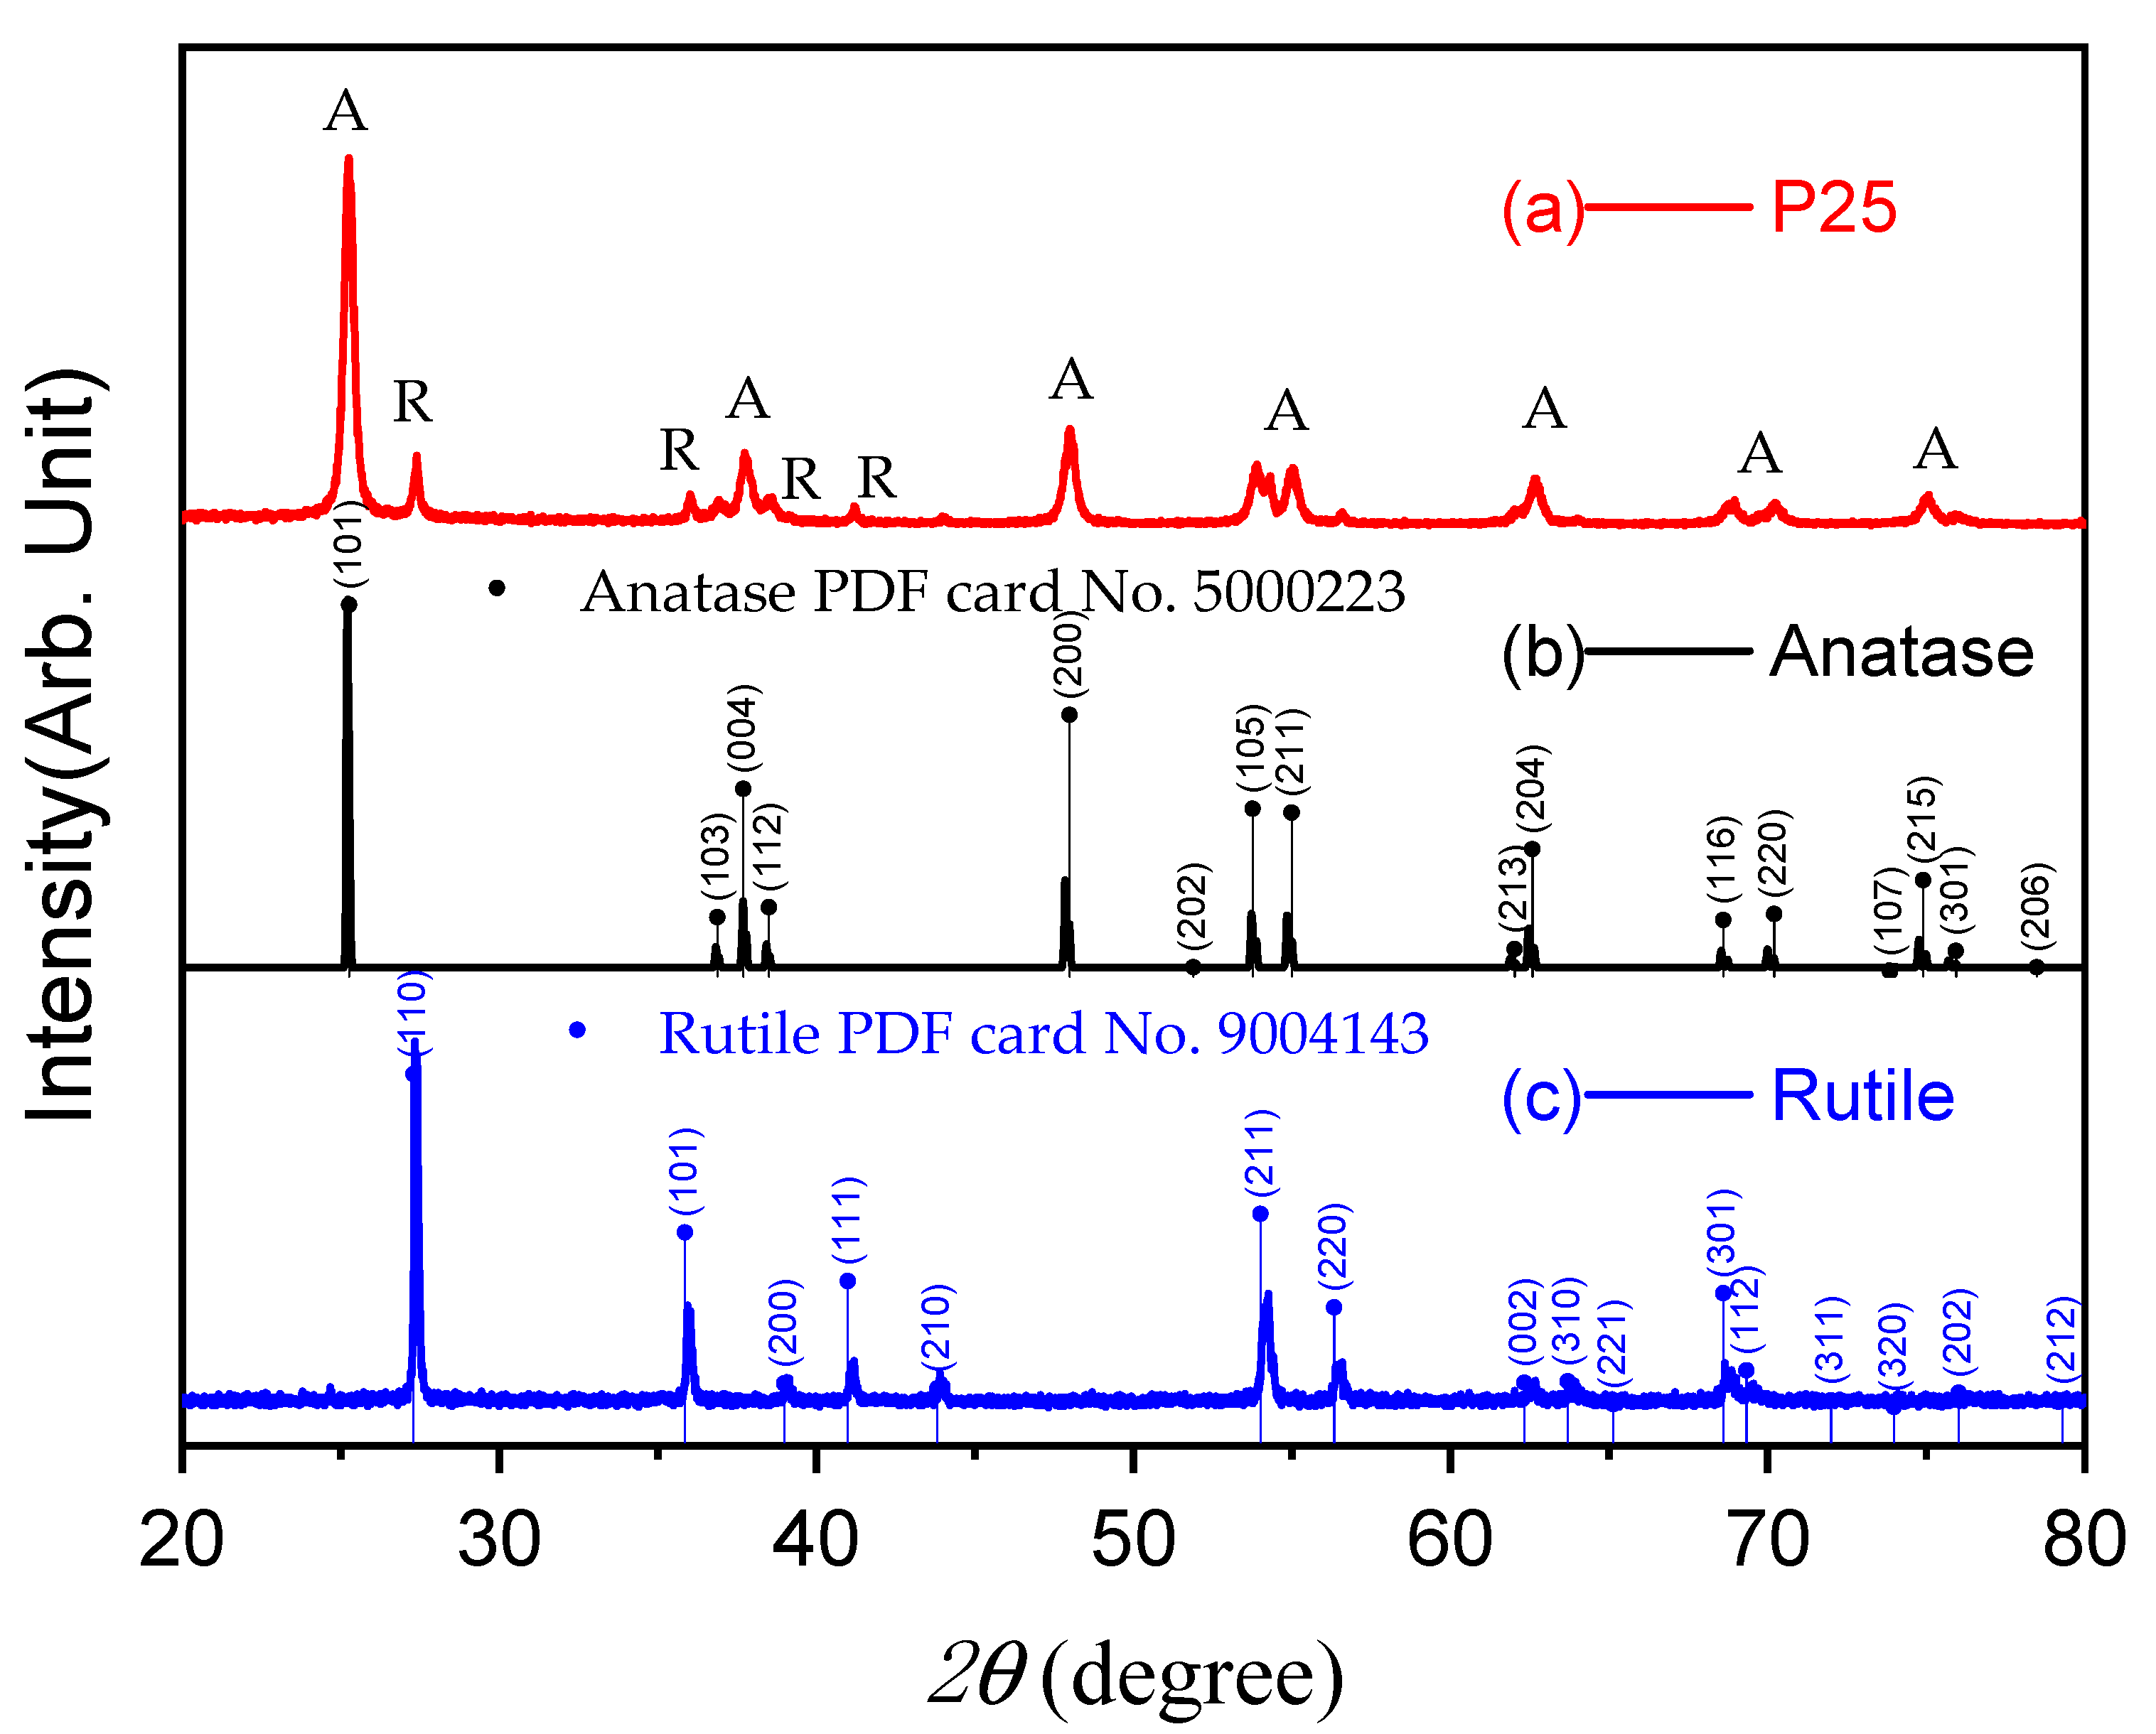
Figure 1. Comparison of XRD patterns and standard anatase and rutile (ICDD) diffraction data of P25 TiO2 samples. (a) XRD pattern of P25 TiO2 sample, (b) standard anatase PDF card (No. 5000223, 7206075), (c) standard rutile PDF card (No. 9004143).
Catalysts 15 00935 g001
Figure 2. (a) The overall SEM image (10,000 magnification) of the P25 TiO2 sample was observed, and (b) the fine shape of the SEM image (100,000 magnification) nanoparticles of the P25 TiO2 sample was observed.
Catalysts 15 00935 g002
Figure 3. (a) Nitrogen adsorption–desorption isotherm (BET analysis result) of P25 TiO2, (b) P25 TiO2 pore size distribution and cumulative pore volume curve (BJH analysis result).
Catalysts 15 00935 g003
Figure 4. Results of particle size and distribution of TiO2 dispersed in distilled water and polymer solution; (a) Particle Size Distribution of TiO2 Dispersed in Distilled Water; (b) Particle Size Distribution of TiO2 Dispersed in PEG solution; (c) Particle Size Distribution of TiO2 Dispersed in PVA solution; (d) Cumulative particle size for DI, PEG, PVA.
Catalysts 15 00935 g004
Figure 5. Particle size results for TiO2 and PVA ratio.
Catalysts 15 00935 g005
Figure 6. Comparison of TiO2 dispersion UV–Vis absorption spectra under different pretreatment and ultrasonic treatment conditions.
Catalysts 15 00935 g006
Figure 7. UV–Vis spectral change in (a) only MB in DI, (b) MB in PVA solution without TiO2, (c) MB in DI dispersed TiO2, and (d) MB in PVA pretreated dispersed TiO2.
Catalysts 15 00935 g007
Figure 8. Experimental procedure schematic diagram: After dispersing TiO2 nanoparticles treated with PVA in distilled water, mixing them with cement and sand to prepare concrete, curing them for 1 month, and powdering them and using them for photocatalytic performance evaluation.
Catalysts 15 00935 g008
Table 1. TiO2 crystal phase mixing ratio of Anatase and Rutile.
TiO2AnataseRutile
wt.%81.3319.06
Table 2. Particle size distribution ratios of TiO2 dispersions with different pretreatments.
Particle Size (nm)DIPEGPVA
100~200046.553.466.7
20,000~200,00053.546.633.3
Table 3. Measurement results of particle size and zeta potential in TiO2, PDI and PVA mixing ratio (n = 3).
PVA/TiO2DI0.1:11:110:1
Particle size (nm) ± SD1715.7 ± 37.51395.5 ± 52.91813.2 ± 46.13351.6 ± 379.1
PDI0.5040.1740.6310.963
Zeta potential (mV) ± SD−5.84 ± 0.37−10.90 ± 0.37−9.27 ± 0.48−9.27 ± 0.81
Table 4. Comparison of MB photolysis velocity constants in aqueous solution.
Samplek_app (10−2 min−1)R2Relative Performance
DI0.150.851.0
PVA 0.1%1.710.9811.4
Table 5. Comparison of Concrete Powder MB Photolysis Velocity Constant.
Samplek_app (×10−3 min−1)R2Relative Performance
DI2.70.901.0
PVA 0.1%5.20.981.9
Disclaimer/Publisher’s Note: The statements, opinions and data contained in all publications are solely those of the individual author(s) and contributor(s) and not of MDPI and/or the editor(s). MDPI and/or the editor(s) disclaim responsibility for any injury to people or property resulting from any ideas, methods, instructions or products referred to in the content.