Article

Exploring the Evolution of Co-Deposited Copper and Iron Nanostructures on Hydroxyapatite: Implications in NH3-SCR Reaction

by
Melissa Greta Galloni
1,2,
Weidong Zhang
2,3,
Anne Giroir-Fendler
2,
Sebastiano Campisi
1,* and
Antonella Gervasini
1
1
Dipartimento di Chimica, Università degli Studi di Milano, Via Camillo Golgi 19, 20133 Milano, Italy
2
IRCELYON, UMR 5256 CNRS, Université-Claude Bernard Lyon 1, 43 Boulevard du 11 Novembre 1918, 69622 Villeurbanne, France
3
School of Chemistry and Chemical Engineering, Anhui Province Key Laboratory of Coal Clean Conversion and High Valued Utilization, Anhui University of Technology, Ma’anshan 243002, China
*
Author to whom correspondence should be addressed.
Catalysts 2025, 15(10), 929; https://doi.org/10.3390/catal15100929
Submission received: 18 August 2025 / Revised: 19 September 2025 / Accepted: 24 September 2025 / Published: 1 October 2025
(This article belongs to the Special Issue Advances in Transition Metal Catalysis, 2nd Edition)

Abstract

Copper and iron species were co-deposited onto a hydroxyapatite surface to produce bimetallic catalysts. Characterization techniques (XRD, XPS, DR-UV spectroscopy and TEM-EDX) helped in unveiling the speciation, nuclearity, and electronic properties of copper and iron in samples with variable total metal loading (1–10 wt.%) and relative Cu-to-Fe ratios. The speciation of Cu was revealed to be not affected by Fe and vice versa. Conversely, the metal loading turned out to be a key factor ruling the aggregation state of Cu and Fe species. The samples were tested as catalysts in the Selective Catalytic Reduction of NO by NH3 (NH3-SCR) in dry and wet environments under quasi-real conditions (50,000 ppm O2; 50,000 ppm H2O, if present; 120,000 h−1 GHSV) in the 200−500 °C interval. Although the combination of Cu and Fe affords a modest improvement in water resistance compared to their monometallic counterparts, no substantial enhancement in activity was observed for the bimetallic hydroxyapatite-based SCR catalysts.

Graphical Abstract

1. Introduction

Hydroxyapatite (Ca10(PO4)6(OH)2, HAP) is a naturally occurring mineral that is gaining increasing attention for its application across a wide range of fields, including biomedicine, cosmetics, cultural heritage preservation, environmental remediation—such as the capture of metal pollutants and adsorption of organic species—and as a catalyst in various heterogeneous reactions [1,2,3,4]. It is a mesoporous solid with highly flexible structure and tunable acid/base properties [5,6], which can be extracted from natural sources (mineral rocks or bio-wastes such as bones or other biogenic products) [7]. The introduction of metal ions into substitutional and interstitial sites of the HAP crystal lattice, along with the immobilization of metal complexes and oxide nanoclusters on its surface, enables the use of metal-loaded hydroxyapatites in various applications [8,9].
Although many different ions (cations or oxo-anions) have been successfully incorporated into HAP, the modification of hydroxyapatite by copper or iron species is particularly interesting as it allows for tunable surface reactivity, optimizing the material for applications in biomedicine, sensors, coatings, catalysis and corrosion [10,11].
The application of Cu/HAP and Fe/HAP in catalysis has recently gained growing attention. The tailored deposition of Cu or Fe species onto the HAP surface has demonstrated high potential for environmental catalysis applications, such as Fenton-like degradation of toxic organic compounds [12], butan-2-ol conversion [13], H2O2 electrocatalytic reduction [14], propane oxidative dehydrogenation [13], selective hydrogenation of CO2 [15], total oxidation of volatile organic compounds (de-VOCs) [16], NOx selective catalytic reduction by NH3 (NH3-SCR), selective oxidation of ammonia (NH3-SCO), and N2O decomposition reactions [17,18,19,20,21,22,23,24]. In NH3-SCR, copper and iron dispersed on HAP operate in different temperature ranges and exhibit different intrinsic activities, likely due to their different reducibility properties. Cu/HAP catalysts demonstrate higher activity and selectivity to N2 than Fe/HAP, although the latter maintains good activity over a broader temperature window [21].
Despite extensive research on Cu/HAP and Fe/HAP materials and their structural and practical applications, the co-deposition of Cu and Fe on hydroxyapatite remains largely unexplored. When copper and iron are simultaneously co-deposited on HAP, the formation of metal species on the surface can be interdependent, affecting speciation, nuclearity, electronic properties, and geometric arrangement of the metal species. These reciprocal interactions between the two metals can determine important differences in the nature and relative abundance of the metal sites. The incorporation of copper and iron could likely occur via ionic substitution at the two symmetrically distinct positions of calcium, Ca(1) and Ca(2). Theoretical and experimental studies indicate that substitution at the Ca(1) site is favored at low metal loadings for both Cu2+ and Fe3+, whereas at high metal loading, Ca(2) sites can also be occupied [25,26]. However, ionic substitution of calcium ions with copper and iron would result in a significant distortion of the crystal structure. Consequently, both copper and iron ions usually undergo interstitial incorporation in the OH-site channel of HAP. In this case, no competition between the two metals should be observed. In fact, Saito et al. [27] studied the co-deposition of copper and iron on HAP and demonstrated through Rietveld refinement that at low metal loading Cu occupied the 2b site (0, 0, 0) at the center of the channel, while Fe occupied the 12i site (x, 0, 0), offset from the channel center. Most importantly, the incorporated Cu did not affect the position of Fe in the channel, and vice versa, at low metal loading. The presence of copper ions into the hydroxyl channel of HAP is accompanied by the replacement of OH with O2– and the formation of [O2––Cu2+–O2–] linear oxocuprate units, while iron forms FeO4 tetrahedra. Recently, Kalita et al. [28] proposed a novel synthesis approach involving the hydrothermal production of HAP nanorods with dual Fe-Cu doping. The resulting Fe-Cu/HAP nanocatalysts demonstrated superior efficiency in degrading organic dyes through a Fenton-like oxidation process using H2O2 as the oxidant. Structural, morphological, and optical analyses confirmed their enhanced catalytic activity compared to undoped HAP.
In the present work, the co-deposition of copper and iron species onto the HAP surface was investigated by varying the metal content in the 1−10 wt.% range and the relative Cu to Fe ratios (Figure S1). Characterization by N2-physisorption, X-Ray Diffraction (XRD), Transmission Electron Microscopy Energy-Dispersive X-ray spectroscopy (TEM-EDX), Diffuse Reflectance UV-Vis (DR-UV), and X-ray Photoelectron (XP) spectroscopic measurements were aimed at disclosing the fate of copper and iron species on the HAP surface. The catalytic performance of bimetallic copper–iron hydroxyapatite in the NH3-SCR reaction was evaluated for the first time, providing a knowledge base to guide the development of future innovative and sustainable catalysts.

2. Results

2.1. Structure and Surface Properties of Copper–Iron HAP Samples

Modified HAP samples with copper and iron were prepared with total metal concentrations ranging from 1 to 10 wt.% with variable molar Cu:Fe ratios (1:1; 1:2; 2:1). The surface properties of the hydroxyapatite support played a crucial role in directing metal dispersion, providing both acid and basic sites that served as anchoring centers for the metal species [17].
Table 1 summarizes the key bulk and surface properties of the copper–iron modified samples, together with those of the unmodified HAP support. ICP-OES analyses confirmed that the concentrations of both copper and iron closely matched the nominal total metal content introduced onto the HAP support. Although surface Ca/P ratios were expected to decrease progressively with increasing Cu–Fe loading, the measured values do not follow a clear trend, ranging irregularly from 1.55 to 2.36. This inconsistency highlights the difficulty of interpreting Ca/P variations in copper–iron HAP samples. The atomic Ca/P molar ratio, ideally 1.67 for stoichiometric hydroxyapatite, is highly sensitive to structural substitutions and vacancies. In non-stoichiometric apatites, the replacement of PO43 by HPO42 or CO32 induces cationic and hydroxyl vacancies, affecting the overall Ca/P balance [29]. The situation becomes even more complex with additional substitutions, such as Cu2+ and Fe3+, which interact with these defects and may preferentially localize in surface or vacancy-rich regions. Furthermore, partial carbonation during synthesis, despite careful control, can introduce both A- and B-type carbonate groups, leading to opposing effects on the Ca/P ratio. These overlapping contributions make it difficult to directly correlate Cu–Fe content with Ca/P values in a linear or predictable way. Surface area and porosity of samples were studied by N2 adsorption/desorption isotherms at −196 °C. The collected isotherms of bare HAP and copper–iron samples are shown in Figure S1a and Figure 1a, respectively. Bare HAP exhibited a mesoporous structure [30], with a specific surface area of 75 m2·g1, a total pore volume of 0.19 cm3·g1, and a mean pore radius of 8.2 nm. These structural features were retained across the copper–iron samples, with negligible alterations in pore size or shape (Table S1). The average surface area of the copper–iron HAP samples remained consistently around 75 m2∙g−1 (Table 1).
X-ray Diffraction (XRD) was used to investigate the crystalline phases present in the metal-modified samples. The diffractograms of the copper–iron samples (Figure 1b) were dominated by the pattern of crystalline HAP (JCPDS 00-009-0432, Figure S1b) with no additional reflections attributable to copper- or iron-containing phases, regardless of the total metal loading or the Cu:Fe molar ratio. It has previously been demonstrated [17,31] that a high concentration of copper on HAP (≥6 wt.%) can promote the formation of libethenite (Cu2(OH)PO4, JCPDS 00-036-0404). The absence of the libethenite phase in Cu5Fe5/HAP—the sample with the highest copper loading—despite the prolonged contact time normally required for its formation, suggests the existence of a critical copper concentration threshold that governs its appearance. However, the role of iron in preventing copper structuring cannot be excluded. The interplay of iron and copper during nucleation, when both species are simultaneously present on the same surface, is not clearly defined in the literature. Metal interactions during nucleation remain complex and poorly understood. In fact, the presence of one metal can create nucleation sites, or alter the surface energy, thereby affecting the deposition pattern of another metal.
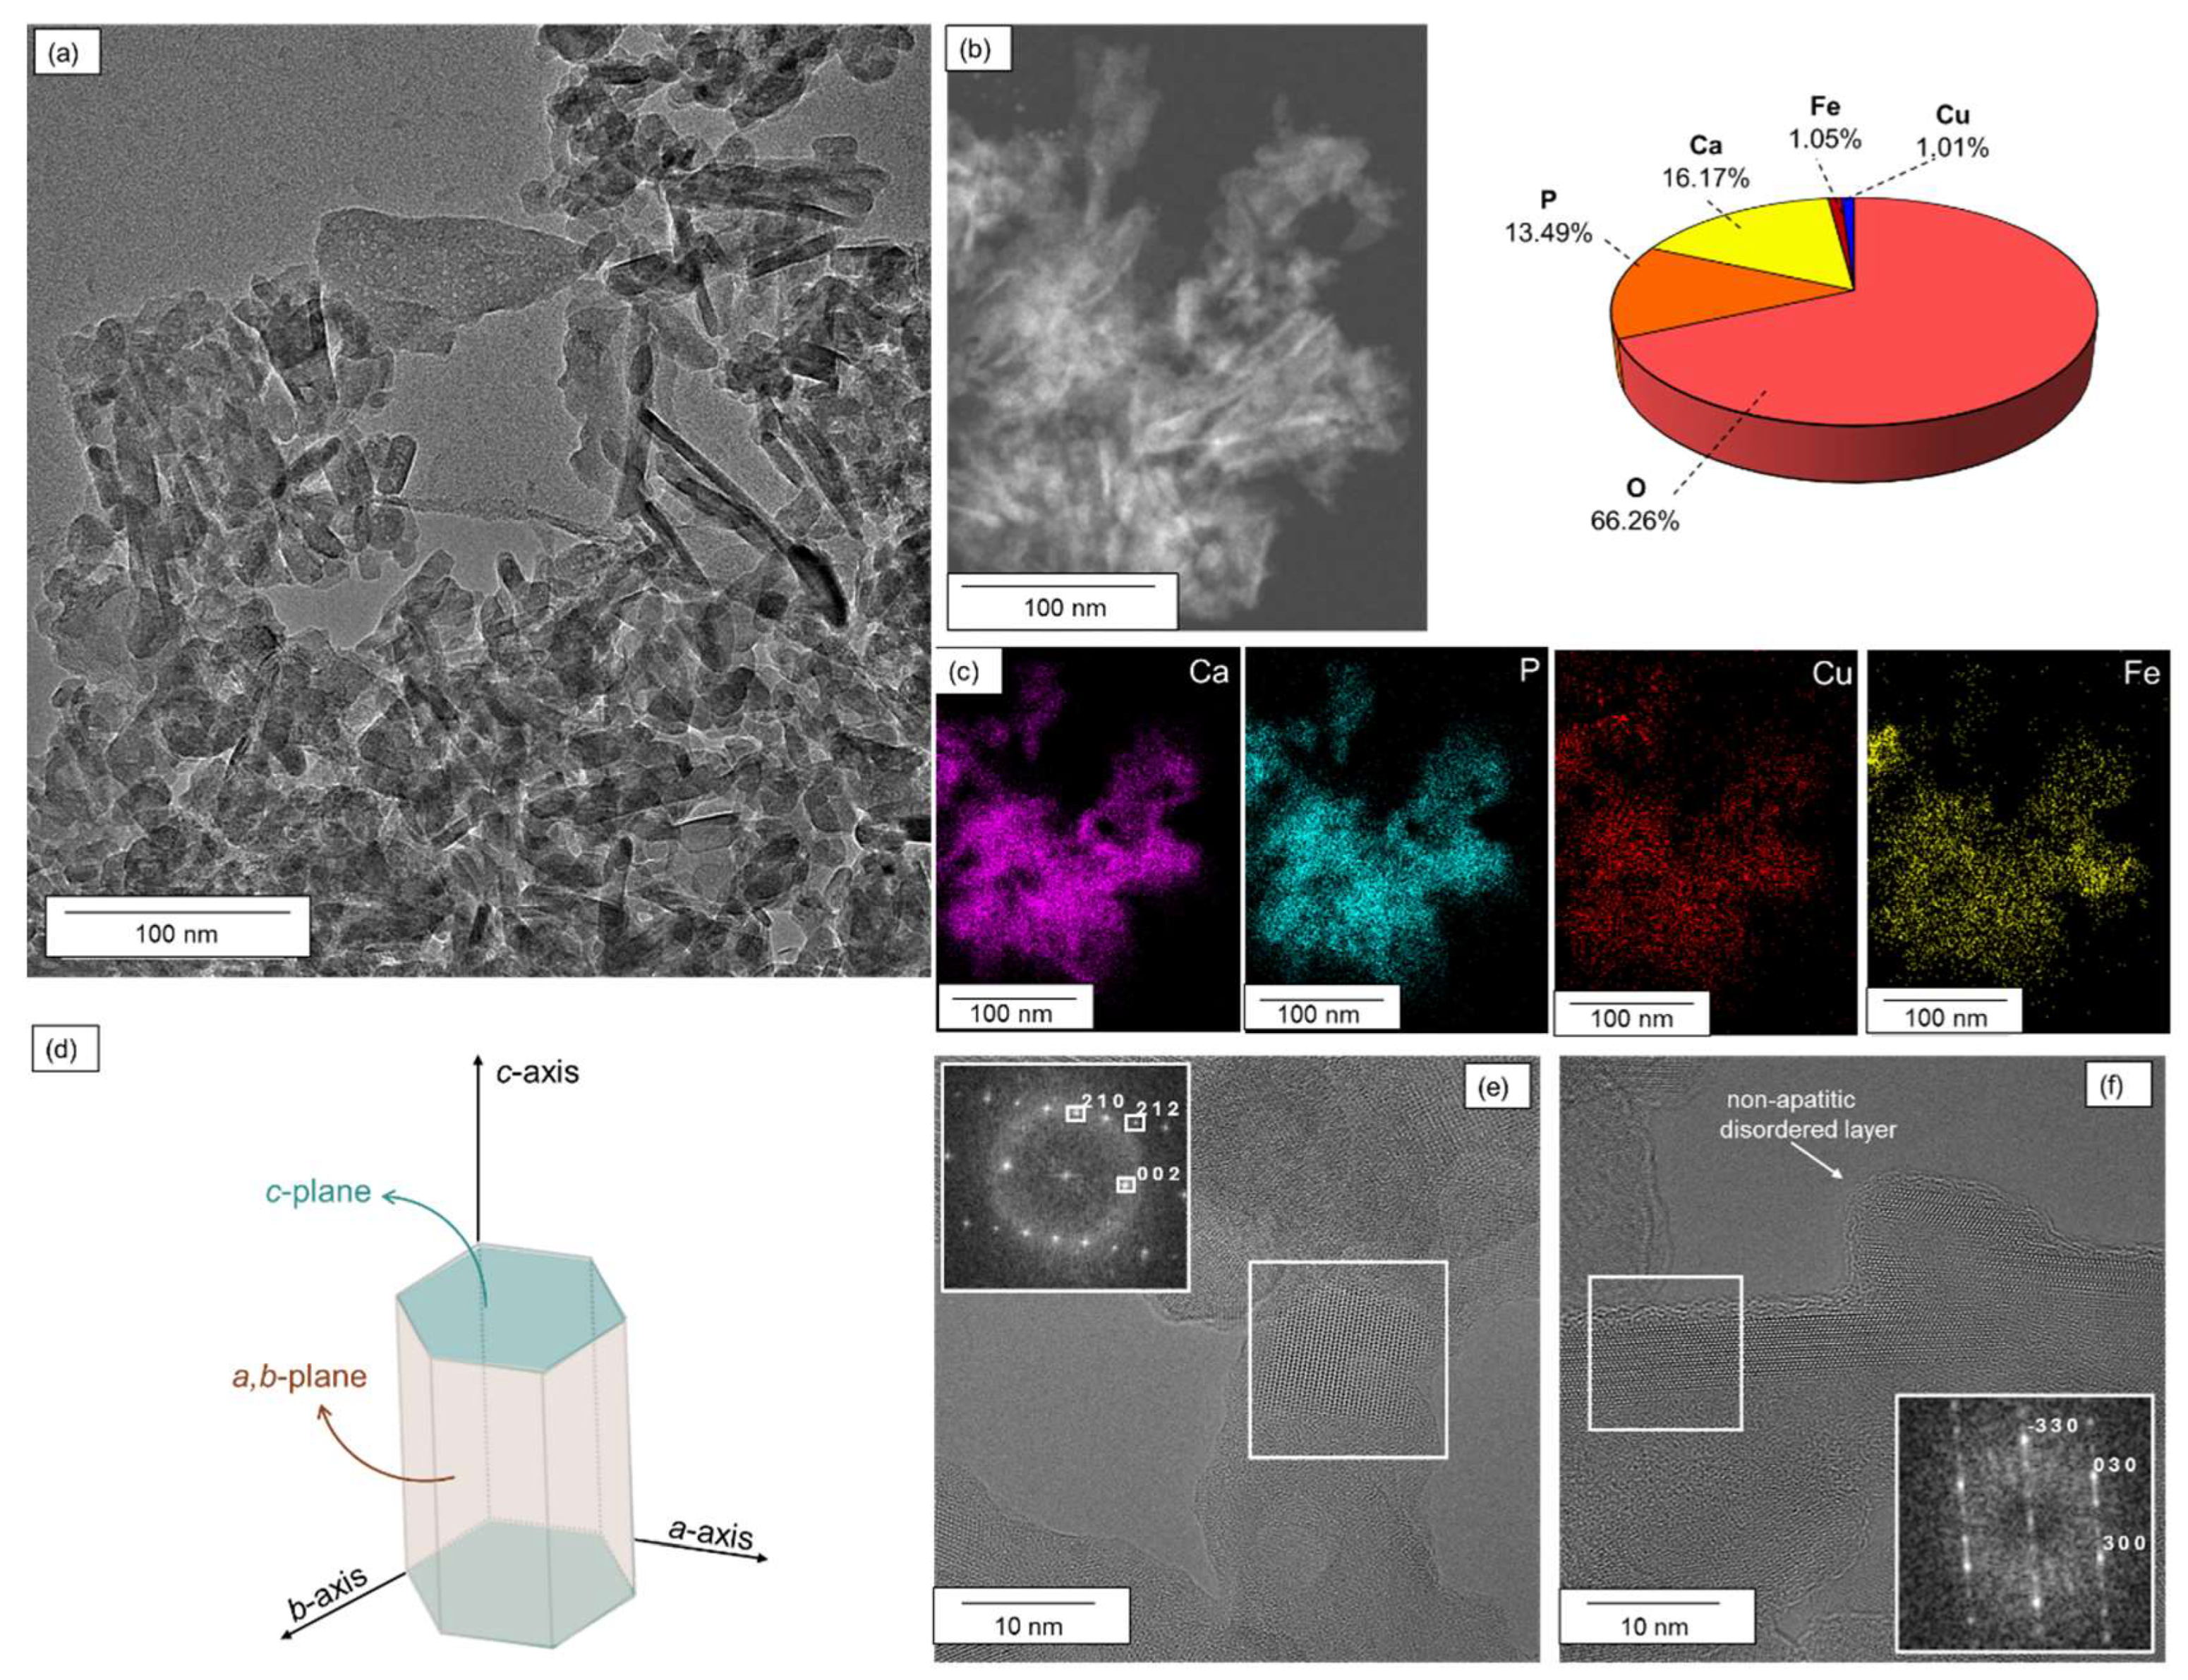
The morphology of Cu3Fe3/HAP was investigated via TEM-EDX microscopy (Figure 2a,b). The TEM micrographs revealed nanorods assemblies similar in shape and size to those observed in unmodified hydroxyapatite (Figure S1c). EDX analysis indicated a uniform decoration of HAP nanorods by both copper and iron species, without any distinct separate phases or aggregates. EDX analysis (Figure 2b) and elemental mapping (Figure 2c) confirmed an equimolar distribution of copper and iron species, with atomic concentrations of approximately 1.01% and 1.05%, respectively. High-resolution TEM images combined with Selected Area Electron Diffraction (SAED) and Fast Fourier Transform (FFT) analyses (Figure 2e,f) acquired from two distinct regions of the hydroxyapatite crystal revealed complementary crystallographic orientations. In Figure 2e, the detection of (002), (212), and (210) reflections in the SAED/FFT pattern indicates a lateral view of the crystal, with the c-axis tilted relative to the electron beam.
The detection of the basal (002) plane along with inclined (212) and prismatic (210) planes suggests that the nanorod is observed in cross-section, revealing its anisotropic structure. In Figure 2f, only prismatic reflections, (–330), (030), and (300), are detected, without any visible (00l) reflections. This pattern is consistent with an observation along the [001] zone axis, i.e., a top-down view along the c-axis, where only planes in the a–b plane contribute to the diffraction. The presence of sharp diffraction spots indicates that the crystalline order is preserved: copper and iron deposition introduce only local lattice distortions without generating significant defect densities.
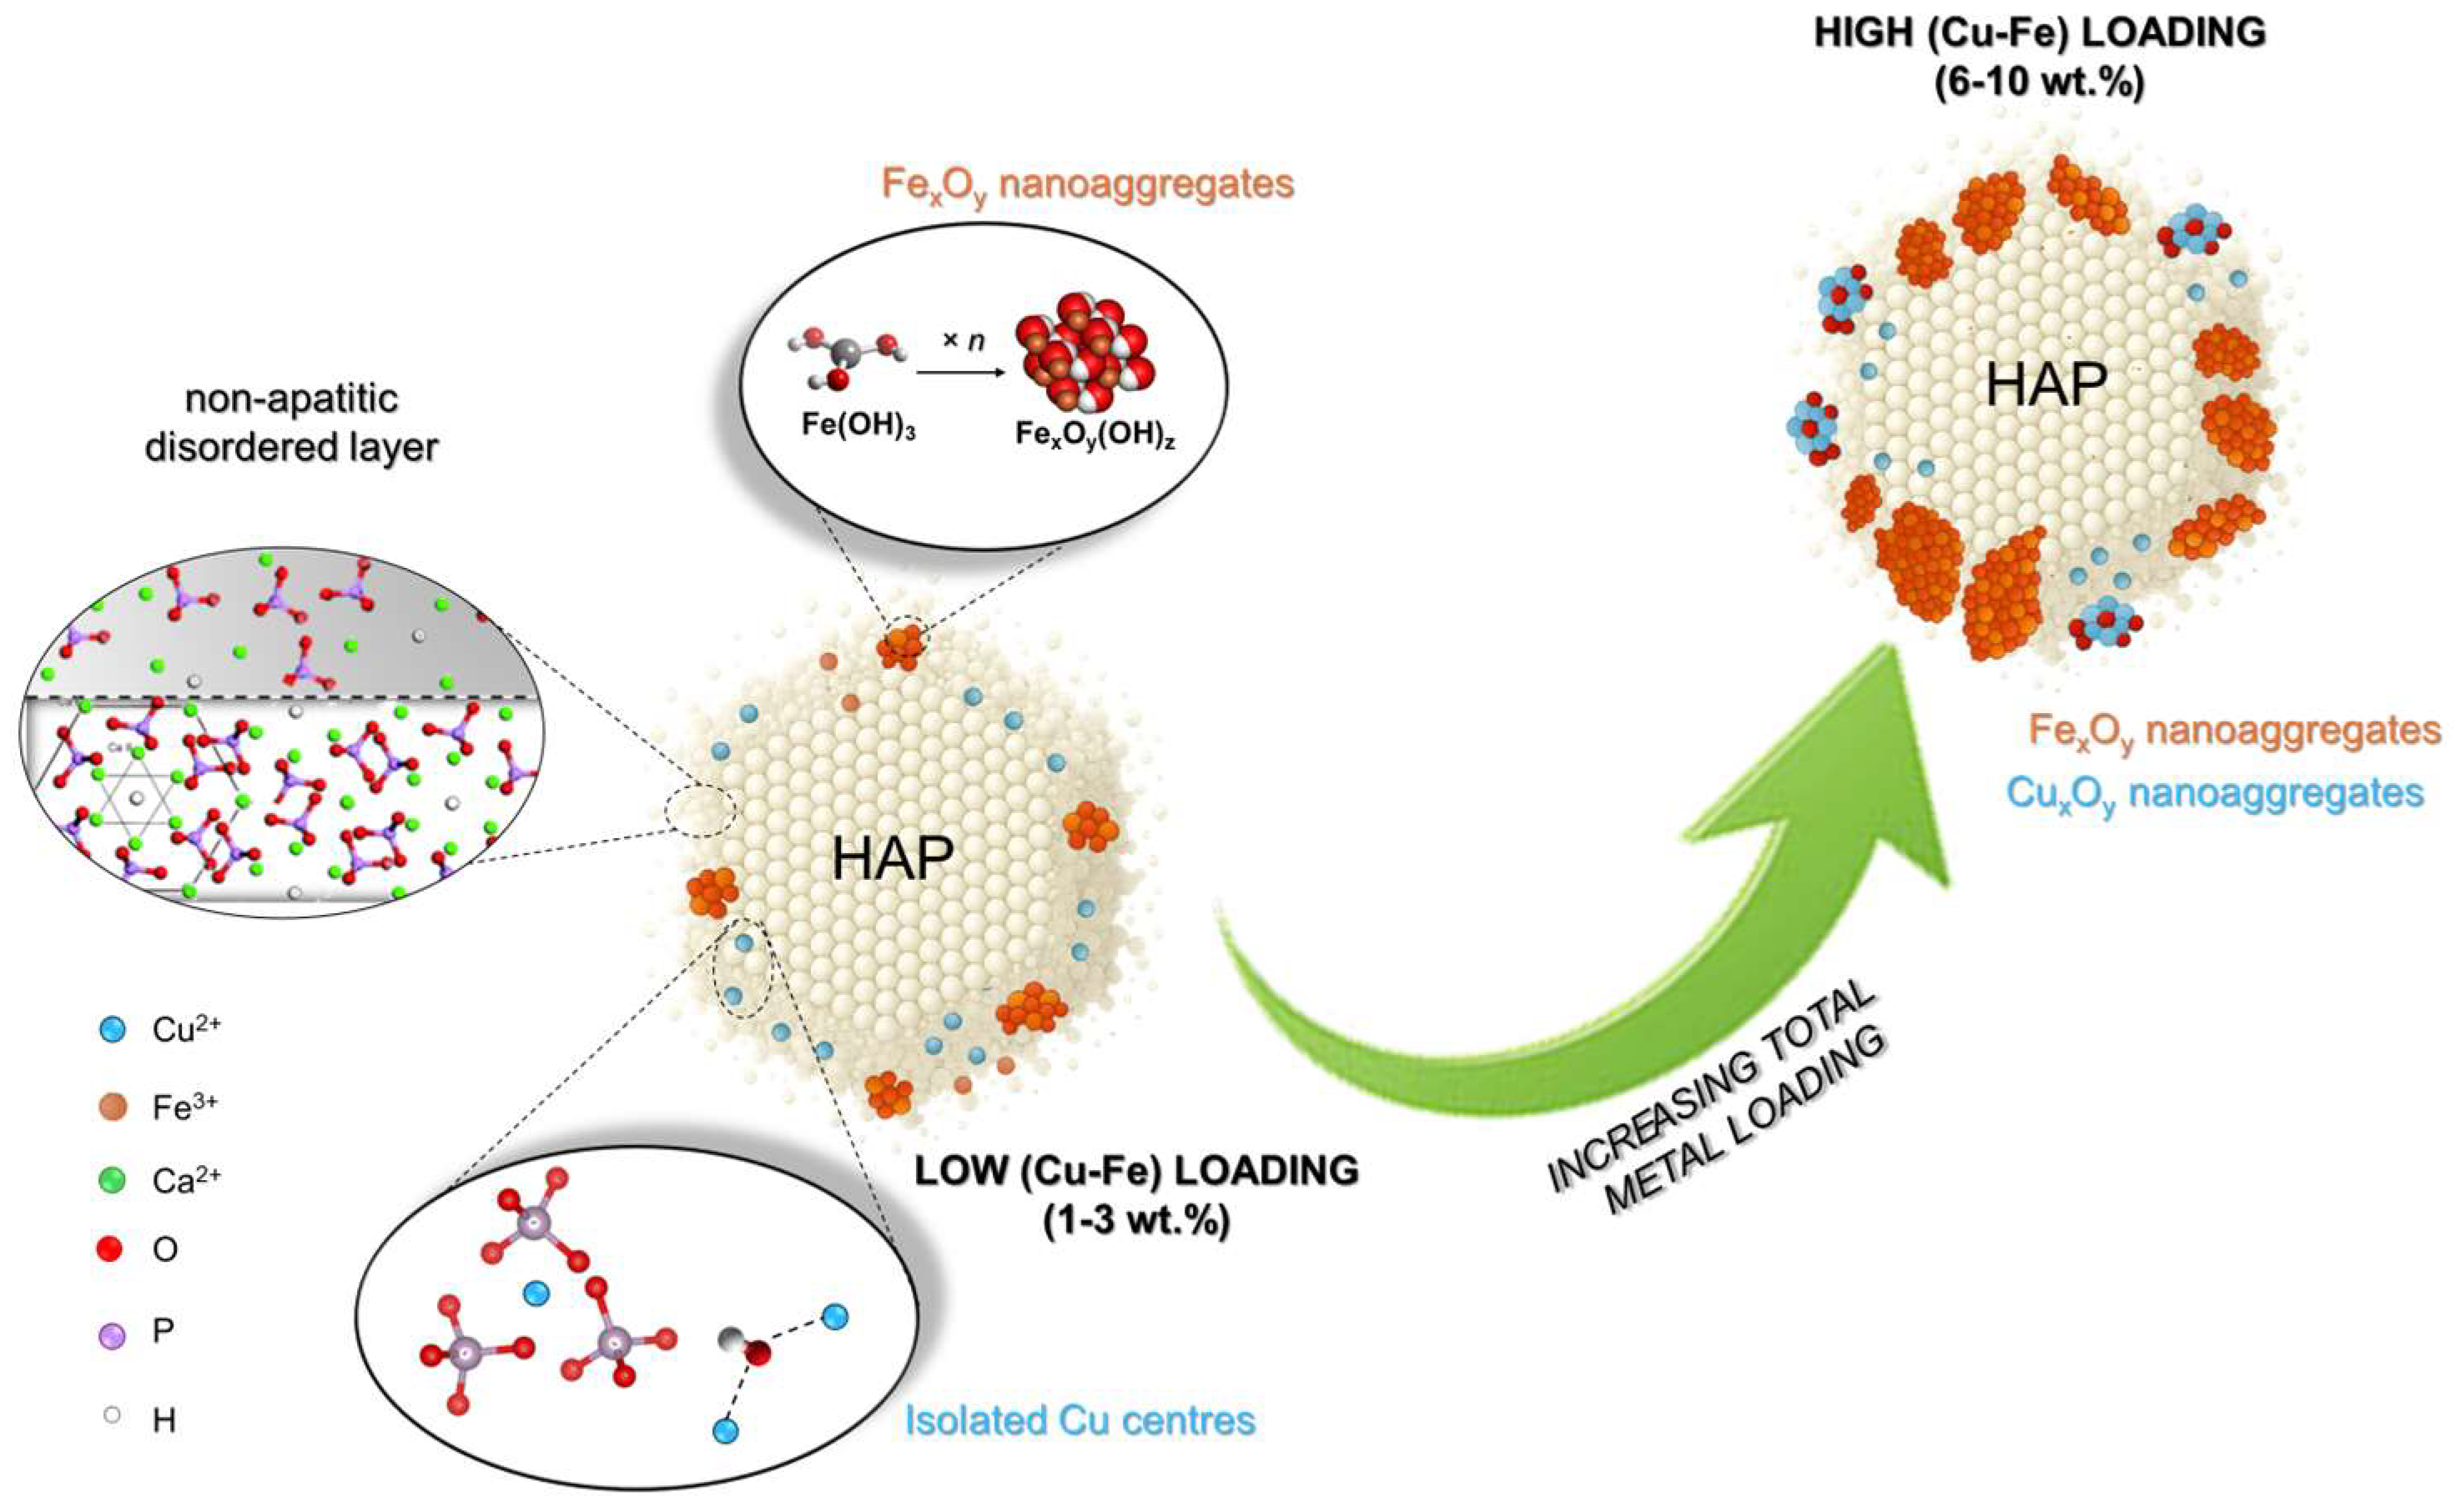
However, the observation of an amorphous layer at the nanorod contours suggests the presence of a non-apatitic disordered layer, a surface region characterized by a lack of long-range crystalline order, which is typical in biogenic analogues and can influence surface properties without affecting the bulk crystal structure [29]. This non-apatitic disordered layer represents a highly reactive, structurally labile region. Due to its higher degree of hydration, lower crystallinity, and increased ion mobility compared to the apatitic core, this surface layer could then serve as a preferential site for the incorporation of copper and iron ions. Notably, even at the atomic scale, localized EDX analyses on small crystal domains confirmed the expected 1:1 Cu:Fe ratio, demonstrating uniform incorporation and compositional homogeneity across individual nanorods.
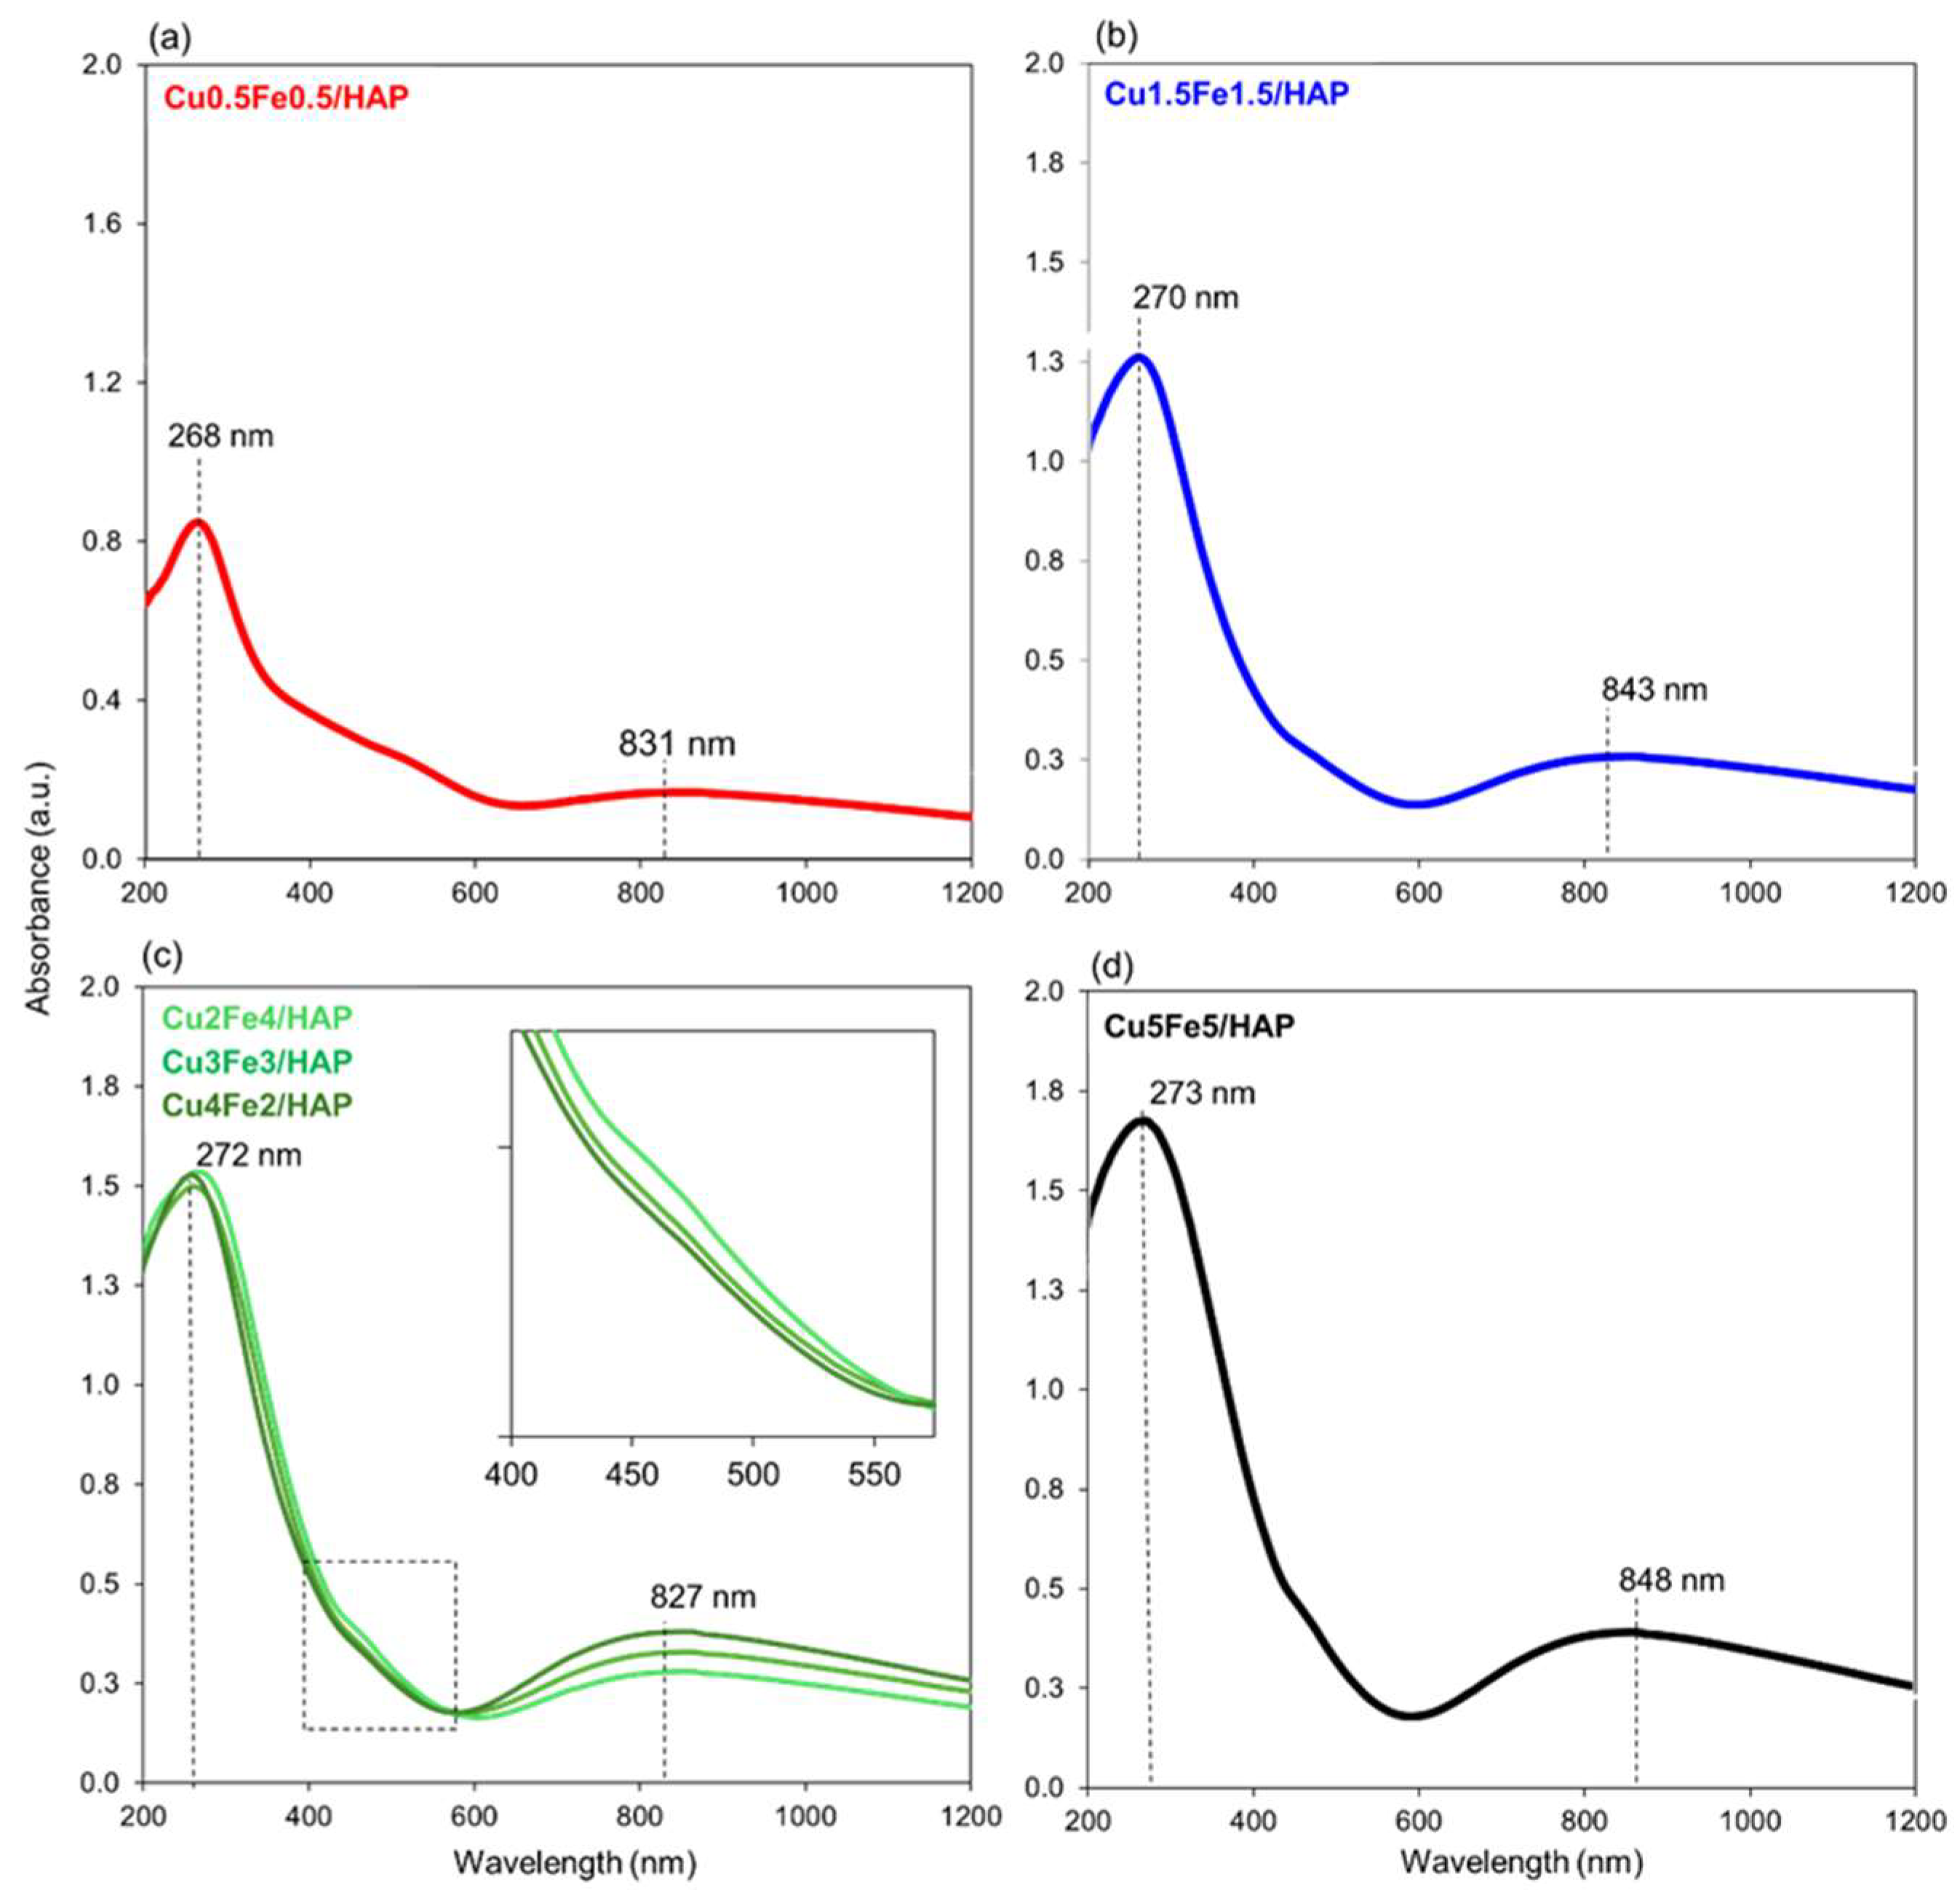
Diffuse Reflectance UV-vis (DR-UV) spectroscopy was employed to investigate the coordination and aggregation states of copper and iron in the copper–iron HAP samples. The collected spectra (Figure 3), spanning the 200–1800 nm region, were first compared with that of bare HAP (Figure S1d). The spectrum of the unmodified HAP (Figure S1d) exhibited no visible-region absorption, consistent with the absence of transition metal species. The only notable feature was a sharp absorption band ca. 200 nm, attributed to ligand-to-metal charge transfer (LMCT) transitions involving lattice oxygen and calcium (O2−→Ca2+), according to our recent investigations [17,18,19,20,21,24]. This is consistent with the electronic behavior of HAP, a wide bandgap insulating material [32].
When copper and iron were introduced onto HAP, the DR-UV spectra (Figure 3) became increasingly complex, reflecting multiple overlapping electronic transitions. In general, the bands were broad and extended over wide wavelength ranges, making precise attribution challenging; however, the average positions of the main absorption maxima have been indicated in Figure 3 as representative markers.
Notably, a broad band spanning 590 nm–1000 nm (centered at 820–850 nm) was observed and attributed to d–d transitions of Cu2+ ions in pseudo-octahedral oxygen coordination, suggesting the presence of dispersed CuxOy-like nanoparticles. This band increased in intensity with higher Cu loading. A sharp band at ca. 200 nm persisted and is attributed to ligand-to-metal charge transfer (LMCT) transitions involving isolated Cu2+ or Fe3+ centers (O2−→Cu2+ or O2−→Fe3+) embedded in the HAP lattice [33]. Two additional shoulders between 400–450 nm and 460–650 nm were also observed. The acquisition of spectra using bare HAP as reference (Figure S2) and the comparison with monometallic ones allowed to unambiguously assign these features to the incorporated metals [33,34]: the first contribution is consistent with the 6A14E, 4A1 ligand field transition typical of Fe3+ in FexOy clusters [35], while the second between 460 and 650 nm is associated with lateral Cu interactions within Cu−O−Cu neighbors in line with previous observations from the literature [36,37]. Overall, all the observed bands exhibited a tendency to broaden and shift with increasing total metal content, indicating progressive aggregation or interaction among metal species.
The co-addition of Cu and Fe can affect the reducibility of each metal species due to partial charge transfer between the two metals, which alters their electronic properties and generates unique electronic and coordination environments. To explore this aspect, XPS analysis was employed. Table 1 summarized the surface atomic composition of copper–iron HAP samples compared with those of bare HAP, whereas Figures S3a and S4a show representative survey spectra of bare HAP and the Cu3Fe3/HAP sample, selected among the copper–iron samples for its medium loading of metal species. As expected, the survey spectrum of bare HAP (Figure S3a) showed signals for Ca, P, O, and adventitious C, while the Cu3Fe3/HAP survey spectrum (Figure S4a) additionally displayed clear Cu 2p and Fe 2p peaks, confirming metal deposition on the surface.
In the unmodified HAP, the detected Ca/P ratio was approximately 1.5, consistent with the literature reporting that XPS analysis typically reveals a surface Ca/P ratio significantly lower than the bulk value, likely due to calcium ions relaxation in the sub-surface, as proven by ion scattering spectroscopy [38,39].
The copper–iron HAP samples exhibited a systematic decrease in the measured surface Ca/P ratios, from 1.4 (Cu0.5Fe0.5/HAP) to 1.0 atomic % (Cu5Fe5/HAP). This trend suggests that Cu2+ and Fe3+ ions preferentially localize within the non-apatitic, disordered surface layer rather than being fully incorporated into the apatitic lattice. Furthermore, a clear deviation from the nominal bulk Cu/Fe ratio was observed, with a consistent surface Fe-enrichment across the series (Table 1).
The comparison between bulk (ICP) and surface (XPS) composition expressed as wt.% (Table 1) clearly confirms the enrichment of both Cu and Fe at the surface with respect to the bulk. This effect is particularly pronounced for Fe, where surface concentrations can be up to ~7 times higher than bulk values, especially at lower overall contents. For Cu, the enrichment is also significant, though less extreme, with surface values generally 1.5–3 times higher than bulk. Moreover, the relative enrichment decreases as the bulk concentration increases.
Compared to copper, iron shows a stronger tendency to accumulate at the hydroxyapatite surface due to its higher charge, smaller ionic radius, and propensity to form surface hydroxide complexes, whereas copper charge and size allow for more efficient substitution into the apatitic lattice.
The high resolution (HR) XPS spectra of all samples (Figures S3b–e, S4b–e and Figure 4) offer insights into oxidation states of the main elements detected. For all samples, the C 1s region HR spectra (Figures S3b and S4b) showed a main peak at ~284.6 eV (C-C, C-H), along with components at ~287.5–288.1 eV ascribable to C=O/O–C=O groups and at ca. 289.0 eV related carbonate species (CO32) [17,38].
The O 1s HR spectra (Figures S3c and S4c) featured a dominant peak at ~531.0 eV, assigned to lattice oxygen in phosphate (PO43) and hydroxyl groups and a second component at ~532.0 eV related to adsorbed water, or carbonate groups [38,40]. In copper–iron HAP samples, a slight broadening and shifting of O 1s peak suggested interaction with transition metal species (Cu, Fe).
The Ca 2p HR region spectra (Figures S3d and S4d) displayed the typical Ca2+ doublet at ~347.1 and ~350.8 eV ascribable to Ca2+ in a phosphate environment [38] with negligible changes upon metal introduction, indicating the structural preservation of the HAP matrix. Similarly, the P 2p peak (Figures S3e and S4e) at ~133.3–133.6 eV for all samples, confirmed that the phosphate framework remains intact after copper and iron introduction onto HAP [38,40].
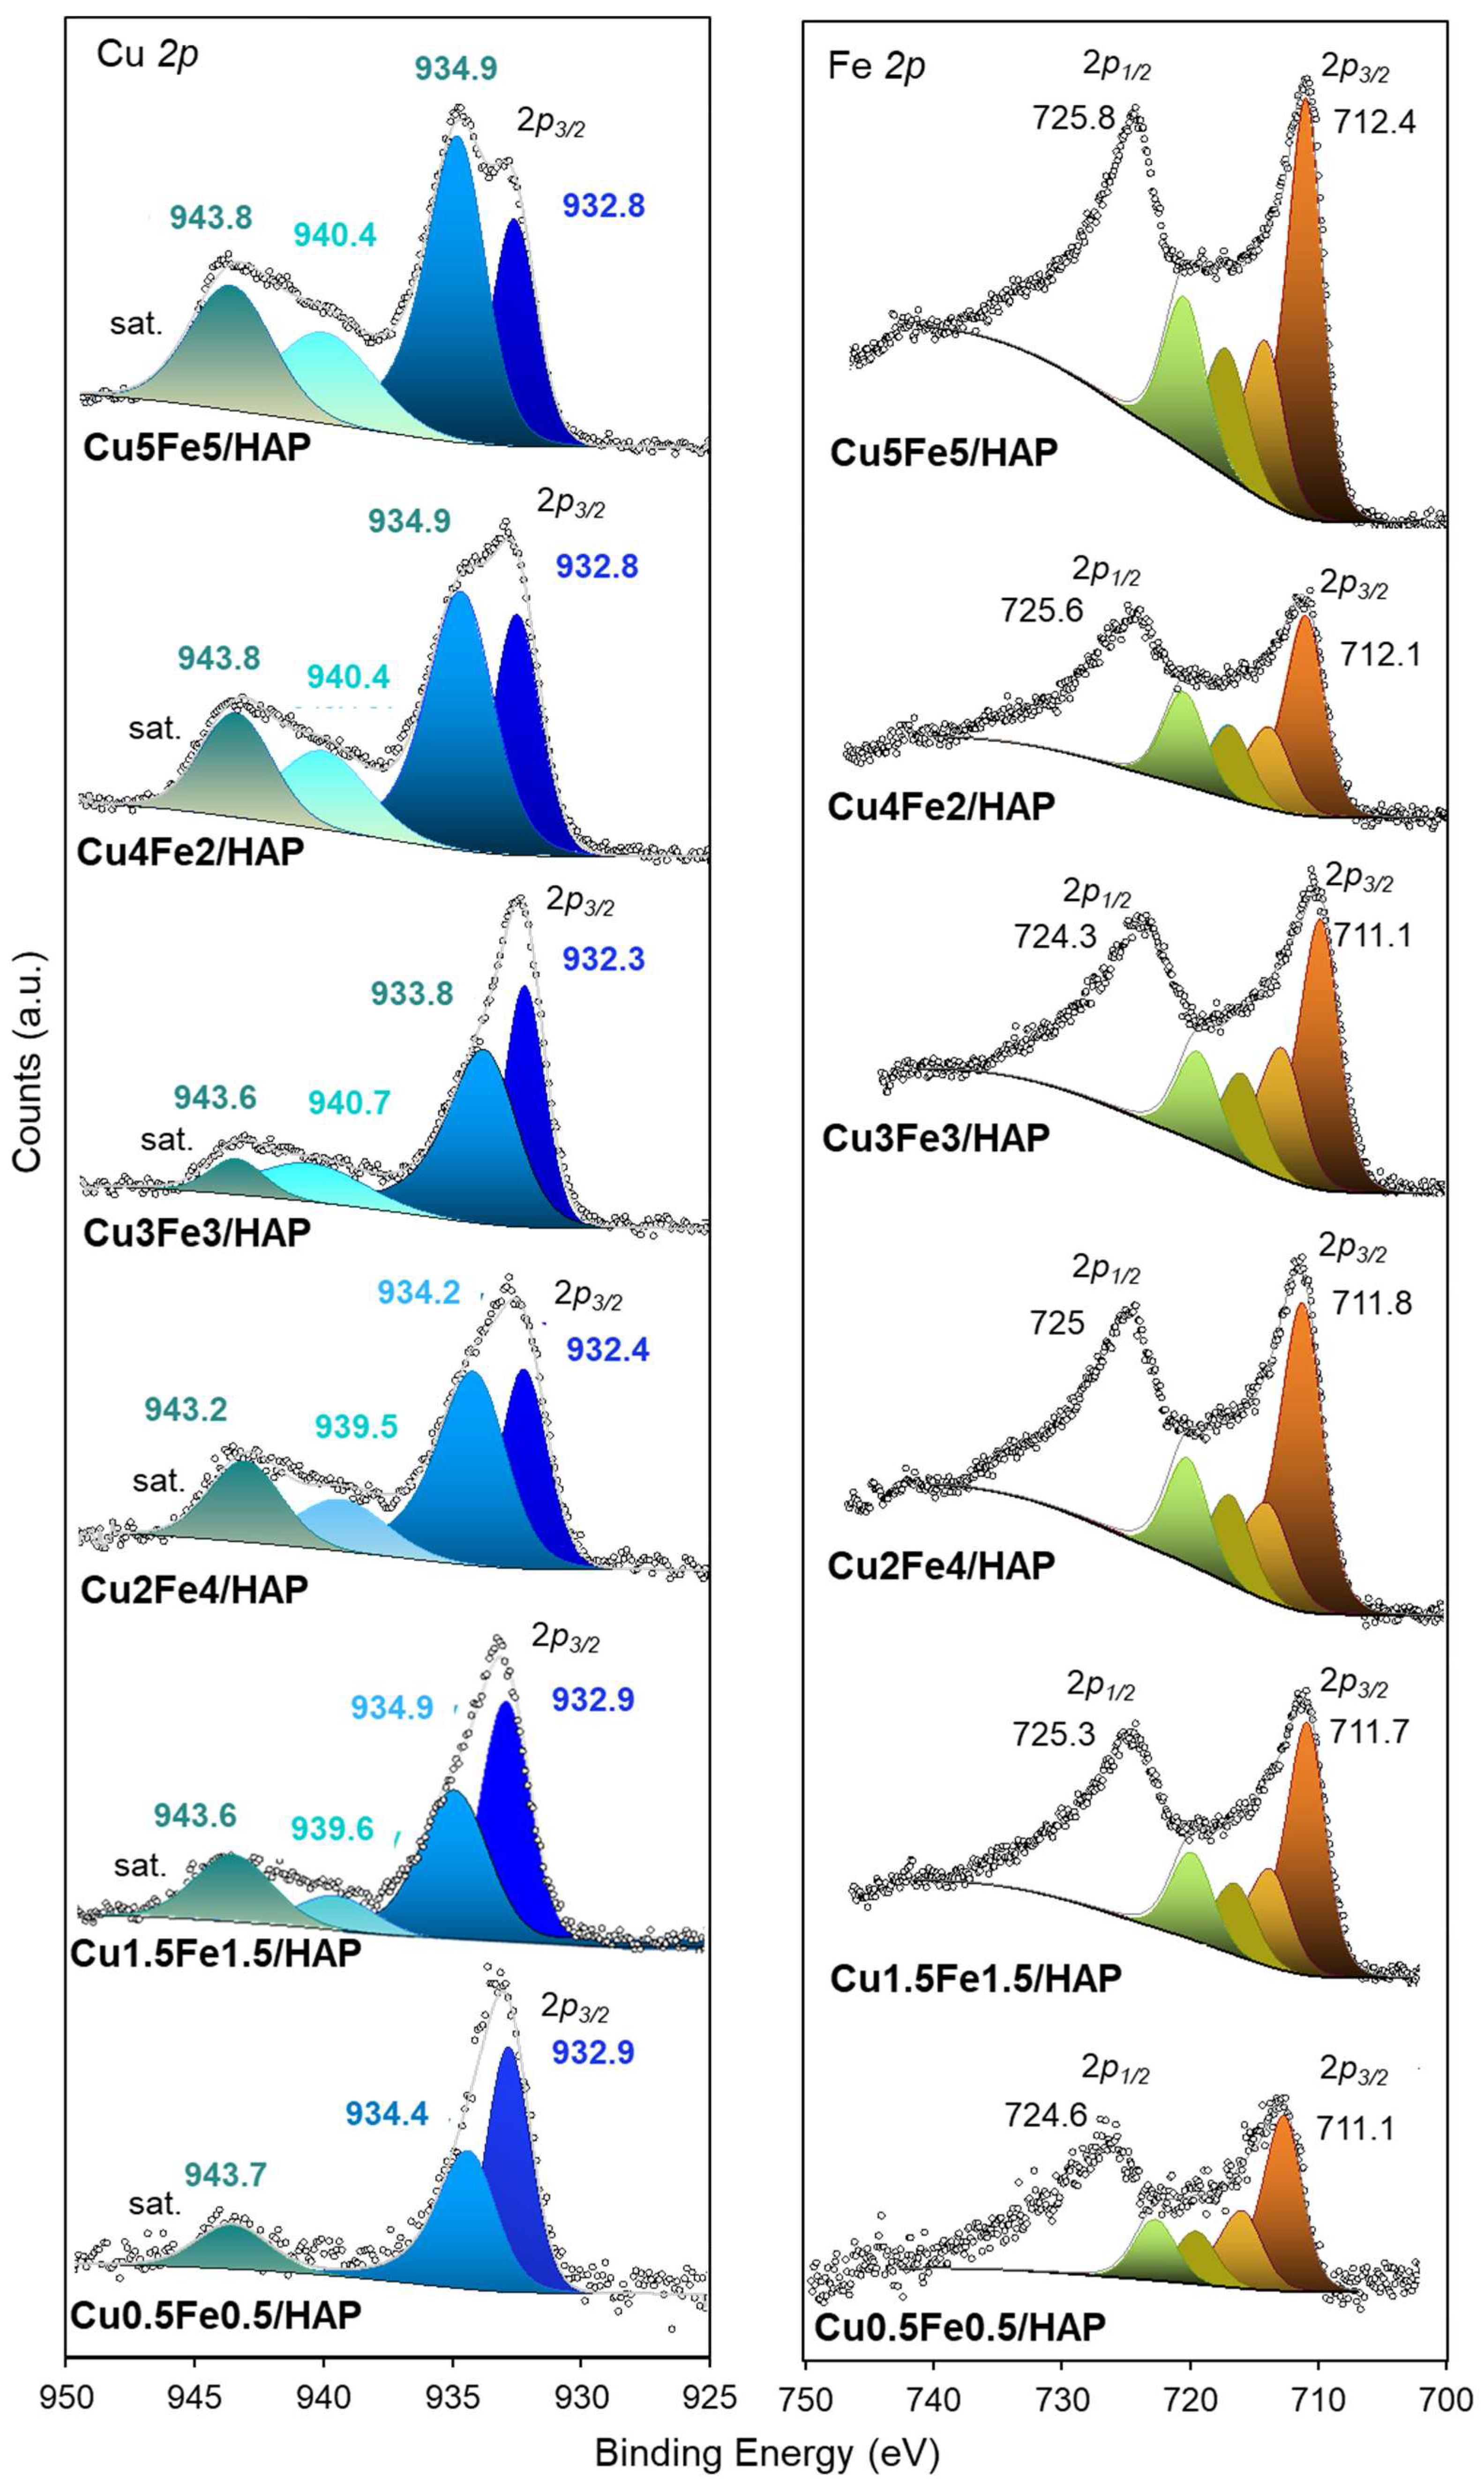
The Cu 2p HR spectra (Figure 4) clearly show the typical Cu 2p3/2 (930–935 eV) and Cu 2p1/2 (950–960 eV) photo-peaks. The possible presence of both Cu+ and Cu2+ species may be deduced from the deconvolution of the Cu 2p3/2 signal, which consists of two peaks at 932–933 eV and 934–935 eV. The former is usually assigned to Cu+ species, while the latter is to Cu2+ ions. These peaks are accompanied by distinct shake-up satellites of Cu2+ at binding energies of approximately 940 and 944 eV. Although the presence of Cu+ species is often reported in the literature for apatitic materials originally doped with Cu2+ [41,42], its origin remains unclear. According to Guo et al. [42], the signal at ca. 932.7 eV could be ascribed to Cu2+ sites in the HAP lattice, which exhibit a higher electron cloud density compared to surface Cu2+ hydrates and CuO [17,24].
Interestingly, this contribution of Cu2+ in lattice sites gradually decreased, while the contribution of Cu2+ in CuO (934–935 eV) increased with higher copper loading. This suggests partial structuring of copper into CuO nanoaggregates as the copper loading increases.
The Fe 2p HR spectra (Figure 4) showed broad 2p3/2 peaks at ~711.1–712.4 eV and 2p1/2 components at ~724.6–728.5 eV, with spin–orbit splitting (ΔE) was found to be around 13–14 eV, consistent with the presence of Fe3+ species [43,44].
Although the signal complexity precluded precise deconvolution, the data support the presence of Fe3+ as dispersed species or small FexOy clusters. This observation appears to confirm what was previously deduced from the study of monometallic iron hydroxyapatite catalysts (with 2–13 wt.% Fe): Mössbauer investigations revealed the co-presence of amorphous Fex(III)Oy nanoclusters (2–4 nm in size) along with paramagnetic Fe3+ species located either in interstitial positions or substituting Ca2+ ions at crystallographic sites within the HAP lattice [18,20,45].
In addition, minor shifts in Fe 2p peaks across the series suggest subtle variations in surface coordination or distribution related to Cu/Fe ratio. Overall, the XPS results confirm the presence of Cu2+ and Fe3+ on the surface of HAP, with no evidence of metallic species. Oxidation states and local environments remain stable across the composition range, although minor chemical shifts reflect evolving metal–support interactions and aggregation state [17].
The different copper and iron aggregation as a function of metal loading could influence the metal dispersion and the surface acidity in terms of Lewis acid sites associable to metal cations on the surface, both of which are expected to play pivotal roles in the SCR reaction. To probe the acidity of the catalysts, NH3 titration measurements were conducted on the copper–iron HAP samples (Table S2).
The results revealed a steady increase in ammonia adsorption with rising total metal loading, reaching a maximum at 6 wt.% (as observed for Cu3Fe3/HAP and Cu2Fe4/HAP, which exhibited NH3 uptakes of ~250 mequiv·g1). Interestingly, Cu4Fe2/HAP deviated from this trend, displaying a lower NH3 adsorption capacity (196 mequiv·g1), comparable to that of the lower-loaded Cu1.5Fe1.5/HAP. This decline suggests that starting from 4 wt.% loading, copper tends to form more aggregated rather than well-dispersed species, which in turn reduces the number of exposed acid sites and consequently lowers the NH3 adsorption capacity.

2.2. Reactivity in NH3-SCR Reaction

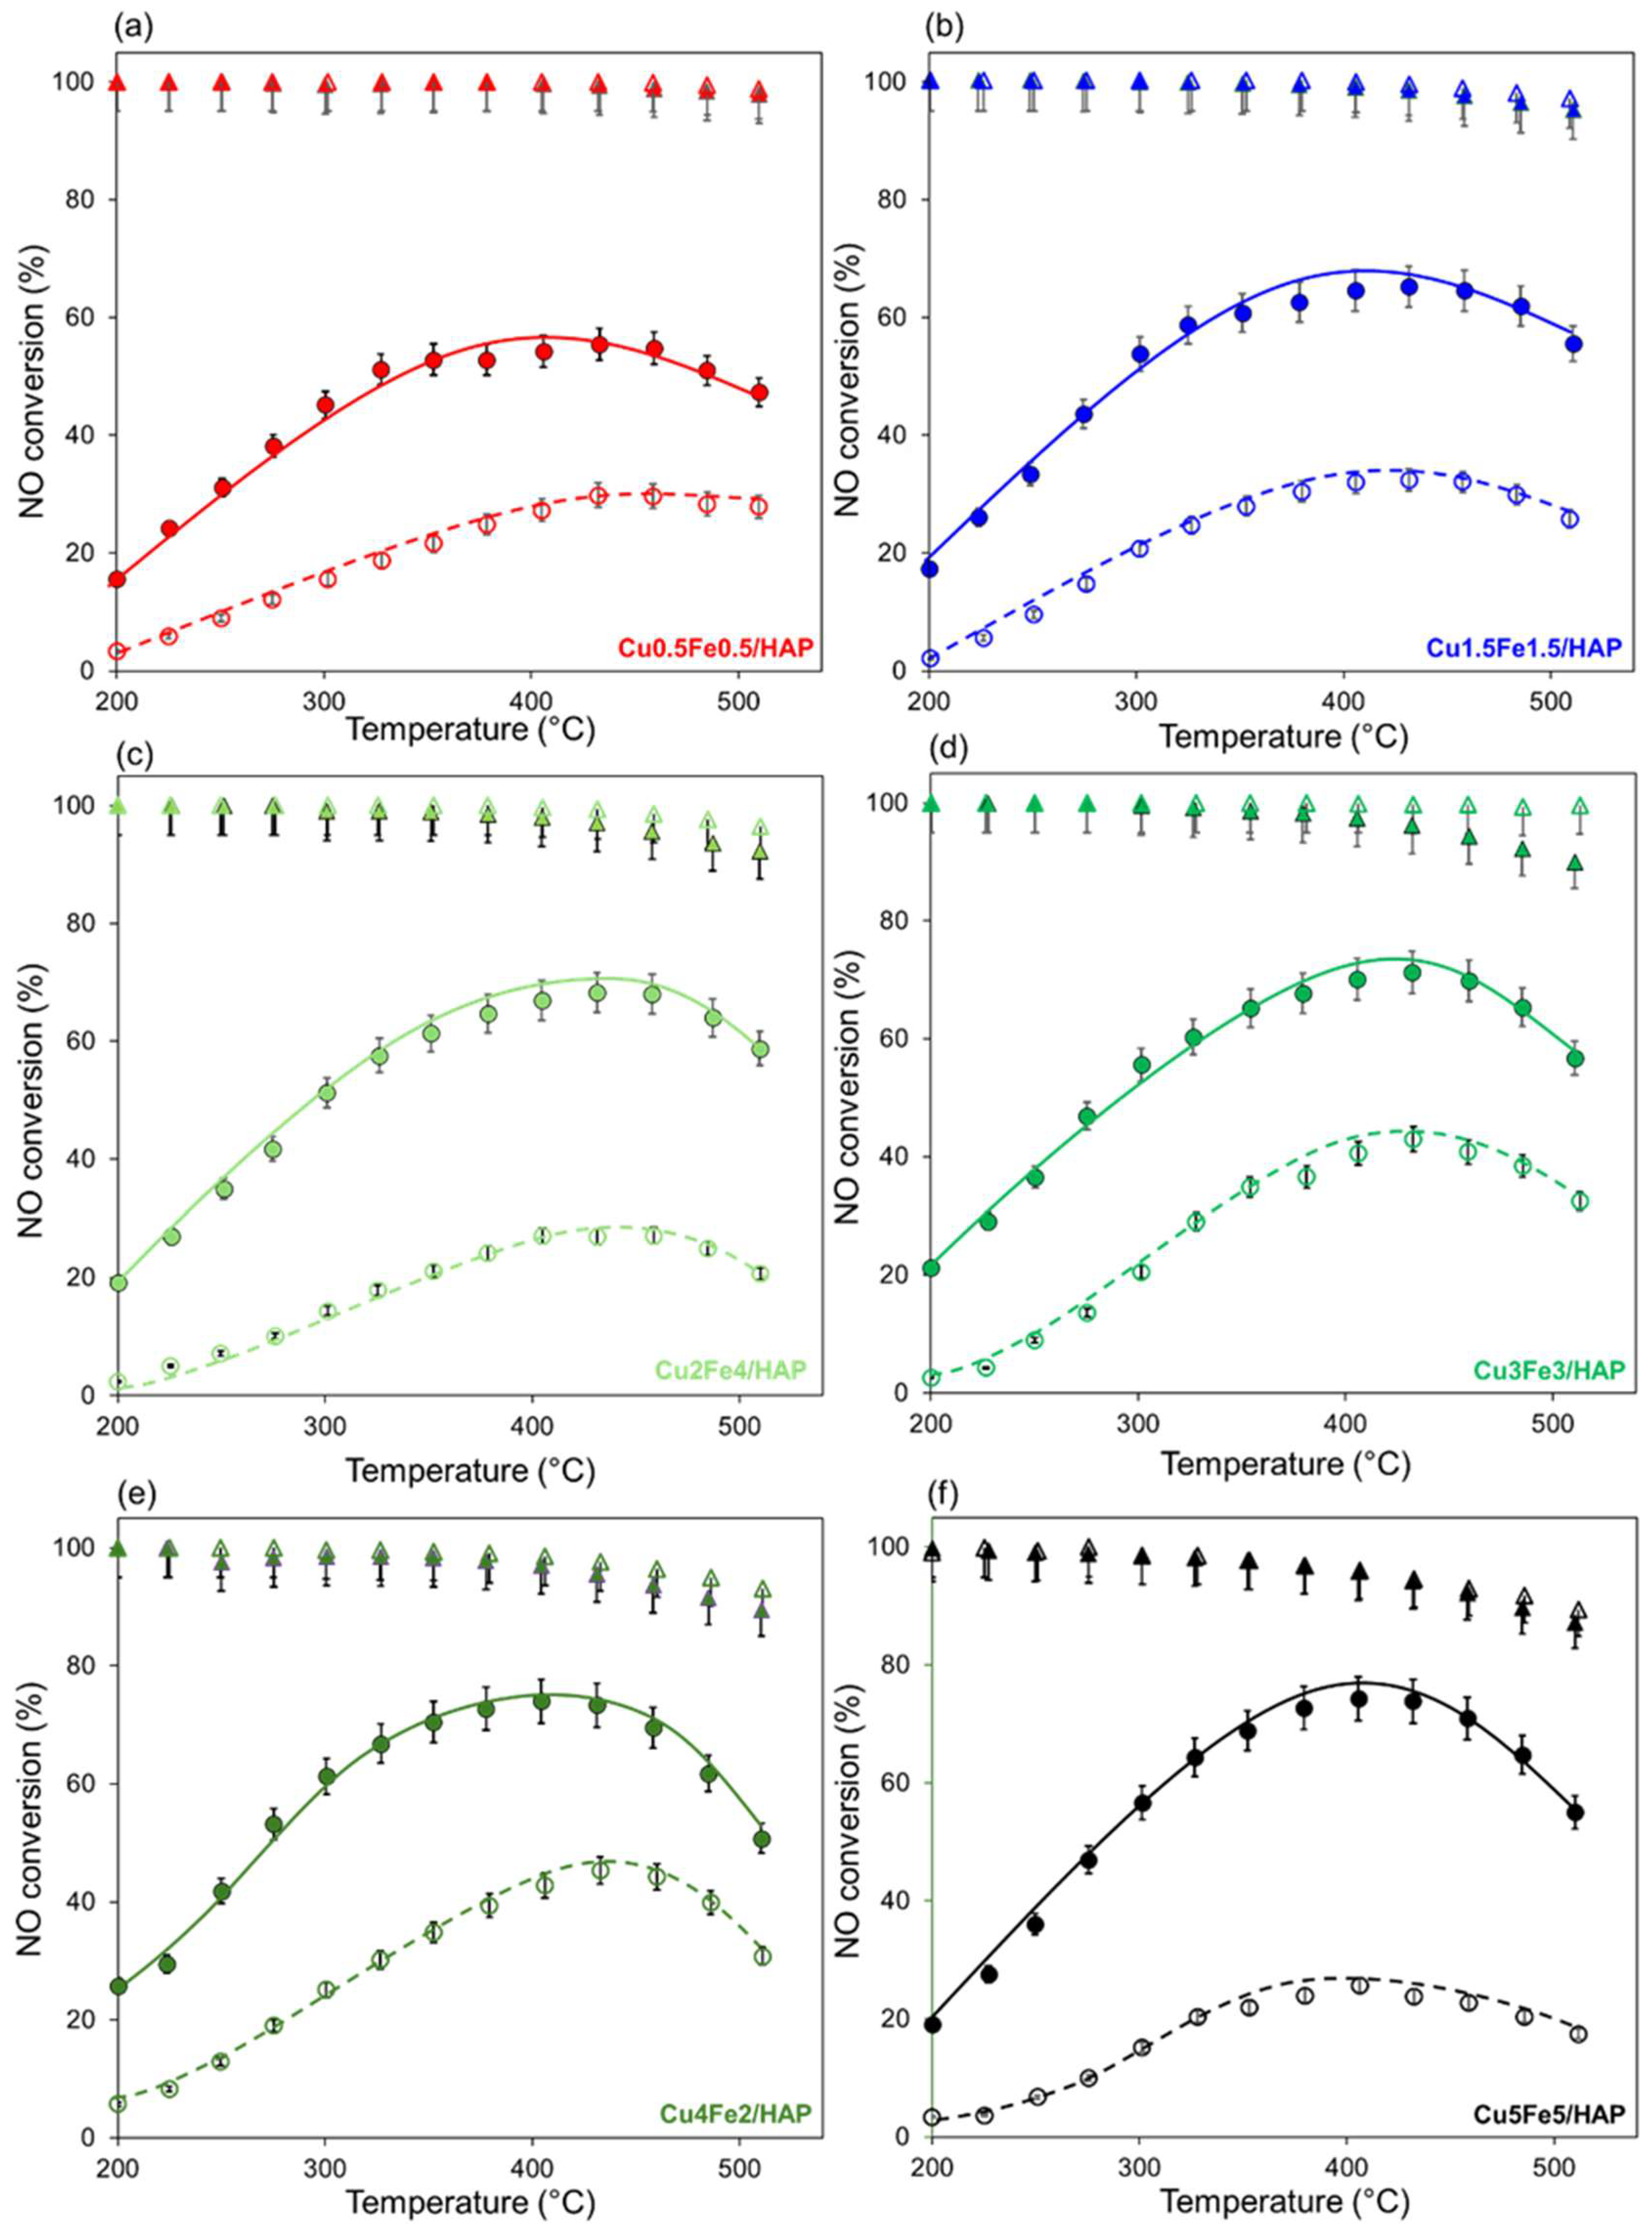
The catalytic performance of the copper–iron HAP samples was evaluated in the NH3-SCR reaction at a fixed GHSV of 120,000 h1 under both dry and wet conditions, in the 200–500 °C temperature range. The bare HAP, although characterized by pronounced amphoteric properties, lacks redox-active sites and thus exhibits poor SCR performance, with NOx conversion remaining below 15% under the investigated conditions (Figure S6). In contrast, metal modification introduces accessible redox centers that markedly enhance catalytic activity. Figure 5 reports the obtained profiles of NO conversion and selectivity to N2 along with temperature. Under dry conditions (Figure 5, full symbols), NO conversion started at 200 °C and regularly increased up to ca. 325 °C on all catalysts. The maximum NO conversion achieved (70–80%) was maintained up to ca. 450 °C, and at higher temperatures, only a very slight decrease was observed. In contrast, ammonia conversion increased continuously and almost linearly with temperature (Figure S6a). However, above 400 °C, a noticeable change in the slope of the ammonia conversion curve indicates a shift in reaction behavior. Above this temperature, the parallel undesired unselective NH3 oxidation by O2 (to N2O and NO species) likely occurs, as also evidenced by the slight decrease in selectivity to N2 at the highest temperatures.
Considering that water vapor is an unavoidable component in flue gas denitration processes, it was of interest to investigate its impact on the catalytic performance. Overall, water plays an inhibitory effect, which can be attributed to reversible competitive adsorption with ammonia and, in some cases, to irreversible catalyst deactivation [46,47].
The introduction of water into the feed gas mixture led to a lower SCR activity for the bimetallic samples compared to dry conditions across all temperatures (Figure 5), without affecting the overall NO conversion trend with temperature. The presence of 5% H2O typically reduced the maximum NO conversion by about 20–30% depending on the sample (for instance, from ~70% to ~50 % for Cu3Fe3/HAP) yet without altering the characteristic bell-shaped profile of the NO conversion curve (Figure 5, open symbols).
Considering the well-established hydrothermal stability of HAP and its ability to retain structural integrity even after exposure to high-temperature water vapor, the observed decrease in NH3-SCR activity could be attributed to a reduction in the number of acid sites available for the interaction with NH3—a fundamental step at the onset of the reaction. The decrease in activity may also be attributed to competitive adsorption between water and ammonia on the acid sites. This was confirmed by the observation that NH3 conversion remained incomplete even at the highest temperature investigated, reaching a maximum of only about 70–75% in the presence of water vapor (Figure S6b). Conversely, the presence of water vapor in the gaseous feed did not affect the selectivity to N2, which consistently remained above 90% and was slightly higher than that observed under dry conditions (Figure 5).
Increasing the total metal loading of the copper–iron HAP catalysts did not result in clearly improving SCR activity.
Eventually, if the normalized SCR activity per mole of total metal species (i.e., expressed as mmolNO∙mol(Cu+Fe)−1∙s−1) was computed, the following activity ranking was obtained: Cu0.5Fe0.5/HAP (â = 4.2) > Cu1.5Fe1.5/HAP (â = 1.7) > Cu3Fe3/HAP (â = 1.0) > Cu5Fe5/HAP (â = 0.5). The trend suggests a key role of metal dispersion, as will be discussed below.
Time-on-stream stability under definite conditions (i.e., reagent concentrations, reaction temperature, and space velocity) and reusability tests were performed on the Cu3Fe3/HAP sample, selected among the other bimetallic samples for its superior catalytic performances under wet conditions.
Time-on-stream stability tests were carried out at 400 °C, continuously monitoring NO conversion up to 72 h (Figure S7). NO conversion profiles maintained satisfactory values over the entire time interval under both dry and wet conditions. A close inspection of the values monitored indicated that just a slight percentage decrease was observed in the presence of water. This positive catalyst response under wet conditions is promising for achieving durable SCR performance under experimental conditions approaching those used in practice.
Catalyst reusability was evaluated by collecting four consecutive runs within the 200–500 °C temperature range with and without water. Figure S8 illustrates the results in terms of NO conversion and selectivity to N2 measured at the temperature range where the catalyst showed maximum activity. Interestingly, the NO conversion values across the four runs remained relatively constant, fluctuating within a narrow range of approximately ± 5%. This consistency was observed regardless of the presence or absence of water vapor. The stability of conversion values, combined with >90 % N2 selectivity throughout, indicates that the active sites are robust against both thermal cycling and repeated water exposure.

3. Discussion

In the NH3-SCR reaction, the catalytic performance of copper–iron HAP catalysts arises from a delicate interplay among metal dispersion, chemical speciation, and active-site accessibility, all strongly influenced by the metal loading.
Scheme 1 depicts the evolving distribution and interplay of Cu and Fe species as the total metal loading increases. At low loadings (1–3 wt.%), Cu and Fe are highly dispersed on the HAP surface. In fact, DR-UV spectra (Figure 3) display sharp bands assigned to isolated Cu2+ or Cu–O–Cu species, whose ionic nature is confirmed by XPS (Figure 4). In contrast, a modest aggregation of Fe3+ as small FexOy clusters appears even at low loading. Anyway, TEM-EDX mapping on Cu3Fe3/HAP (Figure 2) shows a uniform, equimolar distribution of Cu and Fe, with no detectable aggregates. High-resolution TEM images reveal a thin non-apatitic surface layer, likely acting as a preferential anchoring zone for both metals. This feature correlates with the drop in Ca/P ratios and surface Cu- and Fe-enrichment detected by XPS (Table 1). In this configuration, both metals remain highly accessible and contribute to coordinate and activate NH3.
When the total metal loading increases (≥ 6 wt.%), the scenario changes: the DR-UV spectra (Figure 3) exhibit broadened bands shifted to lower energies, indicating the formation of CuxOy clusters and larger FexOy domains. XPS (Figure 4) reveals stronger Cu2+ shake-up satellites and broader Fe 2p peaks, clear signs of reduced dispersion and increased structural disorder. In Scheme 1, this is depicted as the growth of larger and more segregated oxide domains, reducing the number of accessible active sites.
These structural changes align with the catalytic results previously presented (Figure 5). Normalized activity drops sharply with higher loadings, from 4.2 mmolNO·mol(Cu+Fe)1·s1 for Cu0.5Fe0.5/HAP to just 0.5 in Cu5Fe5/HAP. This demonstrates that, despite the higher metal content, no corresponding increase in activity is observed, as the greater aggregation is likely to limit the catalytic performance.
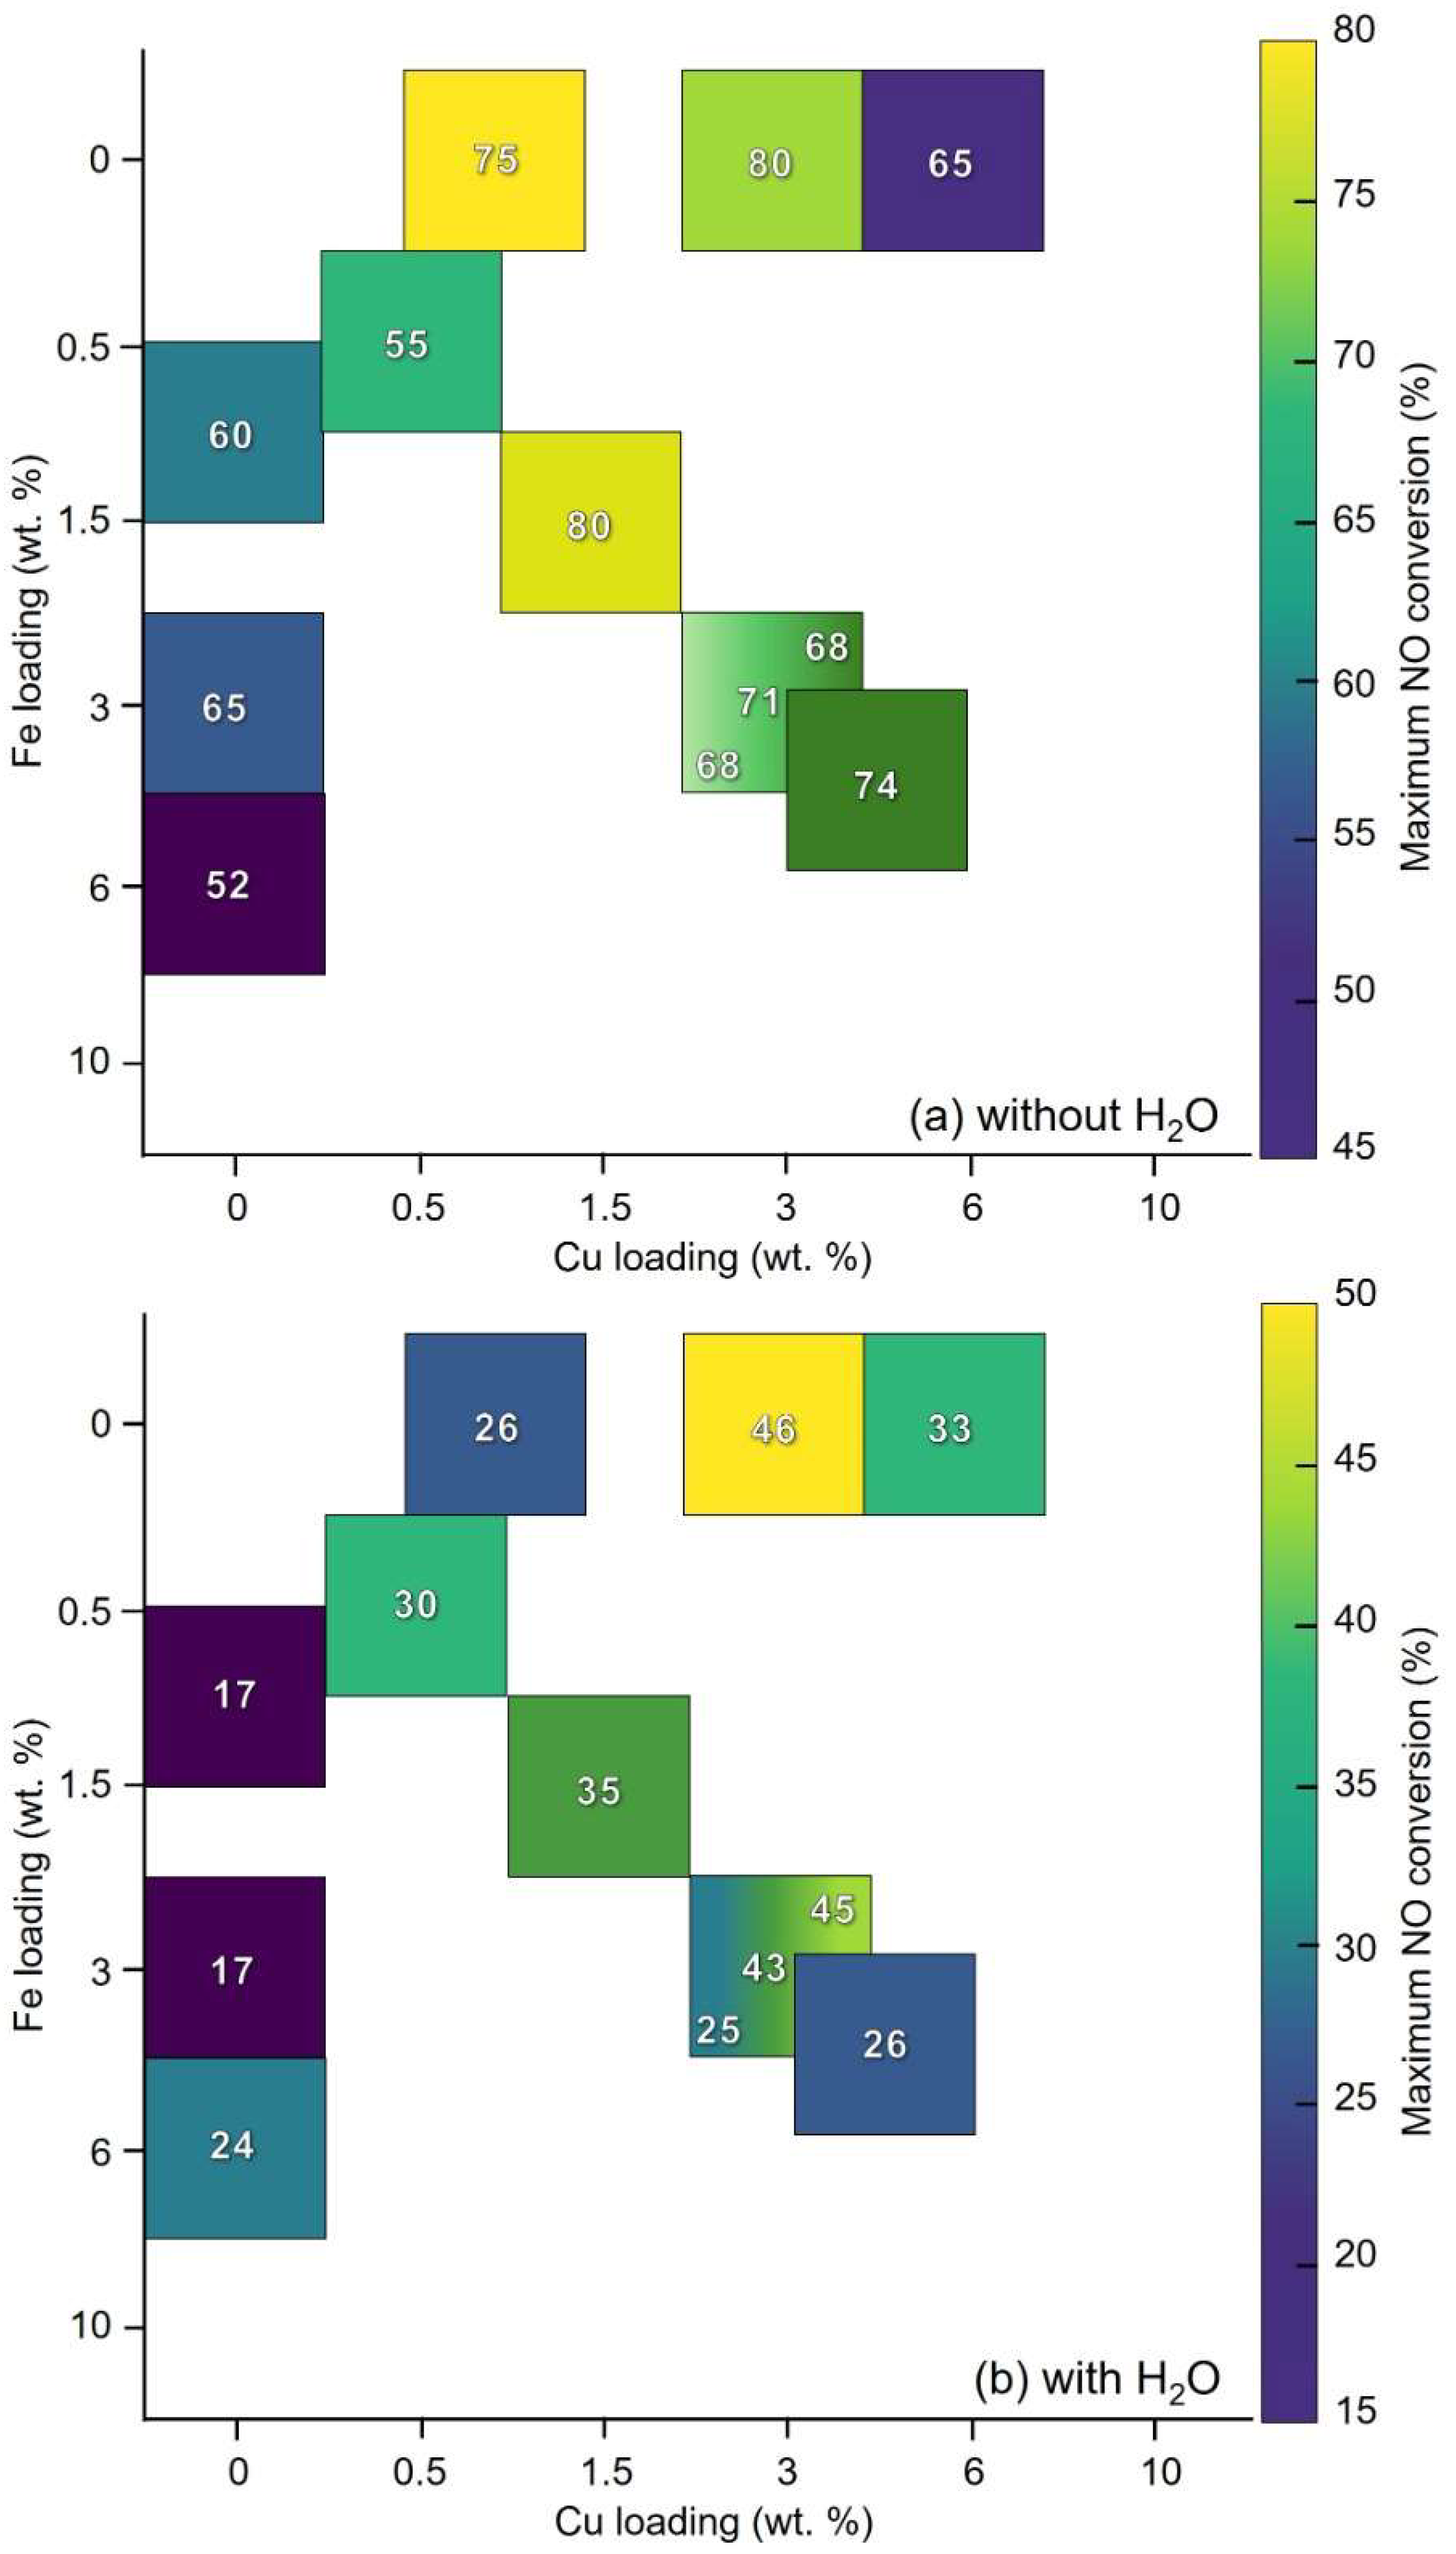
Figure 6 compares the influence of copper and iron loadings on catalytic performance, presenting maximum NO conversion as a function of each metal’s loading considered independently.
Concerning Cu loading, under dry conditions, Figure 6a shows that a concentration as low as 0.5 wt.% (Cu0.5Fe0.5/HAP) is sufficient to achieve good SCR activity. Increasing Cu content leads to a clear rise in NO conversion up to intermediate loadings (1.5–2 wt.%). Beyond this range, performance tends to stabilize, and further increasing the loading to 5 wt.% does not yield proportional gains. This suggests that at low loadings the amount of isolated Cu sites is the limiting factor, while at intermediate loadings the good dispersion allows for optimal performance. At higher loadings, excess metal likely promotes aggregation, which no longer increases the NO conversion.
The Fe-related contribution corresponds to that observed in the case of copper: a marked improvement occurs from very low to medium loadings, while at higher loadings the conversion data fluctuates. These fluctuations could also be influenced by changes in Cu content across the series. Variations in Cu loading could indirectly shape the Fe-related profile.
In Figure 6b, the presence of water vapor reduces the measured NO conversion. This inhibition is most pronounced for low-loading samples: when Cu and Fe contents are low as loading increases, the deactivating effect of water diminishes, with medium- to high-loading catalysts showing smaller relative decreases under wet conditions. An optimal composition is observed at a total metal content of ~6 wt.% with a Cu:Fe molar ratio of 1:1 or 2:1 (Cu3Fe3/HAP and Cu4Fe2/HAP). These catalysts combine high activity with superior water resistance, maintaining NO conversion in the 40–50% range under wet conditions, compared to ~30–35% for both lower and higher loadings. Water likely competes with NH3 and/or NO for coordination sites, hydrolyzes metal centers, or promotes the formation of less active hydroxylated species. Highly dispersed sites, typically more active, are also more susceptible to these effects, whereas clusters and aggregates are less sensitive but exhibit lower intrinsic activity per mole of metal.
A comparative view with monometallic Cu and Fe counterparts is essential to contextualize the performance of the bimetallic catalysts and to clarify the origin of their behavior. Some selected monometallic samples with comparable metal loading of the bimetallic ones have been prepared and studied (Figures S9–S13, Table S3). Under dry conditions (Figure 6a), CuFe/HAP catalysts show no measurable advantage over monometallic Cu/HAP with similar Cu loading. This indicates that, under these conditions, the achievable NO conversion is already dictated by the amount and aggregation state of Cu, and that adding Fe does not introduce an additional, performance-enhancing function. If Fe sites were contributing significantly, the bimetallic catalysts would outperform their Cu-only counterparts at equivalent Cu contents, which is not observed. The decisive factor, for both mono- and bimetallic catalysts, is the aggregation state of the active phase: at low-to-intermediate loadings, isolated Cu centers sustain high conversion, while at higher loadings the progressive aggregation of Cu species limits further gains. In contrast, bimetallic samples are consistently more active than monometallic Fe/HAP under dry feed, simply because they contain Cu, which provides the dominant SCR functionality.
The benefit of the bimetallic formulation emerges clearly under wet conditions: while monometallic catalysts, particularly Cu/HAP, experience pronounced drops in NO conversion (often losing more than half their dry-feed performance), CuFe/HAP retain a much larger fraction of activity. For instance, at equivalent total loadings, Cu3Fe3/HAP and Cu4Fe2/HAP maintain NO conversion in the 40–45% range with water vapor present, compared to ~20–40% for their monometallic Cu/HAP and Fe/HAP analogues.
A plausible explanation for the superior water resistance of the bimetallic catalysts in comparison with the monometallic counterparts can be given considering the competition between NH3 and H2O for adsorption on the metal centers. Both Cu2+ and Fe3+ act as Lewis acid sites and are therefore prone to interactions with either NH3 or H2O molecules. In monometallic Cu/HAP, the strong affinity of Cu2+ for water can lead to preferential H2O adsorption, reducing the availability of sites for NH3 activation and consequently depressing the SCR activity under wet conditions. By contrast, in the bimetallic systems, the coexistence of Cu2+ and Fe3+ sites results in a broader distribution of adsorption centers, which mitigates the competitive inhibition of NH3 uptake with water.
In particular, Cu3Fe3/HAP and Cu2Fe4/HAP expose the highest number of accessible acid centers (Table S2) capable of interacting with both NH3 and H2O, thereby buffering the negative impact of water vapor and sustaining higher levels of NO conversion. This synergistic effect suggests that the presence of Fe3+ sites helps preserve a fraction of Cu2+ sites for effective NH3 activation even under competitive adsorption conditions.
Definitively, combining structural characterization with catalytic results reveals that the overall reactivity of CuFe/HAP catalysts is governed primarily by the individual properties of Cu and Fe species. This is likely due to the spatial distribution of Cu and Fe, which limits direct contact between the two phases and thereby hinders electronic interactions and minimizes synergic effects.

4. Materials and Methods

4.1. Materials

Hydroxyapatite powder (HAP, AV15012 lot) was kindly furnished from Solvay Company, Belgium (Soda Ash & Derivatives Department) (Brussels, Belgium). Copper(II) nitrate trihydrate (Cu(NO3)2·3H2O, 99%), iron(III)nitrate nonahydrate (Fe(NO3)3·9H2O, 99%) were from Sigma Aldrich (St. Louis, MO, USA). Milli-Q water was obtained by Milli-Q® ultra-pure water system from Merck Millipore (Burlington, MA, USA).
For characterization analyses certified reference material (10 components, 100 mg·L−1 each of Ca, Sr, Fe, Cu, Pb, Cd, Ni, Co, Cr, Sn in HNO3 5%) was from Areachem (instrument & consumable, Naples, Italy), nitric acid (HNO3, 65%) was supplied from Carlo Erba (Milan, Italy), ethanol and 2-propanol were from Sigma Aldrich (St. Louis, MO, USA), and barium sulfate (BaSO4, extrapure reagent) was from Nacalai Tesque (Kyoto, Japan).
Pure gases (99.9995% nitrogen) and gaseous mixtures (1.02 % ammonia in nitrogen, and 1.00% nitrogen oxide in nitrogen), prepared according to ISO 6142 and ISO 6143, were furnished from Sapio (Monza, Italy).

4.2. Hydroxyapatite Modification

Hydroxyapatite powder was produced from sediments by the Novosol® process, a patented chemical-thermal procedure designed for the treatment of polluted sediments. In the first step, polluted sediments are mixed with phosphoric acid (2–3.5%) in a tubular reactor. In the presence of calcite, the addition of phosphoric acid promotes the formation of hydroxyapatite. In the second step, the material is calcined to degrade organic contaminants, such as polycyclic aromatic hydrocarbons, dioxins, and pesticides). Through this process, the polluted sediment becomes inert hydroxyapatite that can be re-used as a support [48]. EDS analysis confirmed that the material contains only minor impurities (Mg, Al, and Si), with a total content below 1 wt.%.
Copper–iron HAP samples with different total metal content (1 < wt.% Cu+Fe < 10) were prepared from metal nitrate precursors by a post-synthesis deposition method (Figure S9).
For each preparation, a clear solution containing a mixture of both salts (125 mL of 0.007 < [Cu2+]/M < 0.04 solution and 125 mL of 0.007 < [Fe3+]/M < 0.04) at spontaneous pH (about 5–6) was thermostated at 40 °C. HAP powder (6 g, previously dried at 120 °C, overnight) was added to the solution. The resulting suspension was maintained under vigorous magnetic stirring (250 rpm) for 48 h. The obtained samples were then filtered, thoroughly washed with Milli-Q water (at ca. 40 °C), dried at 120 °C overnight, and eventually calcined at 500 °C for 1 h under dynamic air flow (100 mL·min−1) at a controlled heating rate (1 °C·min−1). The resulting samples were labeled as CuXFeY/HAP, where X and Y indicate the nominal Cu- and Fe-loadings (in wt.%), respectively. Copper- or iron-HAP samples were prepared analogously, using the same metal moles (Cu or Fe) per gram of material as in the corresponding bimetallic samples (Figure S9). These were labeled as CuX/HAP and FeY/HAP, where X and Y indicate the nominal Cu- or Fe-loadings (in wt.%), respectively. The copper and/or iron content of each sample was determined by Inductively Coupled Plasma Optical Emission Spectroscopy (ICP-OES) analyses on digested solids (about 50 mg sample treated with concentrated HNO3 at 250 °C for 15 min) using an «Activa», Jobin Yvon ICP-OES instrument (HORIBA, Kyoto, Japan).

4.3. Material Characterization

Surface area, pore volume, and pore size distribution of copper–iron HAP samples were determined by N2 adsorption/desorption isotherms collected at −196 °C using a Micromeritics TriStar 3000 instrument (Norcross, GA, USA). In a typical analysis, about 0.2 g sample (previously sieved to obtain particles in the 75–180 µm range) was outgassed at 350 °C for 4 h under vacuum. Surface area values were determined using the BET (Brunauer, Emmet, Teller) equation (2-parameters), considering a cross-sectional area for N2 of 16.2 Å/molecule, whereas pore volume and pore size distribution were evaluated by BJH (Barret, Joyner, Halenda) method from the desorption isotherm branch (0.30 < p/p0 < 0.95).
Crystal structure and phase composition of samples were determined by X-Ray Diffraction (XRD) using a Bruker (Billerica, MA, USA) D8 diffractometer (Cu Kα radiation at 0.154184 nm) equipped with a Ni filter and 1-D multistrip detector (LynxEye, 192 channels on 2.95°). Diffractograms were collected in the 5°–65° (2θ) range, with a step size of 0.02° 2θ, a time per step of 96 s, and a total acquisition time between 0.5 and 2 h. Electronic discrimination (fluorescence conditions) in the 0.18–0.25 V interval was applied for Fe-containing samples. Before analysis, the powders were finely ground and spread on an aluminum flat-plate horizontal sample holder. The patterns were identified by comparison with JCPDS files from International Center for Powder Diffraction Data.
High resolution images by Transmission Electron Microscopy of the bare HAP calcined at 500 °C for 1 h at controlled rate (1 °C·min−1) under dynamic air flow (100 mL·min−1) were collected by means of a Talos L120C TEM Thermo Fisher (Waltham, MA, USA) operating at 120 KV. For sample preparation, ca. 5–7 mg powder was crushed, dispersed in 1 mL 2-propanol, and the suspension was sonicated for 15 min. Then, it was further mixed in a Vortex mixer for 10 s and 0.01 mL suspension was diluted in 1 mL. This latter was eventually dropped on a TEM grid (Cu 300 FC) and dried at room temperature overnight.
High-resolution images of the selected Cu3Fe3/HAP sample were obtained by Transmission Electron Microscopy (TEM) using a FEI TITAN ETEM G2 microscope (Thermo Fisher Scientific, Waltham, MA, USA) operating at 300 KV and equipped with an objective Cs aberration corrector. In parallel, an energy-dispersive X-ray (EDX) analyzer (SDD X-Max 80 mm2 from Oxford InstrumentsTM, Abingdon, UK) was used to acquire the EDX spectra. The sample in powder was crushed and sonicated in ethanol, dropped onto a TEM grid, and dried under a lamp. To avoid contamination during analysis and to remove any residual carbon, the samples were Ar-O2 plasma-cleaned for 20 s.
Diffuse Reflectance UV-vis (DR-UV) spectra of samples were collected at room temperature over the 200−2600 nm range using a double beam UV–vis–NIR scanning spectrophotometer (Shimadzu UV-3600 plus, Kyoto, Japan), equipped with an integrating sphere (from BIS-603) as diffuse reflectance accessory. Samples in powder were finely ground, uniformly pressed into a circular disk (internal diameter of ca. 4 cm) and placed in the sample holder. The latter was then inserted into a quartz cuvette and positioned at the window of the integrating sphere for reflectance measurements. Barium sulfate served as the reference material. For an unambiguous assignment of specific signals, DR-UV spectra of the catalysts were also recorded in the 300–800 nm region using HAP support as background instead of barium sulfate.
Surface composition of the samples was studied by X-ray Photoelectron Spectroscopy (XPS) using a ThermoFisher ESCALAB 250 Xi electron spectrometer (Thermo Fisher Scientific, Waltham, MA, USA) equipped with an Al (Kα) excitation source ( = 1486.6 eV). Survey spectra were collected over the 0–1200 eV range with a “dwell time” of 100 ms. High-resolution (HR) spectra were acquired using a “pass energy” of 40 eV (with an energy step of 0.1 eV). Charge neutralization was achieved using a low-energy electron beam. In any case, the resulting binding energy values (BE) were corrected by referencing the C 1s peak (C-C) to 284.6 eV.
Surface acidity studies were conducted via gas–solid titration by NH3 under flow adsorption experiments. They were performed using a laboratory-adsorption line. Sample (about 0.20 g, pressed, crushed and sieved to obtain particles in the range 45–60 mesh) was put on a porous septum of a quartz reactor and pre-treated at 120 °C for 30 min under air flow (about 3 NL·h−1). Consequently, an NH3/N2 gas mixture (about 500 ppm) passed through the catalyst with a flow of about 6 NL·h−1; the gas vented by the reactor was continuously monitored by an online FT-IR spectrophotometer equipped with a heated gas cell (path length 2.4 m) at 190 °C. NH3 was completely adsorbed on the catalyst surface for a measured time and monitored at 966 cm−1 (typical IR-line frequency of NH3). Once the acid sites on the catalyst surface were saturated by NH3, the NH3-signal was restored at a level corresponding to its feeding concentration. By evaluation of the time during which the NH3-signal remained at zero value, the number of acid sites (in µmol·g−1) was evaluated thanks to the following equation (assuming a 1:1 stoichiometry for the NH3 adsorption on the surface acid site):
m o l e s N H 3 ( a d s ) g s a m p l e = [ N H 3 ] f e d · F · t · P R T · m s a m p l e
where [NH3]fed is the flowing NH3 concentration (in ppm); F is the total flow rate of the NH3/N2 gas mixture (in NL·h−1); t is the time during which NH3 was completely adsorbed (in min); P is the pressure (in atm); and msample is the sample mass (in g).

4.4. Reactivity Tests in NH3-SCR Reaction

The performance of samples studied in the NH3-SCR reaction was evaluated using a flow laboratory-reaction line equipped with a set of mass flow controllers (Brooks Instruments, Hatfield, PA, USA), a temperature-controlled furnace provided with a thermocouple for temperature monitoring, and a U-shaped tubular microreactor (internal diameter of about 6 mm, quartz). The tube lines were heated to prevent water condensation and precipitation of ammonium nitrates. An FT-IR spectrophotometer (ThermoScientific with DTGS detector, Waltham, MA, USA) together with an inline micro gas phase chromatograph (GC-R3000, SRA instrument, Cernusco sul Naviglio, Italy) were used for the qualitative and quantitative determination of the fed and vented gaseous species. For each experiment, about 50 mg catalyst (previously pressed, crushed and sieved to obtain particles in the 45–60 mesh range, corresponding to 250–335 µm, and dried at 120 °C overnight) was loaded into the reactor and pre-treated in situ under a helium flow (100 mL·min−1) at 200 °C for 30 min. The catalyst activity was studied along with temperature in the 200−500 °C interval, keeping the concentration of feeding gas mixture constant (400 ppm NO, 400 ppm NH3, 50,000 ppm O2 in He) at a total flow rate of 12 NL·h−1 (corresponding to a GHSV of 120,000 h−1). Each temperature was maintained for 60 min to reach steady-state conditions. The temperature was increased in steps at a ramp rate of 5 °C·min−1. Experiments in the presence of about 5% H2O (50,000 ppm) were also performed by introducing water vapor into the feed mixture through a thermostated saturator. After mixing, the effective fed mixture also contained NO2 (about 20 ppm). The gas mixture flowed through the catalyst particles at 200 °C until the catalyst surface was saturated with NH3. The NOx (NO, NO2), N2O, and NH3 species vented from the reactor were monitored by an inline FT-IR spectrophotometer equipped with a heated gas cell (2 m path length), whereas O2 and N2 were quantified by the µ-GC. The quantification of N2 was doubly checked by difference from the mass balance. The concentrations of each species were continuously recorded over time as the reaction temperature changed. Computational details can be found in the Supplementary Information (Table S4). Additional time-on-stream stability tests on a selected copper–iron HAP sample (Cu3Fe3/HAP) were also carried out at fixed temperature (400 °C) for 72 h.
All experiments were repeated at least three times to ensure reproducibility with a percent relative uncertainty of less than 5%. Error bars representing the standard deviation of the measurements are included in the figures where applicable.

5. Conclusions

In summary, this study investigated the co-deposition of copper and iron species into hydroxyapatite at varying loadings. At low metal content, Cu and Fe were immobilized either as isolated surface species or inserted into the hydroxyl channels of HAP, with the formation of oligomeric FeOx species and linear [O2–Cu2+–O2] oxocuprate units, as indicated by the characteristic bands in the DR-UV spectrum. However, at higher loading, incorporation into the channels was hindered, leading to the formation of CuxOy and FexOy nanoclusters, as evidenced by DR-UV and XPS signal and previous studies. XPS analyses also revealed an absence of electronic interaction between Cu and Fe species, regardless of loading, suggesting that the two metals were not sufficiently proximate on the surface to enable cooperative effects. These findings were confirmed by catalytic tests, which revealed that any significant synergy in the SCR reaction could not be observed on copper–iron HAP materials. In other words, the presence of Fe sites did not enhance the SCR activity of Cu sites, and vice versa.
Nevertheless, bimetallic catalysts exhibited improved water resistance compared to their single metal counterparts. Notably, Cu3Fe3/HAP combined competitive activity with good hydrothermal stability. While it cannot match the best conventional catalysts, its robustness under wet feed and the potential for low-cost, sustainable synthesis from mineral sources make HAP-based catalysts attractive for applications where moisture tolerance and economic feasibility are key.
In conclusion, these results offer a solid starting point for improving targeted deposition and surface engineering to approach state-of-the-art performance while preserving the intrinsic sustainability of HAP supports. Future work will be devoted to systematically exploring alternative modification strategies of hydroxyapatite with Cu and Fe, including sequential deposition, and other tailored approaches, to clarify how different strategies influence the sitting, aggregation states and interactions of the two metal phases.

Supplementary Materials

The following supporting information can be downloaded at https://www.mdpi.com/article/10.3390/catal15100929/s1. Figure S1. Characterization results of the bare HAP sample previously calcined at 500 °C for 1 h at the controlled rate (1 °C·min−1): (a) N2 adsorption/desorption isotherms at −196 °C; (b) XRD pattern; (c) TEM micrograph; (d) DR-UV spectrum. Figure S2. DR UV spectra of copper–iron HAP samples collected using HAP as background. Figure S3. XPS results for bare HAP sample: (a) survey spectrum; HR spectra of (b) C 1s; (c) O 1s; (d) Ca 2p; (e) P 2p. Figure S4. XPS results for the Cu3Fe3/HAP sample: (a) survey spectrum; HR spectra of (b) C 1s; (c) O 1s; (d) Ca 2p; (e) P 2p. Figure S5. NH3-SCR catalytic results over bare HAP: profiles of NO and NH3 conversion as a function of reaction temperature without water vapor. Reaction conditions: [NH3] = [NO] = 400 ppm, [O2] = 50,000 ppm, GHSV = 120,000 h−1. Figure S6. NH3-SCR catalytic results over copper–iron HAP samples: profiles of NH3 conversion as a function of reaction temperature without and with water vapor (a and b panels, respectively). Reaction conditions: [NH3] = [NO] = 400 ppm, [O2] = [H2O, if present] = 50,000 ppm (5%), GHSV = 120,000 h−1. Figure S7. NH3-SCR stability test results over Cu3Fe3/HAP: profiles of NO conversion as a function of time in the absence/presence of H2O (full and open symbols, respectively) in time-on-stream stability tests at fixed temperature (400 °C) for 72 h. Reaction conditions: T = 400 °C; [NH3] = [NO] = 400 ppm, [O2] = [H2O, if present] = 50,000 ppm (5%), GHSV = 120,000 h−1. Figure S8. Reusability tests on Cu3Fe3/HAP; NO conversion (bars) and selectivity to N2 (symbols + lines) values in the temperature interval of maximum activity in dry (a) and wet (b) conditions. Reaction conditions: [NH3] = [NO] = 400 ppm, [O2] = [H2O, if present] = 50,000 ppm (5%), GHSV = 120,000 h−1. Figure S9. Schematic representation of hydroxyapatite modification to obtain monometallic and bimetallic copper- and iron- HAP samples. Figure S10. (a) N2 adsorption/desorption isotherms collected at −196 °C and (b) XRD patterns of copper-HAP samples. Figure S11. (a) N2 adsorption/desorption isotherms collected at −196 °C and (b) XRD patterns of iron-HAP samples. Figure S12. DR UV spectra of (a) copper-HAP and (b) iron-HAP samples using BaSO4 as the background and detail of the 300–800 nm region for (c) copper- and (d) iron-HAP samples collected using HAP as the reference (instead of BaSO4). Figure S13. High Resolution (HR) XP spectra of (a) the Cu 2p region of copper-HAP samples and (b) the Fe 2p region of iron-HAP samples. Table S1. Pore volume and mean radius of copper–iron HAP samples compared to the unmodified HAP. Table S2. Results of gas–solid acid-base titration by NH3 on bimetallic and monometallic samples. Table S3. Bulk–surface properties of copper- or iron- HAP samples. Table S4. Symbols and calculations for computing catalytic parameters.

Author Contributions

Conceptualization, S.C., A.G.-F. and A.G.; methodology, S.C., A.G.-F. and A.G.; validation, S.C., A.G.-F. and A.G.; formal analysis, M.G.G., W.Z., S.C.; investigation, M.G.G. and W.Z.; resources, A.G. and A.G.-F.; data curation, M.G.G. and S.C.; writing—original draft preparation, M.G.G.; writing—review and editing, S.C. and A.G.; visualization, M.G.G.; supervision, S.C. All authors have read and agreed to the published version of the manuscript.

Funding

This research received no external funding.

Data Availability Statement

Dataset available on request from the authors.

Acknowledgments

The technical and scientific staff of Université Claude Bernard Lyon 1, CNRS IRCELYON and Università degli Studi di Milano (SmartMatLab Project 2013-1776, Cariplo Foundation, and Laboratorio di Analisi of Dipartimento di Chimica) are acknowledged for the valuable assistance in physico-chemical characterizations. Nadia Santo of Unitech NOLIMITS at Università degli Studi di Milano is gratefully acknowledged for TEM analyses on unmodified HAP.

Conflicts of Interest

The authors declare no conflicts of interest.

Abbreviations

The following abbreviations are used in this manuscript:
BETBrunauer, Emmet, Teller
BJHBarret, Joyner, Halenda
DR-UV Diffuse Reflectance UV-vis
DTGS Deuterated Triglycine Sulfate
EDXEnergy-Dispersive X-ray
FFT/FTFast Fourier Transform/Fourier Transform
GHSVGas Hourly Space Velocity
HAPHydroxyapatite
HRHigh-resolution
JCPDSJoint Committee on Powder Diffraction Standards
ICP-OESInductively Coupled Plasma Optical Emission Spectrometry
IR/NIRInfrared/Near Infrared
µ-GCmicro gas phase chromatograph
SAEDSelected Area Electron Diffraction
SCRSelective Catalytic Reduction
TEMTransmission Electron Microscopy
VOCVolatile Organic Compounds
XPSX-ray Photoelectron Spectroscopy
XRDX-Ray Diffraction

References

  1. Ibrahim, M.; Labaki, M.; Giraudon, J.M.; Lamonier, J.F. Hydroxyapatite, a Multifunctional Material for Air, Water and Soil Pollution Control: A Review. J. Hazard. Mater. 2020, 383, 121139. [Google Scholar] [CrossRef]
  2. Mondal, S.; Park, S.; Choi, J.; Vu, T.T.H.; Doan, V.H.M.; Vo, T.T.; Lee, B.; Oh, J. Hydroxyapatite: A Journey from Biomaterials to Advanced Functional Materials. Adv. Colloid. Interface Sci. 2023, 321, 103013. [Google Scholar] [CrossRef]
  3. Avola, T.; Campisi, S.; Polito, L.; Arici, S.; Ferruti, L.; Gervasini, A. Addressing the Issue of Surface Mechanisms and Competitive Effects in Cr(VI) Reductive-Adsorption on Tin-Hydroxyapatite in the Presence of Co-Ions. Sci. Rep. 2023, 13, 18913. [Google Scholar] [CrossRef]
  4. Campisi, S.; Evangelisti, C.; Postole, G.; Gervasini, A. Combination of Interfacial Reduction of Hexavalent Chromium and Trivalent Chromium Immobilization on Tin-Functionalized Hydroxyapatite Materials. Appl. Surf. Sci. 2021, 539, 148227. [Google Scholar] [CrossRef]
  5. Kiani, D.; Baltrusaitis, J. Surface Chemistry of Hydroxyapatite for Sustainable N-Butanol Production from Bio-Ethanol. Chem. Catal. 2021, 1, 782–801. [Google Scholar] [CrossRef]
  6. Ben Osman, M.; Krafft, J.M.; Thomas, C.; Yoshioka, T.; Kubo, J.; Costentin, G. Importance of the Nature of the Active Acid/Base Pairs of Hydroxyapatite Involved in the Catalytic Transformation of Ethanol to n-Butanol Revealed by Operando DRIFTS. ChemCatChem 2019, 11, 1765–1778. [Google Scholar] [CrossRef]
  7. Agbeboh, N.I.; Oladele, I.O.; Daramola, O.O.; Adediran, A.A.; Olasukanmi, O.O.; Tanimola, M.O. Environmentally Sustainable Processes for the Synthesis of Hydroxyapatite. Heliyon 2020, 6, e03765. [Google Scholar] [CrossRef] [PubMed]
  8. Fihri, A.; Len, C.; Varma, R.S.; Solhy, A. Hydroxyapatite: A Review of Syntheses, Structure and Applications in Heterogeneous Catalysis. Coord. Chem. Rev. 2017, 347, 48–76. [Google Scholar] [CrossRef]
  9. Minh, D.P. Design and Applications of Hydroxyapatite-Based Catalysts, 1st ed.; Minh, D.P., Ed.; Wiley-VCH Verlag GmbH: Weinheim, Germany, 2022; ISBN 978-3-527-83020-6. [Google Scholar]
  10. Ying Kei, C.L. Iron-Substituted Hydroxyapatite. In Handbook of Ionic Substituted Hydroxyapatites; Khan, A.S., Chaudhry, A.A., Eds.; Elsevier: Amsterdam, The Netherlands, 2020; pp. 259–282. ISBN 978-0-08-102834-6. [Google Scholar]
  11. Nikitina, Y.O.; Petrakova, N.V.; Ashmarin, A.A.; Titov, D.D.; Shevtsov, S.V.; Penkina, T.N.; Kuvshinova, E.A.; Barinov, S.M.; Komlev, V.S.; Sergeeva, N.S. Preparation and Properties of Copper-Substituted Hydroxyapatite Powders and Ceramics. Inorg. Mater. 2019, 55, 1061–1067. [Google Scholar] [CrossRef]
  12. Amedlous, A.; Amadine, O.; Essamlali, Y.; Maati, H.; Semlal, N.; Zahouily, M. Copper Loaded Hydroxyapatite Nanoparticles as Eco-Friendly Fenton-like Catalyst to Effectively Remove Organic Dyes. J. Environ. Chem. Eng. 2021, 9, 105501. [Google Scholar] [CrossRef]
  13. Khachani, M.; Kacimi, M.; Ensuque, A.; Piquemal, J.Y.; Connan, C.; Bozon-Verduraz, F.; Ziyad, M. Iron-Calcium-Hydroxyapatite Catalysts: Iron Speciation and Comparative Performances in Butan-2-Ol Conversion and Propane Oxidative Dehydrogenation. Appl. Catal. A Gen. 2010, 388, 113–123. [Google Scholar] [CrossRef]
  14. Escolano Casado, G.; Ivanchenko, P.; Paul, G.; Bisio, C.; Marchese, L.; Ashrafi, A.M.; Milosavljevic, V.; Degli Esposti, L.; Iafisco, M.; Mino, L. Surface and Structural Characterization of Cu-Exchanged Hydroxyapatites and Their Application in H2O2 Electrocatalytic Reduction. Appl. Surf. Sci. 2022, 595, 153495. [Google Scholar] [CrossRef]
  15. Dos Santos Silva, D.; Villegas, A.E.C.; Bonfim, R.D.P.F.; Salim, V.M.M.; De Resende, N.S. Iron-Substituted Hydroxyapatite as a Potential Photocatalyst for Selective Reduction of CO2 with H2. J. CO2 Util. 2022, 63, 102102. [Google Scholar] [CrossRef]
  16. Chlala, D.; Giraudon, J.-M.; Nuns, N.; Labaki, M.; Lamonier, J.-F. Highly Active Noble-Metal-Free Copper Hydroxyapatite Catalysts for the Total Oxidation of Toluene. ChemCatChem 2017, 9, 2275–2283. [Google Scholar] [CrossRef]
  17. Galloni, M.G.; Campisi, S.; Gervasini, A.; Morandi, S.; Manzoli, M. How Hydroxyapatite Governs Surface Cu(II) and Fe(III) Structuring: Effects in the N2O Decomposition under Highly Oxidant Atmosphere. Appl. Catal. A Gen. 2023, 655, 119101. [Google Scholar] [CrossRef]
  18. Campisi, S.; Galloni, M.G.; Marchetti, S.G.; Auroux, A.; Postole, G.; Gervasini, A. Functionalized Iron Hydroxyapatite as Eco-Friendly Catalyst for NH3-SCR Reaction: Activity and Role of Iron Speciation on the Surface. ChemCatChem 2020, 12, 1676–1690. [Google Scholar] [CrossRef]
  19. Schiavoni, M.; Campisi, S.; Carniti, P.; Gervasini, A.; Delplanche, T. Focus on the Catalytic Performances of Cu-Functionalized Hydroxyapatites in NH3-SCR Reaction. Appl. Catal. A Gen. 2018, 563, 43–53. [Google Scholar] [CrossRef]
  20. Galloni, M.G.; Campisi, S.; Marchetti, S.G.; Gervasini, A. Environmental Reactions of Air-Quality Protection on Eco-Friendly Iron-Based Catalysts. Catalysts 2020, 10, 1415. [Google Scholar] [CrossRef]
  21. Campisi, S.; Galloni, M.G.; Bossola, F.; Gervasini, A. Comparative Performance of Copper and Iron Functionalized Hydroxyapatite Catalysts in NH3-SCR. Catal. Commun. 2019, 123, 79–85. [Google Scholar] [CrossRef]
  22. Campisi, S.; Leone, M.; Papacchini, M.; Evangelisti, C.; Polito, L.; Postole, G.; Gervasini, A. Multifunctional Interfaces for Multiple Uses: Tin(II)-Hydroxyapatite for Reductive Adsorption of Cr(VI) and Its Upcycling into Catalyst for Air Protection Reactions. J. Colloid. Interface Sci. 2023, 630, 473–486. [Google Scholar] [CrossRef] [PubMed]
  23. Ferri, M.; Delafontaine, L.; Guo, S.; Asset, T.; Cristiani, P.; Campisi, S.; Gervasini, A.; Atanassov, P. Steering Cu-Based CO2RR Electrocatalysts’ Selectivity: Effect of Hydroxyapatite Acid/Base Moieties in Promoting Formate Production. ACS Energy Lett. 2022, 7, 2304–2310. [Google Scholar] [CrossRef]
  24. Campisi, S.; Galloni, M.G.; Gervasini, A. Unlocking Catalytic Efficiency: How Preparation Strategies and Copper Loading Enhance Hydroxyapatite Catalysts for NH3 Oxidation. Catalysts 2025, 15, 405. [Google Scholar] [CrossRef]
  25. Ressler, A.; Žužić, A.; Ivanišević, I.; Kamboj, N.; Ivanković, H. Ionic Substituted Hydroxyapatite for Bone Regeneration Applications: A Review. Open Ceram. 2021, 6, 100122. [Google Scholar] [CrossRef]
  26. Avakyan, L.; Paramonova, E.; Bystrov, V.; Coutinho, J.; Gomes, S.; Renaudin, G. Iron in Hydroxyapatite: Interstitial or Substitution Sites? Nanomaterials 2021, 11, 2978. [Google Scholar] [CrossRef] [PubMed]
  27. Saito, K.; Kagawa, S.; Ogasawara, M.; Kato, S. Multiple Incorporation of Copper and Iron Ions into the Channel of Hydroxyapatite. J. Solid State Chem. 2023, 317, 123673. [Google Scholar] [CrossRef]
  28. Kalita, J.; Das, B.; Dhar, S.S. Synergistic Effect of Iron and Copper in Hydroxyapatite Nanorods for Fenton-like Oxidation of Organic Dye. Colloids Surf. A Physicochem. Eng. Asp. 2022, 643, 128750. [Google Scholar] [CrossRef]
  29. Costentin, G.; Drouet, C.; Salles, F.; Sarda, S. Structure and Surface Study of Hydroxyapatite-Based Materials: Experimental and Computational Approaches. In Design and Applications of Hydroxyapatite-Based Catalysts; Wiley: Hoboken, NJ, USA, 2022; pp. 73–140. [Google Scholar]
  30. Goldberg, M.A.; Antonova, O.S.; Donskaya, N.O.; Fomin, A.S.; Murzakhanov, F.F.; Gafurov, M.R.; Konovalov, A.A.; Kotyakov, A.A.; Leonov, A.V.; Smirnov, S.V.; et al. Effects of Various Ripening Media on the Mesoporous Structure and Morphology of Hydroxyapatite Powders. Nanomaterials 2023, 13, 418. [Google Scholar] [CrossRef] [PubMed]
  31. Tounsi, H.; Djemal, S.; Petitto, C.; Delahay, G. Copper Loaded Hydroxyapatite Catalyst for Selective Catalytic Reduction of Nitric Oxide with Ammonia. Appl. Catal. B 2011, 107, 158–163. [Google Scholar] [CrossRef]
  32. Mondal, S.; De Anda Reyes, M.E.; Pal, U. Plasmon Induced Enhanced Photocatalytic Activity of Gold Loaded Hydroxyapatite Nanoparticles for Methylene Blue Degradation under Visible Light. RSC Adv. 2017, 7, 8633–8645. [Google Scholar] [CrossRef]
  33. Chen, J.; Huang, W.; Bao, S.; Zhang, W.; Liang, T.; Zheng, S.; Yi, L.; Guo, L.; Wu, X. A Review on the Characterization of Metal Active Sites over Cu-Based and Fe-Based Zeolites for NH3-SCR. RSC Adv. 2022, 12, 27746–27765. [Google Scholar] [CrossRef] [PubMed]
  34. Pestryakov, A.N.; Petranovskii, V.P.; Kryazhov, A.; Ozhereliev, O.; Pfänder, N.; Knop-Gericke, A. Study of Copper Nanoparticles Formation on Supports of Different Nature by UV-Vis Diffuse Reflectance Spectroscopy. Chem. Phys. Lett. 2004, 385, 173–176. [Google Scholar] [CrossRef]
  35. Sherman, D.M.; Waite, T.D. Electronic Spectra of Fe3+ Oxides and Oxide Hydroxides in the near IR to near UV. Am. Miner. 1985, 70, 1262–1269. [Google Scholar]
  36. Centi, G.; Perathoner, S.; Biglino, D.; Giamello, E. Adsorption and Reactivity of NO on Copper-on-Alumina Catalysts: I. Formation of Nitrate Species and Their Influence on Reactivity in No and NH3 Conversion. J. Catal. 1995, 152, 75–92. [Google Scholar] [CrossRef]
  37. Bravo-Suárez, J.J.; Subramaniam, B.; Chaudhari, R.V. Ultraviolet-Visible Spectroscopy and Temperature-Programmed Techniques as Tools for Structural Characterization of Cu in CuMgAlO x Mixed Metal Oxides. J. Phys. Chem. C 2012, 116, 18207–18221. [Google Scholar] [CrossRef]
  38. Lu, H.B.; Campbell, C.T.; Graham, D.J.; Ratner, B.D. Surface Characterization of Hydroxyapatite and Related Calcium Phosphates by XPS and TOF-SIMS. Anal. Chem. 2000, 72, 2886–2894. [Google Scholar] [CrossRef] [PubMed]
  39. Raikar, G.N.; Ong, J.L.; Lucas, L.C. Hydroxyapatite Characterized by XPS. Surf. Sci. Spectra 1996, 4, 9–13. [Google Scholar] [CrossRef]
  40. Gomes, G.C.; Borghi, F.F.; Ospina, R.O.; López, E.O.; Borges, F.O.; Mello, A. Nd:YAG (532 Nm) Pulsed Laser Deposition Produces Crystalline Hydroxyapatite Thin Coatings at Room Temperature. Surf. Coat. Technol. 2017, 329, 174–183. [Google Scholar] [CrossRef]
  41. Bazin, T.; Gaudon, M.; Champion, E.; Julien, I.; Prestipino, C.; Figueroa, S.J.A.; Duttine, M.; Demourgues, A. Copper Versatility in Hydroxyapatite: Valence States, Clusters, and Optical Absorption Properties. Inorg. Chem. 2024, 63, 22181–22193. [Google Scholar] [CrossRef]
  42. Guo, J.; Duchesne, P.N.; Wang, L.; Song, R.; Xia, M.; Ulmer, U.; Sun, W.; Dong, Y.; Loh, J.Y.Y.; Kherani, N.P.; et al. High-Performance, Scalable, and Low-Cost Copper Hydroxyapatite for Photothermal CO2 Reduction. ACS Catal. 2020, 10, 13668–13681. [Google Scholar] [CrossRef]
  43. Mansour, A.N.; Brizzolara, R.A. Characterization of the Surface of γ-Fe2O3 Powder by XPS. Surf. Sci. Spectra 1996, 4, 351–356. [Google Scholar] [CrossRef]
  44. Wang, Y.; Sherwood, P.M.A. Iron (III) Phosphate (FePO4) by XPS. Surf. Sci. Spectra 2002, 9, 99–105. [Google Scholar] [CrossRef]
  45. Bengoa, J.F.; Campisi, S.; Gervasini, A.; Marchetti, S.G. Mössbauer Spectroscopy as a Tool to Predict the Catalytic Activity of the Fe3+ Sites in an Exchanged Fe/Hydroxyapatite System. J. Nanopart. Res. 2023, 25, 100. [Google Scholar] [CrossRef]
  46. Lee, G.; Deka, D.J.; Rappé, K.G.; Szanyi, J. Water Effects on NH3-SCR over Cu-Based Small-Pore Zeolite Catalysts: A Review. Appl. Catal. A Gen. 2025, 706, 120491. [Google Scholar] [CrossRef]
  47. Szymaszek, A.; Samojeden, B.; Motak, M. The Deactivation of Industrial SCR Catalysts—A Short Review. Energies 2020, 13, 3870. [Google Scholar] [CrossRef]
  48. Zoubeir, L.; Adeline, S.; Laurent, C.S.; Yoann, C.; Truc, H.T.; Benoît, L.G.; Federico, A. The Use of the Novosol Process for the Treatment of Polluted Marine Sediment. J. Hazard. Mater. 2007, 148, 606–612. [Google Scholar] [CrossRef] [PubMed]
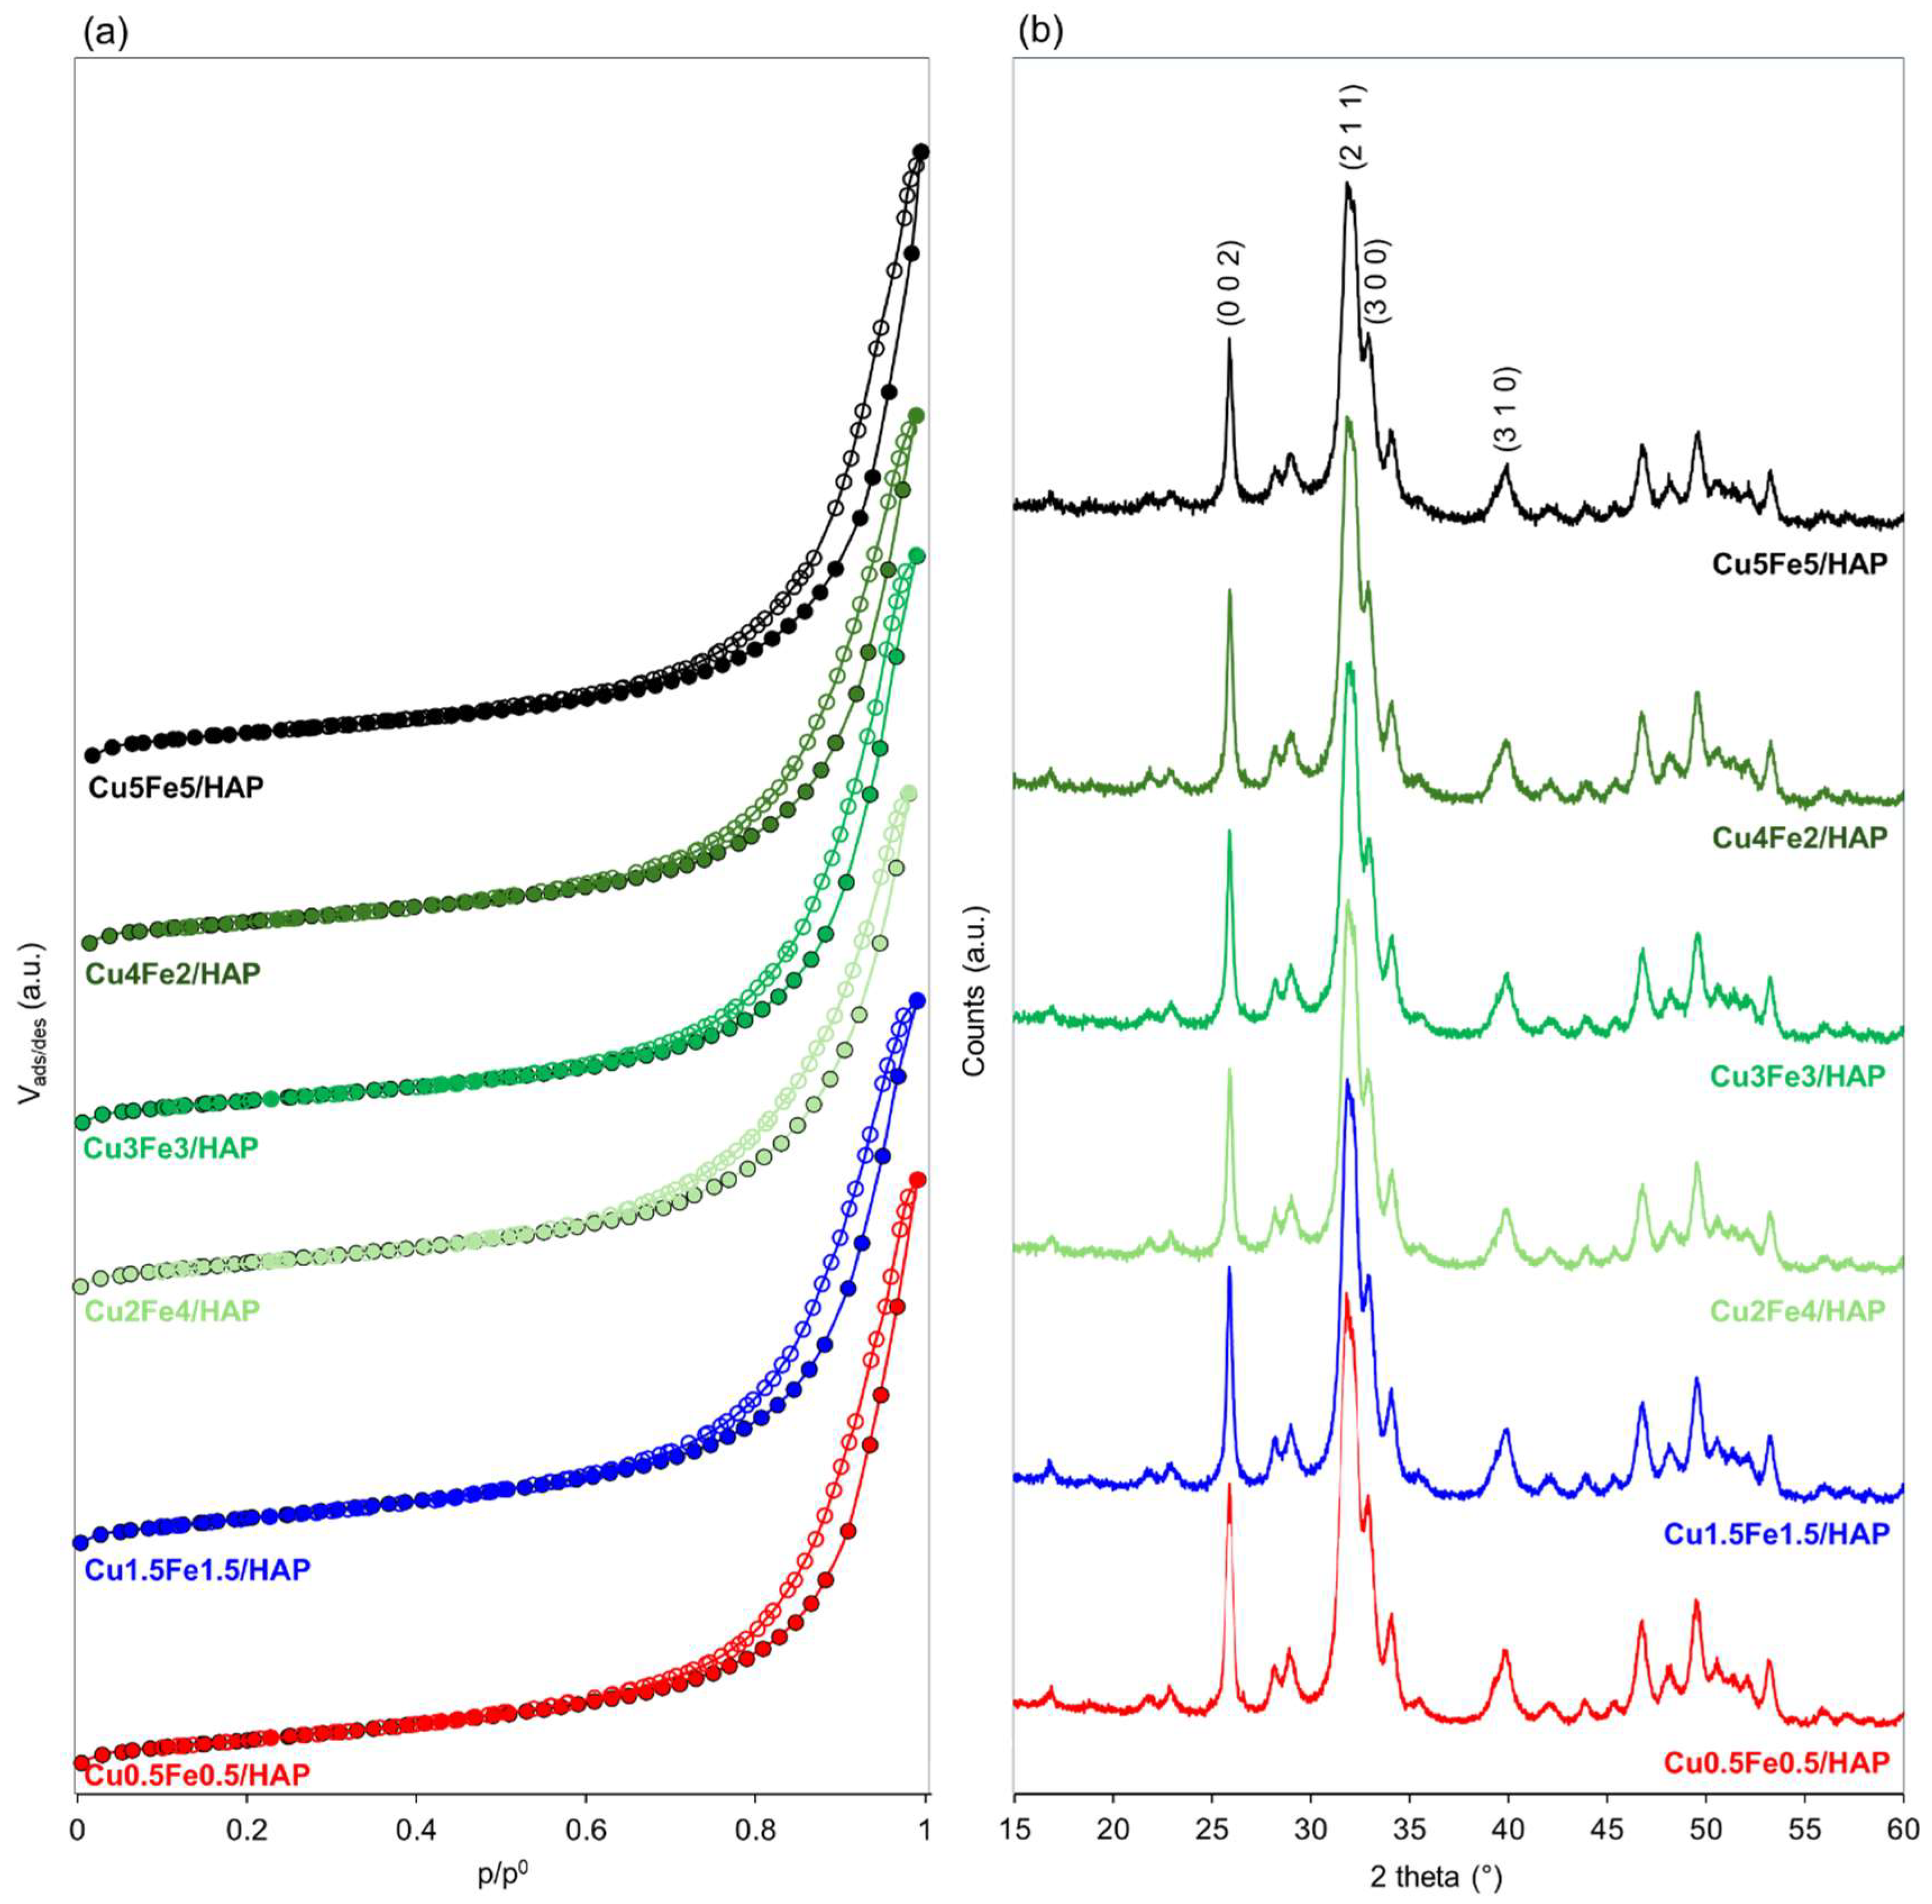
Figure 1. Textural properties of copper iron-HAP samples: (a) N2 adsorption/desorption isotherms at −196 °C and (b) XRD patterns.
Catalysts 15 00929 g001
Figure 2. TEM-EDX characterization of Cu3Fe3/HAP sample: (a) TEM micrograph, (b) STEM reference micrograph of a representative region and the corresponding EDS element quantification; (c) EDS mapping of calcium (violet), phosphorous (cyan), copper (red) and iron (yellow); (d) schematic illustration of the hexagonal HAP crystal system with the c-plane and a,b-planes; (e,f) HRTEM images and SAED patterns at different places of the sample.
Catalysts 15 00929 g002
Figure 3. DR UV spectra of copper–iron HAP samples. The main absorption maxima, averaged across the series, are indicated as representative markers to facilitate interpretation of the broad bands.
Catalysts 15 00929 g003
Figure 4. High Resolution XP spectra of Cu 2p, and Fe 2p of copper–iron HAP samples.
Catalysts 15 00929 g004
Figure 5. NH3-SCR catalytic results over copper–iron HAP samples: profiles of NO conversion (circles + lines) and selectivity to N2 (triangles) as a function of reaction temperature without and with water vapor (full and open symbols, respectively). Reaction conditions: [NH3] = [NO] = 400 ppm, [O2] = [H2O, if present] = 50,000 ppm (5%), GHSV = 120,000 h−1.
Catalysts 15 00929 g005
Scheme 1. Schematic view of copper and iron species at the surface of HAP grain in copper–iron HAP samples.
Catalysts 15 00929 sch001
Figure 6. Maximum NO conversion in NH3-SCR tests in relation to copper and iron loading (wt.%) in bimetallic and monometallic samples under dry (a) and wet conditions (b). Reaction conditions: [NH3] = [NO] = 400 ppm, [O2] = [H2O, if present] = 50,000 ppm (5%), GHSV = 120,000 h−1.
Catalysts 15 00929 g006
Table 1. Main bulk–surface properties of copper–iron HAP samples.
Code 1Surface Area 2
(m2·g−1)
Bulk Composition 3
(wt.%)
Surface Composition 4
(atomic %)
CuFeCa/PCuFeCa/P
HAP75--1.81--1.5
Cu0.5Fe0.5/HAP740.51 ± 0.010.44 ± 0.011.620.5
(1.4 wt.%)
1.3
(3.2 wt.%)
1.4
Cu1.5Fe1.5/HAP 811.54 ± 0.051.37 ± 0.021.671.4
(3.7 wt.%)
3.9
(8.9 wt.%)
1.2
Cu2Fe4/HAP772.03 ± 0.043.75 ± 0.051.551.4
(3.7 wt.%)
4.8
(11 wt.%)
1.2
Cu3Fe3/HAP722.99 ± 0.012.75 ± 0.011.602.2
(5.7 wt.%)
4.9
(11 wt.%)
1.2
Cu4Fe2/HAP733.86 ± 0.011.81 ± 0.011.613.2
(8.1 wt.%)
3.7
(8.3 wt.%)
1.2
Cu5Fe5/HAP735.28 ± 0.045.21 ± 0.042.363.6
(8.9 wt.%)
6.5
(14 wt.%)
1.0
1 all samples were calcined at 500 °C for 1h at controlled rate (1 °C/min) under air flow (100 mL/min); 2 determined by BET equation (2-parameters); 3 obtained by ICP-OES analyses on digested solids; 4 determined by XPS analyses.
Disclaimer/Publisher’s Note: The statements, opinions and data contained in all publications are solely those of the individual author(s) and contributor(s) and not of MDPI and/or the editor(s). MDPI and/or the editor(s) disclaim responsibility for any injury to people or property resulting from any ideas, methods, instructions or products referred to in the content.