Article

Hydrogenation of Simulated Bio-Syngas in the Presence of GdBO3 (B = Fe, Co, Mn) Perovskite-Type Oxides

by
Tatiana F. Sheshko
1,*,
Polina V. Akhmina
1,
Liliya G. Skvortsova
1,
Elizaveta M. Borodina
1,
Tatiana A. Kryuchkova
1,
Irina A. Zvereva
2 and
Alexander G. Cherednichenko
1
1
Department of Physical and Colloidal Chemistry, Faculty of Science, RUDN University, 6 Miklukho-Maklaya Street, 117198 Moscow, Russia
2
Department of Chemical Thermodynamics and Kinetics, Institute of Chemistry, Saint Petersburg State University, 7/9 Universitetskaya nab., 199034 Saint Petersburg, Russia
*
Author to whom correspondence should be addressed.
Catalysts 2025, 15(1), 67; https://doi.org/10.3390/catal15010067
Submission received: 6 December 2024 / Revised: 7 January 2025 / Accepted: 9 January 2025 / Published: 13 January 2025
(This article belongs to the Section Catalysis for Sustainable Energy)

Abstract

:
Direct light olefin synthesis from bio-syngas hydrogenation is a promising pathway to decarbonize the chemical industry. The present study is devoted to the investigation of co-hydrogenation of carbon oxides in the presence of complex systems with the perovskite structure GdBO3 (B = Fe, Mn, Co). The catalyst samples were synthesized by sol-gel technology and characterized by XRD, XPS, BET and TPR. It was found that the Fe/Mn-containing samples exhibited efficient catalysis of the hydrogenation of simulated bio-syngas to light hydrocarbons. The GdMnO3 catalyst exhibits selectivity for C2–C3 light olefins of up to 37% among C1+ hydrocarbons, with a maximum olefin/paraffin ratio. GdMnO3 also exhibits high conversion of CO and CO2, reaching up to 70–75% at 723 K. However, the GdFeO3 catalyst shows a lower selectivity of ( C 2 3 = = 22%, while it exhibits a higher conversion of CO2, up to 95%, at the same temperature. Herein, we established a catalyst structure–performance relationship as a function of chemical composition. Oxygen mobilities and ratios of surface (Os) to lattice (Ol) oxygen, forms of hydrogen adsorption, formation of -CHx- radicals and their subsequent recombination to olefins are influenced by the nature of the element in the B position. This work provides valuable insights for the rational design of bimetallic catalysts for bio-syngas hydrogenation.

1. Introduction

Over the past few centuries, the use of carbon-based fossil fuels—coal, oil and natural gas—has fueled a period of unparalleled human wealth and progress [1]. However, the concentration of carbon dioxide in the atmosphere is steadily increasing. The “greenhouse effect” is causing rising temperatures and contributing to global climate change. Countries are therefore forced to limit CO2 emissions, and scientists are forced to develop efficient systems to capture and use CO2 [2,3,4].
The conversion of biomass-derived syngas into chemicals and fuels using the Fischer–Tropsch (FTS) method is a promising way to create environmentally friendly and sustainable technologies for the production of fuels from renewable sources [5,6,7,8]. However, synthesis gas produced from biomass contains a significant amount of carbon dioxide (10–35% by volume), which is associated with the high oxygen content in the feedstock. This reduces the efficiency of the FTS process, which usually requires an optimal H2/CO 2 ratio [9,10].
Therefore, methods for removing excess CO2 from synthesis gas using additional devices have been developed [11,12]. Nevertheless, these actions raise the expenses for raw material processing, consequently increasing the price of the final product [13].
Bio-syngas is proving to be an attractive C1 building block to produce high-value organic chemicals, as it is an economical, safe and renewable carbon source [5]. However, CO2 is not commonly used as a carbon source in modern laboratory and industrial applications. In fact, only a few industrial processes—the synthesis of urea and its derivatives, salicylic acid and carbonates—use CO2 as a chemical feedstock. This is mainly due to the thermodynamic stability of CO2. The conversion of CO2 into other chemicals usually requires high-energy substances or electro-reduction processes [14,15].
Much attention has been given by the scientific community to the direct hydrogenation of captured CO2 and the production of value-added chemical products using carbon-free “green hydrogen” in the production process [16,17,18,19,20,21]. Catalysts for hydrogenating carbon oxides to methanol and olefins have been studied extensively. However, the direct hydrogenation of CO2 to produce olefins is challenging due to the limitations of CO2 inertness and the difficulty of chain growth [17,22,23].
Direct hydrogenation of CO2 to -CH2- is possible by dissociative adsorption followed by hydrogenation, but the extent of this process is unknown [24,25]. Another possible route is the direct Fischer–Tropsch synthesis of CO2 and H2 (CO2-FT) by performing a reverse water–gas shift (RWGS) reaction followed by FT in the same reactor. This is thermodynamically simpler than RWGS, because the whole process is exothermic [26].
In general, three moles of H2 are required to convert one mole of CO2 to the hydrocarbon precursor -CH2-, as shown in Equations (1)–(3) for the FTS and RWGS reactions, respectively. In particular, the RWGS reaction is a thermodynamically controlled reaction. Temperature and CO2 concentration can shift the equilibrium forward or backward [24].
C O ( g ) + 2 H 2   ( g )   ( C H 2 ) n   +   H 2 O ( g )       Δ r H 573 o = 166   k J / m o l
C O 2   ( g ) + H 2   ( g ) C O ( g ) + H 2 O ( g )       Δ r H 573 o = 38   k J / m o l
C O 2   ( g ) + 3 H 2   ( g )   ( C H 2 ) n   + 2 H 2 O ( g )       Δ r H 573 o = 128   k J / m o l
Thus, for the hydrogenation of CO2 via FTS, it is desirable for the RWGS reaction to occur only after a certain concentration of CO2.
The CO2-FT process is very attractive as a route to producing alkanes and olefins straight from CO + CO2 and H2, but developing catalysts that are water-stable and highly selective for olefins is a daunting issue. A major problem limiting the selective conversion of CO2 is the precise control of carbon chain growth to achieve high selectivity for hydrocarbons with the desired carbon series or bond structure (saturated, unsaturated, branched, etc.). As a thermodynamically stable molecule, CO2 requires initial reduction to the intermediate CO and subsequent C–C coupling, in contrast to CO hydrogenation. This requires active sites corresponding to both RWGS and C–C coupling. As a result, these problems make the hydrogenation of CO2 to olefins a more difficult process than FTS.
The most commonly used metals in a typical syngas (CO + H2) FTS are Fe at high temperatures and Co at low temperatures. When comparing CO and CO2 FTS, the conversion of CO is much higher than that of CO2 [26]. In addition, high methane production and deviation from the Anderson–Schulz–Flory (ASF) distribution occur with Co-based catalysts in CO2-FT [27]. New and improved catalysts for the synthesis of typical FT products using CO2 as a carbon source therefore need to be investigated. Current research into CO2-FT has focused mainly on Fe-based catalysts. These yield more olefins than Co-based catalysts. Olefin synthesis is also enhanced, and methane formation suppressed, by the addition of manganese (Mn) to an iron-based catalyst [28].
In recent times, perovskites have gained significant recognition as a viable substitute for a variety of catalytic systems. Their affordability, straightforward production process and the versatility of their structure through element substitution are key factors contributing to this [29]. The A-site metal in perovskites not only has a strong effect on the stability of the whole crystal configuration but also provides the possibility to improve catalyst performance by synergetic interactions with metals on the B-site [30,31]. For this reason, it is necessary to choose suitable metal ions on the A-site in this kind of structure.
In our previous work [32], the catalytic activity of complex oxides of the perovskite type AFeO3 (A = La, Nd, Gd, Ho, Yb, Lu) in the dry reforming of methane was investigated. The results indicate the presence of a “gadolinium angle” in the values of product formation rate, which is associated with the peculiarities of electronic configuration change in the lanthanide series. Gadolinium inhibited the reduction of Fe3+ and Fe2+ in all types of catalysts, which then suppressed the formation of iron carbides during the reaction [31,32]. This increased the activity of the catalyst.
The present study investigates the effect of metal (Fe/Co/Mn) in the B-position of GdBO3 perovskite catalysts for the conversion of CO2-rich syngas. Catalyst efficiency in terms of conversion and selectivity to different products was investigated at different CO2 contents (H2/CO/CO2) in the feed. Since biomass-derived syngas is an H2-deficient feedstock for the FTS process, the experiments were performed under H2-deficient conditions [33]. The balanced H2 content is defined as the molar ratio H2/(2CO + 3CO2) = 1 that is necessary for the production of one unit of the intermediate product -(CH2)-. This ratio was obtained using Equations (1) and (3). In contrast, a raw material is called H2-deficient if the molar ratio of H2/(3CO2 + 2CO) is 0.5 [34]. By varying the CO2/(CO2 + CO) ratio from 0 to 1, experiments were carried out to investigate the effect of the presence of CO2 in the feedstock under H2-deficient conditions. We have found that catalysts with a perovskite structure are promising for the FTS reaction in our previous studies [35,36,37]. It is therefore interesting to investigate the efficiency of GdBO3 (B = Fe, Co, Mn) perovskite catalysts for converting CO2-rich syngas to light olefins. As a result, the optimum operating conditions for the conversion of CO2-rich syngas to obtain the maximum amount of light olefins were proposed.

2. Results

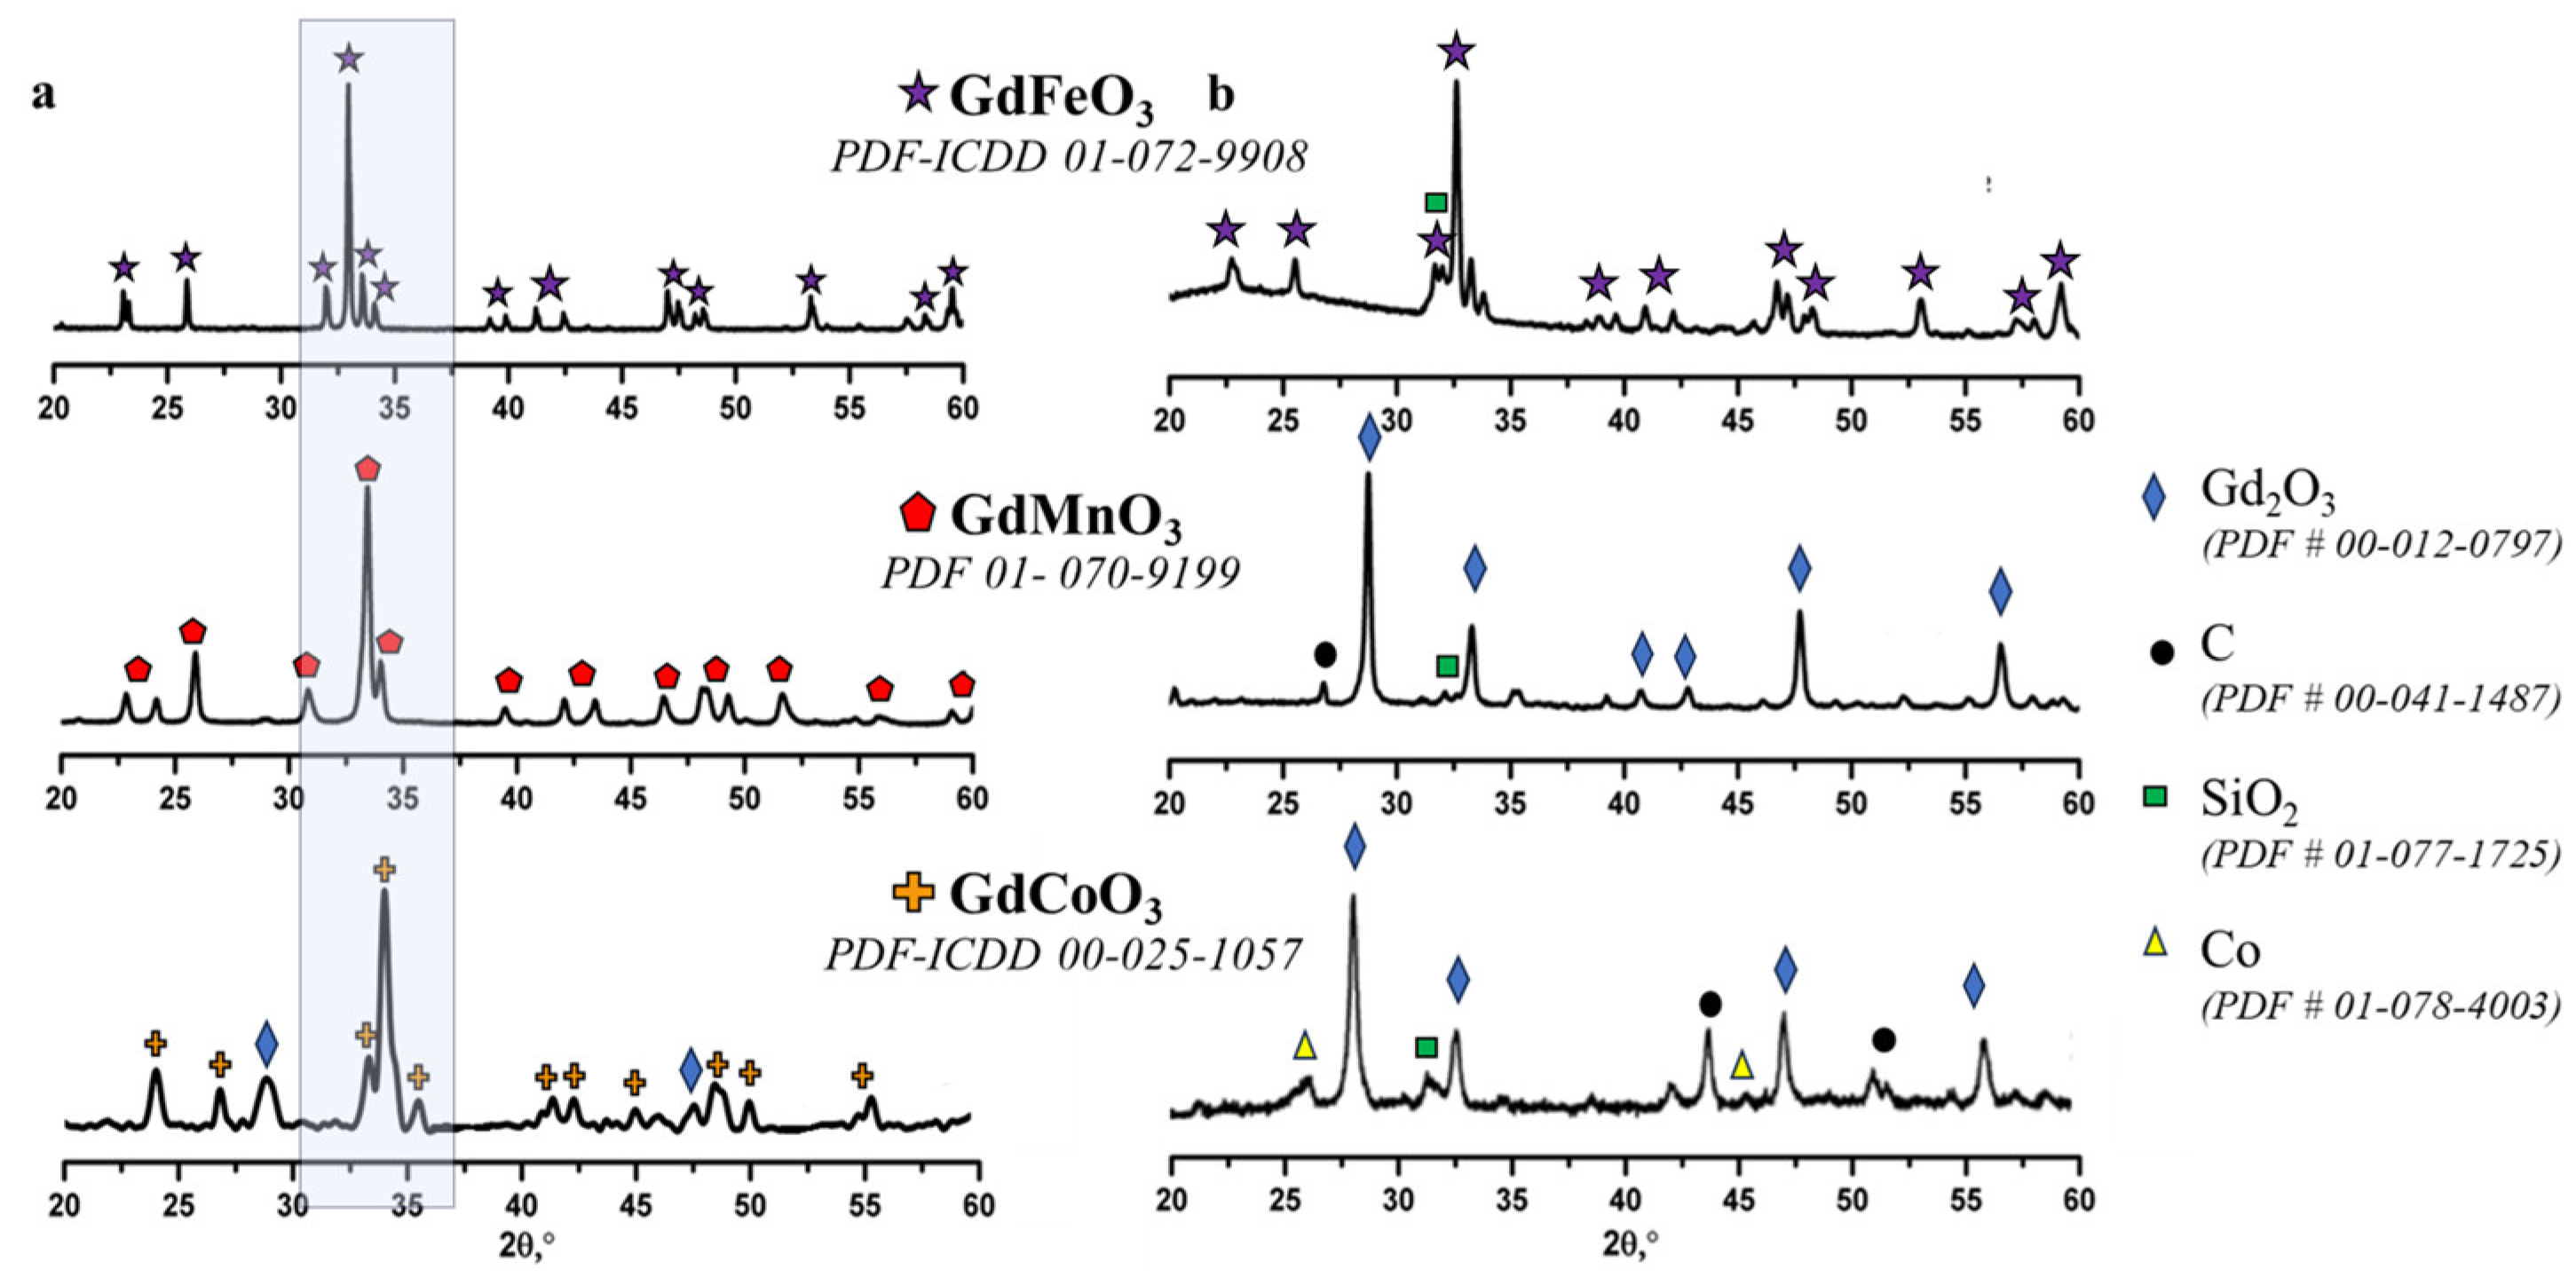
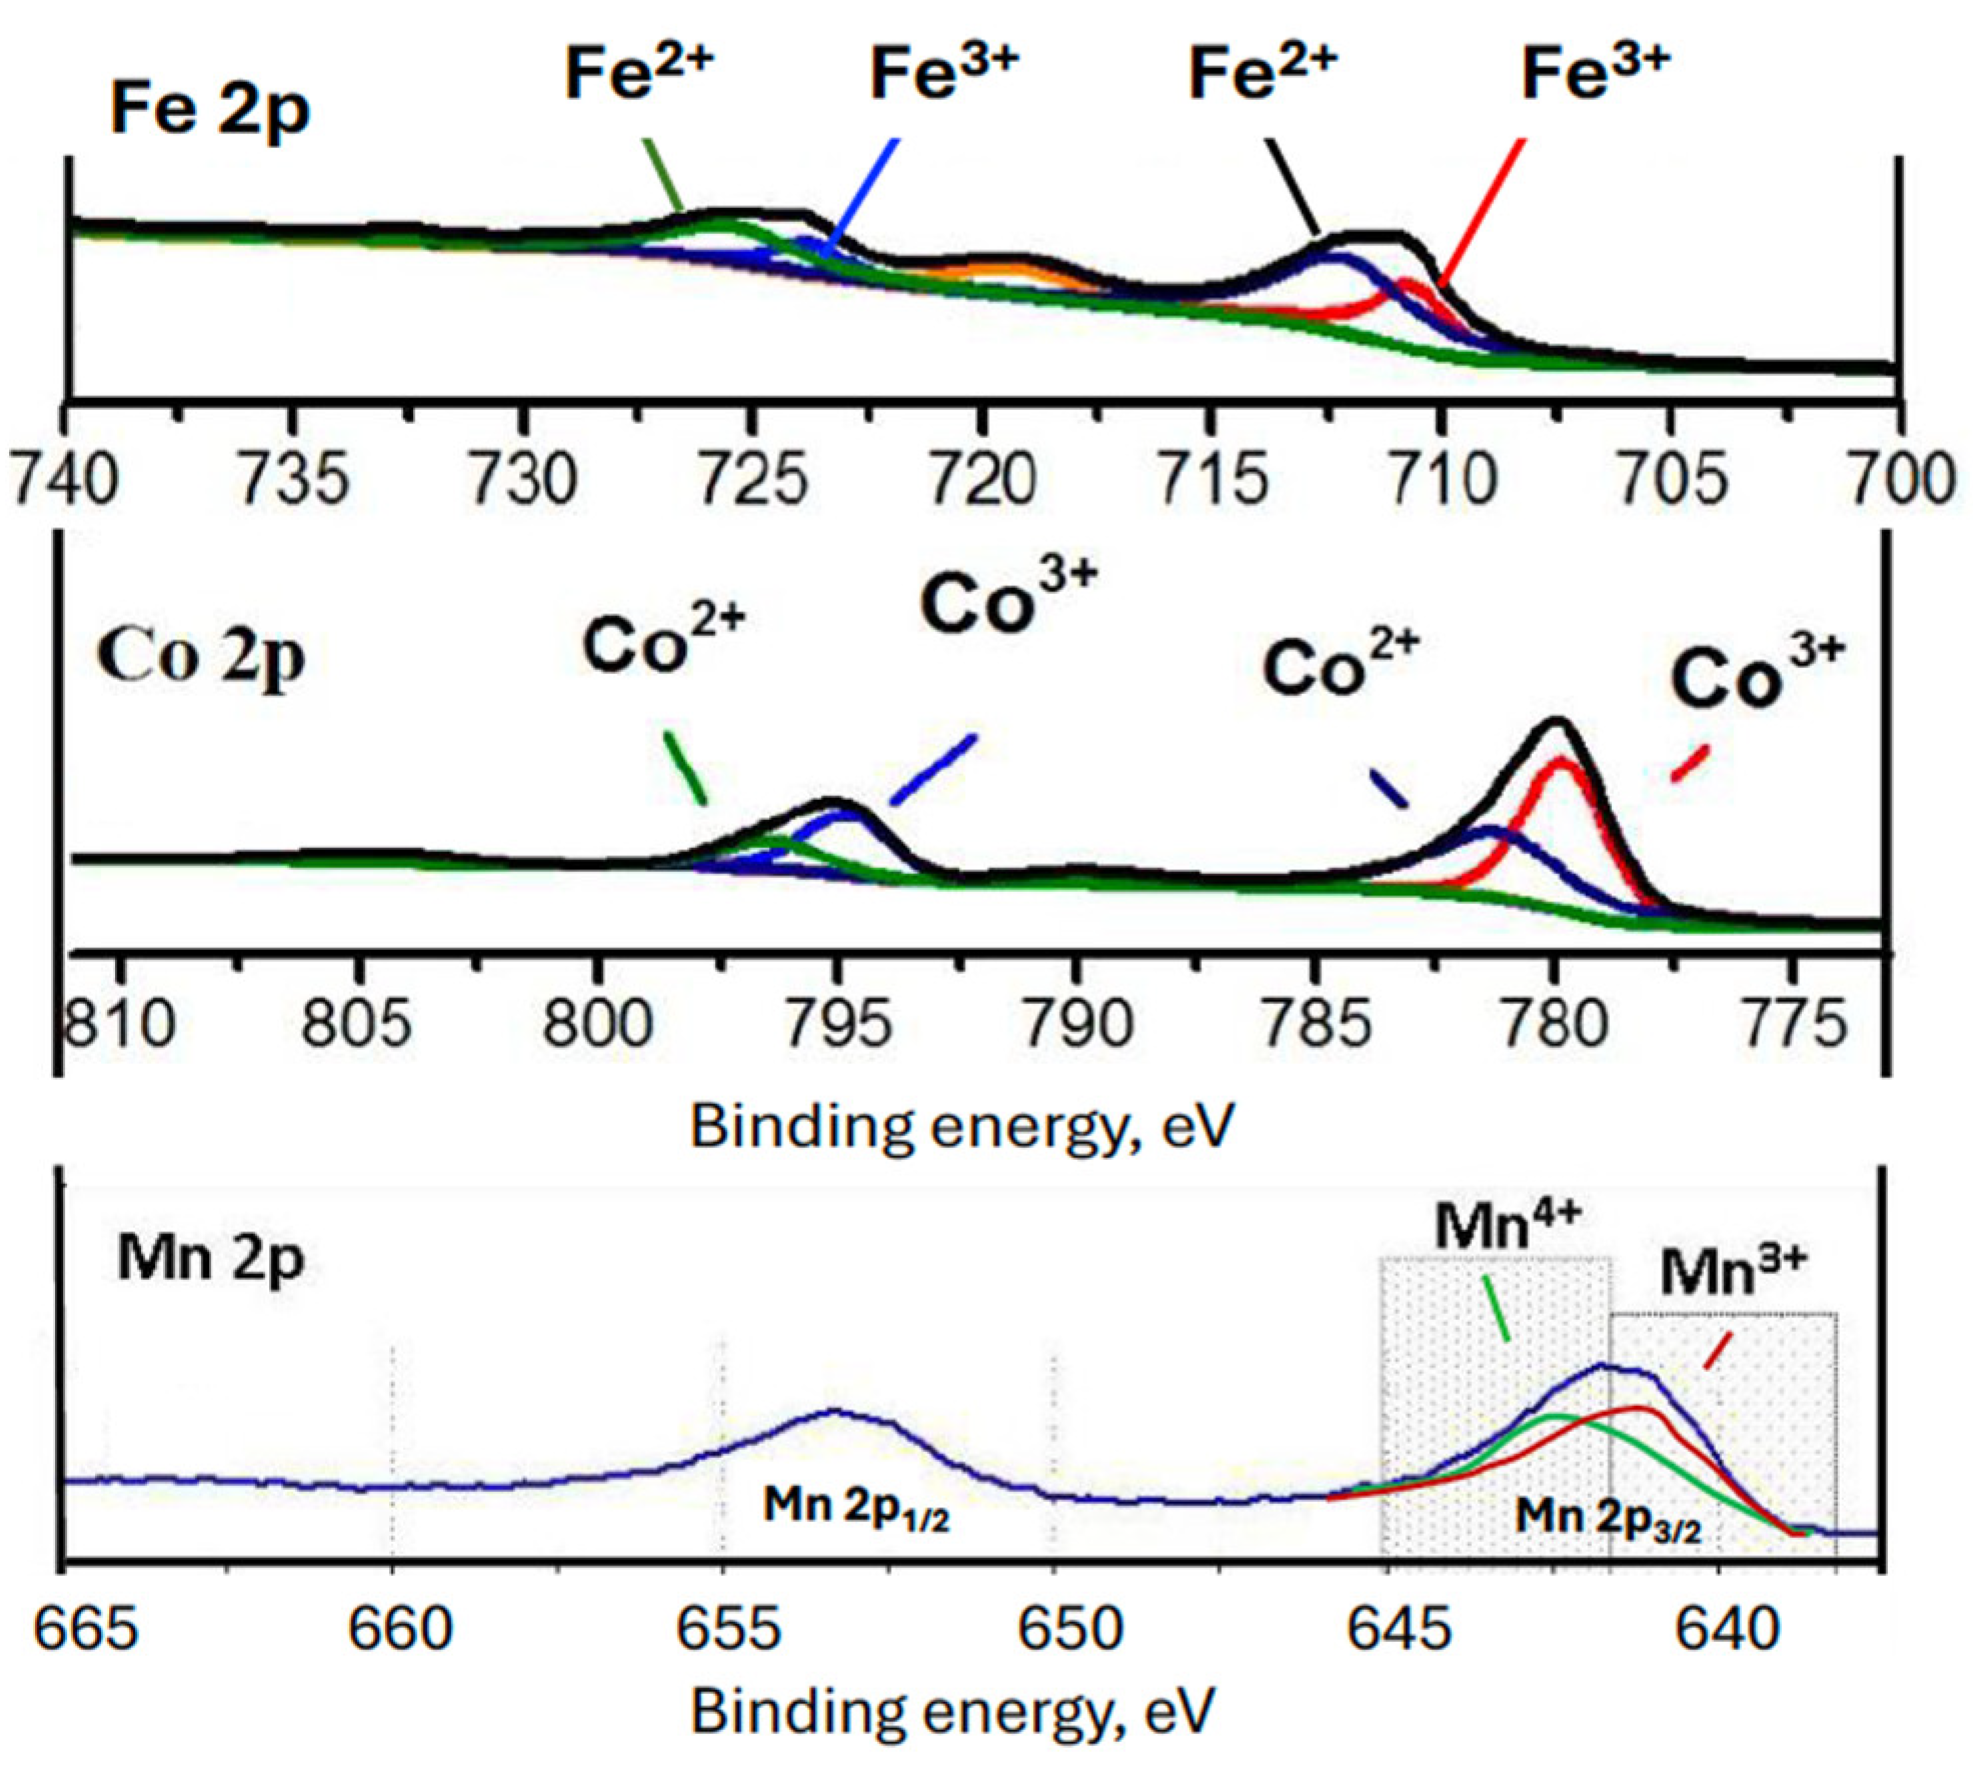
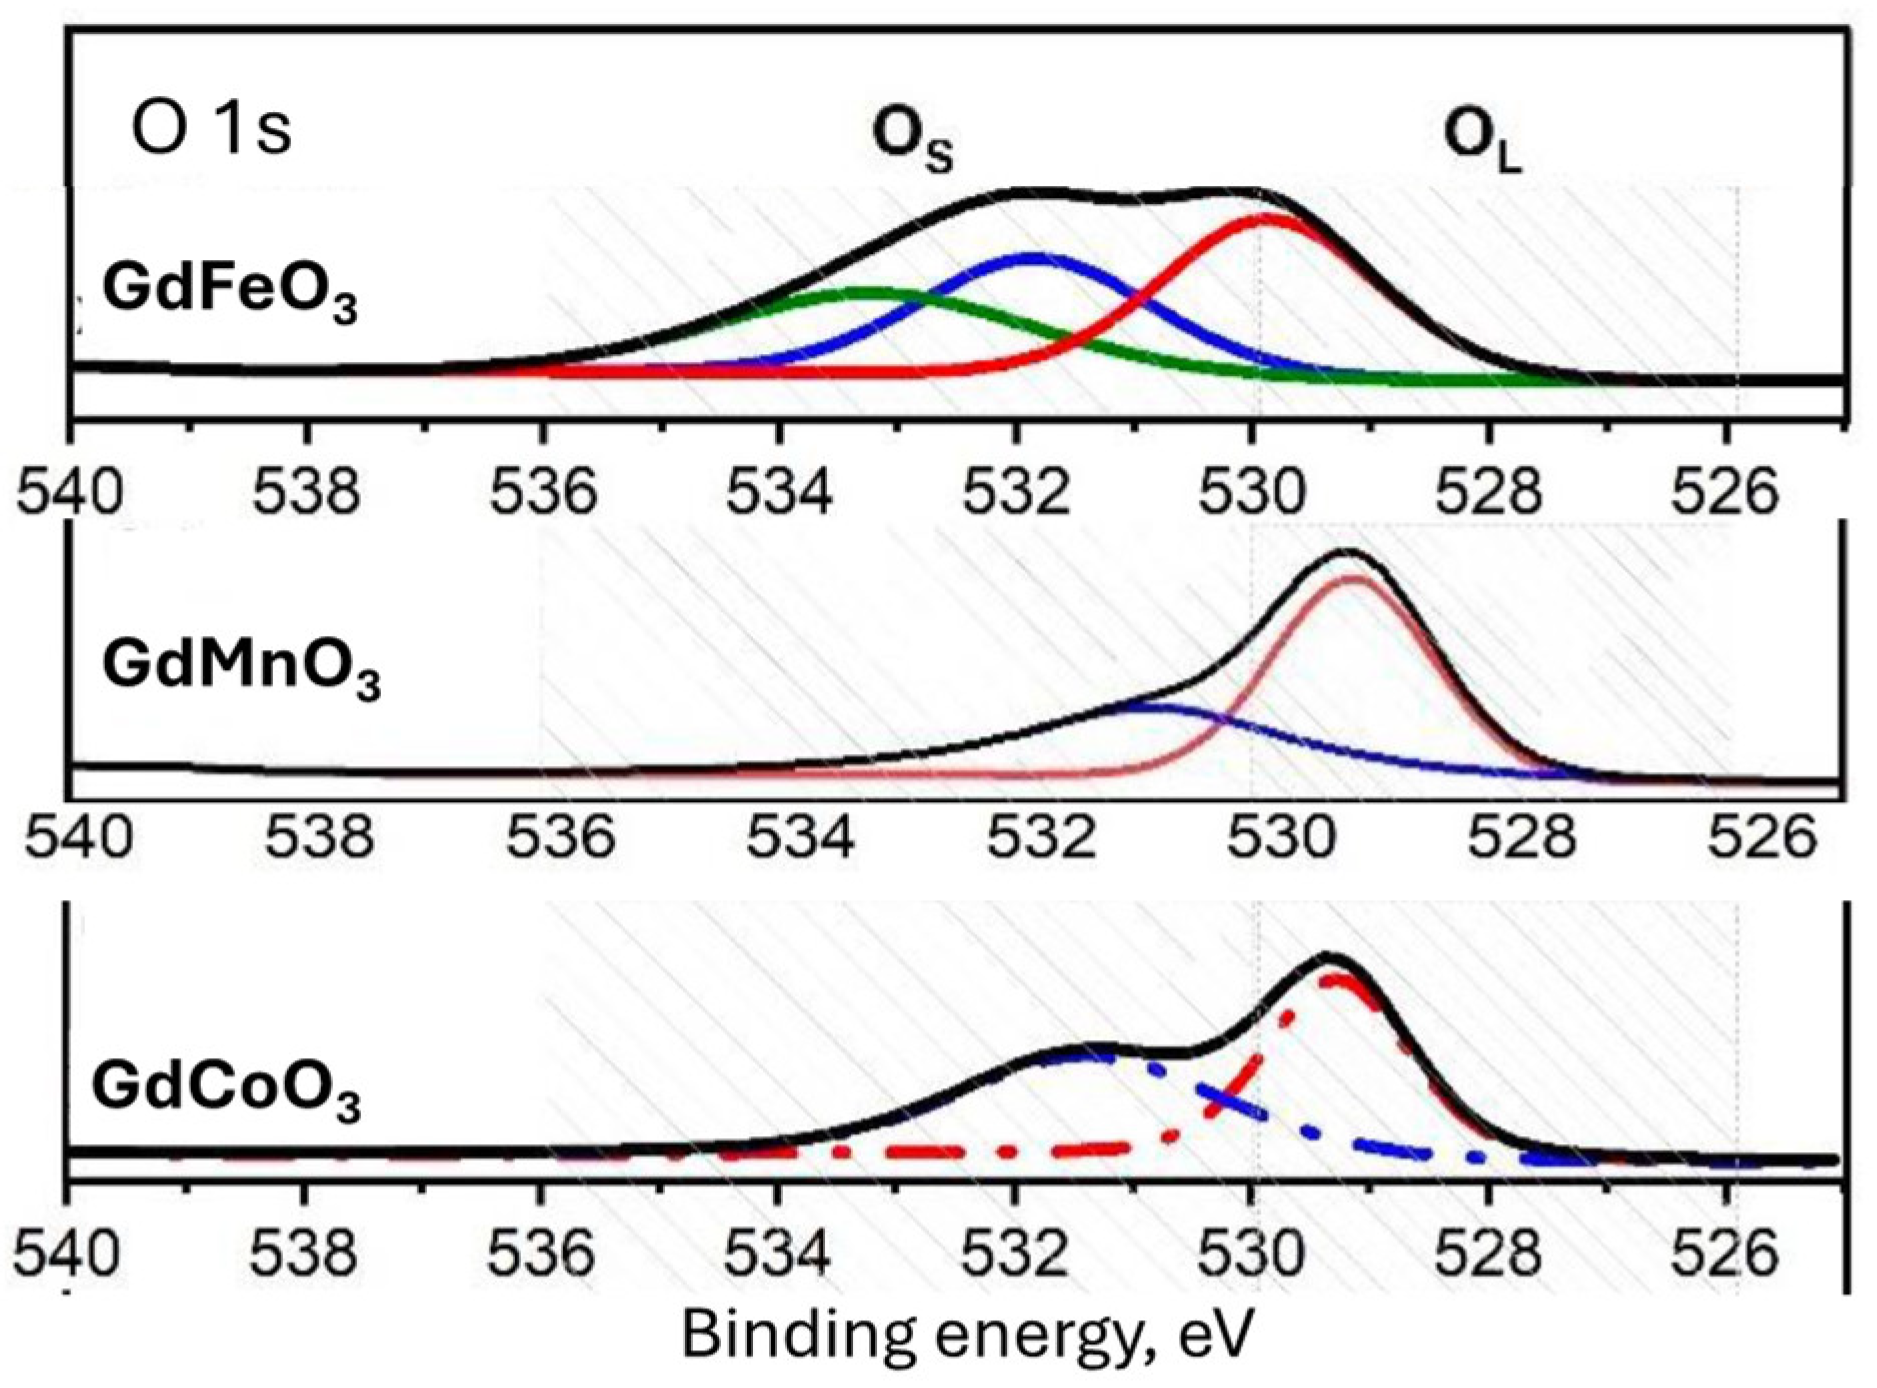
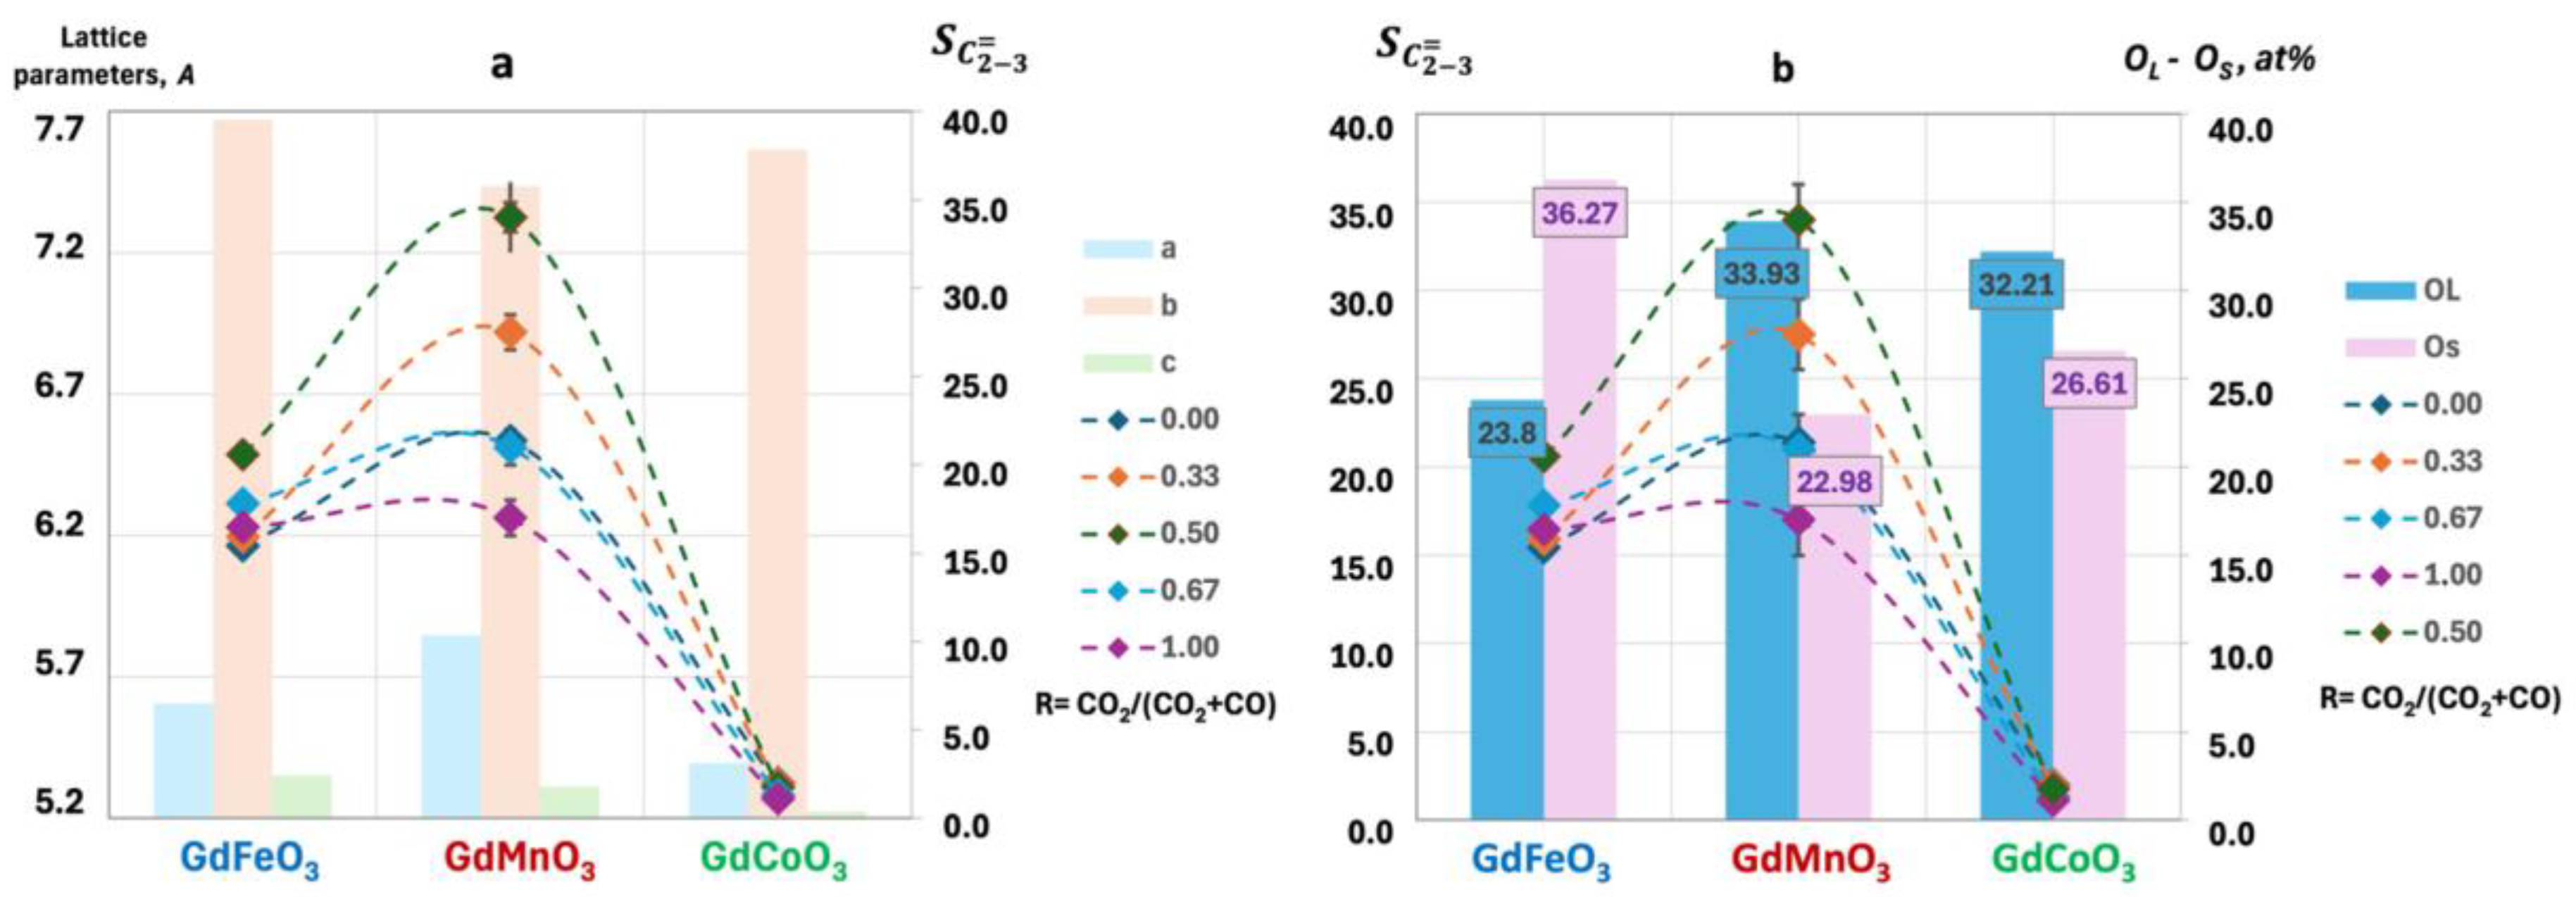
2.1. Characterization of the Catalysts

The XRD patterns of fresh and spent perovskites are shown in Figure 1. XRD analysis of the fresh catalysts (Figure 1) showed that the perovskites present in all catalysts consist mainly of GdFeO3 (PDF-ICDD 01-072-9908), GdCoO3 (PDF-ICDD 00-025-1057) and GdMnO3 (01-070-9199). The diffraction peaks have a slight shift in the parameters towards large angles 2θ during the Fe–Mn–Co transition. This shift is associated with the difference in the radii of the B-ions and indicates the formation of structures with distorted crystal lattice parameters.
The investigation of the phase composition after the catalytic tests shows that during the catalytic transformations, the phase composition of GdFeO3 remains unchanged, while the presence of C (PDF#00-041-1487) is observed in the GdMnO3 diffractogram. Also observed in the samples studied is the presence of SiO2 (PDF#01-077-1725), which was used to prevent sintering of the catalyst surface. The crystal lattice parameters and the results of elemental analysis of the synthesized perovskites, which are presented in Table 1, show a good correlation with the literature data [38,39] and the calculated values.
The specific BET surface areas of GdBO3 are depicted in Table 1. The outcomes of the nitrogen adsorption–desorption technique are displayed in Figure S1. All the perovskite samples showcased the type IV isotherm based on IUPAC classification with an H1-type hysteresis loop. The IV isotherm characterizes parallel channels with cylindrical shapes in a mesoporous structure. Overall, two hysteresis loops can be identified in the isotherms. The first presented at an intermediate relative pressure (P/P0) region, indicating a porous structure with uniform channels belonging to mesostructures. The second one at a relative pressure region of 0.8–1 implies textural mesoporous on GdBO3.
The surface morphology of gadolinium ferrite, manganite and cobaltite was studied using scanning electron microscopy (Zeiss Merlin device, Oberkochen, Germany). The surface morphology of oxides with the composition GdBO3 (B = Fe; Mn; Co) was studied using scanning electron microscopy. Micrographs of GdFeO3 (a), GdMnO3 (b) and GdCoO3 (c) fresh and spent (d, f, e) catalysts are shown in Figure 2.
The metal substitution in the B-site of the perovskite structure slightly affected the morphology of the particles: for manganite and cobaltite, the particles turned out to be of “more regular” spherical shape with the crystallite size of 100–200 nm. However, their size was 55–60 nm according to XRD data, i.e., the particles obtained are polycrystalline formed by synthesis during calcination. As with ferrite, manganite and cobaltite had a porous structure, with larger particles having less marked porosity, consistent with the specific surface area (Table 1).
The investigation of surface morphology after catalytic tests showed that for all catalysts, a slight agglomeration of particles is observed, which is associated with some sintering of crystallites as a result of catalytic processes. Figure 2d–f shows that in addition to graphite, which is deposited directly on the catalyst surface according to the XRD and TGA results, the formation of carbon with a “filamentary” structure similar to carbon nanotubes is observed.
Following the reaction, all the surface morphologies (Figure 2d–f) changed to reflect deformation and some aggregation of particles up to ~ 250 nm. The SEM micrographs of the used catalysts clearly showed that most of the surface was covered by deposited graphite and graphite clusters protruding on the surface, mixed with some fine filamentous carbon (Figure 2d–f). Graphite has been confirmed by TGA and XRD analyses. Particle growth did seem to occur on all three catalysts, but the carbon deposits are more severe for the GdCoO3 catalysts (Figure 2e). For GdFeO3 (Figure 2d) and GdCoO3 (Figure 2e), in addition to graphite, the carbon structure also has a fibrous (filamentous) shape, similar to carbon nanotubes. This filamentous shape results from carbon diffusion through the crystal lattice of the catalytic system, and the formation and growth of filaments on the surface of the catalyst. This form does not cause deactivation of the catalysts and therefore does not affect their effectiveness. After reaction, no filamentous carbon was observed in all cases, since most of it would have been converted in situ to form a mixture of carbonates such as Gd2O2CO3. XRD analysis showed the presence of Gd2O2CO3 on the bulk of the GdCoO3 surface.
Overview XPS spectra (Figure 3) of GdFeO3 (a), GdMnO3 (b) and GdCoO3 (c) demonstrate intense peaks of only Gd3d, Fe2p, Co2p, Co2p, Mn2p, O1s and C1s in the binding energy range 0–1400 eV. The states of atoms were refined by decomposition of the spectra.
The study of the XRS spectra of gadolinium for all oxides revealed the presence of peaks with binding energies at 141.6 and 1188.5 eV. These peaks are characteristic of Gd 4d5/2 and Gd 3d5/2, corresponding to the Gd3+ state [40].
Analysis of the XPS spectrum of iron atoms showed that the curve represents a two-peak spectrum with low binding energy Fe2p3/2 and high binding energy Fe2p1/2 (Figure 4). The position of the Fe XPS peak depends on the chemical state and the environment of the atoms. The positions of Fe2p3/2 peaks for all studied oxides are in the range of 709.87 ~711.92 eV, and those of Fe2p1/2 peaks, 723.06~724.88 eV. The determined values of Fe2p3/2 and Fe2p1/2 peak positions correspond to the standard values for Fe2+ and Fe3+ states [41], and the presence of Fe in several states is also confirmed by the asymmetry of the Fe2p peaks [42].
For GdCoO3, the Co 2p spectra (Figure 4) are represented by two main and two “satellite” peaks, and the XPS spectra are broad, indicating the presence of atoms in several oxidation states. The main peaks, namely Co 2p3/2 and Co 2p1/2, are located at binding energies of 779.80 eV and 795.1 eV, corresponding to Co2+ and Co3+ states, respectively [43]. The values of the spin–orbital splitting energies of Co 2p3/2 and Co 2p1/2 are ∼15 eV.
Manganese, having six stable oxidation states (0, II, III, IV, VI and VIII), three oxidation states with significant multiplet splitting (II, III, IV), one oxidation state with less defined splitting or broadening (VI) and overlapping binding energy ranges for these mutiplet splitting structures, presents a serious challenge for both qualitative and quantitative analysis [44]. The XPS spectra of Mn2p for GdMnO3 (Figure 4) shows the presence of two peaks located at 641.8 eV (Mn 2p3/2 peak) and 653.4 eV (Mn 2p1/2 peak). The splitting between the Mn 2p3/2 and Mn 2p1/2 levels was 11.6 eV. The results (peak positions) are in good agreement with the literature data [44,45]. Based on the data for Mn 2p3/2, the valence state of manganese in the compound is slightly higher than +3. Thus, the heterovalent state of manganese in the complex oxide GdMnO3 is characterized by Mn3+ and Mn4+. This indicates that the manganite samples obtained have defects due to the lack of cations. Moreover, the Mn2+ state can also be present in complex oxides, but the task of determining the presence of this oxidation degree is complicated, because the XPS analysis binding energies of Mn 2p for the Mn2+, Mn3+ and Mn4+ states are quite close.
We note the presence of an O1s peak with a binding energy of around 528–532 eV in the XPS spectra (Figure 3). Figure 5 shows the O1s spectra for GdFeO3, GdMnO3 and GdCoO3. The presence of two superimposed peaks for perovskite compounds has been reported [46,47]: the peak in the range of 528–530 eV corresponds to lattice oxygen (OL), and the peak with binding energies of 530–532 eV corresponds to surface forms of oxygen (Os): O2−, O22− and O. Each form can participate in the reaction and influence the catalytic properties [48]. The Table 2 summarizes the XPS data of the surface composition and atomic states of the studied perovskites.

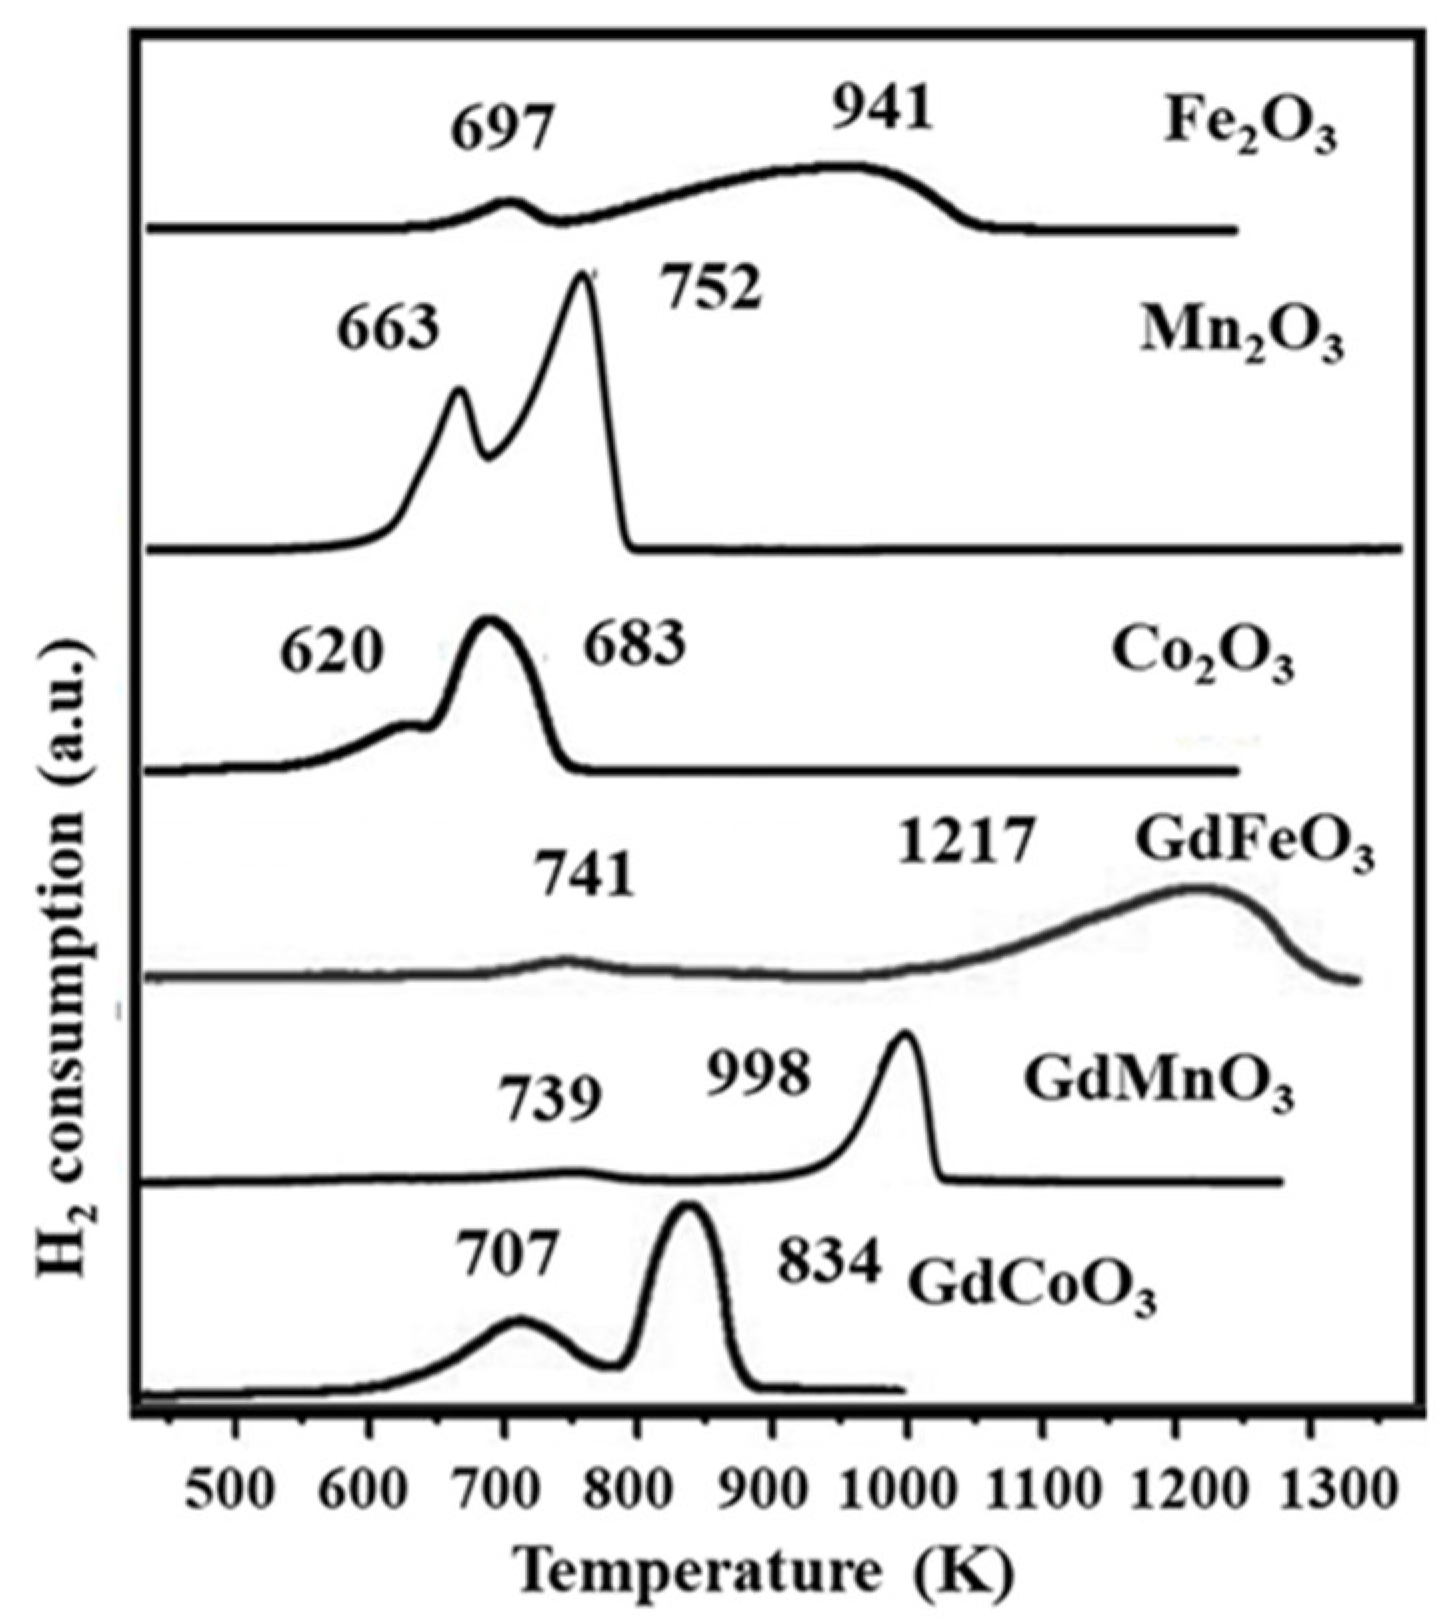
2.2. Temperature-Programmed Reduction by Hydrogen

The reduction of perovskite-type oxides is thought to be stepwise and usually consists of two successive reduction stages: low temperature up to ~783 K and high temperature of 783–1273 K. According to the data described in [46], the low-temperature reduction region is associated with the Me3+ → Me2+ transition, while the broad reduction peaks in the high-temperature region are associated with the Me2+ → Me0 transition.
Figure 6 shows the H2-TPR spectra of complex and simple Fe/Mn/Co oxides. The reduction of the B-element in perovskites occurs in two stages. The temperature ranges of these stages are shown in Table 3. The presence of the reduction peak in the first temperature range describes the partial reduction of Fe3+→Fe+2, Mn4+→Mn3+, Co3+→Co+2 and the formation of an oxygen-deficient compound of the GdBO3-δ type. The main peak of reduction to the metallic state for GdFeO3 and GdCoO3 falls in the high temperature range. This is due to the high stability of these compounds in a hydrogen atmosphere.
Two reduction ranges are also observed, but at lower temperatures, for the simple oxides Fe2O3, Mn2O3 and Co2O3. This means that the reduction of the B-element in the perovskite structure is more complicated than in simple oxides, which may be due to the mutual influence of Gd–O–B and the different oxygen environment of the B-atom.
The XRD data of the spent GdCoO3 show its reduction to Gd2Co2O5, and that the valence states of cobalt change from Co3+ to Co2+. These data are in good agreement with the results described in the literature [49]. Analysis of the phase composition of GdCoO3 after the second reduction peak (~1173 K) shows the presence of Gd2O3 and Co phases, confirming the reduction of Co2+ to Co0.
The phase analysis study shows that GdCoO3 after reduction exhibits the absence of diffraction peaks characteristic of perovskites, indicating the destruction of the perovskite structure and its transformation into Gd2O3 (PDF-ICDD 00-012-0797) and Co (PDF-ICDD 01-078-4003). As for GdFeO3, the phase composition study shows the presence of GdFeO3 perovskite phase reflections (PDF-ICDD 01-072-9908) and a small peak of Gd2O3 (PDF-ICDD 00-012-0797), which is related to the high recovery temperature of this compound (peak at 1217 K, Figure 6). The first peak at ~739 K is associated with the reduction of Mn4+ to Mn3+ in GdMnO3, and those at temperatures above 973 K with the reduction of Mn3+ to Mn2+ [50]. In comparison with GdCoO3 and GdFeO3, the process is accompanied by a lower level of hydrogen absorption.
For the Gd–Co–Mn–Fe–O series, the Tmax of the reduction peaks is shifted to a higher-temperature region, which indicates a high thermal stability, possibly arising due to the influence of the mutual strengthening of the M–O bond (M = Co, Mn, Fe), which leads to a limitation of the mobility of oxygen ions.

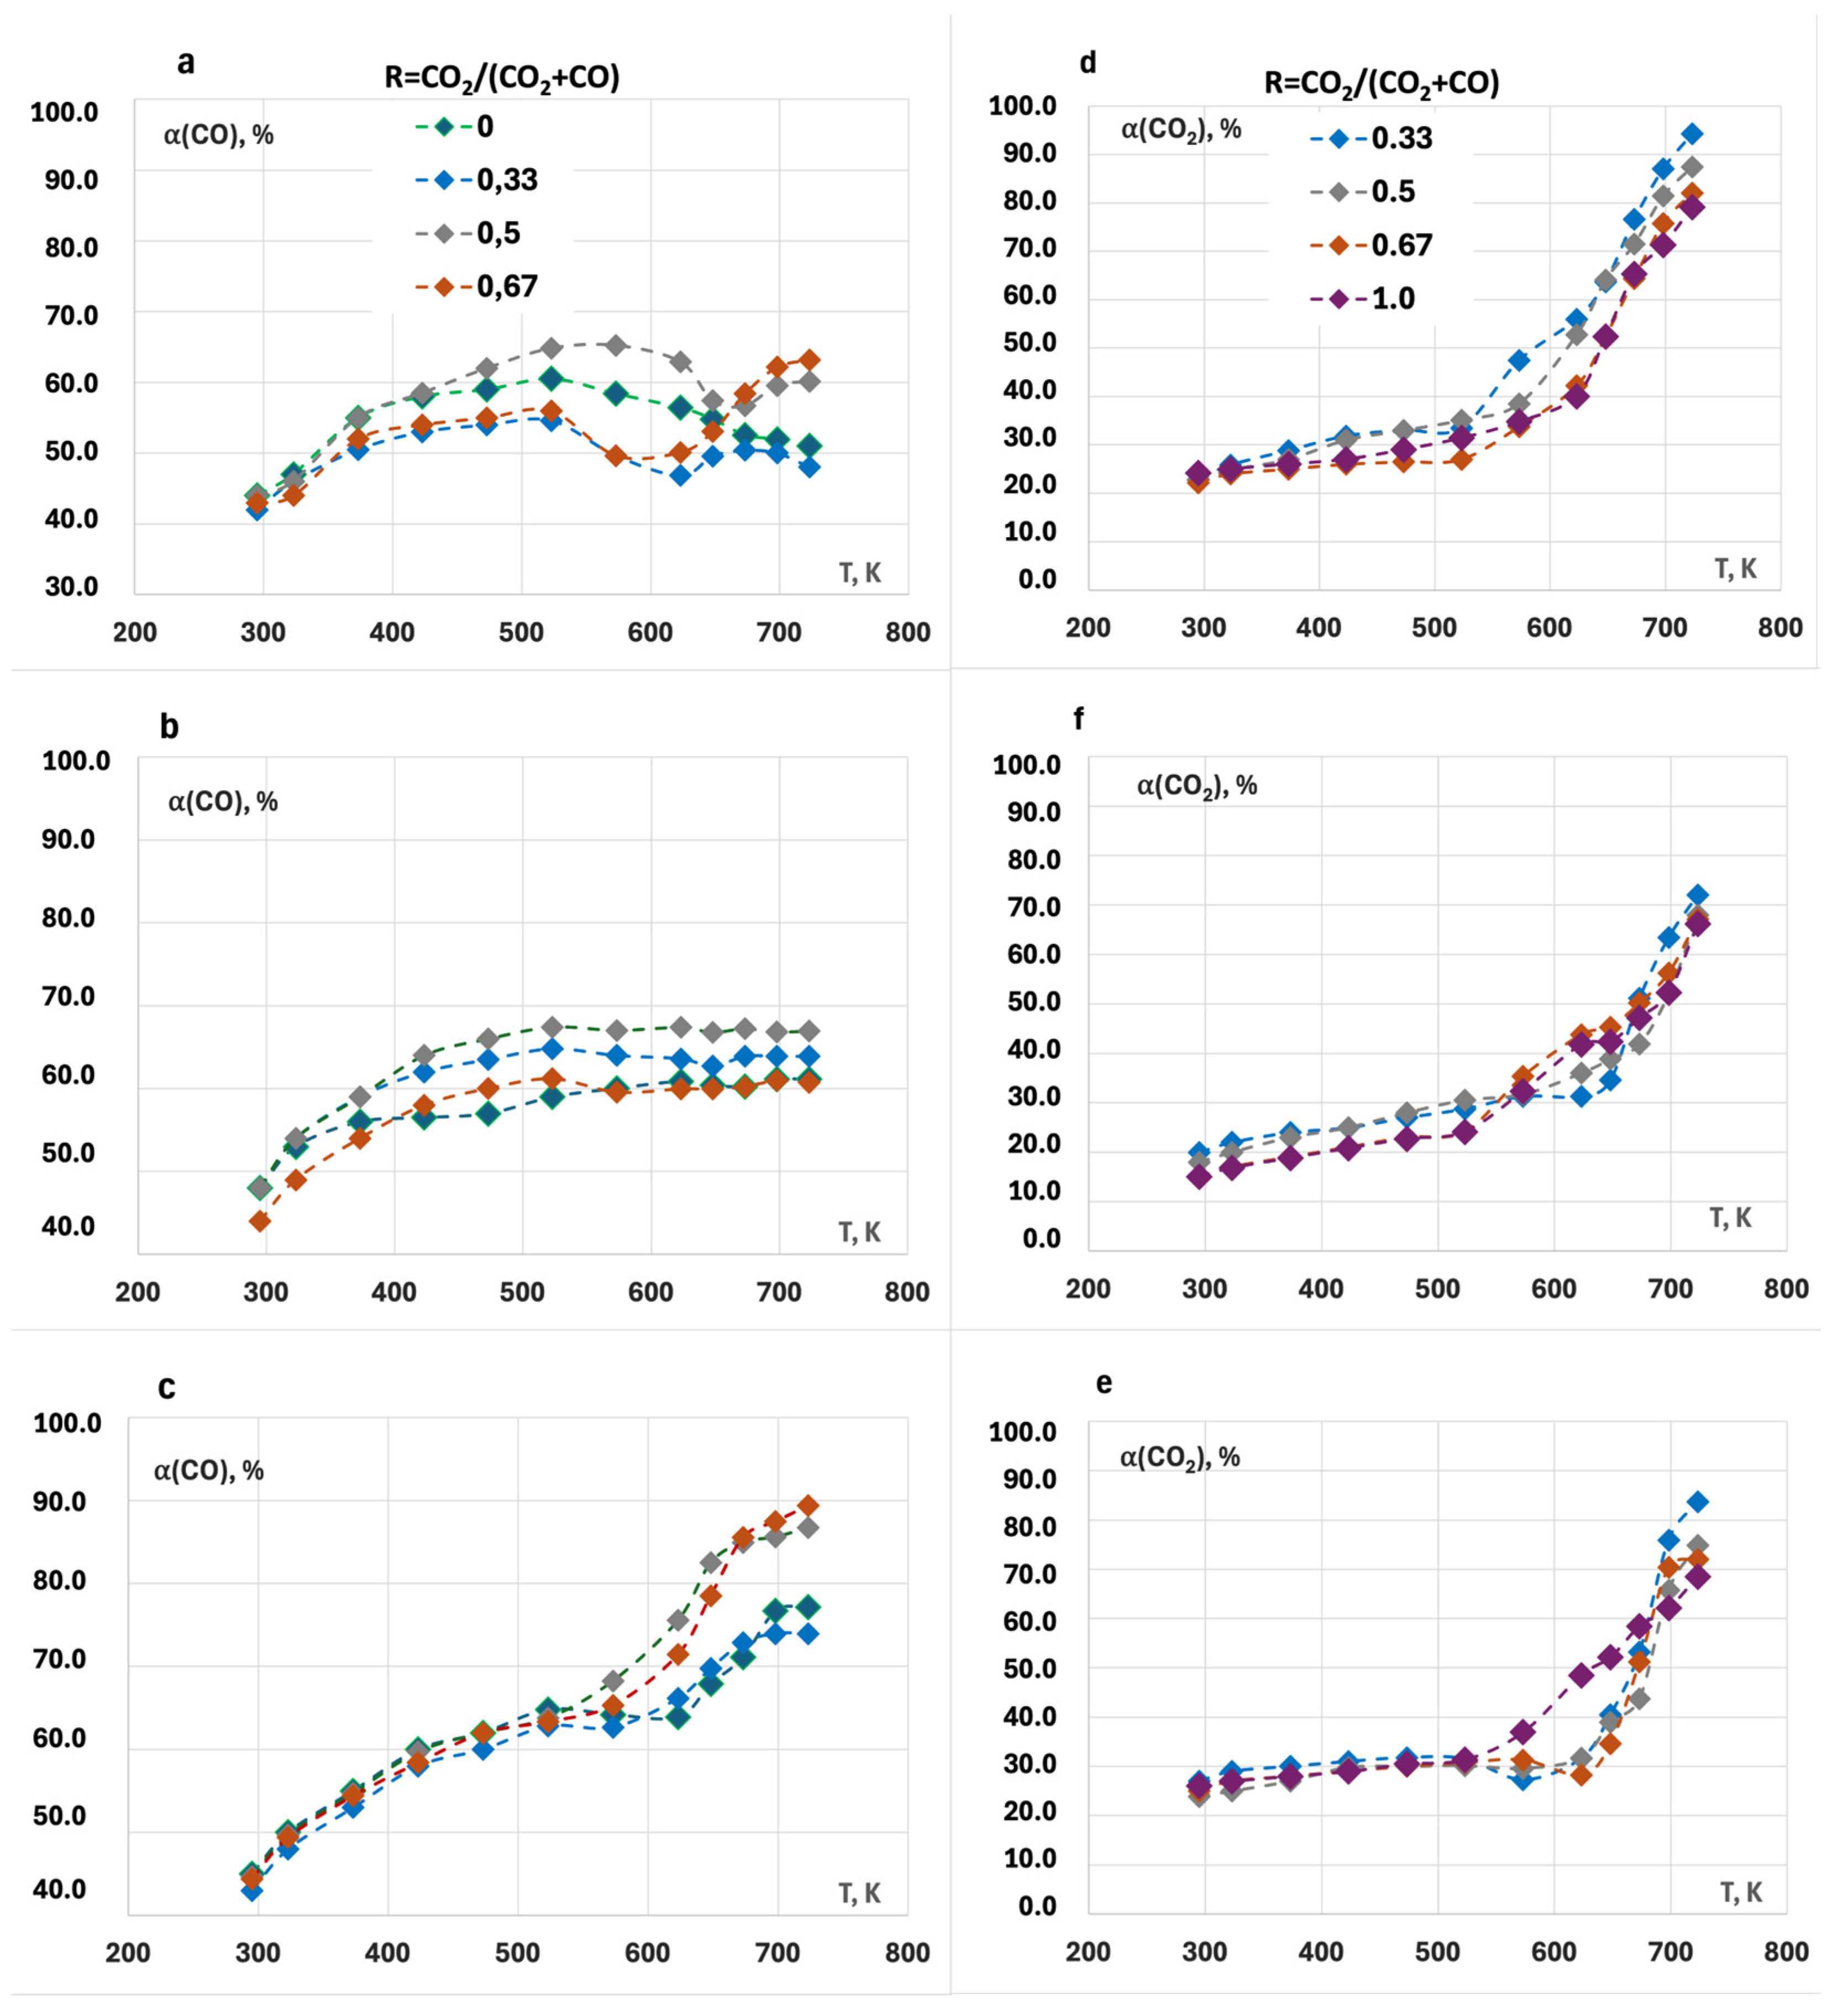
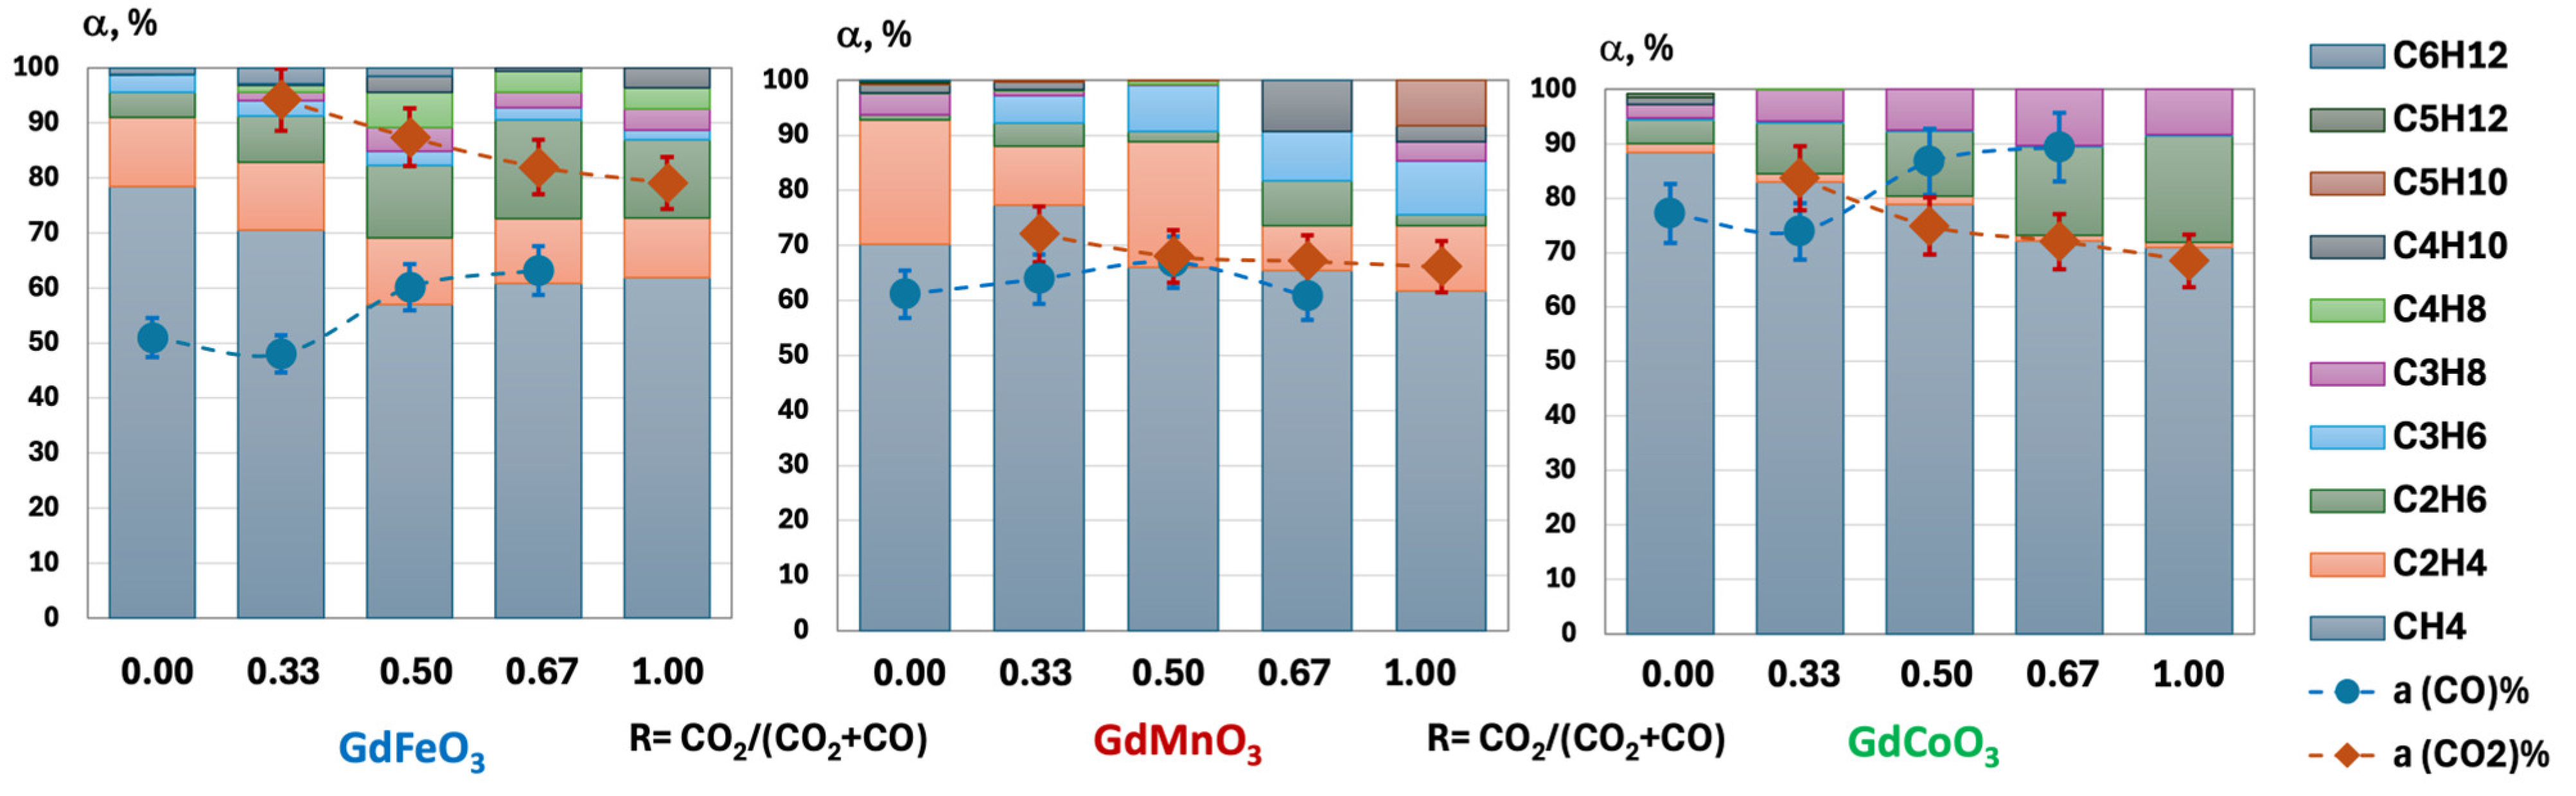
2.3. Catalytic Activity

Figure 7 shows feedstock conversions at different values of R = CO2/(CO2 + CO) for H2-deficient feedstock compositions.
Under all conditions and on all catalysts investigated, the CO conversion was already above 40% at 293 K (Figure 7a–c) and increased with increasing temperature. However, on GdFeO3 in the temperature range 573–673 K, a decrease in CO conversion was observed at all compositions of the reaction mixture. This can be explained by the formation of CO because of the RWGS reaction, which is most intense on iron-containing catalysts and increases with increasing CO2 concentration in the feed [51]. Under H2-deficient conditions, the % CO conversion was maximal at CO2/(CO + CO2) = 0.5 for all complex oxides. It is noteworthy that the CO2 conversion was not negative for all samples and increased from 10–15% at 293 K to 80–90% at 723 K (Figure 7d–f). CO2 conversion occurs in two steps, where in the first step CO2 is converted to CO via the RWGS reaction. As a result, the CO conversion either decreases or does not change (Figure 7). In a second step, the CO formed is converted into hydrocarbons by the FTS reaction. There is a value of critical ratio RC = CO2/(CO2 + CO) [52], at which CO2 conversion becomes equal to zero or even negative, which is associated with WGS. RC = CO2/(CO2 + CO) varies between 0.35 and 0.75 on iron-containing catalysts, as shown in [34,53,54]. Syngas produced from biomass contains higher than critical amounts of CO2. The hydrogenation of such bio-syngas does not require removal of CO2 from the feedstock. This increases the carbon efficiency of the process. The positive CO conversion values at all CO2/(CO2 + CO) ratios indicate that our perovskite catalysts are highly active towards RWGS and show significant FTS reaction activity under these conditions.
The RWGS is an endothermic reaction, so it is favored at higher temperatures, whereas FTO is an exothermic process [55,56]. Therefore, thermodynamic data indicate that low temperature favors the FTO reaction, while a high temperature is necessary to activate CO2 for the RWGS reaction [57,58]. Therefore, the reaction conditions greatly influence the CO2 conversion and product distribution.
Figure 8 shows the distribution of hydrogenation products at 723 K as a function of R = CO2/(CO2 + CO) of perovskites with different elements in the B-position. The product yield depends on the ratio of CO to CO2. Indeed, the result showed a strong product dependency on the CO2/(CO2 + CO) ratio in the feed gas. In particular, the CO2-rich feedstock favors the formation of linear-chain hydrocarbons, especially for GdCoO3. These results agree with literature data using cobalt-based catalysts [54,59]. The low CO2 concentration (less than 50%) acts as a diluting agent in the feed gas on cobalt catalysts. For GdFeO3, increasing the CO2 content in the feed gas suppressed the methane formation while decreasing the CO2 conversion. High CO2 concentration favors the RWGS reaction, and the main products were obtained by CO hydrogenation. However, CO2 was converted to hydrocarbons at higher CO2 concentration (more than 50%) and affected the overall distribution of FTS products. This can be explained by the change in the mean partial pressure of CO and H2. The partial pressure of hydrogen (H2) remains relatively constant, while a decrease in the partial pressure of carbon monoxide (CO) leads to an increase in the ratio of H2 to CO at the surface. This, in turn, enhances the yield of C2 and higher hydrocarbons. These findings are consistent with the trend observed in the iron (Fe/Cu/K/Si/Al) catalysts, where selectivity for longer-chain hydrocarbons increases as the CO2 content of the feed gas increases [34,52].
Increasing the CO2 content of the feed resulted in an increase in the propylene fraction when hydrogenation was carried out in the presence of GdMnO3. Mn is a well-studied promoter in CO2 hydrogenation via CO2-FTS and is considered an effective option for altering the product [52,60,61]. Al-Dossari et al. [62] observed that the Mn promoter inhibits H2 adsorption and increases the affinity for CO2 due to its basicity, thereby reducing methane formation and increasing the O/p value and selectivity towards C2+ hydrocarbons.
Calculation of total selectivity for ethylene and propylene at different R = CO2/(CO2 + CO) showed an increase with increasing temperature for all studied catalysts (Figure 9). The highest C 2 3 = values are achieved on GdMnO3 (up to 35%) at T = 723 K and at R = 0.5. GdFeO3 catalyst also shows high C 2 3 = selectivity, reaching 22% at 723 K, while the lowest selectivity for light olefins belongs to GdCoO3 (4%).
Figure 9 also shows that the C 2 3 = selectivity depends on the CO/CO2 ratio. For GdFeO3 and GdMnO3, increasing the ratio R = CO2/(CO2 + CO) up to 0.5 led to an increase in selectivity. At R > 0.5, the selectivity decreased and was comparable to the corresponding values for hydrogenation of carbon monoxide (R = 0) only. In the presence of GdCoO3, the increase of CO2 content in the feed reduced the already low yield of olefins.
Kinetic parameters were determined from Arrhenius plots, charting effective activation energies of product formation and logarithms of the pre-exponent, characteristic of the number of active centers of the catalyst. The calculated corresponding values for all samples are presented in Table 4.
For the hydrogenation of carbon monoxide, the nature of the element in the B-position of the complex oxide structure does not significantly change the apparent activation energies of the hydrogenation product formation. The activation energies of methane, ethylene and propylene formation were comparable for GdFeO3 and GdCoO3 and were larger for GdMnO3. The apparent activation barrier was at a similarly low value of 30 ± 10 kJ/mol for CH4, C2H4 and C3H6 formation.
When the reaction was carried out in the presence of CO2, an increase in the CO2 content led to a decrease in the Ea* of methane, ethylene and propylene formation for the iron catalyst. Conversely, for cobaltite and manganite, an increase in R = CO2/(CO2 + CO) up to 1 led to an increase in the effective activation energies of product formation.
For all catalysts, the logarithm of the equilibrium constant for the reaction in the presence of carbon dioxide is greater than for the reaction with carbon monoxide alone. The CO2 effect was most significant for GdMnO₃. The increase in the logarithms of the pre-factor suggests the presence of some compensation effect (Meyer-Neidel rule [63]), which manifests itself in heterogeneous catalytic reactions. Usually, this effect indicates that the process being studied is a multi-step process, and that the establishment of equilibrium is preceded by a so-called “pre-equilibrium” stage, e.g., adsorption equilibrium (dissociative adsorption of CO2, CO and H2; formation of surface carbonate complexes and CH particles) [37]. In the case of complex oxides GdBO3, adsorption of CO and CO2 predominantly occurs on the A-centers of perovskite [64,65] with the formation of carbonate complexes Gd2O2CO3. The dissociative adsorption of both CO and CO2 easily occurs in the case of co-hydrogenation of carbon oxides, leading to an increased concentration of CHx particles and the interaction between them to produce ethylene and propylene.
The CO2 pressure did not affect the kinetic characteristics of C2–C3+ olefin formation on all these catalysts. The specific rate dependencies of CO2 conversion and formation of carbon-containing products with respect to reactants are different for CO2 hydrogenation on different catalysts, because the substitution of a metal atom in the B-position changes the reducibility of these catalysts and/or the identity of carbon species on the catalyst surface [66]. The reducibility of catalysts and/or the identity of the surface carbon species can affect the kinetically relevant steps, active site structures, the number of unoccupied Me atoms and hence the rate dependencies. It was reported in [67] that the oxophilicity of the catalyst surface can determine the degree of surface oxygen content and its involvement in kinetically significant stages of C–H activation. Modification of the oxophilicity of catalysts by substitution of the element in the B-position led to a change in their properties [67].
As discussed above, adsorption of both CO and CO2 primarily occurs on the A-sites of perovskite, leading to the formation of carbonate complexes Gd2O2CO3 [65]. In the studied perovskites, the lattice parameters of the crystal lattice are changed, and therefore the binding energy between oxygen and metal in Gd–O–Me is also changed, which in turn affects the gadolinium–oxygen bond and is reflected in the conversions of both CO and CO2 and consequently in the product selectivity (Figure 10).
As shown in [68], the type of element in the B-position affects the mobility of oxygen and redox properties, and also changes the ratio of surface to lattice oxygen in the structure of complex oxides. Thus, the substitution of iron for cobalt or manganese leads to a decrease in the fraction of surface oxygen OS and an increase in the fraction of lattice O1. Experimental results indicate that with increasing temperature, not only surface but also lattice oxygen starts to participate in the reaction, the amount of which depends on the oxide composition, i.e., the oxidizing capacity of the samples increases in the series GdFeO3 < GdCoO3 < GdMnO3 (Figure 10).
The RWGS reaction proceeds mainly via surface carbonate intermediates, including reaction between the surface carbonates and oxygen vacancies or the diffusion of the vacancies [69]. Theoretical studies using model systems of the RWGS reaction mechanism predicted that C–O bond breaking in CO2 occurred prior to the dissociation of H2 [70]. The H2 moiety could promote the charge transfer in the Me insertion process and facilitate the dissociation of coordinated CO2 molecules by reducing the energy barrier. The rate-determining step for the reaction is the migration of the hydrogen atom from the Me center to the oxygen atom. As the metal radius increases, the overlap of filled orbitals decreases, and the binding energy of the atoms increases in the Mn–Fe–Co series. Therefore, it is expected that dissociation will be easier with decreasing d-orbital filling and decreasing atomic radius. It can be assumed that exactly Co3+, Mn3+ and Fe3+ in the Gd–O–Me bond are active centers for hydrogen adsorption. Hydrogen is known to be preferentially adsorbed and dissociative in atomic form on the surface of manganese and iron, and on cobalt in both molecular and dissociative forms [71]. The ratio between saturated and unsaturated hydrocarbons in hydrogenation products is also determined by the amount of atomic hydrogen able to migrate from some active surface sites to others and by the structure of these sites [36]. This is in good agreement with the experimental data obtained: comparable selectivity for olefins on GdFeO3 and GdMnO3 and low selectivity on GdCoO3.
When examining the specifics of the process of producing light olefins, it becomes evident that maintaining the correct balance between active H and C is crucial [72]. The large amount of *H on the surface (* denotes the adsorption state) will result in excessive hydrogenation, which can lead to methanation. Conversely, if there is not enough H on the surface, the catalyst will not be able to hydrogenate effectively, reducing its ability to convert CO2.
CO2 is first adsorbed and activated on the active Gd–O centers of perovskite to form carbonate complexes Gd2O2CO3. Hydrogen is adsorbed dissociatively/molecularly on the B–O–B centers. Then, *CO2 can be hydrogenated by adsorbed *H to form an intermediate compound *HOCO. The intermediate compound then dissociates into *OH and *CO. The *CO is then either desorbed as CO or undergoes further reactions through successive FTS. To form hydrocarbons, *CO can dissociate into *C and *O [72,73]. The *C can then be hydrogenated to *CHx at the surface. The *CHx species are precursors to the formation of olefins. The most likely pathways are the accession of *C + *CHx and *CHx + *CHx [72]. Alternative partial hydrogenation of CO to HCO seems unlikely, as oxygenates were not present in the reaction products. In short, the main stages in the conversion of CO2 into light olefins involve the breaking of C–O bonds and the formation of C–C bonds. A unique aspect of this proposed process is that there is no stage for carbide formation. X-ray analysis of the spent catalysts did not detect their presence. The structure of the catalyst framework and the presence of gadolinium prevent the formation of iron carbides, thus increasing the activity of the catalyst [31].

3. Materials and Methods

3.1. Materials

Iron, cobalt and gadolinium nitrates (Fe(NO3)3⋅9H2O, 98.5% AR; Co(NO3)3⋅9H2O, 98.5% AR; Gd(NO3)3⋅6H2O, 99.9% AR) were supplied from Vekton, St. Petersburg, Russia. Manganese nitrate (Mn(NO3)2⋅6H2O, 98% AR) was purchased from Lenreactiv, St. Petersburg, Russia. Citric acid was purchased from ALDOSA, Moscow, Russia, and was of analytical grade (AR, 99.3%). All chemicals were used as received without further purification.

3.2. Catalyst Preparation

The citrate–nitrate sol-gel method [74,75] was used for the synthesis of complex oxides. A twofold excess of citric acid was added to solutions containing stoichiometric amounts of nitrates under constant stirring. The synthesis was carried out at pH = 6. The resulting sol was heated to 393 K and kept at this temperature until a dark porous dry gel was formed. The gel was then calcined at a gradual increase in temperature to 723 K for 2 h. Gadolinium cobaltite required additional calcination at 1073 K for one hour.

3.3. Characterization

X-ray diffraction (XRD) analysis was carried out using the Rigaku MiniFlex II diffractometer (Tokyo, Japan). The operating voltage and current were 30 kV and 15 mA, respectively, and the scanning range was 2θ = 10~60°. The Cu-Kα radiation source was used, and the spectra were recorded at a scan rate of 5°/min. The ICDD-PDF2 database was used to analyze the phase composition of the studied samples.
X-ray photoelectron spectra (XPS) were recorded by Thermo Fisher Scientific (Waltham, MA, USA) Escalab 250Xi spectrometer (AlKα = 1486.6 eV, spectral resolution 0.5 eV). The C1s peak of 284.6 eV was used as the calibration peak to correct the charge effect of the sample.
Temperature-programmed reduction (TPR) was conducted using a Micrometrics AutoChem II 2920 analyzer (Micromeritics Instrument Corporation, Norcross, GA, USA). In each H2-TPR test, 50 mg of catalyst was used. The materials were loaded into a U-shaped continuous-flow quartz reactor and heated up to 1273 K at a 10 K/min rate in 10% H2/Ar gas mixture passed at a flow rate of 50 mL/min. Water vapors were captured using a trap placed in a Dewar with ethyl alcohol (T = 134 K). Hydrogen consumption was measured by TCD (thermal conductivity detector).
Thermogravimetric analysis (TGA) was performed by NETZSCH (Exton, PA, USA) STA 449 F5 in the temperature range of 303 to 1173 K (heating rate of 10 K/min) in a stream of air (rate = 50 mL·min−1).
Scanning electron microscopy (SEM) and energy-dispersive X-ray (EDS) analyses were conducted via a Zeiss Merlin system (Oberkochen, Germany).
N2 adsorption–desorption measurement was conducted using Quadrasorb SI device (Boynton Beach, FL, USA) at the liquid nitrogen temperature of 77 K. The specific surface area was calculated using the Brunner–Emmett–Teller (BET) method.

3.4. Catalytic Activity Tests

Catalytic tests were carried out in a flow reactor at atmospheric pressure, in the temperature range of 523–708 K and a feed volume rate of 1.5 L/hour (GHSV = 8700 h−1) with component ratio [(CO + CO2):H2] = 1:2, [CO2/(CO + CO2)] = 0 ÷ 1.
Powdered catalysts (0.1 g) were mixed with fine-grained quartz (dmid = 1–10 µm) in a ratio of 1:5 to avoid sintering and placed in a quartz reactor (dreactor = 1 cm) with a quartz filter to avoid particulate entrainment.
The reactants were analyzed by a Chromatec Crystal 5000 gas chromatograph (Yoshkar-Ola, Russia) equipped with a column of stainless steel filled with Porapack Q and TCD and FID detectors (with argon as a carrier gas). The rate of product formation Ri (mol/hour·g) was measured after reaching a steady state.
The catalytic characteristics were calculated using the following equations:
α i , % = n i n t n o u t n i n t × 100
S i , % = R i R i × 100
R i = n i o u t ω V m
where nin and nout are the component molar content in the input and output of the reactor, respectively; ω is the feed rate (L/h); V is the chromatograph loop volume (0.153 × 10⁻³ L); and m is the catalyst mass (g).

4. Conclusions

To summarize, we synthesized a series of GdBO3 (B = Fe, Mn, Co) perovskite-type catalysts and found that Fe/Mn-containing samples efficiently catalyzed the hydrogenation of simulated bio-syngas to light hydrocarbons. Increasing the carbon dioxide content of the reaction mixture to CO2/[CO + CO2] = 0.5 suppressed the formation of methane and favored the formation of light olefins. The hydrogenation of CO2 occurred by combining the primary reverse water–gas shift reaction to form CO and the subsequent hydrogenation of CO to produce olefins and paraffins. The GdMnO3 catalyst exhibits selectivity for C 2 3 = of up to 37% among C1+ hydrocarbons, with a maximum olefin/paraffin ratio. GdMnO3 also exhibits high conversion of CO and CO2, reaching up to 70–75% at 723 K. However, the GdFeO3 catalyst shows a lower selectivity of C 2 3 = = 22%, while it exhibits a higher conversion of CO2 up to 95% at the same temperature. Herein, we established a catalyst structure–performance relationship as a function of chemical composition. Substitution of an element in the B-position leads to a change in oxygen mobility and the ratio of surface oxygen (Os) to lattice oxygen (Ol). This is reflected in the conversion of carbon oxides as they are adsorbed on A-centers via surface oxygen. The nativity of the element in the B-position also influences the forms of hydrogen adsorption, the formation of -CHx- radicals and their subsequent recombination into olefins. The process of converting bio-syngas into light olefins involves breaking C–O bonds and forming C–C bonds. The uniqueness of the proposed technique lies in the fact that it does not lead to the formation of carbides. The analysis of spent catalysts did not reveal their presence. The framework structure and the presence of gadolinium prevent the formation of iron carbides, which, in turn, increases the activity of the catalysts.
The findings presented here provide a strategy to tune bio-syngas hydrogenation product distributions toward specific target products by varying the catalyst composition. Further detailed studies are needed to identify the active sites/phase and elucidate the underlying mechanisms, given the complexity of perovskite catalytic systems.

Supplementary Materials

The following supporting information can be downloaded at: https://www.mdpi.com/article/10.3390/catal15010067/s1, Figure S1: N2 adsorption/desorption isotherms of GdFeO3(a), GdMnO3(b) and GdCoO3(c).

Author Contributions

Conceptualization and methodology, I.A.Z. and T.F.S.; investigation, P.V.A., L.G.S., T.A.K. and E.M.B.; data curation, T.A.K.; writing—original draft, E.M.B., P.V.A., L.G.S. and T.A.K.; writing—review and editing, T.A.K., T.F.S. and I.A.Z.; supervision, A.G.C.; project administration, A.G.C.; funding acquisition, T.F.S. All authors have read and agreed to the published version of the manuscript.

Funding

This work was funded by the Russian Science Foundation, grant no. 24-29-00341, https://rscf.ru/project/24-29-00341 (accessed on 1 January 2024).

Data Availability Statement

Original data are available from authors E.M.B., T.A.K. and T.F.S.

Acknowledgments

The authors are grateful to Saint Petersburg State University Research Park. The XRD study was carried out at the Research Center for X-ray Diffraction Studies, and the XPS study was performed at the Resource Center for Studies in Surface Science. TG analysis was carried out at the Center of Thermal Analysis and Calorimetry.

Conflicts of Interest

The authors declare no conflicts of interest. The funders had no role in the design of the study; in the collection, analyses or interpretation of data; in the writing of the manuscript; or in the decision to publish the results.

References

  1. Olah, G.A.; Goeppert, A.; Prakash, G.K.S. Chemical Recycling of Carbon Dioxide to Methanol and Dimethyl Ether: From Greenhouse Gas to Renewable, Environmentally Carbon Neutral Fuels and Synthetic Hydrocarbons. J. Org. Chem. 2008, 74, 487–498. [Google Scholar] [CrossRef] [PubMed]
  2. Riduan, S.N.; Zhang, Y. Recent Developments in Carbon Dioxide Utilization under Mild Conditions. Dalton Trans. 2010, 39, 3347. [Google Scholar] [CrossRef] [PubMed]
  3. Nomoto, K.; Okazaki, T.; Beppu, K.; Shishido, T.; Amano, F. Highly Selective Formate Formation via Bicarbonate Conversions. EES. Catal. 2024, 2, 1277–1284. [Google Scholar] [CrossRef]
  4. Hirunsit, P.; Senocrate, A.; Gómez-Camacho, C.E.; Kiefer, F. From CO2 to Sustainable Aviation Fuel: Navigating the Technology Landscape. ACS Sustain. Chem. Eng. 2024, 12, 12143–12160. [Google Scholar] [CrossRef]
  5. Song, C. Global Challenges and Strategies for Control, Conversion and Utilization of CO2 for Sustainable Development Involving Energy, Catalysis, Adsorption and Chemical Processing. Catal. Today 2006, 115, 2–32. [Google Scholar] [CrossRef]
  6. Muradov, N. Low to near-zero CO2 production of hydrogen from fossil fuels: Status and perspectives. Int. J. Hydrogen Energy 2017, 42, 14058–14088. [Google Scholar] [CrossRef]
  7. dos Santos, R.G.; Alencar, A.C. Biomass-derived syngas production via gasification process and its catalytic conversion into fuels by Fischer Tropsch synthesis: A review. Int. J. Hydrogen Energy 2020, 45, 18114–18132. [Google Scholar] [CrossRef]
  8. Gutierrez-Martı´n, F.; Rodrı´guez-Anton, L.M. Power-to-SNG technologies by hydrogenation of CO2 and biomass resources: A comparative chemical engineering process analysis. Int. J. Hydrogen Energy 2019, 44, 12544–12553. [Google Scholar] [CrossRef]
  9. Haryanto, A.; Fernando, S.D.; Pordesimo, L.O.; Adhikari, S. Upgrading of syngas derived from biomass gasification: A thermodynamic analysis. Biomass Bioenergy 2009, 33, 882–889. [Google Scholar] [CrossRef]
  10. Alauddin, Z.A.B.Z.; Lahijani, P.; Mohammadi, M.; Mohamed, A.R. Gasification of lignocellulosic biomass in fluidized beds for renewable energy development: A review. Renew. Sustain. Energy Rev. 2010, 14, 2852–2862. [Google Scholar] [CrossRef]
  11. Dinca, C.; Slavu, N.; Cormos‚, C.-C.; Badea, A. CO2 capture from syngas generated by a biomass gasification power plant with chemical absorption process. Energy 2018, 149, 925–936. [Google Scholar] [CrossRef]
  12. Zhao, B.; Zhang, X.; Xu, A.; Ding, W.; Sun, L.; Chen, L.; Guan, H.; Yang, S.; Zhou, W. A study of the in-situ CO2 removal pyrolysis of Chinese herb residue for syngas production. Sci. Total Environ. 2018, 626, 703–709. [Google Scholar] [CrossRef] [PubMed]
  13. Tijmensen, M.J.A.; Faaij, A.P.C.; Hamelinck, C.N.; Van Hardeveld, M.R.M. Exploration of the possibilities for production of Fischer Tropsch liquids and power via biomass gasification. Biomass Bioenergy 2002, 23, 129–152. [Google Scholar] [CrossRef]
  14. Ma, J.; Sun, N.; Zhang, X.; Zhao, N.; Xiao, F.; Wei, W.; Sun, Y. A Short Review of Catalysis for CO2 Conversion. Catal. Today 2009, 148, 221–231. [Google Scholar] [CrossRef]
  15. Wang, W.; Wang, S.; Ma, X.; Gong, J. Recent Advances in Catalytic Hydrogenation of Carbon Dioxide. Chem. Soc. Rev. 2011, 40, 3703. [Google Scholar] [CrossRef]
  16. Zhou, Z.; Gao, P. Direct Carbon Dioxide Hydrogenation to Produce Bulk Chemicals and Liquid Fuels via Heterogeneous Catalysis. Chin. J. Catal. 2022, 43, 2045–2056. [Google Scholar] [CrossRef]
  17. Choi, Y.H.; Jang, Y.J.; Park, H.; Kim, W.Y.; Lee, Y.H.; Choi, S.H.; Lee, J.S. Carbon Dioxide Fischer-Tropsch Synthesis: A New Path to Carbon-Neutral Fuels. Appl. Catal. B Environ. 2017, 202, 605–610. [Google Scholar] [CrossRef]
  18. Guo, L.; Sun, J.; Ji, X.; Wei, J.; Wen, Z.; Yao, R.; Xu, H.; Ge, Q. Directly converting carbon dioxide to linear α-olefins on bio-promoted catalysts. Commun. Chem. 2018, 1, 11. [Google Scholar] [CrossRef]
  19. Zhang, K.; Guo, D.; Wang, X.; Qin, Y.; Hu, L.; Zhang, Y.; Zou, R.; Gao, S. Sustainable CO2 management through integrated CO2 capture and conversion. J. CO2 Util. 2023, 72, 102493. [Google Scholar] [CrossRef]
  20. Zhang, R.; Xie, Z.; Ge, Q.; Zhu, X. Recent advancements in integrating CO2 capture from flue gas and ambient air with thermal catalytic conversion for efficient CO2 utilization. J. CO2 Util. 2024, 89, 102973. [Google Scholar] [CrossRef]
  21. Latsiou, A.I.; Charisiou, N.D.; Frontistis, Z.; Goula, M.A. From CO2 to value added chemicals: The promise of single atom catalysts. Int. J. Hydrogen Energy 2024, 92, 465–481. [Google Scholar] [CrossRef]
  22. Zhang, J.; Ma, L.; Fan, S.; Zhao, T.-S.; Sun, Y. Synthesis of Light Olefins from CO Hydrogenation over Fe–Mn Catalysts: Effect of Carburization Pretreatment. Fuel 2013, 109, 116–123. [Google Scholar] [CrossRef]
  23. Kuddusi, Y.; Piveteau, L.; Mensi, M.; Cano-Blanco, D.C.; Züttel, A. Selective light olefin synthesis with high ethylene abundance via CO2 hydrogenation over (Ga-In)2O3/SSZ-13 catalysts. J. CO2 Util. 2024, 91, 103001. [Google Scholar] [CrossRef]
  24. Riedel, T.; Schaub, G.; Jun, K.-W.; Lee, K.-W. Kinetics of CO2 Hydrogenation on a K-Promoted Fe Catalyst. Ind. Eng. Chem. Res. 2001, 40, 1355–1363. [Google Scholar] [CrossRef]
  25. Porosoff, M.D.; Yan, B.; Chen, J.G. Catalytic Reduction of CO2 by H2 for Synthesis of CO, Methanol and Hydrocarbons: Challenges and Opportunities. Energy Environ. Sci. 2016, 9, 62–73. [Google Scholar] [CrossRef]
  26. Green Carbon Dioxide: Advances in CO2 Utilization; Centi, G., Perathoner, S., Eds.; Wiley: Hoboken, NJ, USA, 2014. [Google Scholar] [CrossRef]
  27. Dorner, R.W.; Hardy, D.R.; Williams, F.W.; Davis, B.H.; Willauer, H.D. Influence of Gas Feed Composition and Pressure on the Catalytic Conversion of CO2 to Hydrocarbons Using a Traditional Cobalt-Based Fischer−Tropsch Catalyst. Energy Fuels 2009, 23, 4190–4195. [Google Scholar] [CrossRef]
  28. Dorner, R.W.; Hardy, D.R.; Williams, F.W.; Willauer, H.D. K and Mn Doped Iron-Based CO2 Hydrogenation Catalysts: Detection of KAlH4 as Part of the Catalyst’s Active Phase. Appl. Catal. A Gen. 2010, 373, 112–121. [Google Scholar] [CrossRef]
  29. Matveyeva, A.N.; Omarov, S.O. Comparison of Perovskite Systems Based on AFeO3 (A = Ce, La, Y) in CO2 Hydrogenation to CO. Trans. Tianjin Univ. 2024, 30, 337–358. [Google Scholar] [CrossRef]
  30. Atta, N.F.; Galal, A.; El-Ads, E.H. Perovskite Nanomaterials—Synthesis, Characterization, and Applications. Perovskite Mater.–Synth. Characterisation Prop. Appl. 2016, 107–151. [Google Scholar] [CrossRef]
  31. Silva, C.L.S.; Marchetti, S.G.; Faro Júnior, A. da C.; de Silva, T.F.; Assaf, J.M.; do Rangel, M.C. Effect of gadolinium on the catalytic properties of iron oxides for WGSR. Catal. Today 2013, 213, 127–134. [Google Scholar] [CrossRef]
  32. Kost, V.V.; Kryuchkova, T.A.; Zimina, V.D.; Sheshko, T.F.; Cherednichenko, A.G.; Kurilkin, V.V.; Safronenko, M.G.; Yafarova, L.V. Catalytic performance of LnFeO3 complex oxides for dry reforming of methane to synthesis gas. Bulg. Chem. Commun. 2019, 51, 138–142. Available online: http://bcc.bas.bg/BCC_Contens_Volume_51-D_Special.html (accessed on 8 January 2025).
  33. Zhang, C.; Jun, K.-W.; Ha, K.-S.; Lee, Y.-J.; Kang, S.C. Efficient Utilization of Greenhouse Gases in a Gas-to-Liquids Process Combined with CO2 /Steam-Mixed Reforming and Fe-Based Fischer–Tropsch Synthesis. Environ. Sci. Technol. 2014, 48, 8251–8257. [Google Scholar] [CrossRef] [PubMed]
  34. Rafati, M.; Wang, L.; Shahbazi, A. Effect of Silica and Alumina Promoters on Co-Precipitated Fe–Cu–K Based Catalysts for the Enhancement of CO2 Utilization during Fischer–Tropsch Synthesis. J. CO2 Util. 2015, 12, 34–42. [Google Scholar] [CrossRef]
  35. Sheshko, T.F.; Borodina, E.M.; Yafarova, L.V.; Markova, E.B.; Kryuchkova, T.A.; Cherednichenko, A.G.; Zvereva, I.A.; Terent’ev, A.O. Insights into the Reactivity of Gd2−xSrxFe2O7 (x = 0 ÷ 0.4) in CO Radical Hydrogenation. Catalysts 2023, 13, 1256. [Google Scholar] [CrossRef]
  36. Sheshko, T.F.; Markova, E.B.; Sharaeva, A.A.; Kryuchkova, T.A.; Zvereva, I.A.; Chislova, I.V.; Yafarova, L.V. Carbon Monoxide Hydrogenation over Gd(Fe/Mn)O3 Perovskite-Type Catalysts. Pet. Chem. 2019, 59, 1307–1313. [Google Scholar] [CrossRef]
  37. Borodina, E.M.; Yafarova, L.V.; Kryuchkova, T.A.; Sheshko, T.F.; Cherednichenko, A.G.; Zvereva, I.A. Influences of Co-Content on the Physico-Chemical and Catalytic Properties of Perovskite GdCoxFe1−xO3 in CO Hydrogenation. Catalysts 2022, 13, 8. [Google Scholar] [CrossRef]
  38. Marezio, M.; Remeika, J.; Dernier, P. The crystal chemistry of the rare earth orthoferrites. Acta Crystallogr. 1970, 26, 2008–2022. [Google Scholar] [CrossRef]
  39. Vasquez, J.A.C.; Téllez, D.A.L.; A Collazos, C.; Rojas, J.R. Structural and magnetic characterization of the new GdMn1-xFexO3 perovskite material. J. Phys. Conf. Ser. 2016, 687, 012087. [Google Scholar] [CrossRef]
  40. Khan, H.; Ahmed, J.; Lofland, S.E.; Ramanujachary, K.V.; Ahmad, T. Synergistic Effect of Multiferroicity in GdFeO3 Nanoparticles for Significant Hydrogen Production through Photo/Electrocatalysis. Mater. Today Chem. 2023, 33, 101713. [Google Scholar] [CrossRef]
  41. Graat, P.C.J.; Somers, M.A.J. Simultaneous Determination of Composition and Thickness of Thin Iron-Oxide Films from XPS Fe 2p Spectra. Appl. Surf. Sci. 1996, 100–101, 36–40. [Google Scholar] [CrossRef]
  42. Tholkappiyan, R.; Vishista, K. Tuning the Composition and Magnetostructure of Dysprosium Iron Garnets by Co-Substitution: An XRD, FT-IR, XPS and VSM Study. Appl. Surf. Sci. 2015, 351, 1016–1024. [Google Scholar] [CrossRef]
  43. Zhao, K.; Shen, Y.; Huang, Z.; He, F.; Wei, G.; Zheng, A.; Li, H.; Zhao, Z. Different Oxidation Routes for Lattice Oxygen Recovery of Double-Perovskite Type Oxides LaSrFeCoO6 as Oxygen Carriers for Chemical Looping Steam Methane Reforming. J. Energy Chem. 2017, 26, 501–509. [Google Scholar] [CrossRef]
  44. Biesinger, M.C.; Payne, B.P.; Grosvenor, A.P.; Lau, L.W.M.; Gerson, A.R.; Smart, R.S.C. Resolving Surface Chemical States in XPS Analysis of First Row Transition Metals, Oxides and Hydroxides: Cr, Mn, Fe, Co and Ni. Appl. Surf. Sci. 2011, 257, 2717–2730. [Google Scholar] [CrossRef]
  45. Uppara, H.P.; Pasuparthy, J.S.; Pradhan, S.; Singh, S.K.; Labhsetwar, N.K.; Dasari, H. The Comparative Experimental Investigations of SrMn(Co3+/Co2+)O3±δ and SrMn(Cu2+)O3±δ Perovskites towards Soot Oxidation Activity. Mol. Catal. 2020, 482, 110665. [Google Scholar] [CrossRef]
  46. Merino, N.A.; Barbero, B.P.; Eloy, P.; Cadús, L.E. La1−xCaxCoO3 Perovskite-Type Oxides: Identification of the Surface Oxygen Species by XPS. Appl. Surf. Sci. 2006, 253, 1489–1493. [Google Scholar] [CrossRef]
  47. Wang, Y.; Ren, J.; Wang, Y.; Zhang, F.; Liu, X.; Guo, Y.; Lu, G. Nanocasted Synthesis of Mesoporous LaCoO3 Perovskite with Extremely High Surface Area and Excellent Activity in Methane Combustion. J. Phys. Chem. C 2008, 112, 15293–15298. [Google Scholar] [CrossRef]
  48. Sun, J.; Zhao, Z.; Li, Y.; Yu, X.; Zhao, L.; Li, J.; Wei, Y.; Liu, J. Synthesis and Catalytic Performance of Macroporous La1-xCexCoO3 Perovskite Oxide Catalysts with High Oxygen Mobility for Catalytic Combustion of Soot. J. Rare Earths 2020, 38, 584–593. [Google Scholar] [CrossRef]
  49. Fuwa, Y.; Wakeshima, M.; Hinatsu, Y. Crystal Structure and Magnetic Properties of a New Layered Cobalt Oxyselenide. Solid. State Commun. 2010, 150, 1698–1701. [Google Scholar] [CrossRef]
  50. Yafarova, L.V.; Silyukov, O.I.; Kryuchkova, T.A.; Sheshko, T.F.; Zvereva, I.A. The Influence of Fe Substitution in GdFeO3 on Redox and Catalytic Properties. Russ. J. Phys. Chem. 2020, 94, 2679–2684. [Google Scholar] [CrossRef]
  51. Kang, S.C.; Jun, K.-W.; Lee, Y.-J. Effects of the CO/CO2 Ratio in Synthesis Gas on the Catalytic Behavior in Fischer–Tropsch Synthesis Using K/Fe–Cu–Al Catalysts. Energy Fuels 2013, 27, 6377–6387. [Google Scholar] [CrossRef]
  52. Sonal Ahmad, E.; Upadhyayula, S.; Pant, K.K. Biomass-Derived CO2 Rich Syngas Conversion to Higher Hydrocarbon via Fischer-Tropsch Process over Fe–Co Bimetallic Catalyst. Int. J. Hydrogen Energy 2019, 44, 27741–27748. [Google Scholar] [CrossRef]
  53. Wang, Z.X.; Dong, T.; Yuan, L.X.; Kan, T.; Zhu, X.F.; Torimoto, Y.; Sadakata, M.; Li, Q.X. Characteristics of Bio-Oil-Syngas and Its Utilization in Fischer−Tropsch Synthesis. Energy Fuels 2007, 21, 2421–2432. [Google Scholar] [CrossRef]
  54. Yao, Y.; Liu, X.; Hildebrandt, D.; Glasser, D. The Effect of CO2 on a Cobalt-Based Catalyst for Low Temperature Fischer–Tropsch Synthesis. Chem. Eng. J. 2012, 193–194, 318–327. [Google Scholar] [CrossRef]
  55. Daza, Y.A.; Kuhn, J.N. CO2 Conversion by Reverse Water Gas Shift Catalysis: Comparison of Catalysts, Mechanisms and Their Consequences for CO2 Conversion to Liquid Fuels. RSC Adv. 2016, 6, 49675–49691. [Google Scholar] [CrossRef]
  56. Álvarez, A.; Bansode, A.; Urakawa, A.; Bavykina, A.V.; Wezendonk, T.A.; Makkee, M.; Gascon, J.; Kapteijn, F. Challenges in the Greener Production of Formates/Formic Acid, Methanol, and DME by Heterogeneously Catalyzed CO2 Hydrogenation Processes. Chem. Rev. 2017, 117, 9804–9838. [Google Scholar] [CrossRef] [PubMed]
  57. Ma, Z.; Porosoff, M.D. Development of Tandem Catalysts for CO2 Hydrogenation to Olefins. ACS Catal. 2019, 9, 2639–2656. [Google Scholar] [CrossRef]
  58. Ronda-Lloret, M.; Rothenberg, G.; Shiju, N.R. A Critical Look at Direct Catalytic Hydrogenation of Carbon Dioxide to Olefins. ChemSusChem 2019, 12, 3896–3914. [Google Scholar] [CrossRef]
  59. Visconti, C.G.; Lietti, L.; Tronconi, E.; Forzatti, P.; Zennaro, R.; Finocchio, E. Fischer–Tropsch Synthesis on a Co/Al2O3 Catalyst with CO2 Containing Syngas. Appl. Catal. A Gen. 2009, 355, 61–68. [Google Scholar] [CrossRef]
  60. Liang, B.; Sun, T.; Ma, J.; Duan, H.; Li, L.; Yang, X.; Zhang, Y.; Su, X.; Huang, Y.; Zhang, T. Mn Decorated Na/Fe Catalysts for CO2 Hydrogenation to Light Olefins. Catal. Sci. Technol. 2019, 9, 456–464. [Google Scholar] [CrossRef]
  61. Kulikova, M.V.; Chudakova, M.V.; Ivantsov, M.I.; Dementyva, O.S.; Maksimov, A.L. Hydrocarbon Synthesis from CO2 and H2 Using the Ultrafine Iron-Containing Catalytic Systems Based on Carbonized Cellulose. Eurasian Chem. Tech. J. 2022, 24, 149. [Google Scholar] [CrossRef]
  62. Al-Dossary, M.; Ismail, A.A.; Fierro, J.L.G.; Bouzid, H.; Al-Sayari, S.A. Effect of Mn Loading onto MnFeO Nanocomposites for the CO2 Hydrogenation Reaction. Appl. Catal. B Environ. 2015, 165, 651–660. [Google Scholar] [CrossRef]
  63. Bligaard, T.; Honkala, K.; Logadottir, A.; Nørskov, J.K.; Dahl, S.; Jacobsen, C.J.H. On the Compensation Effect in Heterogeneous Catalysis. J. Phys. Chem. B 2003, 107, 9325–9331. [Google Scholar] [CrossRef]
  64. Mota, N.; Millán Ordoñez, E.; Pawelec, B.; Fierro, J.L.G.; Navarro, R.M. Direct Synthesis of Dimethyl Ether from CO2: Recent Advances in Bifunctional/Hybrid Catalytic Systems. Catalysts 2021, 11, 411. [Google Scholar] [CrossRef]
  65. Kryuchkova, T.A.; Kost’, V.V.; Sheshko, T.F.; Chislova, I.V.; Yafarova, L.V.; Zvereva, I.A. Effect of Cobalt in GdFeO3 Catalyst Systems on Their Activity in the Dry Reforming of Methane to Synthesis Gas. Pet. Chem. 2020, 60, 609–615. [Google Scholar] [CrossRef]
  66. Malhi, H.S.; Sun, C.; Zhang, Z.; Liu, Y.; Liu, W.; Ren, P.; Tu, W.; Han, Y.-F. Catalytic Consequences of the Decoration of Sodium and Zinc Atoms during CO2 Hydrogenation to Olefins over Iron-Based Catalyst. Catal. Today 2022, 387, 28–37. [Google Scholar] [CrossRef]
  67. Tu, W.; Ghoussoub, M.; Singh, C.V.; Chin, Y.-H.C. Consequences of Surface Oxophilicity of Ni, Ni-Co, and Co Clusters on Methane Activation. J. Am. Chem. Soc. 2017, 139, 6928–6945. [Google Scholar] [CrossRef] [PubMed]
  68. Sadykov, V.A.; Bulgakov, N.N.; Muzykantov, V.S.; Kuznetsova, T.G.; Alikina, G.M.; Lukashevich, A.I.; Neophytides, S. Mobility and reactivity of the surface and lattice oxygen of some complex oxides with perovskite structure. In Mixed Ionic Electronic Conducting Perovskites for Advanced Energy Systems; Springer: Dordrecht, The Netherlands, 2004; Volume 183, pp. 53–74. [Google Scholar] [CrossRef]
  69. Goguet, A.; Meunier, F.C.; Tibiletti, D.; Breen, J.P.; Burch, R. Spectrokinetic Investigation of Reverse Water-Gas-Shift Reaction Intermediates over a Pt/CeO2 Catalyst. J. Phys. Chem. B 2004, 108, 20240–20246. [Google Scholar] [CrossRef]
  70. Mebel, A.M.; Hwang, D.-Y. Theoretical Study on the Reaction Mechanism of Nickel Atoms with Carbon Dioxide. J. Phys. Chem. A 2000, 104, 11622–11627. [Google Scholar] [CrossRef]
  71. Popova, N.M.; Babenkova, L.V.; Savel’eva, G.A. Adsorption and Interaction of the Simplest Gases with VIII Group Metals; Nauka: Alma-Ata, Kazakhstan, 1979; pp. 83–97. (In Russian) [Google Scholar]
  72. Weber, D.; He, T.; Wong, M.; Moon, C.; Zhang, A.; Foley, N.; Ramer, N.J.; Zhang, C. Recent Advances in the Mitigation of the Catalyst Deactivation of CO2 Hydrogenation to Light Olefins. Catalysts 2021, 11, 1447. [Google Scholar] [CrossRef]
  73. Li, W.H.; Wang, H.Z.; Jiang, X.; Zhu, J.; Liu, Z.M.; Guo, X.W.; Song, C.S. A short review of recent advances in CO2 hydrogenation to hydrocarbons over heterogeneous catalysts. RCS Adv. 2018, 8, 7651–7669. [Google Scholar] [CrossRef]
  74. Chislova, I.V.; Matveeva, A.A.; Volkova, A.V.; Zvereva, I.A. Sol-Gel Synthesis of Nanostructured Perovskite-like Gadolinium Ferrites. Glass Phys. Chem. 2011, 37, 653–660. [Google Scholar] [CrossRef]
  75. Yafarova, L.V.; Chislova, I.V.; Zvereva, I.A.; Kryuchkova, T.A.; Kost, V.V.; Sheshko, T.F. Sol–gel synthesis and investigation of catalysts on the basis of perovskite-type oxides GdMO3 (M = Fe, Co). J. Sol-Gel Sci. Technol. 2019, 92, 264–272. [Google Scholar] [CrossRef]
Figure 1. XRD patterns of the GdFeO3, GdMnO3 and GdCoO3 oxides: (a) fresh; (b) spent.
Catalysts 15 00067 g001
Figure 2. SEM images of the fresh (ac) and spent (df) GdFeO3 (a,d), GdMnO3 (b,f) and GdCoO3 (c,e) catalysts.
Catalysts 15 00067 g002
Figure 3. Survey XPS spectrum for compounds of the GdFeO3 (a), GdMnO3 (b) and GdCoO3 (c), and identification of the main photoelectron lines.
Catalysts 15 00067 g003
Figure 4. XPS spectra (Fe2p, Co2p and Mn2p region) of GdFeO3, GdCoO3 and GdMnO3.
Catalysts 15 00067 g004
Figure 5. O1s spectra for GdFeO3, GdMnO3 and GdCoO3.
Catalysts 15 00067 g005
Figure 6. H2-TPR curves of GdBO3 (B = Fe, Mn, Co) and cobalt, manganese and iron oxides.
Catalysts 15 00067 g006
Figure 7. Temperature dependencies of CO (ac) and CO2 (df) conversion on GdFeO3 (a,d), GdMnO3 (b,f) and GdCoO3 (c,e).
Catalysts 15 00067 g007
Figure 8. Distribution of hydrogenation products at 723 K from R = CO2/(CO2 + CO) for GdFeO3, GdMnO3 and GdCoO3.
Catalysts 15 00067 g008
Figure 9. Selectivity for C 2 3 = olefins as a function of CO2 content in the reaction mixture (a) on GdFeO3, GdMnO3 and GdCoO3 at 573 (b) and 723 K (c).
Catalysts 15 00067 g009
Figure 10. Selectivity for C2–C3 olefins and crystal lattice parameters (a); the proportion of surface oxygen (Os) and lattice oxygen (Ol) (b).
Catalysts 15 00067 g010
Table 1. Structural parameters, surface composition by X-ray spectral microanalysis and specific surface area by BET of GdBO3 compounds (B = Fe; Mn; Co).
CompoundLattice Parameters (Å)Crystallite Size (nm)Space Content (at%)SBET 
(m2/g)
GroupGdBO
GdFeO3a = 5.606
b = 7.671
c = 5.352
53.4Pnma (62)18.5319.1562.324.6
GdMnO3a = 5.847
b = 7.435
c = 5.312
55.9Pnma (62)14.6014.0465.178.5
Table 2. The XPS data of the surface composition and atomic states of the studied perovskites.
CompoundContent (at%)
GdBB2+/(B2++B3+)OSOLOS/OL
GdFeO323.6016.320.6436.2723.801.52
GdMnO318.2024.90-22.9833.930.67
GdCoO318.1921.990.4726.6132.210.83
Table 3. Temperature reduction and quantitative analysis curves of temperature-programmed reduction of GdBO3 (B = Fe, Mn, Co).
OxidesTemperature (K)H2 Consumption, mmol/g
Peak 1Peak 1Peak 1Peak 1Total
GdFeO3741 K (Fe3+→Fe+2)1217 K (Fe2+→Fe0)141752893
GdMnO3739 K (Mn4+→Mn3+)998 K (Mn3+→Mn2+)286528814
GdCoO3707 K (Co3+→Co+2)834 K (Co2+→Co0)381592973
Table 4. Values of activation energies and pre-exponential multipliers of the investigated catalysts for methane, ethylene and propylene.
R = CO2/(CO2 + CO)CH4 C2H4C3H6
Ea, kJ/mollnK0 Ea, kJ/mollnK0Ea, kJ/mollnK0
GdFeO3
0304.74346.37 445.94
0.33226.28 297.07 396.70
0.50226.45 307.01 387.20
0.67216.57 287.32 387.26
1.00206.52 287.60 426.79
GdMnO3
0671.57893.4787 11.7
0.33746.479315.017415.9
0.507310.7739.6074 9.1
0.6773 16.68118.909112.5
1.00546.51 7715.17 7312.9
GdCoO3
0332.15365.74 357.13
0.33381.48464.19 436.27
0.50391.08463.80 455.43
0.67381.79435.23 416.98
1.00312.94356.89 407.35
Disclaimer/Publisher’s Note: The statements, opinions and data contained in all publications are solely those of the individual author(s) and contributor(s) and not of MDPI and/or the editor(s). MDPI and/or the editor(s) disclaim responsibility for any injury to people or property resulting from any ideas, methods, instructions or products referred to in the content.

