Article

Design of Experiments for Process Optimization of the Direct Wacker-Type Oxidation of 1-Decene to n-Decanal

1
Circular Transformation Lab, TH Köln-University of Applied Sciences, 51379 Leverkusen, Germany
2
Bell-Consulting, Tempelstraße 2A, 50679 Köln, Germany
*
Author to whom correspondence should be addressed.
Catalysts 2024, 14(6), 360; https://doi.org/10.3390/catal14060360
Submission received: 29 April 2024 / Revised: 23 May 2024 / Accepted: 27 May 2024 / Published: 31 May 2024
(This article belongs to the Special Issue Catalysis for Functionalization Reaction of Hydrocarbons Compounds)

Abstract

:
The rapid increase in the use and development of statistical design of experiments (DoE), particularly in pharmaceutical process development, has become increasingly important over the last decades. This rise aligns with Green Chemistry Principles, seeking reduced resource usage and heightened efficiency. In this study, we employed a comprehensive design of experiments (DoE) approach to optimize the catalytic conversion of 1-decene to n-decanal through direct Wacker-type oxidation using the previously determined efficient PdCl2(MeCN)2 catalytic system. The aim was to maximize selectivity and conversion efficiency. Through systematic variation of seven factors, including substrate amount, catalyst and co-catalyst amount, reaction temperature, reaction time, homogenization temperature, and water content, this study identified critical parameters influencing the process to direct the reaction toward the desired product. The statistical analysis revealed high significance for both selectivity and conversion, with surface diagrams illustrating optimal conditions. Notably, catalyst amount emerged as a pivotal factor influencing conversion, with reaction temperature and co-catalyst amount significantly affecting both conversion efficiency and selectivity. The refined model demonstrated strong correlations between predicted and observed values, highlighting the impact of these factors on both selectivity and conversion.

1. Introduction

New synthetic methodologies are crucial in academic chemistry, focusing on discovering novel reactions and improving existing transformations. These advancements determine the accessibility of molecules for practical applications across various fields, such as pharmaceuticals, agrochemicals, and functional materials [1]. The adoption of statistical design of experiments (DoE) has become a powerful strategy for optimizing chemical processes, experiencing a significant increase in its usage, especially within pharmaceutical process development, over the past decades [2,3]. Despite the widespread application of well-established statistical methodologies for reaction optimization within industrial contexts, their integration into academic chemistry has been notably limited [1,4,5,6].
This rise in statistical method application can be attributed to various factors, including a growing adherence to Green Chemistry Principles, advocating for reduced solvent and reagent usage, increased process efficiency, and minimizing the amount of chemical waste [7,8]. Technological advancements, particularly in parallel reactors and analytical assays/instrumentation, have mitigated challenges associated with setting up the multiple reactions required by design of experiments [9].
Statistical DoE comprises fundamental methodologies for efficiently organizing experiments to extract meaningful information with a limited number of runs [10]. Originating as a pivotal tool for transforming data into actionable insights, statistical DoE encompasses various classical designs, such as full factorial, fractional factorial, screening, Plackett–Burman [11], Box–Behnken [12], central composite designs [13], orthogonal arrays [14], and optimal designs [15]. Fractional factorial experiments are particularly relevant when evaluating all possible factor settings is impractical. Regression or correlation analysis serves to delineate the robustness of the relationship between input variables and the output within the studied system [16]. These methodologies are rooted in seminal works, such as those by Box, Hunter, and Hunter (1978) [17], Montgomery (1984) [7], Hedayat, Sloane, and Stufken (1999) [18], and Lucas (1994) [19].
This heightened adoption of DoE in process chemistry represents the overcoming of perceived barriers, establishing it as a prevalent and influential tool. In contrast to the conventional one-factor-at-a-time (OFAT) optimization approach, which has inherent limitations, DoE offers distinct advantages [20,21]. OFAT often fails to reveal optimal conditions due to its dependence on the starting point and struggles to differentiate inherent system variation from genuine improvement without a substantial number of repeated reactions. DoE, with its systematic approach, minimizes researcher bias, often proposing unconsidered reaction conditions [22].
Its primary strength lies in its ability to detect how interactions between factors affect product yield and quality. The simultaneous variation of parameters makes the DoE approach more efficient compared to the traditional OFAT methodology. Instances of employing DoE in chemical problem-solving trace back to process development, particularly in optimizing reaction protocols crucial to the success of drug manufacturing processes. The swift discovery of robust and reliable protocols has significant financial implications, making DoE pivotal for achieving time and cost savings, compared to conventional methods. The synergy of DoE with automated reaction systems has notably enhanced its efficacy, enabling the identification of optimal reaction conditions within shortened timeframes (weeks, as opposed to months). Owen et al. comprehensively outlined the application of DoE in the realm of development chemistry, providing an instructive guide that essentially serves as a blueprint for researchers aiming to utilize DoE for the optimization of chemical processes [23,24]. Realizing the full potential of a DoE depends upon the systematic execution of a predefined workflow [25].
The process of conducting a design of experiments (DoE) involves several key steps, as outline below.
The first step, objective definition, entails identifying process issues, often focusing on process optimization or understanding robustness around fixed conditions, probing the impact of minimal changes in continuous factors. Secondly, factor/variable definition and range specification involve selecting resource-dependent factors for inclusion in DoE, guided by existing process knowledge. Factors are categorized into impactful groups with assigned high and low settings, creating a practical design space. In the third step, response definition establishes measurable outcomes, such as reaction yield and conversion, with multifaceted responses within a single DoE study. Accuracy and reproducibility are ensured through center-point experiments conducted in triplicate. The following step, experimental design selection, requires choosing an appropriate design based on objectives and resources. Screening designs provide qualitative insights and rank factors by impact, while subsequent optimization designs yield a comprehensive response surface model. The next step, reaction worksheet generation, requires inputting information into software to generate a reaction list, considering practical constraints that may require randomized run orders. Subsequently, reaction execution/data collection involves performing reactions under controlled conditions, possibly in blocks, to mitigate bias from variation in starting materials. The following step, data input/software analysis, includes inputting results for individual response analysis, selecting a mathematical model based on key metrics, such as p-values and R-squared terms, to predict outcomes within the design space. Finally, the achieved results lead to reaction confirmation, which requires experimentally validating ideal conditions suggested by DoE analysis to ensure model reliability and reproducibility within the study’s scope.

Reaction System

An aldehyde of great commercial importance is n-decanal. Due to its strong citrus odor, n-decanal is primarily used as a perfume and fragrance in floral fragrances, in the manufacture of artificial citrus oils, and as an artificial citrus flavor in the food industry [26,27]. Today, n-decanal is mainly obtained petrochemically by the Shell Higher Olefin Process (SHOP), in which n-octene is produced from ethene, followed by hydroformylation of n-octene to n-nonanol with synthesis gas and a subsequent hydrogenation to n-nonanal. In a following dehydration step, n-nonene is formed, which is finally converted into n-decanal in a further hydroformylation step with a synthesis gas of fossil origin [28]. Here, a new route to n-decanal is proposed: to convert 1-decene from renewable resources via Tsuji–Wacker oxidation [29,30].
This study aims to optimize a catalytic reaction involving the conversion of 1-decene to n-decanal using a predetermined homogeneous catalyst system. Specifically, PdCl2(MeCN)2 is selected as the catalyst to drive the desired chemical transformation, with CuCl2 employed as a co-catalyst to enhance catalytic efficiency and selectivity.
The new synthesis route to n-decanal offers several advantages over the conventional petrochemical process. It utilizes renewable resources, such as 1-decene. The market size of 1-decene is estimated to range between 500,000 and 700,000 tons per year, as reported by Kohl [31]. Ethenolysis, a chemical process employed by Verbio GmbH to produce 1-decene, involves the degradation of terminal olefins and can be characterized as a type of cross-metathesis. The new route to n-decanal utilizing green 1-decene employs the environmentally friendly Tsuji–Wacker oxidation method, potentially utilizing green oxygen obtained from water splitting, and drastically reduces the amount of reaction steps needed. This approach reduces reliance on fossil resources, minimizes unwanted by-products, and addresses environmental and climate concerns associated with traditional petrochemical synthesis routes. The Wacker oxidation of terminal alkenes typically leads to the formation of methyl ketones (Markovnikov product (1)) with high regioselectivity, unless the substrate contains coordinating groups that can direct the palladium to the inner carbon atom [32], or a suitable ligand on the palladium catalyst, minimizing the transition state activation energy of the anti-Markovnikov reaction. In this study, the objective is to redirect the regioselectivity of the reaction toward the aldehyde (anti-Markovnikov product (2)) by optimizing the reaction parameters using a predetermined homogeneous catalyst. The two possible products of such a catalyzed Wacker-type oxidation [33] are shown in Scheme 1.
Catalytic efficiency can be characterized by three fundamental parameters: activity, selectivity, and stability. These key parameters serve to assess and quantify the catalyst’s performance in facilitating chemical reactions. Selectivity is the most important criterion when considering the efficiency of a catalytic process. Selective reactions consume fewer reactants, avoid the need for costly separations, and produce no potentially environmentally harmful by-products [34].
In certain instances, selective synthesis of aldehydes has been observed, albeit typically leading to low product yields. However, these instances are limited to scenarios where the olefin bears a functional group directing the reaction or when stoichiometric palladium or an excess of hetero-polyacid are utilized, highlighting the challenges in achieving aldehyde selectivity [32,35,36,37,38]. The reaction also yields an aldehyde as a by-product in a ratio of 95:5 (M:AM) [39]. Oxidation of the alkene’s double bond generates both the ketone (as the Markovnikov product) and the aldehyde (as the anti-Markovnikov product). Terminal alkene substrates in Wacker oxidation predominantly yield methyl ketones with significant regioselectivity, unless the substrate incorporates coordinating groups that direct palladium to the internal carbon atom. Accordingly, there arises a demand for the development of a straightforward yet effective procedure to directly transform olefins into aldehydes, ensuring high yields and selectivity. While prior studies have achieved moderate aldehyde selectivity through styrene Wacker oxidations, these methods have required either super-stoichiometric hetero-polyacids (HPA) containing 12 equivalents of metal per mole of HPA or stoichiometric amounts of palladium [32,38,40,41]. The aim of this work is a chemical transformation that proceeds efficiently and selectively from the starting material (1-decene) to the desired product (n-decanal) without the need for extensive intermediate steps or additional functionalization of the substrate.
One approach to achieve higher anti-Markovnikov selectivity, for example, is to use a bulky alcohol as the oxygen nucleophile, leading to preferential attack at the less hindered end of the alkene. Subsequent hydride elimination of the organopalladium intermediate yields the enol ether of the corresponding aldehyde [42,43]. Teo et al. previously demonstrated that employing the PdCl2(MeCN)2 catalyst and introducing benzoquinone into the reaction of an aryl-substituted olefin can elevate the yield and selectivity of the anti-Markovnikov product to levels as high as 96% and 99%, respectively [44]. Furthermore, a study by Feringa et al. investigated the catalytic oxidation of alk-1-enes to aldehydes, highlighting the successful application of a modified palladium-nitro complex catalyst. Specifically focusing on dec-1-ene, the oxidation reaction yielded a mixture of decan-1-al and decan-2-one in a ratio of 60:40, achieving a remarkable yield of 280% based on palladium in just 66 min [45].

2. Results and Calculations

2.1. Original Conditions

The results presented herein showcase the initial outcomes of the catalytic conversion process using PdCl2(MeCN)2 as the catalyst, with a reaction temperature of 50 °C, 1 mL of substrate, 26 mg of catalyst, 40 mg of co-catalyst, and a reaction time of 1 h. The conversion (X) of the starting material 1-decene was observed to be 32.3%, while the selectivity (S) toward the desired product (n-decanal) was measured at 1.3%, with a ratio of anti-Markovnikov to Markovnikov product of 68:32. These preliminary results underscore the need for optimization to enhance both the conversion efficiency and selectivity of the desired product. By analyzing these initial conditions, we identified key parameters that influenced the reaction outcome and subsequently developed a systematic approach for optimizing the catalytic process. The following sections will delve into detailed data analysis, statistical interpretation, and optimization strategies aimed at improving the overall performance of the catalytic system.

2.2. Seven-Factor DoE Results

The results of the first seven-factor DoE indicate that, based on the selection criterion (p-value < 0.050; VIF = 1.00), the system was statistically significant for both selectivity and conversion, also supported by the consideration of the residual plots, shown in Figures S3–S5 of the Supplementary Materials. A VIF value of 1.00 indicates that there is no correlation issue between the corresponding predictor variable and other variables in the model. Key factors influencing selectivity included the substrate amount, reaction temperature, catalyst amount, co-catalyst amount, reaction time, and water content. For conversion, critical factors included the substrate amount, catalyst amount, reaction time, and water content. These insights provide a foundation for optimizing the chemical process, emphasizing the importance of the identified factors in achieving desired outcomes. Figure 1 depicts a surface diagram (A)–(F) for selectivity and conversion in decimal values (0–1) for the significant factors.
The model demonstrated a high coefficient of determination (R-squared) for both selectivity (85.26%) and conversion (85.33%), as shown in Tables S1 and S3 of the Supplementary Materials, indicating a strong correlation between the predicted and observed values. The results showed a clear optimum in terms of selectivity for the respective factors. The conversion values ranged from approximately 31.21% to 99.24%, while selectivity values varied between 0.00% and 11.70%. The highest conversion observed was 99.24%. On the other hand, selectivity peaked at 11.70% in another entry, reflecting optimal reaction conditions for producing the desired product. This study achieved aldehyde-to-ketone ratios of up to 70:30, which is consistent with findings from previous studies with different substrates or modified catalysts. The p-value is the probability of observing a test statistic as extreme as, or more extreme than, the one observed in the data, assuming that the null hypothesis is true. When set at a significance level α of 0.05, a p-value below 0.05 indicates statistical significance, suggesting that the observed results are unlikely to have occurred by chance alone. Statistically significant influence factors were determined as the substrate amount (p = 0.000), reaction temperature (p = 0.040), catalyst amount (p = 0.000), co-catalyst amount (p = 0.249), included because of the two-way interaction despite being over the p-value limit to avoid conflicts, reaction time (p = 0.741), also included because of the two-way interaction, and water content (p = 0.000). Additionally, the following two-way interactions of those factors were also determined as significant: substrate amount*catalyst amount (p = 0.001), substrate amount*water content (p = 0.002), reaction temperature*reaction time (p = 0.015), and catalyst amount*co-catalyst amount (p = 0.013). The inclusion of co-catalyst amount and reaction time in the model was crucial, even though their p-values exceeded 0.05, as they exhibited cross-influence when combined with other factors in the system.
For the conversion, the statistically significant influence factors included substrate amount (p = 0.000), catalyst amount (p = 0.000), reaction time (p = 0.024), water content (p = 0.002), as well as the two-way interactions of the factors, substrate amount*catalyst amount (p = 0.000), substrate amount*water content (p = 0.015), and catalyst amount*water content (p = 0.004). Additionally, the p-values for central-point experiments, 0.829 for selectivity and 0.963 for conversion, suggested a high linear reliability of the model. These results are further detailed in Table 1 and Table 2.
For the selectivity analysis, substrate amount displayed a negative correlation with selectivity, indicating that higher substrate amounts corresponded to lower selectivity. Conversely, increases in reaction temperature, catalyst amount, and substrate amount*water content positively influenced selectivity. Notably, the interaction terms also contributed significantly to selectivity, as shown in Figure 2. The model demonstrated an explanatory power of 85.26% regarding the variance in selectivity. For the conversion analysis, substrate amount exhibited an inverse relationship with conversion, implying that higher substrate amounts led to lower conversion rates. Conversely, increases in the catalyst amount, reaction time, water content, and the interaction terms positively affected conversion, as shown in Figure 3. The model accounted for 85.33% of the variance in conversion.
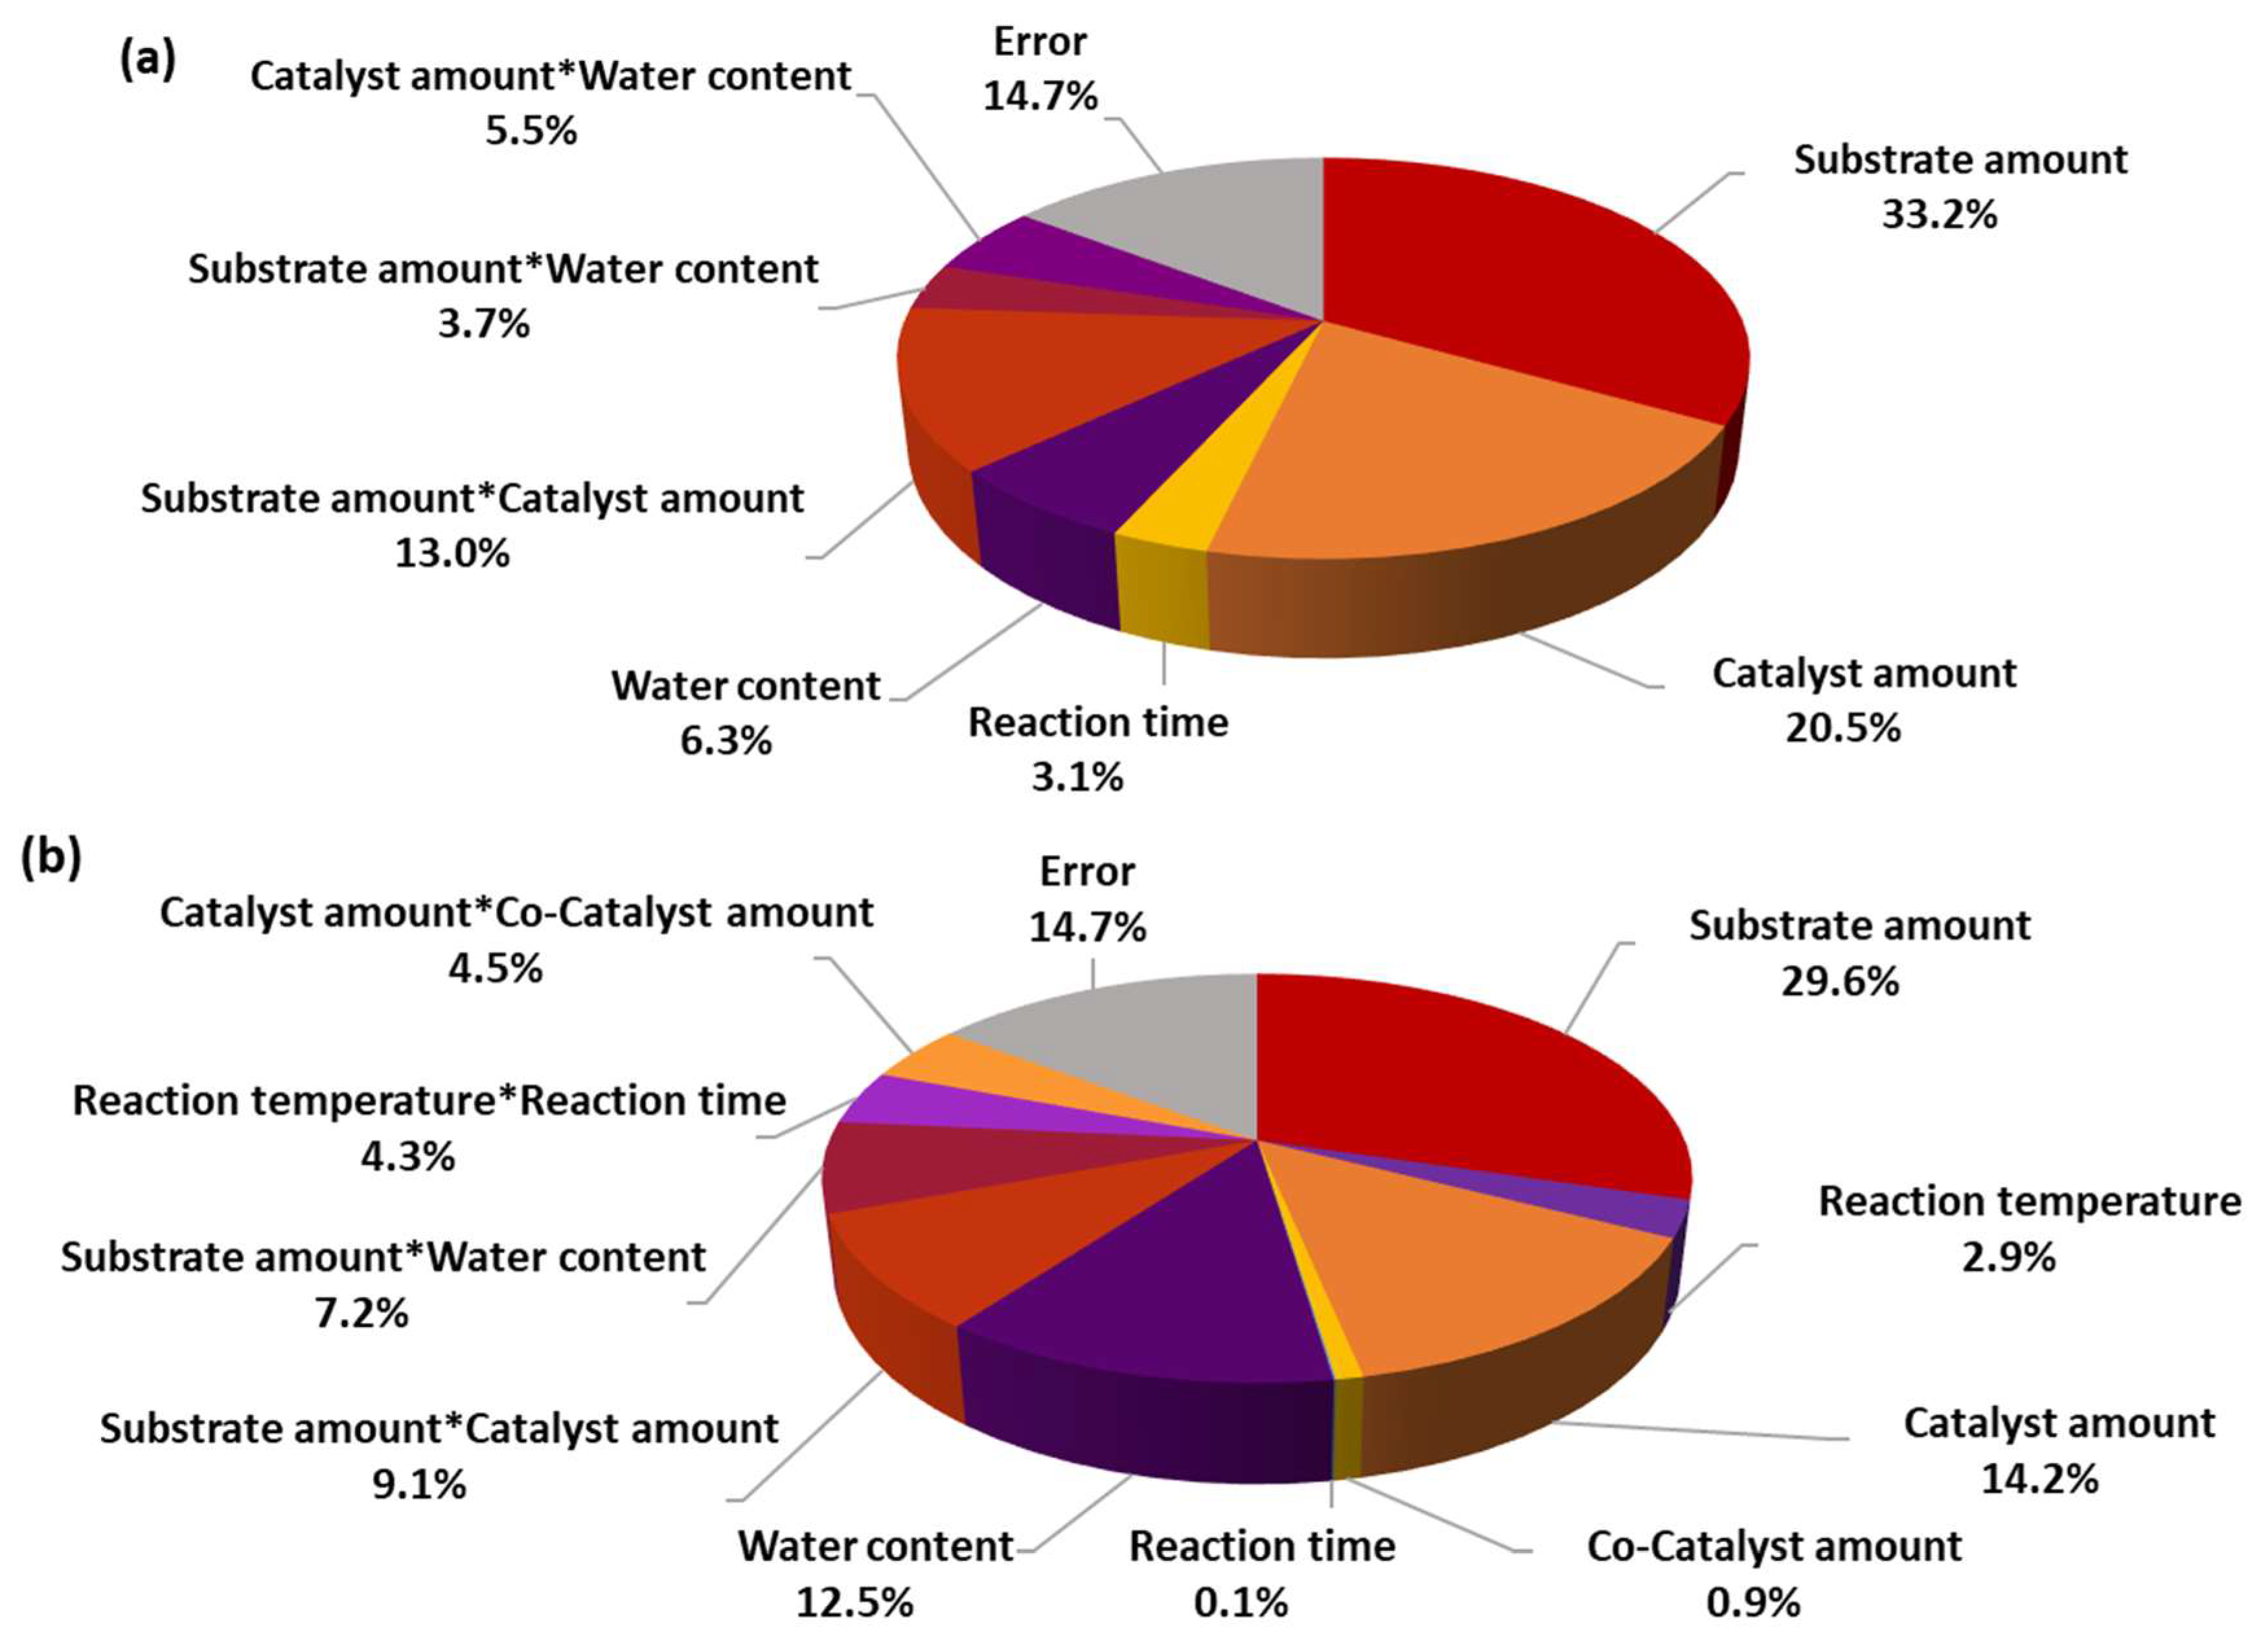
Each factor’s variance and adjusted sum of squares (Adj SS) are provided in relation to each other in Figure 4 and can also be found in Tables S2 and S4 of the Supplementary Materials. Adj SS is used to quantify the amount of variation in the dependent variable that is explained by the independent variables, while adjusting for the number of predictors in the model. It accounts for the degrees of freedom and the complexity of the model, providing a more accurate assessment of the model’s goodness of fit compared to the unadjusted sum of squares. Adjusted sum of squares helps in comparing different models and selecting the most appropriate one for predicting the dependent variable, while disadvantaging overly complex models that may overfit the data. For conversion, the most influential factors included the substrate amount, catalyst amount, reaction time, and water content, as evidenced by their higher variance and adjusted sum of squares. These factors had statistically significant effects on the conversion process, as indicated by their low p-values (p < 0.05) and their high percentages. Similarly, for selectivity, substrate amount, reaction temperature, catalyst amount, and water content were the primary influencing factors. They exhibited higher variance and adjusted sum of squares, suggesting significant effects on selectivity. Notably, the interaction between substrate amount and catalyst amount also played a substantial role in determining selectivity. The analysis revealed that substrate amount and catalyst amount had significant effects on both conversion and selectivity, underscoring their importance in the chemical process. Additionally, water content emerged as a critical factor affecting both conversion and selectivity.
These results led to the conception of a further investigation plan, in which the water content, substrate amount, and reaction time were set as low as possible.

2.3. Results of Optimization

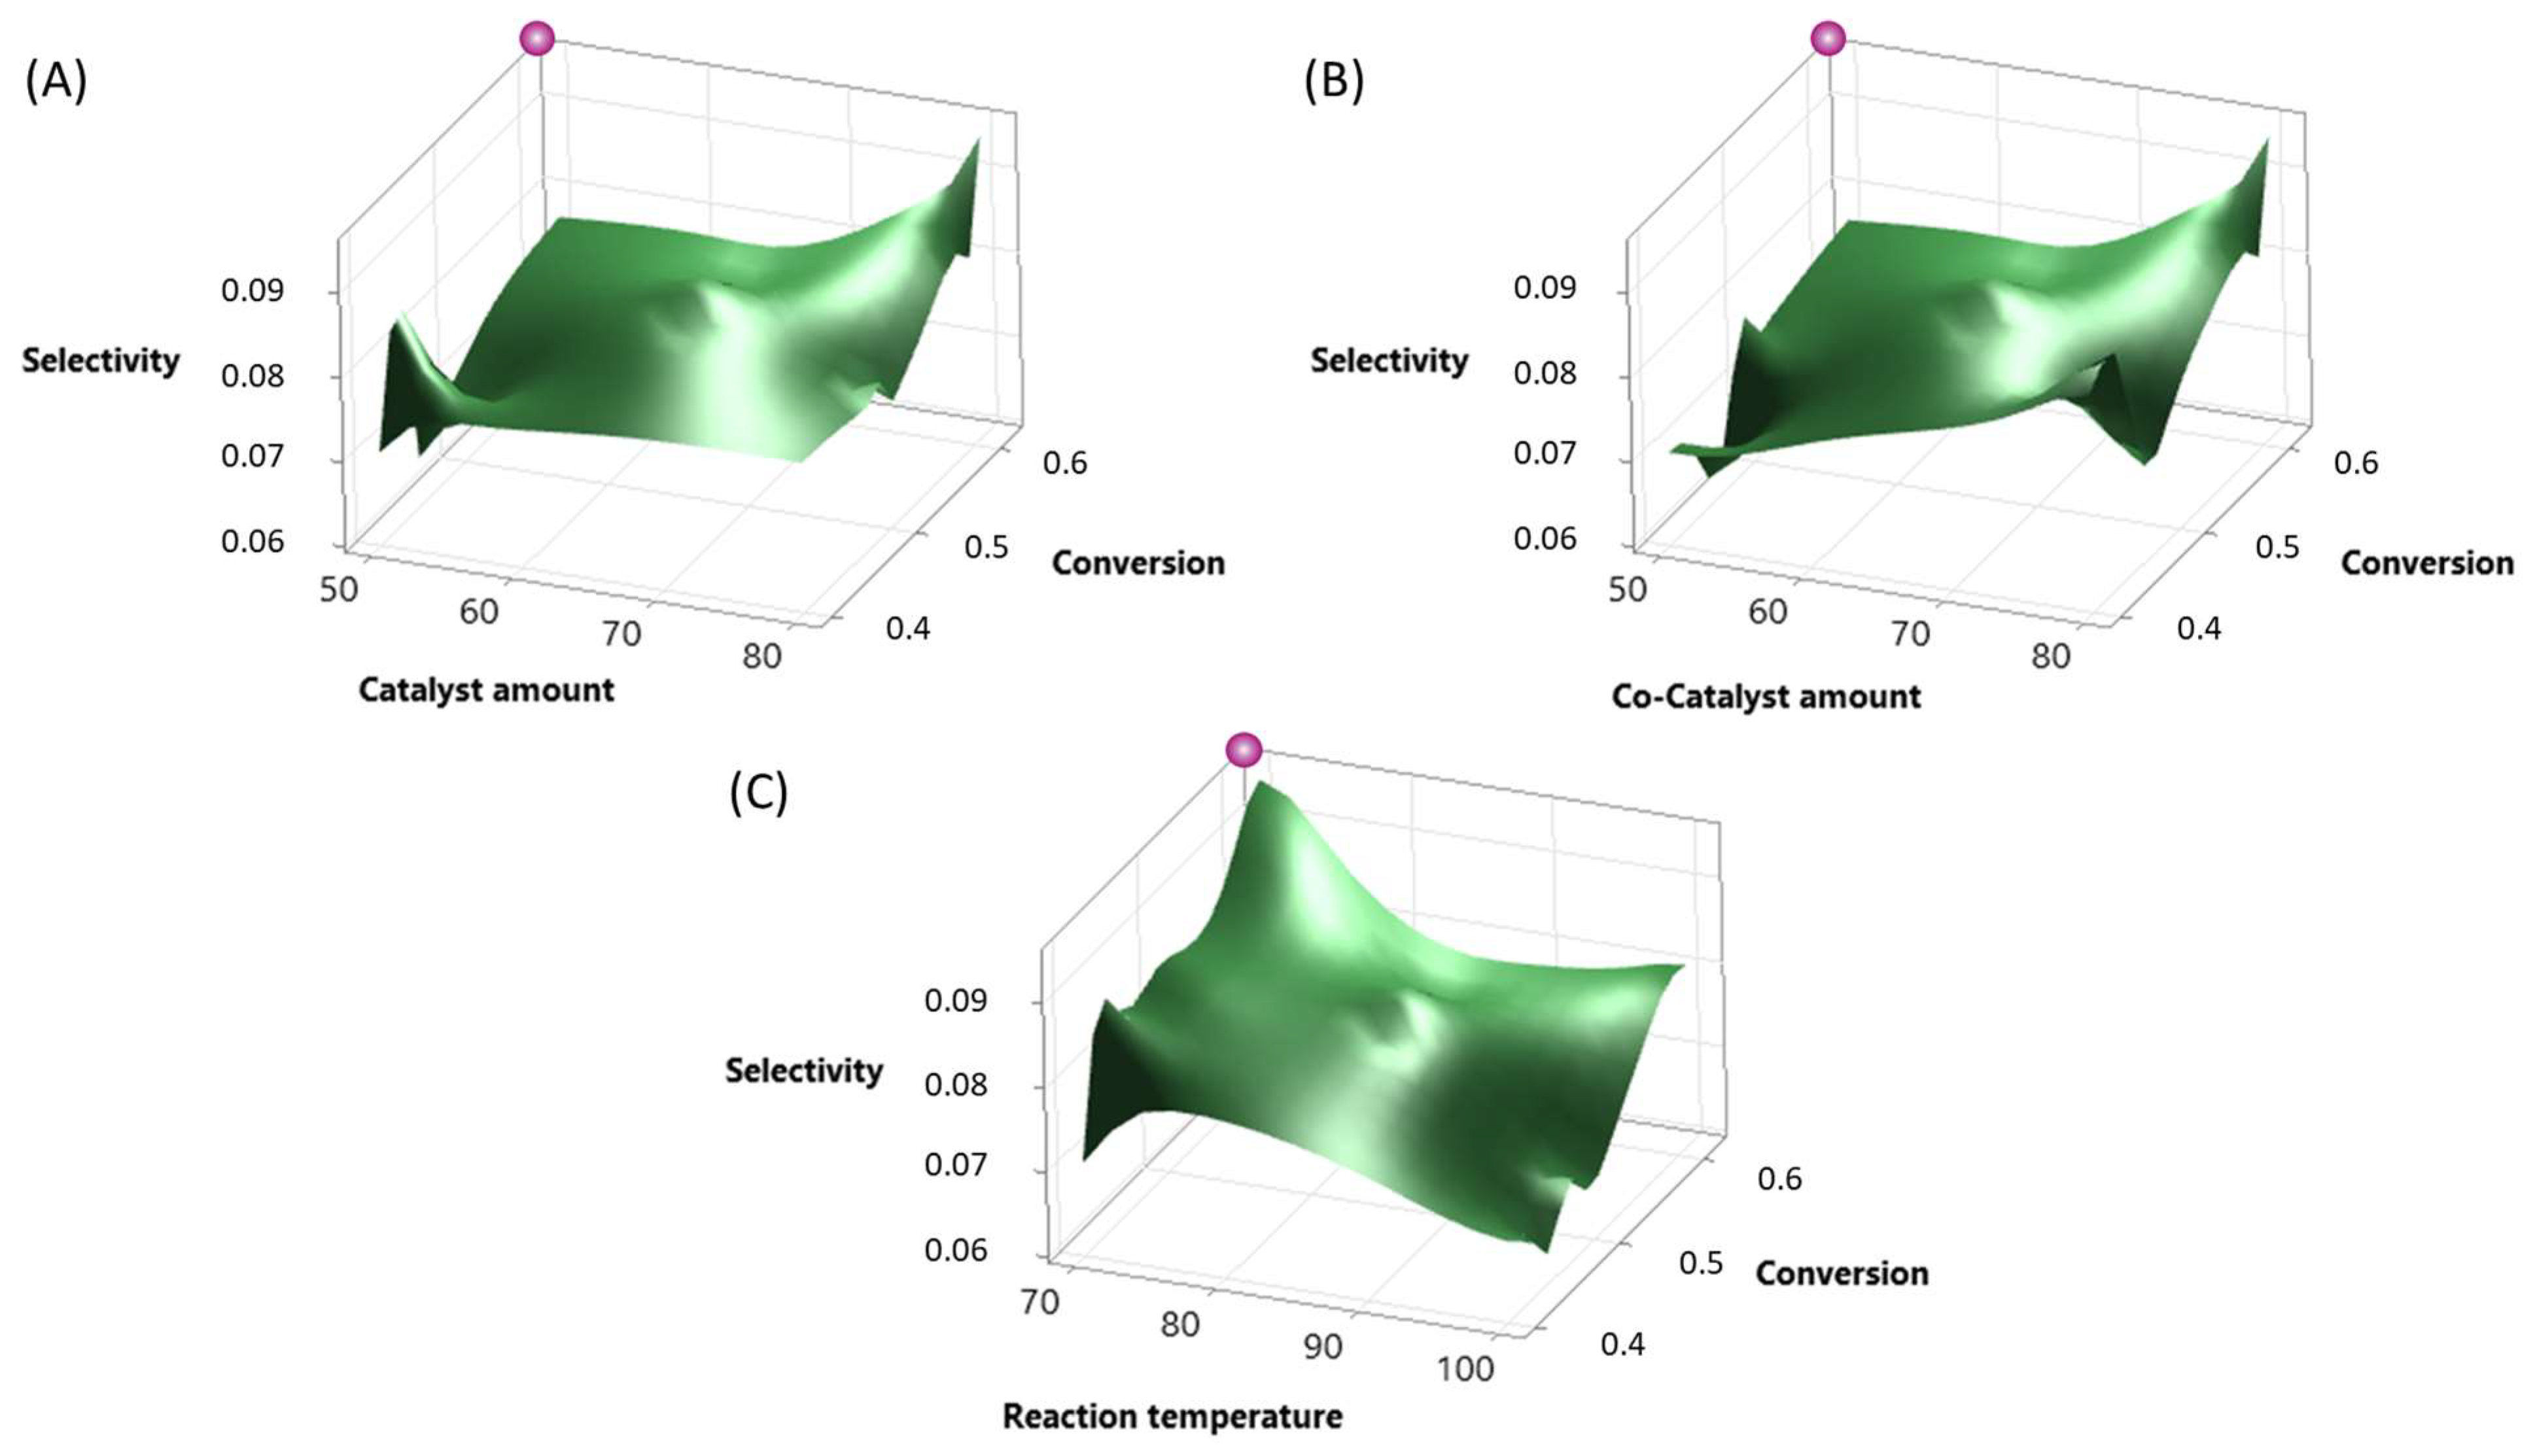
The analysis of the reaction system optimization underscored its statistical significance in terms of both selectivity and conversion, as evidenced by a selection criterion of p-value < 0.050 and VIF = 1.00, indicating the absence of correlation issues among predictor variables also supported by the consideration of the residual plots, as shown in Figures S7–S9 of the Supplementary Materials. Notably, key factors affecting selectivity and conversion, as determined previously, encompassed substrate amount, reaction temperature, catalyst amount, co-catalyst amount, reaction time, and water content, emphasizing the relevance of catalyst amount, co-catalyst amount, and reaction temperature for further optimization efforts. The model demonstrated a high coefficient of determination (R-squared) for both selectivity (94.50%) and conversion (79.44%), as shown in Tables S5 and S7 of the Supplementary Materials, indicating a strong correlation between the predicted and observed values. The regression analysis indicated significant coefficients for reaction temperature, catalyst amount, and co-catalyst amount, suggesting their influence on the response variable. Figure 5 depicts a surface diagram (A)–(C) for selectivity and conversion in decimal values (0–1) for the significant factors of the optimization experiments.
Statistically significant influence factors studied in this second DoE were determined as reaction temperature (p = 0.000), catalyst amount (p = 0.004), and co-catalyst amount (p = 0.004) for selectivity, as well as catalyst amount (p = 0.002) and co-catalyst amount (p = 0.033) for conversion. These results are further detailed in Table 3 and Table 4.
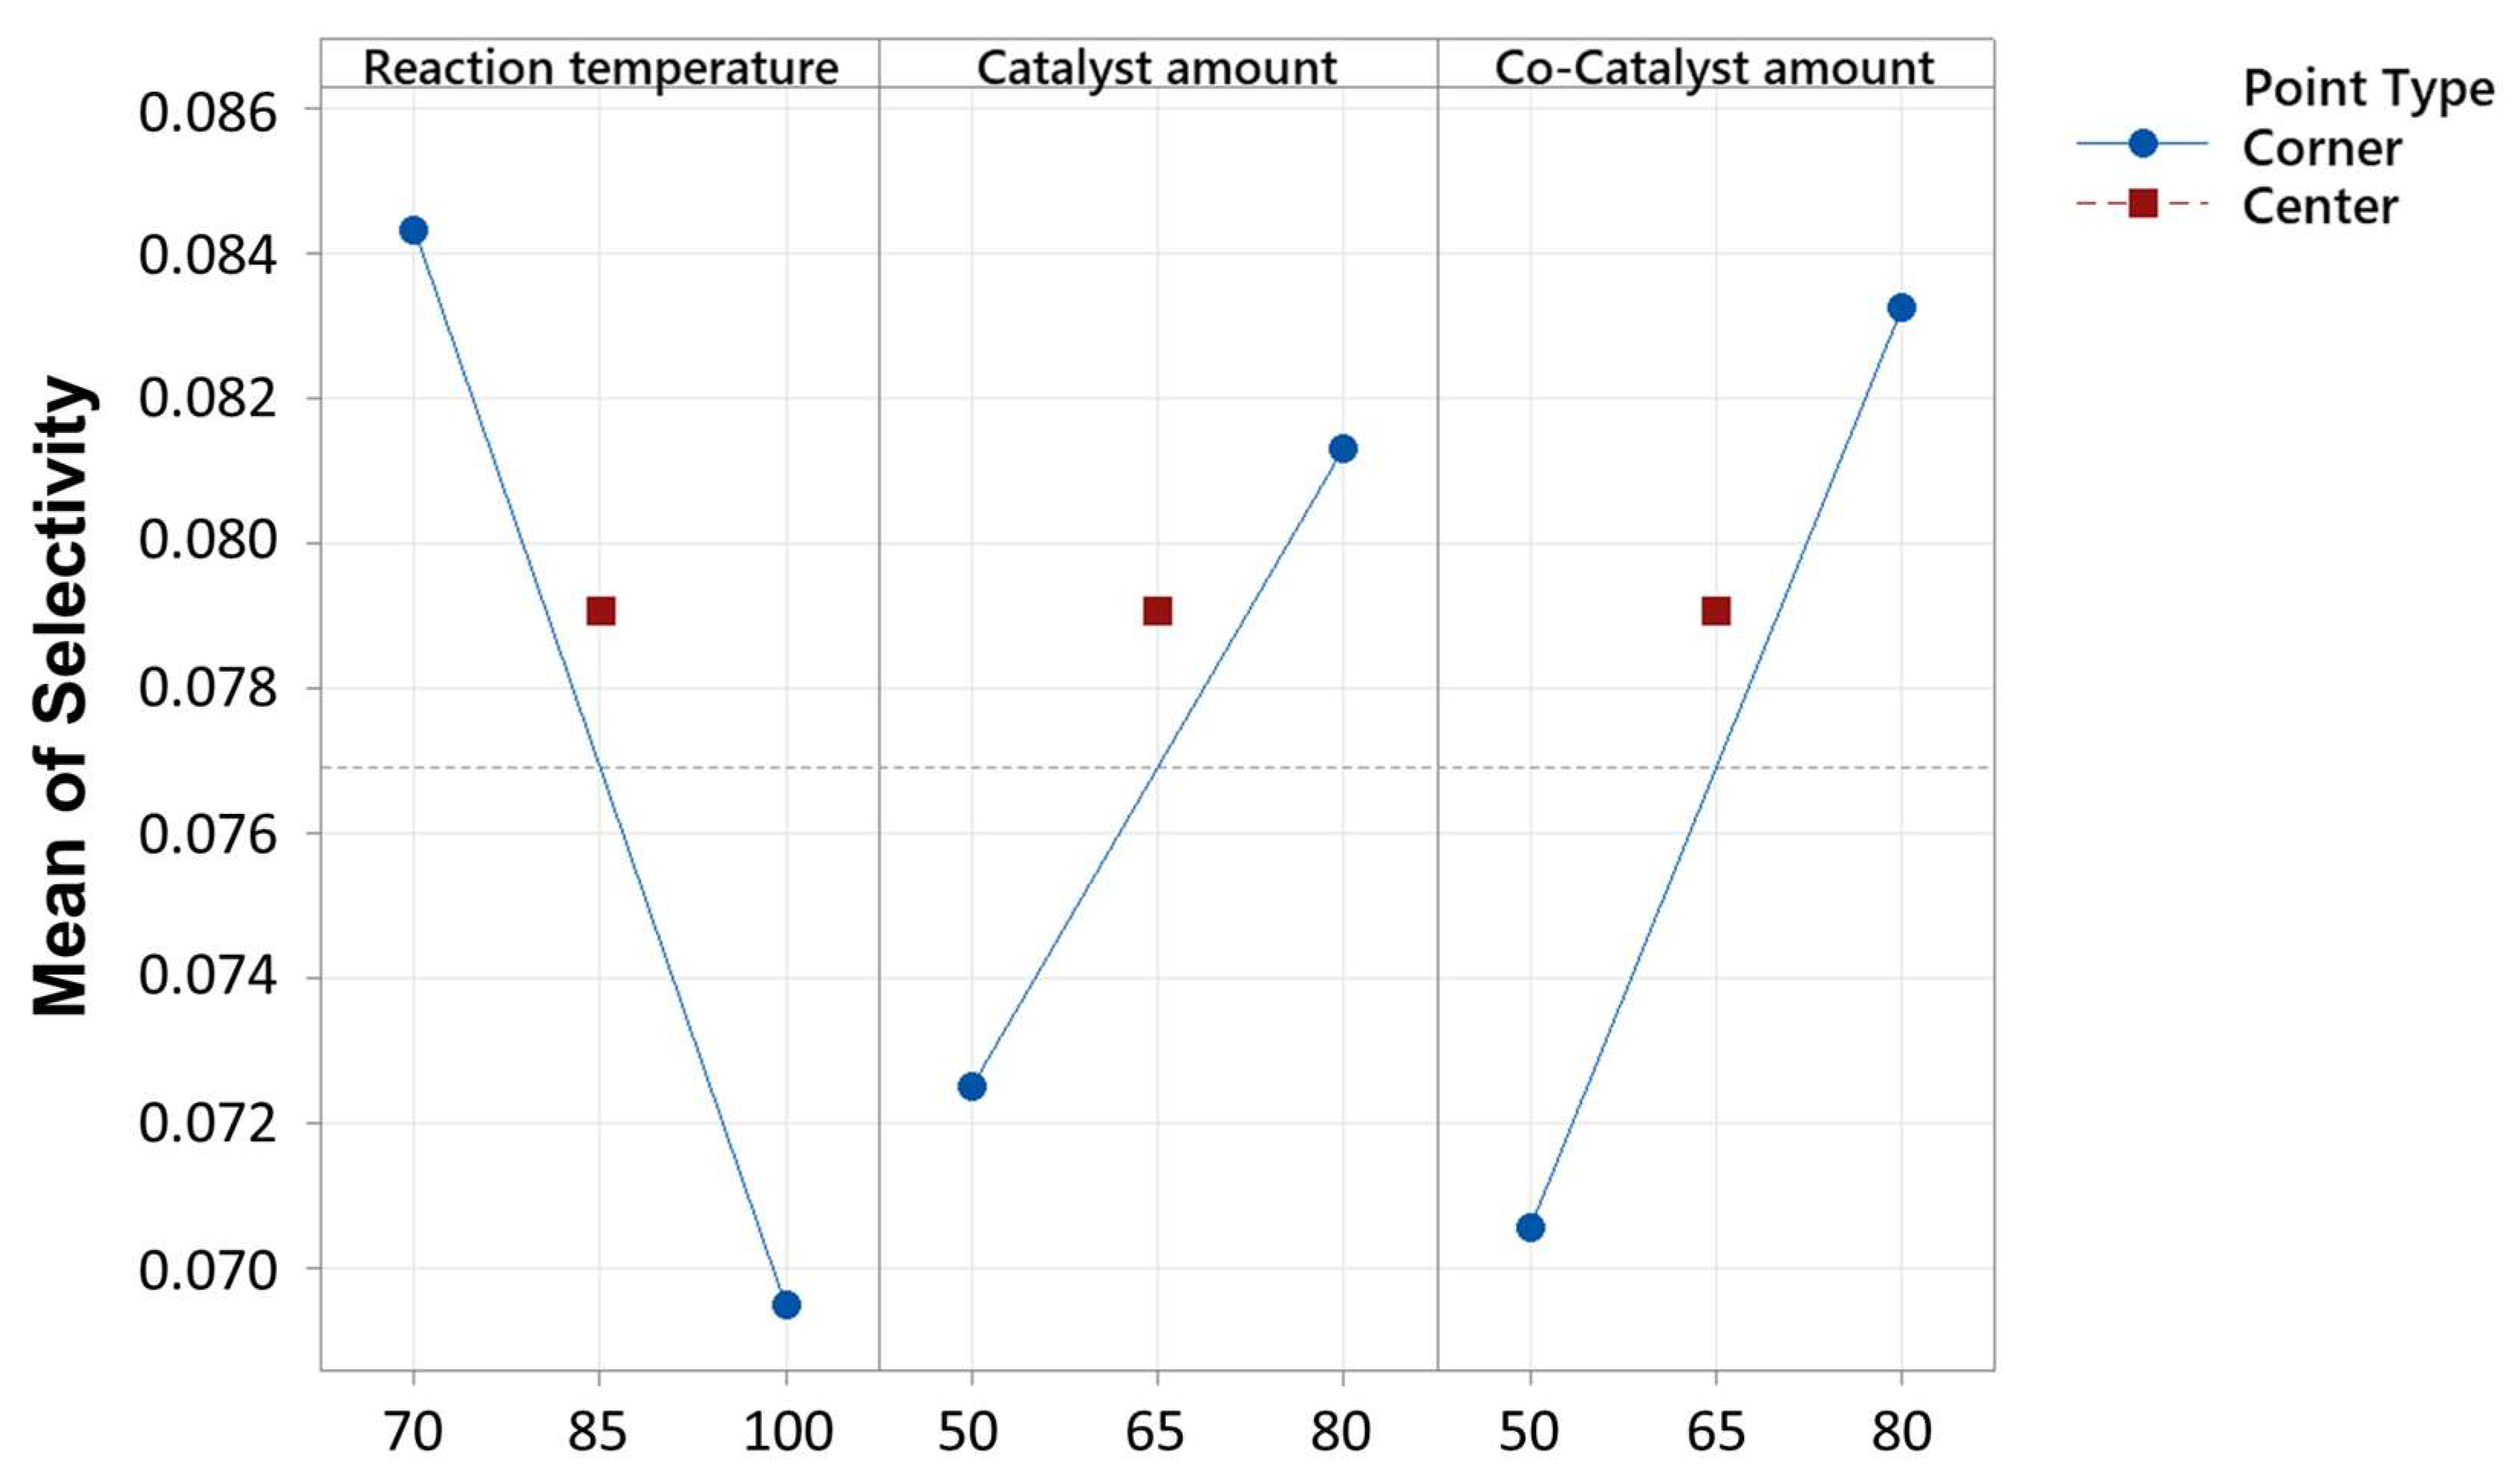
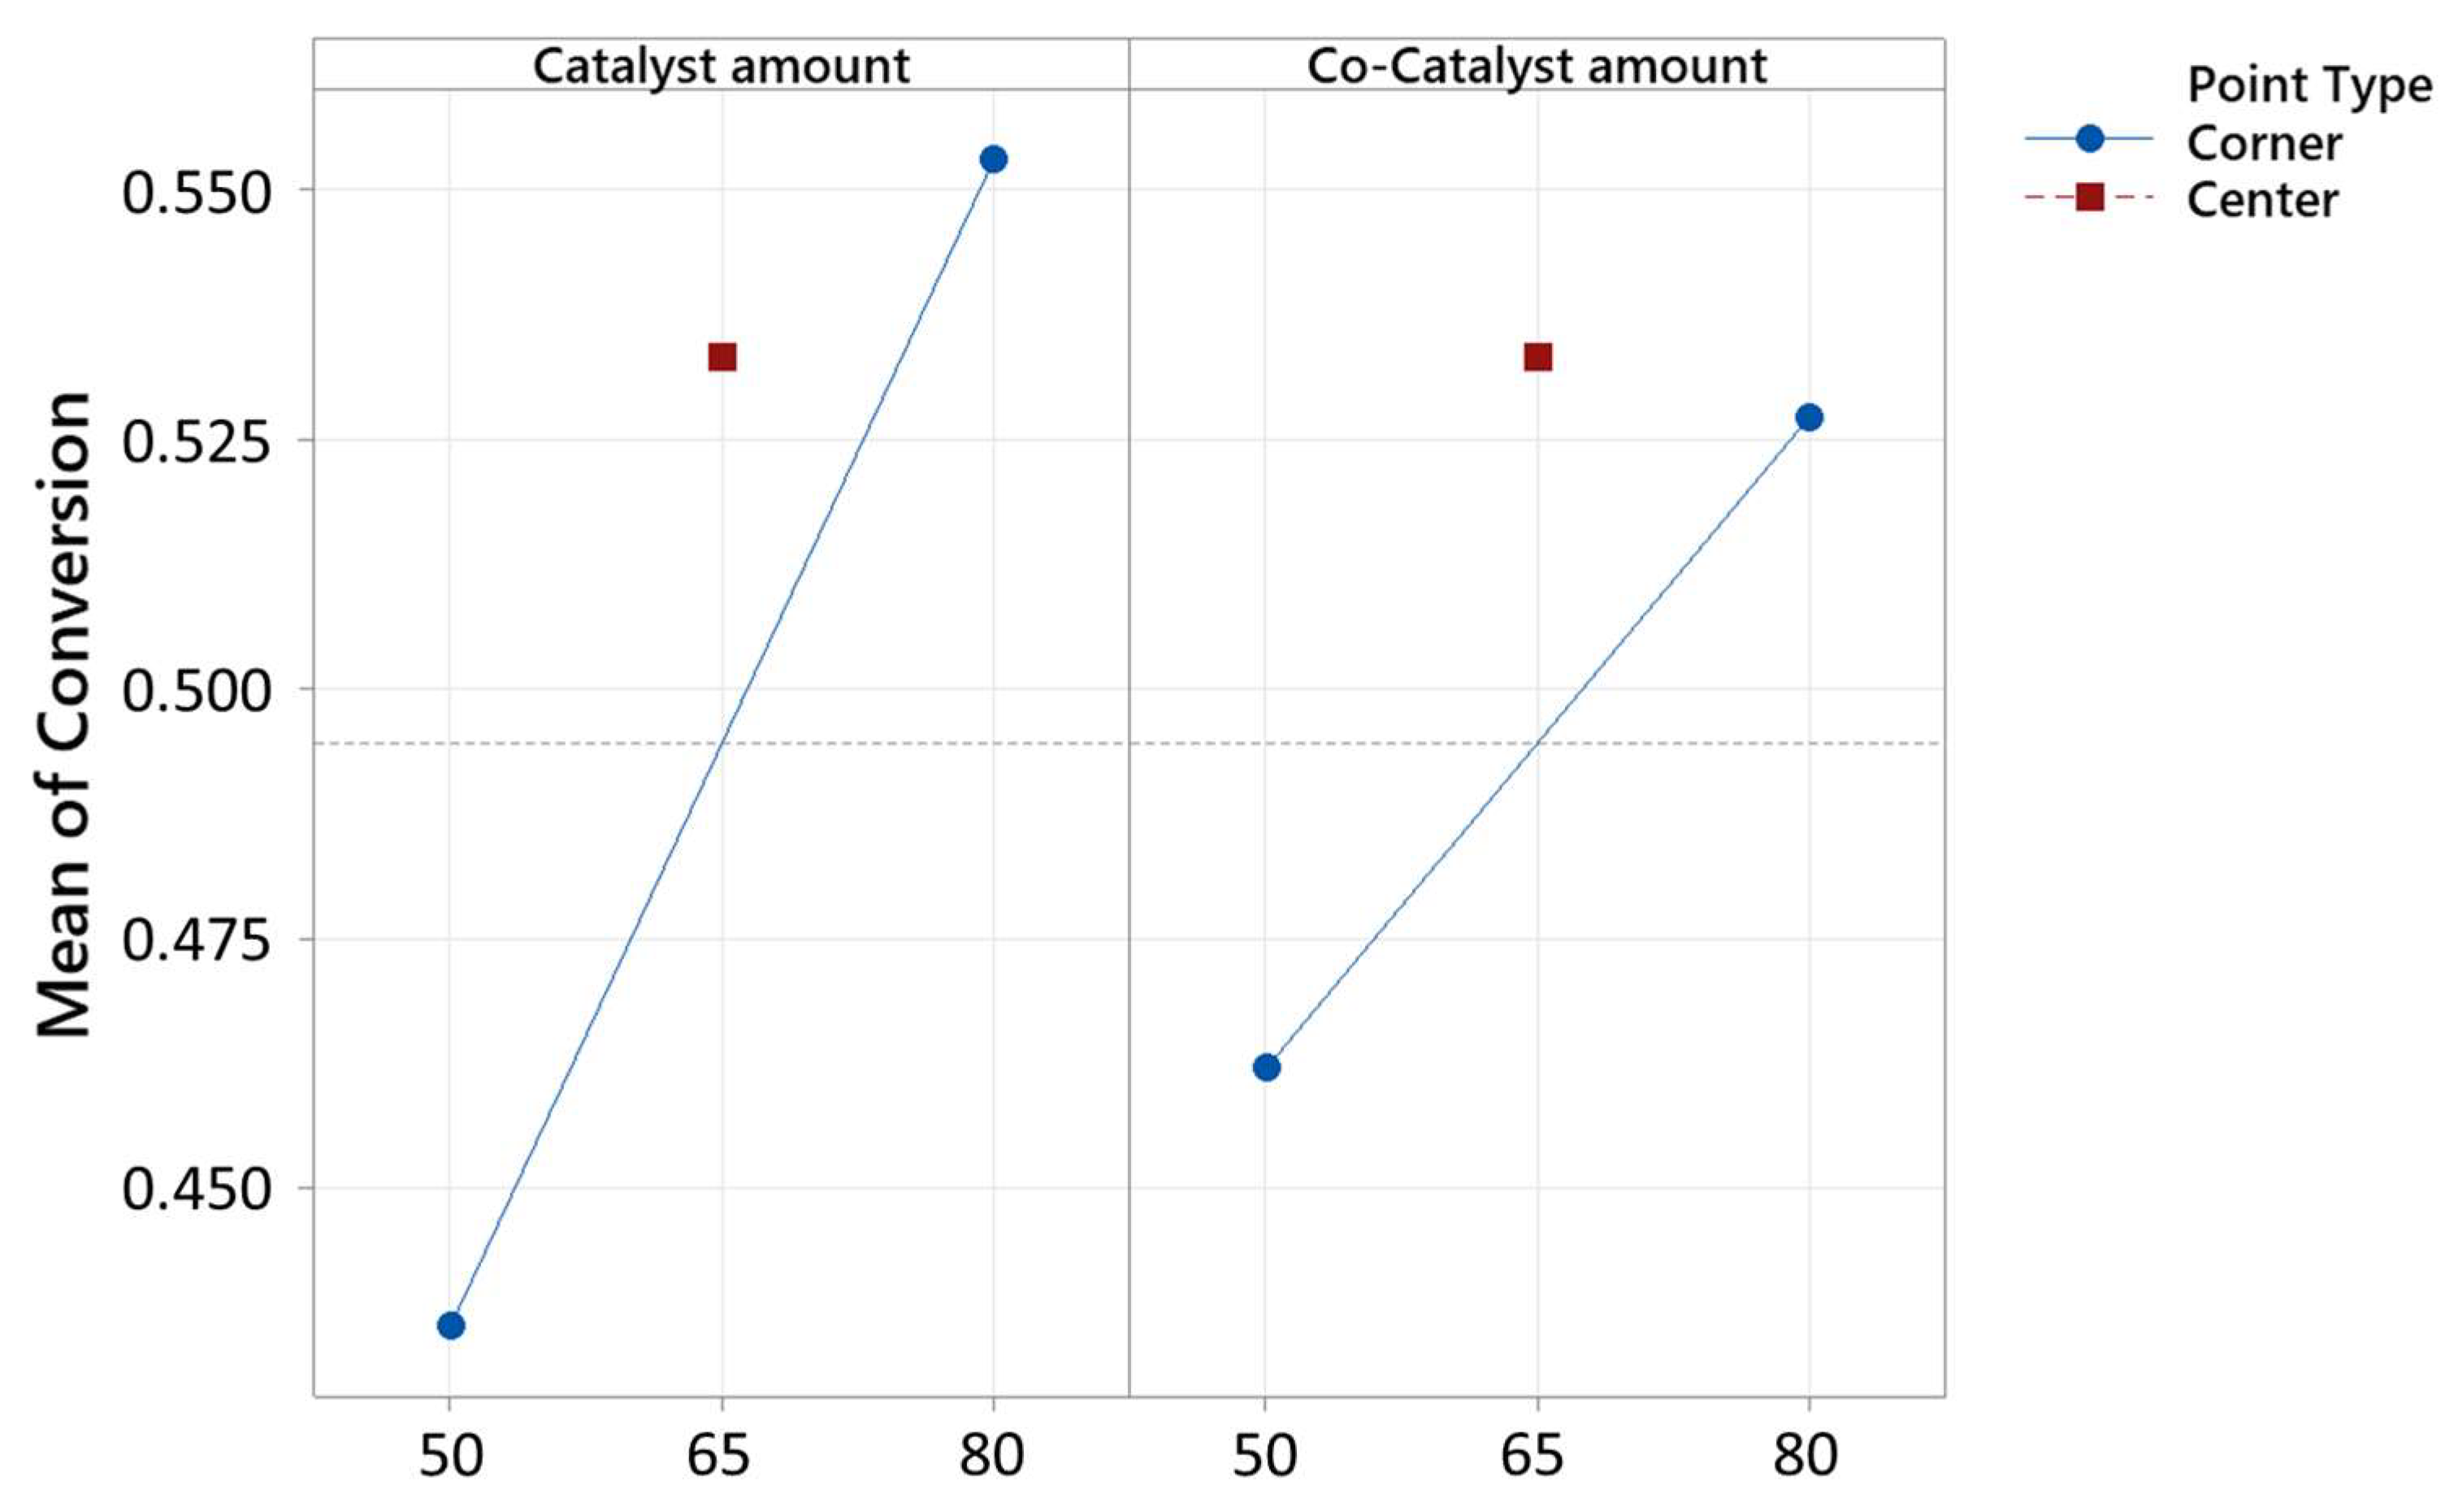
A decrease in the reaction temperature (−0.01486) corresponded to a decrease in the response, while increases in the catalyst amount (0.00884) and co-catalyst amount (0.01273) led to increases in the response, as seen in Figure 6 and Figure 7. However, the center point did not exhibit a statistically significant effect on the response variable, and thus the linear behavior. The model explained 94.05% of the variance in the response.
Figure 8 outlines the statistical analysis results for factors influencing conversion and selectivity in the chemical process. For conversion, the catalyst amount demonstrated the highest influence and adjusted sum of squares, accounting for 59.2% of the observed variation. This indicates that the catalyst amount had a substantial impact on the conversion efficiency. The low p-value (<0.05) associated with catalyst amount suggests that its effect on conversion was statistically significant. Similarly, for selectivity, the reaction temperature exhibited the highest influence and adjusted sum of squares, explaining 45.1% of the observed variation. This implies that the reaction temperature significantly influenced the selectivity in the process. The p-value associated with the reaction temperature was also very low, indicating its statistical significance in determining selectivity. Moreover, the co-catalyst amount contributed to both conversion and selectivity, albeit to a lesser extent compared to the catalyst amount and reaction temperature. Nonetheless, its variance and adjusted sum of squares suggested a notable impact on both conversion and selectivity. The associated p-values also indicated statistical significance for the co-catalyst amount in influencing both the conversion and selectivity. Each factor’s variance and adjusted sum of squares (Adj SS) are provided in relation to each other in Figure 8 and can be found in Tables S6 and S8 of the Supplementary Materials.
In summary, the statistical analysis underscored the importance of the catalyst amount, reaction temperature, and co-catalyst amount in influencing both the conversion and selectivity in the chemical process. These findings provided valuable insights for optimizing process parameters to enhance the conversion efficiency and selectivity.

2.4. Validation Experiments

Optimization experiments were conducted to refine the reaction conditions, focusing on variables such as reaction temperature, catalyst amount, and co-catalyst amount, with a minimum substrate amount (of 0.5 mL), reaction time, and water content. Maintaining a temperature of 70 °C and employing 80 mg of both catalyst (8 eq) and co-catalyst (23 eq), the experiments yielded the following results: For selectivity, the predicted value stood at 9.5% with a standard error (SE) of 0.2%. The 95% confidence interval (CI) ranged from 9.0% to 10.0%, while the prediction interval (PI) spanned from 8.7% to 10.354%. For the conversion, the predicted value was 58.6%, with a SE of 2.2%, a CI ranging from 53.5% to 63.6%, and a PI of 48.9% to 68.25%. The target optimum experiments conducted in a three-fold determination using 80 mg of catalyst and co-catalyst at 70 °C for 0.5 h demonstrated conversions ranging from 50.2% to 61.4%, and a corresponding selectivity of the desired product from 9.4%. These results further support the DoE’s previous results and its effectiveness, highlighting the critical impact of reaction conditions on both conversion and selectivity in the catalytic process. The overall ratio between anti-Markovnikov and Markovnikov products was 82:18, which is a great improvement compared to the initial ratio of Wacker-type oxidation of 5:95 with a PdCl2 catalyst or the ratio of the preliminary experiment of 68:32.

3. Methodology

3.1. Materials

The 1-decene (95.5%) was kindly provided by Verbio GmbH, Bitterfeld, Germany. The catalyst palladium(II)-chloride-diacetonitrile (PdCl2(MeCN)2; 99%; Nitrogen flushed), as well as the reaction solvent t-butanol (extra pure; 99.5%), were purchased from Acros Organics, Verona, Italy. Copper(II)-chloride (CuCl2; for synthesis), as a co-catalyst, was provided by Aldrich Chemistry (Merck, Darmstadt, Germany). The two reference substances, n-decanal (96%) and 2-decanone (97%), for analytic purposes, were obtained from Fisher Scientific, Waltham, MA, USA. Diethyl ether (≥99.5%; analytical reagent grade) and cyclohexane (≥99.8%; analytical reagent grade), for quenching the reaction, were purchased from Fisher Scientific, Loughborough, UK.

3.2. Experimental Setup and Analysis for the Reaction of 1-Decene to n-Decanal

The discontinuous direct oxidation of 1-decene to n-decanal using tert-butanol (t-BuOH) as a solvent was carried out in a 10 mL two-neck flask over a temperature-controlled heat bath, connected to a vacuum manifold for oxygen supply, under reflux with 30–80 mg of catalyst and 10–80 mg of co-catalyst. The two solids were dissolved in 1 mL of t-BuOH and stirred under reflux in an oxygen atmosphere at 80 °C for 30 min. In the next step, 1 mL each of 1-decene and t-BuOH were mixed and added to the solution, as well as 0.001–0.5 mL of deionized water. The temperature was then set to 30–100 °C and again placed under an oxygen atmosphere. After 0.5–24 h, the reaction was stopped by adding 1 mL each of cyclohexane and diethyl ether.
The qualitative and quantitative characterization of the substances in the reaction mixture was carried out by gas chromatography using a flame ionization detector (FID) with the help of reference substances in diethyl ether and the freely accessible NIST database. Gas chromatography was carried out using the SHIMADZU GC-2010-Plus model with an OPTIMA 624 LB column (Shimadzu, Kyoto, Japan). A detailed listing of the analysis parameters can be found in the Supplementary Materials Table S9.
The conversion and selectivity of reactions were quantified using gas chromatography (GC) with the 100% method, employing calibration of individual substances to establish their response factors. The equations applied for the calculations can be found in the Supplementary Materials.

3.3. Initial DoE

In pursuit of experimental optimization, the catalytic system using PdCl2(MeCN)2 [46], previously identified as highly efficient in preliminary trials, was employed to construct a partial factorial DoE [42,43,44,47]. This optimization focused on investigating both the selectivity toward n-decanal and the conversion of 1-decene. Consistent reaction conditions throughout the DoE included the addition of 1 mL of t-butanol, as the sterically demanding solvent to guide the reaction toward the AM product, for a fixed 30 min duration, dedicated to homogenization of the catalyst and co-catalyst [45].
The Minitab® 21.2 software (Minitab, LLC, State College, PA, USA) was used to create the DoE [48]. The first experimental plan involved seven factors, with a resolution of IV, indicating the ability to estimate main effects and all two-way interactions without confounding with higher-order interactions, executed through thirty-six runs with one replication, employing a fractional design (¼), implying that only one-quarter of the full factorial design was being utilized to minimize the number of experimental runs. Blocks represent distinct subsets within the experimental design, used to minimize variability and control for external factors, while central points, totaling four in this case, denote specific experimental runs conducted at the center of the design space to estimate experimental error and curvature effects. Table 5 depicts an overview of the experimental plan. The factors encompassed substrate amount, reaction temperature, catalyst and co-catalyst amounts, homogenization temperature, reaction time, and water content. The study aimed to discern optimal conditions for maximizing primarily product selectivity, but also conversion of educt, by identifying key factors and their respective levels that significantly influenced the catalytic reaction. The outcomes of this analysis will guide subsequent adjustments to the reaction conditions, ultimately leading to the optimization of the catalytic process.
Table 6 provides a detailed overview of the seven factors considered in the first study due to predetermined relevance for the reaction, along with their respective levels. The factors included: (A) substrate amount, (B) reaction temperature, (C) catalyst amount, (D) co-catalyst amount, (E) homogenization temperature, (F) reaction time, and (G) water content. Each factor was systematically varied at two levels, denoted as (−) and (+), representing the lower and higher bounds, respectively. The selection of specific range levels was informed by pre-existing knowledge, solubility considerations, and potential process requirements, guided by their practical relevance and anticipated impact on the catalytic reaction. Statistical analysis of the data encompassed the evaluation of main effects and interactions among the factors.

3.4. Optimization

Table 7 shows an overview of the experimental design for further optimization after the initial analysis employed in the study. The experimental plan involved three factors, executed through twelve runs without replication. A single block was utilized, incorporating four central points among the total experimental runs.
The experimental design involved three factors: (B) reaction temperature, (C) catalyst amount, and (D) co-catalyst amount. Table 8 depicts an overview of the chosen factors and their respective upper and lower bounds. Substrate amount, reaction time, and water content were set as the lower levels, respectively, as they were determined optimal.

4. Conclusions and Outlook

This study focused on optimizing reaction conditions for the synthesis of n-decanal from 1-decene via Wacker-type direct oxidation using statistical design of experiments (DoE) to enhance selectivity and conversion. Seven key factors, including substrate amount, catalyst, co-catalyst, temperature, reaction time, homogenization temperature, and water content, were systematically varied in an initial DoE plan to identify the parameters influencing the process. Statistical analyses identified significant factors for selectivity and conversion, highlighting substrate amount, temperature, catalyst, co-catalyst, reaction time, and water content, along with their two-way interactions. The model demonstrated reliability, with high coefficients of determination (R-squared) for selectivity (85.26%) and conversion (85.33%), showing strong correlations between predicted and observed values. Further optimization experiments focused on refining the conditions with a minimal substrate amount, reaction time, and water content, achieving a conversion of 50.18% and selectivity of 9.38% under optimal conditions (R-squared for selectivity: 94.50%, and conversion: 79.44%). The catalyst amount and reaction temperature exhibited significant impacts on the process, with the co-catalyst amount also contributing significantly to both conversion and selectivity. The optimized anti-Markovnikov to Markovnikov product ratio of 82:18 represents a substantial enhancement compared to the initial Wacker-type oxidation ratio of 5:95 and the ratio from the preliminary experiment of 68:32, highlighting the effectiveness of the optimized conditions in promoting the desired product selectivity. These findings provide valuable insights for enhancing conversion efficiency and selectivity in chemical processes, emphasizing the significance of catalyst and reaction parameters in reaction optimization. Further investigations using other substrates under the optimal conditions found here will be conducted to broaden the scope of this study.

Supplementary Materials

The following supporting information can be downloaded at: https://www.mdpi.com/article/10.3390/catal14060360/s1. Figure S1: Cube diagram of the experimental space with (A) substrate amount (0.5–4 mL), (B) reaction temperature (30–80 °C), (C) catalyst amount (10–50 mg), (D) co-catalyst amount (10–60 mg), (E) homogenization temperature (30–80 °C), (F) reaction time (0.5–24 h), and (G) water content (0.001–0.5 mL), without a center-point depiction. Figure S2: Cube diagram of the experimental space with (B) reaction temperature (70–100 °C), (C) catalyst amount (50–80 mg), and (D) co-catalyst amount (50–80 mg), with a center-point depiction. Table S1: Model summary for the conversion of the seven-factor DoE. Table S2: Analysis of variance of the conversion for the seven-factor DoE. Figure S3: Residual plots for conversion of the seven-factor DoE. Figure S4: Pareto chart of the standardized effects of the conversion of the seven-factor DoE (response is conversion; α = 0.05). Table S3: Model summary for the selectivity of the seven-factor DoE. Table S4: Analysis of variance of the conversion for the seven-factor DoE. Figure S5: Residual plots for the selectivity of the seven-factors DoE. Figure S6: Pareto Chart of the Standardized Effects of the Selectivity of the seven factors DoE (response is selectivity; α = 0.05). Table S5: Model summary for the conversion of the optimization. Table S6: Analysis of variance for the conversion of the optimization. Figure S7: Residual plots for the conversion of the optimization. Figure S8: Pareto chart of the standardized effects of the conversion of the optimization (response is conversion; α = 0.05). Table S7: Model summary for the selectivity of the optimization. Table S8: Analysis of variance for the conversion of the optimization. Figure S9: Residual plots for selectivity of the optimization. Figure S10: Pareto chart of the standardized effects of the selectivity of the optimization (response is selectivity; α = 0.05). Table S9: Detailed parameters of the GC-2010 Plus instrument used for analysis. Conversion and selectivity models for the seven-factor design of experiments (DoE) are described, along with regression equations, model summaries, analysis of variance, residual plots, and Pareto charts, illustrating standardized effects. Equation (S1): Conversion of substrate. Equation (S2): Yield of analyte. Equation (S3): Selectivity of analyte.

Author Contributions

Conceptualization, T.B. and M.E.; methodology, T.B. and P.B. (Peter Bell); validation, P.B. (Peter Bell) and M.E.; formal analysis, M.E.; investigation, T.B. and P.B. (Patricia Bratenberg); data curation, T.B.; writing—original draft preparation, T.B.; writing—review and editing, P.B. (Peter Bell) and M.E.; visualization, T.B.; supervision, M.E.; project administration, M.E.; funding acquisition, M.E. All authors have read and agreed to the published version of the manuscript.

Funding

This study was funded by the German Federal Ministry of Education and Research, with the funding number 031B1319. The publication of this article was funded by the Open-Access Publication fund of TH Köln.

Data Availability Statement

Data are contained within the article and Supplementary Materials.

Acknowledgments

The authors would like to thank Verbio GmbH, Bitterfeld, Germany, for the supply of bio-based 1-decene.

Conflicts of Interest

Author Peter Bell was employed by the company Bell-Consulting. The remaining authors declare that the research was conducted in the absence of any commercial or financial relationships that could be construed as a potential conflict of interest.

Glossary

p-valueThe p-value is a measure that helps determine the statistical significance of the observed results in a hypothesis test. It represents the probability of obtaining results as extreme as the observed results, assuming that the null hypothesis is true. In statistical analysis, if the p-value is less than a predetermined significance level (commonly 0.05), the null hypothesis is rejected, indicating that the results are statistically significant. A lower p-value suggests stronger evidence against the null hypothesis and greater statistical significance.
VIF (Variance Inflation Factor)The VIF is a measure used to assess multicollinearity among independent variables in a regression analysis. Multicollinearity occurs when independent variables in a regression model are highly correlated with each other. The VIF quantifies how much the variance of an estimated regression coefficient is inflated due to multicollinearity. A VIF value of 1 indicates no multicollinearity, while values greater than 5 or 10 are often considered indicative of multicollinearity. High VIF values suggest that the corresponding independent variable may be redundant or highly correlated with other variables in the model, which can affect the interpretation of regression coefficients and the overall reliability of the regression analysis.
EffectThe effect, also known as the effect size, represents the estimated impact of an independent variable (factor) on the dependent variable (response) in a statistical model. It indicates the magnitude of the change in the dependent variable for a one-unit change in the independent variable, while holding all other variables constant. In the context of regression analysis, the effect size is typically measured by the coefficient (Coef) associated with each independent variable.
CoefThe coefficient, also known as the estimated coefficient or parameter estimate, represents the estimated effect size of an independent variable on the dependent variable. It indicates the change in the dependent variable for a one-unit change in the independent variable, while holding other variables constant.
SE CoefThe standard error of the coefficient measures the variability or uncertainty in the estimated coefficient. It represents the standard deviation of the coefficient’s sampling distribution. A smaller standard error suggests more precise estimates.
t-valueThe t-value is the ratio of the estimated coefficient to its standard error. It indicates the number of standard deviations that the coefficient estimate is away from zero. A larger t-value suggests a more statistically significant coefficient. Typically, t-values are used to assess whether a coefficient is significantly different from zero.

References

  1. Murray, P.M.; Bellany, F.; Benhamou, L.; Bučar, D.-K.; Tabor, A.B.; Sheppard, T.D. The application of design of experiments (DoE) reaction optimisation and solvent selection in the development of new synthetic chemistry. Org. Biomol. Chem. 2016, 14, 2373–2384. [Google Scholar] [CrossRef] [PubMed]
  2. Mills, J.E. Design of Experiments in Pharmaceutical Process Research and Development. In Chemical Process Research; Abdel-Magid, A.F., Ragan, J.A., Eds.; American Chemical Society: Washington, DC, USA, 2003; pp. 87–109. ISBN 9780841238244. [Google Scholar]
  3. Mullin, R. Statistical Method Makes a Comeback. American Chemical Society [Online], 20201022. Available online: https://cen.acs.org/articles/91/i13/Design-Experiments-Makes-Comeback.html (accessed on 25 January 2024).
  4. Nadin, A.; Hattotuwagama, C.; Churcher, I. Lead-oriented synthesis: A new opportunity for synthetic chemistry. Angew. Chem. Int. Ed. 2012, 51, 1114–1122. [Google Scholar] [CrossRef] [PubMed]
  5. Weissman, S.A.; Anderson, N.G. Design of Experiments (DoE) and Process Optimization. A Review of Recent Publications. Org. Process Res. Dev. 2015, 19, 1605–1633. [Google Scholar] [CrossRef]
  6. Tye, H. Application of statistical ‘design of experiments’ methods in drug discovery. Drug Discov. Today 2004, 9, 485–491. [Google Scholar] [CrossRef] [PubMed]
  7. Montgomery, D.C. Design and Analysis of Experiments, 9th ed.; Wiley: Hoboken, NJ, USA, 2017; ISBN 9781119113478. [Google Scholar]
  8. Anastas, P.T.; Warner, J.C. Green Chemistry: Theory and Practice; 1. paperback; Oxford University Press: Oxford, UK, 2000; ISBN 0198502346. [Google Scholar]
  9. Lendrem, D.; Owen, M.; Godbert, S. DOE (Design of Experiments) in Development Chemistry: Potential Obstacles. Org. Process Res. Dev. 2001, 5, 324–327. [Google Scholar] [CrossRef]
  10. Weissman, S.A. Application of Design of Experiments to Process Development. Org. Process Res. Dev. 2015, 19, 1604. [Google Scholar] [CrossRef]
  11. Plackett, R.L.; Burman, J.P. The Design Of Optimum Multifactorial Experiments. Biometrika 1946, 33, 305–325. [Google Scholar] [CrossRef]
  12. Box, G.E.P.; Behnken, D.W. Some New Three Level Designs for the Study of Quantitative Variables. Technometrics 1960, 2, 455–475. [Google Scholar] [CrossRef]
  13. Sanchez, S.M.; Sanchez, P.J. Very large fractional factorial and central composite designs. ACM Trans. Model. Comput. Simul. 2005, 15, 362–377. [Google Scholar] [CrossRef]
  14. Zhou, Y.-D.; Xu, H. Composite Designs Based on Orthogonal Arrays and Definitive Screening Designs. J. Am. Stat. Assoc. 2017, 112, 1675–1683. [Google Scholar] [CrossRef]
  15. Berger, M.; Wong, W.K. (Eds.) Applied Optimal Designs; Wiley: Hoboken, NJ, USA, 2005; ISBN 0470856971. [Google Scholar]
  16. Iordache, O. Evolvable Designs of Experiments: Applications for Circuits; Wiley-VCH: Weinheim, Germany, 2009; ISBN 978-3-527-32424-8. [Google Scholar]
  17. Box, G.E.P.; Hunter, W.G.; Hunter, J.S. Statistics for Experimenters: An Introduction to Design, Data Analysis, and Model Building; Wiley: New York, NY, USA, 1978; ISBN 0471093157. [Google Scholar]
  18. Hedayat, A.S.; Sloane, N.J.A.; Stufken, J. Orthogonal Arrays; Springer: New York, NY, USA, 1999; ISBN 978-1-4612-7158-1. [Google Scholar]
  19. Lucas, S.; Vidal, E.; Amiri, A.; Hanlon, S.; Amengual, J.C. A comparison of syntactic and statistical techniques for off-line OCR. In Grammatical Inference and Applications; Carbonell, J.G., Siekmann, J., Goos, G., Hartmanis, J., Leeuwen, J., Carrasco, R.C., Oncina, J., Eds.; Springer: Berlin/Heidelberg, Germany, 1994; pp. 168–179. ISBN 978-3-540-58473-5. [Google Scholar]
  20. Box, G.E.P.; Hunter, J.S.; Hunter, W.G. Statistics for Experimenters: Design, Innovation, and Discovery, 2nd ed.; Wiley-Interscience: Hoboken, NJ, USA, 2005; ISBN 0471718130. [Google Scholar]
  21. Carlson, R.; Carlson, J.E. Design and Optimization in Organic Synthesis, 2nd ed.; Elsevier: Amsterdam, The Netherlands; San Diego, CA, USA, 2005; ISBN 9780080455273. [Google Scholar]
  22. Lazić, Ž.R. Design of Experiments in Chemical Engineering: A Practical Guide; Wiley-VCH: Weinheim, Germany, 2004; ISBN 9783527604166. [Google Scholar]
  23. Owen, M.R.; Luscombe, C.; Lai; Godbert, S.; Crookes, D.L.; Emiabata-Smith, D. Efficiency by Design: Optimisation in Process Research. Org. Process Res. Dev. 2001, 5, 308–323. [Google Scholar] [CrossRef]
  24. Owen, S.C.; Shoichet, M.S. Design of three-dimensional biomimetic scaffolds. J. Biomedical. Mater. Res. 2010, 94A, 1321–1331. [Google Scholar] [CrossRef]
  25. Rekab, K.; Shaikh, M. Statistical Design of Experiments with Engineering Applications; Chapman & Hall/CRC Press: Boca Raton, FL, USA, 2005; ISBN 978-1-57444-625-8. [Google Scholar]
  26. Ullmann’s Encyclopedia of Industrial Chemistry, 7th ed.; release 2015; Wiley-VCH: Weinheim, Germany, 2010; ISBN 9783527306732.
  27. Fugmann, B.; Lang-Fugmann, S.; Steglich, W. (Eds.) RÖMPP Encyclopedia Natural Products, 1st ed.; 1. Auflage; Thieme: Stuttgart, Germany, 2014; ISBN 9783131795519. [Google Scholar]
  28. Keim, W. Oligomerization of ethylene to α-olefins: Discovery and development of the shell higher olefin process (SHOP). Angew. Chem. Int. Ed. 2013, 52, 12492–12496. [Google Scholar] [CrossRef]
  29. Walker, K.L.; Dornan, L.M.; Zare, R.N.; Waymouth, R.M.; Muldoon, M.J. Mechanism of Catalytic Oxidation of Styrenes with Hydrogen Peroxide in the Presence of Cationic Palladium(II) Complexes. J. Am. Chem. Soc. 2017, 139, 12495–12503. [Google Scholar] [CrossRef] [PubMed]
  30. Tsuji, J.; Nagashima, H.; Hori, K. A new preparative method for 1,3-dicarbonyl compounds by the regioselective oxidation of α,β-unsaturated carbonyl compounds, catalyzed by PdCl2 using hydroperoxides as the reoxidant of Pd0. Chem. Lett. 1980, 9, 257–260. [Google Scholar] [CrossRef]
  31. ICIS Explore. INTERVIEW: German Biofuels Producer Verbio Develops Ethenolysis-Based Renewable Chemicals Project|ICIS. Available online: https://www.icis.com/explore/resources/news/2024/03/13/10980232/interview-german-biofuels-producer-verbio-develops-ethenolysis-based-renewable-chemicals-project/ (accessed on 21 March 2024).
  32. Muzart, J. Aldehydes from Pd-catalysed oxidation of terminal olefins. Tetrahedron 2007, 63, 7505–7521. [Google Scholar] [CrossRef]
  33. Mann, S.; Benhamou, L.; Sheppard, T. Palladium(II)-Catalysed Oxidation of Alkenes. Synthesis 2015, 47, S19–S22. [Google Scholar] [CrossRef]
  34. Cornils, B.; Herrmann, W.A.; Xu, J.-H.; Zanthoff, H.-W. (Eds.) Catalysis from A to Z: A Concise Encyclopedia; 5. aktualis. u. erw. Auflage; Wiley-VCH: Weinheim, Germany, 2019; ISBN 978-3-527-34311-9. [Google Scholar]
  35. Wenzel, T.T. Oxidation of olefins to aldehydes using a palladium–copper catalyst. J. Chem. Soc. Chem. Commun. 1993, 10, 862–864. [Google Scholar] [CrossRef]
  36. Usama, W.O.; Markewich, D.J.; East, A. Regioselectivity in Wacker oxidations of internal alkenes: Antiperiplanar effects? Can. J. Chem. 2023, 101, 579–584. [Google Scholar] [CrossRef]
  37. Michel, B.W.; Steffens, L.D.; Sigman, M.S. On the mechanism of the palladium-catalyzed tert-butylhydroperoxide-mediated Wacker-type oxidation of alkenes using quinoline-2-oxazoline ligands. J. Am. Chem. Soc. 2011, 133, 8317–8325. [Google Scholar] [CrossRef]
  38. Wright, J.A.; Gaunt, M.J.; Spencer, J.B. Novel anti-Markovnikov regioselectivity in the Wacker reaction of styrenes. Chemistry 2006, 12, 949–955. [Google Scholar] [CrossRef] [PubMed]
  39. Fleischmann, G.; Jira, R.; Bolt, H.M.; Golka, K. Acetaldehyde. In Ullmann’s Encyclopedia of Industrial Chemistry; Wiley-VCH Verlag GmbH & Co. KGaA: Weinheim, Germany, 2000; ISBN 3527306730. [Google Scholar]
  40. Tsuji, J. Palladium Reagents and Catalysts: New Perspectives for the 21st Century, 2nd ed.; J. Wiley: Hoboken, NJ, USA, 2004; ISBN 0470850329. [Google Scholar]
  41. Dong, G.; Teo, P.; Wickens, Z.K.; Grubbs, R.H. Primary alcohols from terminal olefins: Formal anti-Markovnikov hydration via triple relay catalysis. Science 2011, 333, 1609–1612. [Google Scholar] [CrossRef] [PubMed]
  42. Dong, J.J.; Browne, W.R.; Feringa, B.L. Palladium-catalyzed anti-Markovnikov oxidation of terminal alkenes. Angew. Chem. Int. Ed. Engl. 2015, 54, 734–744. [Google Scholar] [CrossRef]
  43. Keith, J.A.; Henry, P.M. The mechanism of the Wacker reaction: A tale of two hydroxypalladations. Angew. Chem. Int. Ed. Engl. 2009, 48, 9038–9049. [Google Scholar] [CrossRef] [PubMed]
  44. Teo, P.; Wickens, Z.K.; Dong, G.; Grubbs, R.H. Efficient and highly aldehyde selective Wacker oxidation. Org. Lett. 2012, 14, 3237–3239. [Google Scholar] [CrossRef] [PubMed]
  45. Feringa, B.L. Catalytic oxidation of alk-1-enes to aldehydes. J. Chem. Soc. Chem. Commun. 1986, 12, 909. [Google Scholar] [CrossRef]
  46. Carretero, J.C.; Arrayás, R.G. Dichloro Bis(acetonitrile) Palladium. In Encyclopedia of Reagents for Organic Synthesis; Paquette, L.A., Ed.; Wiley: Chichester, UK, 1995; ISBN 0471936235. [Google Scholar]
  47. Ganesamoorthy, S.; Shanmugasundaram, K.; Karvembu, R. Remarkable catalytic activity of [PdCl2(CH3CN)2] in Suzuki–Miyaura cross-coupling reaction in aqueous media under mild conditions. J. Mol. Catal. A Chem. 2013, 371, 118–124. [Google Scholar] [CrossRef]
  48. Minitab, L. Minitab® Statistical Software; Minitab, L.L.C.: State College, PA, USA, 2022. [Google Scholar]
Scheme 1. Direct oxidation of terminal alkenes to the Markovnikov (1) and anti-Markovnikov (2) products.
Catalysts 14 00360 sch001
Figure 1. Surface diagram for selectivity and conversion in decimal value (0–1): (A) substrate amount (0.5–4 mL), (B) reaction temperature (30–80 °C), (C) catalyst amount (10–50 mg), (D) co-catalyst amount (10–60 mg), (E) reaction time (0.5–24 h), and (F) water content (0.001–0.5 mL). Purple = target optimal point for the reaction.
Catalysts 14 00360 g001
Figure 2. Interaction plot for selectivity, in decimal value (0–1), of the seven-factor DoE by fitted means.
Catalysts 14 00360 g002
Figure 3. Interaction plot and main effect plot for conversion, in decimal value (0–1), of the seven-factor DoE by fitted means.
Catalysts 14 00360 g003
Figure 4. Pie charts of analysis of variance by adjusted means for the seven-factor DoE of (a) conversion and (b) selectivity.
Catalysts 14 00360 g004
Figure 5. Surface diagram for selectivity and conversion in decimal value (0–1): (A) catalyst amount (50–80 mg), (B) co-catalyst amount (50–80 mg), and (C) reaction temperature (70–100 °C). Purple = target optimal point for the reaction.
Catalysts 14 00360 g005
Figure 6. Interaction plot for selectivity, in decimal value (0–1), of the optimization by fitted means.
Catalysts 14 00360 g006
Figure 7. Interaction plot for conversion, in decimal value (0–1), of the optimization by fitted means.
Catalysts 14 00360 g007
Figure 8. Pie charts of analysis of variance by adjusted means for the optimization of (a) conversion and (b) selectivity.
Catalysts 14 00360 g008
Table 1. Coded coefficients for selectivity of the seven-factor DoE.
TermEffectCoef.SE Coef.t-Valuep-ValueVIF
Constant 0.017860.002108.490.000
Substrate amount−0.02920−0.014600.00210−6.940.0001.00
Reaction temperature0.009140.004570.002102.170.0401.00
Catalyst amount0.020240.010120.002104.810.0001.00
Co-catalyst amount0.004980.002490.002101.180.2491.00
Reaction time0.001410.000700.002100.330.7411.00
Water content−0.01899−0.009500.00210−4.510.0001.00
Substrate amount*Catalyst amount−0.01621−0.008110.00210−3.850.0011.00
Substrate amount*Water content0.014390.007200.002103.420.0021.00
Reaction temperature*Reaction time−0.01108−0.005540.00210−2.630.0151.00
Catalyst amount*Co-catalyst amount0.011360.005680.002102.700.0131.00
Central points −0.001370.00631−0.220.8291.00
Table 2. Coded coefficients for conversion of the seven-factor DoE.
TermEffectCoef.SE Coef.t-Valuep-ValueVIF
Constant 0.393930.0088544.490.000
Substrate amount−0.13843−0.069210.00885−7.820.0001.00
Catalyst amount0.108720.054360.008856.140.0001.00
Reaction time0.042460.021230.008852.400.0241.00
Water content0.060360.030180.008853.410.0021.00
Substrate amount*Catalyst amount−0.08659−0.043300.00885−4.890.0001.00
Substrate amount*Water content−0.04622−0.023110.00885−2.610.0151.00
Catalyst amount*Water content0.056500.028250.008853.190.0041.00
Central points 0.00120.02660.050.9631.00
Table 3. Coded coefficients for selectivity of the optimization.
TermEffectCoef.SE Coef. t-Value p-Value VIF
Constant 0.076910.0010372.070.000
Reaction temperature−0.01486−0.007430.00103−6.960.0001.00
Catalyst amount0.008840.004420.001034.140.0041.00
Co-catalyst amount0.012730.006370.001035.970.0001.00
Central points 0.002170.001781.170.2621.00
Table 4. Coded coefficients for conversion of the optimization.
TermEffect Coef. SE Coef. t-Value p-Value VIF
Constant 0.49460.012739.030.000
Catalyst amount0.11680.05840.01274.610.0021.00
Co-catalyst amount0.06520.03260.01272.570.0331.00
Central points 0.03850.02201.750.1181.00
Table 5. Overview of the experimental plan for the seven-factor DoE.
Factors:7Basic experimental plan:7; 32Resolution:IV
Runs:36Replications:1Fraction:¼
Blocks:1Central points (total):4
Table 6. Overview of the factors and levels used in the seven-factor DoE.
FactorsSteps
(−)Origin(+)
(A) Substrate amount (mL)0.52.254
(B) Reaction temperature (°C)305580
(C) Catalyst amount i (mg)103050
(D) Co-catalyst amount i (mg)103560
(E) Homogenization temperature (°C)305580
(F) Reaction time (h)0.512.2524
(G) Water content (mL)0.0010.250.5
i The equivalents of the catalyst ranged from 0.6 eq to 5 eq and of the co-catalyst from 0.4 eq to 17 eq, depending on the amount of the respective substances used in the substrate.
Table 7. Overview of the experimental plan for the optimization.
Factors:3Basic experimental plan:3; 8
Runs:12Replications:1
Blocks:1Central points (total):4
ResolutionIVFraction¼
Table 8. Overview of the factors and levels used in the optimization.
FactorsSteps
(−)Origin(+)
(B) Reaction temperature (°C)7085100
(C) Catalyst amount (mg)50
(4.9 eq)
65
(6.4 eq)
80
(8 eq)
(D) Co-catalyst amount (mg)50
(14 eq)
65
(18 eq)
80
(23 eq)
Disclaimer/Publisher’s Note: The statements, opinions and data contained in all publications are solely those of the individual author(s) and contributor(s) and not of MDPI and/or the editor(s). MDPI and/or the editor(s) disclaim responsibility for any injury to people or property resulting from any ideas, methods, instructions or products referred to in the content.