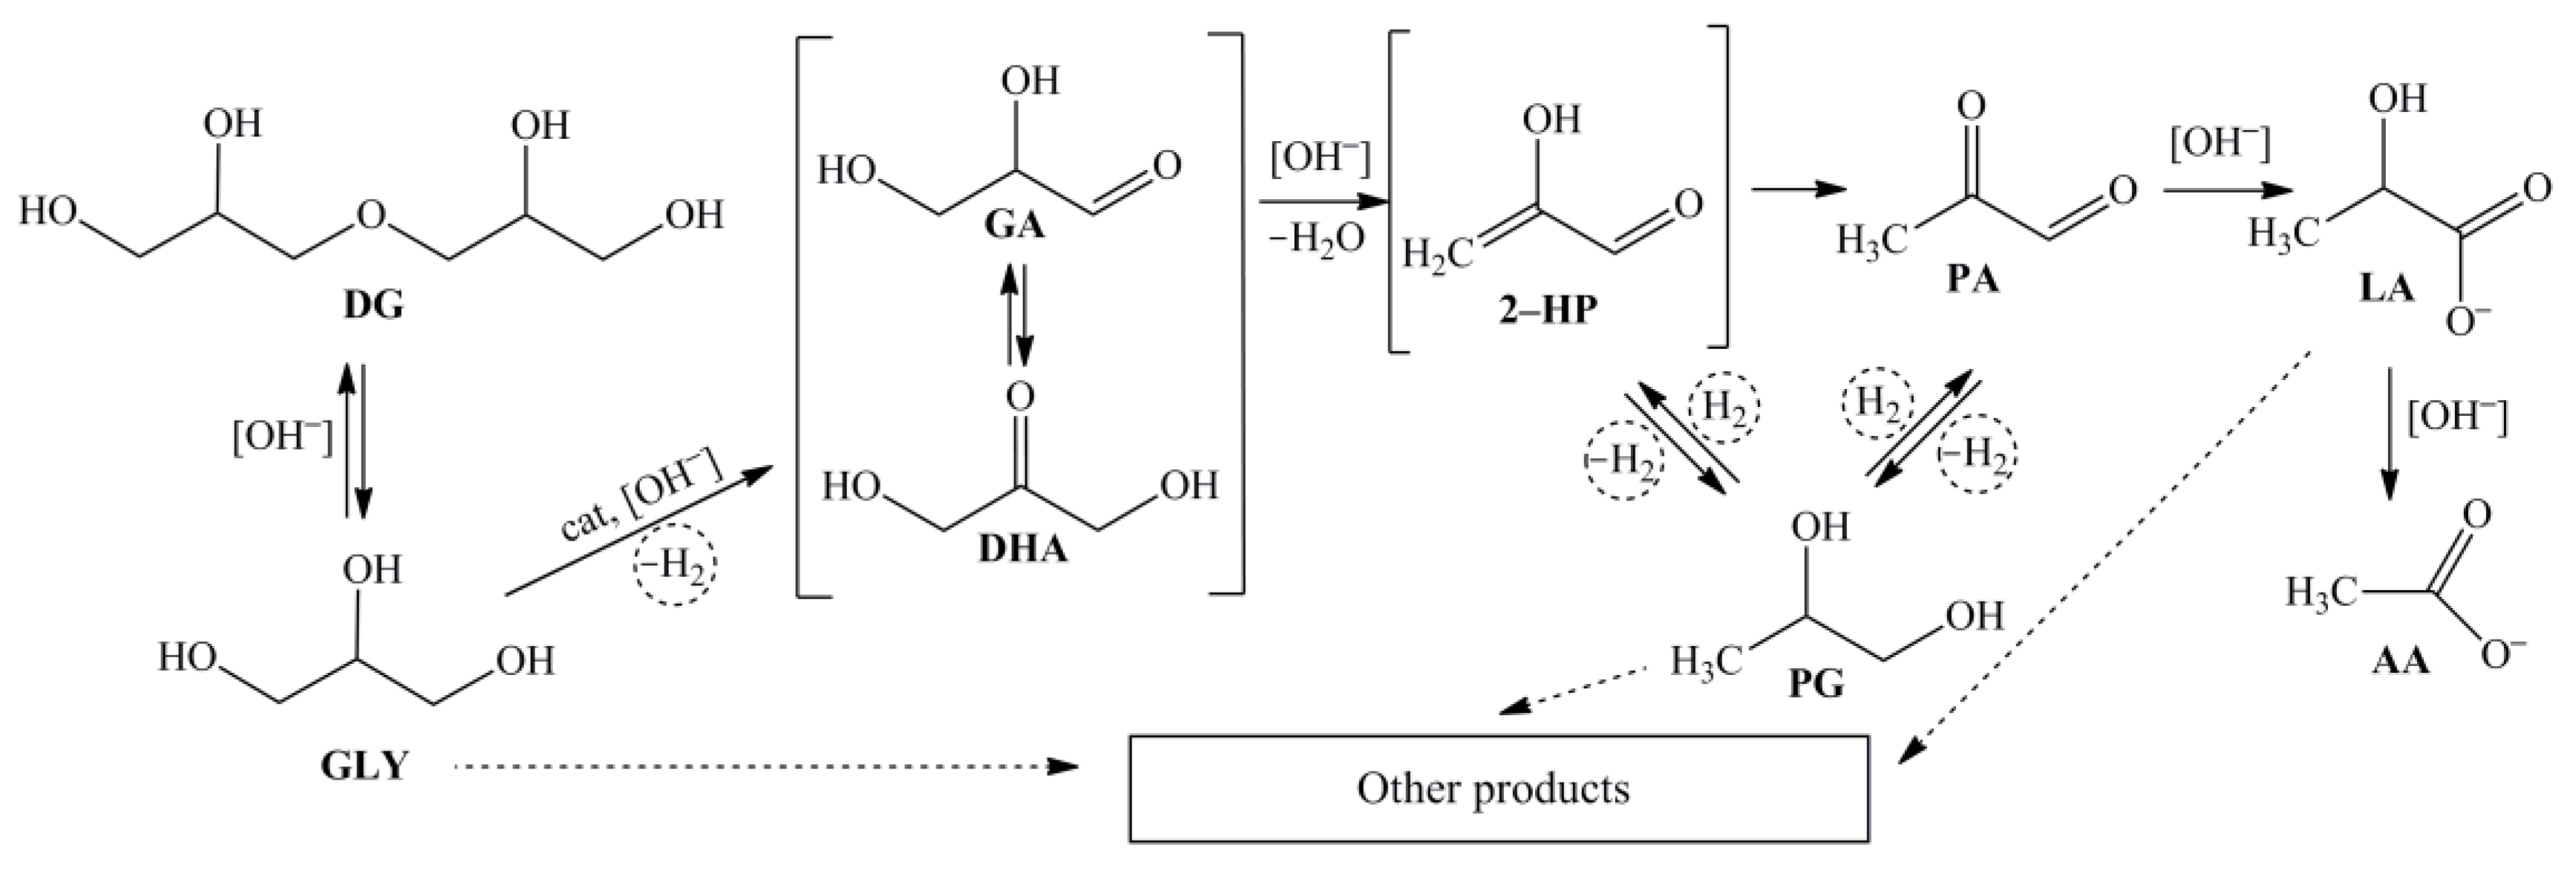
Catalytic Conversion of Glycerol to Lactic Acid Over Cu-Based Catalysts

 , , ,
, , ,
Abstract
1. Introduction
2. Results and Discussions
2.1. Catalyst Characterization
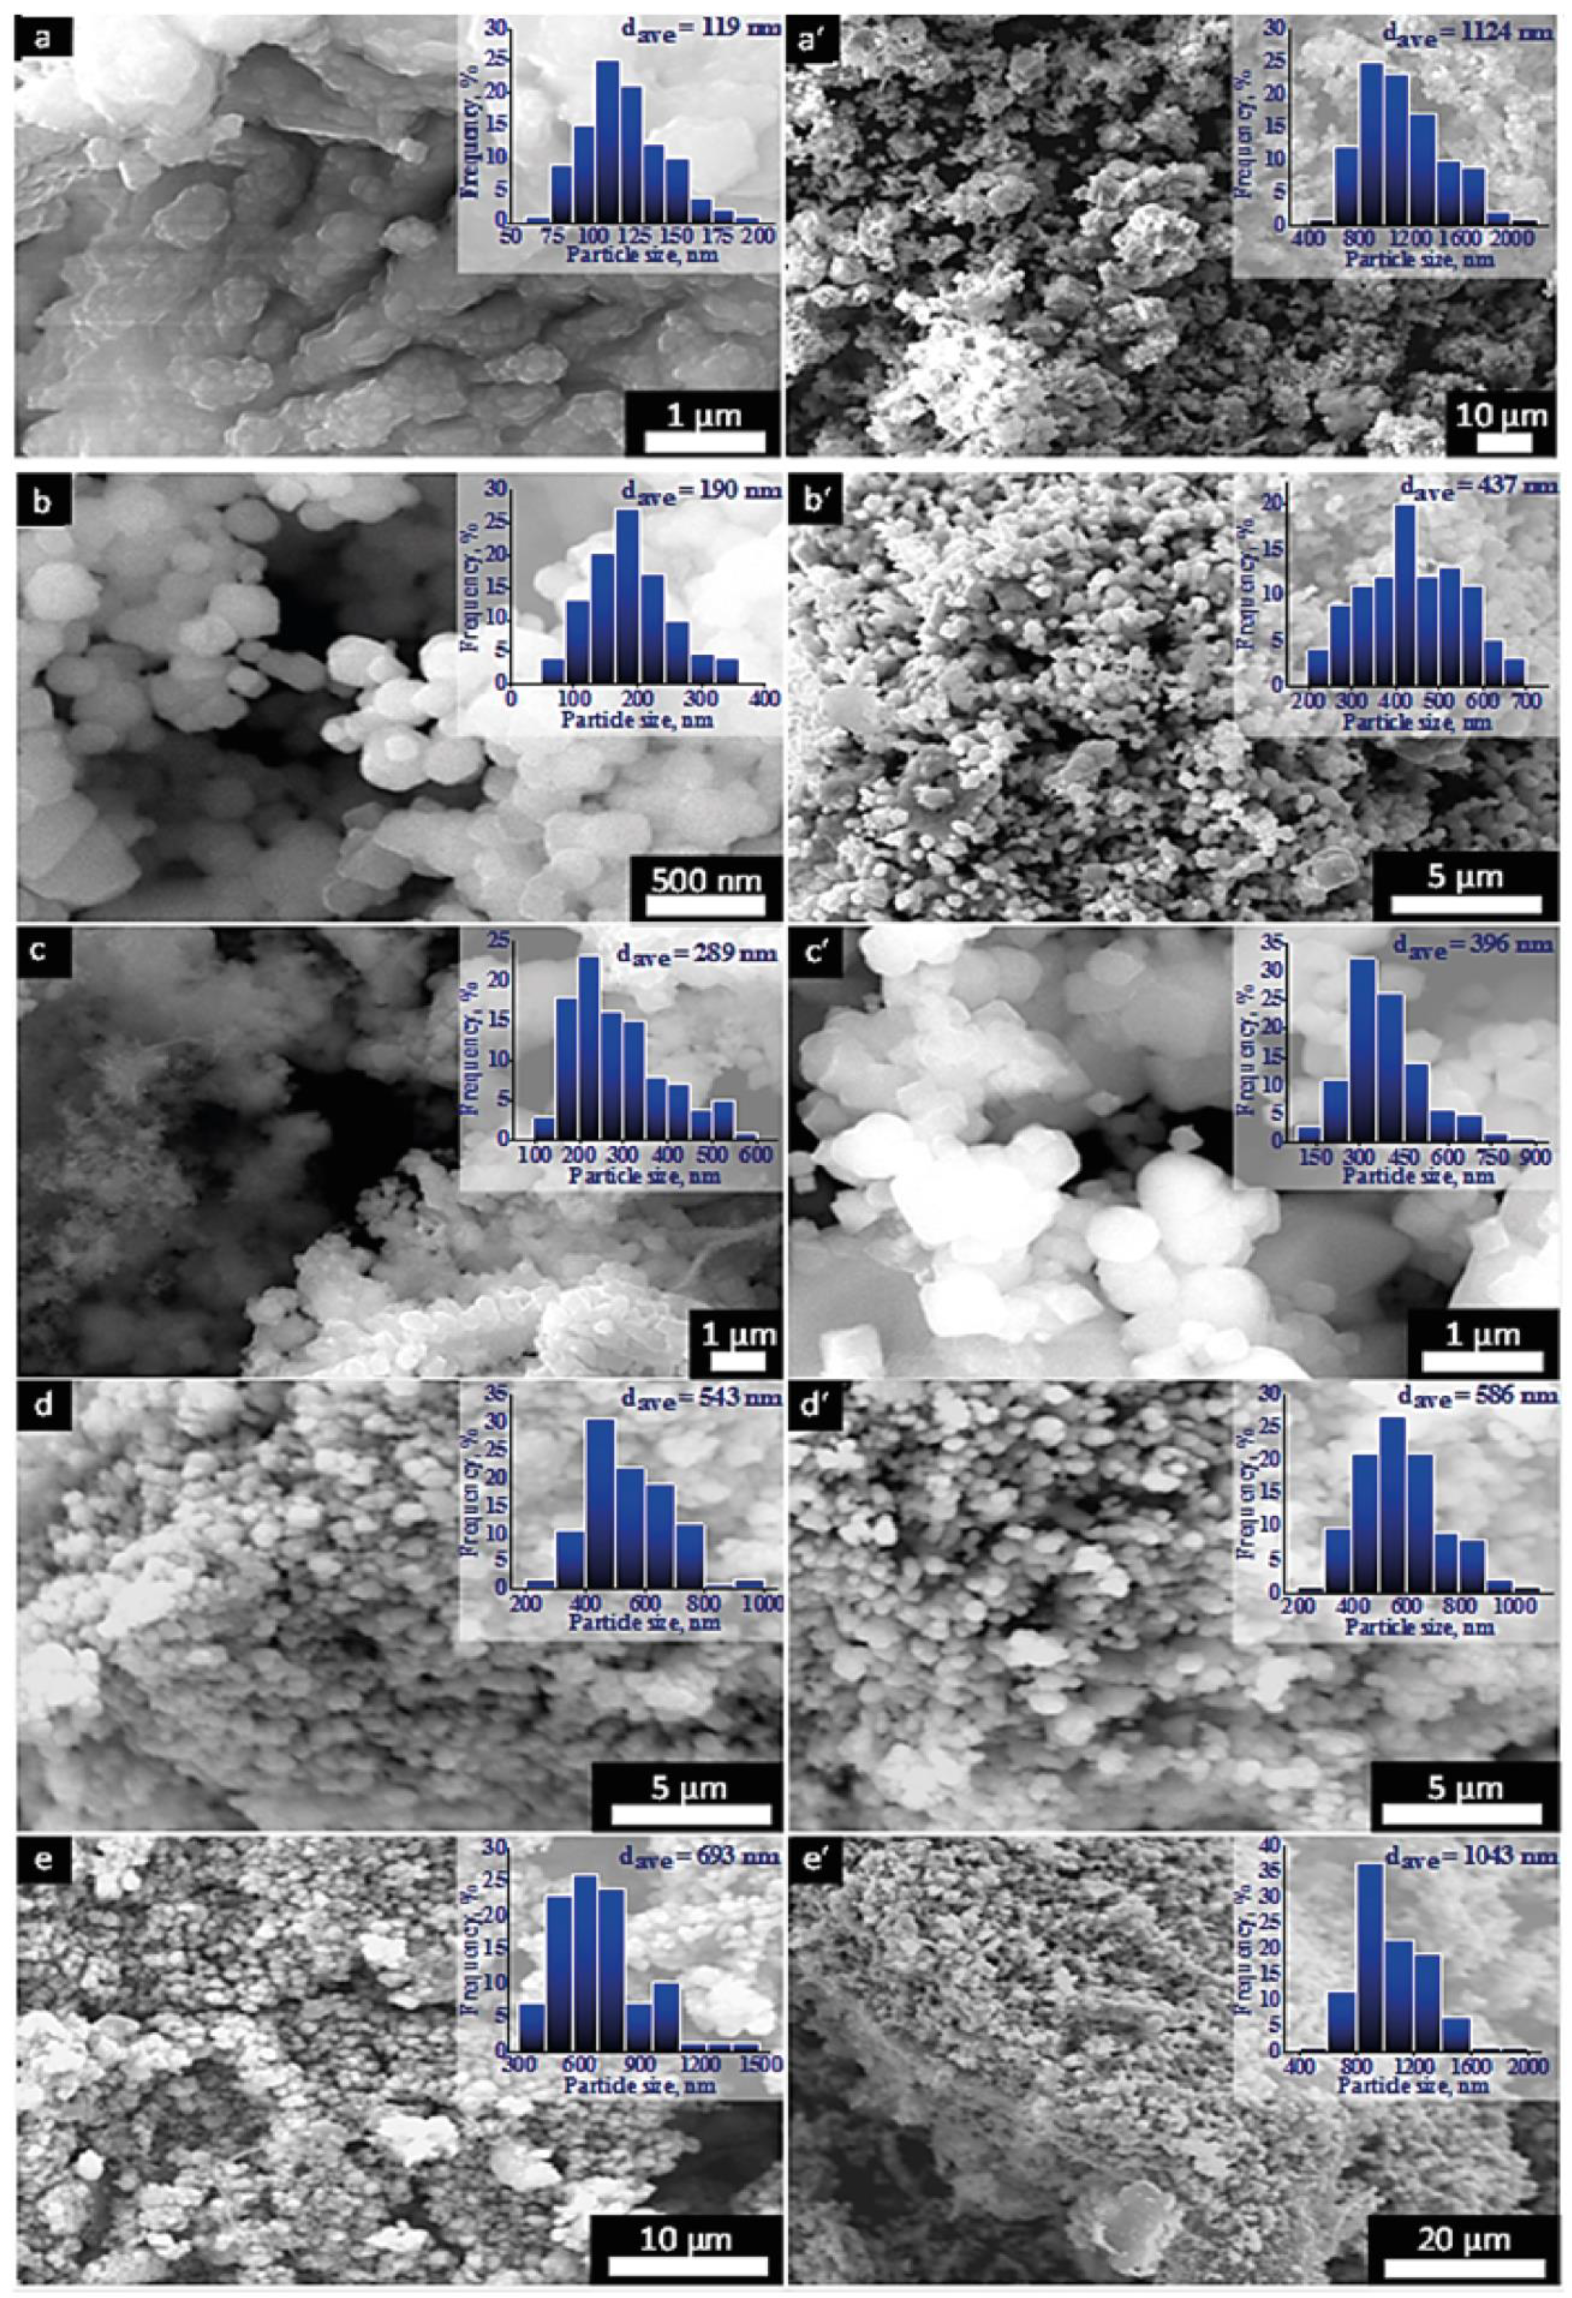
2.1.1. SEM Analysis
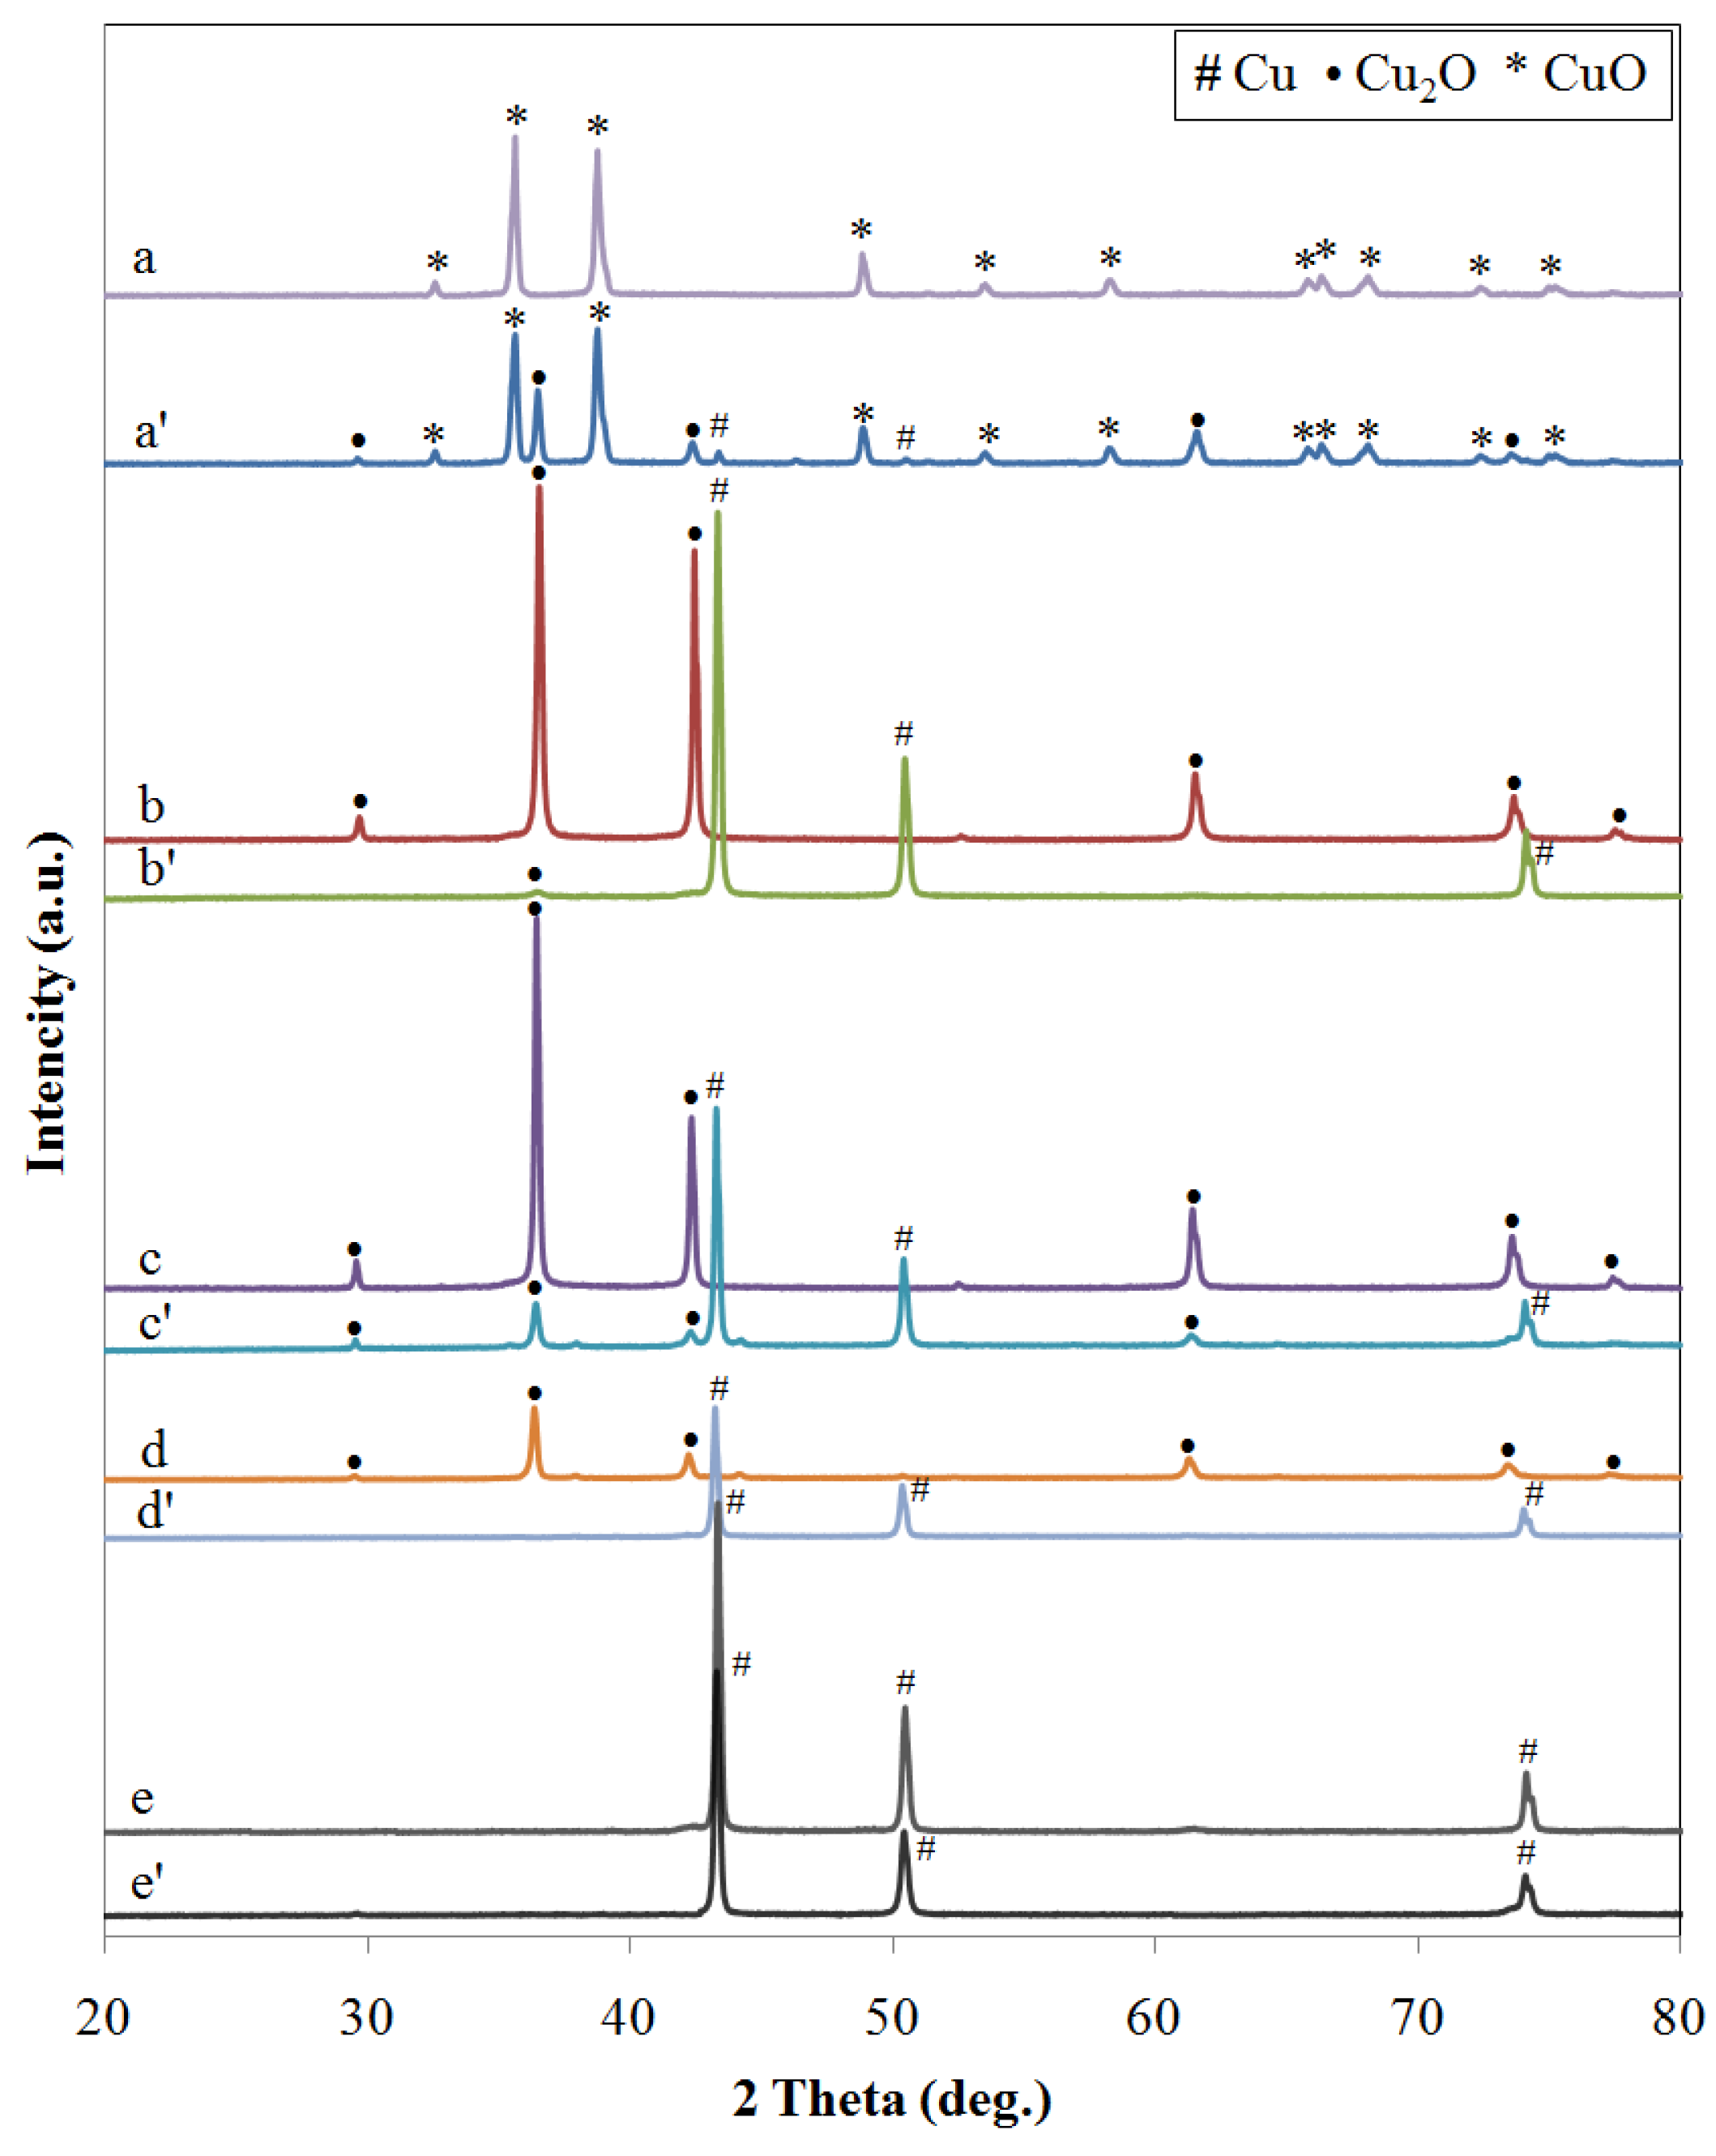
2.1.2. XRD Analysis
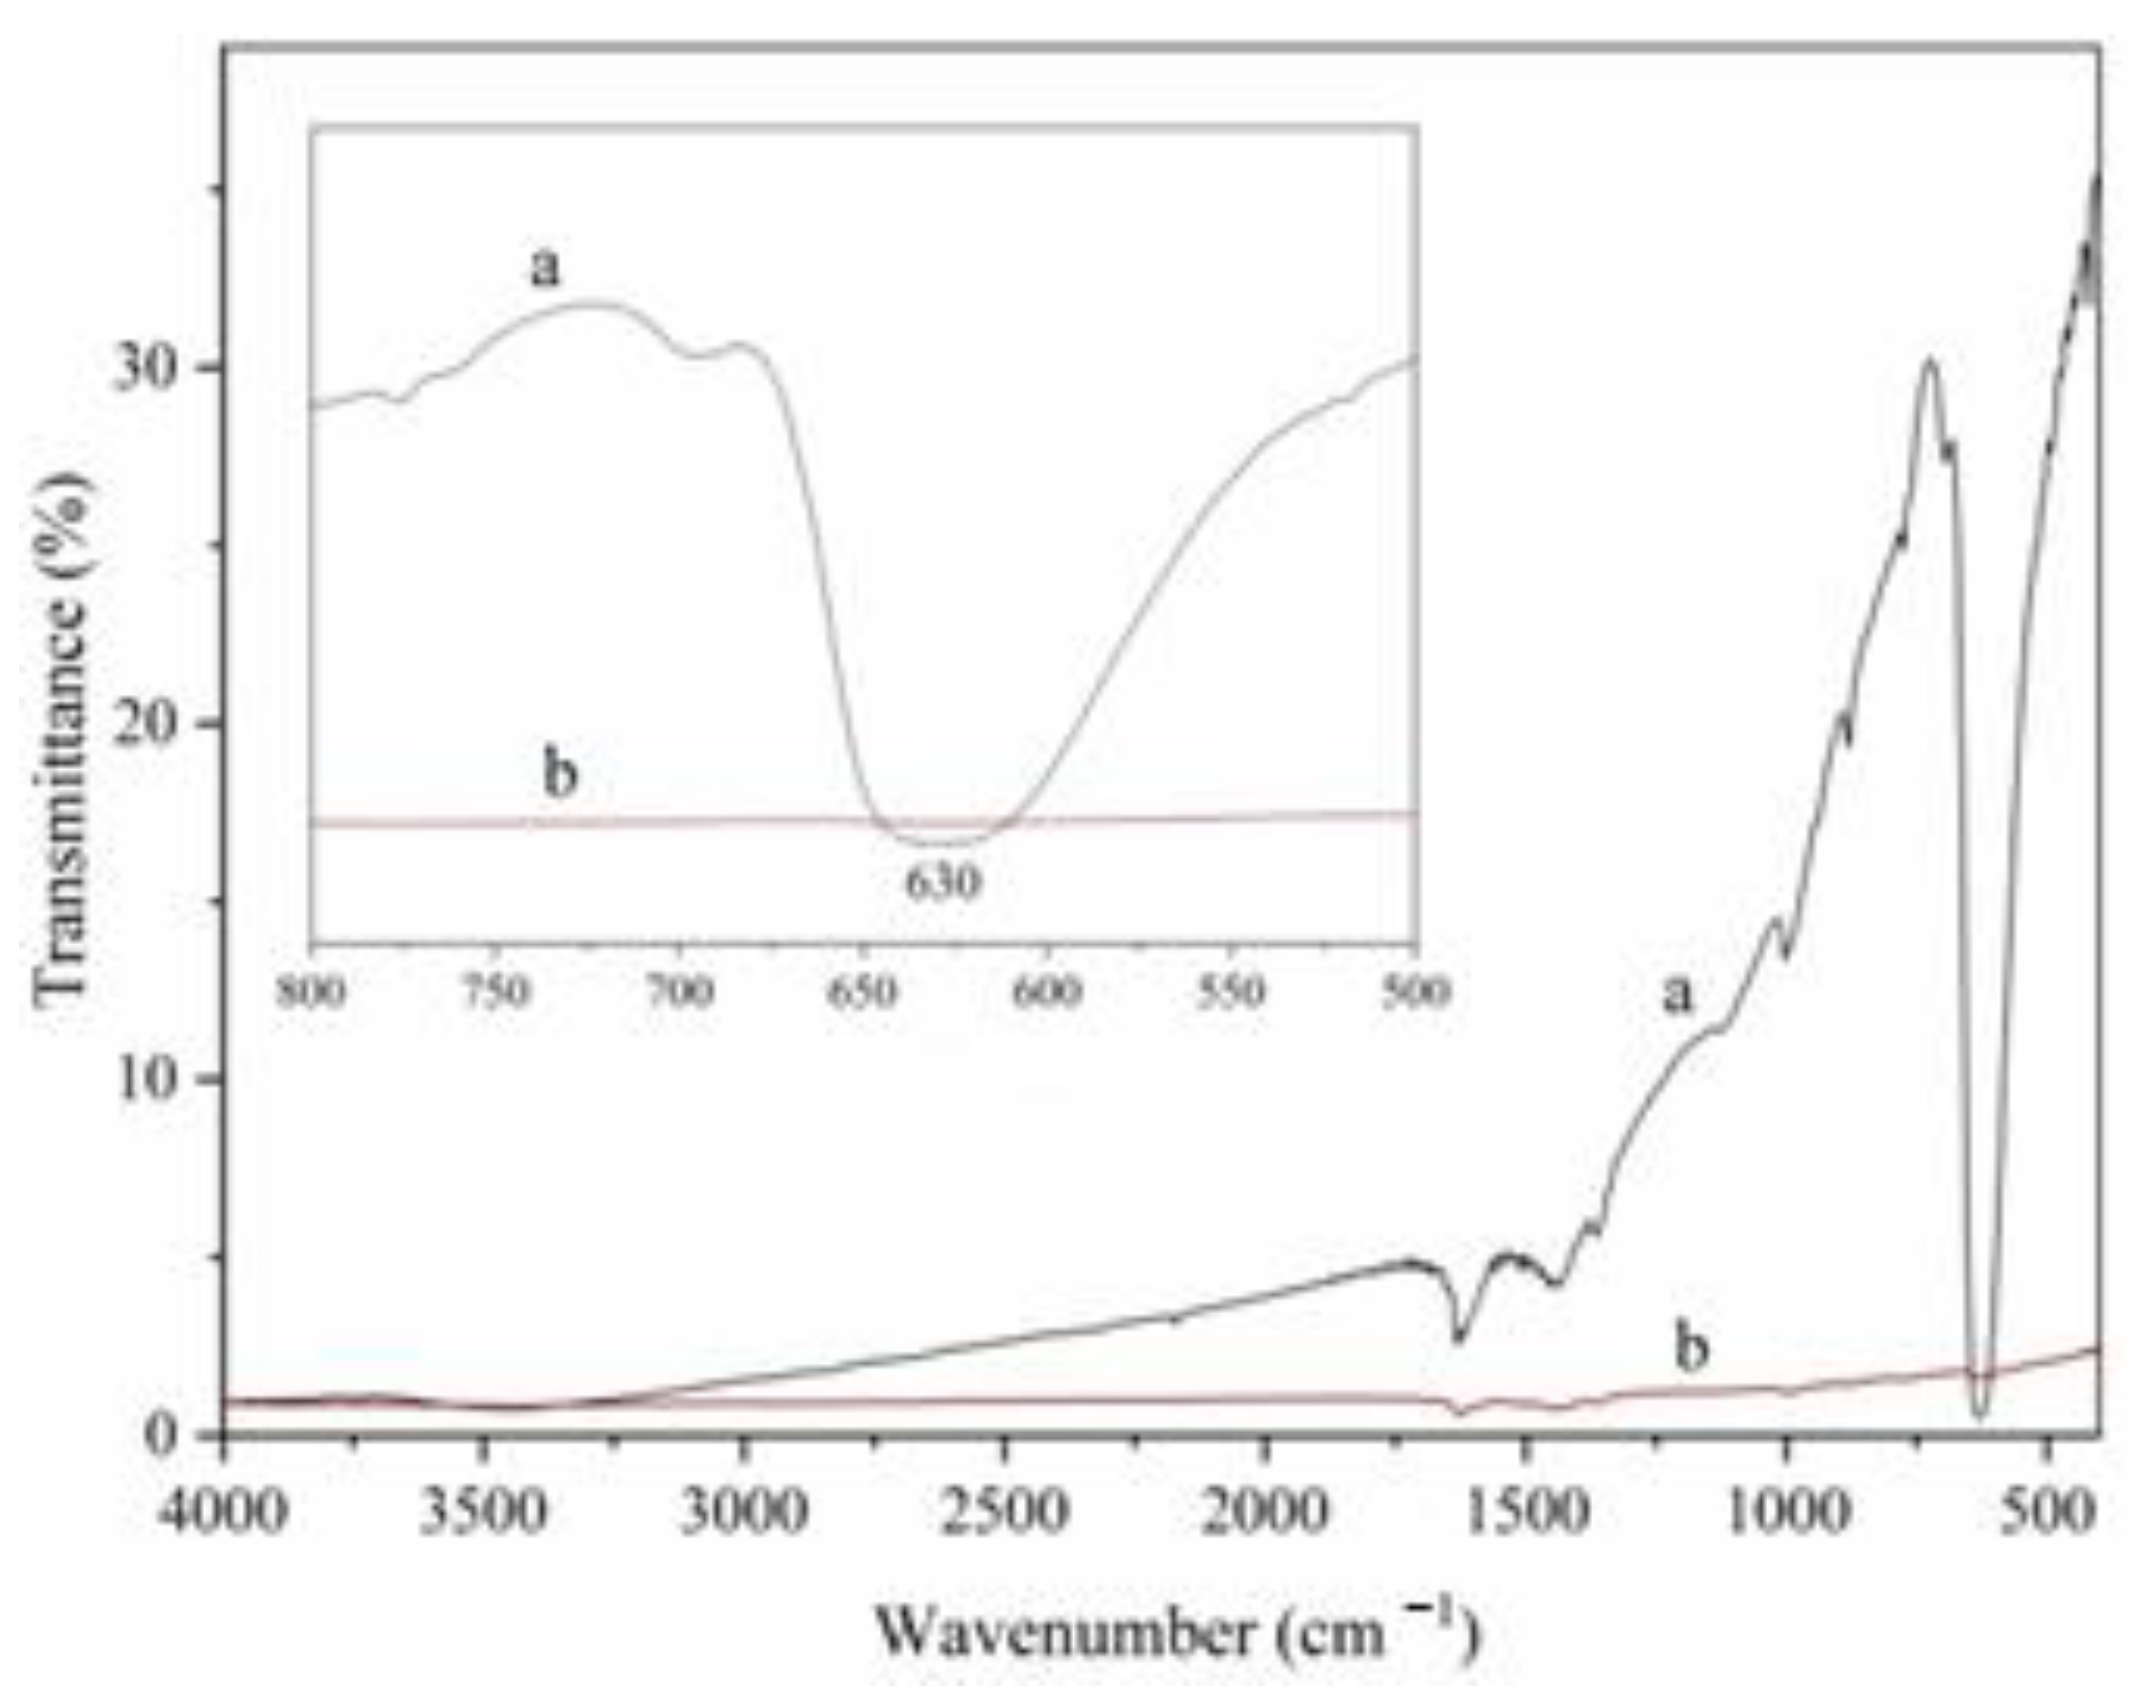
2.1.3. FTIR Analysis
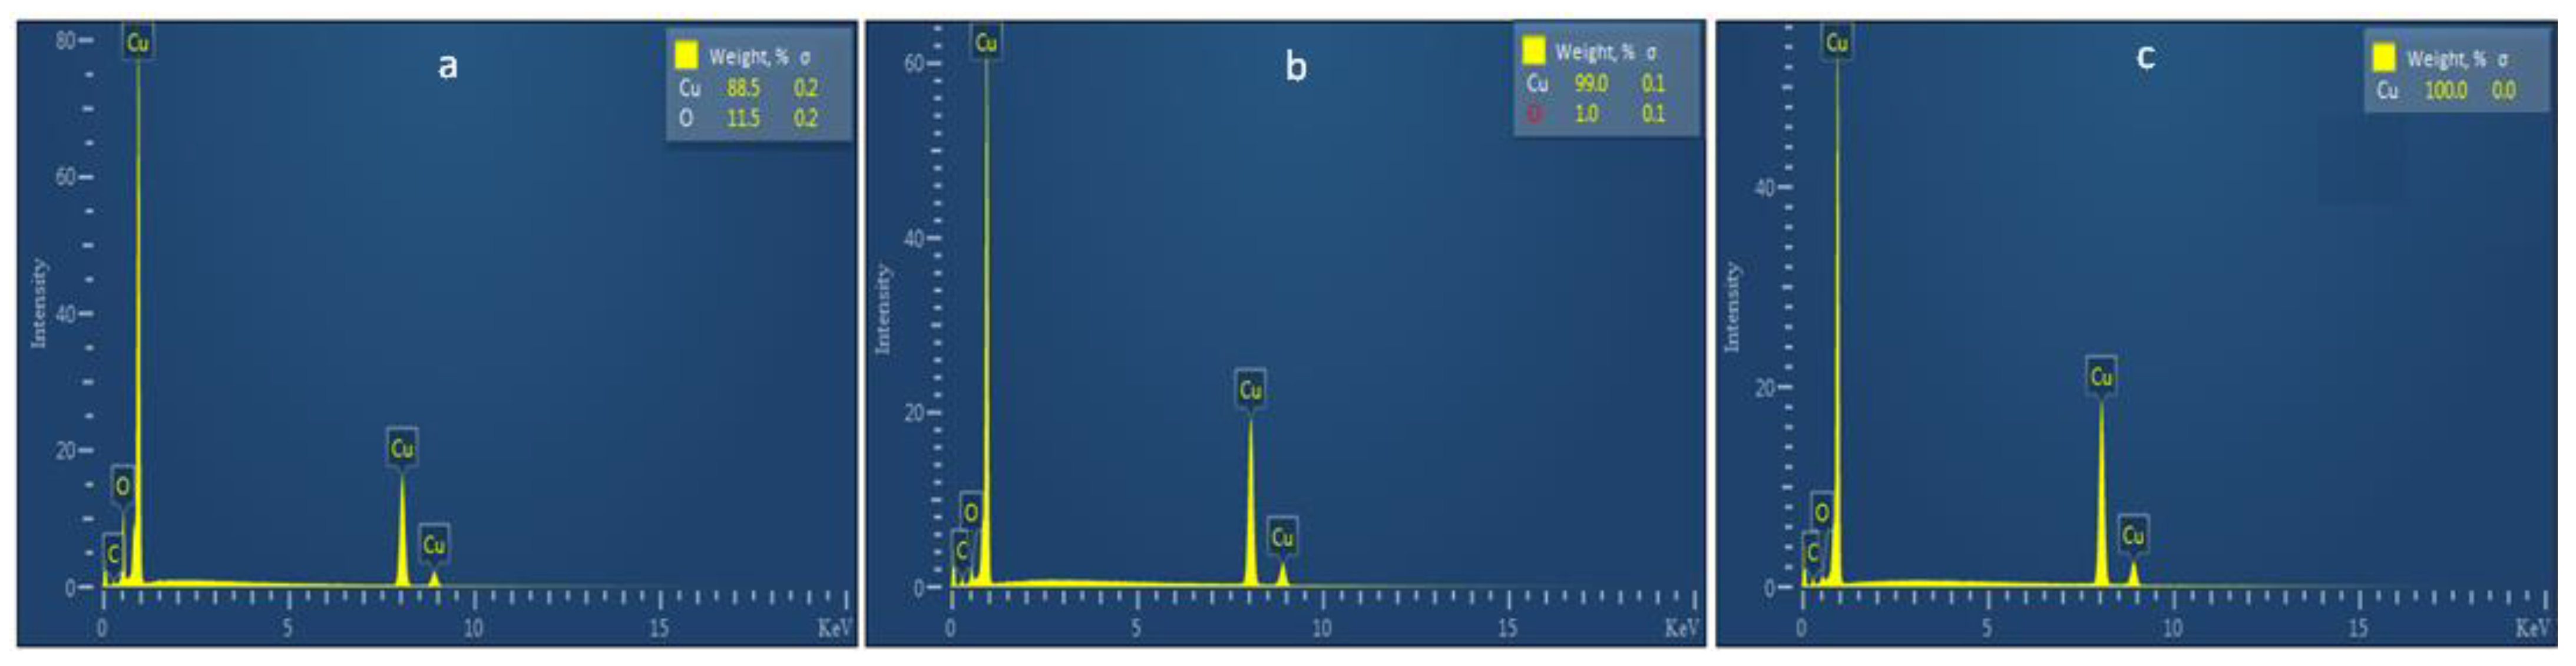
2.1.4. EDS Analysis
2.2. Effect of Reaction Conditions on the Conversion of Glycerol over In Situ Cu Catalyst
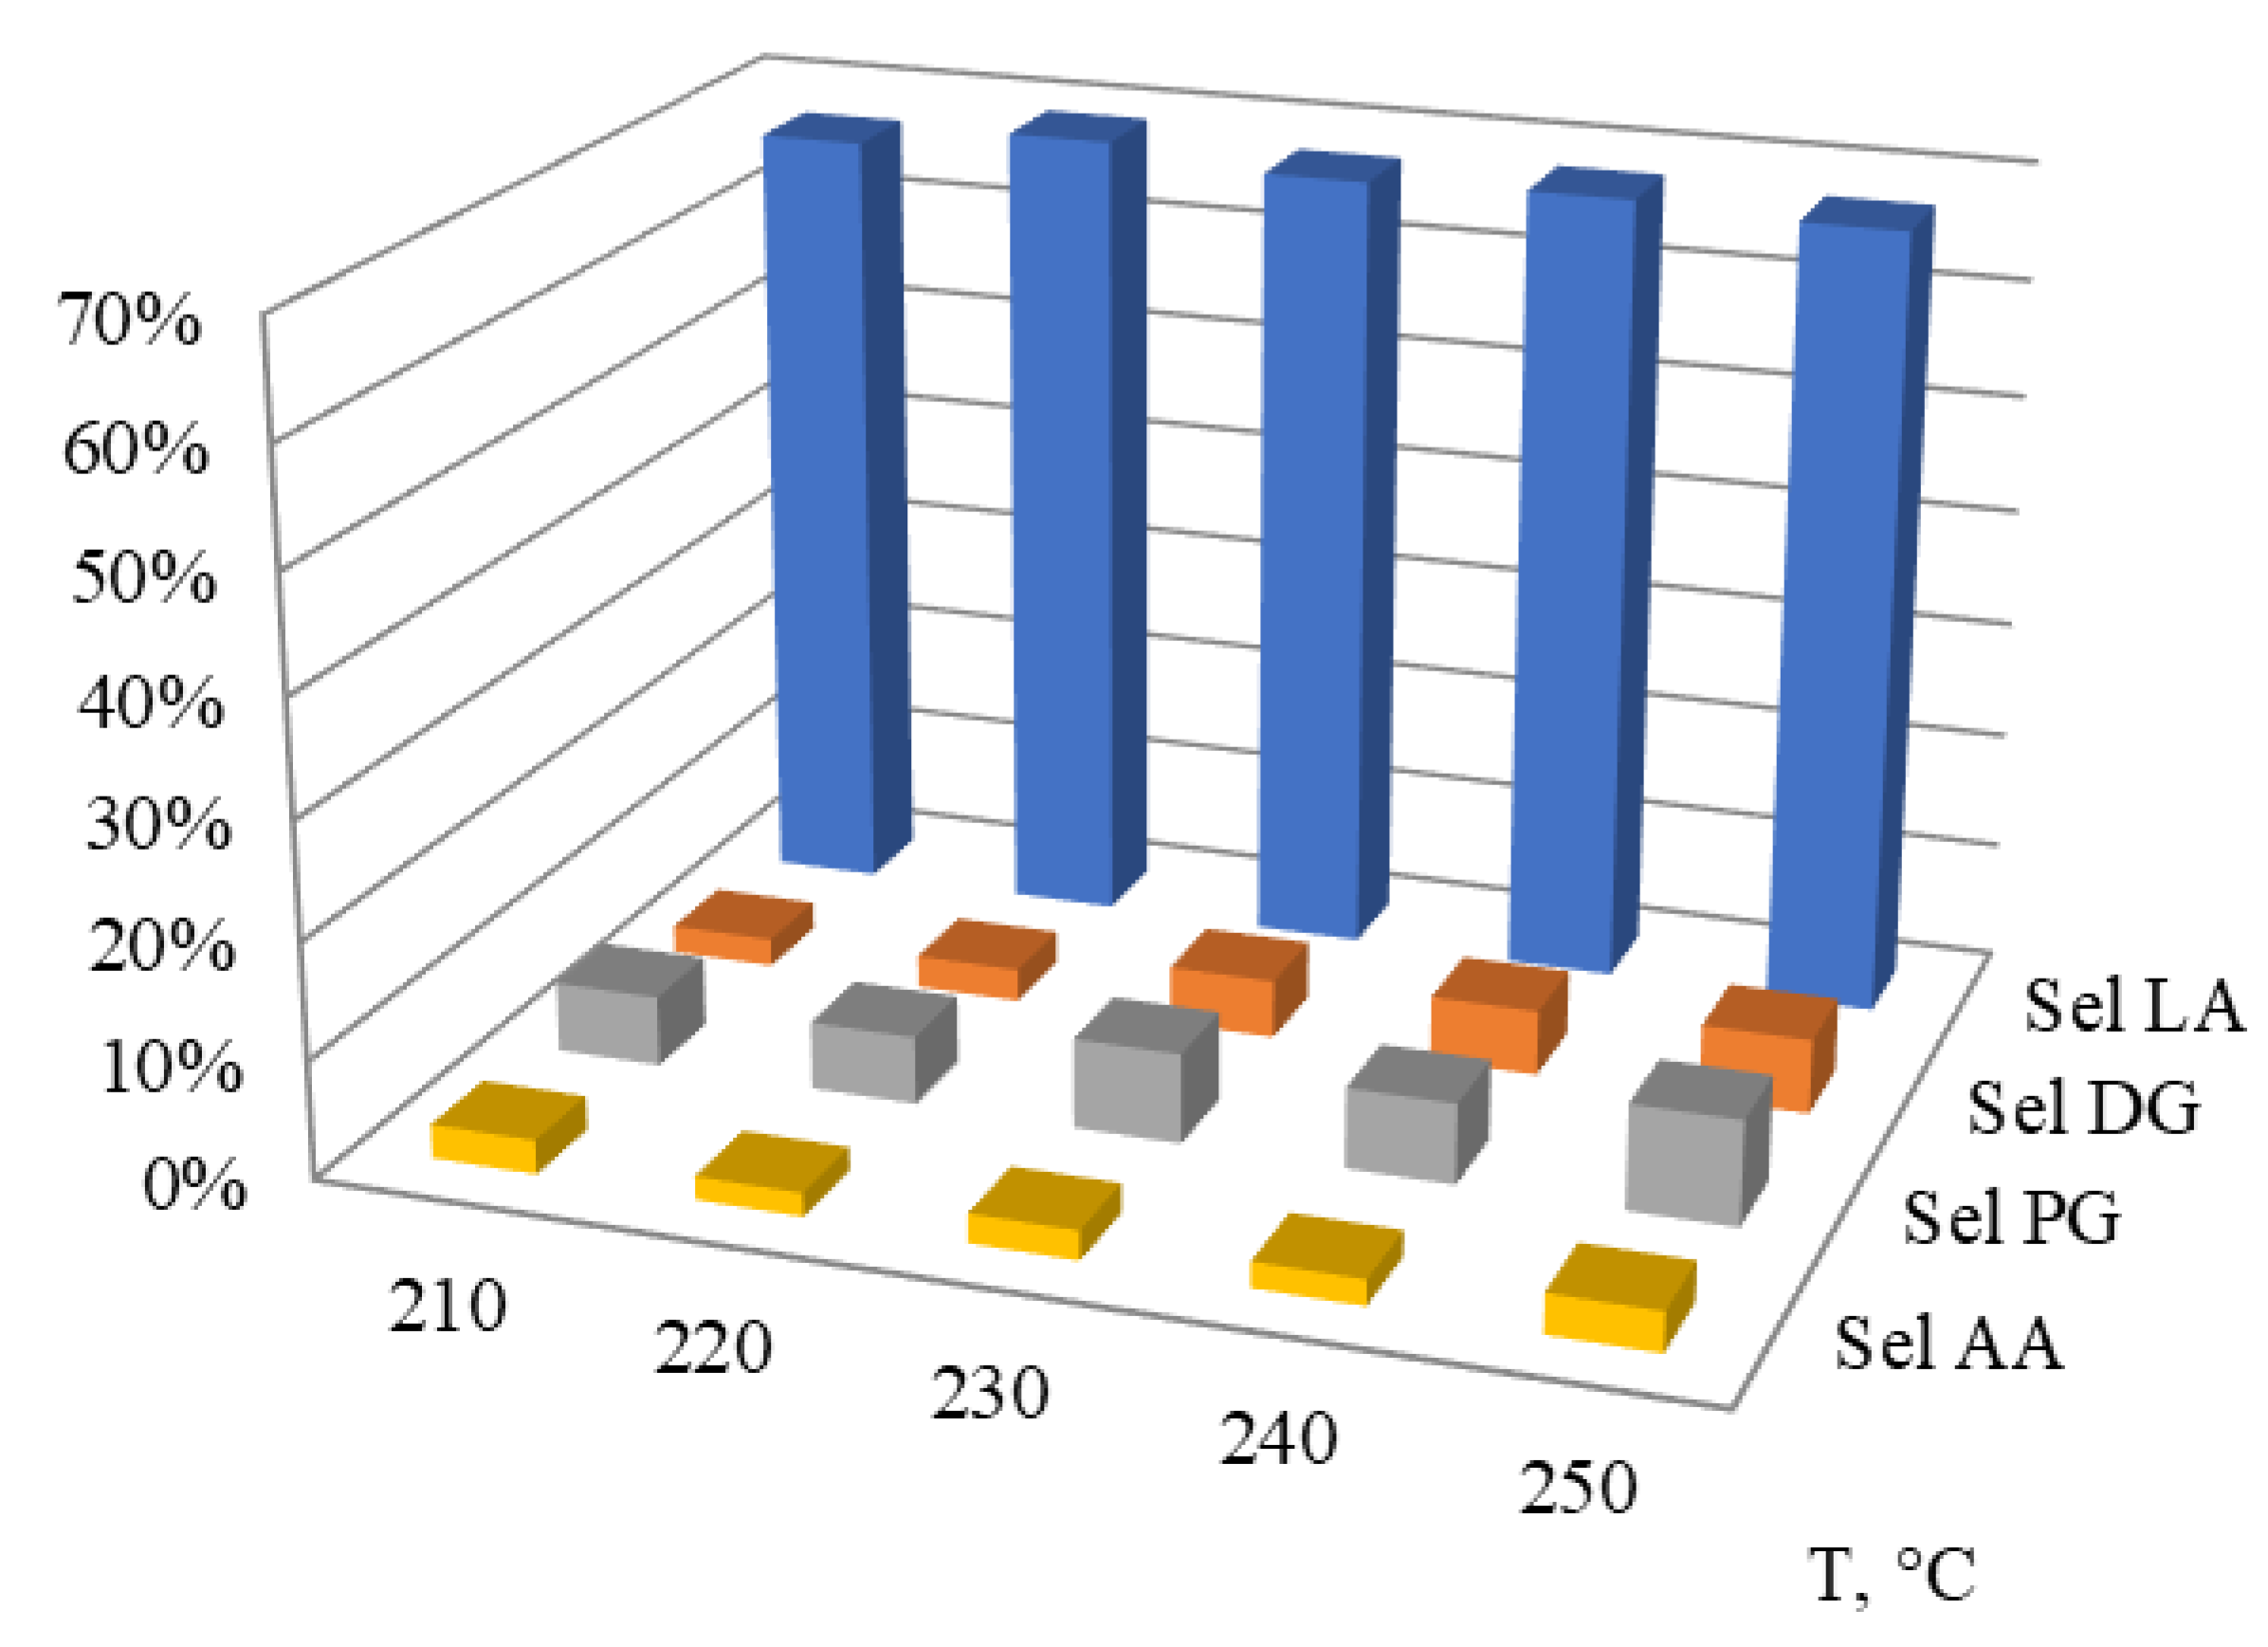
2.2.1. Effect of the Reaction Temperature
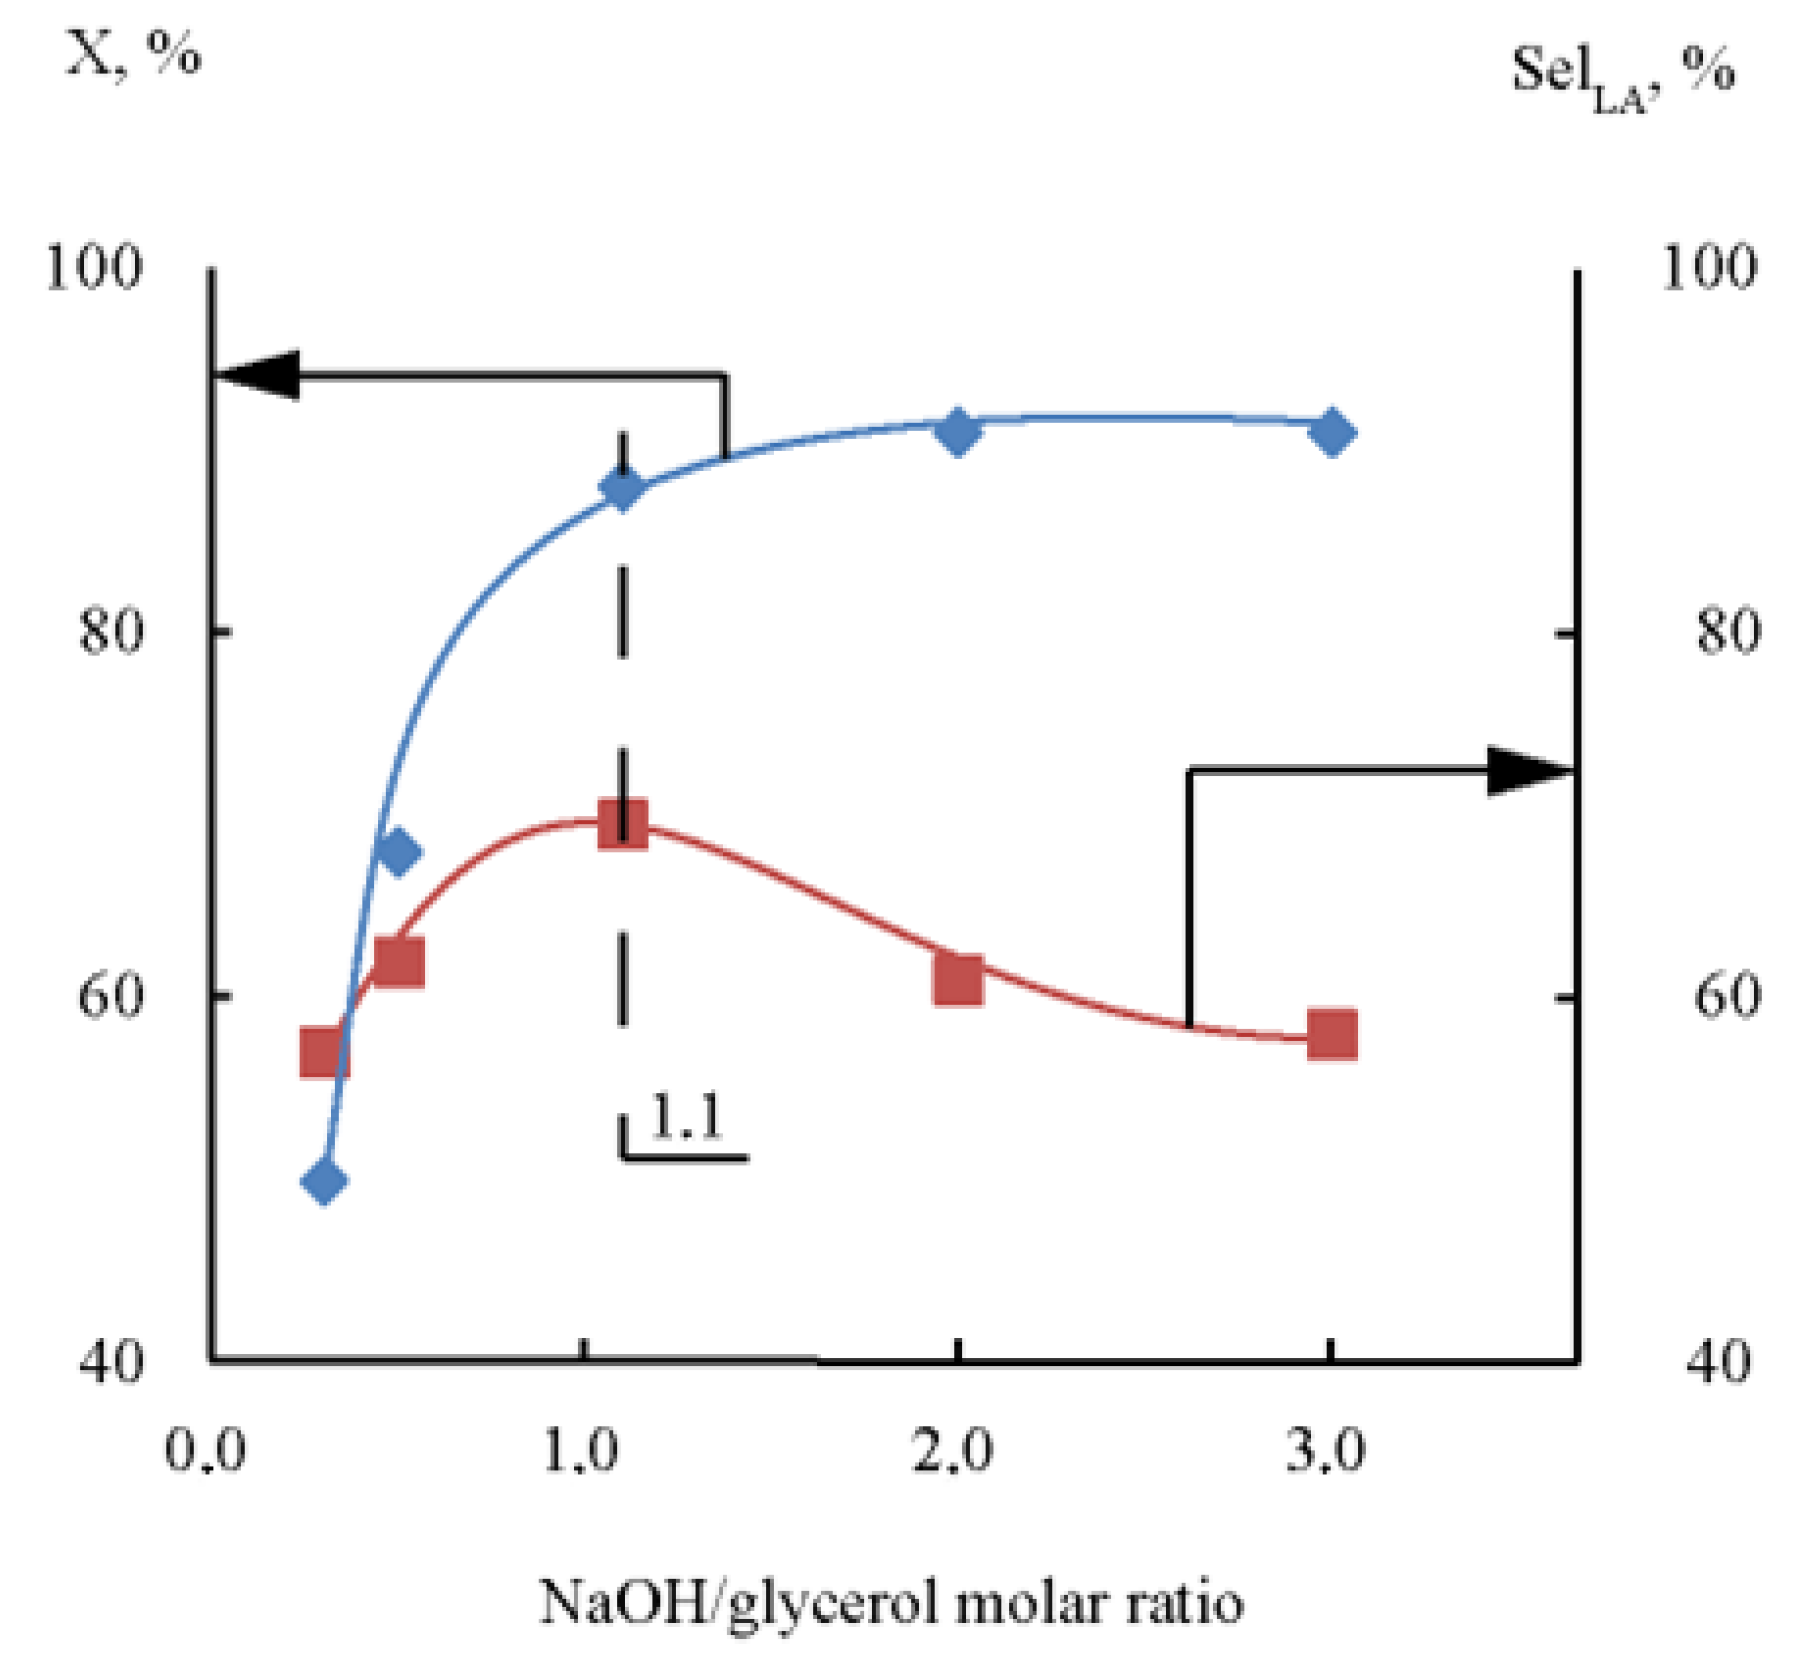
2.2.2. Effect of NaOH/glycerol Molar Ratio
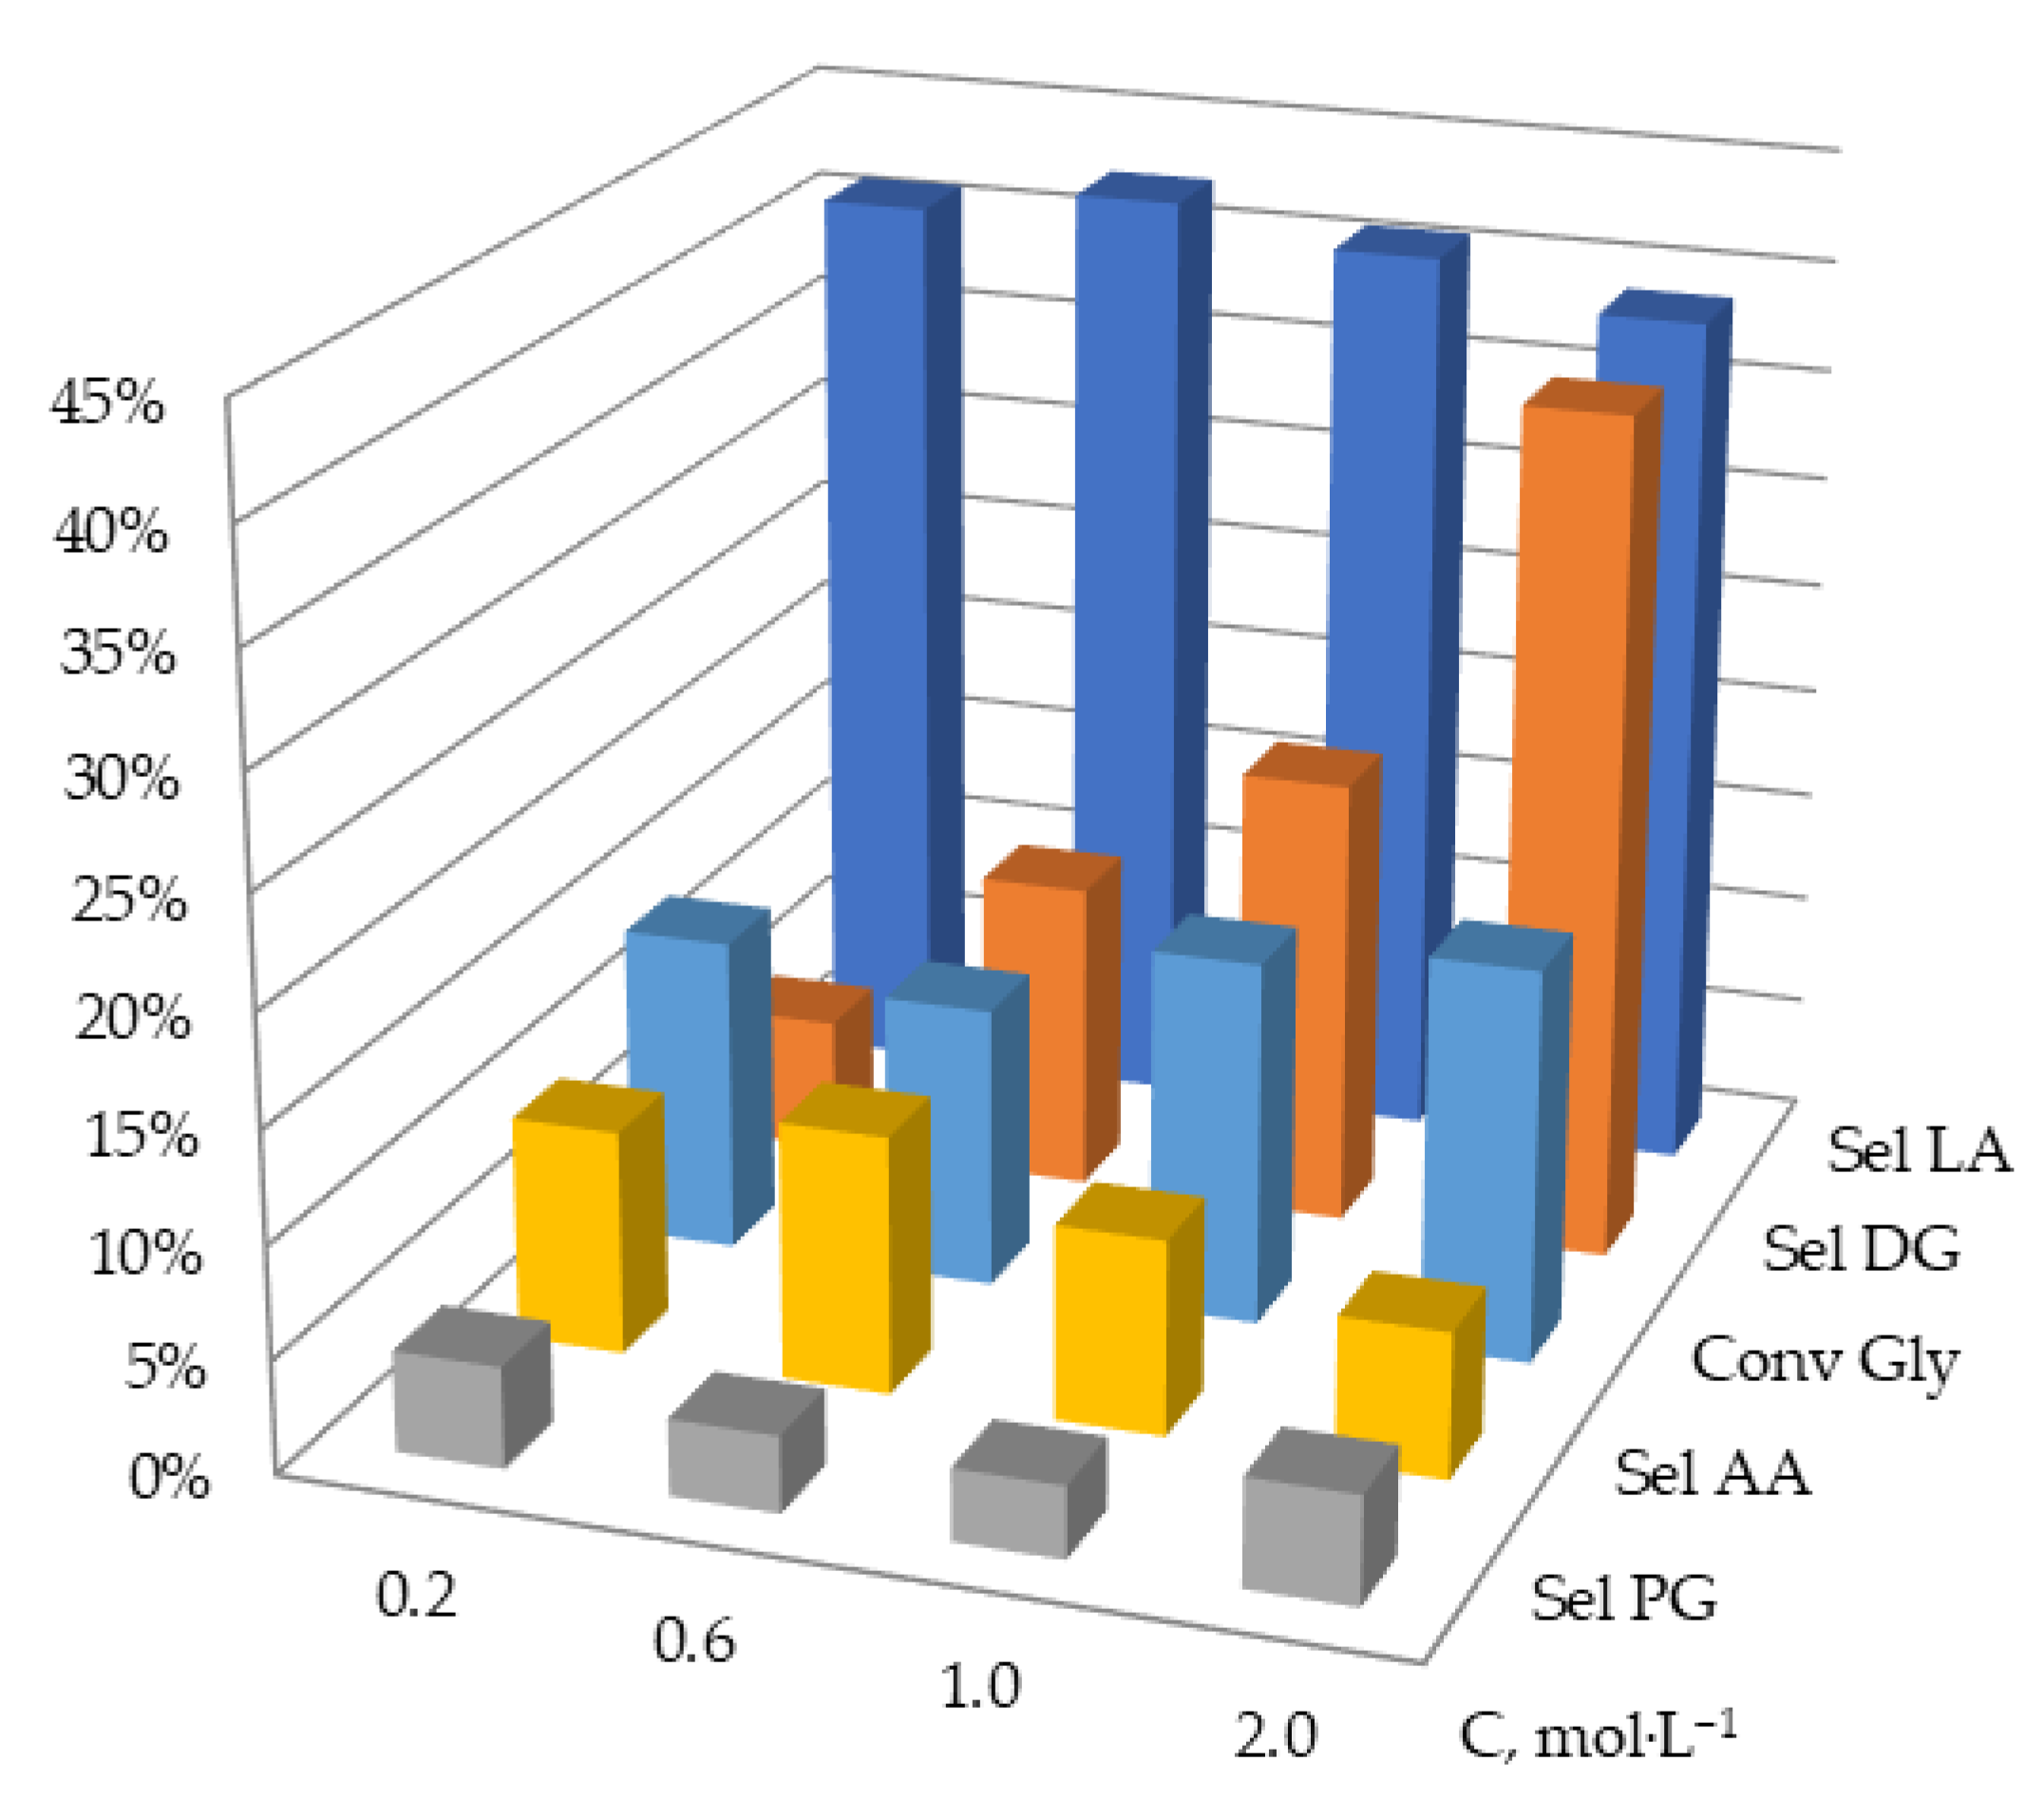
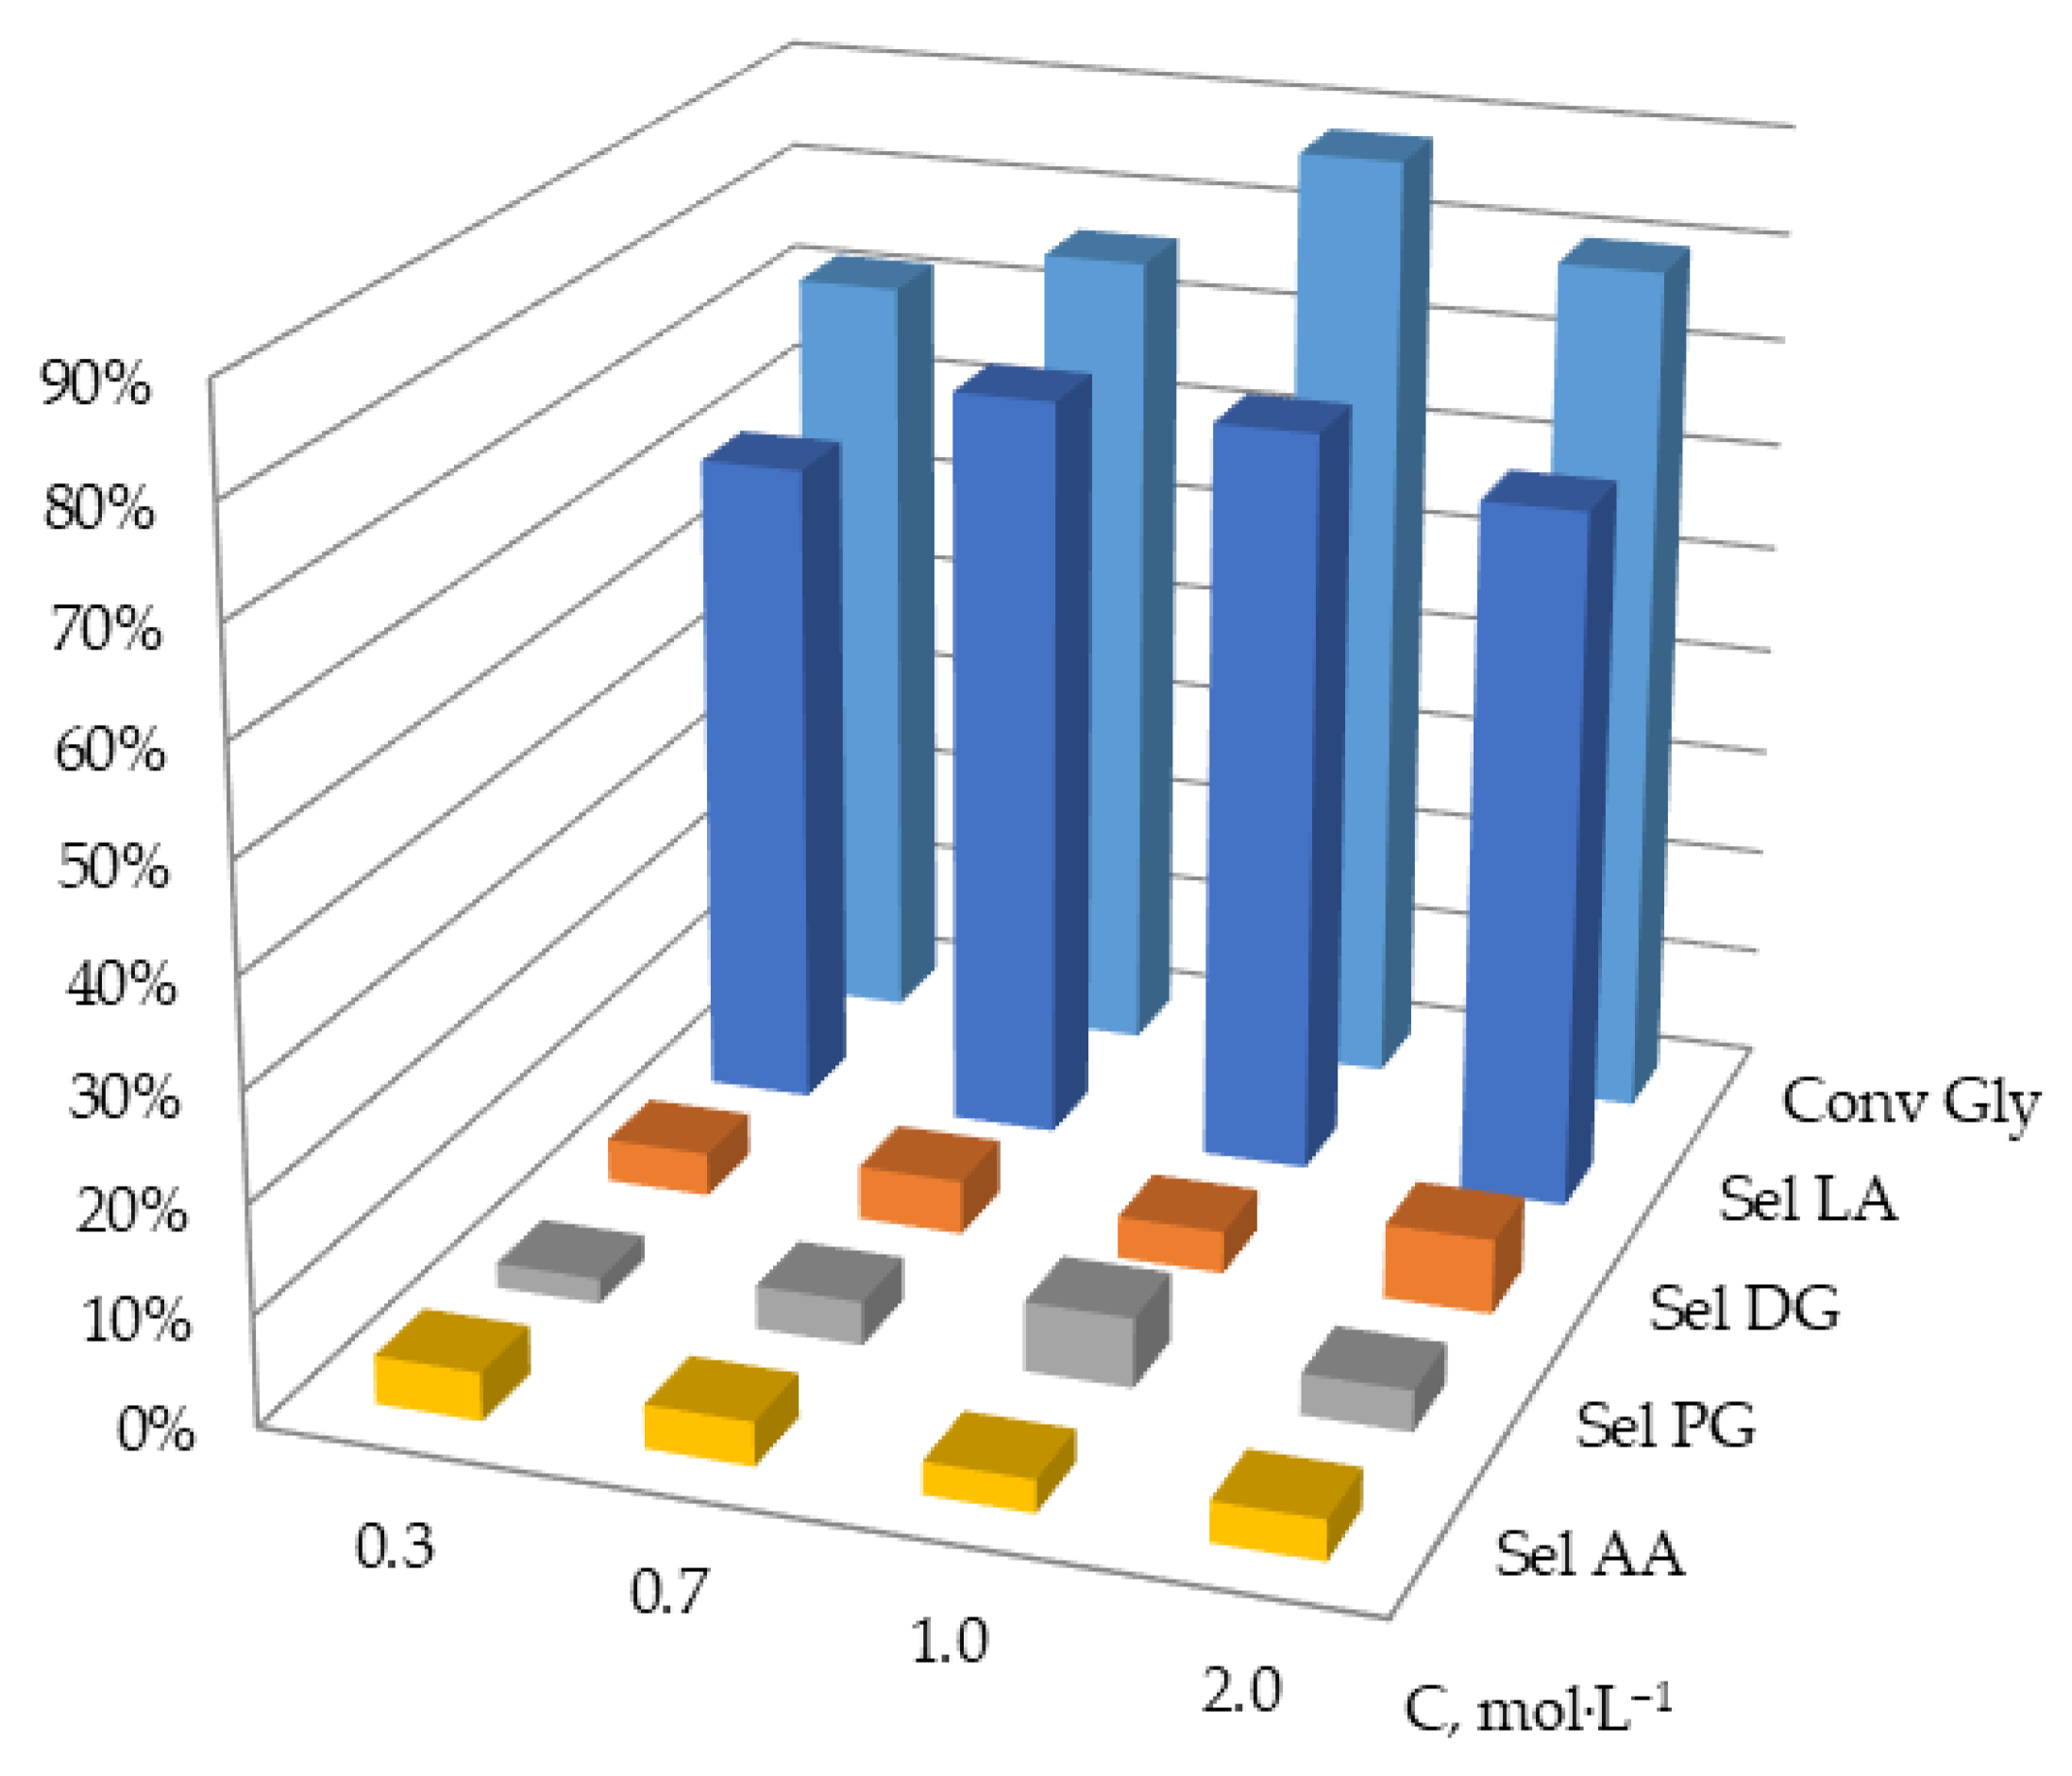
2.2.3. Effect of Initial Glycerol Concentration
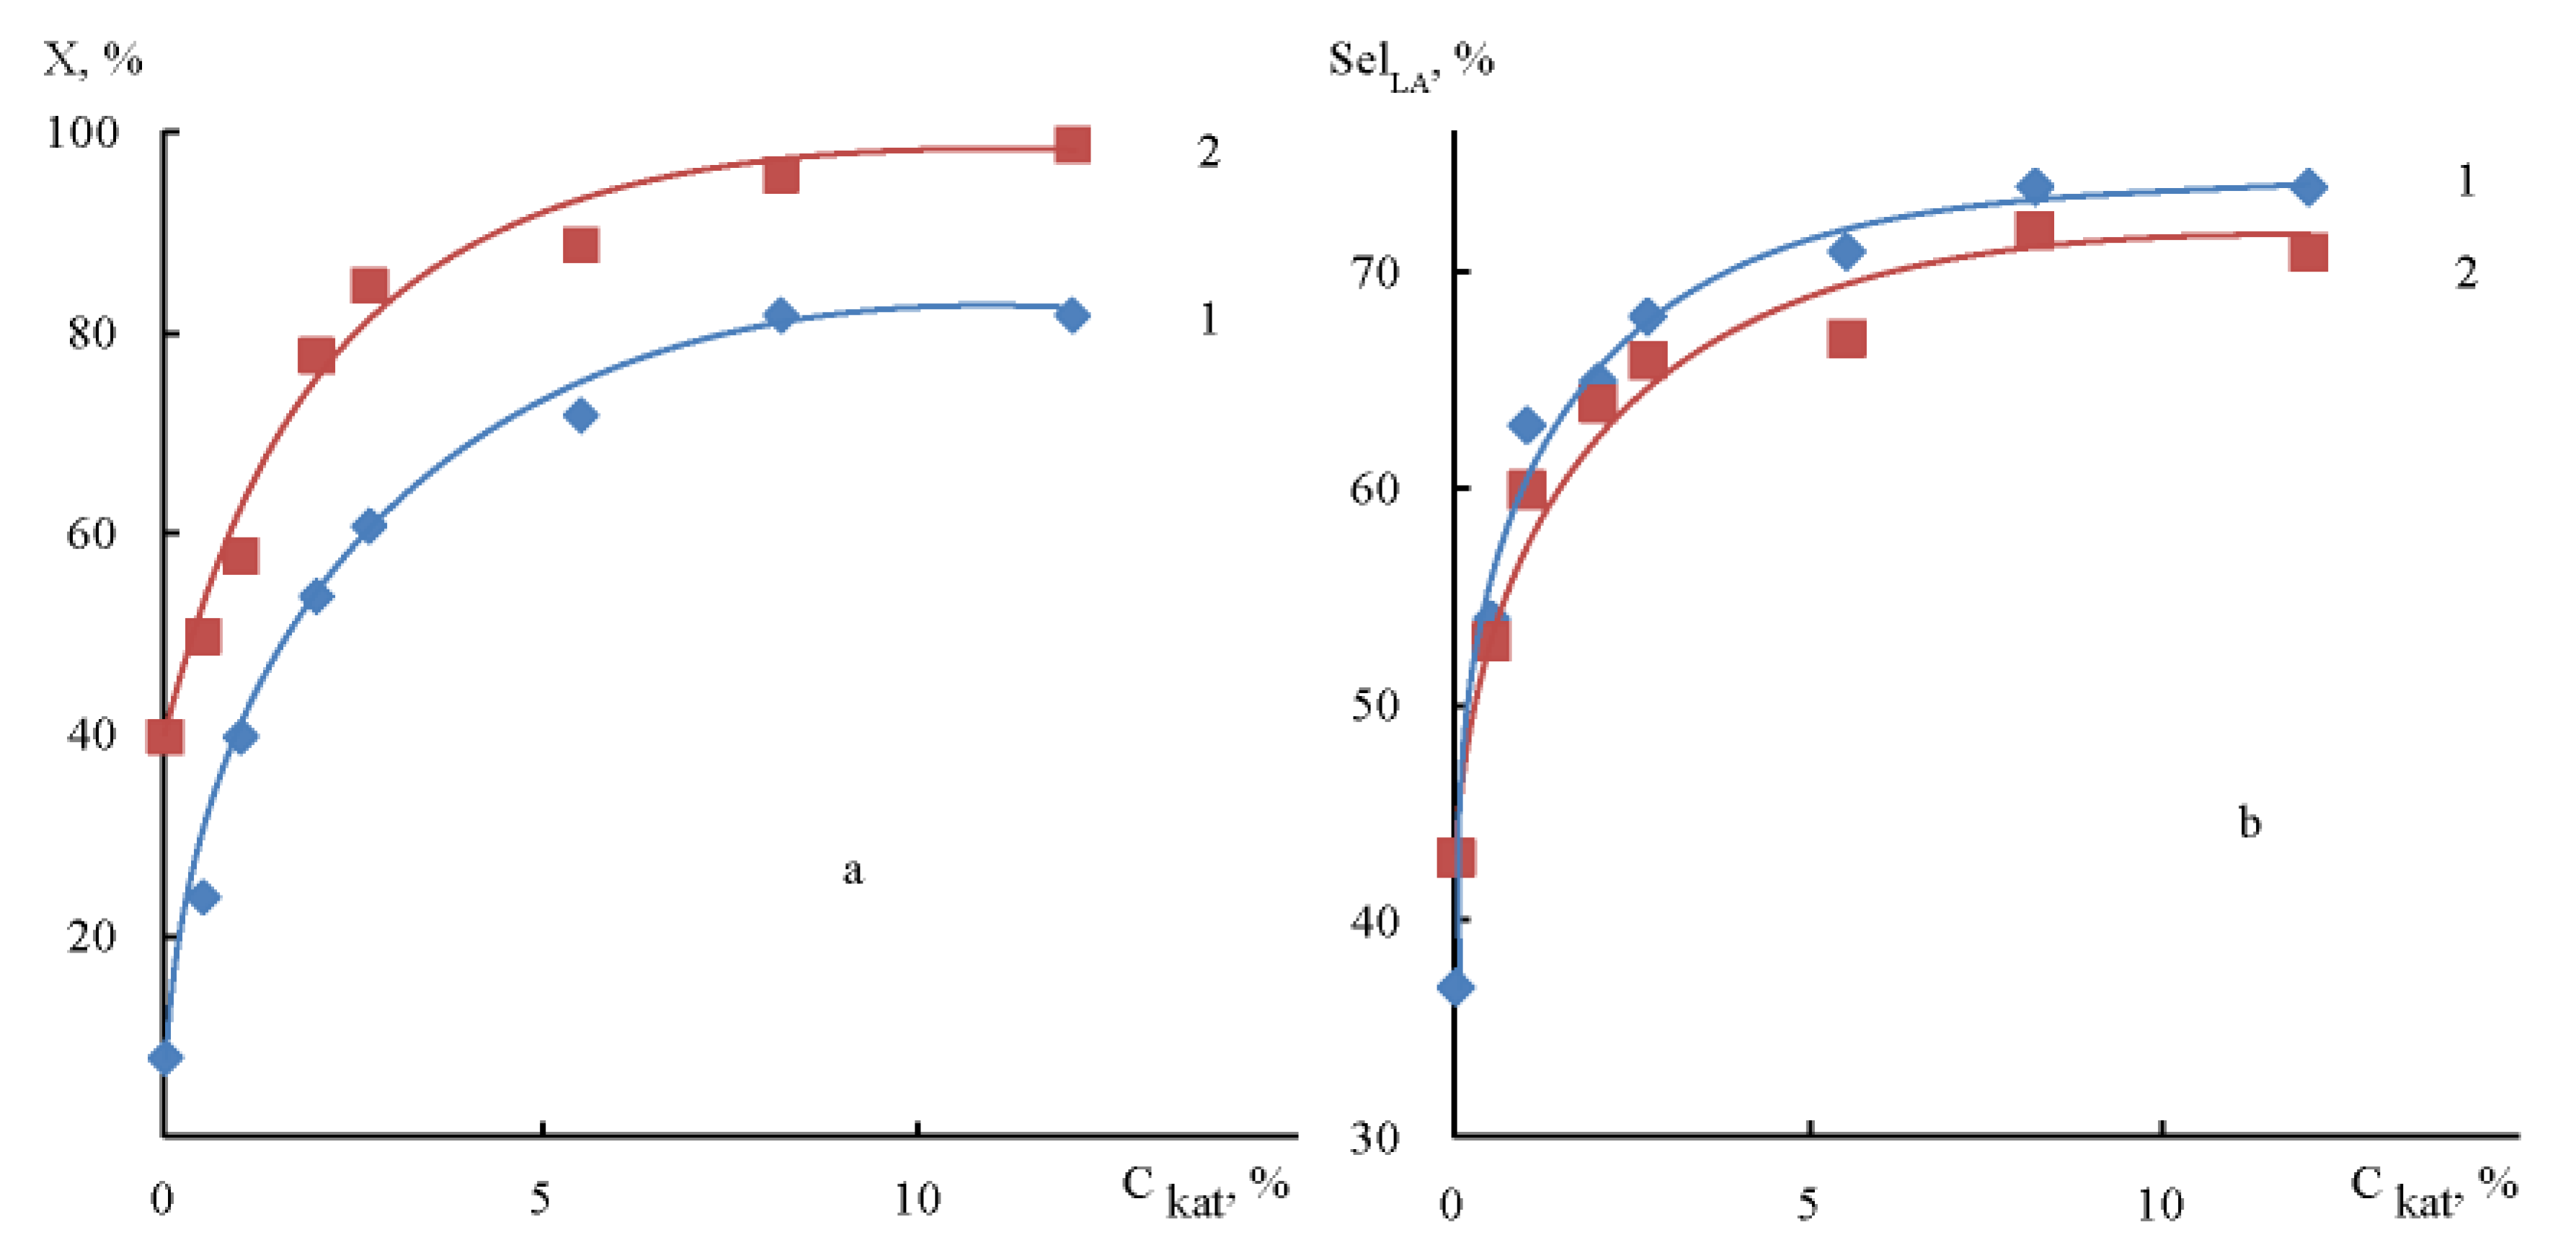
2.2.4. Effect of Catalyst Loading
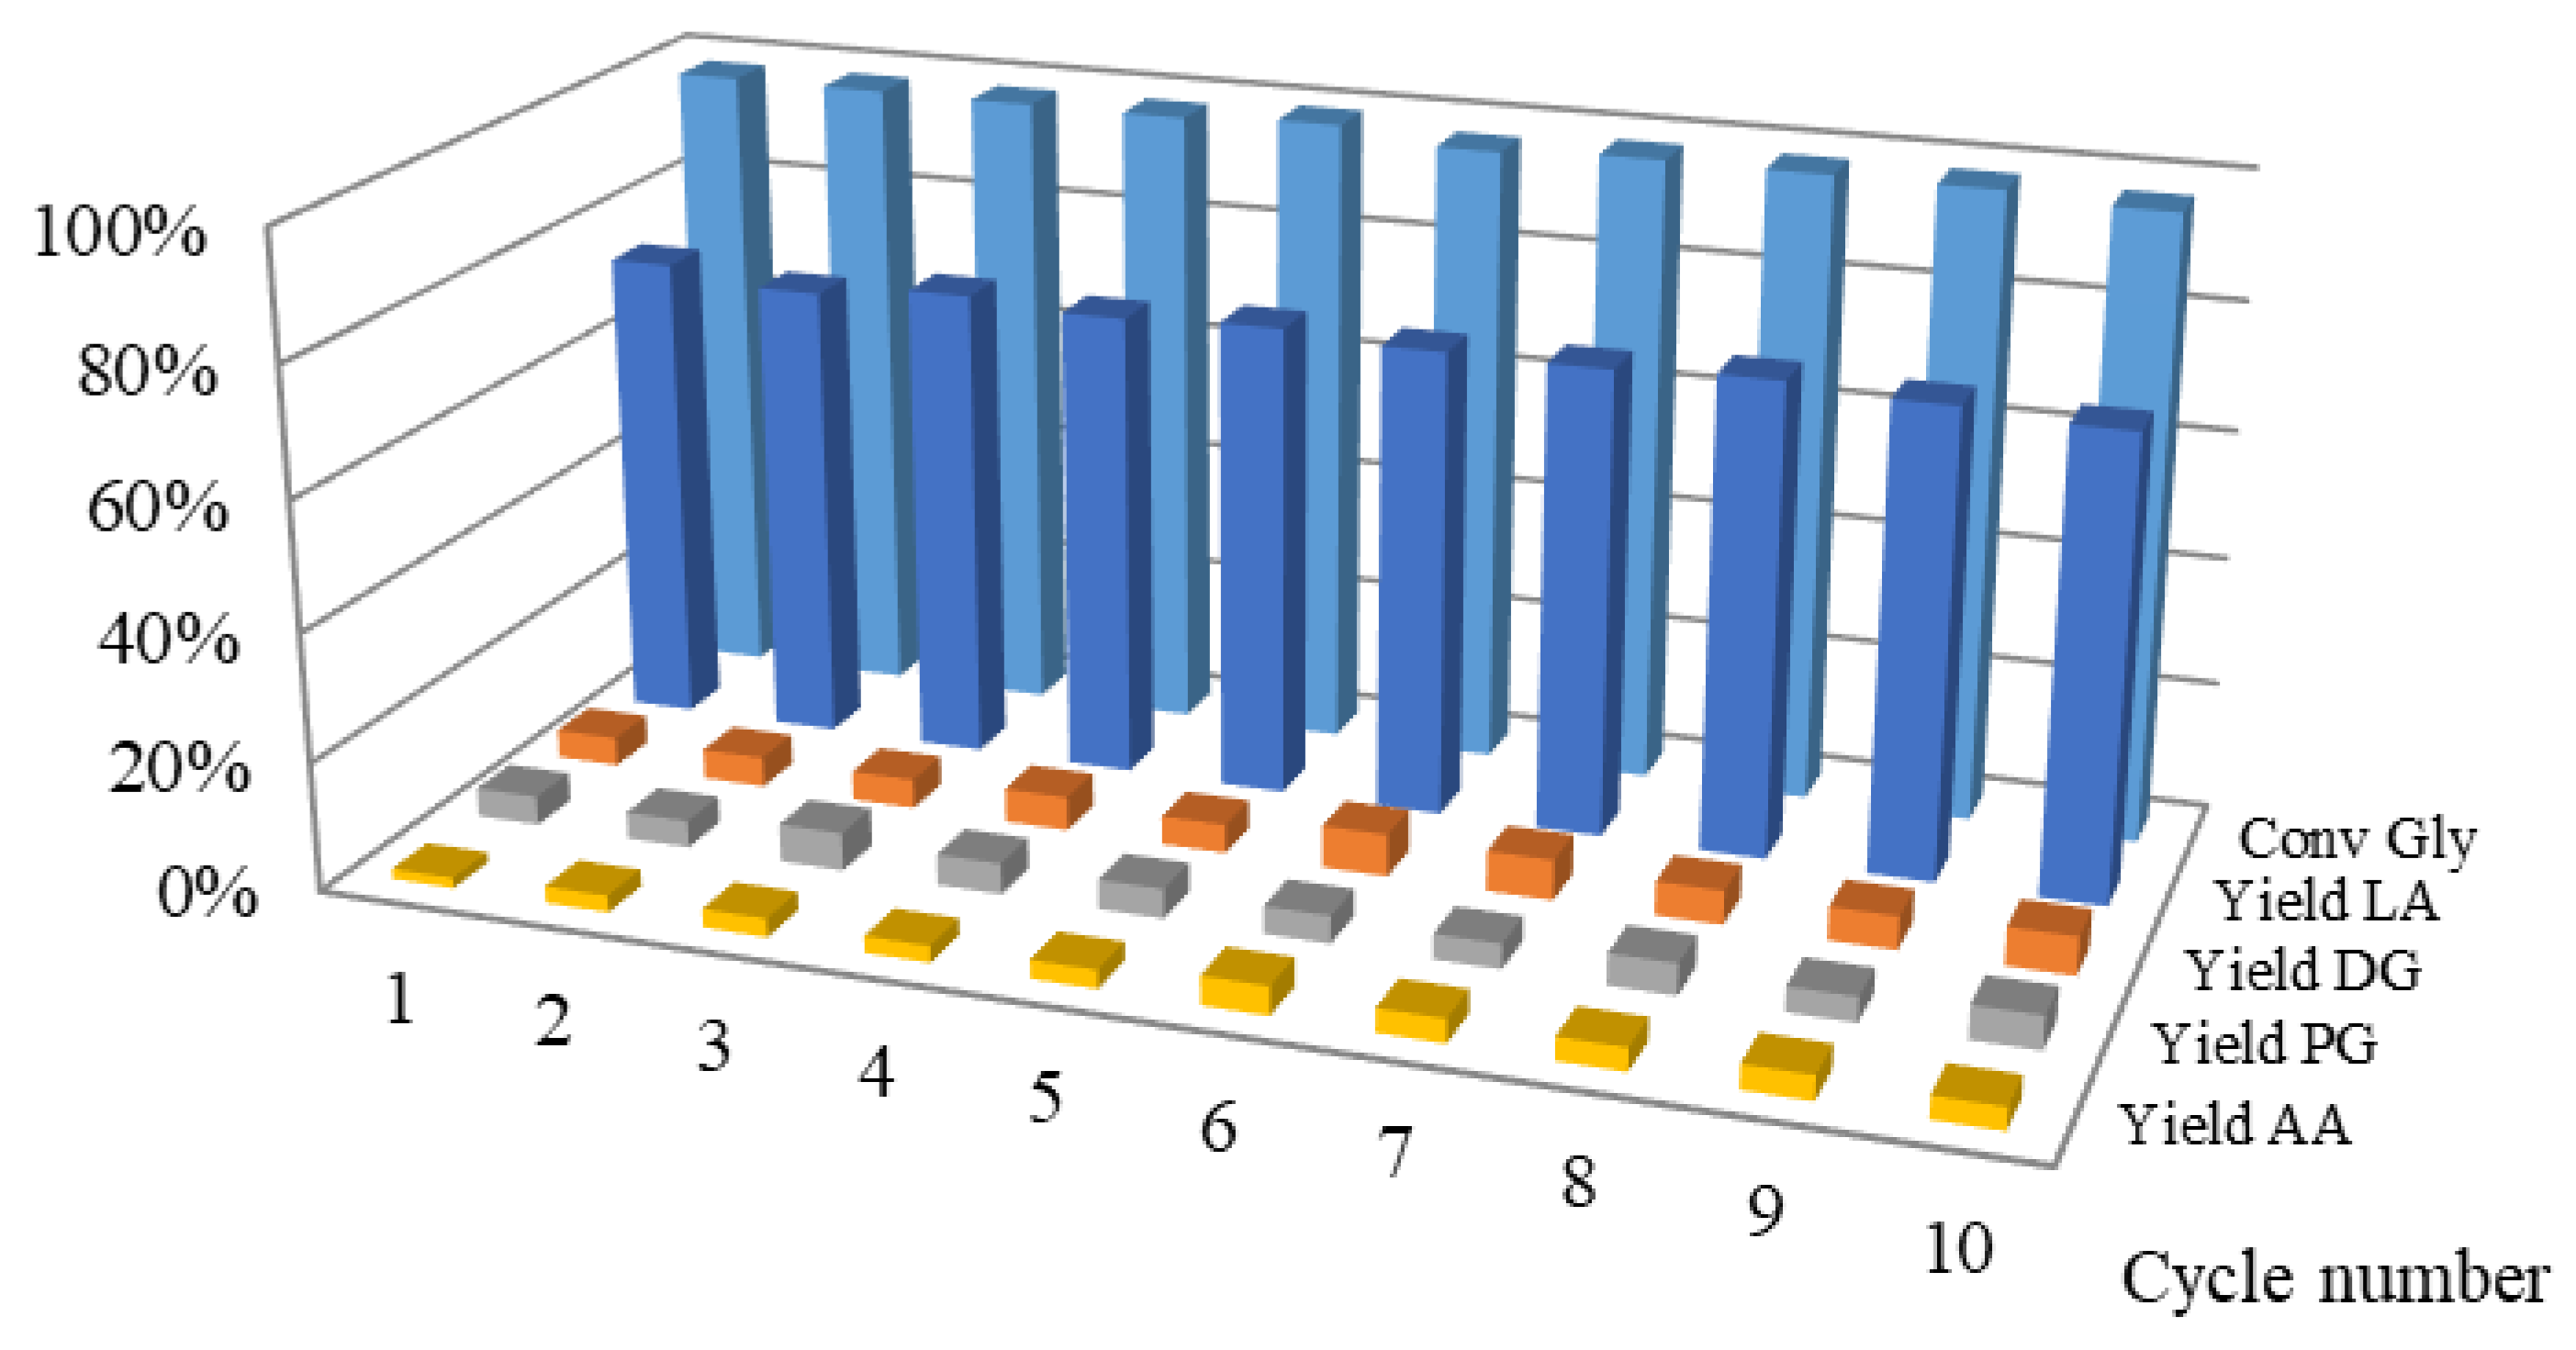
2.3. Reuse (Stability Study) of In Situ Cu Catalyst
3. Materials and Methods
3.1. Materials
3.1.1. Preparation of Catalysts
CuO
Cu2O
Copper Powder (CP)
3.1.2. Characterization of Catalysts
3.2. Catalytic Activity Test
3.3. Analysis
4. Conclusions
Supplementary Materials
Author Contributions
Funding
Data Availability Statement
Conflicts of Interest
References
- Ojo, A.O.; De Smidt, O. Lactic Acid: A Comprehensive Review of Production to Purification. Processes 2023, 11, 688. [Google Scholar] [CrossRef]
- Kim, J.; Kim, Y.-M.; Lebaka, V.R.; Wee, Y.-J. Lactic Acid for Green Chemical Industry: Recent Advances in and Future Prospects for Production Technology, Recovery, and Applications. Fermentation 2022, 8, 609. [Google Scholar] [CrossRef]
- Paul, S.; Pradhan, K.; Das, A.R. Ethyl Lactate as a Green Solvent: A Promising Bio-Compatible Media for Organic Synthesis. Curr. Green Chem. 2016, 3, 111–118. [Google Scholar] [CrossRef]
- Zavrazhnov, S.A.; Esipovich, A.L.; Danov, S.M.; Zlobin, S.Y.; Belousov, A.S. Catalytic Conversion of Glycerol to Lactic Acid: State of the Art and Prospects. Kinet. Catal. 2018, 59, 459–471. [Google Scholar] [CrossRef]
- Chacón, J.M.; Caminero, M.A.; García-Plaza, E.; Núñez, P.J. Additive Manufacturing of PLA Structures Using Fused Deposition Modelling: Effect of Process Parameters on Mechanical Properties and Their Optimal Selection. Mater. Des. 2017, 124, 143–157. [Google Scholar] [CrossRef]
- Lactic and Poly Lactic Acid Market by Application (Automotive & Transport, Agriculture, Electronics, Horticulture, Consumer Goods, Bio-Medical, Packaging, Textiles, Others); By Raw Material; Form; By Region; Segment Forecast, 2022–2030. Polaris Market Research. 2022. Available online: https://www.polarismarketresearch.com/industry-analysis/lactic-and-poly-lactic-acid-market (accessed on 1 February 2024).
- Abdel-Rahman, M.A.; Tashiro, Y.A.; Sonomoto, K. Recent Advances in Lactic Acid Production by Microbal Fermentation Processes. Biotechnol. Adv. 2013, 31, 877–902. [Google Scholar] [CrossRef] [PubMed]
- Castillo Martinez, F.A.; Balciunas, E.M.; Salgado, J.M.; Domínguez González, J.M.; Converti, A.; Oliveira, R.P.D.S. Lactic Acid Properties, Applications and Production: A Review. Trends Food Sci. Technol. 2013, 30, 70–83. [Google Scholar] [CrossRef]
- West, R.M.; Holm, M.S.; Saravanamurugan, S.; Xiong, J.; Beversdorf, Z.; Taarning, E.; Christensen, C.H. Zeolite H-USY for the Production of Lactic Acid and Methyl Lactate from C3-Sugars. J. Catal. 2010, 269, 122–130. [Google Scholar] [CrossRef]
- Esipovich, A.L.; Rogozhin, A.E.; Belousov, A.S.; Kanakov, E.A.; Danov, S.M. A Comparative Study of the Separation Stage of Rapeseed Oil Transesterification Products Obtained Using Various Catalysts. Fuel Process. Technol. 2018, 173, 153–164. [Google Scholar] [CrossRef]
- Yin, H.; Yin, H.; Wang, A.; Shen, L. Catalytic Conversion of Glycerol to Lactic Acid over Graphite-Supported Nickel Nanoparticles and Reaction Kinetics. J. Ind. Eng. Chem. 2018, 57, 226–235. [Google Scholar] [CrossRef]
- Moklis, M.H.; Cheng, S.; Cross, J.S. Current and Future Trends for Crude Glycerol Upgrading to High Value-Added Products. Sustainability 2023, 15, 2979. [Google Scholar] [CrossRef]
- Akbulut, D.; Özkar, S. A Review of the Catalytic Conversion of Glycerol to Lactic Acid in the Presence of Aqueous Base. RSC Adv. 2022, 12, 18864–18883. [Google Scholar] [CrossRef] [PubMed]
- Kishida, H.; Jin, F.M.; Zhou, Z.Y.; Moriya, T.; Enomoto, H. Conversion of Glycerin into Lactic Acid by Alkaline Hydrothermal Reaction. Chem. Lett. 2005, 34, 1560–1561. [Google Scholar] [CrossRef]
- Ramirez-Lopez, C.A.; Ochoa-Gomez, J.R.; Fernandez-Santos, M.; Gomez-Jimenez-Aberasturi, O.; Aonso-Vicario, A.; Torrecilla-Soria, J. Synthesis of Lactic Acid by Alkaline Hydrothermal Conversion of Glycerol at High Glycerol Concentration. Ind. Eng. Chem. Res. 2010, 49, 6270–6278. [Google Scholar] [CrossRef]
- Oberhauser, W.; Evangelisti, C.; Tiozzo, C.; Vizza, F.; Psaro, R. Lactic Acid from Glycerol by Ethylene-Stabilized Platinum-Nanoparticles. ACS Catal. 2016, 6, 1671–1674. [Google Scholar] [CrossRef]
- Dodekatos, G.; Schunemann, S.; Tuysuz, H. Recent Advances in Thermo-, Photo-, and Electrocatalytic Glycerol Oxidation. Acs Catal. 2018, 8, 6301–6333. [Google Scholar] [CrossRef]
- Purushothaman, R.K.P.; van Haveren, J.; van Es, D.S.; Melian-Cabrera, I.; Meeldijk, J.D.; Heeres, H.J. An Efficient One Pot Conversion of Glycerol to Lactic Acid Using Bimetallic Gold-Platinum Catalysts on a Nanocrystalline CeO2 Support. Appl. Catal. B Environ. 2014, 147, 92–100. [Google Scholar] [CrossRef]
- Shen, Y.H.; Zhang, S.H.; Li, H.J.; Ren, Y.; Liu, H.C. Efficient Synthesis of Lactic Acid by Aerobic Oxidation of Glycerol on Au-Pt/TiO2 Catalysts. Chem. Eur. J. 2010, 16, 7368–7371. [Google Scholar] [CrossRef]
- Zhang, Y.L.; Shen, Z.; Zhou, X.F.; Zhang, M.; Jin, F.M. Solvent Isotope Effect and Mechanism for the Production of Hydrogen and Lactic Acid from Glycerol under Hydrothermal Alkaline Conditions. Green Chem. 2012, 14, 3285–3288. [Google Scholar] [CrossRef]
- Gawande, M.B.; Goswami, A.; Felpin, F.-X.; Asefa, T.; Huang, X.; Silva, R.; Zou, X.; Zboril, R.; Varma, R.S. Cu and Cu-Based Nanoparticles: Synthesis and Applications in Catalysis. Chem. Rev. 2016, 116, 3722–3811. [Google Scholar] [CrossRef]
- Roy, D.; Subramaniam, B.; Chaudhari, R.V. Cu-Based Catalysts Show Low Temperature Activity for Glycerol Conversion to Lactic Acid. ACS Catal. 2011, 1, 548–551. [Google Scholar] [CrossRef]
- Yin, H.X.; Yin, H.B.; Wang, A.L.; Shen, L.Q.; Liu, Y.; Zheng, Y. Catalytic Conversion of Glycerol to Lactic Acid over Metallic Copper Nanoparticles and Reaction Kinetics. J. Nanosci. Nanotechnol. 2017, 17, 1255–1266. [Google Scholar] [CrossRef] [PubMed]
- Yin, H.; Zhang, C.; Yin, H.; Gao, D.; Shen, L.; Wang, A. Hydrothermal Conversion of Glycerol to Lactic Acid Catalyzed by Cu/Hydroxyapatite, Cu/MgO, and Cu/ZrO2 and Reaction Kinetics. Chem. Eng. J. 2016, 288, 332–343. [Google Scholar] [CrossRef]
- Yang, G.Y.; Ke, Y.H.; Ren, H.F.; Liu, C.L.; Yang, R.Z.; Dong, W.S. The Conversion of Glycerol to Lactic Acid Catalyzed by ZrO2-Supported CuO Catalysts. Chem. Eng. J. 2016, 283, 759–767. [Google Scholar] [CrossRef]
- Shen, L.Q.; Yin, H.X.; Yin, H.B.; Liu, S.; Wang, A.L. Conversion of Glycerol to Lactic Acid Catalyzed by Different-Sized Cu2O Nanoparticles in NaOH Aqueous Solution. J. Nanosci. Nanotechnol. 2017, 17, 780–787. [Google Scholar] [CrossRef]
- Zhang, J.; Wu, X.; Chen, J.; Wang, X.; Mai, Y. Efficient and Stable Cu-Cu2O@NC Catalysts for Selective Catalytic Conversion of Glycerol to Lactic Acid. ChemCatChem 2023, 15, e202201139. [Google Scholar] [CrossRef]
- Tang, C.; Li, S.; Li, S.; Wang, Y.; He, M.; Huang, M.; Yu, S. The Structure–Activity Relationship of CuO in the Catalytic Conversion Reaction of Glycerol to Lactic Acid. Catalysts 2023, 13, 1218. [Google Scholar] [CrossRef]
- Li, K.T.; Li, J.Y.; Li, H.H. Conversion of Glycerol to Lactic Acid over Cu–Zn–Al and Cu–Cr Catalysts in Alkaline Solution. J. Taiwan Inst. Chem. Eng. 2017, 79, 74–79. [Google Scholar] [CrossRef]
- Van Haasterecht, T.; van Deelen, T.W.; de Jong, K.P.; Bitter, J.H. Transformations of Polyols to Organic Acids and Hydrogen in Aqueous Alkaline Media. Catal. Sci. Technol. 2014, 4, 2353–2366. [Google Scholar] [CrossRef]
- Shen, L.; Zhou, X.; Wang, A.; Yin, H.; Yin, H.; Cui, W. Hydrothermal Conversion of High-Concentrated Glycerol to Lactic Acid Catalyzed by Bimetallic CuAux (x = 0.01–0.04) Nanoparticles and Their Reaction Kinetics. RSC Adv. 2017, 7, 30725–30739. [Google Scholar] [CrossRef]
- Zavrazhnov, S.A.; Esipovich, A.L.; Zlobin, S.Y.; Belousov, A.S.; Vorotyntsev, A.V. Mechanism Analysis and Kinetic Modelling of Cu NPs Catalysed Glycerol Conversion into Lactic Acid. Catalysts 2019, 9, 231. [Google Scholar] [CrossRef]
- Liu, J.; Chu, X.; Zhu, L.; Hu, J.; Dai, R.; Xie, S.; Pei, Y.; Yan, S.; Qiao, M.; Fan, K. Simultaneous Aqueous-Phase Reforming and KOH Carbonation to Produce COx-Free Hydrogen in a Single Reactor. ChemSusChem 2010, 3, 803–806. [Google Scholar] [CrossRef] [PubMed]
- Zhang, Y.C.; Tang, J.Y.; Wang, G.L.; Zhang, M.; Hu, X.Y. Facile Synthesis of Submicron Cu2O and CuO Crystallites from a Solid Metallorganic Molecular Precursor. J. Cryst. Growth 2006, 294, 278–282. [Google Scholar] [CrossRef]
- Scherrer, P. Bestimmung der Größe und der inneren Struktur von Kolloidteilchen mittels Röntgenstrahlen. Nachrichten Von Der Ges. Der Wiss. Zu Göttingen 1918, 1918, 98–100. [Google Scholar]


| Catalyst | Conversion of Glycerol, XGly, % | Selectivity, Seli, % | Carbon Balance, % | ||||
|---|---|---|---|---|---|---|---|
| DG | LA | PG | AA | Others | |||
| Control | >1.0 | 0 | 0 | 0 | 0 | 0 | 99.8 |
| CuO, no base Cu2O-1, no base Cu2O-2, no base Cu2O-3, no base CP, no base | >1.0 | 0 | 0 | 0 | 0 | 0 | 99.6 |
| Control, only base * | 24.9 | 25.3 | 43.4 | 1.6 | 4.0 | 25.7 | 95.3 |
| CuO * | 86.3 | 2.3 | 67.9 | 3.9 | 2.2 | 23.7 | 89.4 |
| Cu2O-1 * | 91.8 | 4.9 | 69.5 | 3.3 | 2.5 | 19.8 | 98.1 |
| Cu2O-2 * | 88.6 | 6.6 | 63.3 | 4.3 | 3.5 | 22.3 | 95.5 |
| Cu2O-3 * | 86.5 | 3.8 | 62.8 | 6.6 | 7.3 | 19.5 | 97.5 |
| CP * | 90.1 | 5.0 | 66.7 | 4.6 | 1.8 | 21.9 | 96.2 |
| Cu powder commercial | 80.2 | 5.0 | 61.6 | 6.7 | 3.2 | 23.5 | 97.8 |
| Catalyst | Conversion of Glycerol, XGly,% | Selectivity, Seli, % | Carbon Balance, % | ||||
|---|---|---|---|---|---|---|---|
| DG | LA | PG | AA | Others | |||
| CuO | 88.5 | 2.8 | 66.2 | 4.1 | 2.6 | 24.3 | 95.4 |
| Cu2O-1 | 88.6 | 4.7 | 69.5 | 4.9 | 1.9 | 19.0 | 96.8 |
| Cu2O-2 | 88.6 | 5.6 | 64.6 | 4.7 | 2.8 | 22.3 | 96.5 |
| Cu2O-3 | 86.5 | 4.1 | 67.6 | 6.1 | 5.3 | 16.9 | 98.3 |
| CP | 89.4 | 4.0 | 69.7 | 4.9 | 2.8 | 18.6 | 97.4 |
| Catalyst Sample | Surface Area, BET, m2/g | Average Particle Size, nm | ||
|---|---|---|---|---|
| Fresh | Spent | Fresh | Spent | |
| CuO | 1.9 ± 0.1 | 1.2 ± 0.1 | 119 ± 25 | 1124 ± 342 |
| Cu2O-1 | 5.1 ± 0.3 | 2.2 ± 0.0 | 190 ± 67 | 437 ± 112 |
| Cu2O-2 | 0.9 ± 0.2 | 0.8 ± 0.2 | 289 ± 106 | 396 ± 145 |
| Cu2O-3 | 3.5 ± 0.1 | 1.0 ± 0.2 | 543 ± 142 | 586 ± 150 |
| CP | 4.8 ± 0.1 | 3.2 ± 0.3 | 693 ± 205 | 1043 ± 241 |
Disclaimer/Publisher’s Note: The statements, opinions and data contained in all publications are solely those of the individual author(s) and contributor(s) and not of MDPI and/or the editor(s). MDPI and/or the editor(s) disclaim responsibility for any injury to people or property resulting from any ideas, methods, instructions or products referred to in the content. |
© 2024 by the authors. Licensee MDPI, Basel, Switzerland. This article is an open access article distributed under the terms and conditions of the Creative Commons Attribution (CC BY) license (https://creativecommons.org/licenses/by/4.0/).
Share and Cite
Esipovich, A.L.; Zlobin, S.Y.; Shirshin, K.K.; Zavrazhnov, S.A.; Markov, A.N. Catalytic Conversion of Glycerol to Lactic Acid Over Cu-Based Catalysts. Catalysts 2024, 14, 231. https://doi.org/10.3390/catal14040231
Esipovich AL, Zlobin SY, Shirshin KK, Zavrazhnov SA, Markov AN. Catalytic Conversion of Glycerol to Lactic Acid Over Cu-Based Catalysts. Catalysts. 2024; 14(4):231. https://doi.org/10.3390/catal14040231
Chicago/Turabian StyleEsipovich, Anton L., Sergey Yu. Zlobin, Konstantin K. Shirshin, Sergey A. Zavrazhnov, and Artyom N. Markov. 2024. "Catalytic Conversion of Glycerol to Lactic Acid Over Cu-Based Catalysts" Catalysts 14, no. 4: 231. https://doi.org/10.3390/catal14040231
APA StyleEsipovich, A. L., Zlobin, S. Y., Shirshin, K. K., Zavrazhnov, S. A., & Markov, A. N. (2024). Catalytic Conversion of Glycerol to Lactic Acid Over Cu-Based Catalysts. Catalysts, 14(4), 231. https://doi.org/10.3390/catal14040231