Figure 1.
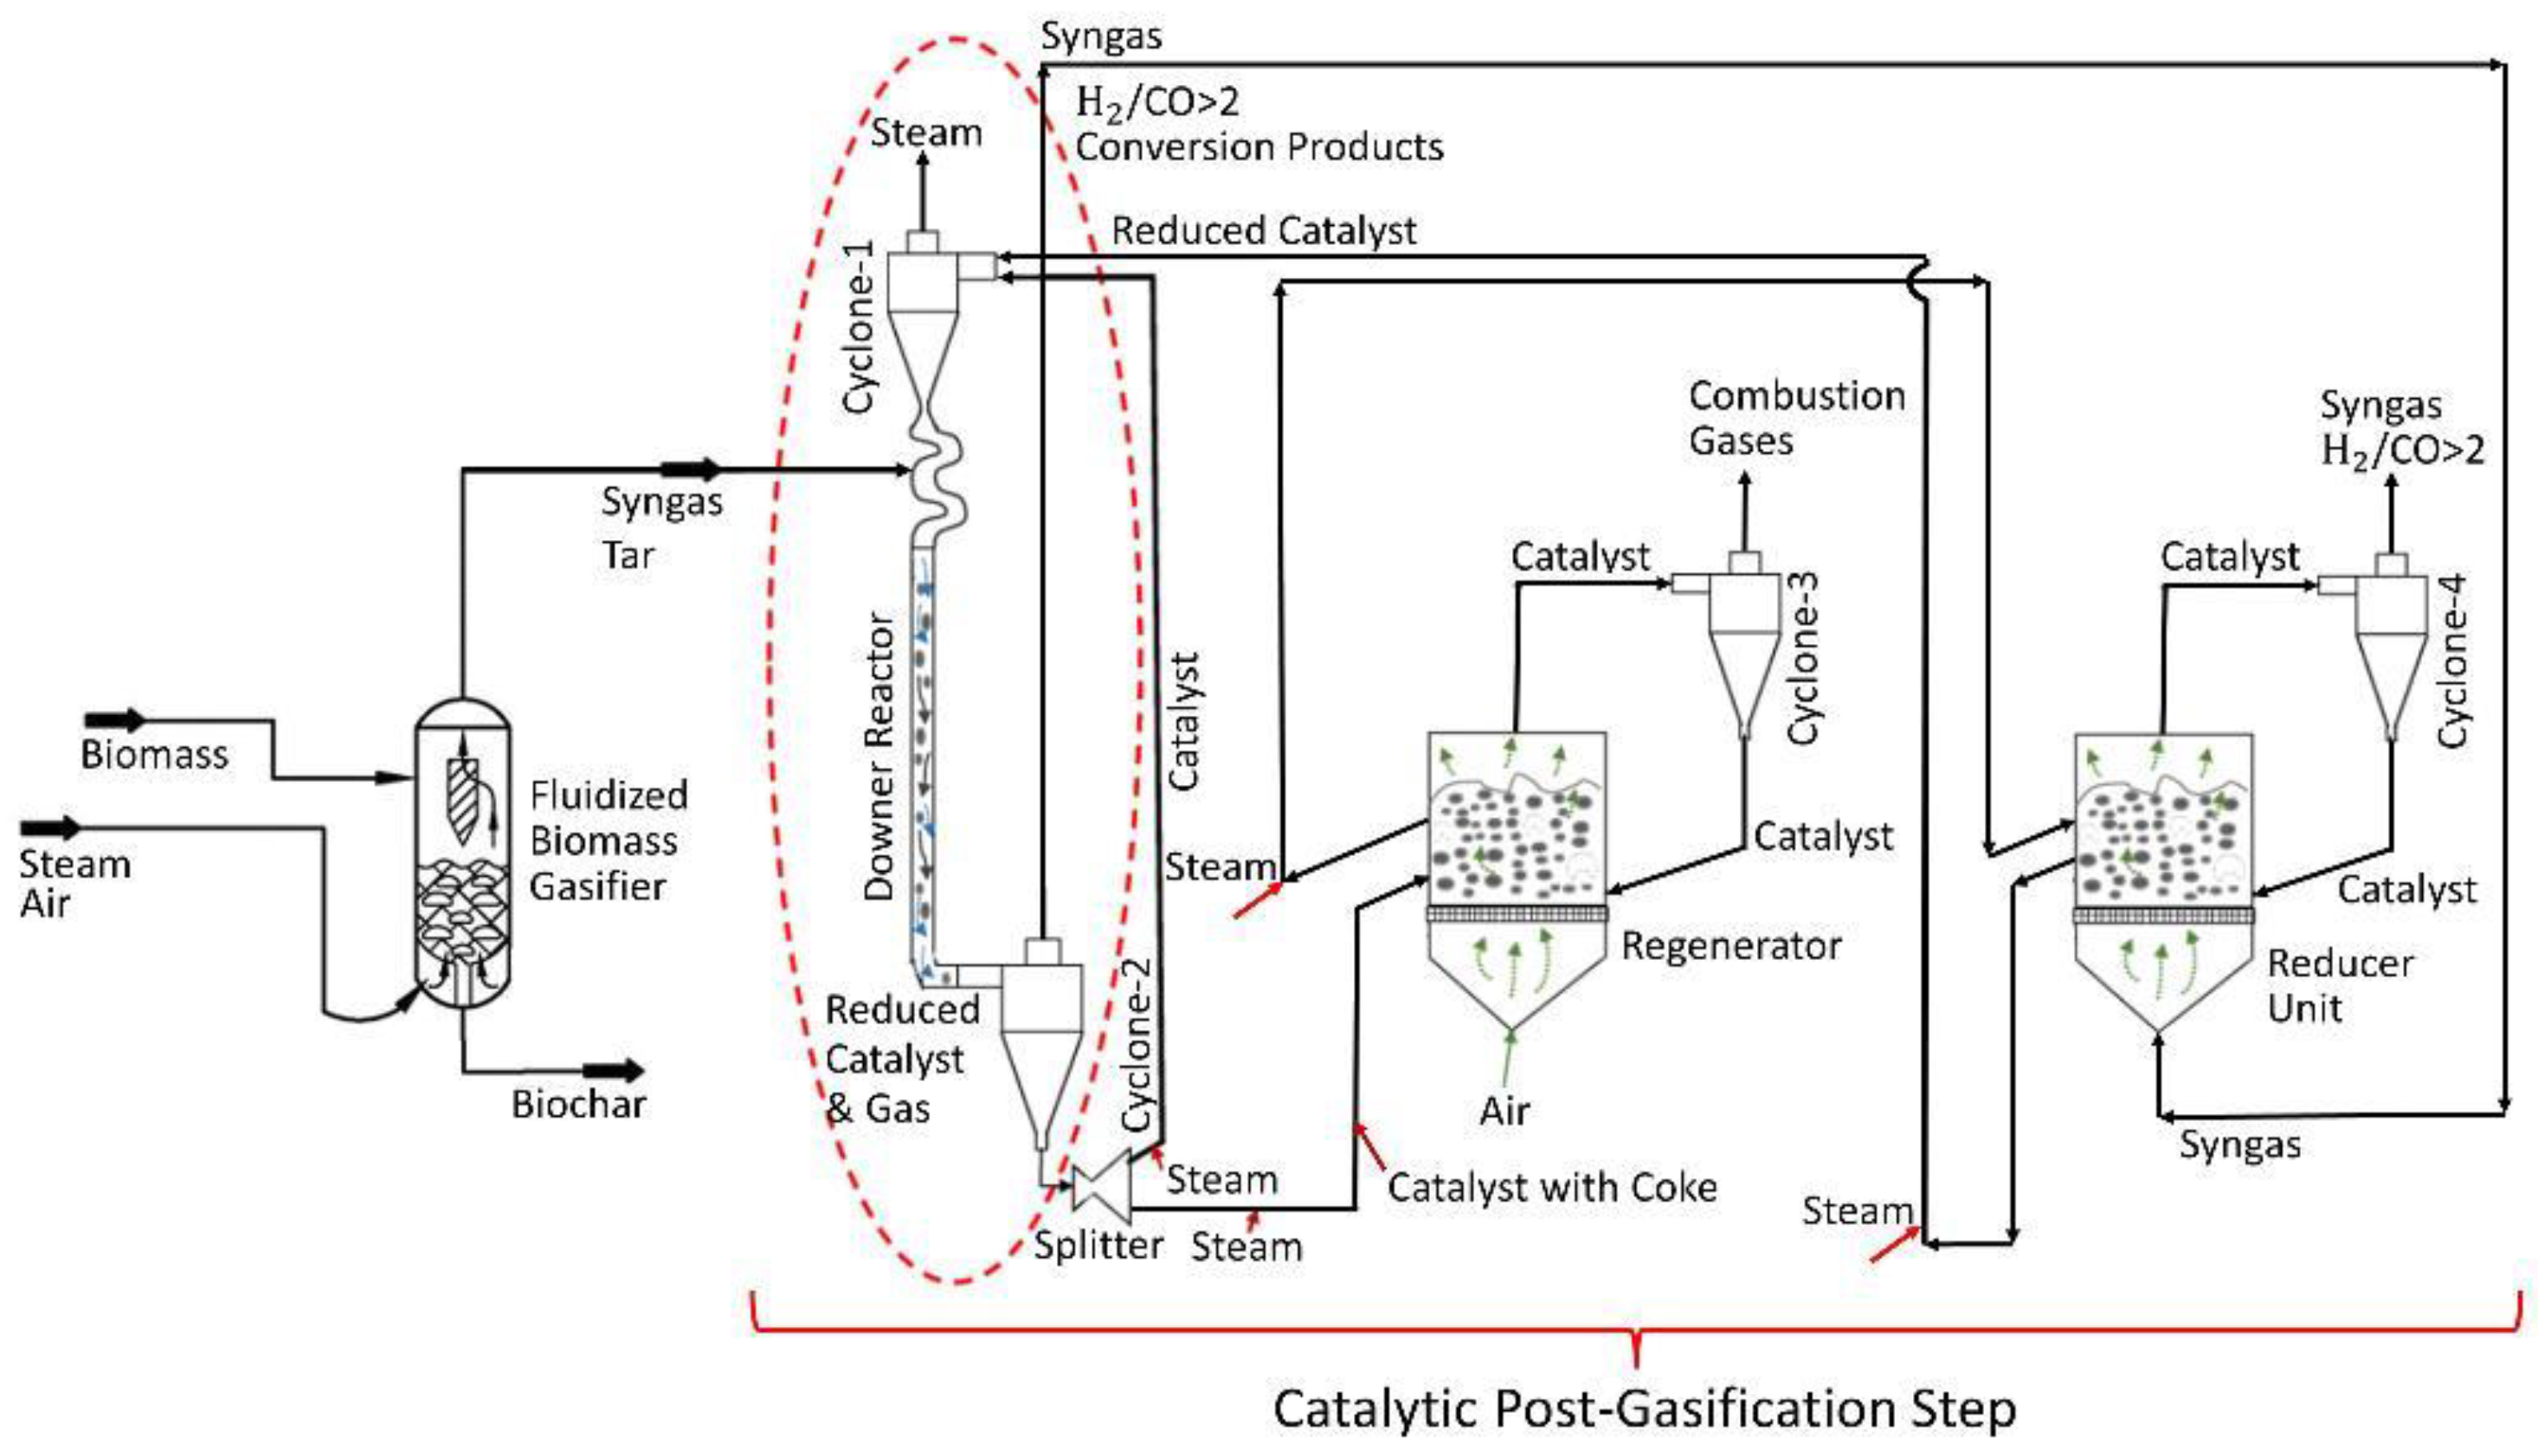
Tar post-biomass gasification process includes: (a) a fluidized bed biomass gasifier operated at 650 °C, (b) a downer unit providing tar conversion and syngas enrichment operated at 550 °C, (c) a catalyst regenerator and a catalyst reduction unit both operated at 615 °C, processing 1/10 of the catalyst downer flow.
Figure 1.
Tar post-biomass gasification process includes: (a) a fluidized bed biomass gasifier operated at 650 °C, (b) a downer unit providing tar conversion and syngas enrichment operated at 550 °C, (c) a catalyst regenerator and a catalyst reduction unit both operated at 615 °C, processing 1/10 of the catalyst downer flow.
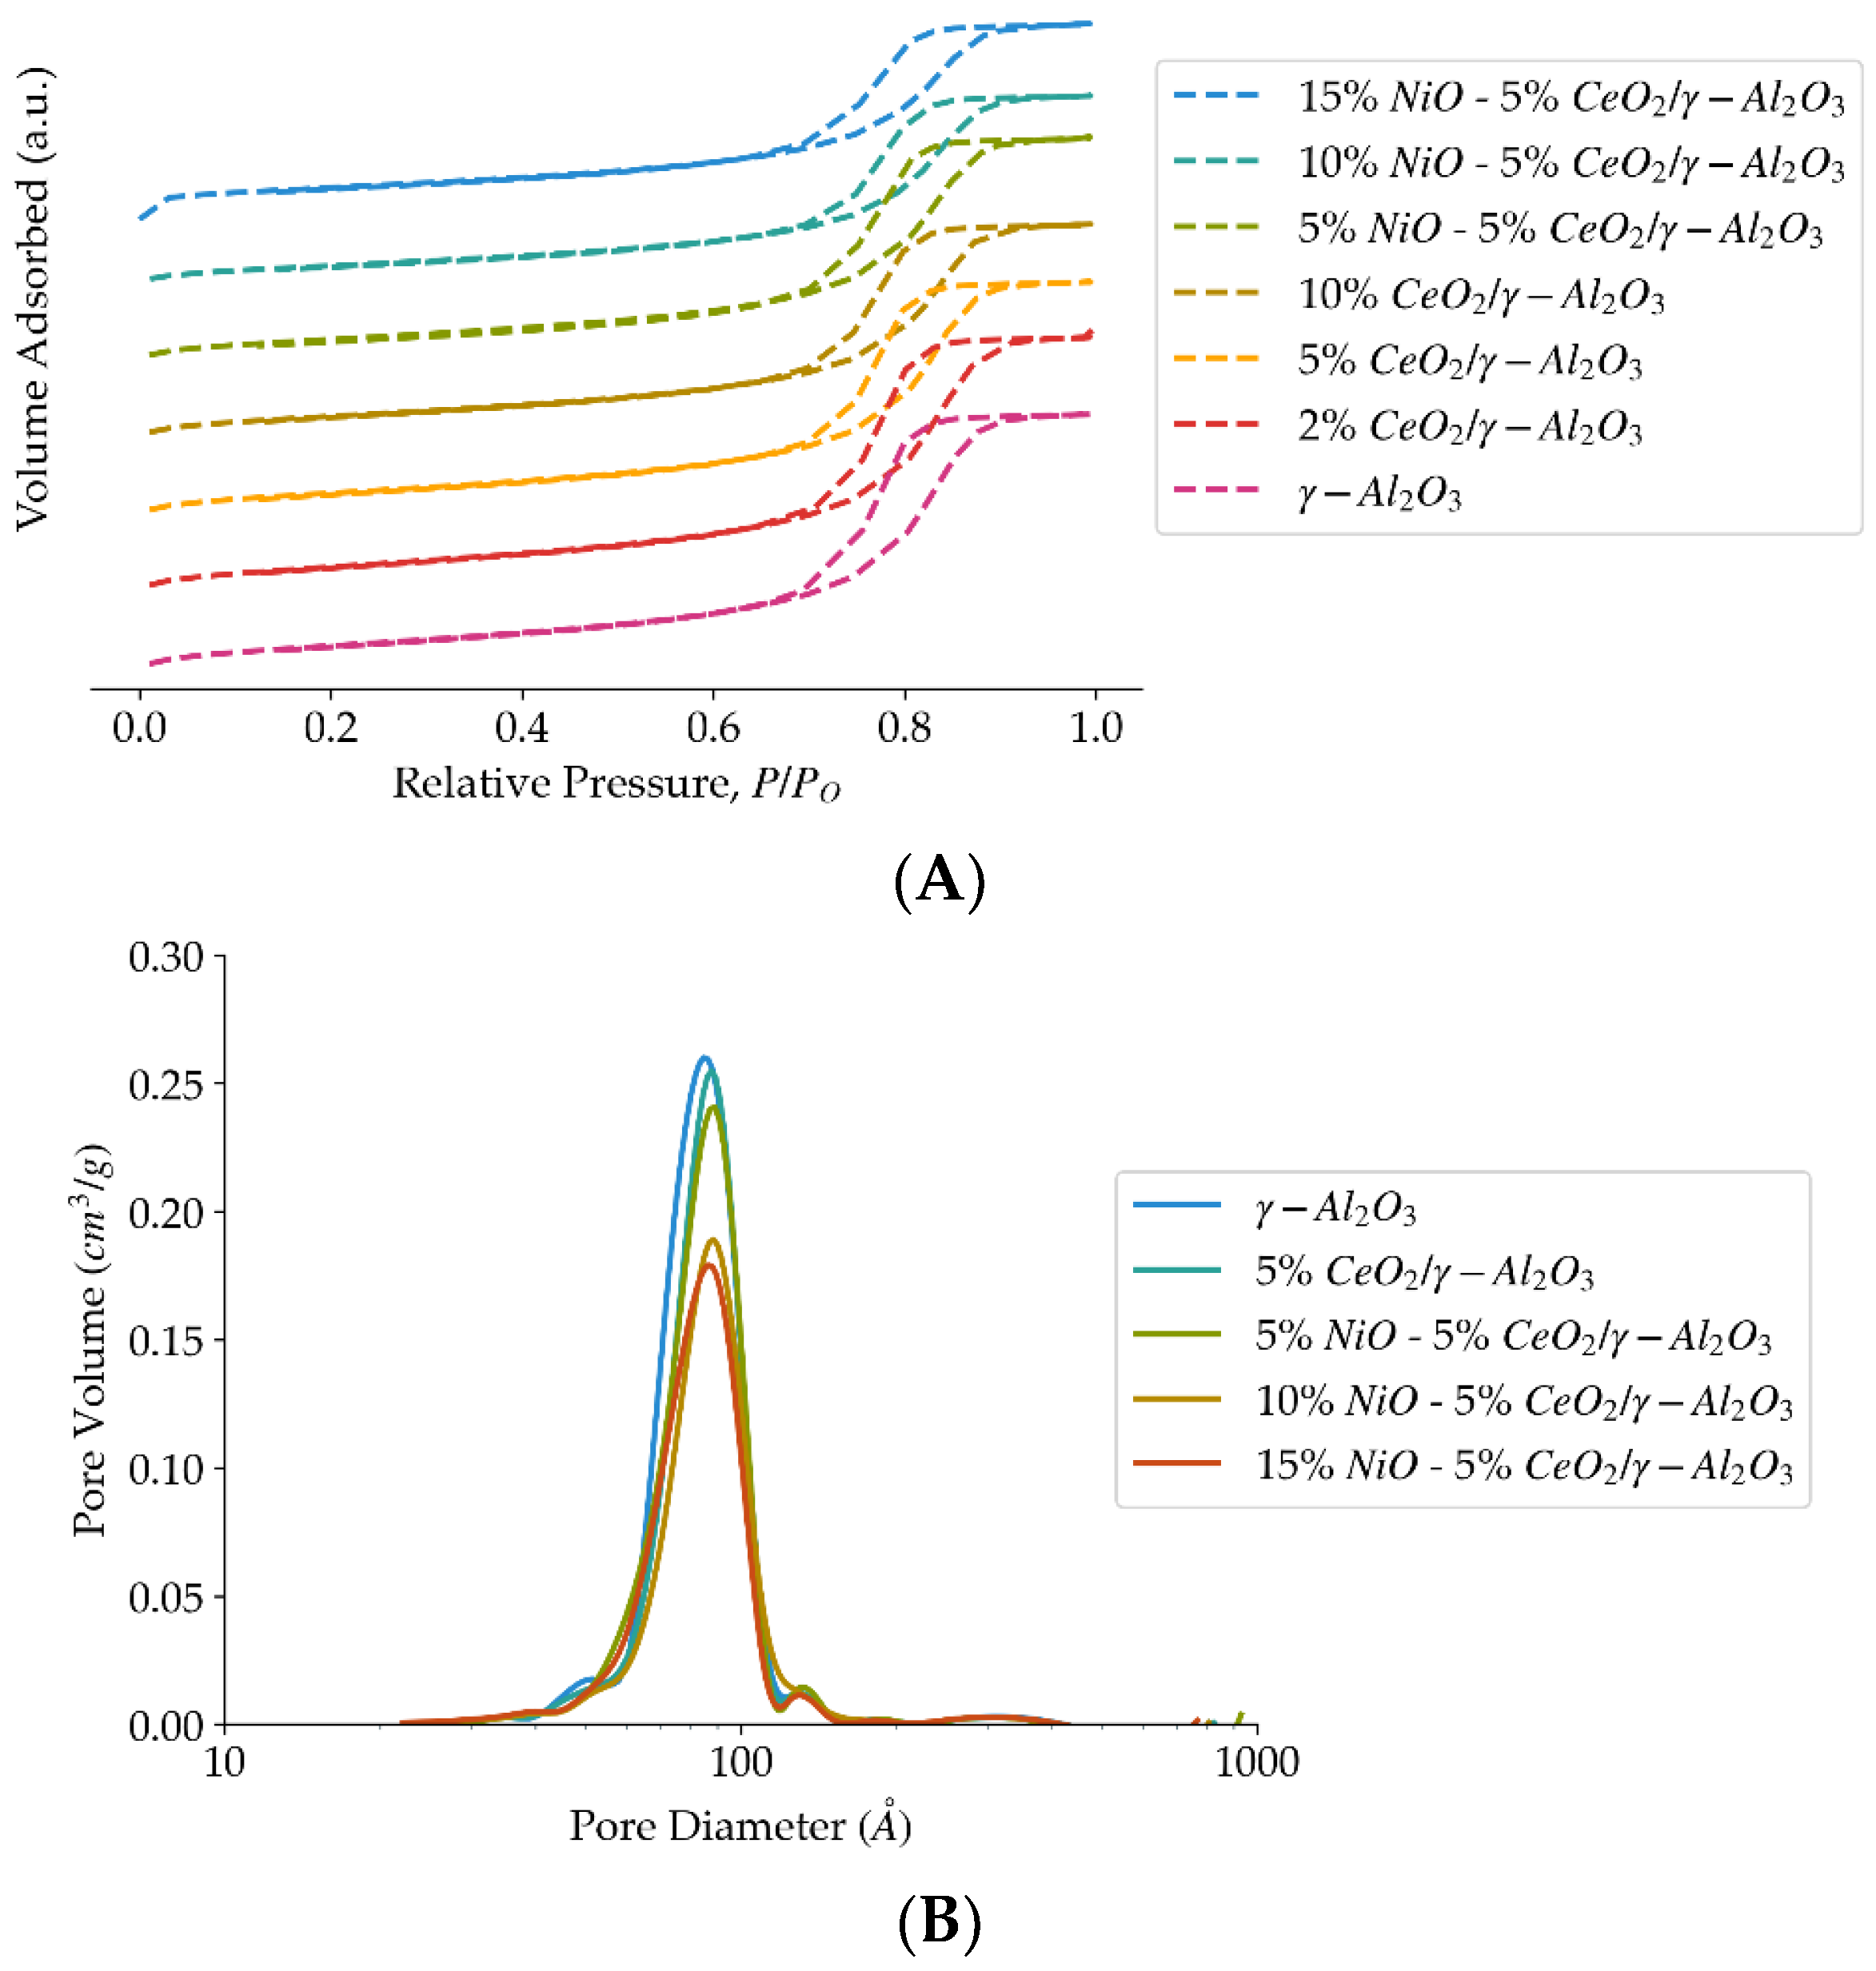
Figure 2.
(A) Adsorption-desorption isotherms obtained from N2-physysoption analysis, for different ceria and NiO loadings on the γ-Al2O3 support. (B) Adsorption-desorption isotherms obtained from N2-physysoption analysis, for different ceria and NiO loadings on the γ-Al2O3 support.
Figure 2.
(A) Adsorption-desorption isotherms obtained from N2-physysoption analysis, for different ceria and NiO loadings on the γ-Al2O3 support. (B) Adsorption-desorption isotherms obtained from N2-physysoption analysis, for different ceria and NiO loadings on the γ-Al2O3 support.
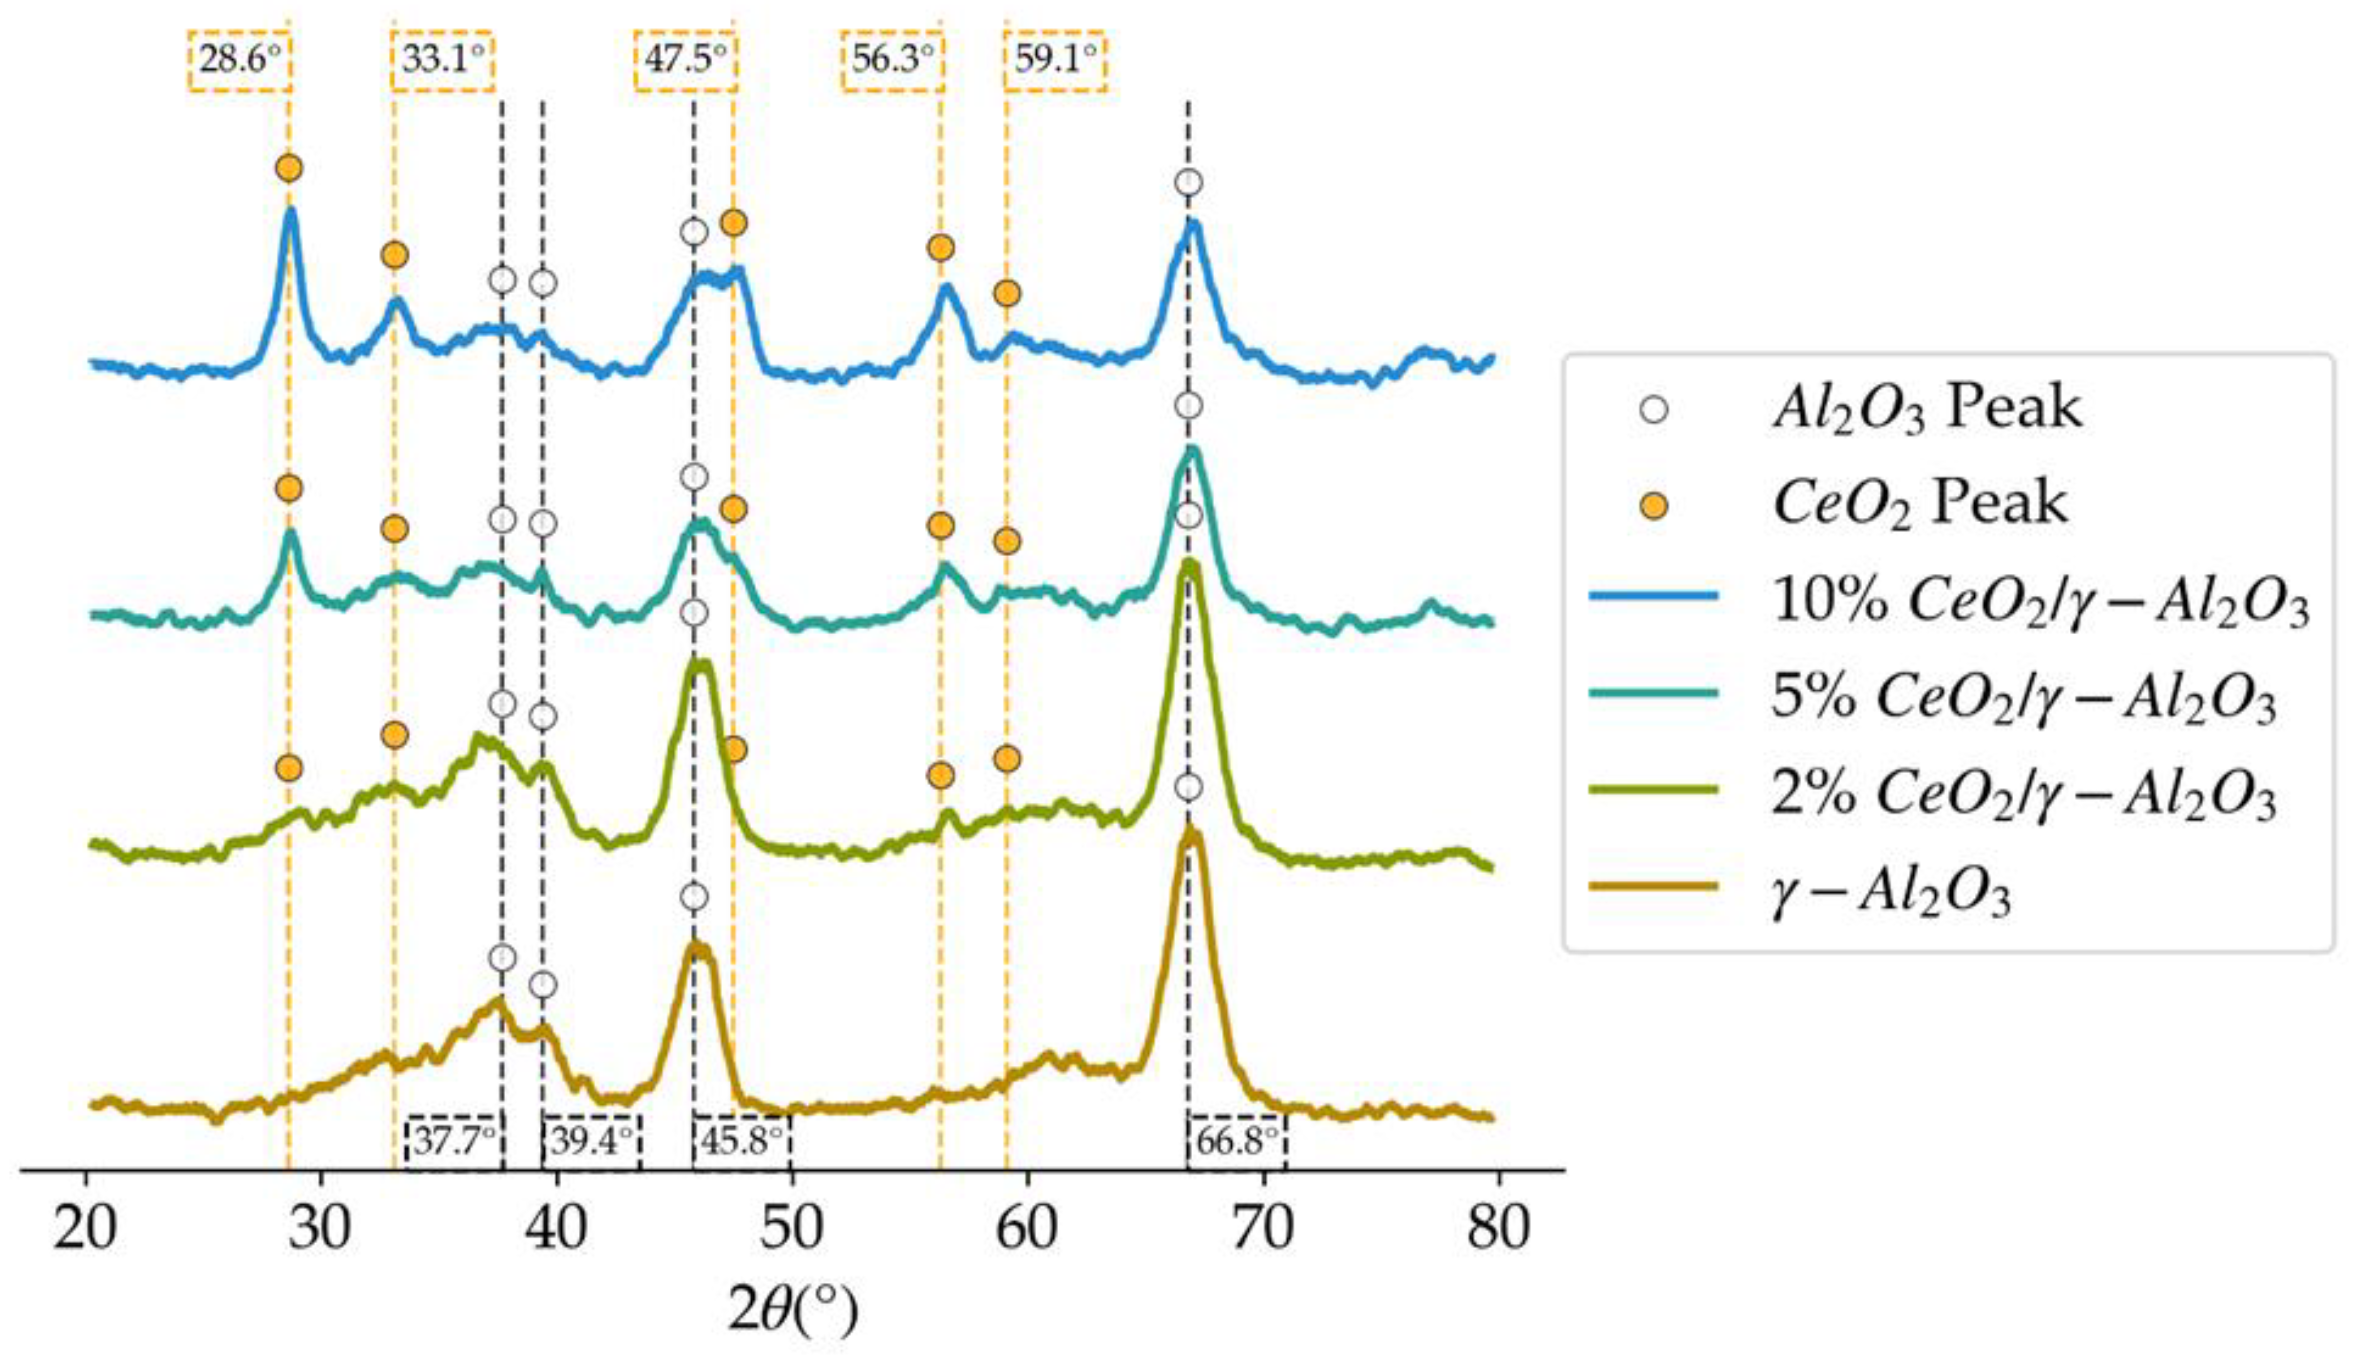
Figure 3.
XRD patterns in the 2θ degrees diffractogram, for the different loadings of CeO2 on γ-Al2O3.
Figure 3.
XRD patterns in the 2θ degrees diffractogram, for the different loadings of CeO2 on γ-Al2O3.
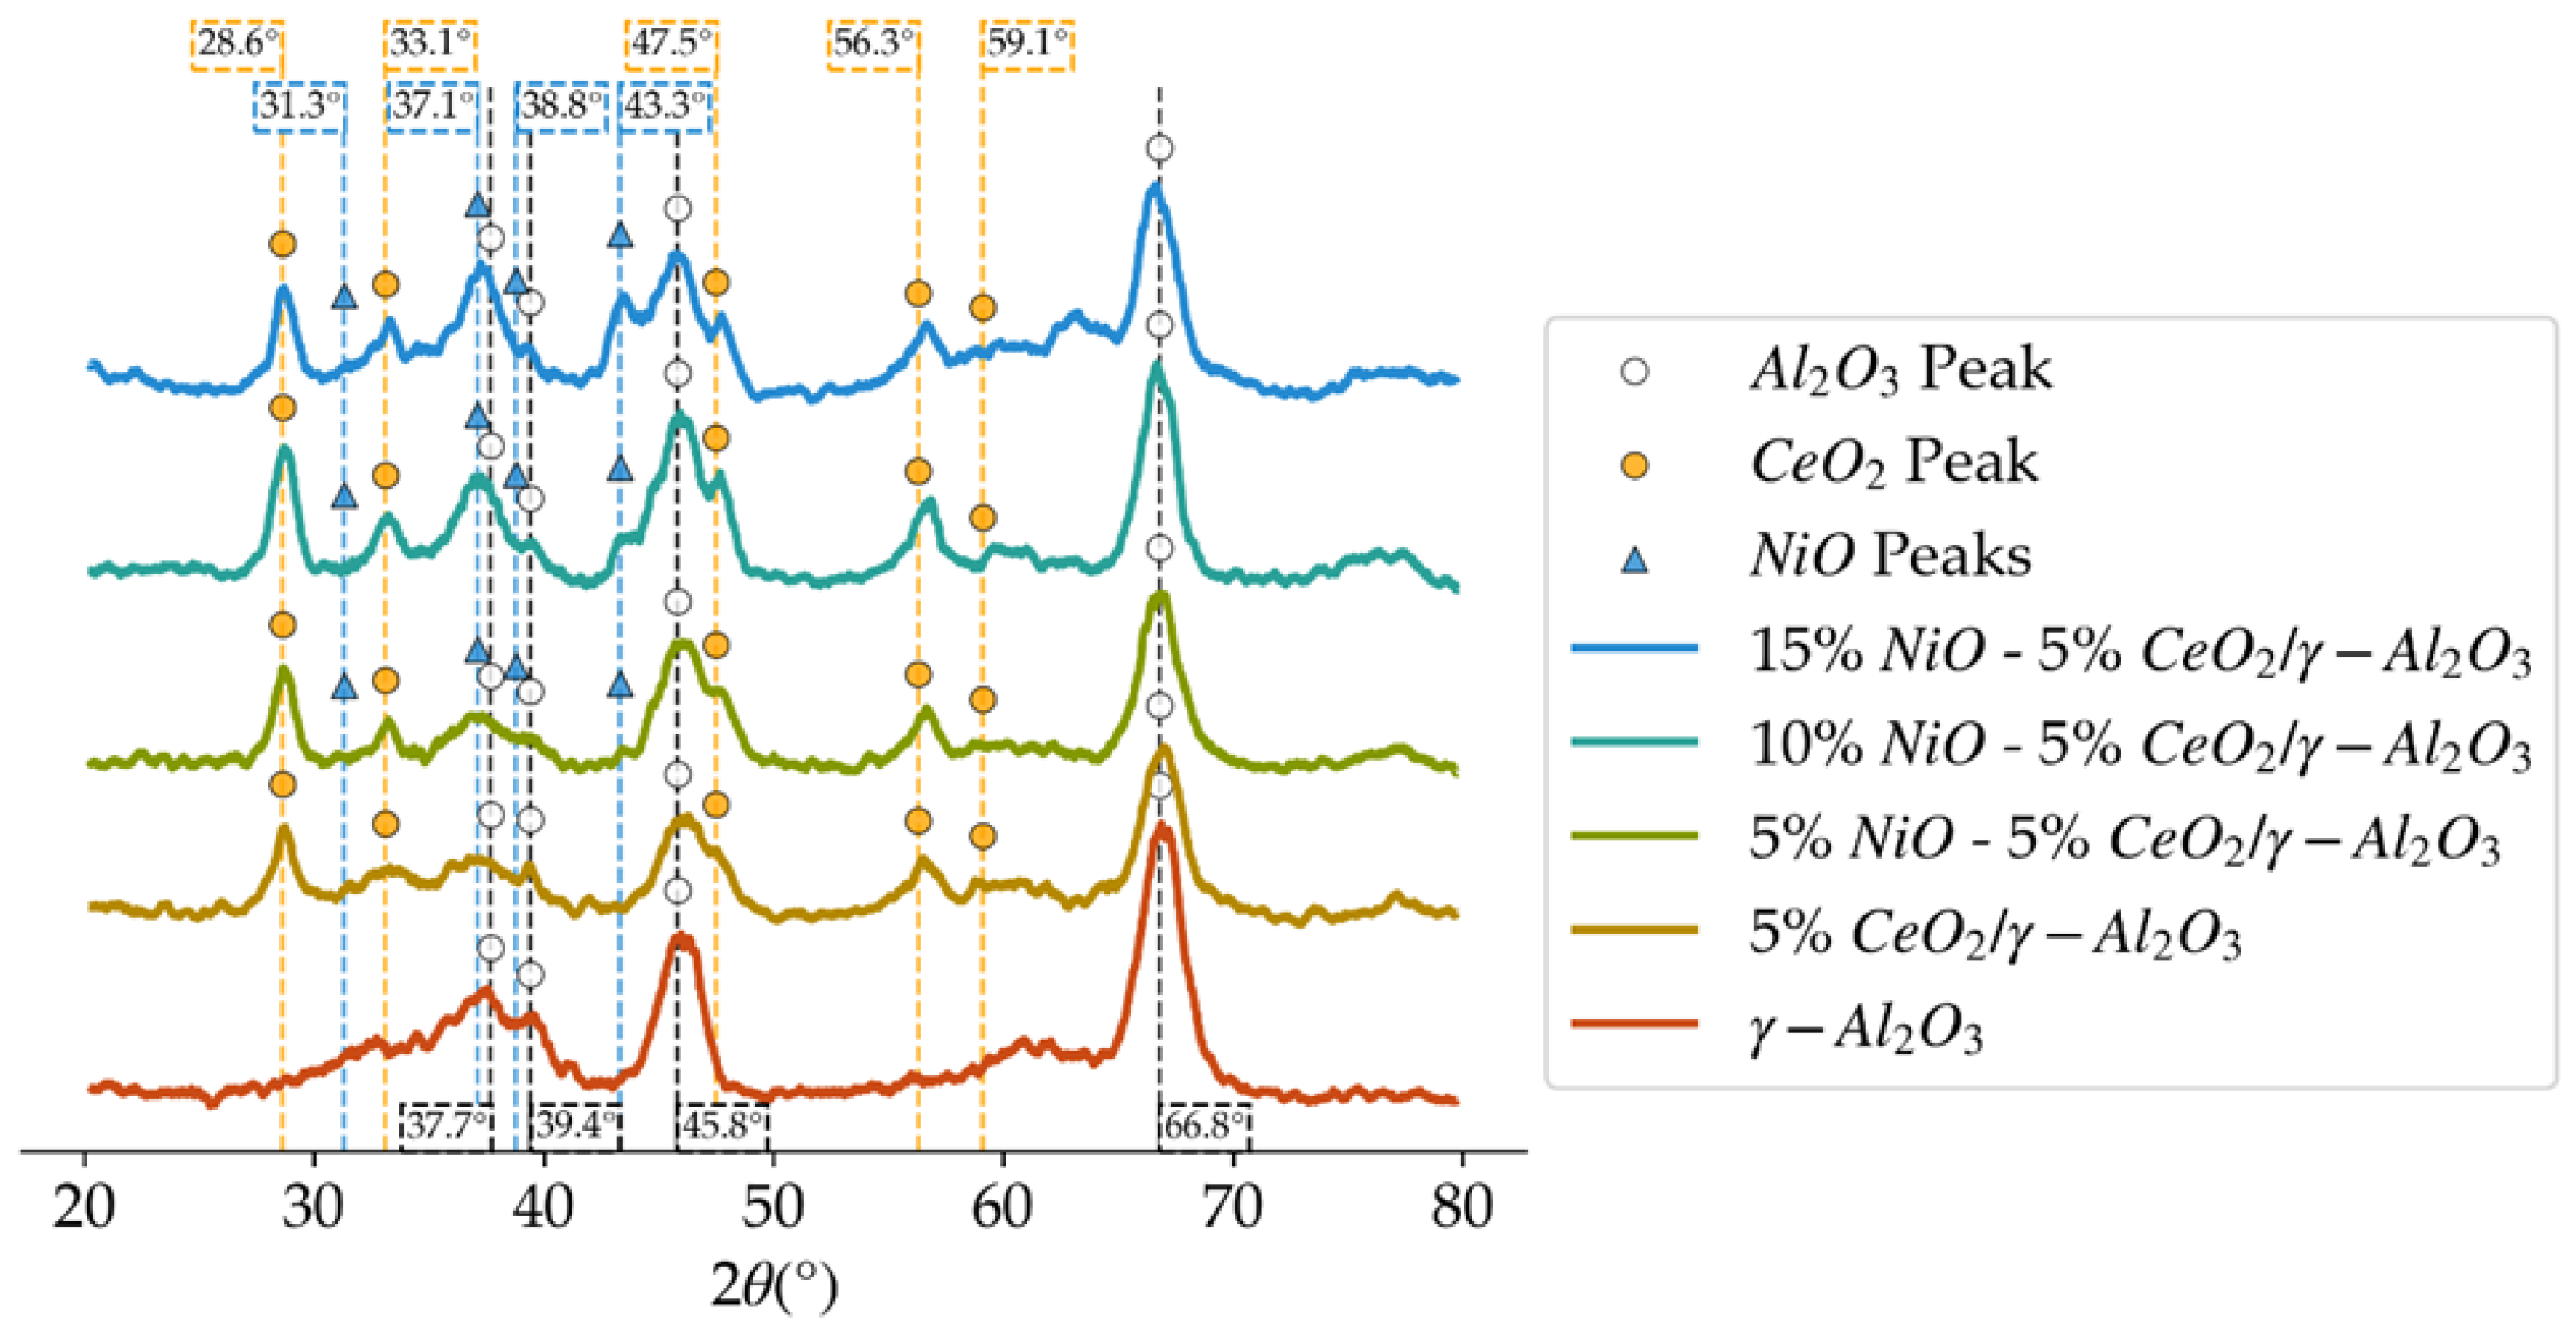
Figure 4.
XRD patterns in the 2θ degrees diffractogram for the different loadings of NiO over 5%CeO2/γ-Al2O3.
Figure 4.
XRD patterns in the 2θ degrees diffractogram for the different loadings of NiO over 5%CeO2/γ-Al2O3.
Figure 5.
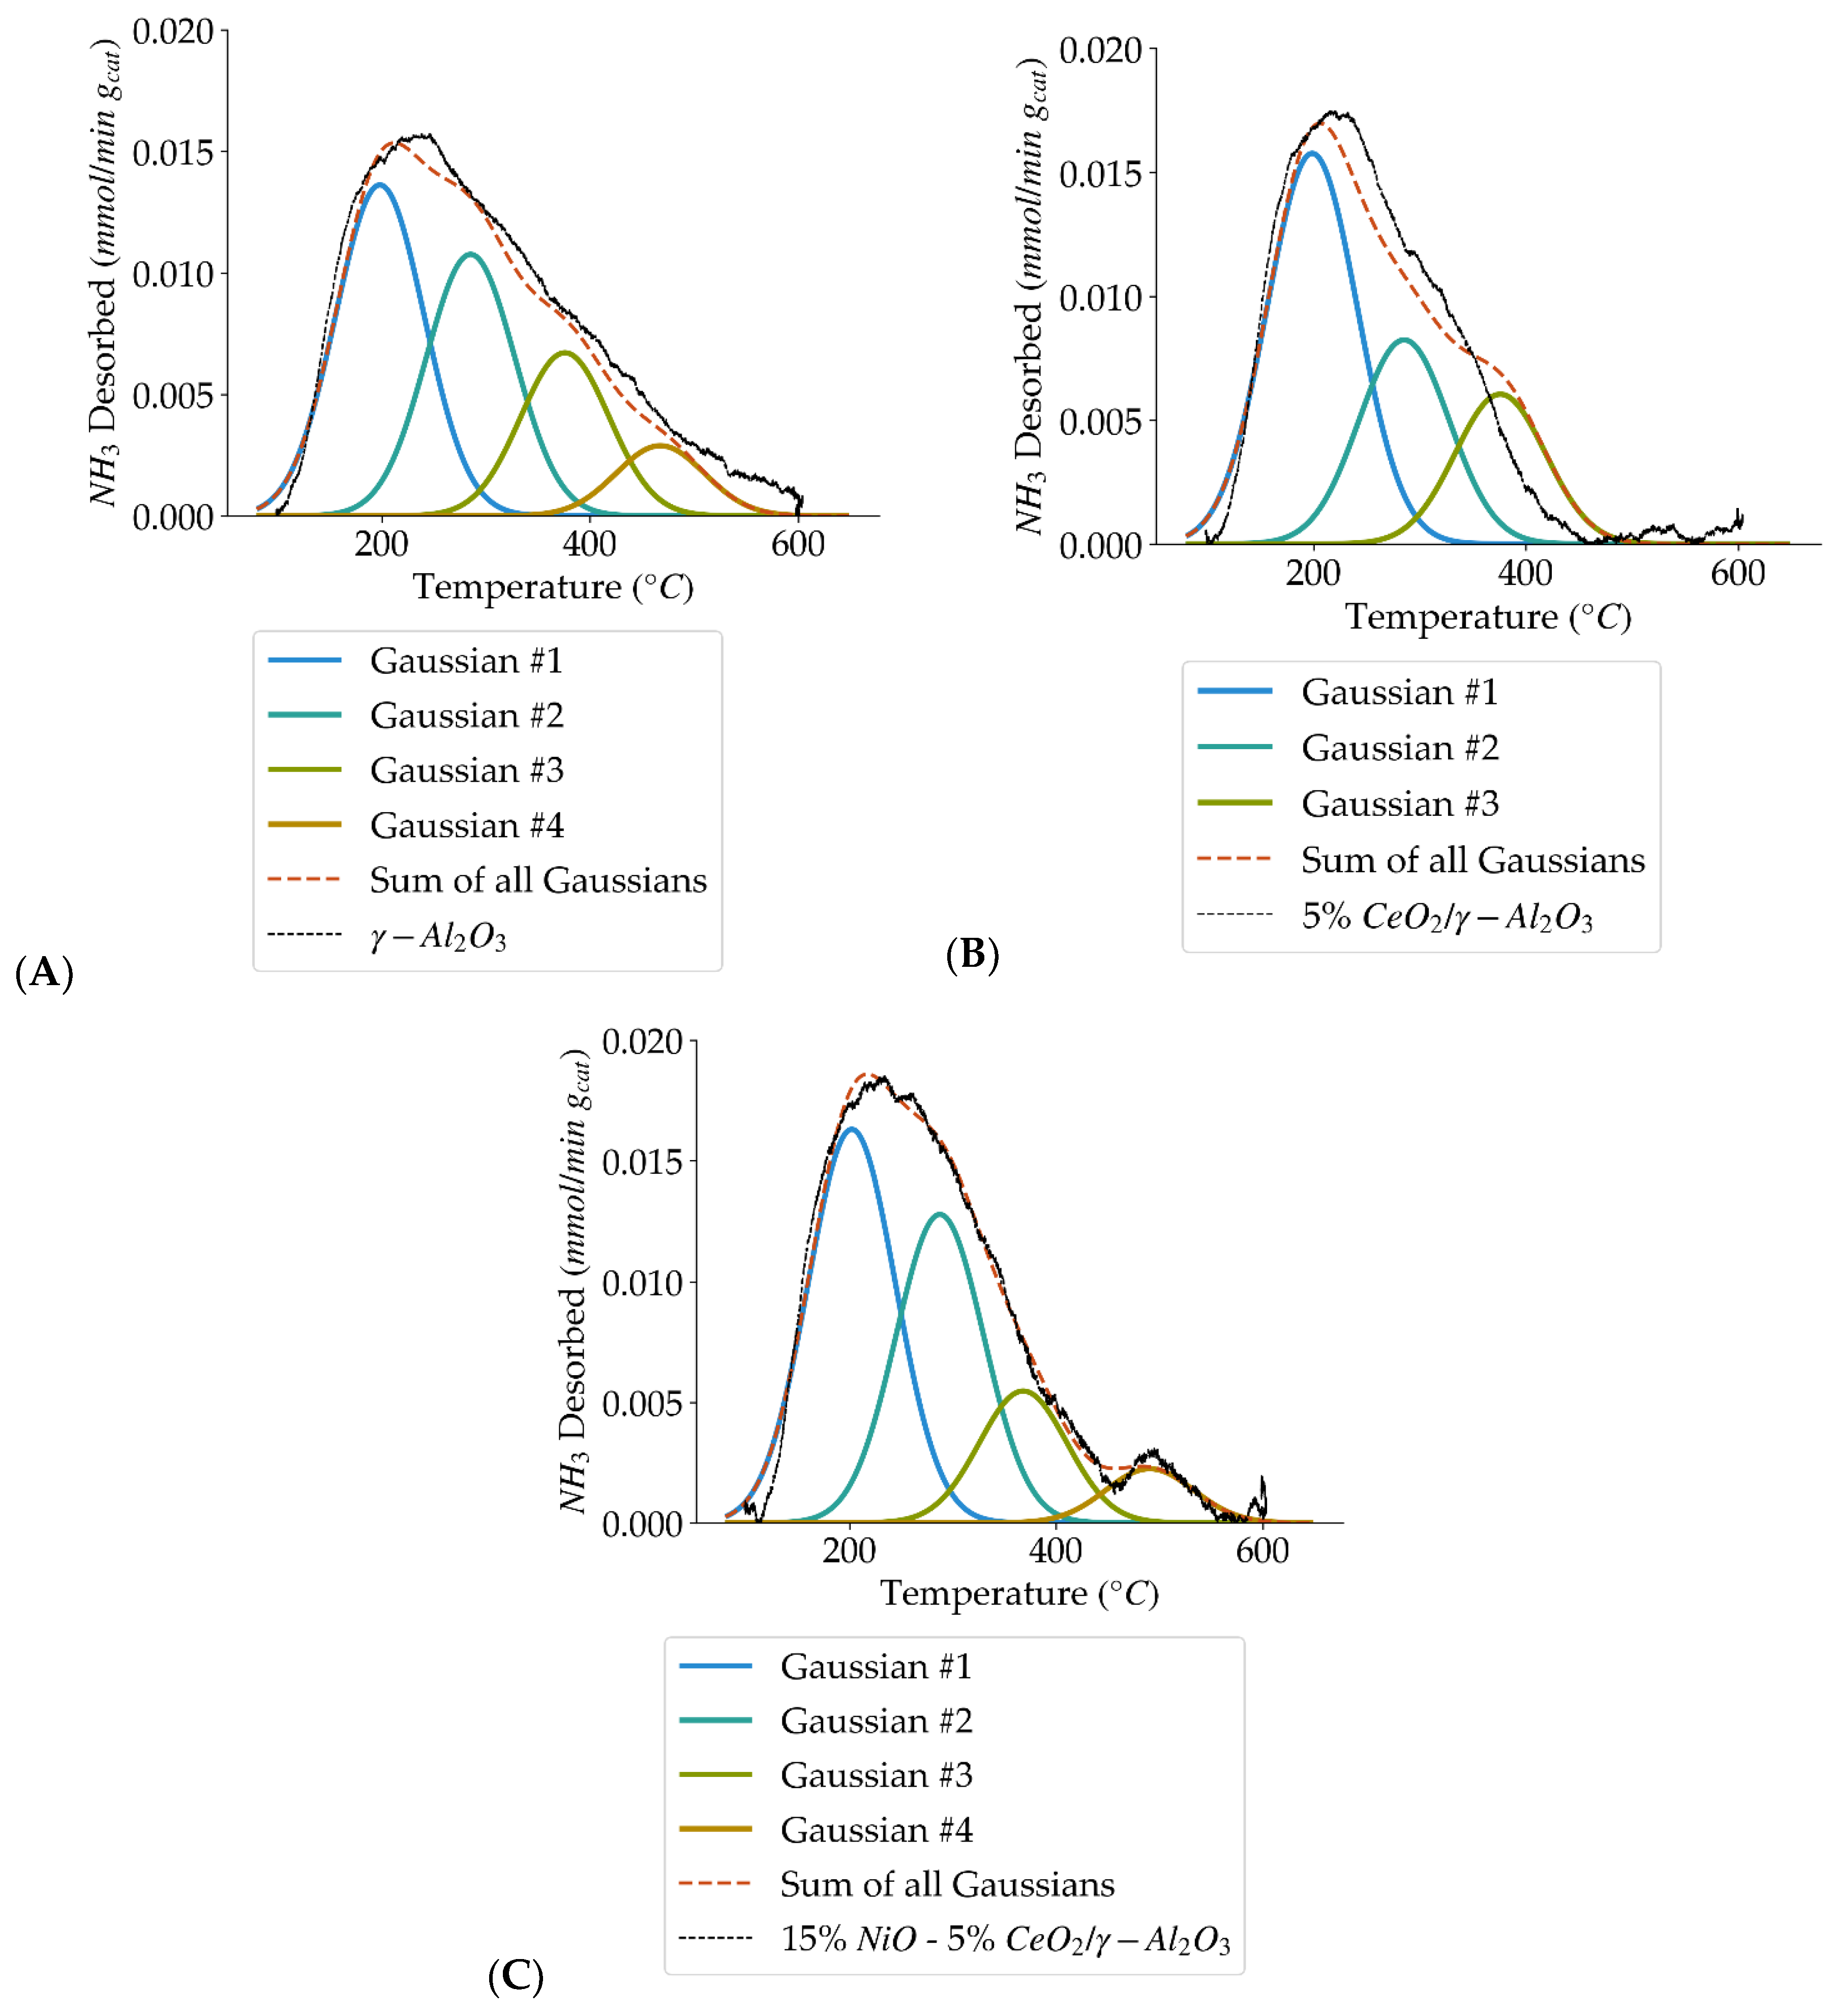
Deconvolution of NH3–TPD curves showing the four acid site types (weak, medium, strong, very strong) for: (A) γ-Al2O3, (B) 5% CeO2/γ-Al2O3, and (C) 15% NiO-5% CeO2/γ-Al2O3.
Figure 5.
Deconvolution of NH3–TPD curves showing the four acid site types (weak, medium, strong, very strong) for: (A) γ-Al2O3, (B) 5% CeO2/γ-Al2O3, and (C) 15% NiO-5% CeO2/γ-Al2O3.
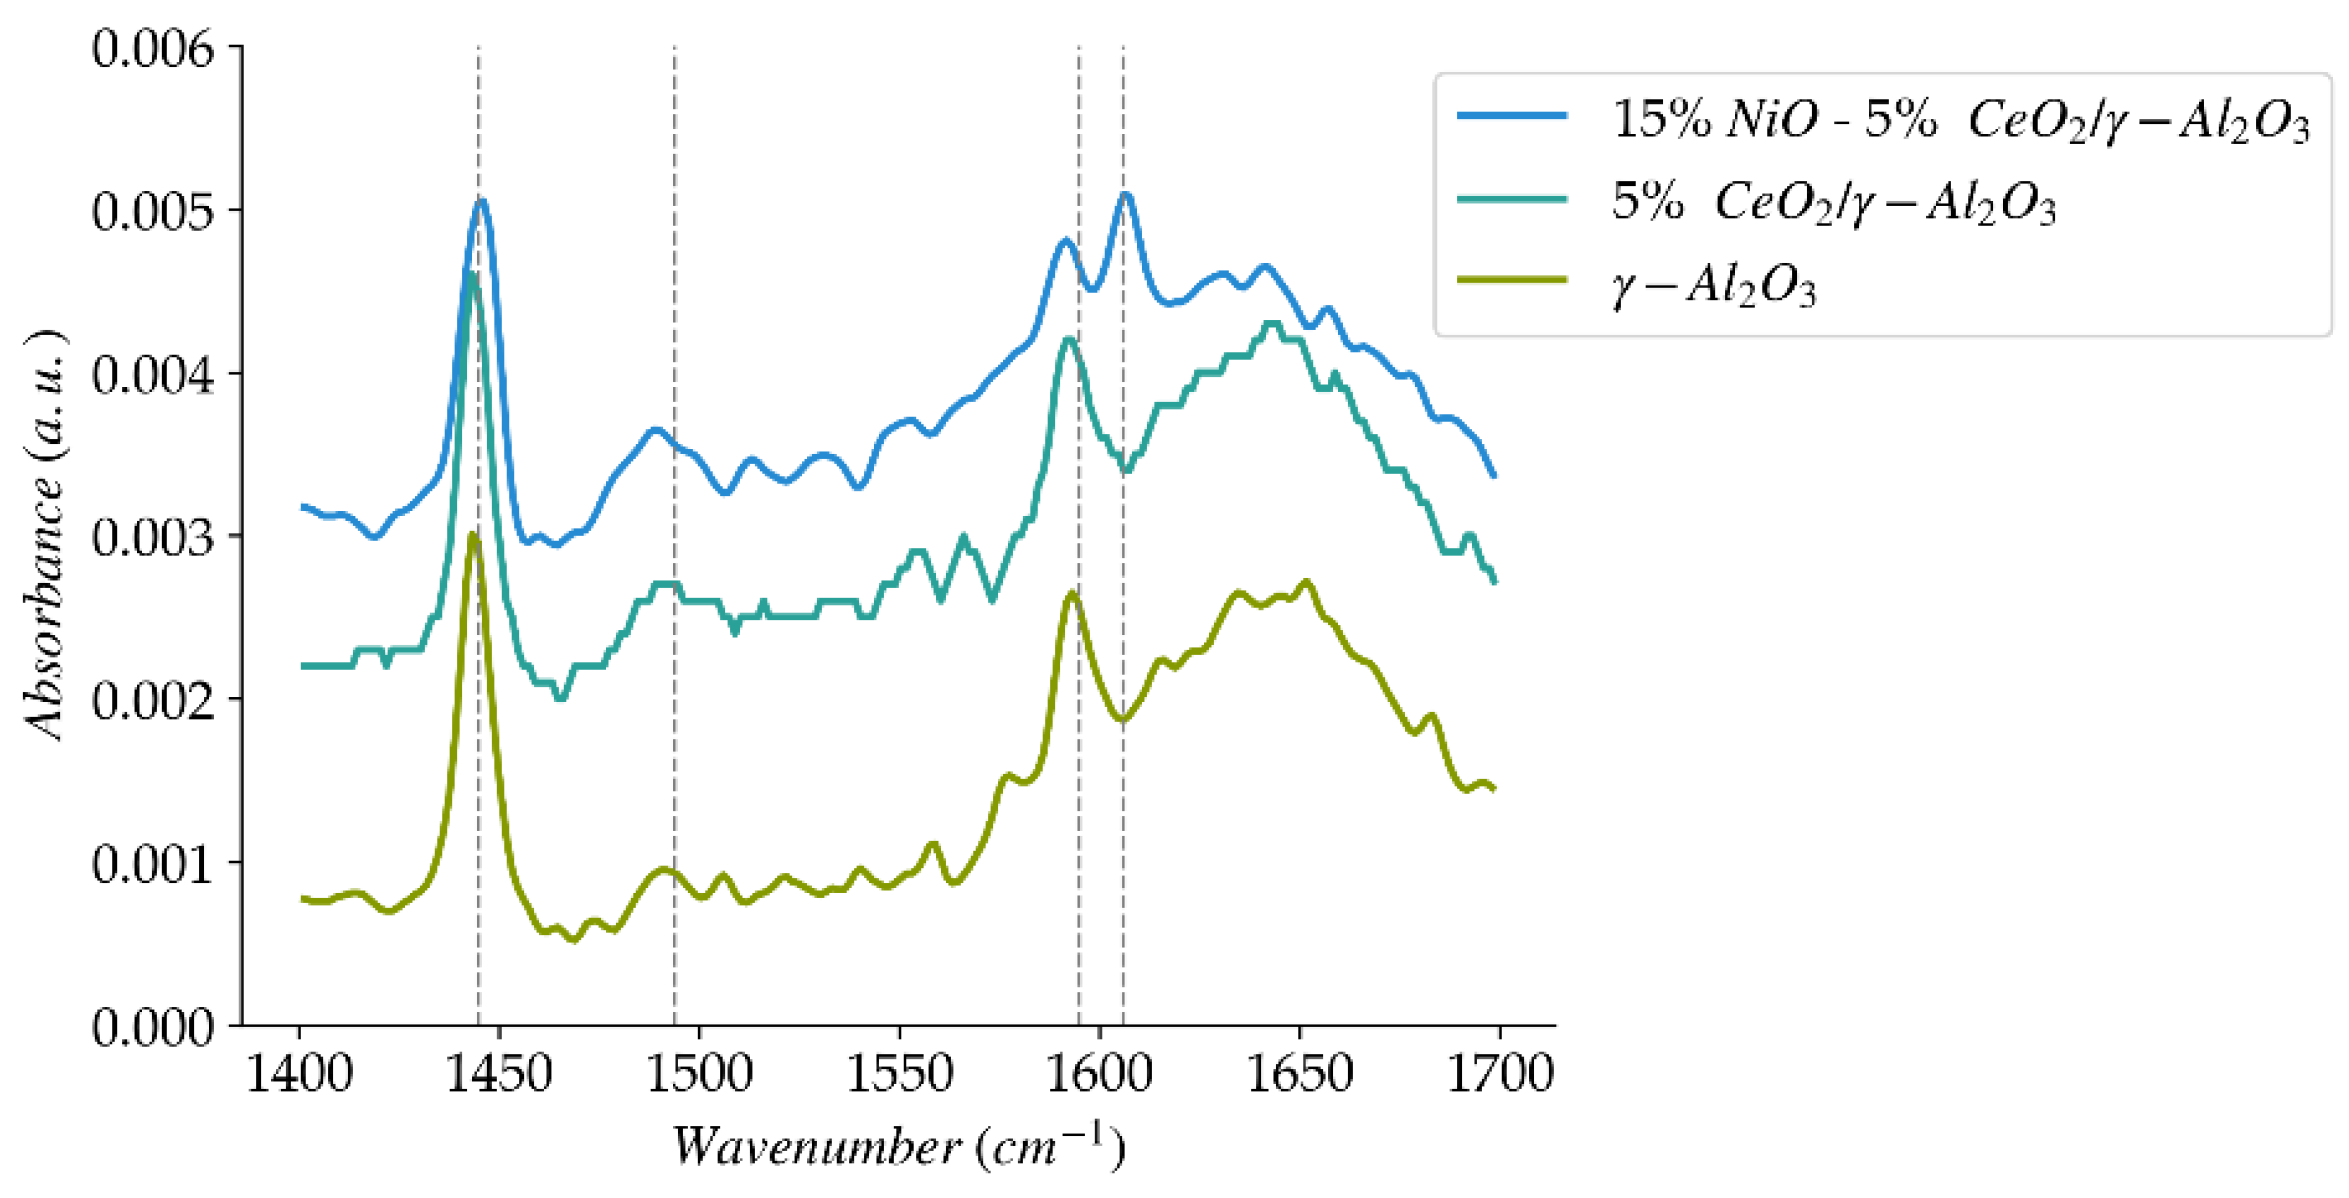
Figure 6.
Pyridine FTIR spectra for the catalyst and catalyst precursors of the present study.
Figure 6.
Pyridine FTIR spectra for the catalyst and catalyst precursors of the present study.
Figure 7.
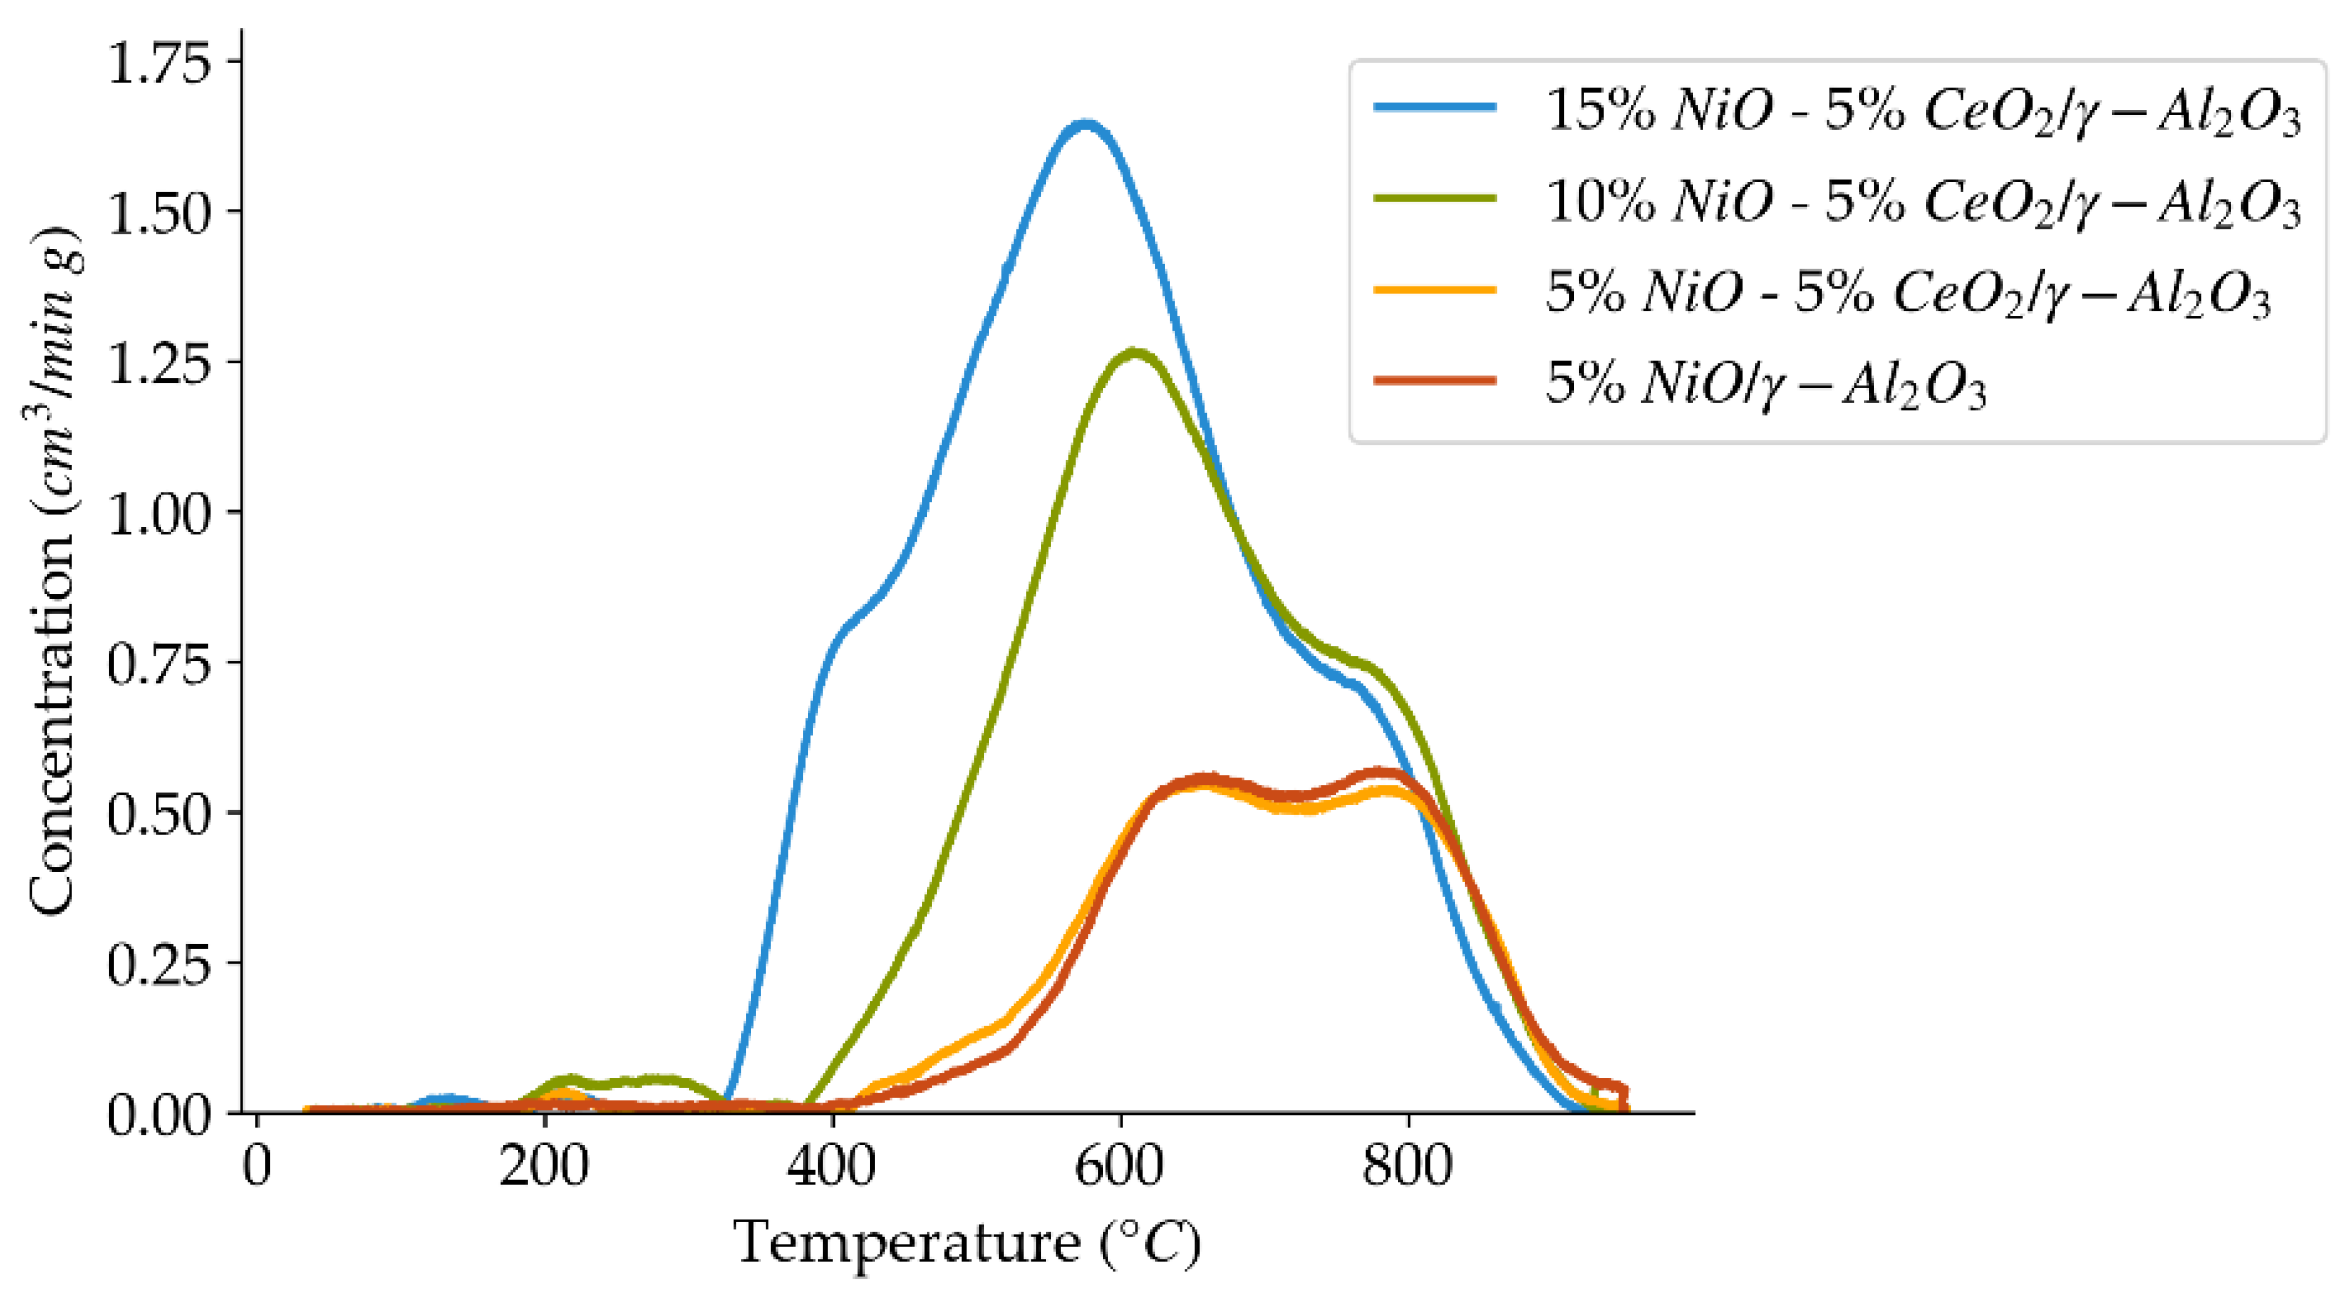
H2-TPR profiles using a 10 °C/min heating ramp, for the set of catalysts prepared with different nickel loadings.
Figure 7.
H2-TPR profiles using a 10 °C/min heating ramp, for the set of catalysts prepared with different nickel loadings.
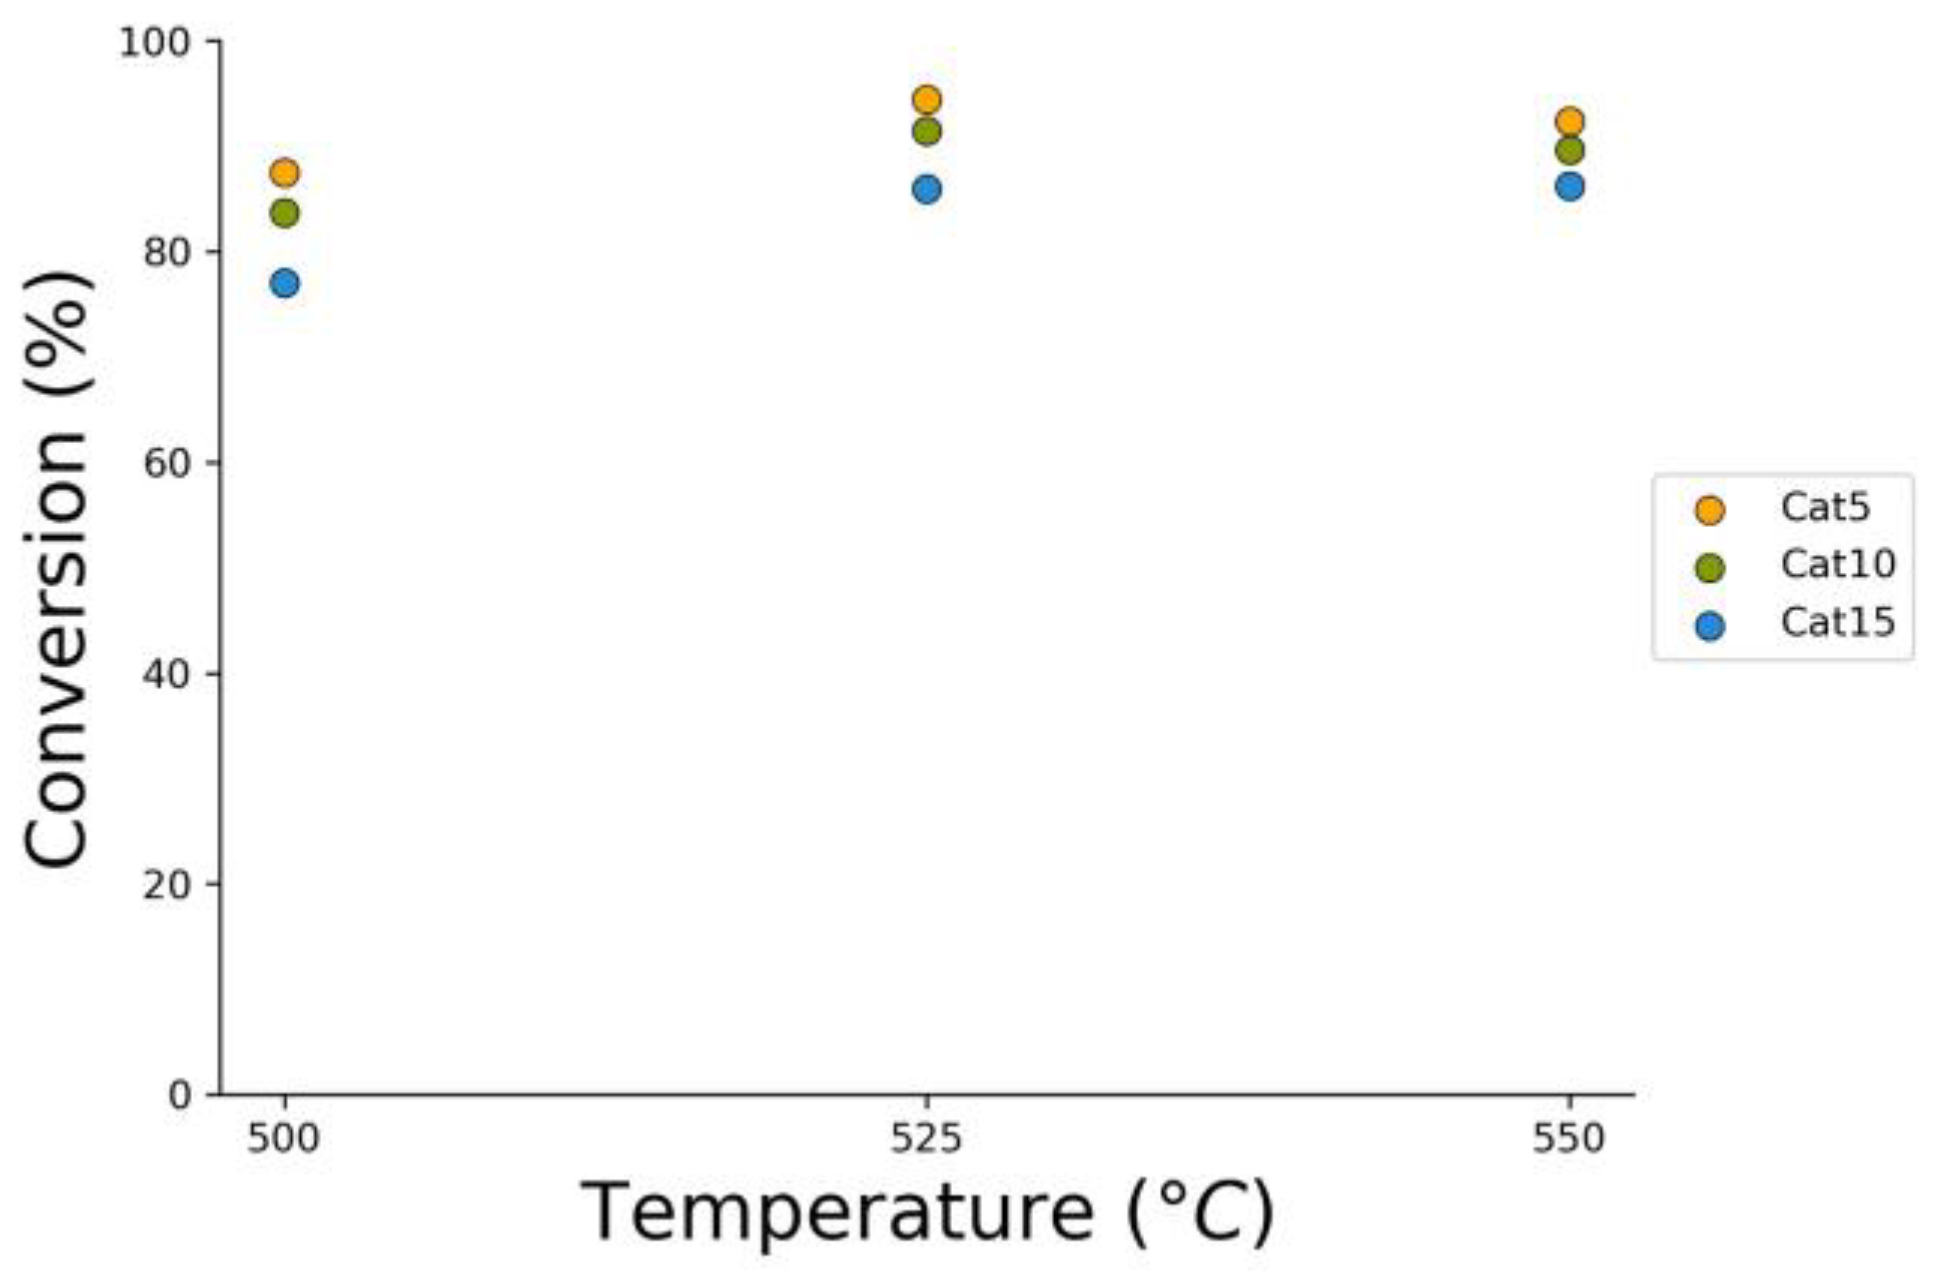
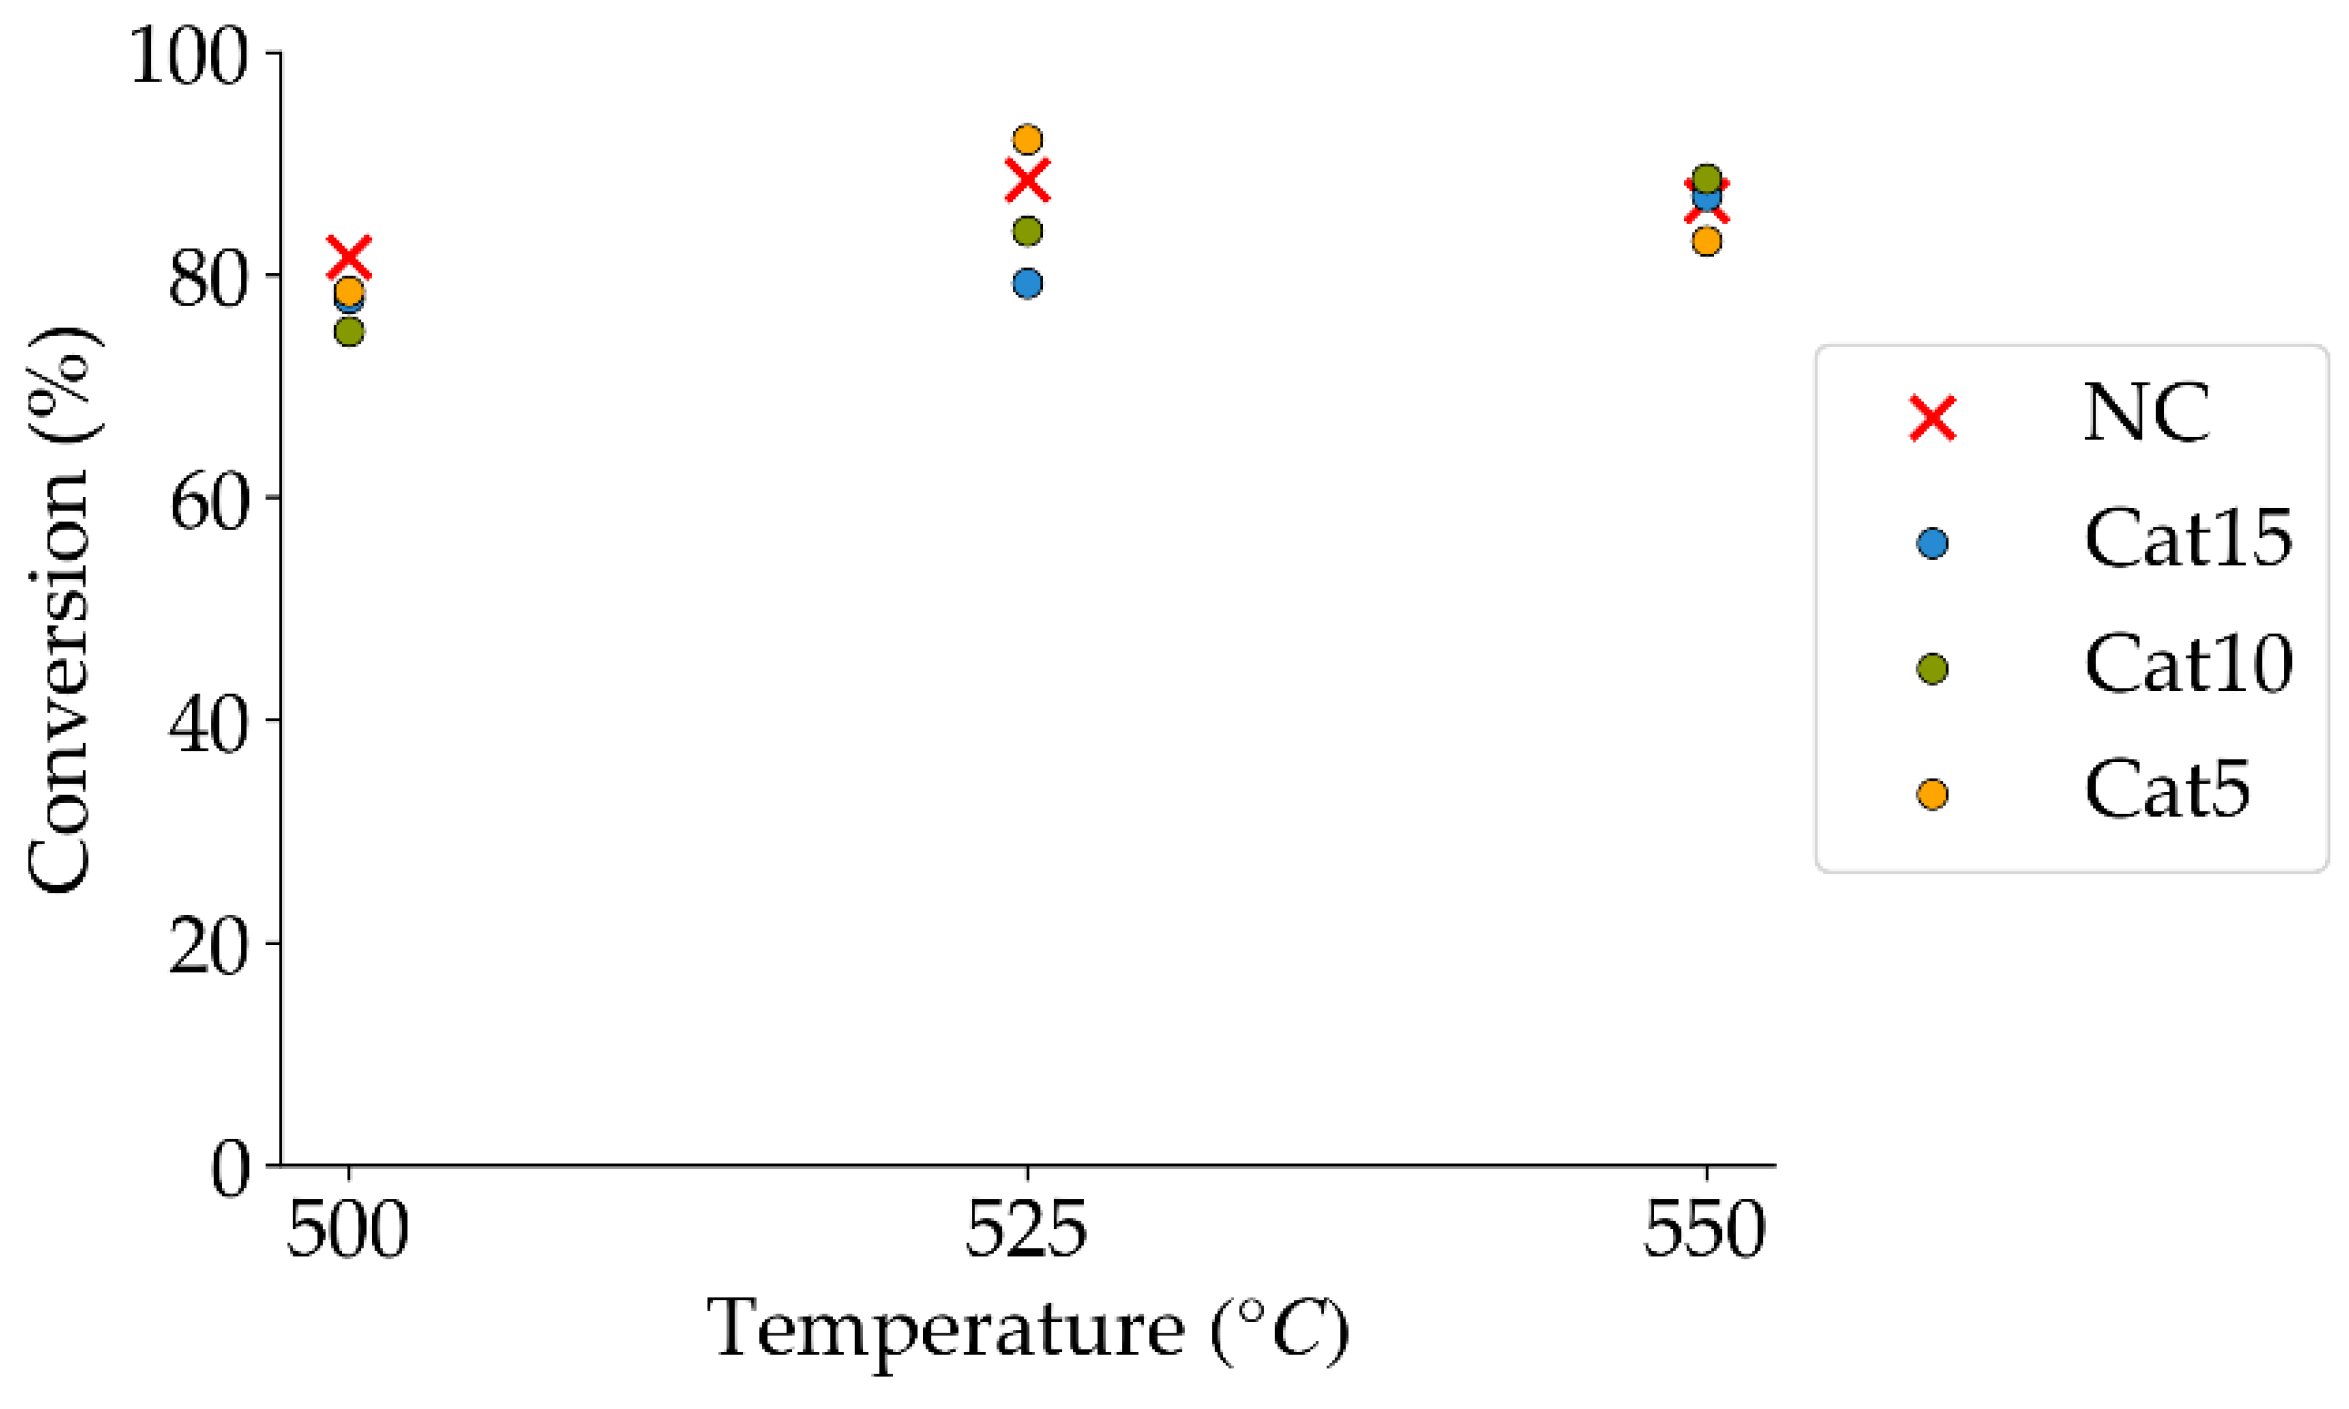
Figure 8.
2M4MP catalytic conversions under steam (mean standard deviation: ±6%). Notes: (a) Catalysts: Cat5, Cat10, Cat15, (b) catalyst weight: 0.30 g, (c) reaction time: 10 s, (d) non-catalytic (NC) runs’ conversions are reported as a reference.
Figure 8.
2M4MP catalytic conversions under steam (mean standard deviation: ±6%). Notes: (a) Catalysts: Cat5, Cat10, Cat15, (b) catalyst weight: 0.30 g, (c) reaction time: 10 s, (d) non-catalytic (NC) runs’ conversions are reported as a reference.
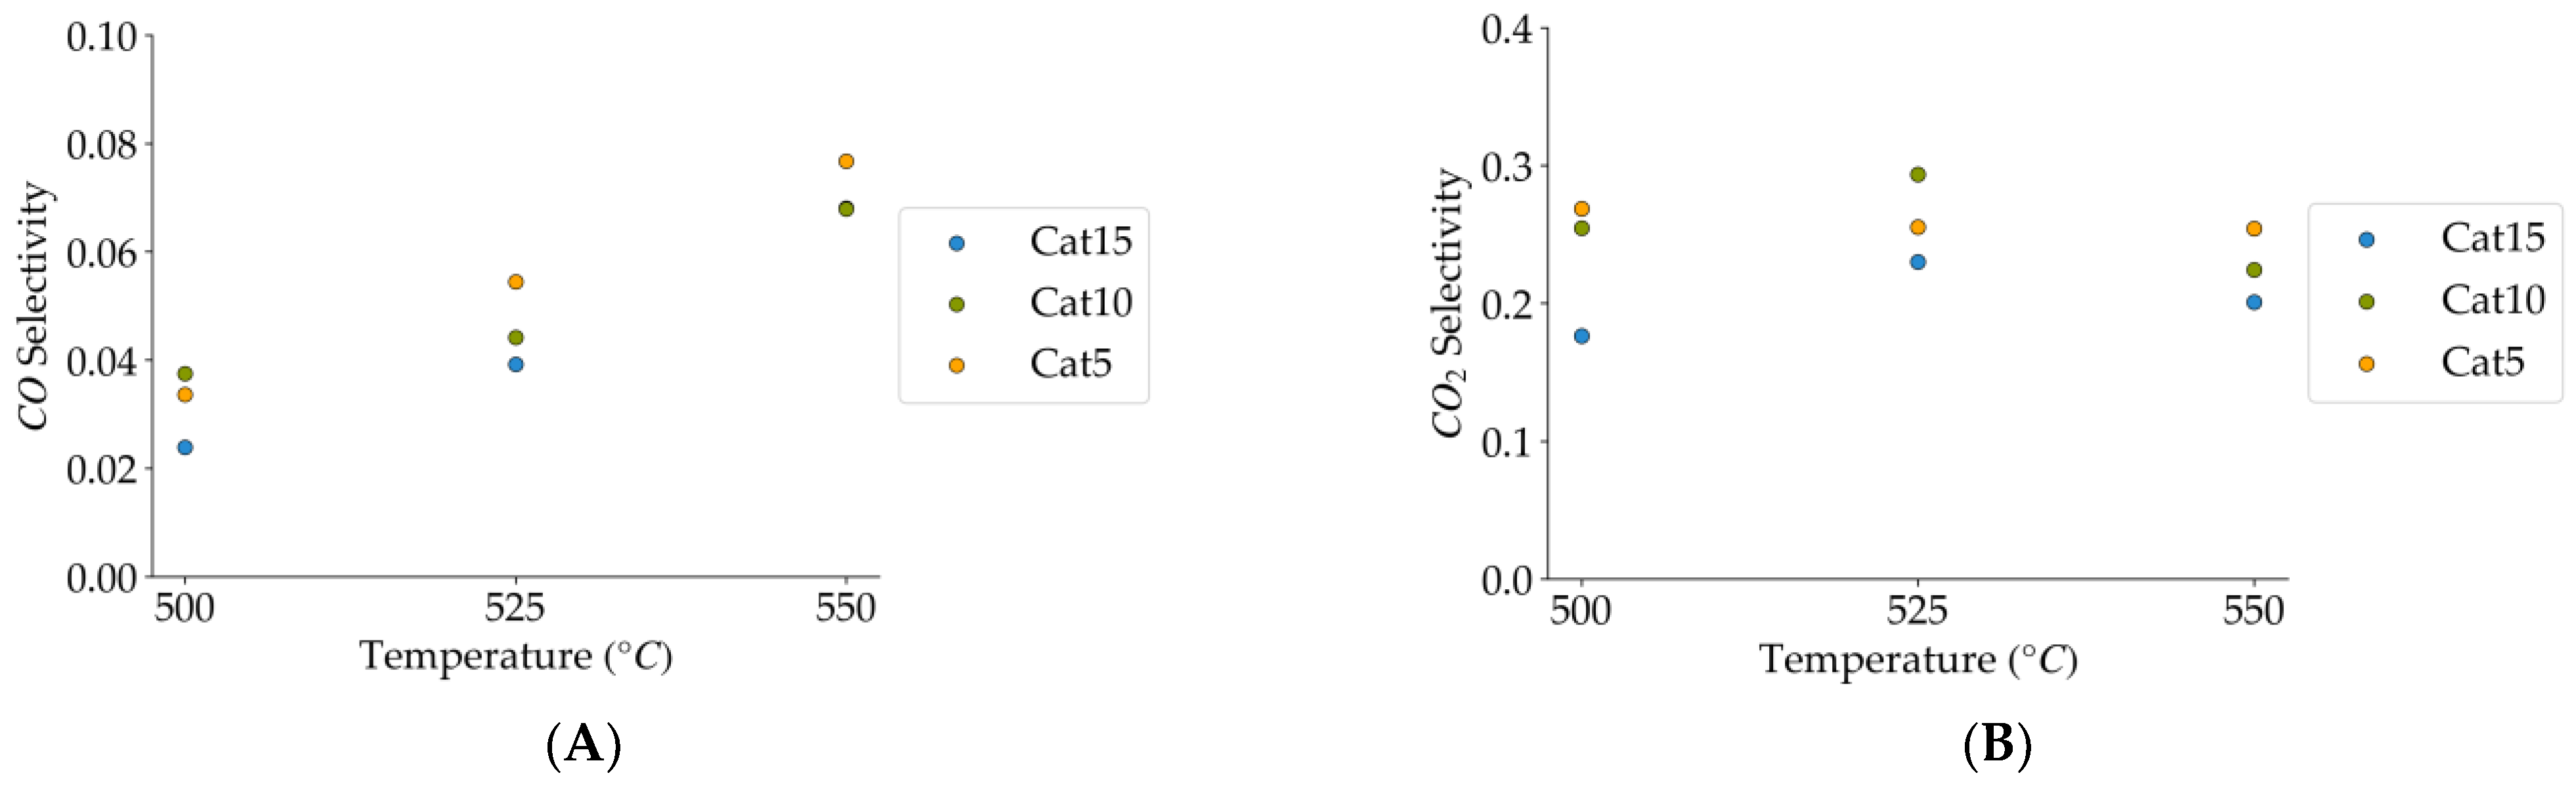
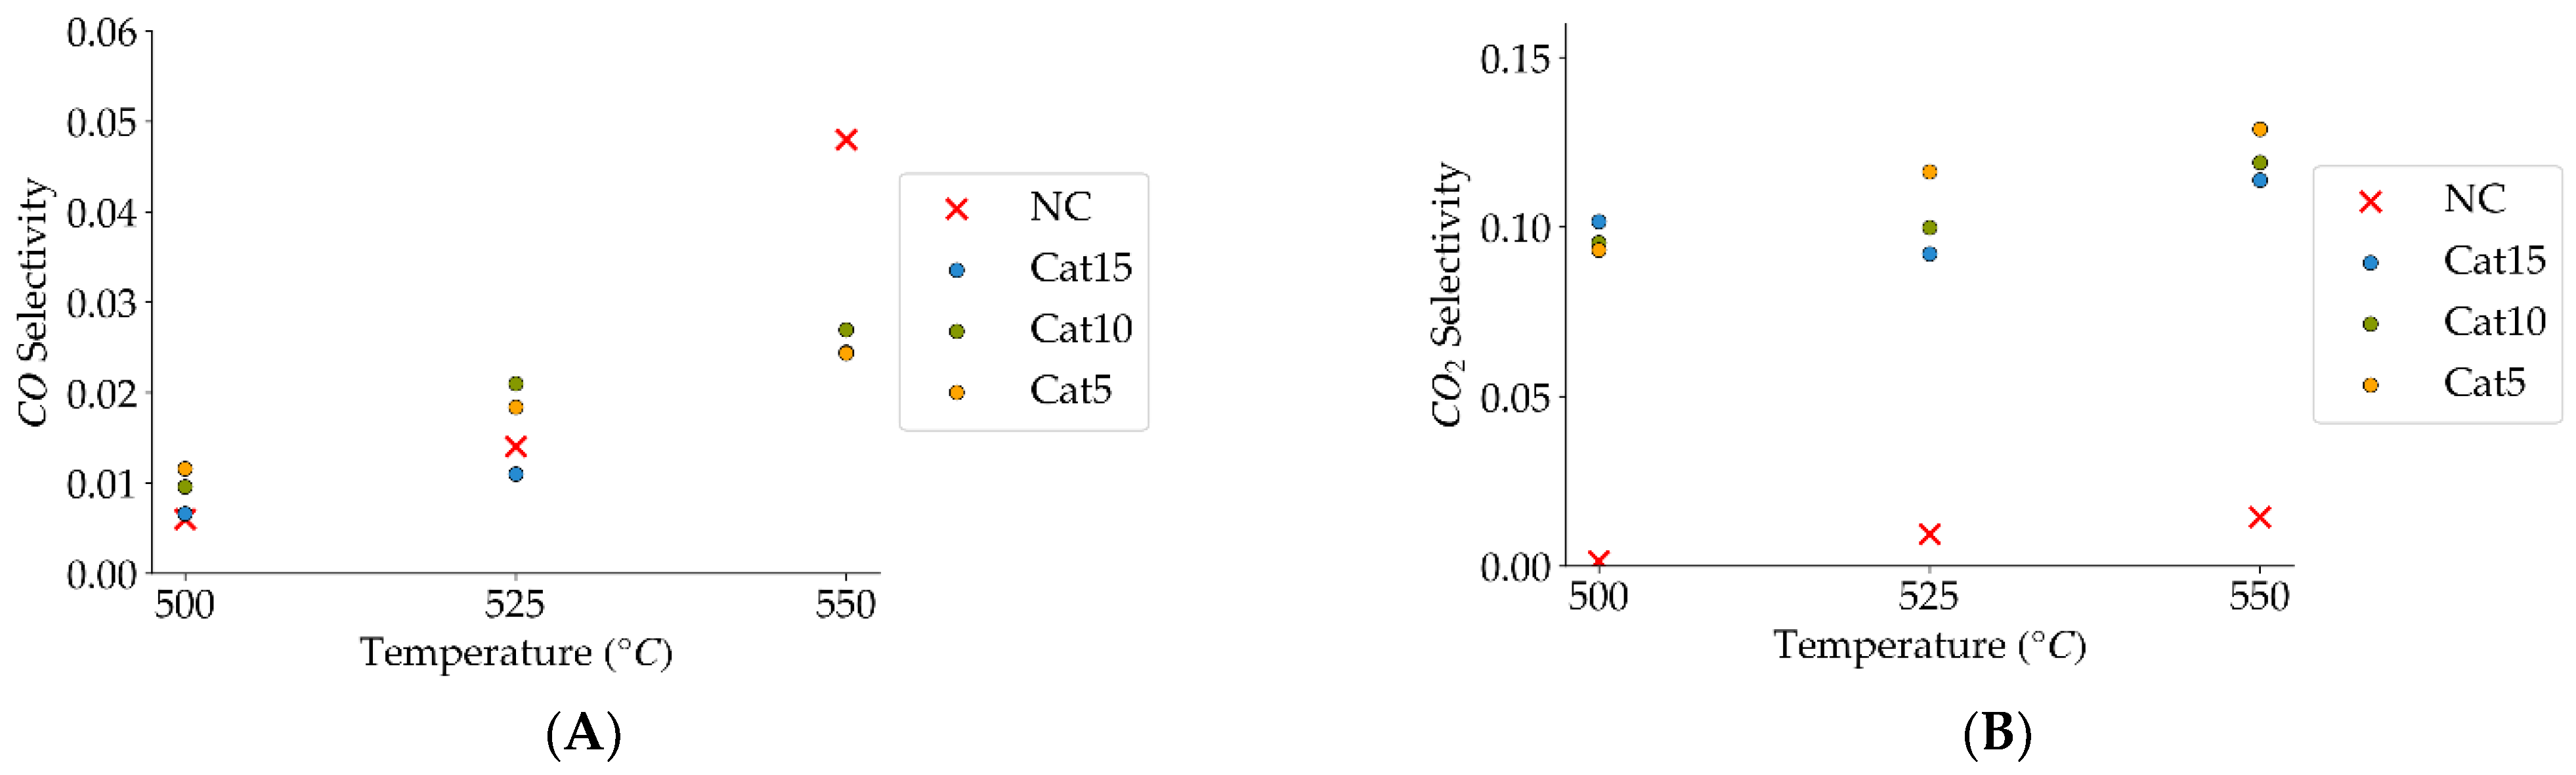
Figure 9.
(A) Catalyst selectivity towards carbon monoxide (the mean standard deviation is ±0.007), (B) catalyst selectivity towards carbon dioxide (the mean standard deviation is ±0.01). Notes: (a) Tar surrogate: 2M4MP, (b) reaction time: 10 s, (c) steam atmosphere, (d) catalysts: Cat5, Cat10, Cat:15, (e) catalyst weight: 0.30 g, (f) non-catalytic (NC) runs’ conversions are reported as a reference.
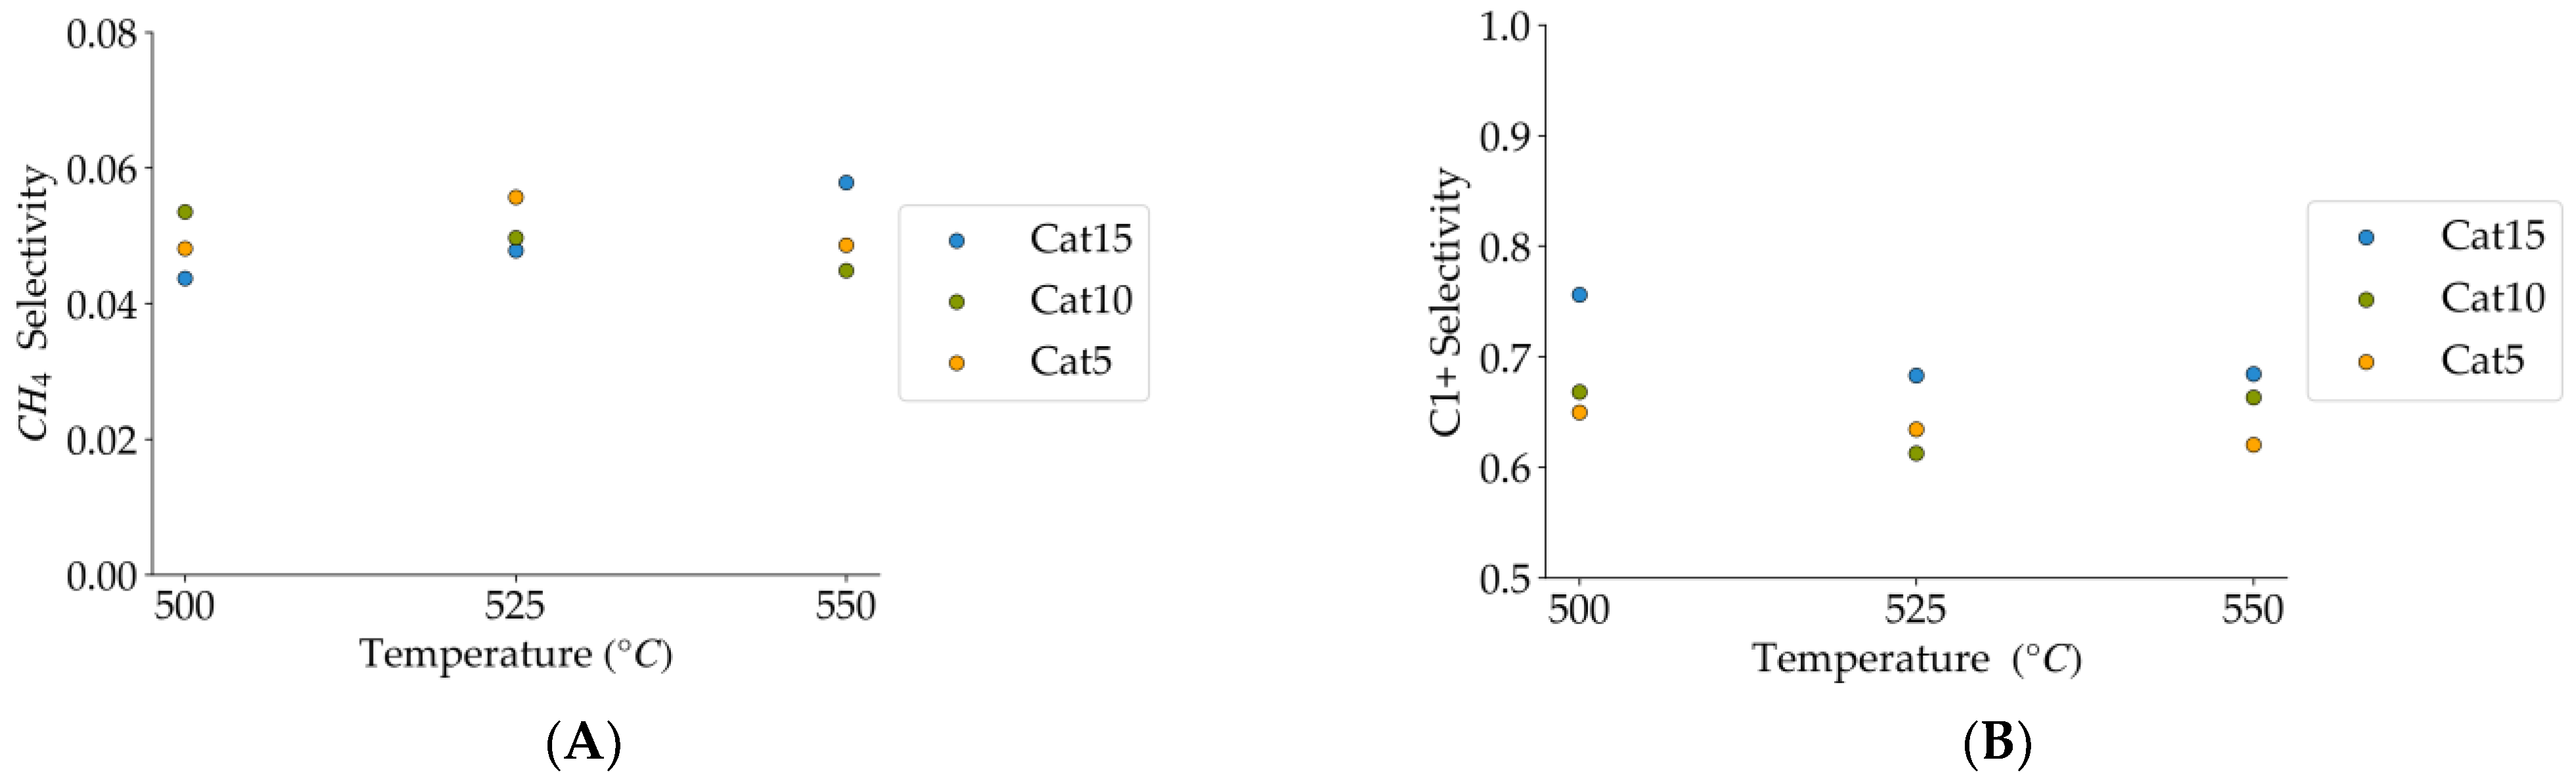
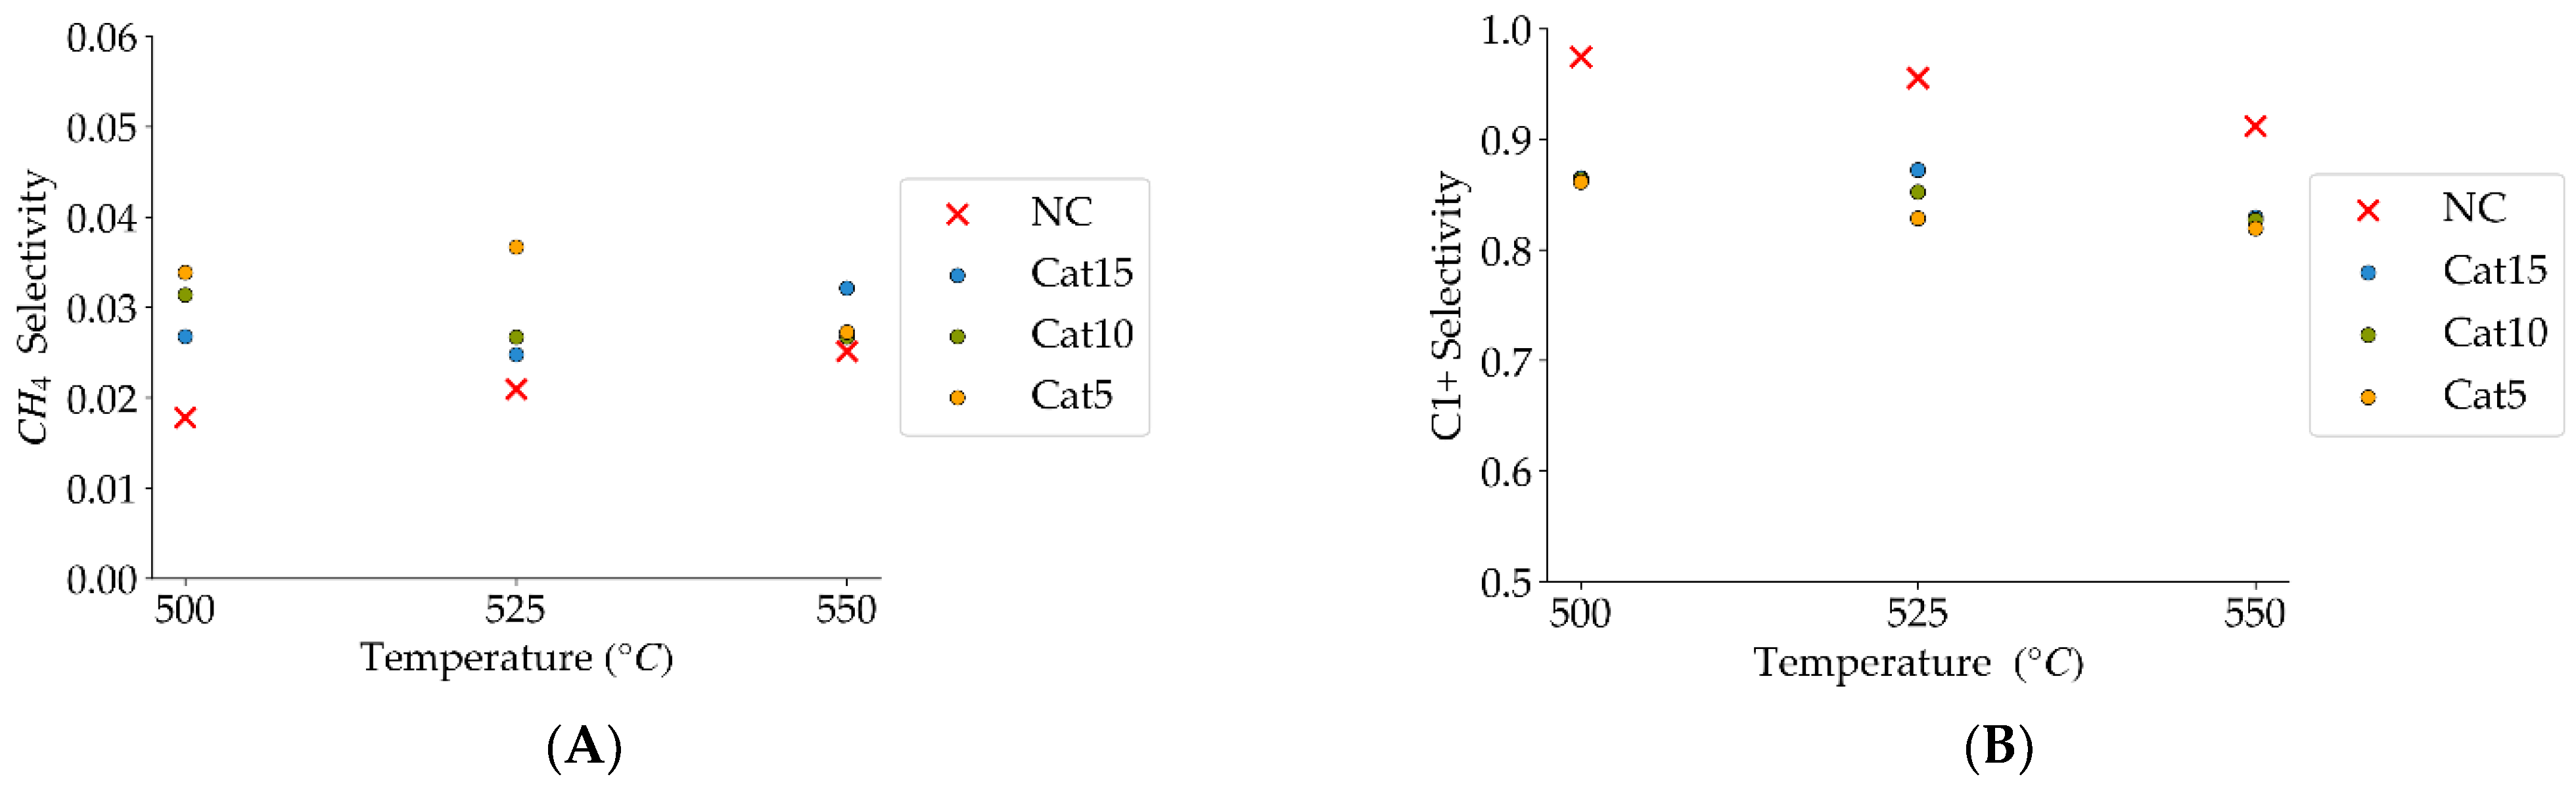
Figure 10.
(A) Methane selectivities (mean standard deviation is ±0.004), (B) c1+ hydrocarbon selectivities (more than one carbon in their molecular formula) (the mean standard deviation is ±0.02). Notes: (a) Tar surrogate: 2M4MP, (b) reaction time: 10 s, (c) steam atmosphere, (d) catalysts: Cat5, Cat10, Cat15, (e) catalyst weight: 0.30 g, (f) non-catalytic runs’ selectivities are reported, as a reference.
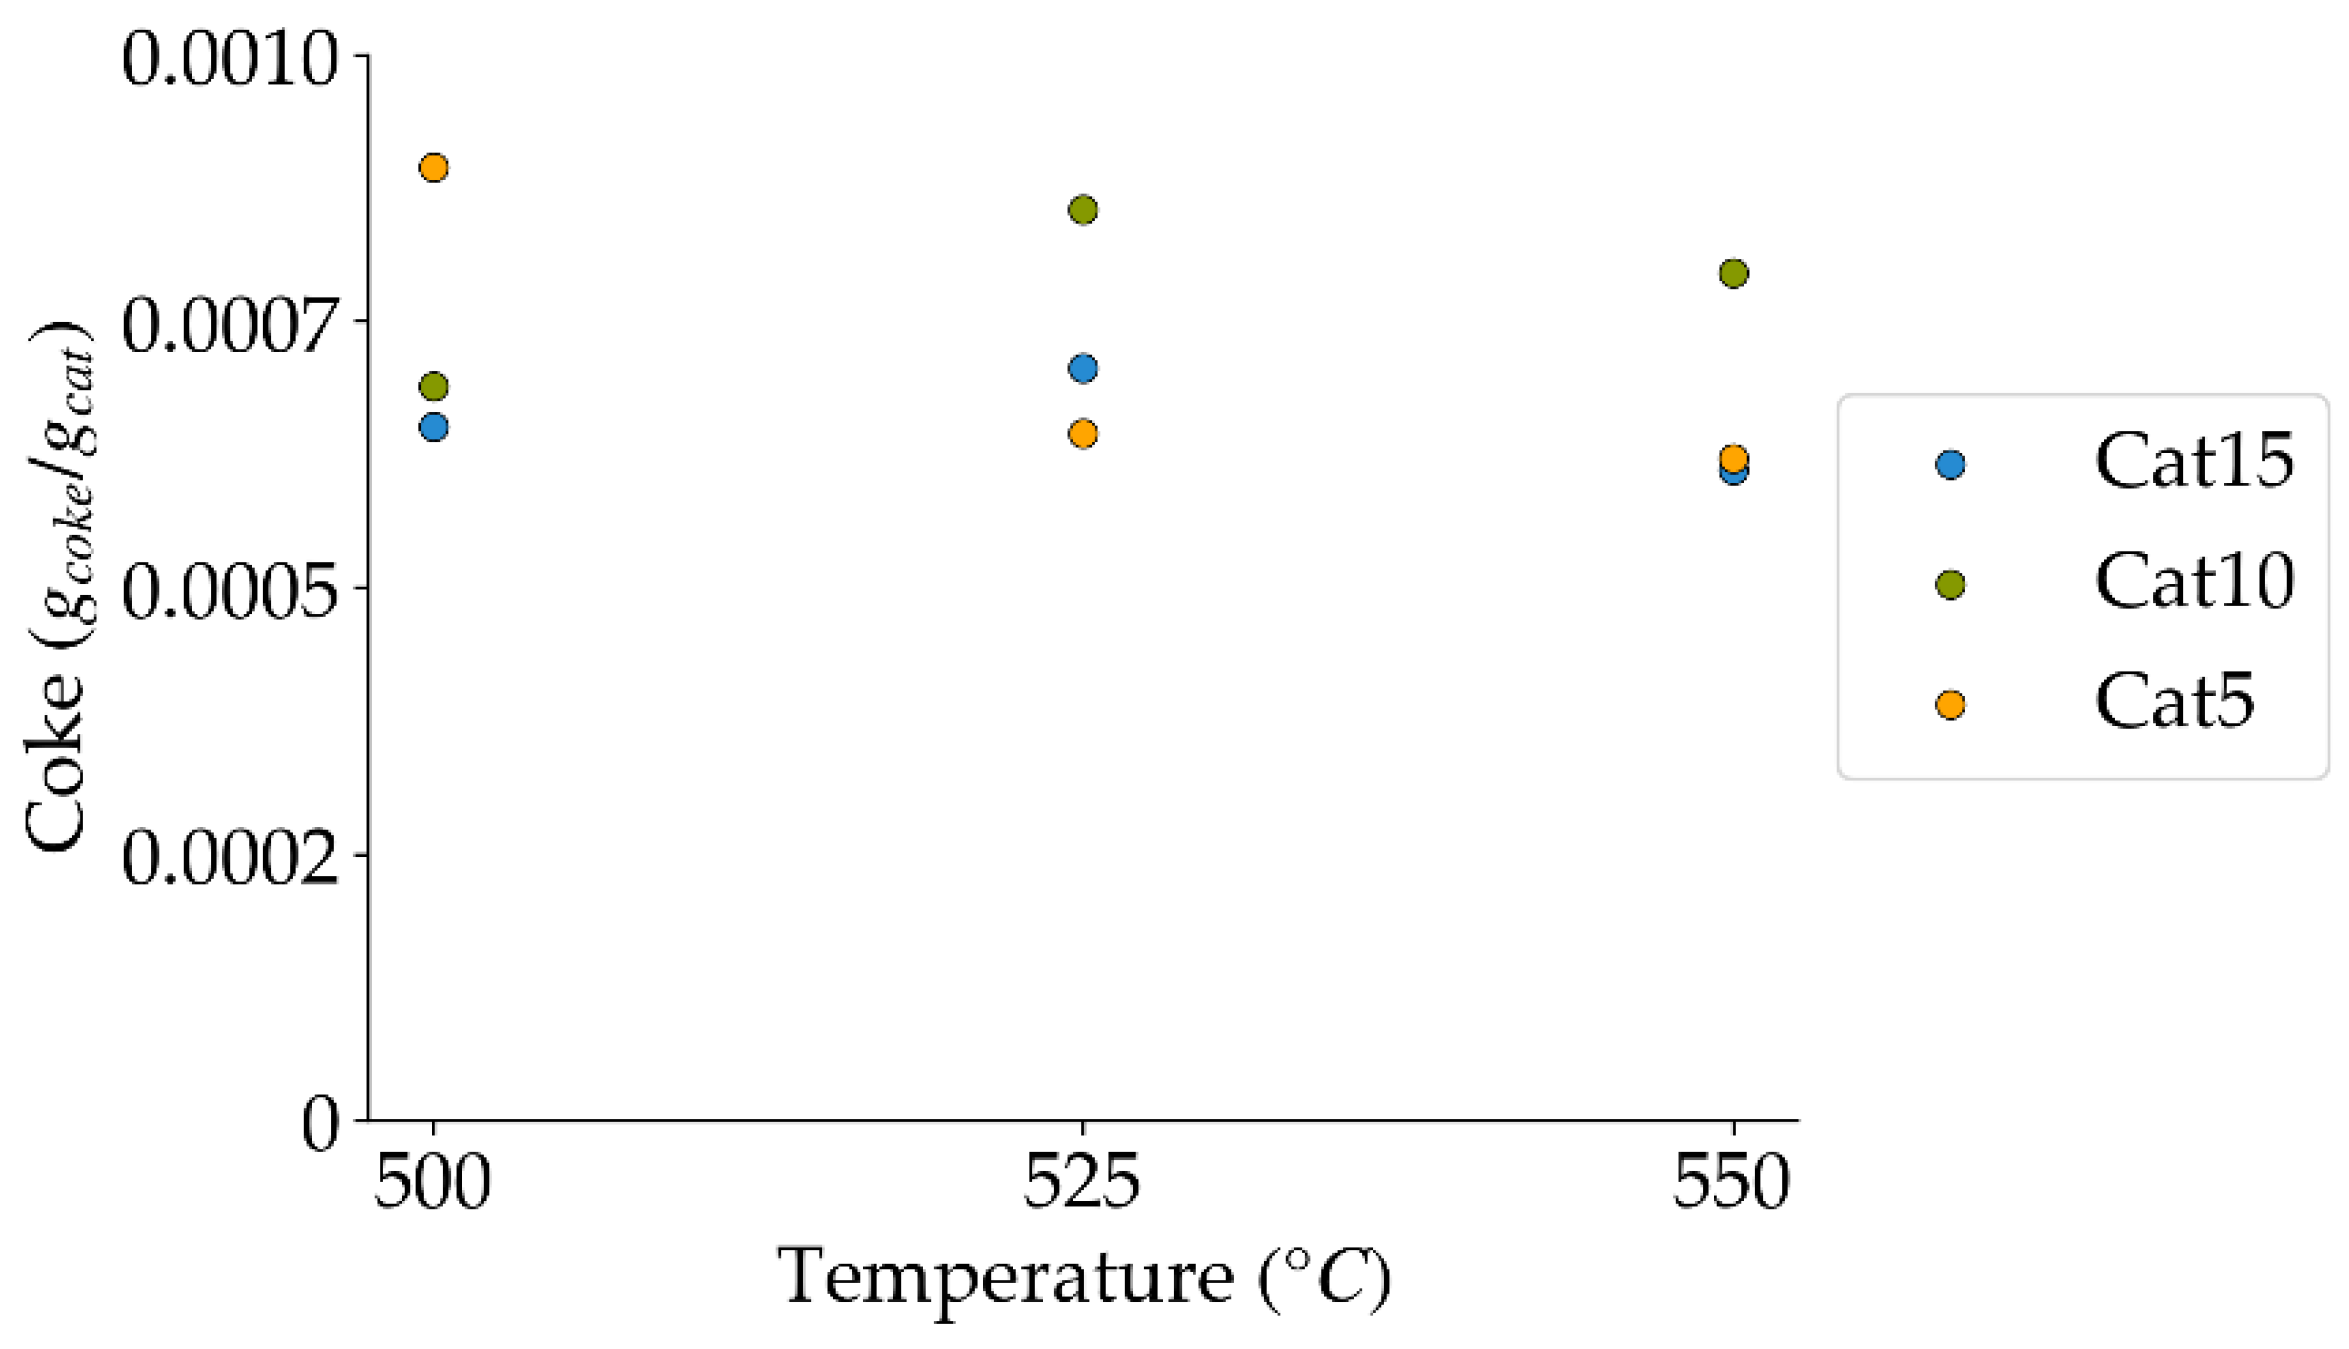
Figure 11.
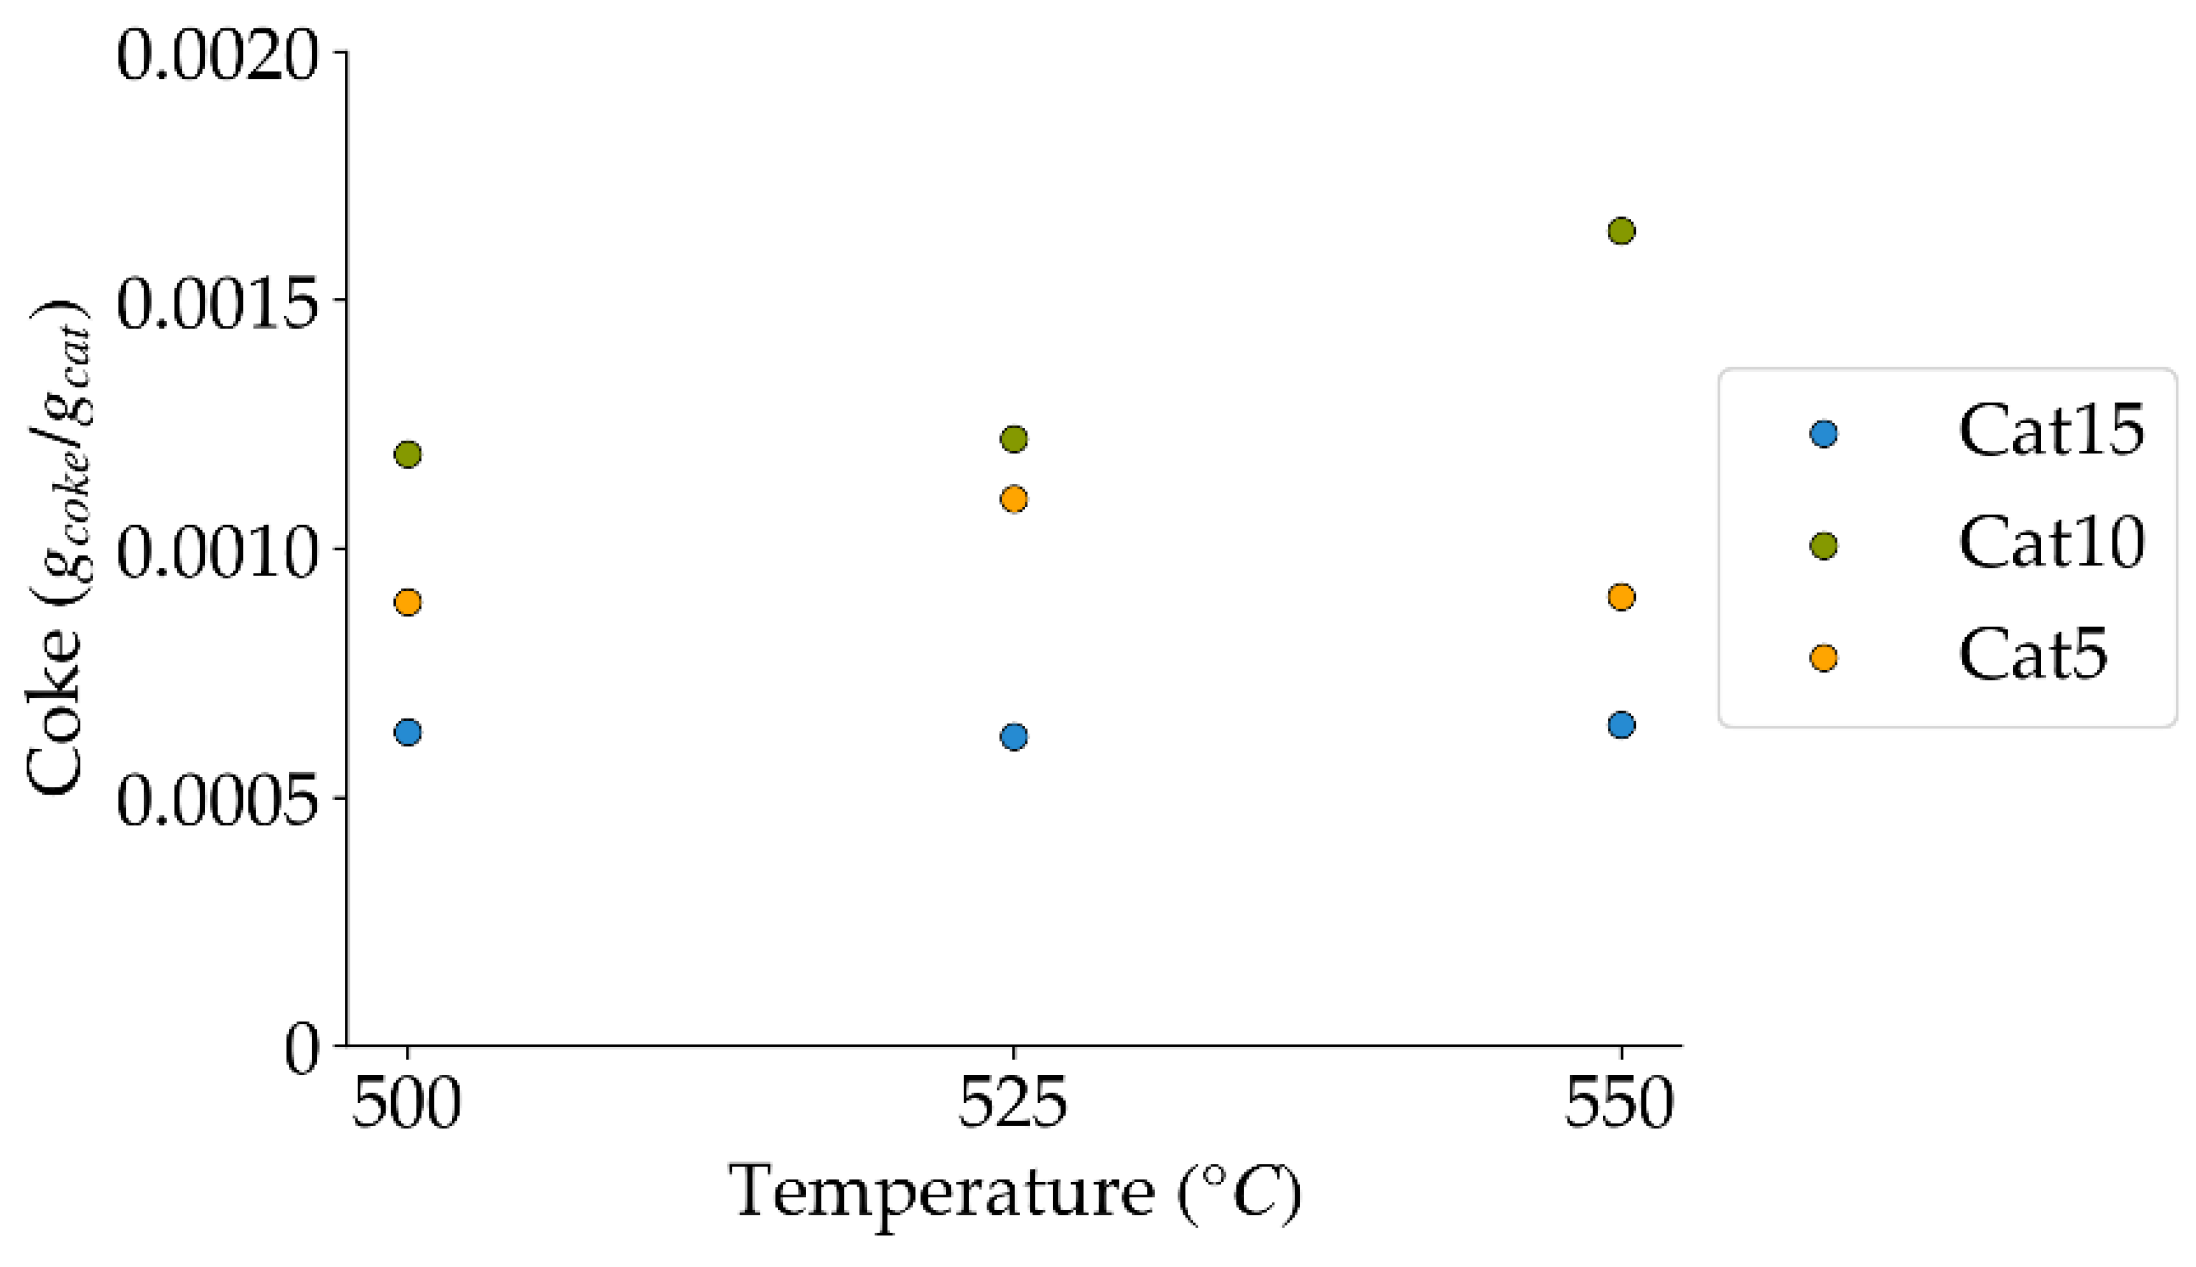
Coke formation at 10 s reaction time, under a steam atmosphere (mean standard deviation is: ±0.0003). Notes: (a) Tar surrogate: 2M4MP, (b) catalyst weight: 0.30 g, (c) catalysts: Cat5, Cat10, Cat15, (d) reported coke amounts were obtained after two consecutive injections of 2M4MP.
Figure 11.
Coke formation at 10 s reaction time, under a steam atmosphere (mean standard deviation is: ±0.0003). Notes: (a) Tar surrogate: 2M4MP, (b) catalyst weight: 0.30 g, (c) catalysts: Cat5, Cat10, Cat15, (d) reported coke amounts were obtained after two consecutive injections of 2M4MP.
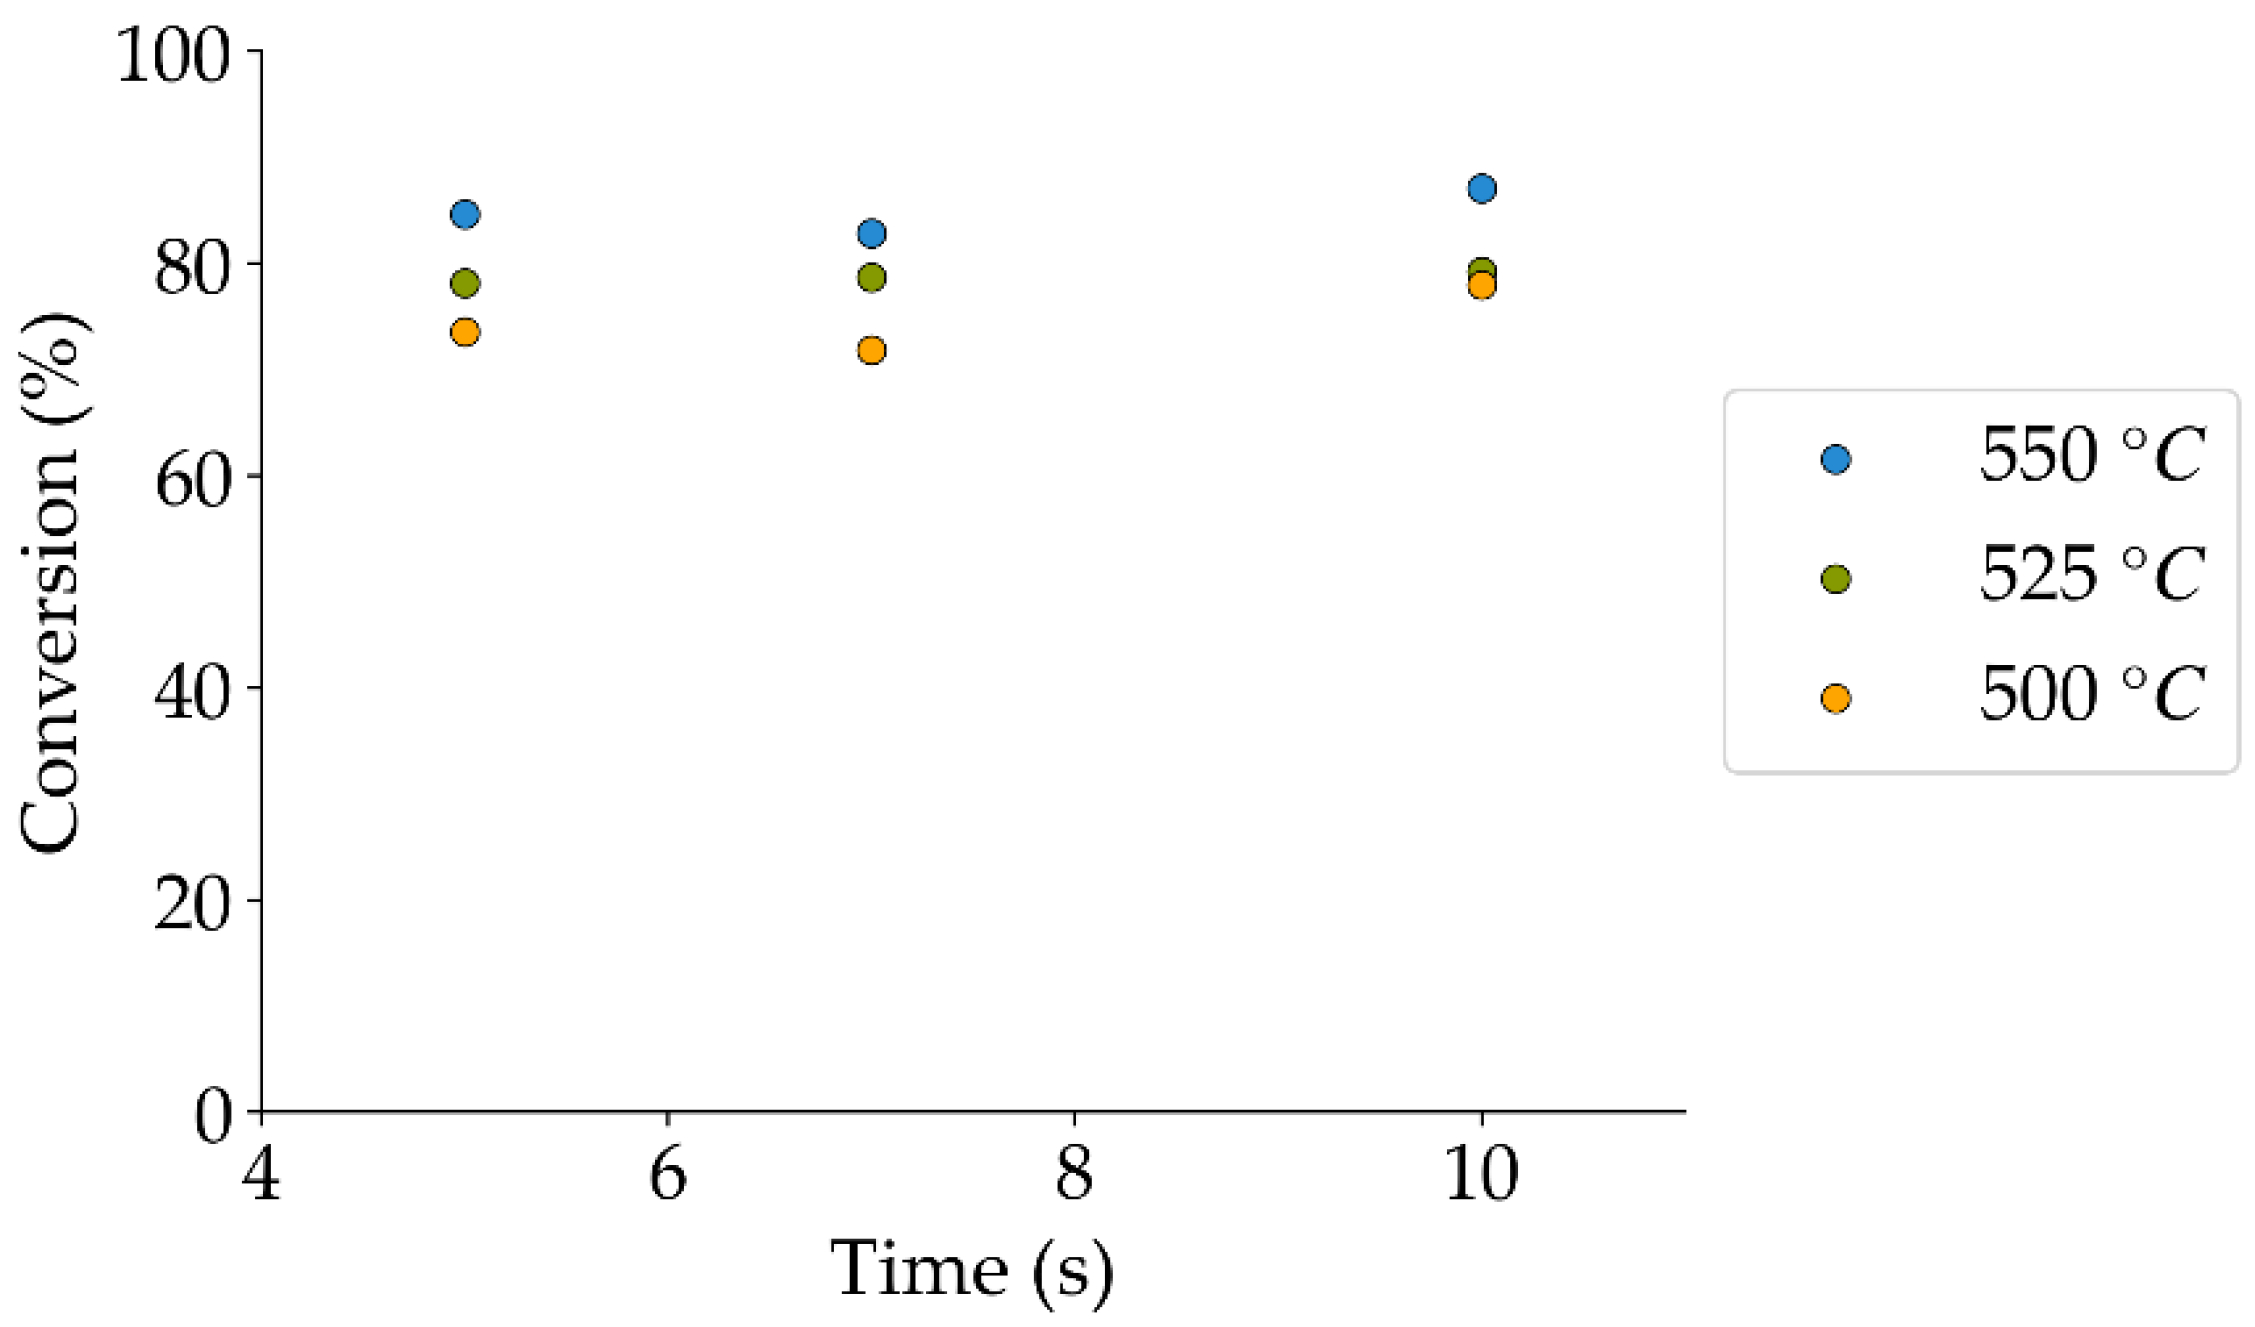
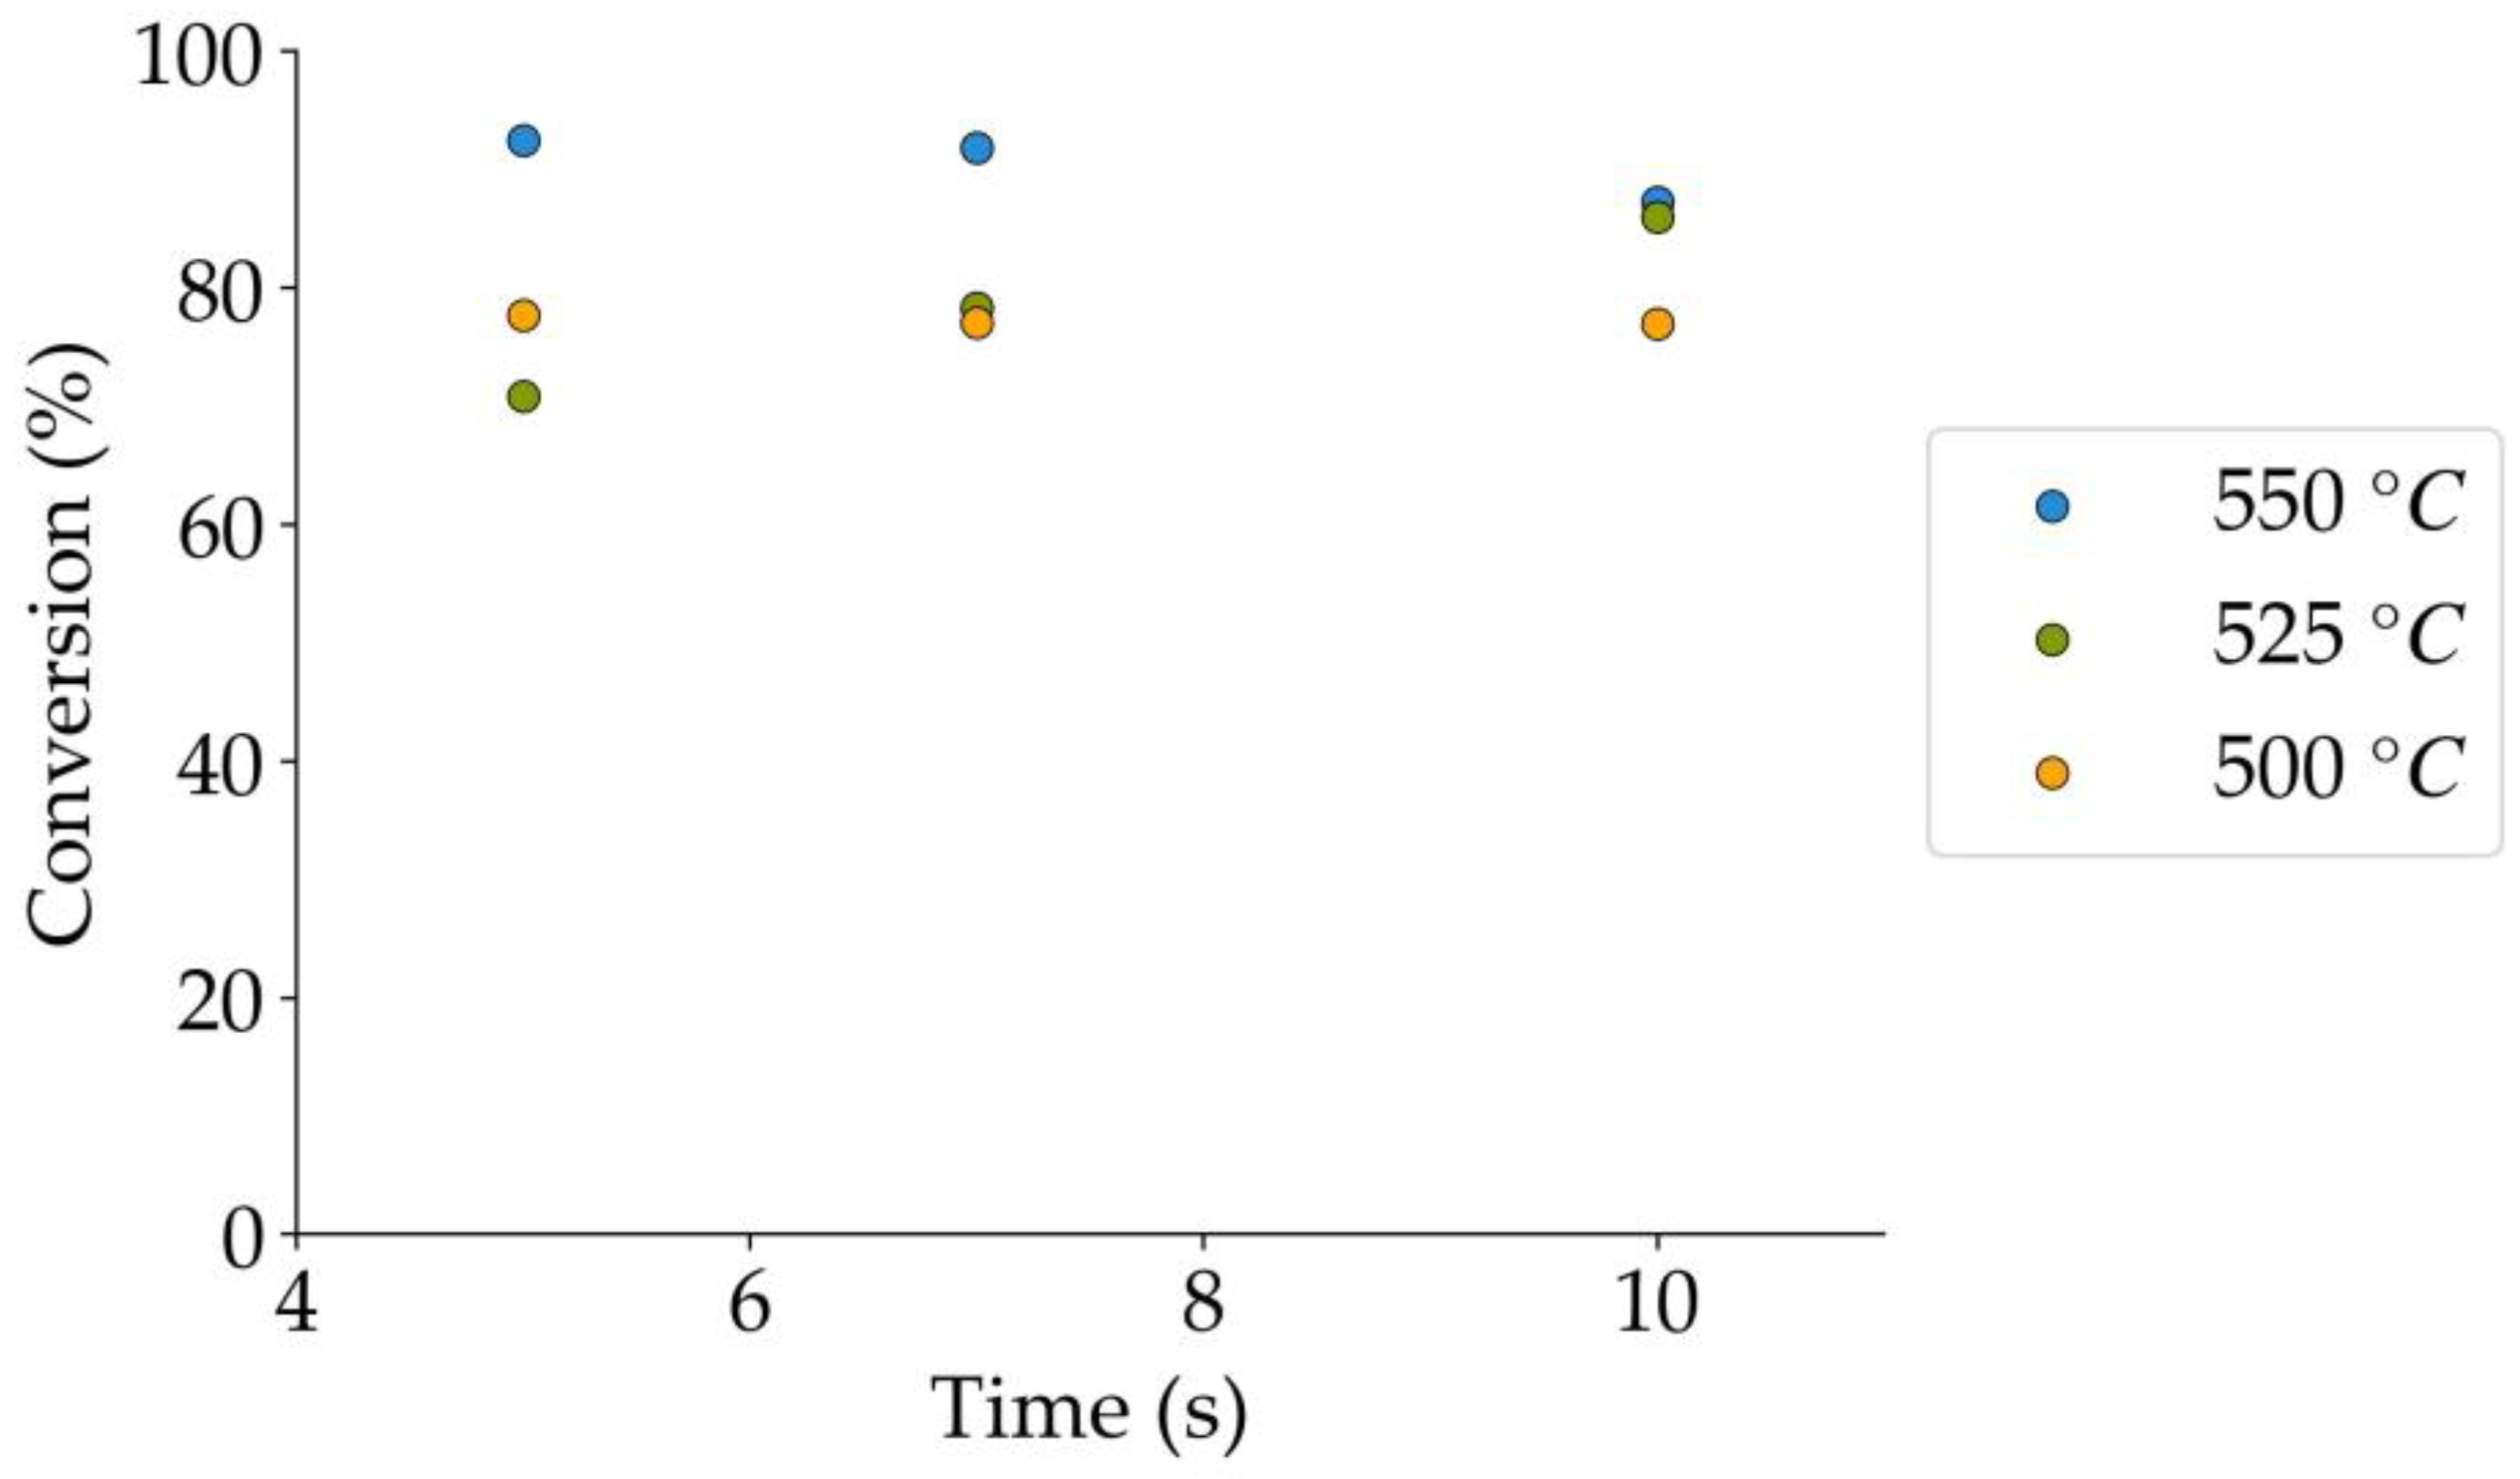
Figure 12.
2M4MP catalytic conversion at various reaction times and temperatures, and under a steam atmosphere (the mean standard deviation is: ±5%). Notes: (a) Catalyst: Cat15, (b) catalyst weight: 0.30 g.
Figure 12.
2M4MP catalytic conversion at various reaction times and temperatures, and under a steam atmosphere (the mean standard deviation is: ±5%). Notes: (a) Catalyst: Cat15, (b) catalyst weight: 0.30 g.
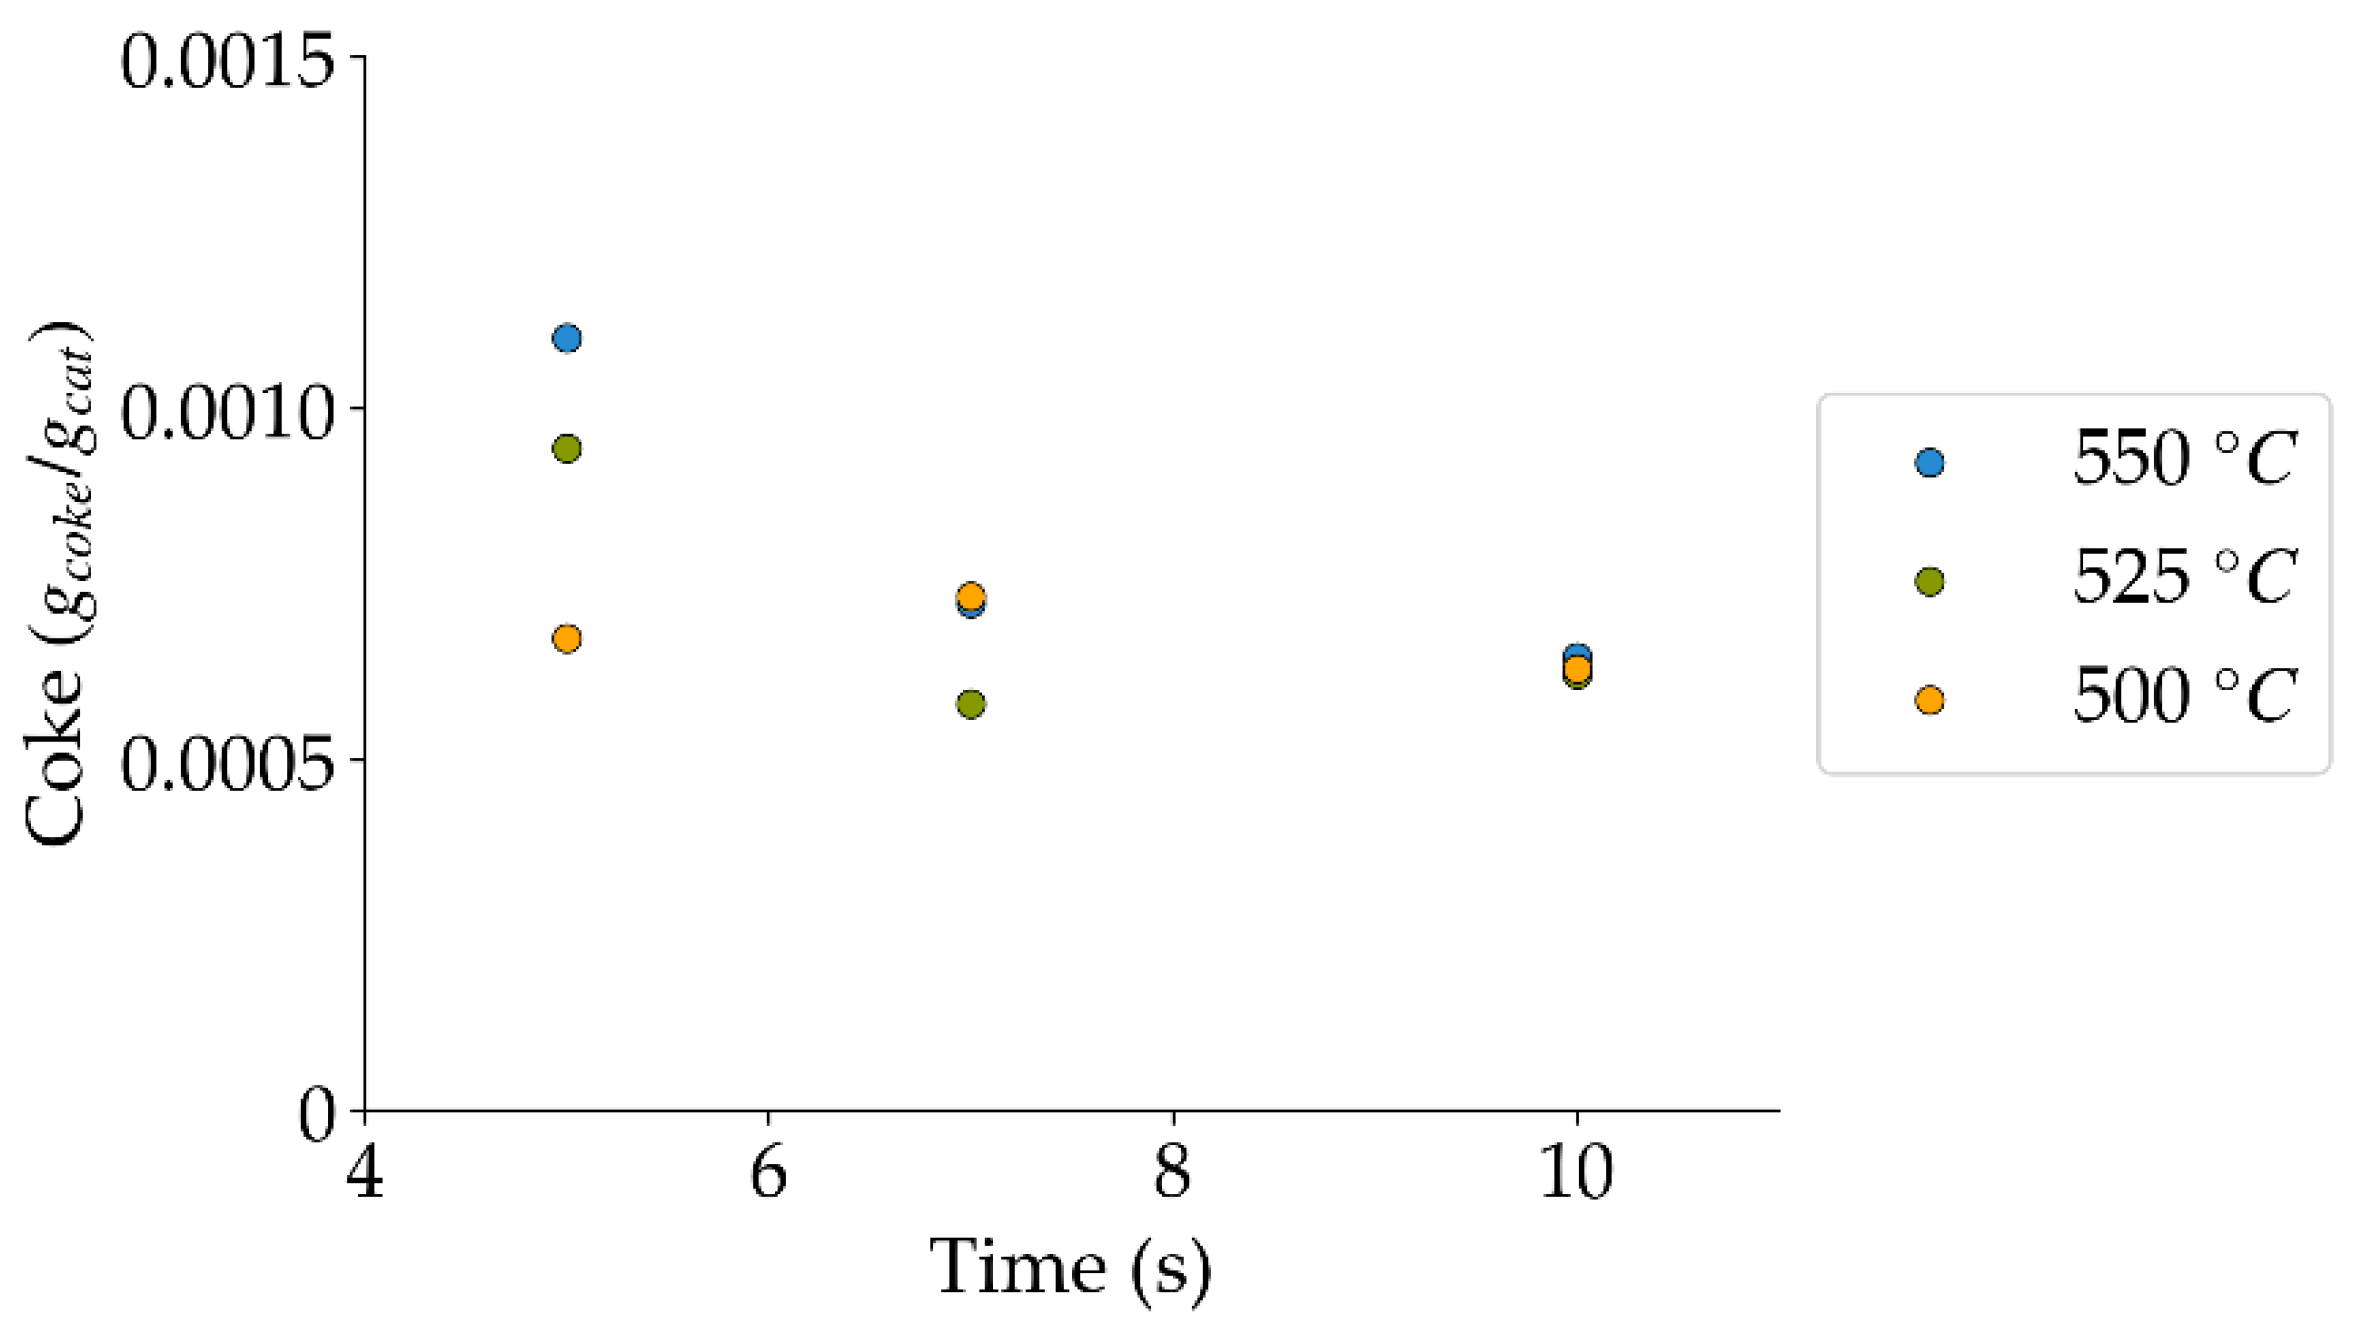
Figure 13.
Coke formation under a steam atmosphere at the different reaction times and temperatures (mean standard deviation is: ±0.0002). Notes: (a) Tar surrogate: 2M4MP, (b) catalyst: Cat15, (c) catalyst weight: 0.30 g, (d) reported coke corresponds to that formed after two consecutive injections of 2M4MP.
Figure 14.
2M4MP catalytic conversions under a steam-H2/CO2 atmosphere (mean standard deviation: ±6%). Notes: (a) Catalysts: Cat5, Cat10, Cat15, (b) catalyst weight: 0.30 g, (c) reaction time: 10 s.
Figure 14.
2M4MP catalytic conversions under a steam-H2/CO2 atmosphere (mean standard deviation: ±6%). Notes: (a) Catalysts: Cat5, Cat10, Cat15, (b) catalyst weight: 0.30 g, (c) reaction time: 10 s.
Figure 15.
(A) CO selectivity (mean standard deviation is: ±0.01). (B) CO2 selectivity (mean standard deviation is: ±0.04). Notes: (a) Tar surrogate: 2M4MP, (b) reaction time: 10 s, (c) steam-H2/CO2 atmosphere, (d) Catalysts: Cat5, Cat10, Cat:15, (e) catalyst weight: 0.30 g.
Figure 15.
(A) CO selectivity (mean standard deviation is: ±0.01). (B) CO2 selectivity (mean standard deviation is: ±0.04). Notes: (a) Tar surrogate: 2M4MP, (b) reaction time: 10 s, (c) steam-H2/CO2 atmosphere, (d) Catalysts: Cat5, Cat10, Cat:15, (e) catalyst weight: 0.30 g.
Figure 16.
(A) Methane selectivities (mean standard deviation is: ±0.005). (B) C1+ hydrocarbon selectivities (more than one carbon in their molecular formula) (the mean standard deviation is: ±0.04). Notes: (a) Tar surrogate: 2M4MP, (b) reaction time: 10 s, (c) steam-H2/CO2 atmosphere, (d) Catalysts: Cat5, Cat10, Cat15, (e) catalyst weight: 0.30 g.
Figure 17.
Coke formed under a steam-H2/CO2 atmosphere, at the three temperatures of the present study (mean standard deviation is: ±0.0001). Notes: (a) Tar surrogate: 2M4MP, (b) catalyst weight: 0.30 g, (c) catalysts: Cat5, Cat10, Cat15, (d) reaction time: 10 s, (e) reported coke corresponds to that formed after two consecutive injections of 2M4MP.
Figure 18.
2M4MP catalytic conversion at various reaction times and temperatures and under a steam-H2/CO2 atmosphere (the mean standard deviation is: ±8%. Notes: (a) Catalyst: Cat15, (b) catalyst weight: 0.30 g.
Figure 18.
2M4MP catalytic conversion at various reaction times and temperatures and under a steam-H2/CO2 atmosphere (the mean standard deviation is: ±8%. Notes: (a) Catalyst: Cat15, (b) catalyst weight: 0.30 g.
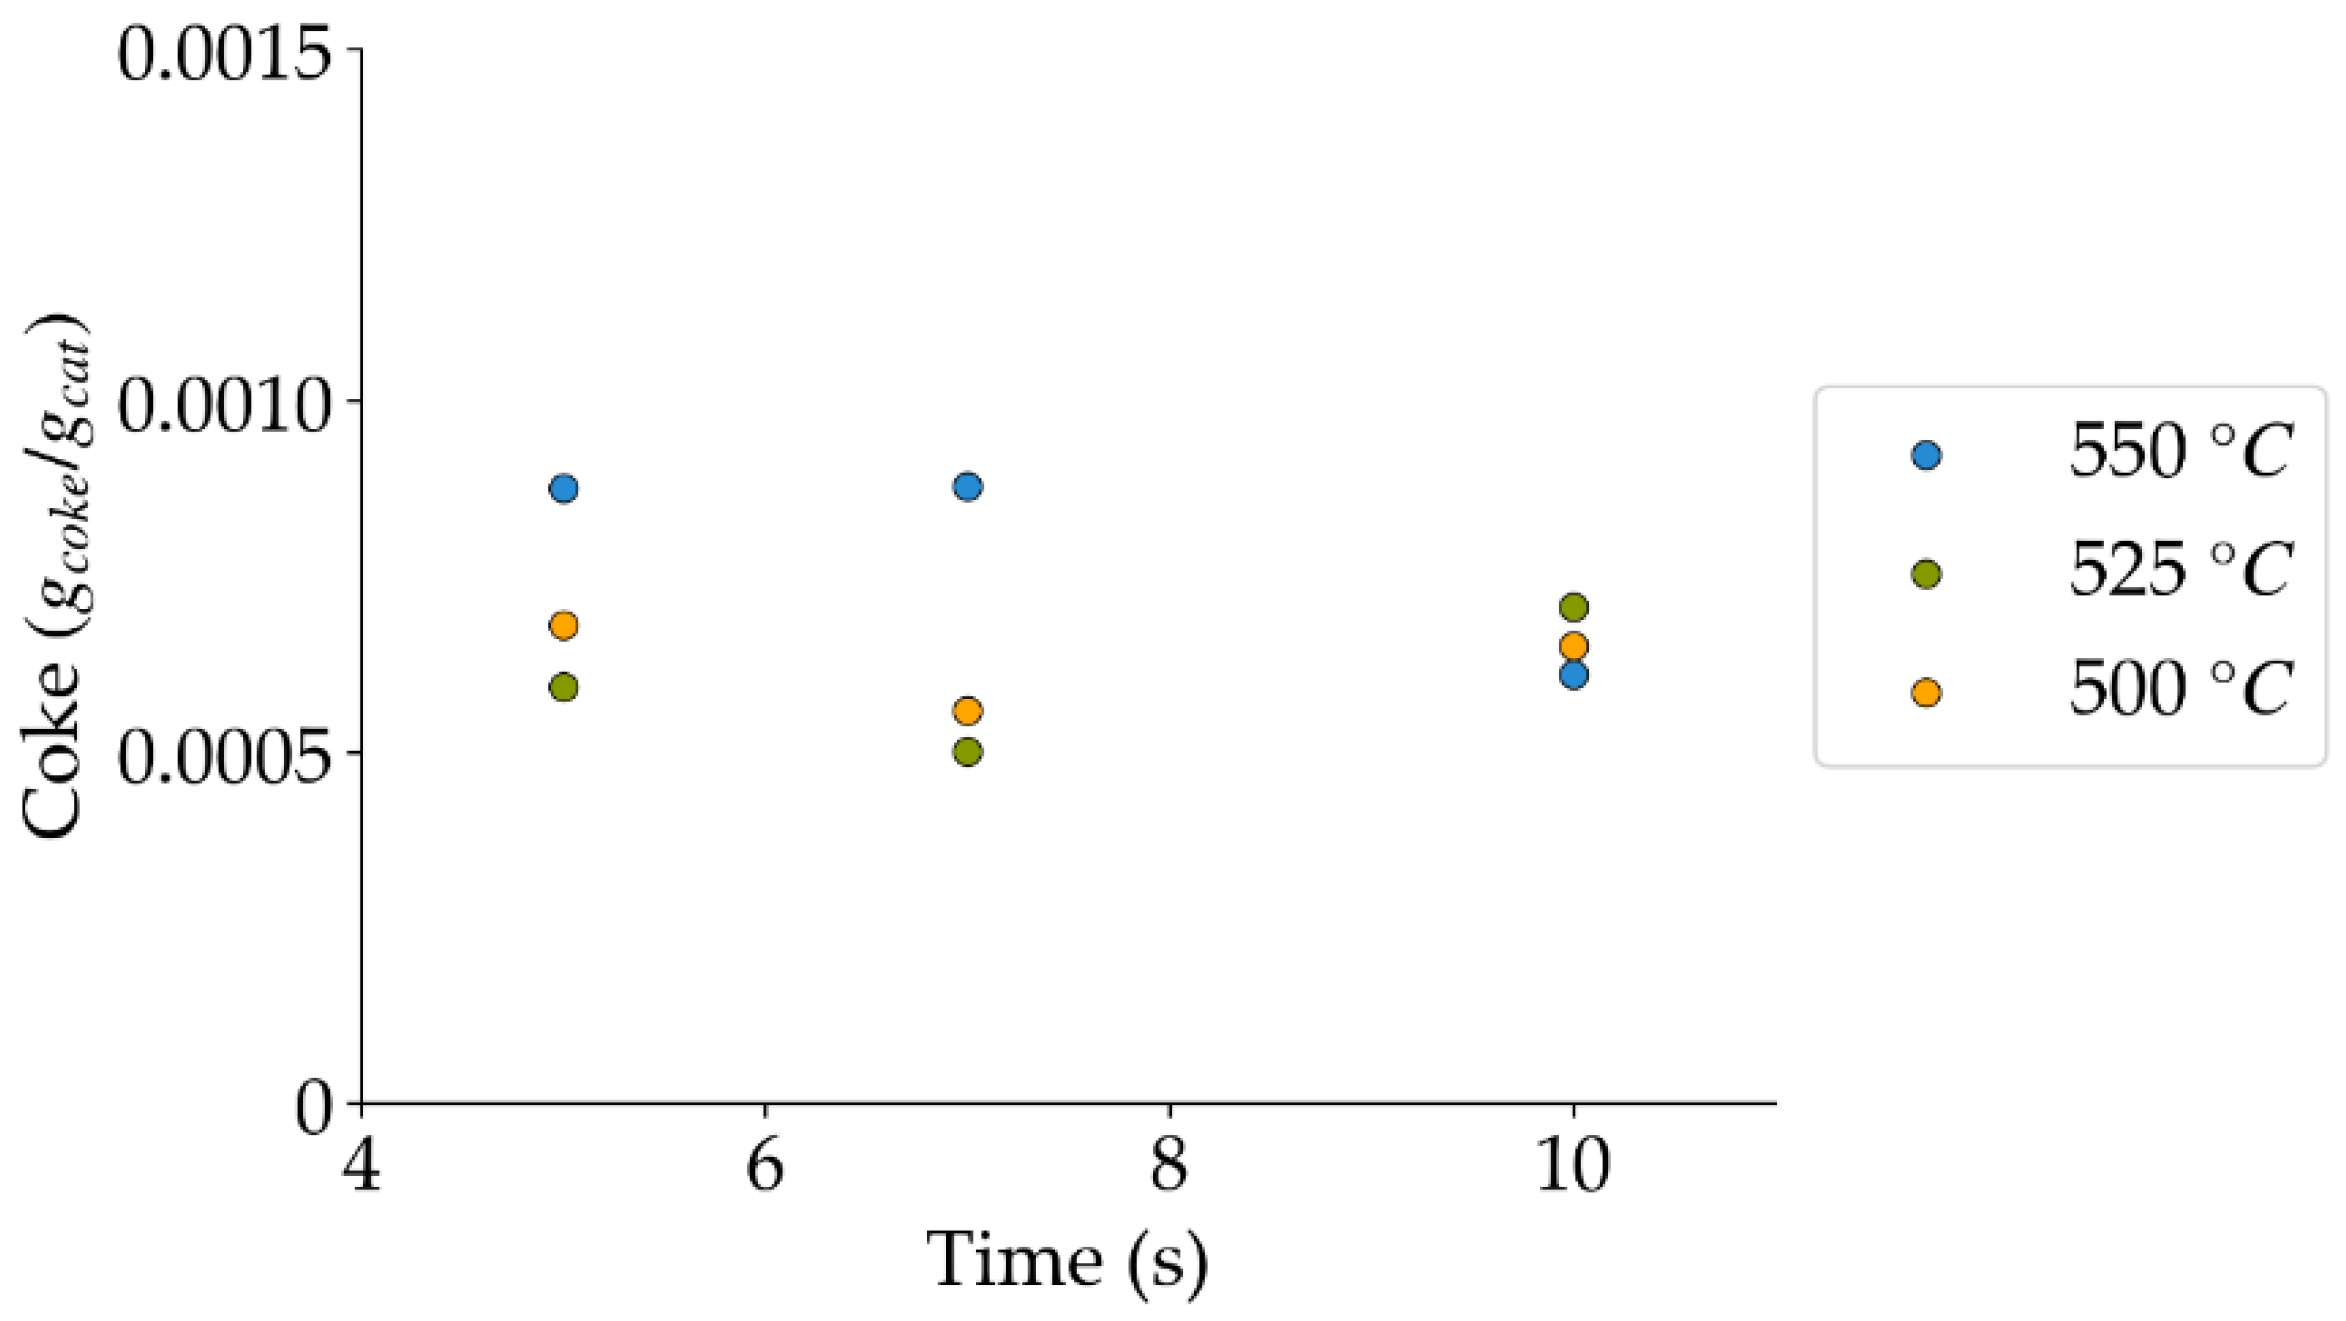
Figure 19.
Coke formation under a steam-H2/CO2 atmosphere at the different reaction times and temperatures (mean standard deviation is: ±0.0001). Notes: (a) Tar surrogate: 2M4MP, (b) catalyst: Cat15, (c) catalyst weight: 0.30 g, (d) reported coke corresponds to that formed after two consecutive injections of 2M4MP.
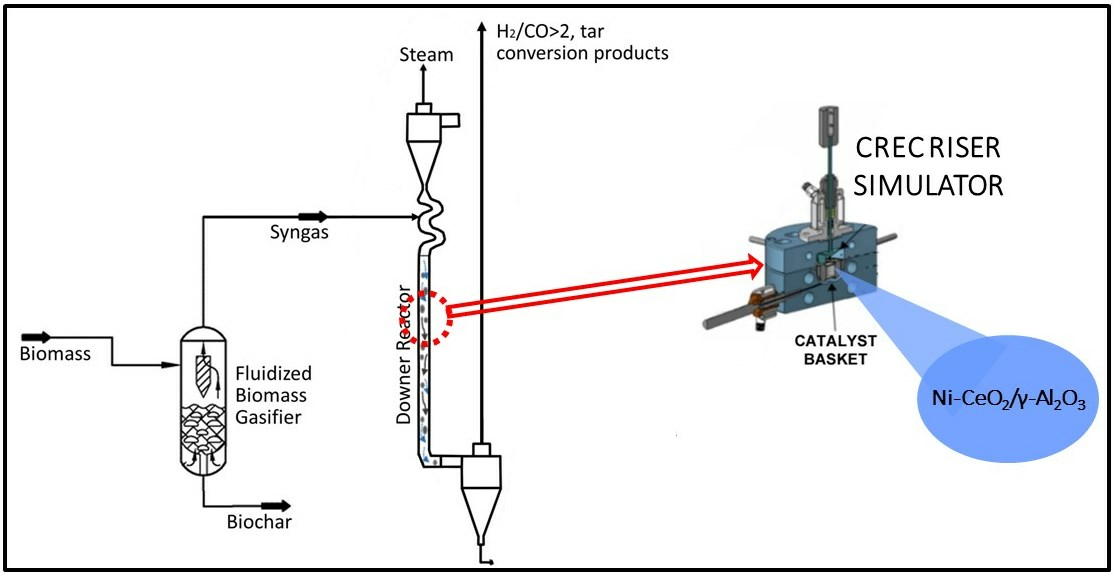
Figure 20.
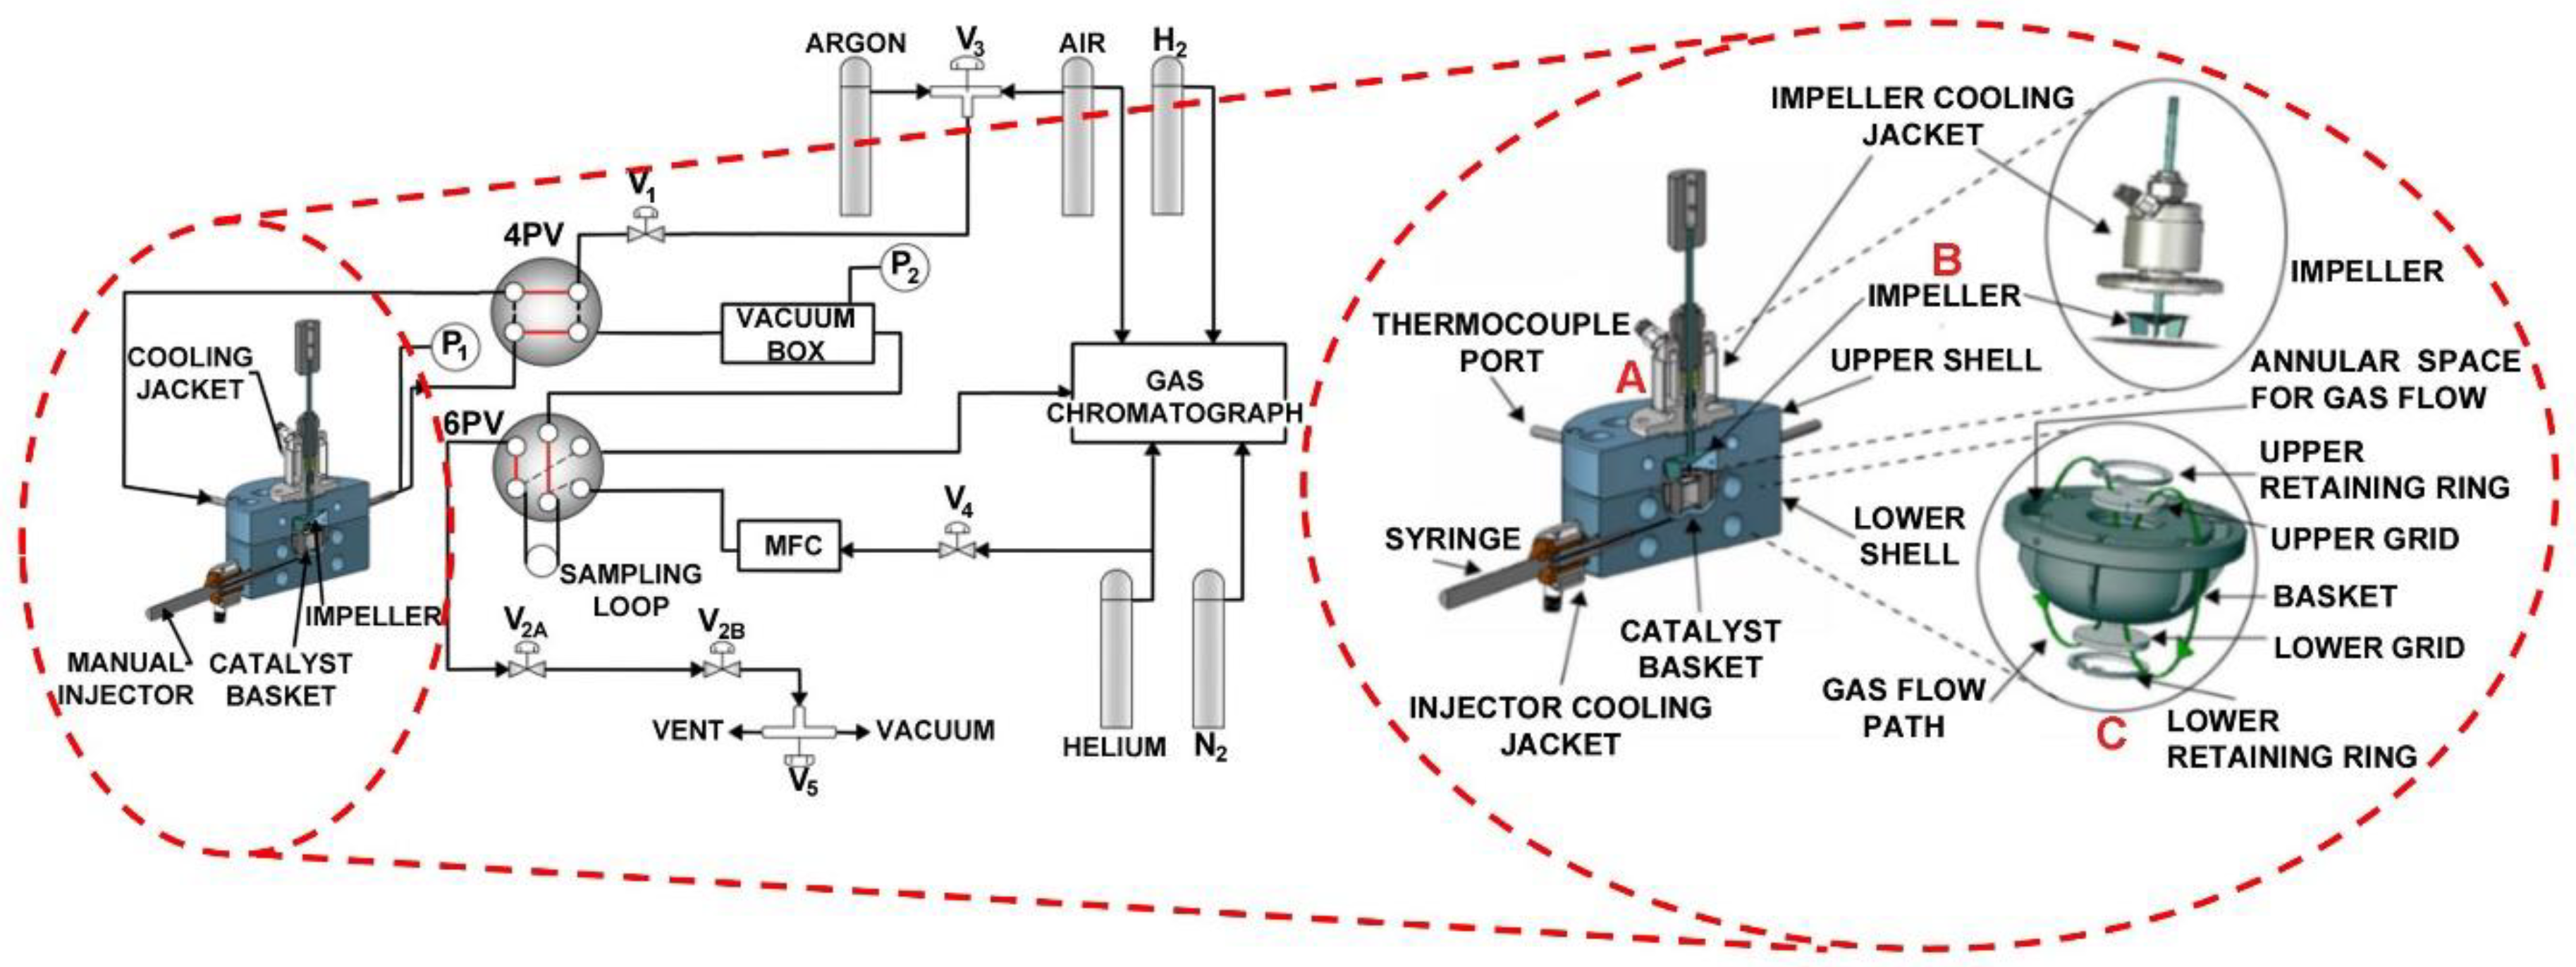
Schematic diagram of the CREC Riser Simulator and its accessories. Adapted from [
52,
53,
54].
Figure 20.
Schematic diagram of the CREC Riser Simulator and its accessories. Adapted from [
52,
53,
54].
Table 1.
Structural support and support-promoter parameters of the γ-Al2O3 support and ceria-doped γ-Al2O3 support established using N2-physisorption analysis.
Table 1.
Structural support and support-promoter parameters of the γ-Al2O3 support and ceria-doped γ-Al2O3 support established using N2-physisorption analysis.
| Sample | BET Surface Area (m2/g) | Pore Volume (cm³/g) | Average Pore Diameter (Å) |
|---|
| γ-Al2O3 | 199 ± 13 | 0.54 ± 0.04 | 109.5 ± 0.6 |
| 2 wt%CeO2/γ-Al2O3 | 201 ± 3 | 0.54 ± 0.01 | 106.7 ± 0.4 |
| 5 wt%CeO2/γ-Al2O3 | 183 ± 3 | 0.49 ± 0.01 | 106 ± 2 |
| 10 wt%CeO2/γ-Al2O3 | 183 ± 13 | 0.47 ± 0.03 | 103.7 ± 0.1 |
Table 2.
Catalyst structural parameters established by using N2-physisorption analysis when employing different nickel oxide loadings, over 5 wt% ceria doped on a γ-Al2O3 support.
Table 2.
Catalyst structural parameters established by using N2-physisorption analysis when employing different nickel oxide loadings, over 5 wt% ceria doped on a γ-Al2O3 support.
| Catalyst | BET Surface Area (m2/g) | Pore Volume (cm³/g) | Average Pore Diameter (Å) |
|---|
| 5 wt%NiO-5 wt%CeO2/γ-Al2O3 | 164 ± 6 | 0.45 ± 0.02 | 108 ± 2 |
| 10 wt%NiO-5 wt%CeO2/γ-Al2O3 | 150 ± 6 | 0.41 ± 0.01 | 109 ± 1 |
| 15 wt%NiO-5 wt%CeO2/γ-Al2O3 | 139 ± 7 | 0.37 ± 0.01 | 103.7 ± 0.1 |
Table 3.
Acidity and basicity of the γ-Al2O3 support loaded with different ceria amounts.
Table 3.
Acidity and basicity of the γ-Al2O3 support loaded with different ceria amounts.
| Sample | Acidity (cm³ STP/g) * | Basicity (cm³ STP/g) * |
|---|
| γ-Al2O3 | 6.4 ± 0.3 | 2.2 ± 0.4 |
| 2 wt% CeO2/γ-Al2O3 | 6.2 ± 0.3 | 2.2 ± 0.4 |
| 5 wt% CeO2/γ-Al2O3 | 5.8 ± 0.1 | 2.1 ± 0.3 |
| 10 wt% CeO2/γ-Al2O3 | 6.1± 0.1 | 2.8 ± 0.8 |
Table 4.
Total acidity and basicity observed when using different nickel loadings on the ceria-promoted γ-AL2O3.
Table 4.
Total acidity and basicity observed when using different nickel loadings on the ceria-promoted γ-AL2O3.
| Sample | Acidity (cm³ STP/g) * | Basicity (cm³ STP/g) * |
|---|
| 5 wt%NiO-5 wt%CeO2/γ-Al2O3 | 7.0 ± 0.3 | 2.8 ± 0.3 |
| 10 wt%NiO-5 wt%CeO2/γ-Al2O3 | 6.8 ± 0.1 | 2.8 ± 0.2 |
| 15 wt%NiO-5 wt%CeO2/γ-Al2O3 | 6.80 ± 0.06 | 2.4 ± 0.5 |
Table 5.
Kinetic parameters for the desorption of ammonia, from temperature-programmed desorption analysis.
Table 5.
Kinetic parameters for the desorption of ammonia, from temperature-programmed desorption analysis.
| | Acid Sites | kd
(mmol K/min gcat) | Edes
(kJ/mol) | T
(K) |
|---|
| γ-Al2O3 | Weak | 1.900 ± 0.003 | 36.43 ± 0.07 | 471 |
| Medium | 1.412 ± 0.007 | 59.4 ± 0.3 | 559 |
| Strong | 0.843 ± 0.005 | 86.0 ± 0.5 | 651 |
| Very strong | 0.325 ± 0.002 | 113.1 ± 0.6 | 746 |
| 5%CeO2/γ-Al2O3 | Weak | 2.165 ± 0.003 | 36.71 ± 0.07 | 472 |
| Medium | 1.105 ± 0.005 | 59.7 ± 0.3 | 549 |
| Strong | 0.703 ± 0.004 | 77.1 ± 0.4 | 617 |
| Very strong | - | - | - |
| 15%NiO-5%CeO2/γ-Al2O3 | Weak | 2.224 ± 0.004 | 38.15 ± 0.09 | 475 |
| Medium | 1.656 ± 0.008 | 62.5 ± 0.3 | 561 |
| Strong | 0.672 ± 0.004 | 83.3 ± 0.4 | 641 |
| Very strong | 0.254 ± 0.001 | 111.2 ± 0.6 | 739 |
Table 6.
Nominal Ni loadings, Ni reduction values obtained from the H2-TPR analysis, as well as percentage reduction of Ni species, using a heating ramp of 10 °C/min.
Table 6.
Nominal Ni loadings, Ni reduction values obtained from the H2-TPR analysis, as well as percentage reduction of Ni species, using a heating ramp of 10 °C/min.
| Catalyst | Nominal Ni (%) | Reducible Ni (%) | Percentage of
Reduction (%) |
|---|
| 5% Ni-5% CeO2/γ-Al2O3 | 5 | 4.3 ± 0.4 | 86 |
| 10% Ni-5% CeO2/γ-Al2O3 | 10 | 8.86 ± 0.03 | 87 |
| 15% Ni-5% CeO2/γ-Al2O3 | 15 | 12.5 + 0.7 | 84 |
Table 7.
Dispersion and crystallite sizes of Ni-based catalysts obtained after H2-Pulse Chemisorption at 615 °C.
Table 7.
Dispersion and crystallite sizes of Ni-based catalysts obtained after H2-Pulse Chemisorption at 615 °C.
| Catalysts | Dispersion (%) | Crystallite Size (nm) | Metal Specific Surface Area (m2/g) |
|---|
| 5%Ni-5%CeO2/γ-Al2O3 | 0.74 | 114 | 0.094 |
| 10%Ni-5%CeO2/γ-Al2O3 | 0.81 | 104 | 0.28 |
| 15%Ni-5%CeO2/γ-Al2O3 | 0.79 | 107 | 0.41 |
Table 8.
CO2/CO ratios obtained at the different reaction temperatures, with the three catalysts of the present study, at 10 s reaction time, and under a steam atmosphere.
Table 8.
CO2/CO ratios obtained at the different reaction temperatures, with the three catalysts of the present study, at 10 s reaction time, and under a steam atmosphere.
| Catalyst | Temperature (°C) |
|---|
| 500 | 525 | 550 |
|---|
| 5%Ni-5%CeO2/γ-Al2O3 (Cat5) | 8.1 | 6.3 | 5.3 |
| 10%Ni-5% CeO2/γ-Al2O3 (Cat10) | 10.0 | 4.8 | 4.3 |
| 15%Ni-5% CeO2/γ-Al2O3 (Cat15) | 15 | 8.4 | 4.7 |
Table 9.
Tar surrogate conversion obtained during the non-catalytic experiments.
Table 9.
Tar surrogate conversion obtained during the non-catalytic experiments.
| Reaction Time (s) | Temperature (°C) |
|---|
| 500 | 525 | 550 |
|---|
| 5 | 84 | 74 | 91 |
| 7 | 78 | 86 | 88 |
| 10 | 82 | 89 | 87 |
Table 10.
CO2/CO ratios at various temperatures, reaction times, under a steam atmosphere, and using a Cat15 catalyst.
Table 10.
CO2/CO ratios at various temperatures, reaction times, under a steam atmosphere, and using a Cat15 catalyst.
| Reaction Time (s) | Temperature (°C) |
|---|
| 500 | 525 | 550 |
|---|
| 5 | 9.7 | 3.8 | 2.5 |
| 7 | 10.8 | 10.8 | 3.1 |
| 10 | 15.4 | 8.4 | 4.7 |
Table 11.
Methane selectivities at various temperatures and reaction times, under a steam atmosphere, and using the Cat15 catalyst. Note: the mean standard deviation is: ±0.004.
Table 11.
Methane selectivities at various temperatures and reaction times, under a steam atmosphere, and using the Cat15 catalyst. Note: the mean standard deviation is: ±0.004.
| Reaction Time (s) | Temperature (°C) |
|---|
| 500 | 525 | 550 |
|---|
| 5 | 0.024 | 0.032 | 0.033 |
| 7 | 0.026 | 0.033 | 0.029 |
| 10 | 0.027 | 0.025 | 0.032 |
Table 12.
Selectivities towards C1+ hydrocarbons at the different temperatures and reaction times under a steam atmosphere and using the Cat15 catalyst. Note: the mean standard deviation is: ±0.03.
Table 12.
Selectivities towards C1+ hydrocarbons at the different temperatures and reaction times under a steam atmosphere and using the Cat15 catalyst. Note: the mean standard deviation is: ±0.03.
| Reaction Time (s) | Temperature (°C) |
|---|
| 500 | 525 | 550 |
|---|
| 5 | 0.91 | 0.90 | 0.86 |
| 7 | 0.90 | 0.84 | 0.86 |
| 10 | 0.87 | 0.87 | 0.83 |
Table 13.
CO2/CO ratios at the various temperatures and for three catalysts of the present study. Notes: (a) reaction time: 10 s, (b) catalyst weight: 0.30 g, and (c) a steam-H2/CO2 atmosphere.
Table 13.
CO2/CO ratios at the various temperatures and for three catalysts of the present study. Notes: (a) reaction time: 10 s, (b) catalyst weight: 0.30 g, and (c) a steam-H2/CO2 atmosphere.
| Catalyst | Temperature (°C) |
|---|
| 500 | 525 | 550 |
|---|
| 5%Ni-5%CeO2/γ-Al2O3 | 8.0 | 4.7 | 3.3 |
| 10%Ni-5%CeO2/γ-Al2O3 | 6.8 | 6.6 | 3.3 |
| 15%Ni-5%CeO2/γ-Al2O3 | 7.4 | 5.9 | 3.0 |
Table 14.
CO2/CO ratios at the different temperatures and reaction times of the present study. Notes: (a) Tar surrogate: 2M4MP, (b) catalyst weight: 0.30 g, (c) catalyst: Cat15, (d) steam-H2/CO2 atmosphere.
Table 14.
CO2/CO ratios at the different temperatures and reaction times of the present study. Notes: (a) Tar surrogate: 2M4MP, (b) catalyst weight: 0.30 g, (c) catalyst: Cat15, (d) steam-H2/CO2 atmosphere.
| Reaction Time (s) | Temperature (°C) |
|---|
| 500 | 525 | 550 |
|---|
| 5 | 9.7 | 3.8 | 2.5 |
| 7 | 8.0 | 8.6 | 3.9 |
| 10 | 7.4 | 5.9 | 3.0 |
Table 15.
Methane selectivities at the different reaction temperatures and reaction times of the present study. Notes: (a) Tar surrogate: 2M4MP, (b) catalyst weight: 0.30 g, (c) catalyst: Cat15, (d) steam-H2/CO2 atmosphere. The mean standard deviation is ±0.010.
Table 15.
Methane selectivities at the different reaction temperatures and reaction times of the present study. Notes: (a) Tar surrogate: 2M4MP, (b) catalyst weight: 0.30 g, (c) catalyst: Cat15, (d) steam-H2/CO2 atmosphere. The mean standard deviation is ±0.010.
| Reaction Time (s) | Temperature (°C) |
|---|
| 500 | 525 | 550 |
|---|
| 5 | 0.045 | 0.040 | 0.042 |
| 7 | 0.048 | 0.041 | 0.045 |
| 10 | 0.044 | 0.048 | 0.058 |
Table 16.
Selectivities towards C1+ hydrocarbons at the different temperatures and reaction times of the present study. Notes: (a) Tar surrogate: 2M4MP, (b) catalyst weight: 0.30 g, (c) catalyst: Cat15, (d) steam-H2/CO2 atmosphere. The mean standard deviation is ±0.09.
Table 16.
Selectivities towards C1+ hydrocarbons at the different temperatures and reaction times of the present study. Notes: (a) Tar surrogate: 2M4MP, (b) catalyst weight: 0.30 g, (c) catalyst: Cat15, (d) steam-H2/CO2 atmosphere. The mean standard deviation is ±0.09.
| Reaction Time (s) | Temperature (°C) |
|---|
| 500 | 525 | 550 |
|---|
| 5 | 0.70 | 0.74 | 0.71 |
| 7 | 0.70 | 0.71 | 0.67 |
| 10 | 0.76 | 0.68 | 0.68 |
Table 17.
H2/CO ratios obtained at 550 °C using the different nickel-loaded catalysts and the various reaction times of the present study. Notes: (a) Tar surrogate: 2M4MP, (b) catalyst weight: 0.30 g, (c) steam-H2/CO2 atmosphere.
Table 17.
H2/CO ratios obtained at 550 °C using the different nickel-loaded catalysts and the various reaction times of the present study. Notes: (a) Tar surrogate: 2M4MP, (b) catalyst weight: 0.30 g, (c) steam-H2/CO2 atmosphere.
| Catalyst | Reaction Time (s) | H2/CO Ratio |
|---|
| Cat5 | 10 | 3.8 |
| Cat10 | 10 | 4.0 |
| Cat15 | 10 | 3.8 |
| Cat15 | 7 | 3.8 |
| Cat15 | 5 | 3.9 |


