
Cobalt–Magnesium Oxide Catalysts for Deep Oxidation of Hydrocarbons

 , , , ,
  , ,
, ,
Abstract
1. Introduction
2. Results
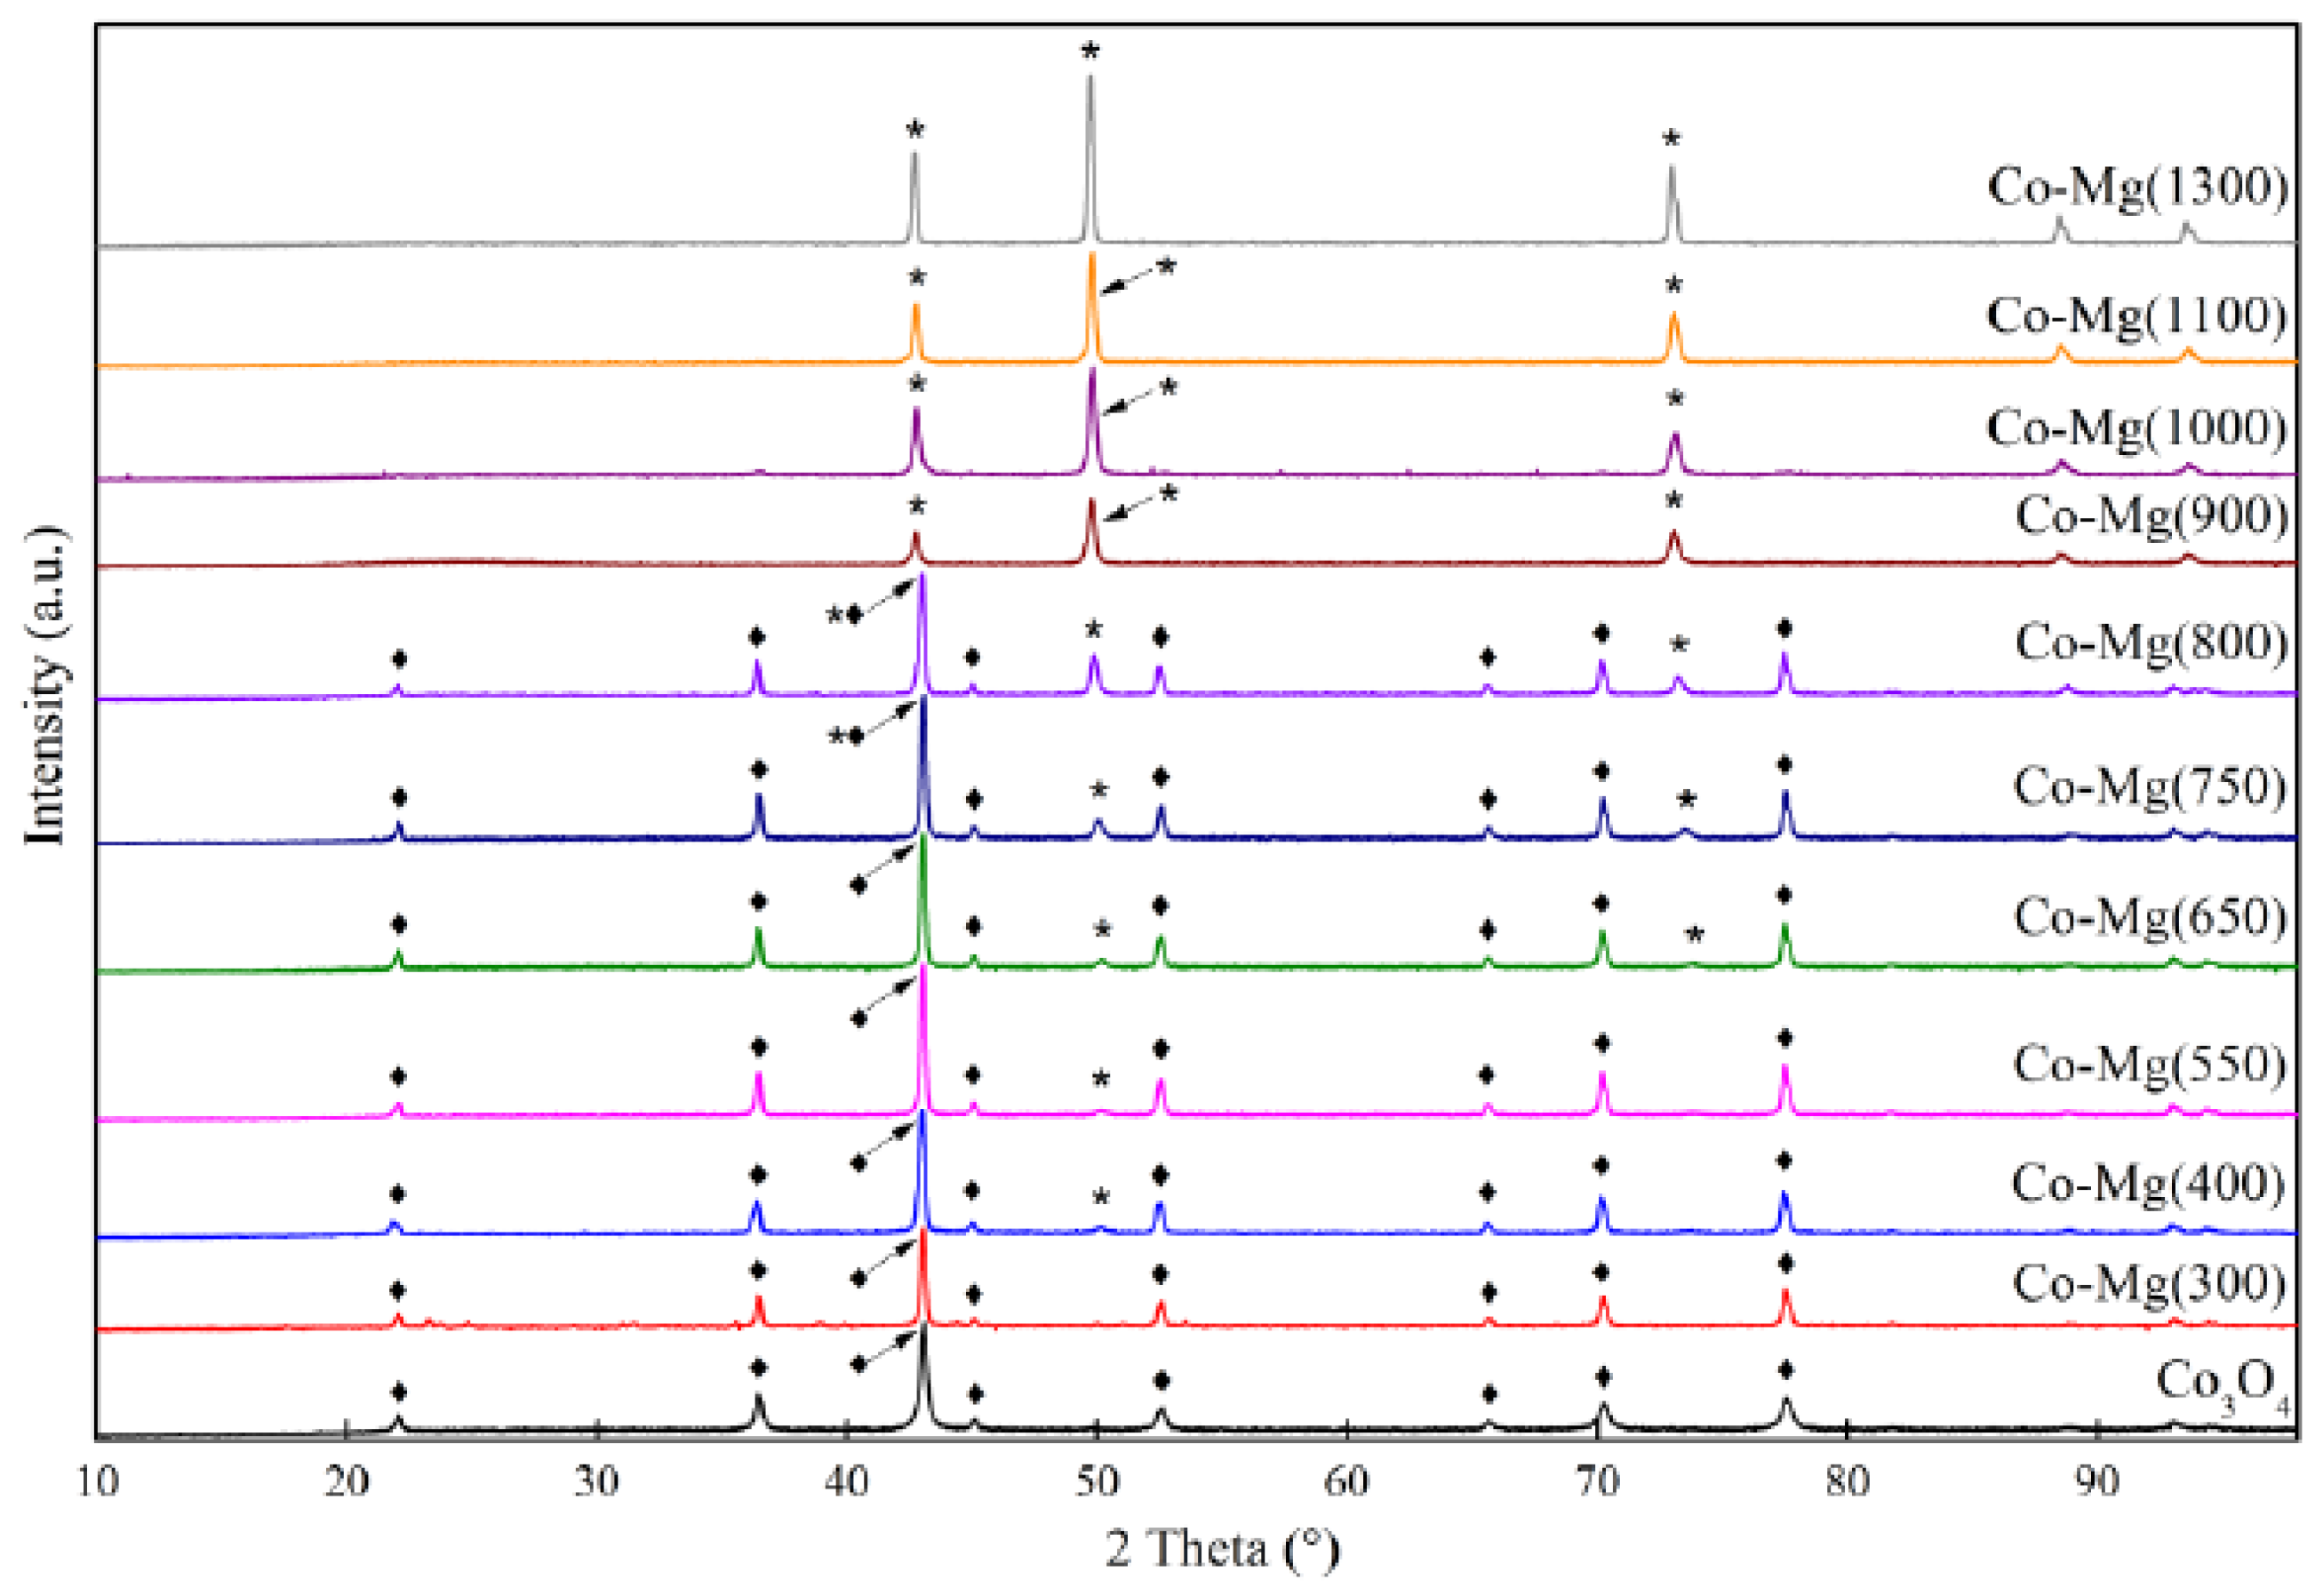
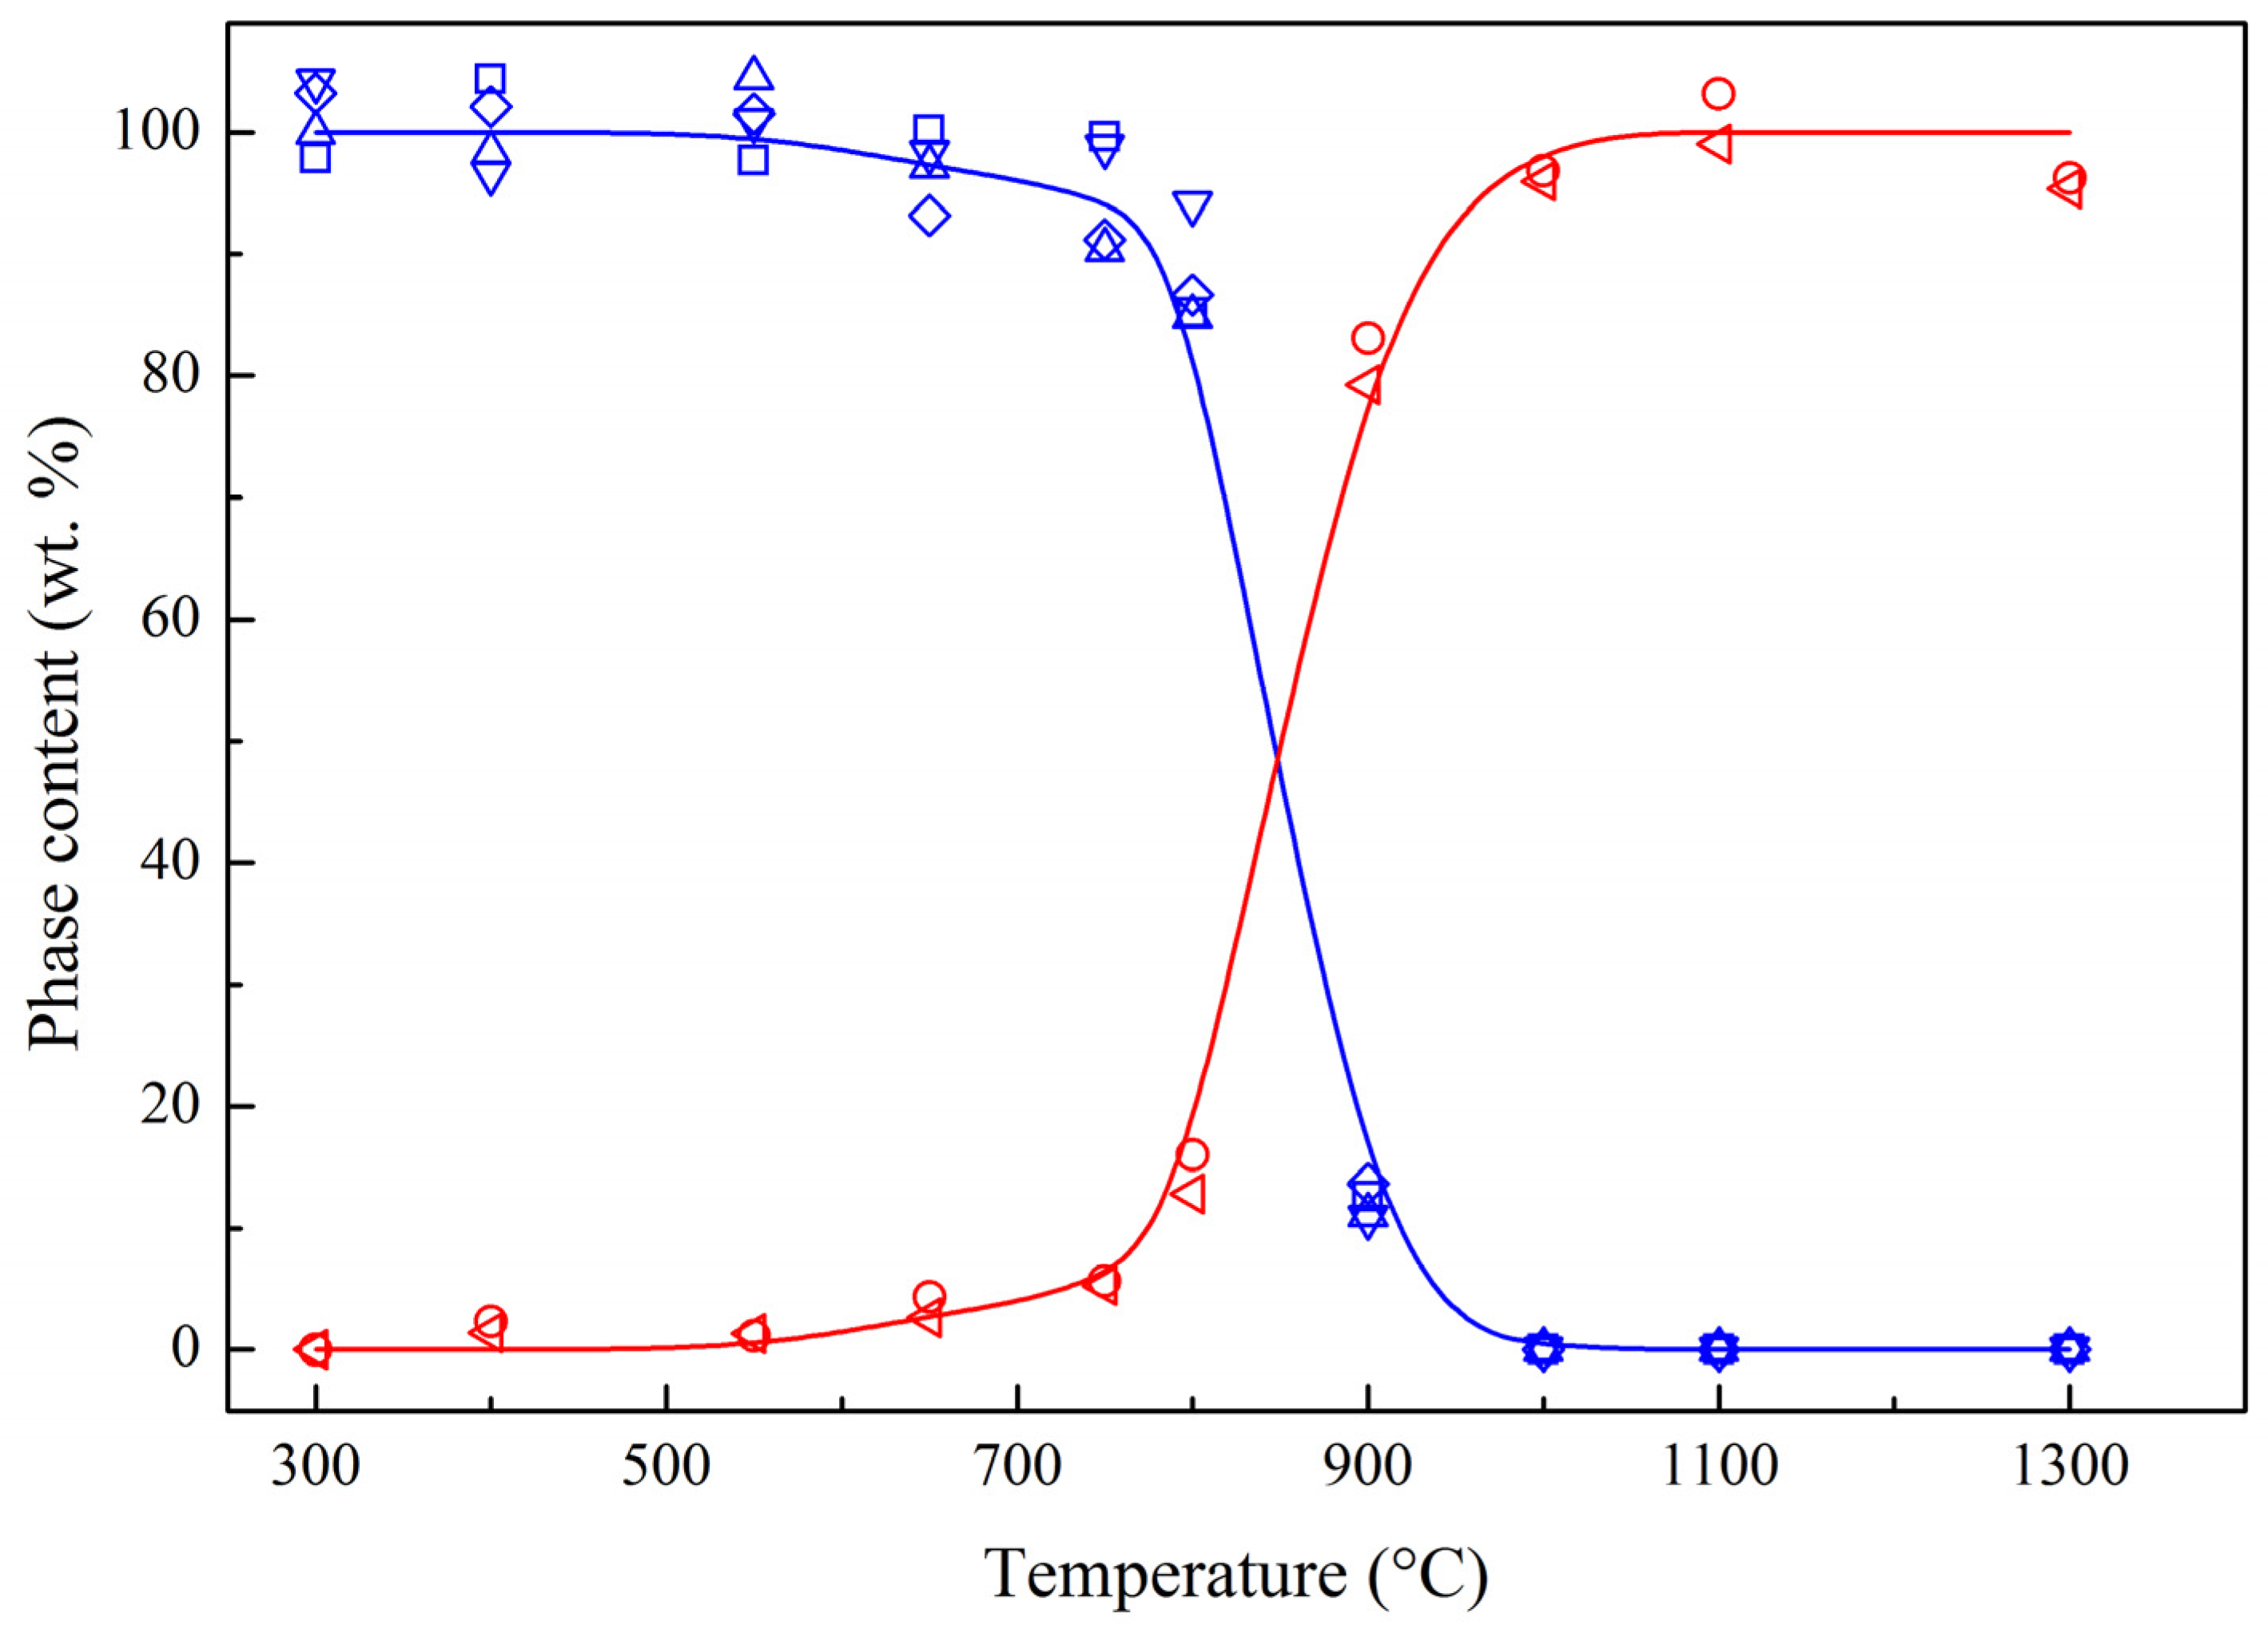
2.1. Phase Composition and Structure of Samples
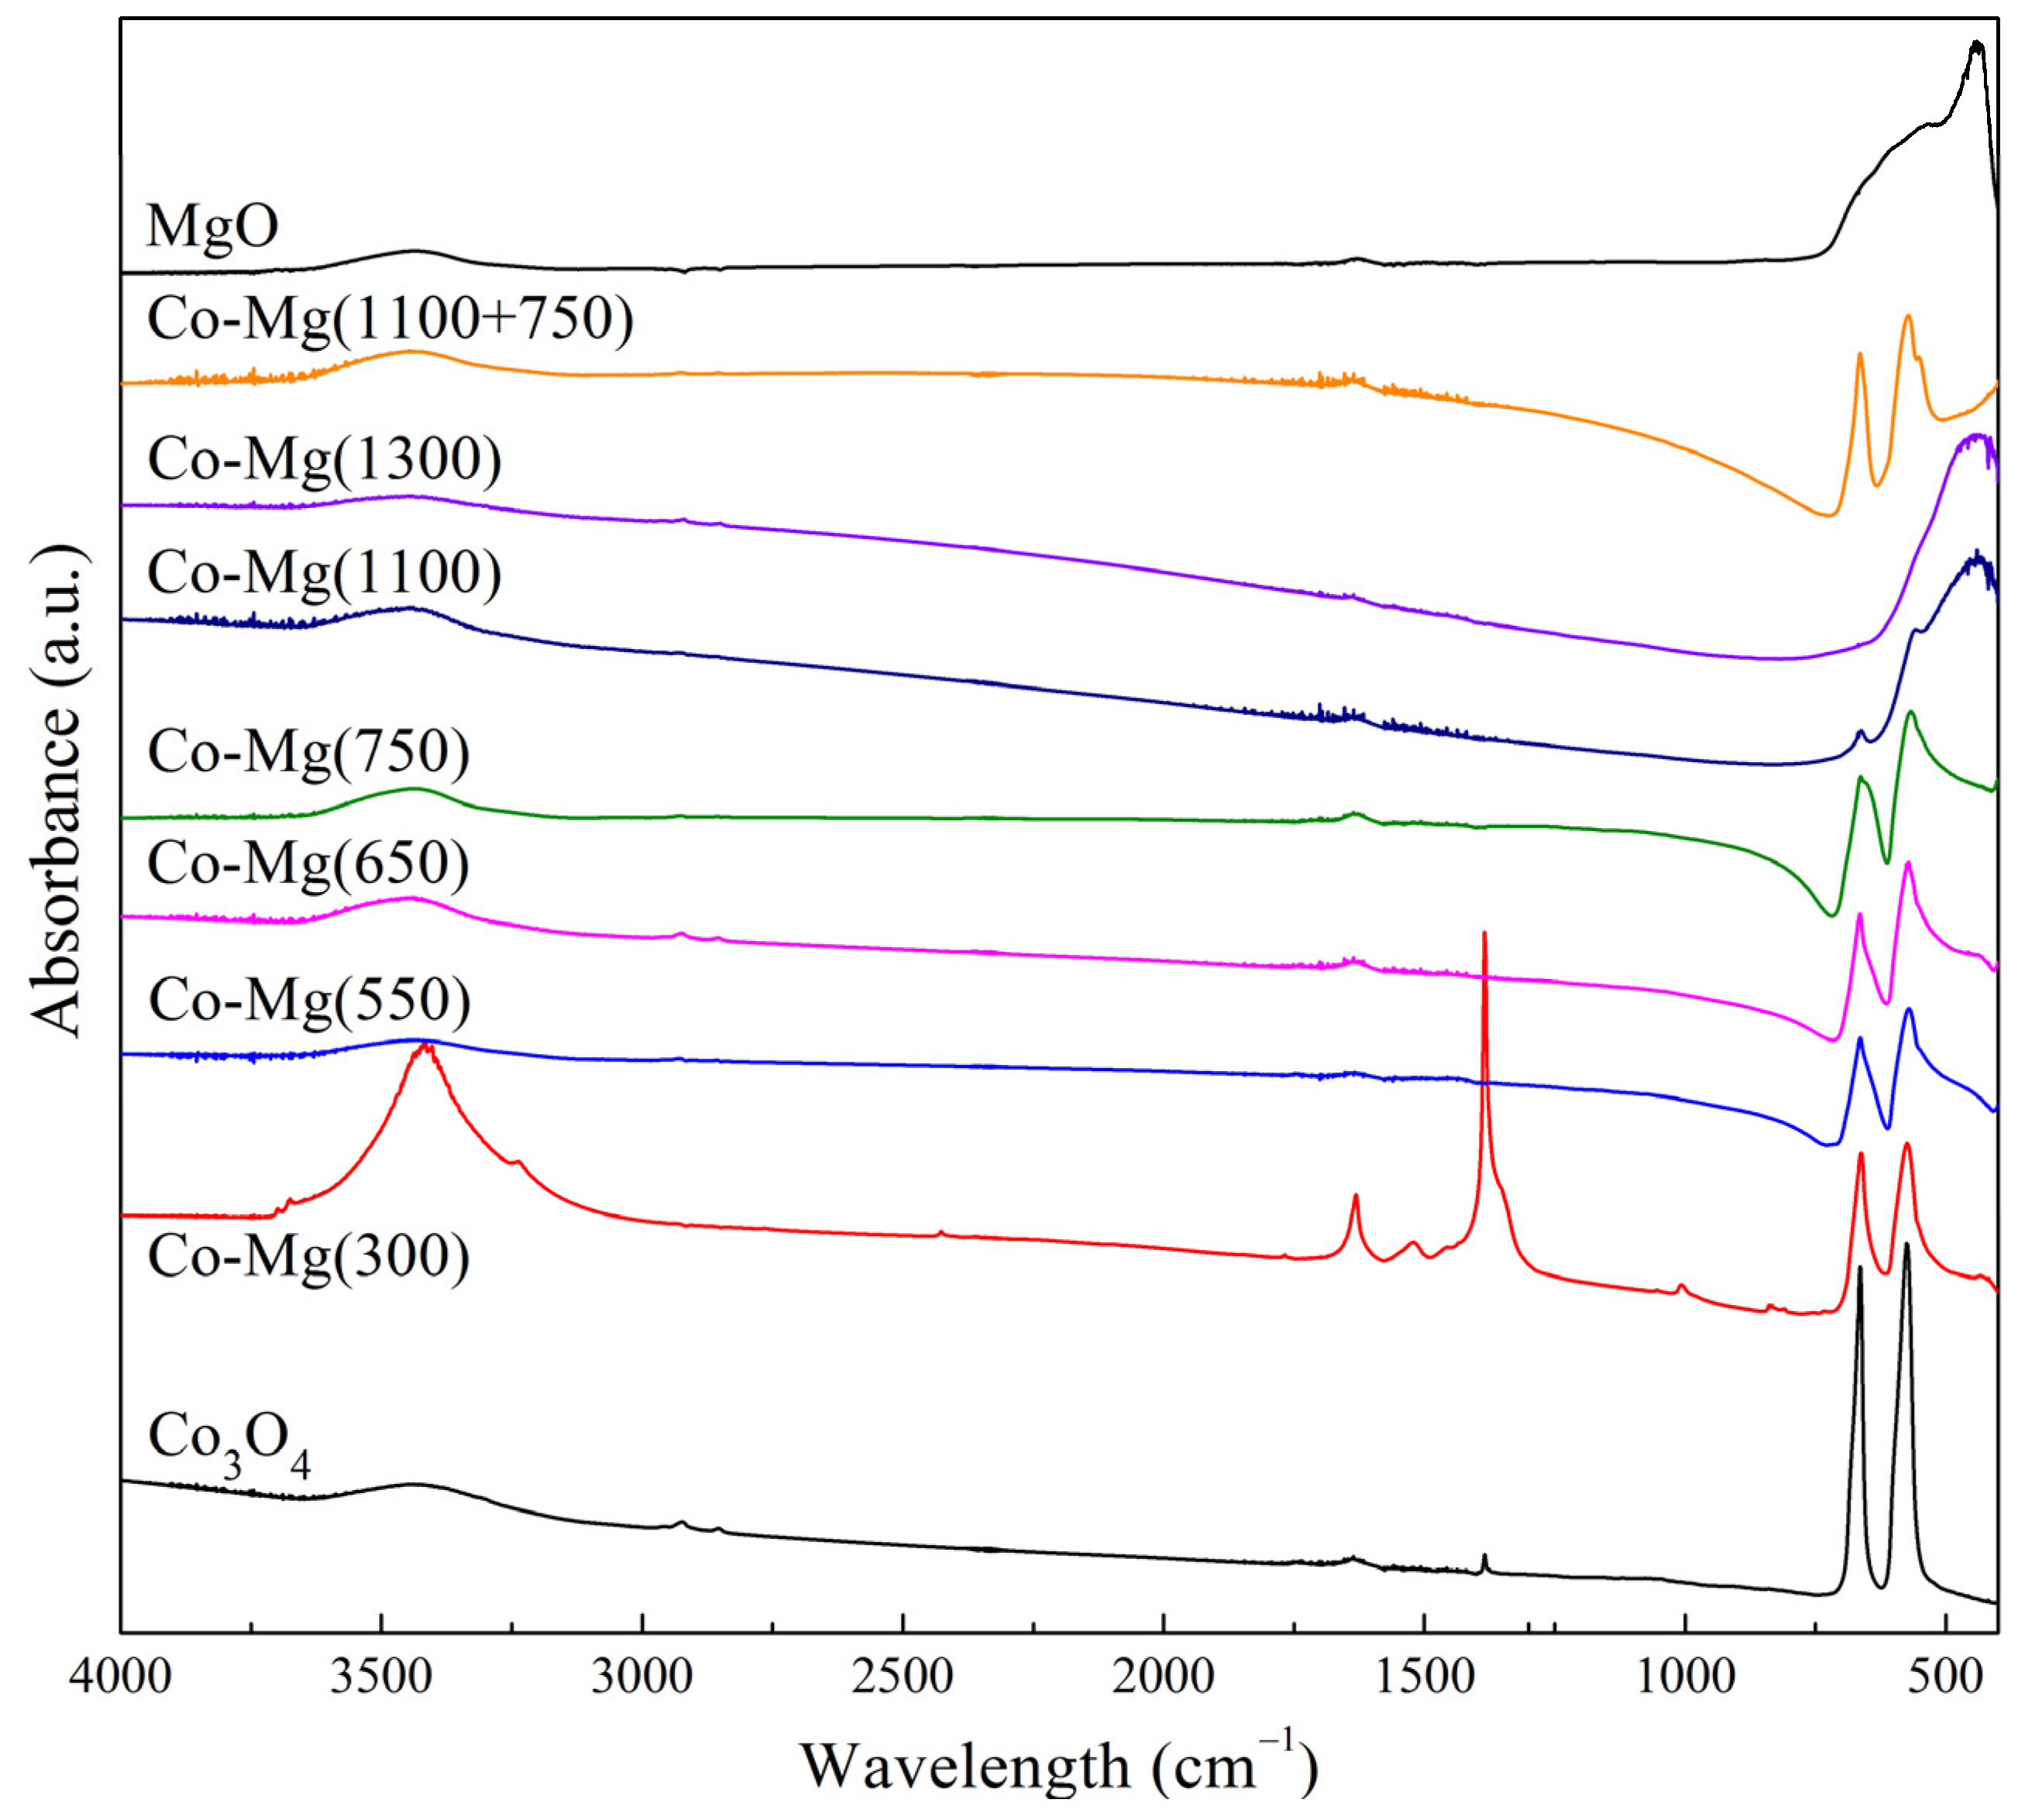
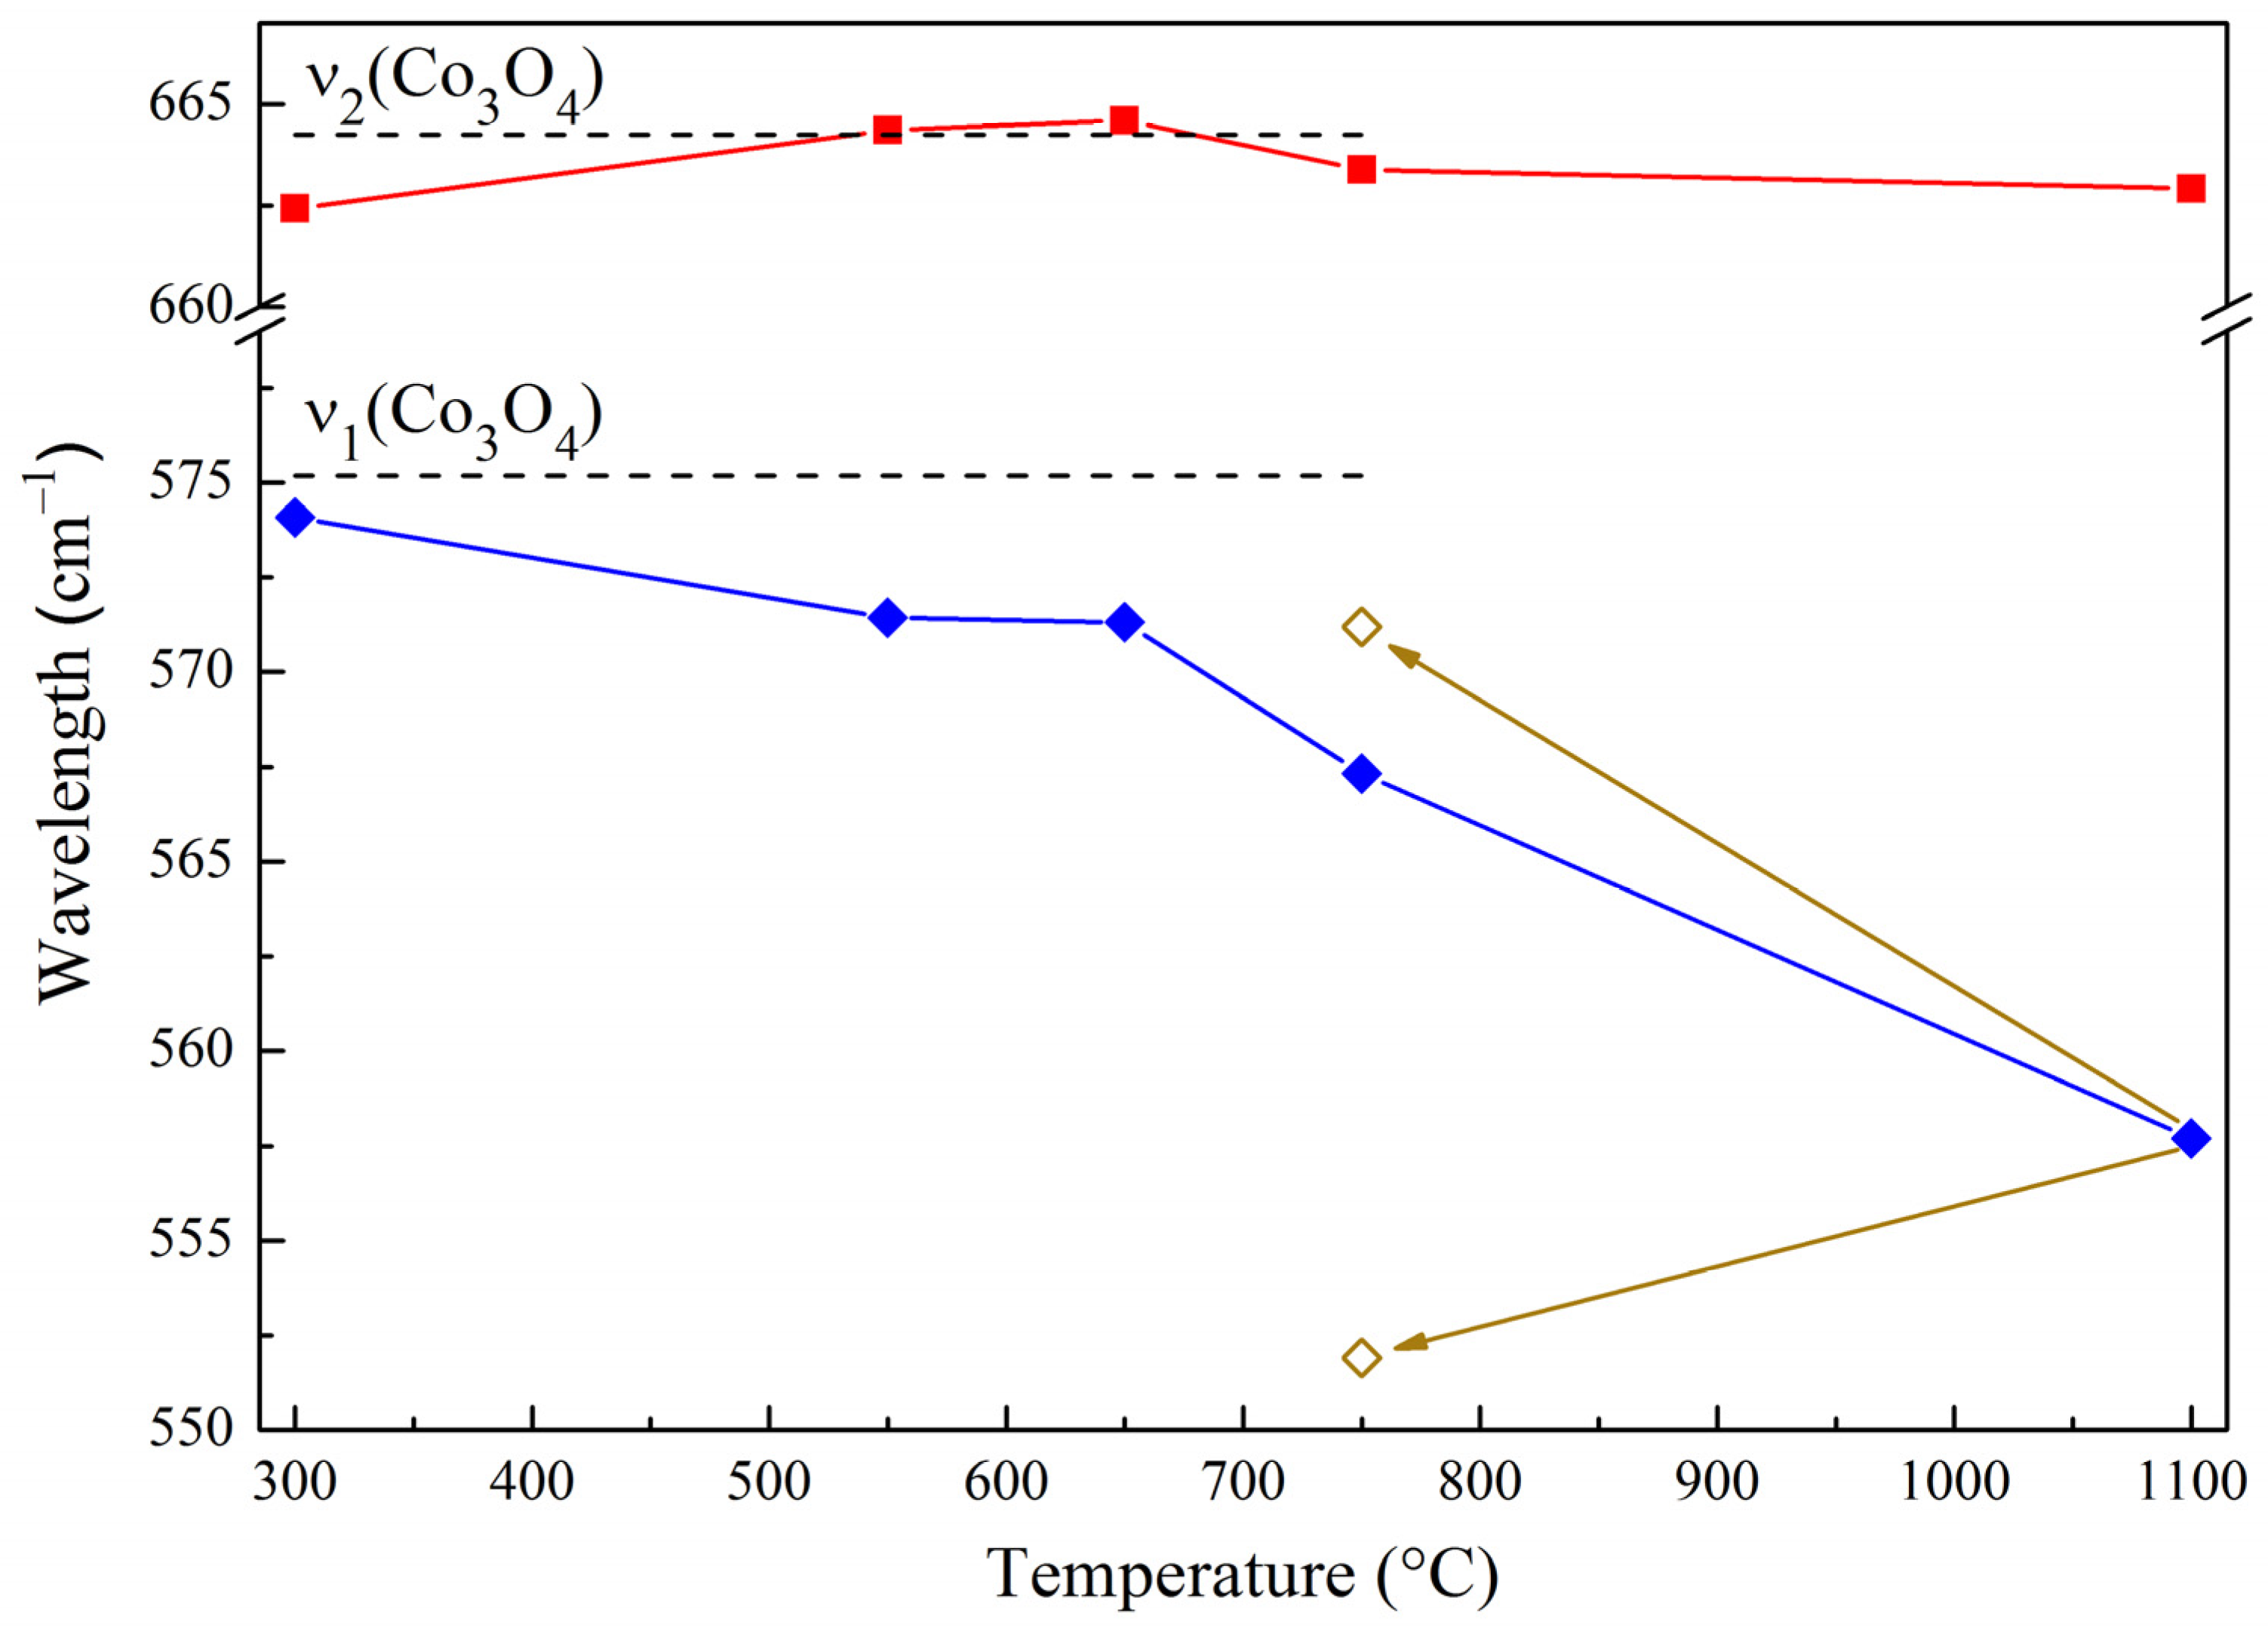
2.2. Binding Energy and Oxygen Reactivity of Samples
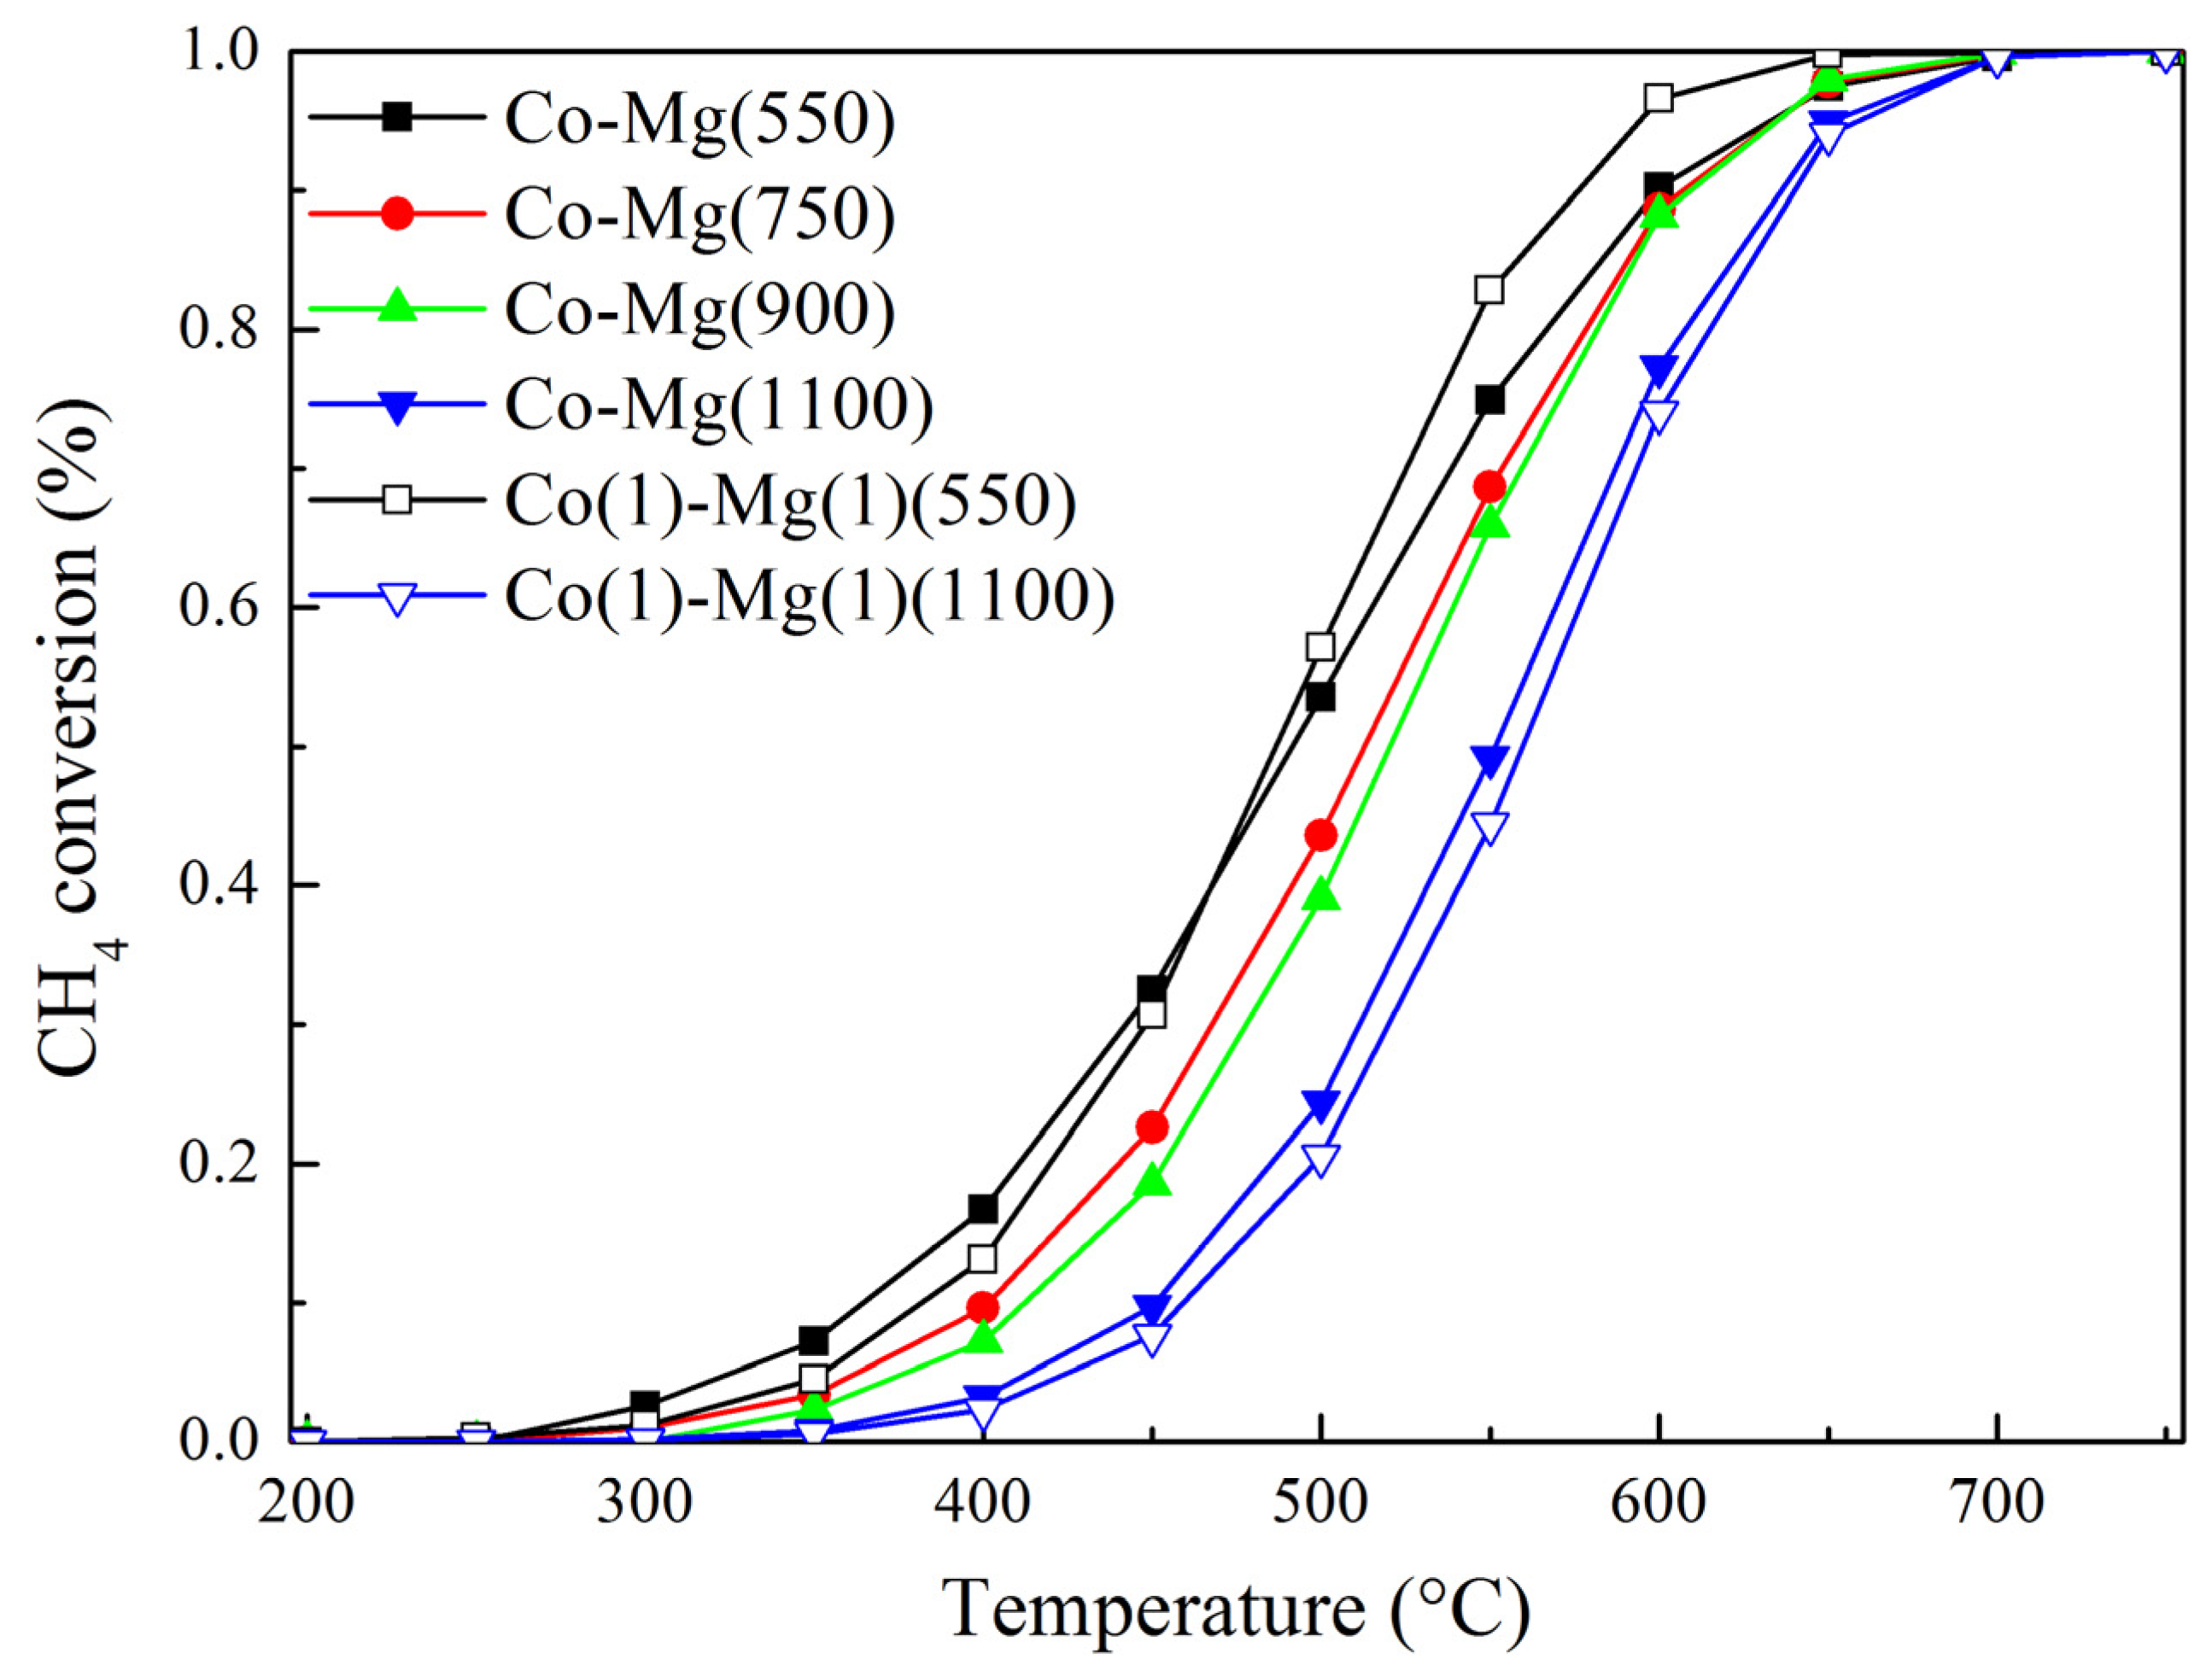
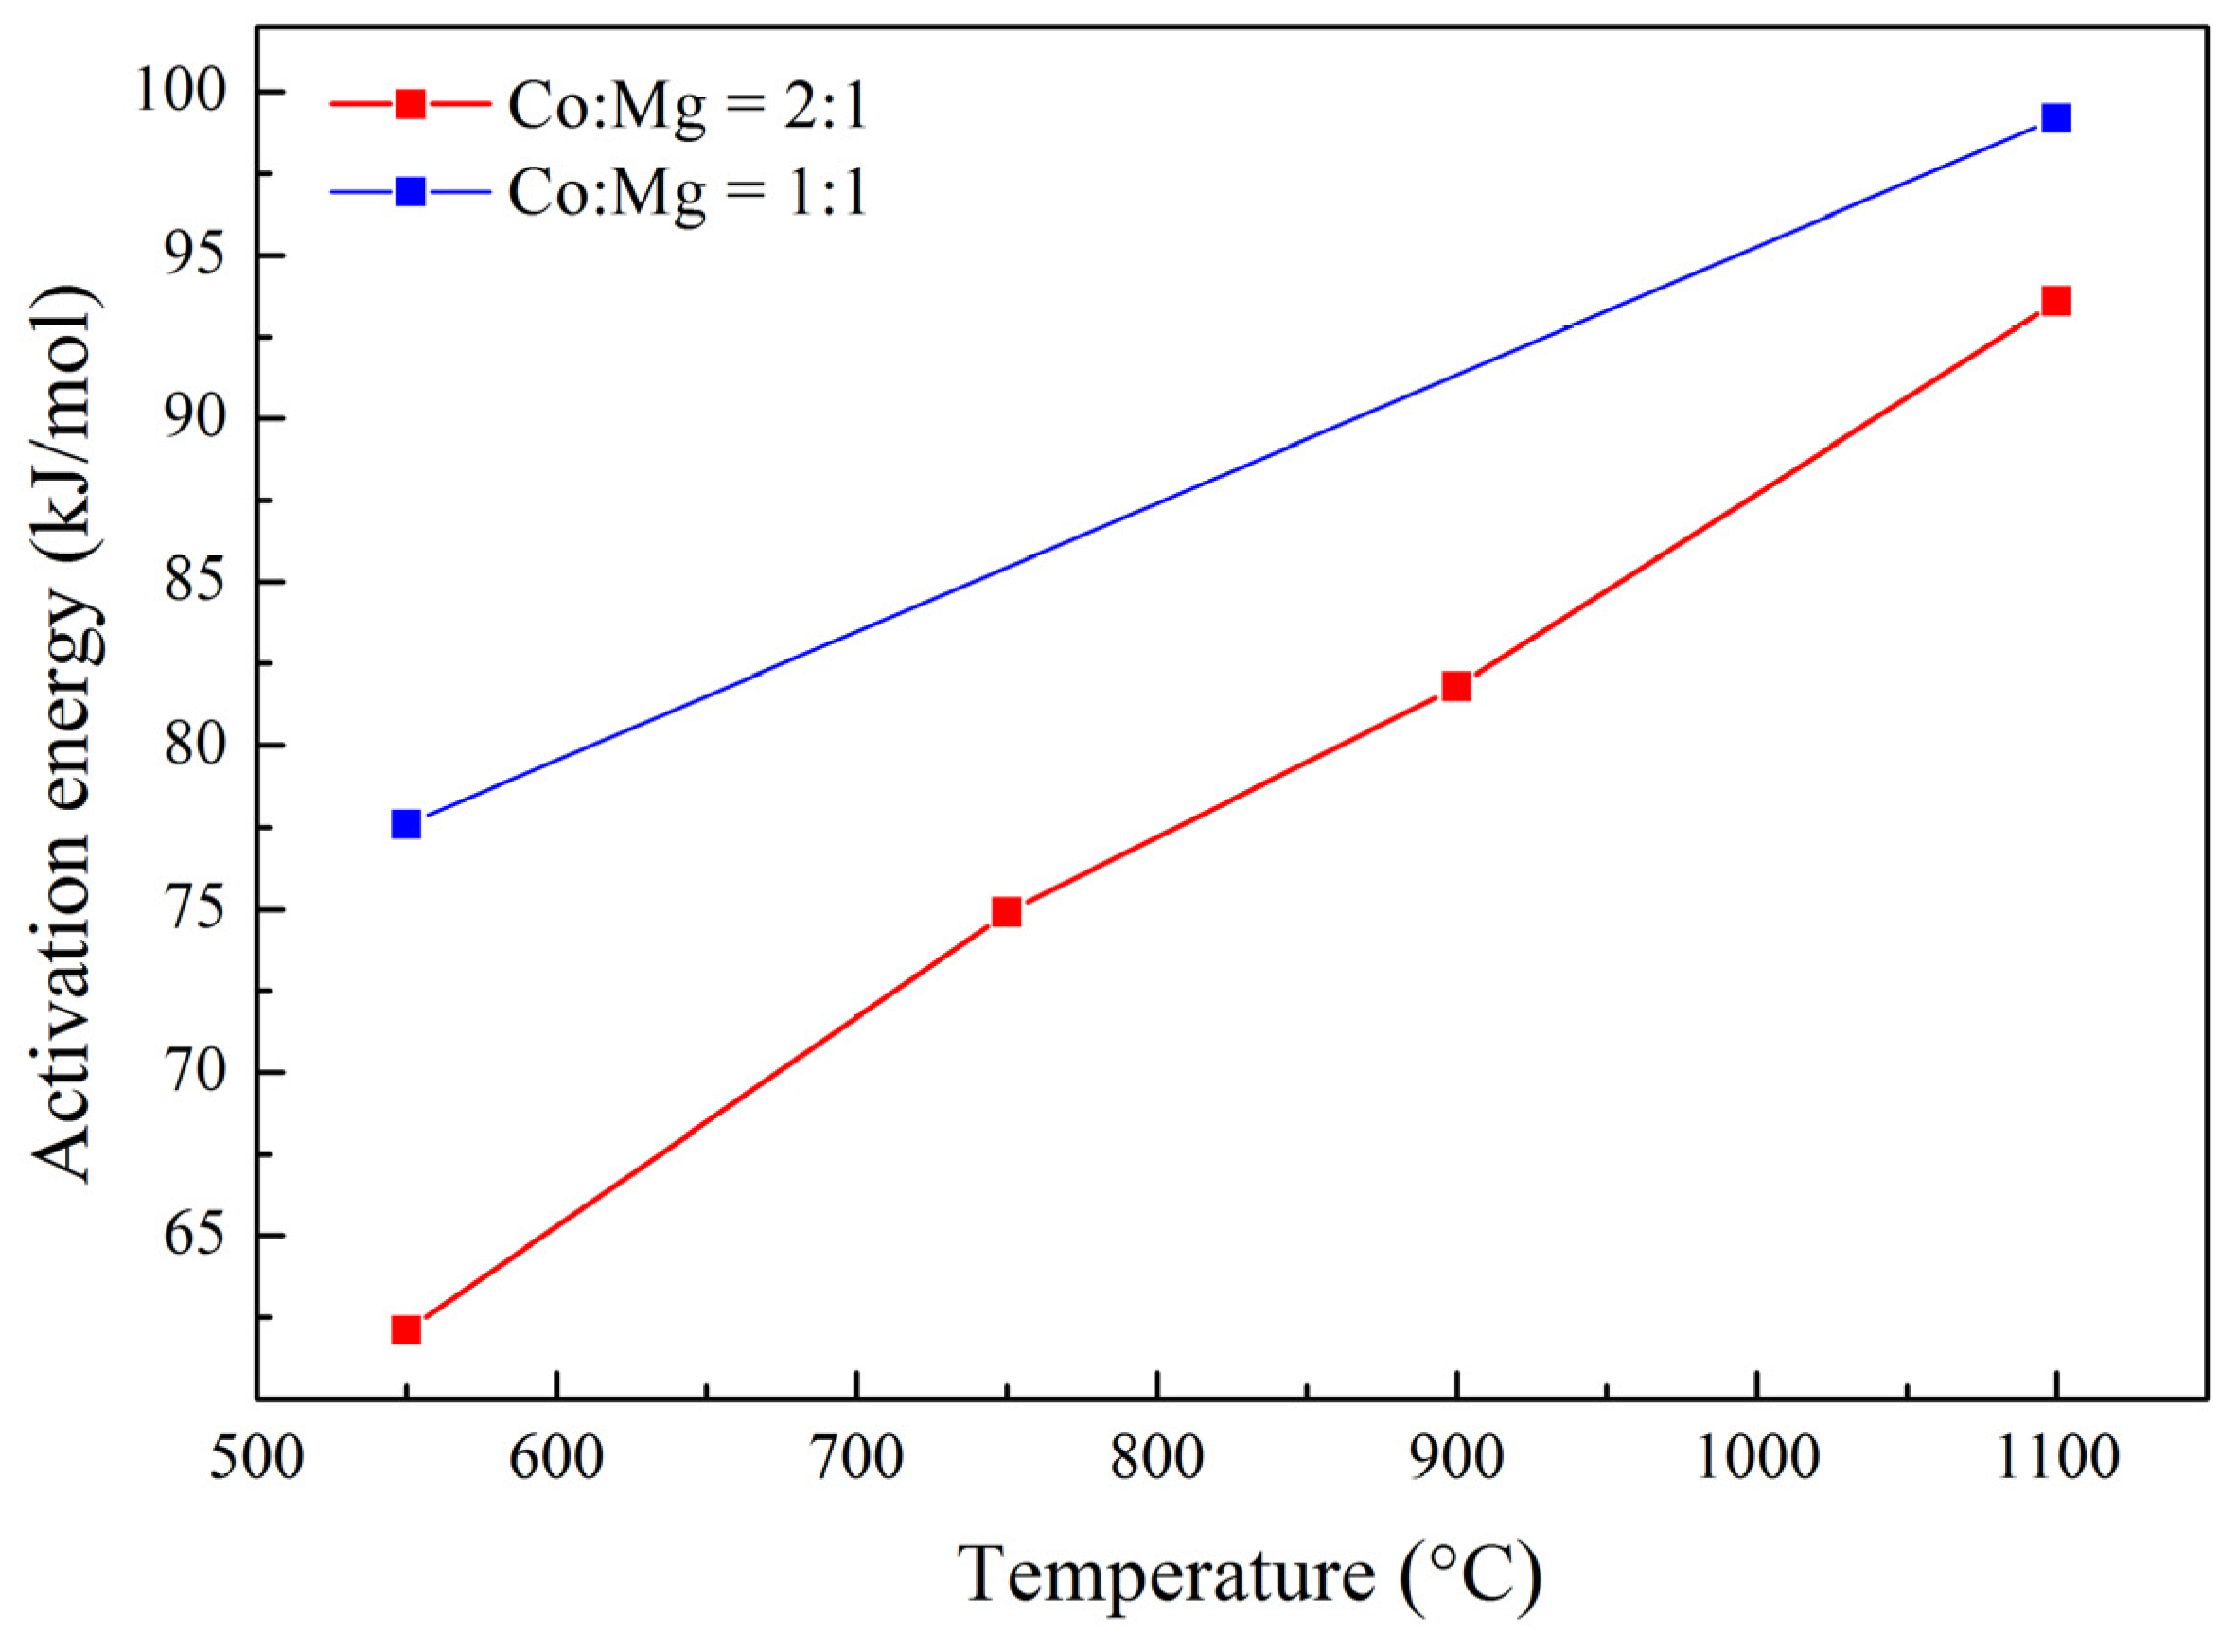
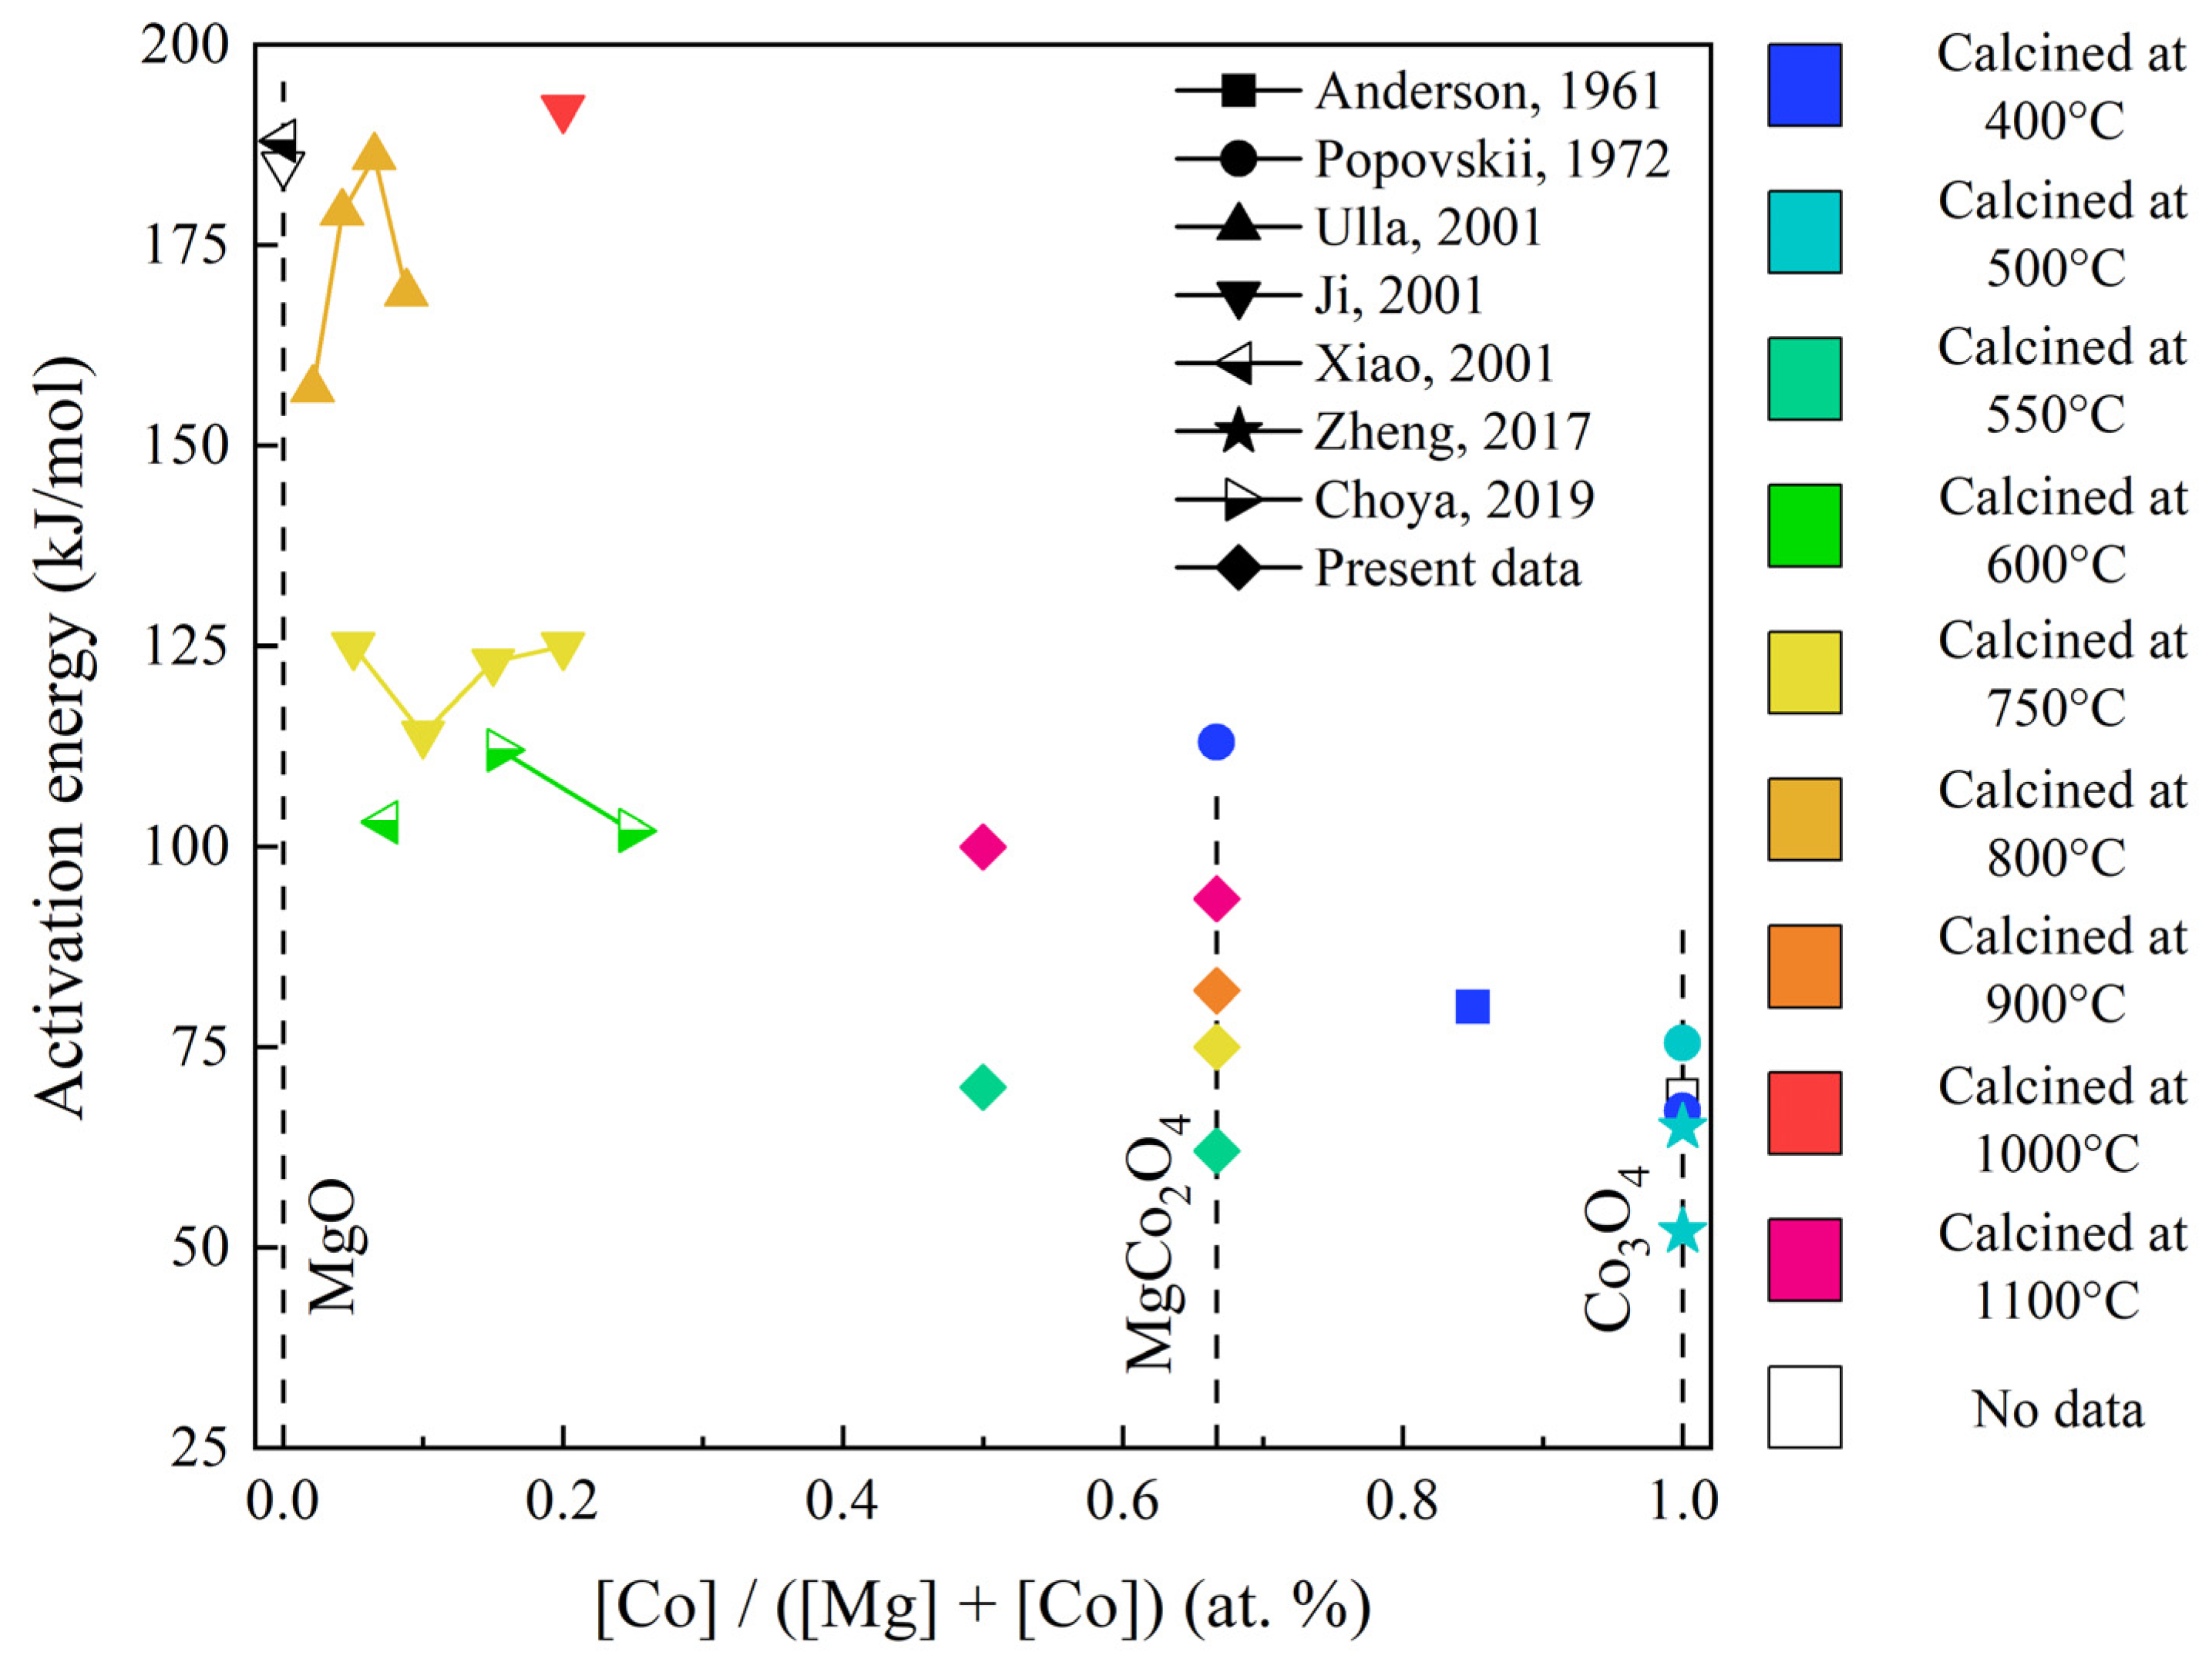
2.3. Catalytic Activity of Samples
3. Materials and Methods
3.1. Preparation of Catalysts
3.2. Study of Catalysts
4. Conclusions
Author Contributions
Funding
Data Availability Statement
Acknowledgments
Conflicts of Interest
References
- Feng, X.; Jiang, L.; Li, D.; Tian, S.; Zhu, X.; Wang, H.; He, C.; Li, K. Progress and key challenges in catalytic combustion of lean methane. J. Energy Chem. 2022, 75, 173–215. [Google Scholar] [CrossRef]
- Li, K.; Luo, X. Research progress on catalytic combustion of volatile organic compounds in industrial waste gas. Catalysts 2023, 13, 268. [Google Scholar] [CrossRef]
- Feng, Y.; Liu, Y.; Dai, H.; Deng, J. Review and perspectives of enhancement in the catalytic stability for the complete combustion of CO, CH4, and volatile organic compounds. Energy Fuels 2023, 37, 3590–3604. [Google Scholar] [CrossRef]
- Chen, J.; Arandiyan, H.; Gao, X.; Li, J. Recent advances in catalysts for methane combustion. Catal. Surv. Asia 2015, 19, 140–171. [Google Scholar] [CrossRef]
- Zheng, Y.; Liu, Y.; Zhou, H.; Huang, W.; Pu, Z. Complete combustion of methane over Co3O4 catalysts: Influence of pH values. J. Alloys Compd. 2018, 734, 112–120. [Google Scholar] [CrossRef]
- Golodets, G.I. Heterogenous Catalytic Reactions Involving Molecular Oxygen. Stud. Surf. Sci. Catal. 1983, 15, 437–469. [Google Scholar]
- Choya, A.; de Rivas, B.; Gutiérrez-Ortiz, J.I.; López-Fonseca, R. Comparative study of strategies for enhancing the performance of Co3O4/Al2O3 catalysts for lean methane combustion. Catalysts 2020, 10, 757. [Google Scholar] [CrossRef]
- Massenova, A.; Kalykberdiyev, M.; Sass, A.; Kenzin, N.; Ussenov, A.; Baiken, A.; Rakhmetova, K. Catalytic technologies for solving environmental problems in the production of fuels and motor transport in Kazakhstan. Catalysts 2020, 10, 1197. [Google Scholar] [CrossRef]
- Zhao, L.; Ji, S.; Yin, F.; Lu, Z.; Liu, H.; Li, C. Catalytic combustion of methane over Co1–xMgxO/Al2O3/FeCrAl monolithic catalysts. J. Nat. Gas Chem. 2006, 15, 287–296. [Google Scholar] [CrossRef]
- Choya, A.; de Rivas, B.; González-Velasco, J.R.; Gutiérrez-Ortiz, J.I.; López-Fonseca, R. On the beneficial effect of MgO promoter on the performance of Co3O4/Al2O3 catalysts for combustion of dilute methane. Appl. Catal. A 2019, 582, 117099. [Google Scholar] [CrossRef]
- Chen, L.; Tian, X.; Fu, Y.; Shen, J. The effect of surface acidic and basic properties of highly loaded Co catalysts on the Fischer–Tropsch synthesis. Catal. Commun. 2012, 28, 155–158. [Google Scholar] [CrossRef]
- Wang, H.Y.; Ruckenstein, E. CO2 reforming of CH4 over Co/MgO solid solution catalysts—Effect of calcination temperature and Co loading. Appl. Catal. A 2001, 209, 207–215. [Google Scholar] [CrossRef]
- Sukri, M.F.F.; Khavarian, M.; Mohamed, A.R. Effect of cobalt loading on suppression of carbon formation in carbon dioxide reforming of methane over Co/MgO catalyst. Res. Chem. Intermed. 2018, 44, 2585–2605. [Google Scholar] [CrossRef]
- El-Salamony, R.A.; Morshedy, A.S.; El Naggar, A.M.A. Elevated CO-free hydrogen productivity through ethanol steam reforming using cubic Co-nanoparticles based MgO catalyst. Environ. Technol. 2022, 43, 1860–1869. [Google Scholar] [CrossRef]
- Furusawa, T.; Tsutsumi, A. Development of cobalt catalysts for the steam reforming of naphthalene as a model compound of tar derived from biomass gasification. Appl. Catal. A 2005, 278, 195–205. [Google Scholar] [CrossRef]
- Wang, H.Y.; Ruckenstein, E. Partial oxidation of methane to synthesis gas over alkaline earth metal oxide supported cobalt catalysts. J. Catal. 2001, 199, 309–317. [Google Scholar] [CrossRef]
- Moral, A.; Reyero, I.; Llorca, J.; Bimbela, F.; Gandía, L.M. Partial oxidation of methane to syngas using Co/Mg and Co/Mg-Al oxide supported catalysts. Catal. Today 2019, 333, 259–267. [Google Scholar] [CrossRef]
- Anderson, R.B.; Stein, K.C.; Feenan, J.J.; Hofer, L.J.E. Catalytic oxidation of methane. Ind. Eng. Chem. 1961, 53, 809–812. [Google Scholar] [CrossRef]
- Ulla, M.A.; Spretz, R.; Lombardo, E.; Daniell, W.; Knözinger, H. Catalytic combustion of methane on Co/MgO: Characterisation of active cobalt sites. Appl. Catal. B 2001, 29, 217–229. [Google Scholar] [CrossRef]
- Ji, S.-F.; Xiao, T.-C.; Wang, H.-T.; Flahaut, E.; Coleman, K.S.; Green, M.L.H. Catalytic combustion of methane over cobalt-magnesium oxide solid solution catalysts. Catal. Lett. 2001, 75, 65–71. [Google Scholar] [CrossRef]
- Xiao, T.-C.; Ji, S.-F.; Wang, H.-T.; Coleman, K.S.; Green, M.L. Methane combustion over supported cobalt catalysts. J. Mol. Catal. A Chem. 2001, 175, 111–123. [Google Scholar] [CrossRef]
- Kiselev, V.F.; Krylov, O.V.B. Adsorption and Catalysis on Transition Metals and Their Oxides; Springer: Berlin/Heidelberg, Germany, 1989; p. 445. [Google Scholar]
- Robin, J. Recherches sur la constitution et la stabilité de quelques solutions solides a base d’oxyde de cobalt. Ann. Chim. 1955, 12, 389–412. [Google Scholar]
- Zamudio, M.A.; Bensaid, S.; Fino, D.; Russo, N. Influence of the MgCo2O4 preparation method on N2O catalytic decomposition. Ind. Eng. Chem. Res. 2011, 50, 2622–2627. [Google Scholar] [CrossRef]
- Fadlalla, M.I.; Nyathi, T.M.; Claeys, M. Magnesium as a methanation suppressor for iron- and cobalt-based oxide catalysts during the preferential oxidation of carbon monoxide. Catalysts 2022, 12, 118. [Google Scholar] [CrossRef]
- Zigla, A.A.; Kox, T.; Mevoa, D.; Assaouka, H.T.; Nsangou, I.N.; Daawe, D.M.; Kenmoe, S.; Kouotou, P.M. Magnesium-modified Co3O4 catalyst with remarkable performance for toluene low temperature deep oxidation. Catalysts 2022, 12, 411. [Google Scholar] [CrossRef]
- Veselov, G.B.; Stoyanovskii, V.O.; Cherepanova, S.V.; Vedyagin, A.A. Sol–gel prepared Co–Mg–O oxide systems: Redox behavior, thermal stability and catalytic performance in CO oxidation. React. Kinet. Mech. Catal. 2023, 136, 233–250. [Google Scholar] [CrossRef]
- Ya, M.; Wang, J.; Li, G.; Gao, G.; Zhao, X.; Cui, J.; Wu, H.; Li, L. Surface engineering in MgCo2O4 spinel oxide for an improved oxygen evolution reaction. ACS Sustain. Chem. Eng. 2023, 11, 744–750. [Google Scholar] [CrossRef]
- Han, X.; Wang, L.; Ling, H.; Ge, Z.; Lin, X.; Dai, X.; Chen, H. Critical review of thermochemical energy storage systems based on cobalt, manganese, and copper oxides. Renew. Sustain. Energy Rev. 2022, 158, 112076. [Google Scholar] [CrossRef]
- Wang, H.; Mi, N.; Sun, S.; Zhang, W.; Yao, S. Oxygen vacancies enhancing capacitance of MgCo2O4 for high performance asymmetric supercapacitors. J. Alloys Compd. 2021, 869, 159294. [Google Scholar] [CrossRef]
- Kamioka, N.; Ichitsubo, T.; Uda, T.; Imashuku, S.; Taninouchi, Y.K.; Matsubara, E. Synthesis of spinel-type magnesium cobalt oxide and its electrical conductivity. Mater. Trans. 2008, 49, 824–828. [Google Scholar] [CrossRef]
- Hagan, A.P.; Lofthouse, M.G.; Stone, F.S.; Trevethan, M.A. High surface area oxide solid solution catalyst. Stud. Surf. Sci. Catal. 1979, 3, 417–438. [Google Scholar]
- Holgersson, S.; Karlsson, A. Röntgenographische Untersuchungen einiger Mischkristallsysteme mit Monoxyden als Komponenten. Z. Anorg. Allg. Chem. 1929, 182, 255–271. [Google Scholar] [CrossRef]
- Krezhov, K.; Konstantinov, P. On the cationic distribution in MgxCo3–xO4 spinels. J. Phys. Condens. Matter 1992, 4, L543–L548. [Google Scholar] [CrossRef]
- Casas-Cabanas, M.; Binotto, G.; Larcher, D.; Lecup, A.; Giordani, V.; Tarascon, J.M. Defect chemistry and catalytic activity of nanosized Co3O4. Chem. Mater. 2009, 21, 1939–1947. [Google Scholar] [CrossRef]
- McCormack, S.J.; Navrotsky, A. Thermodynamics of high entropy oxides. Acta Mater. 2021, 202, 1–21. [Google Scholar] [CrossRef]
- Ichimura, H.; Komatsu, W. Distribution of various dopants cations (Li+, Al3+, Ga3+, and In3+) in cobalt spinel. J. Chem. Soc. Jpn. 1972, 4, 690–695. [Google Scholar]
- Peshev, P.; Toshev, A.; Gyurov, G. Preparation of high-dispersity MCo2O4 (M = Mg, Ni, Zn) spinels by thermal dissociation of coprecipitated oxalates. Mater. Res. Bull. 1989, 24, 33–40. [Google Scholar] [CrossRef]
- Yagi, S.; Ichikawa, Y.; Yamada, I.; Doi, T.; Ichitsubo, T.; Matsubara, E. Synthesis of binary magnesium-transition metal oxides via inverse co-precipitation. Jap. J. Appl. Phys. 2013, 52, 025501. [Google Scholar] [CrossRef]
- Syeda, A.F.; Khan, M.N. Spin state of cobalt and electrical transport in MgCo2O4 system. J. Supercond. Nov. Magn. 2018, 31, 3545–3551. [Google Scholar] [CrossRef]
- Aukrust, E.; Muan, A. Activities of components in oxide solid solutions: The systems CoO–MgO, CoO–MnO, and CoO–FeO at 1200 °C. Trans. Metall. Soc. AIME 1963, 227, 1378–1380. [Google Scholar]
- Wang, C.W.; Wang, C.B.; Chien, S.H. Characterization of cobalt oxides studied by FT-IR, Raman, TPR and TG-MS. Thermochim. Acta 2008, 473, 68–73. [Google Scholar]
- Nayak, S.; Dasari, K.; Joshi, D.C. Spectroscopic studies of Co2TiO4 and Co3O4 two-phase composites. Phys. Status Solidi B 2016, 253, 2270–2282. [Google Scholar] [CrossRef]
- Dyrek, K.; Sojka, Z. Coordination and dispersion of Co2+ ions in CoO–MgO solid solutions. J. Chem. Soc. Faraday Trans. 1 Phys. Chem. Condens. Phases 1982, 78, 3177–3185. [Google Scholar] [CrossRef]
- Gazzoli, D.; Occhiuzzi, M.; Cimino, A.; Cordischi, D.; Minelli, G.; Pinzari, F. XPS and EPR study of high and low surface area CoO–MgO solid solutions: Surface composition and Co2+ ion dispersion. J. Chem. Soc. Faraday Trans. 1996, 92, 4567–4574. [Google Scholar] [CrossRef]
- Querini, C.A.; Ulla, M.A.; Requejo, F.; Soria, J.; Sedrán, U.A.; Miró, E.E. Catalytic combustion of diesel soot particles. Activity and characterization of Co/MgO and Co, K/MgO catalysts. Appl. Catal. B 1998, 15, 5–19. [Google Scholar] [CrossRef]
- Dutta, P.; Seehra, M.S.; Thota, S.; Kumar, J. A comparative study of the magnetic properties of bulk and nanocrystalline Co3O4. J. Phys. Condens. Matter 2008, 20, 015218. [Google Scholar] [CrossRef]
- Gardner, T.J.; Messing, G.L. Magnesium salt decomposition and morphological development during evaporative decomposition of solutions. Thermochim. Acta 1984, 78, 17–27. [Google Scholar] [CrossRef]
- Raveau, B.; Seikh, M. Cobalt Oxides: From Crystal Chemistry to Physics; Wiley–VCH: Weinheim, Germany, 2012; p. 333. [Google Scholar]
- Guan, D.; Shi, C.; Xu, H.; Gu, Y.; Zhong, J.; Sha, Y.; Hu, Z.; Ni, M.; Shao, Z. Simultaneously mastering operando strain and reconstruction effects via phase-segregation strategy for enhanced oxygen-evolving electrocatalysis. J. Energy Chem. 2023, 82, 572–580. [Google Scholar] [CrossRef]
- De Jong, A.M.; Niemantsverdriet, J.W. Thermal desorption analysis: Comparative test of ten commonly applied procedures. Surf. Sci. 1990, 233, 355–365. [Google Scholar] [CrossRef]

 spinel phase:
  —S2.86/S2.44,
  —S2.02/S2.44,
  —S1.56/S2.44,
  —S1.43/S2.44.
  solid solution phase:
  —S2.12/S2.44,
  —S1.50/S2.44.
spinel phase: —S2.86/S2.44, —S2.02/S2.44, —S1.56/S2.44, —S1.43/S2.44. solid solution phase: —S2.12/S2.44, —S1.50/S2.44.
—S1.50/S2.44.
spinel phase: —S2.86/S2.44, —S2.02/S2.44, —S1.56/S2.44, —S1.43/S2.44. solid solution phase: —S2.12/S2.44, —S1.50/S2.44.

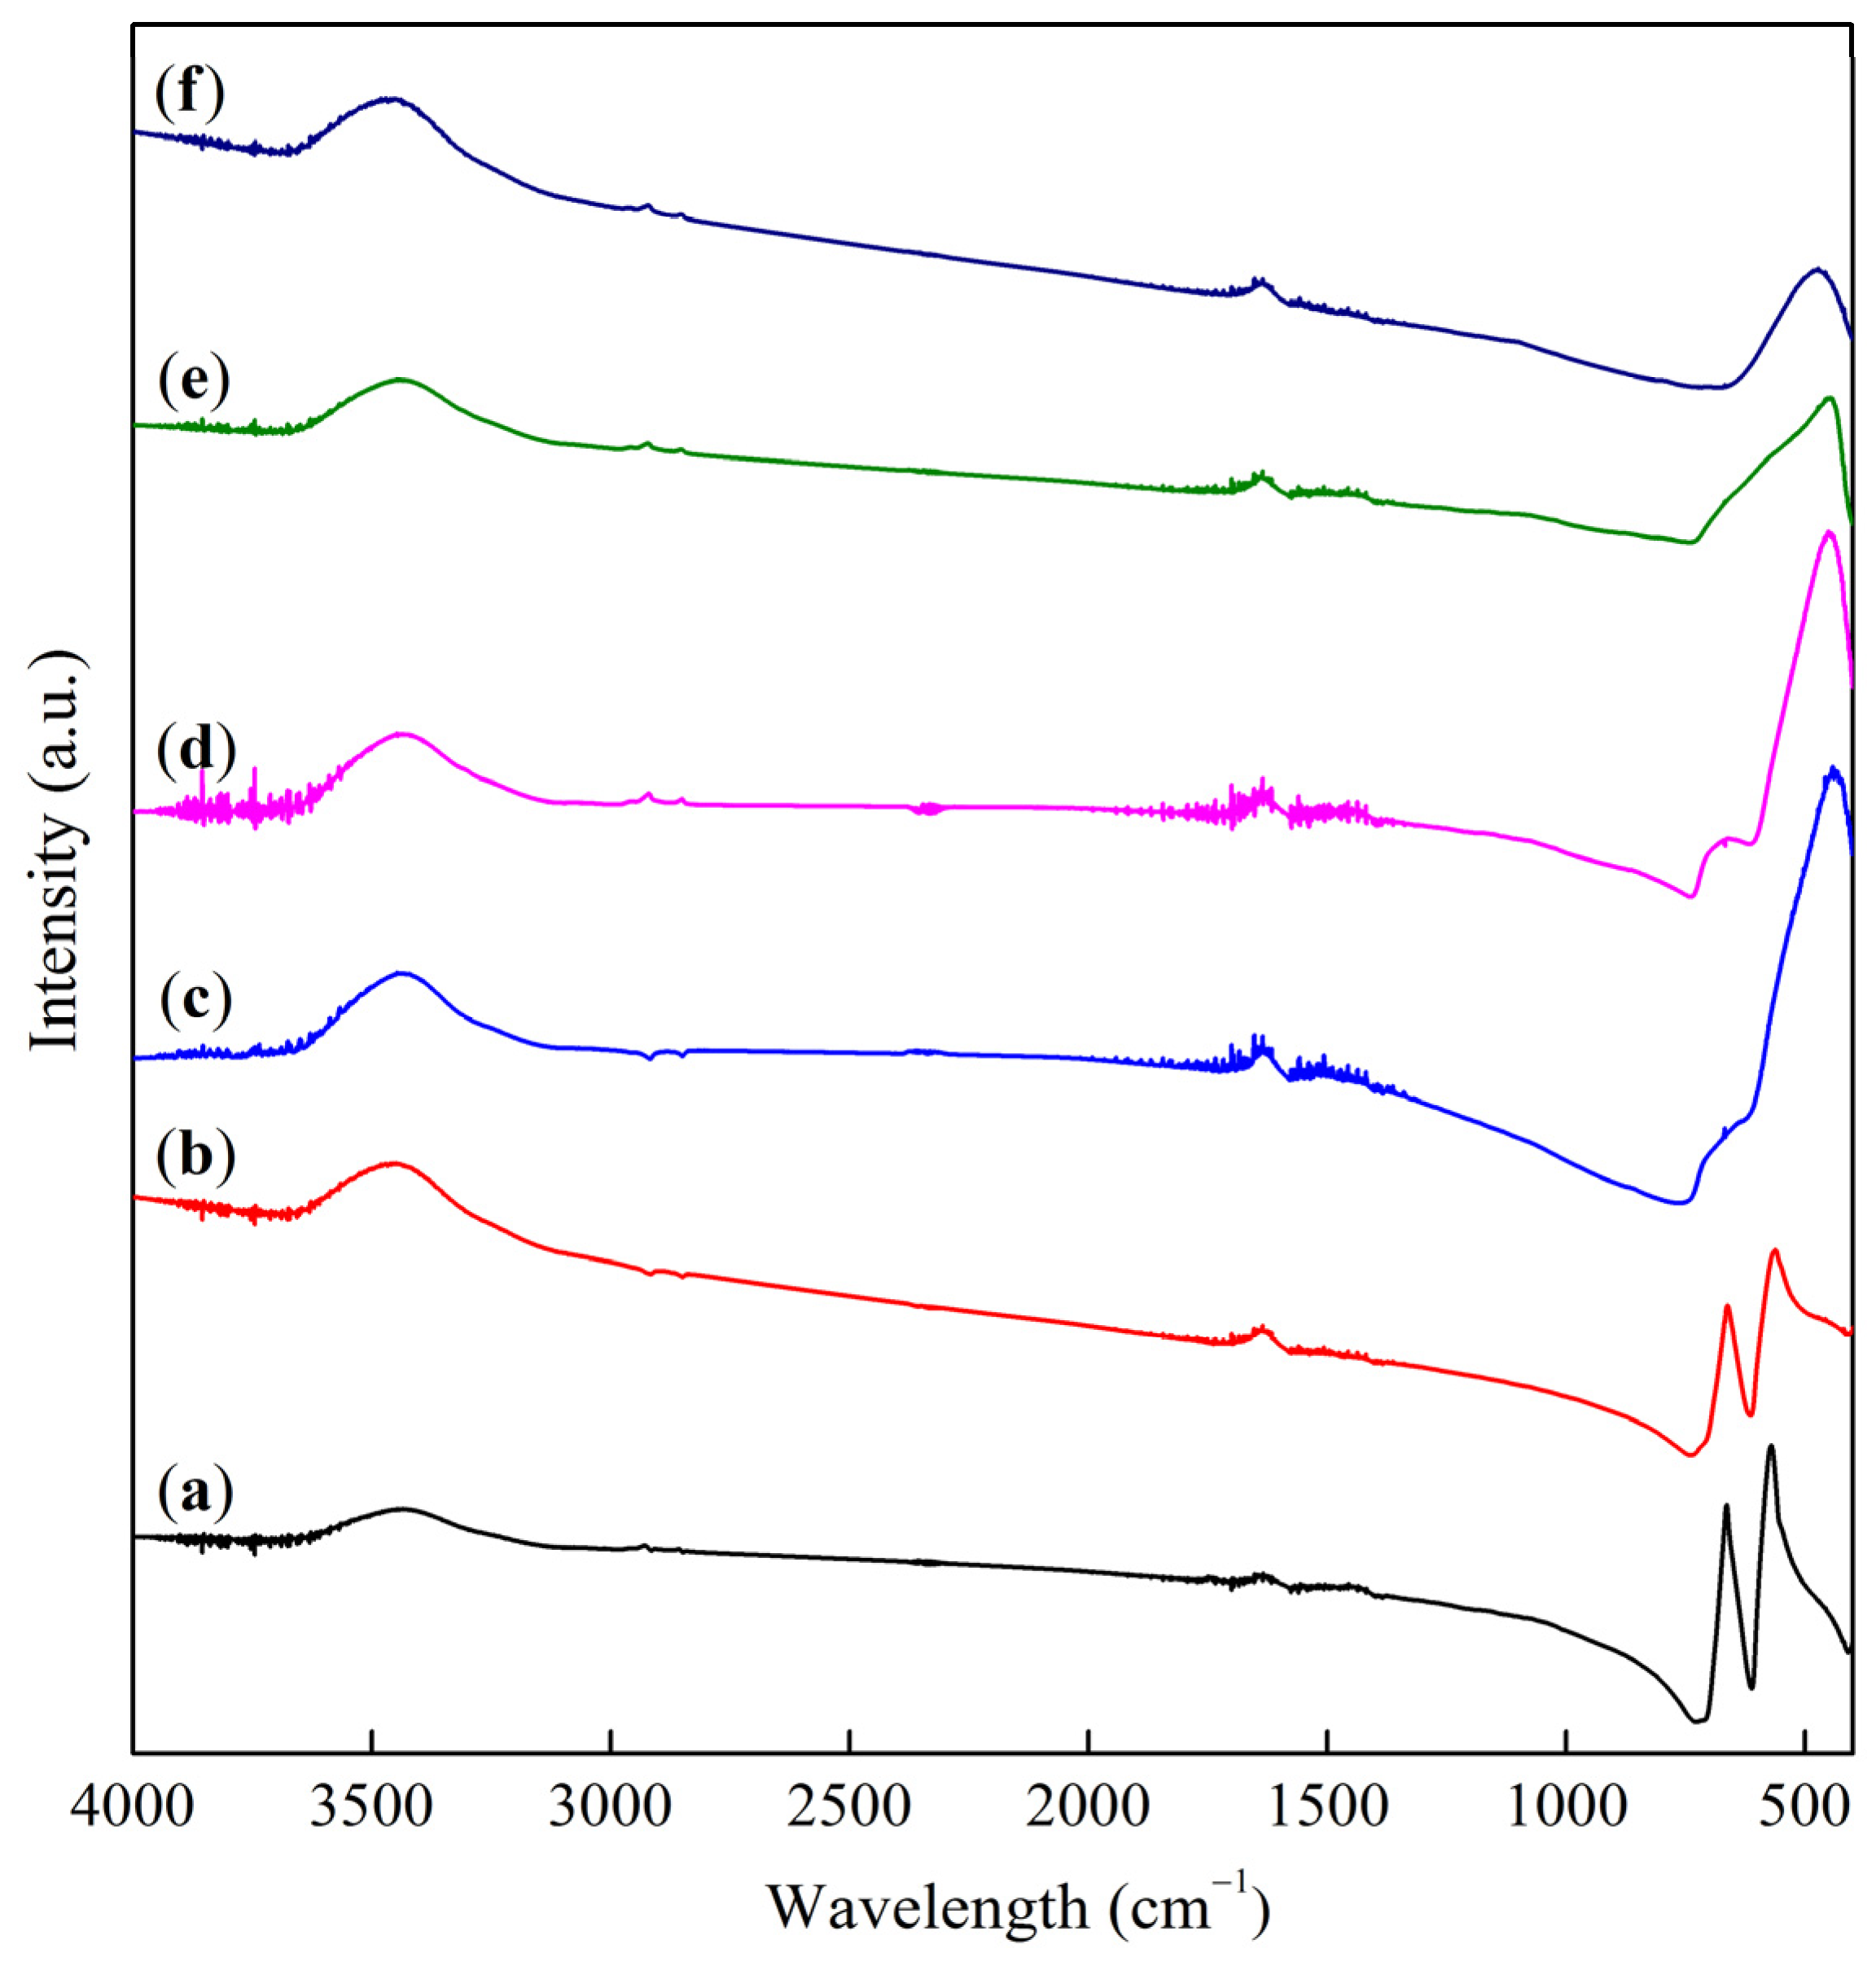
 —ν1 a.b.,
  —ν2 a.b.,
  —changes in the position of bands during reoxidation.
—ν1 a.b., —ν2 a.b., —changes in the position of bands during reoxidation.
—changes in the position of bands during reoxidation.
—ν1 a.b., —ν2 a.b., —changes in the position of bands during reoxidation.


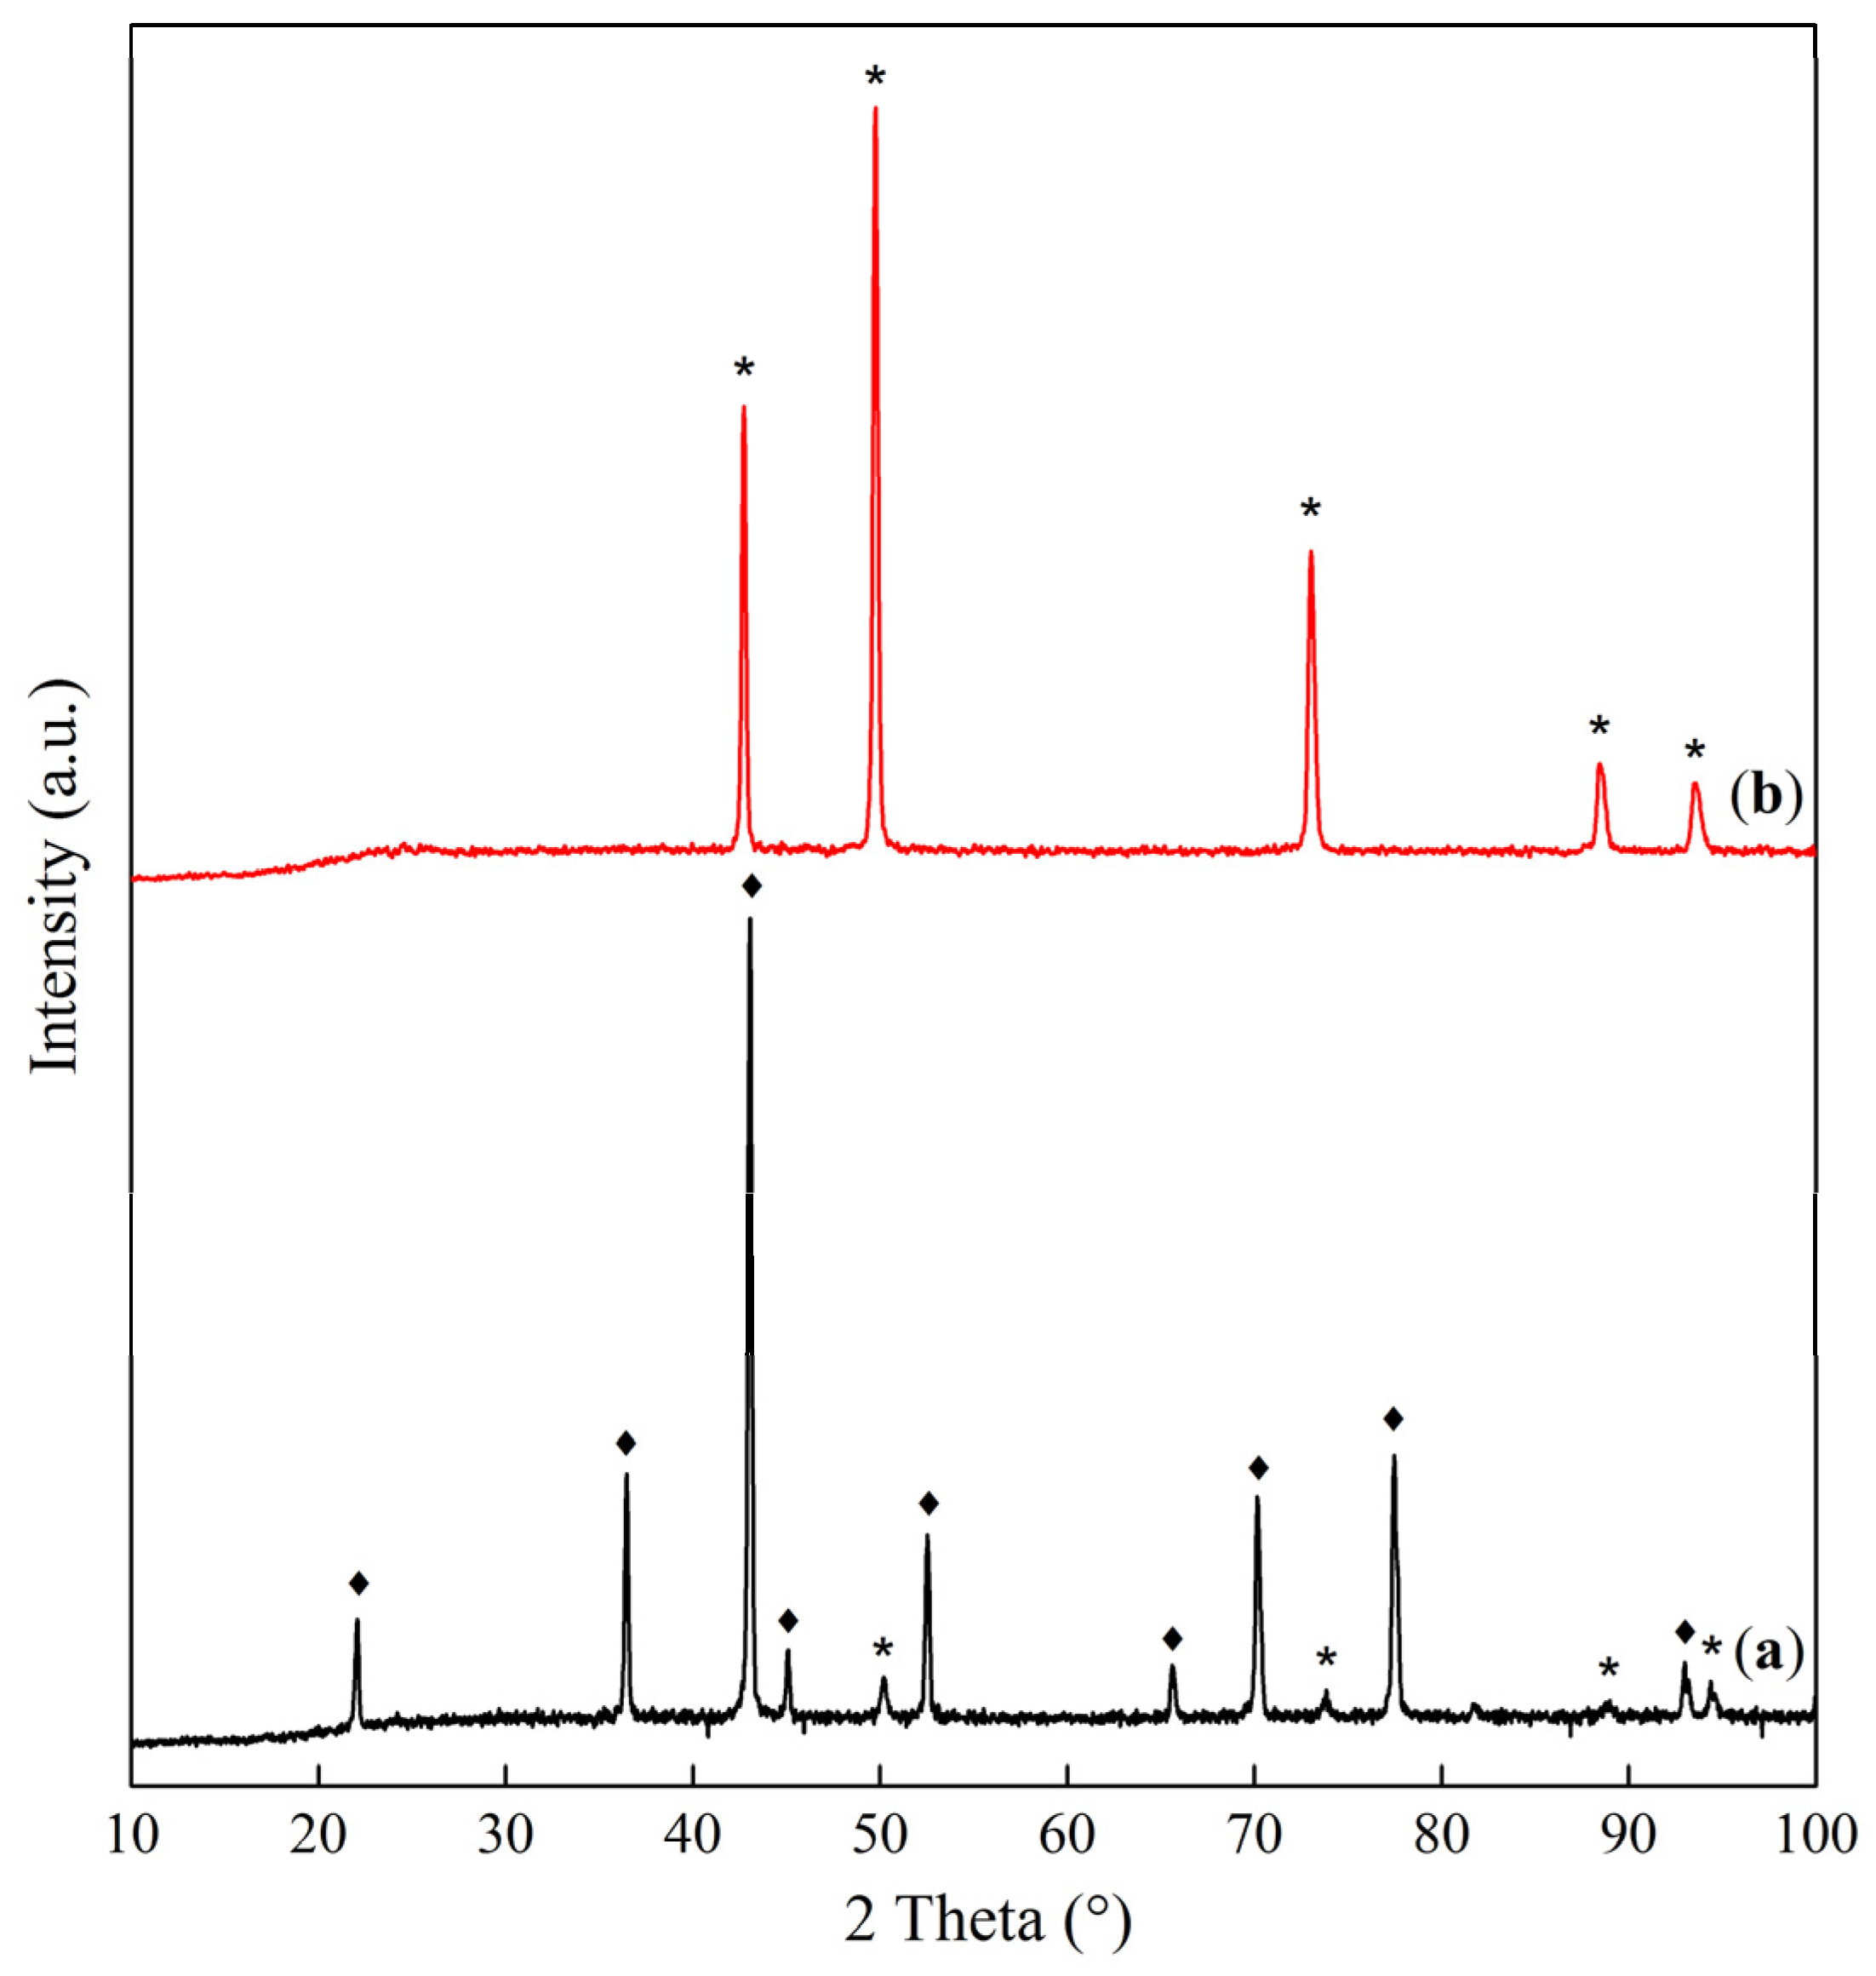
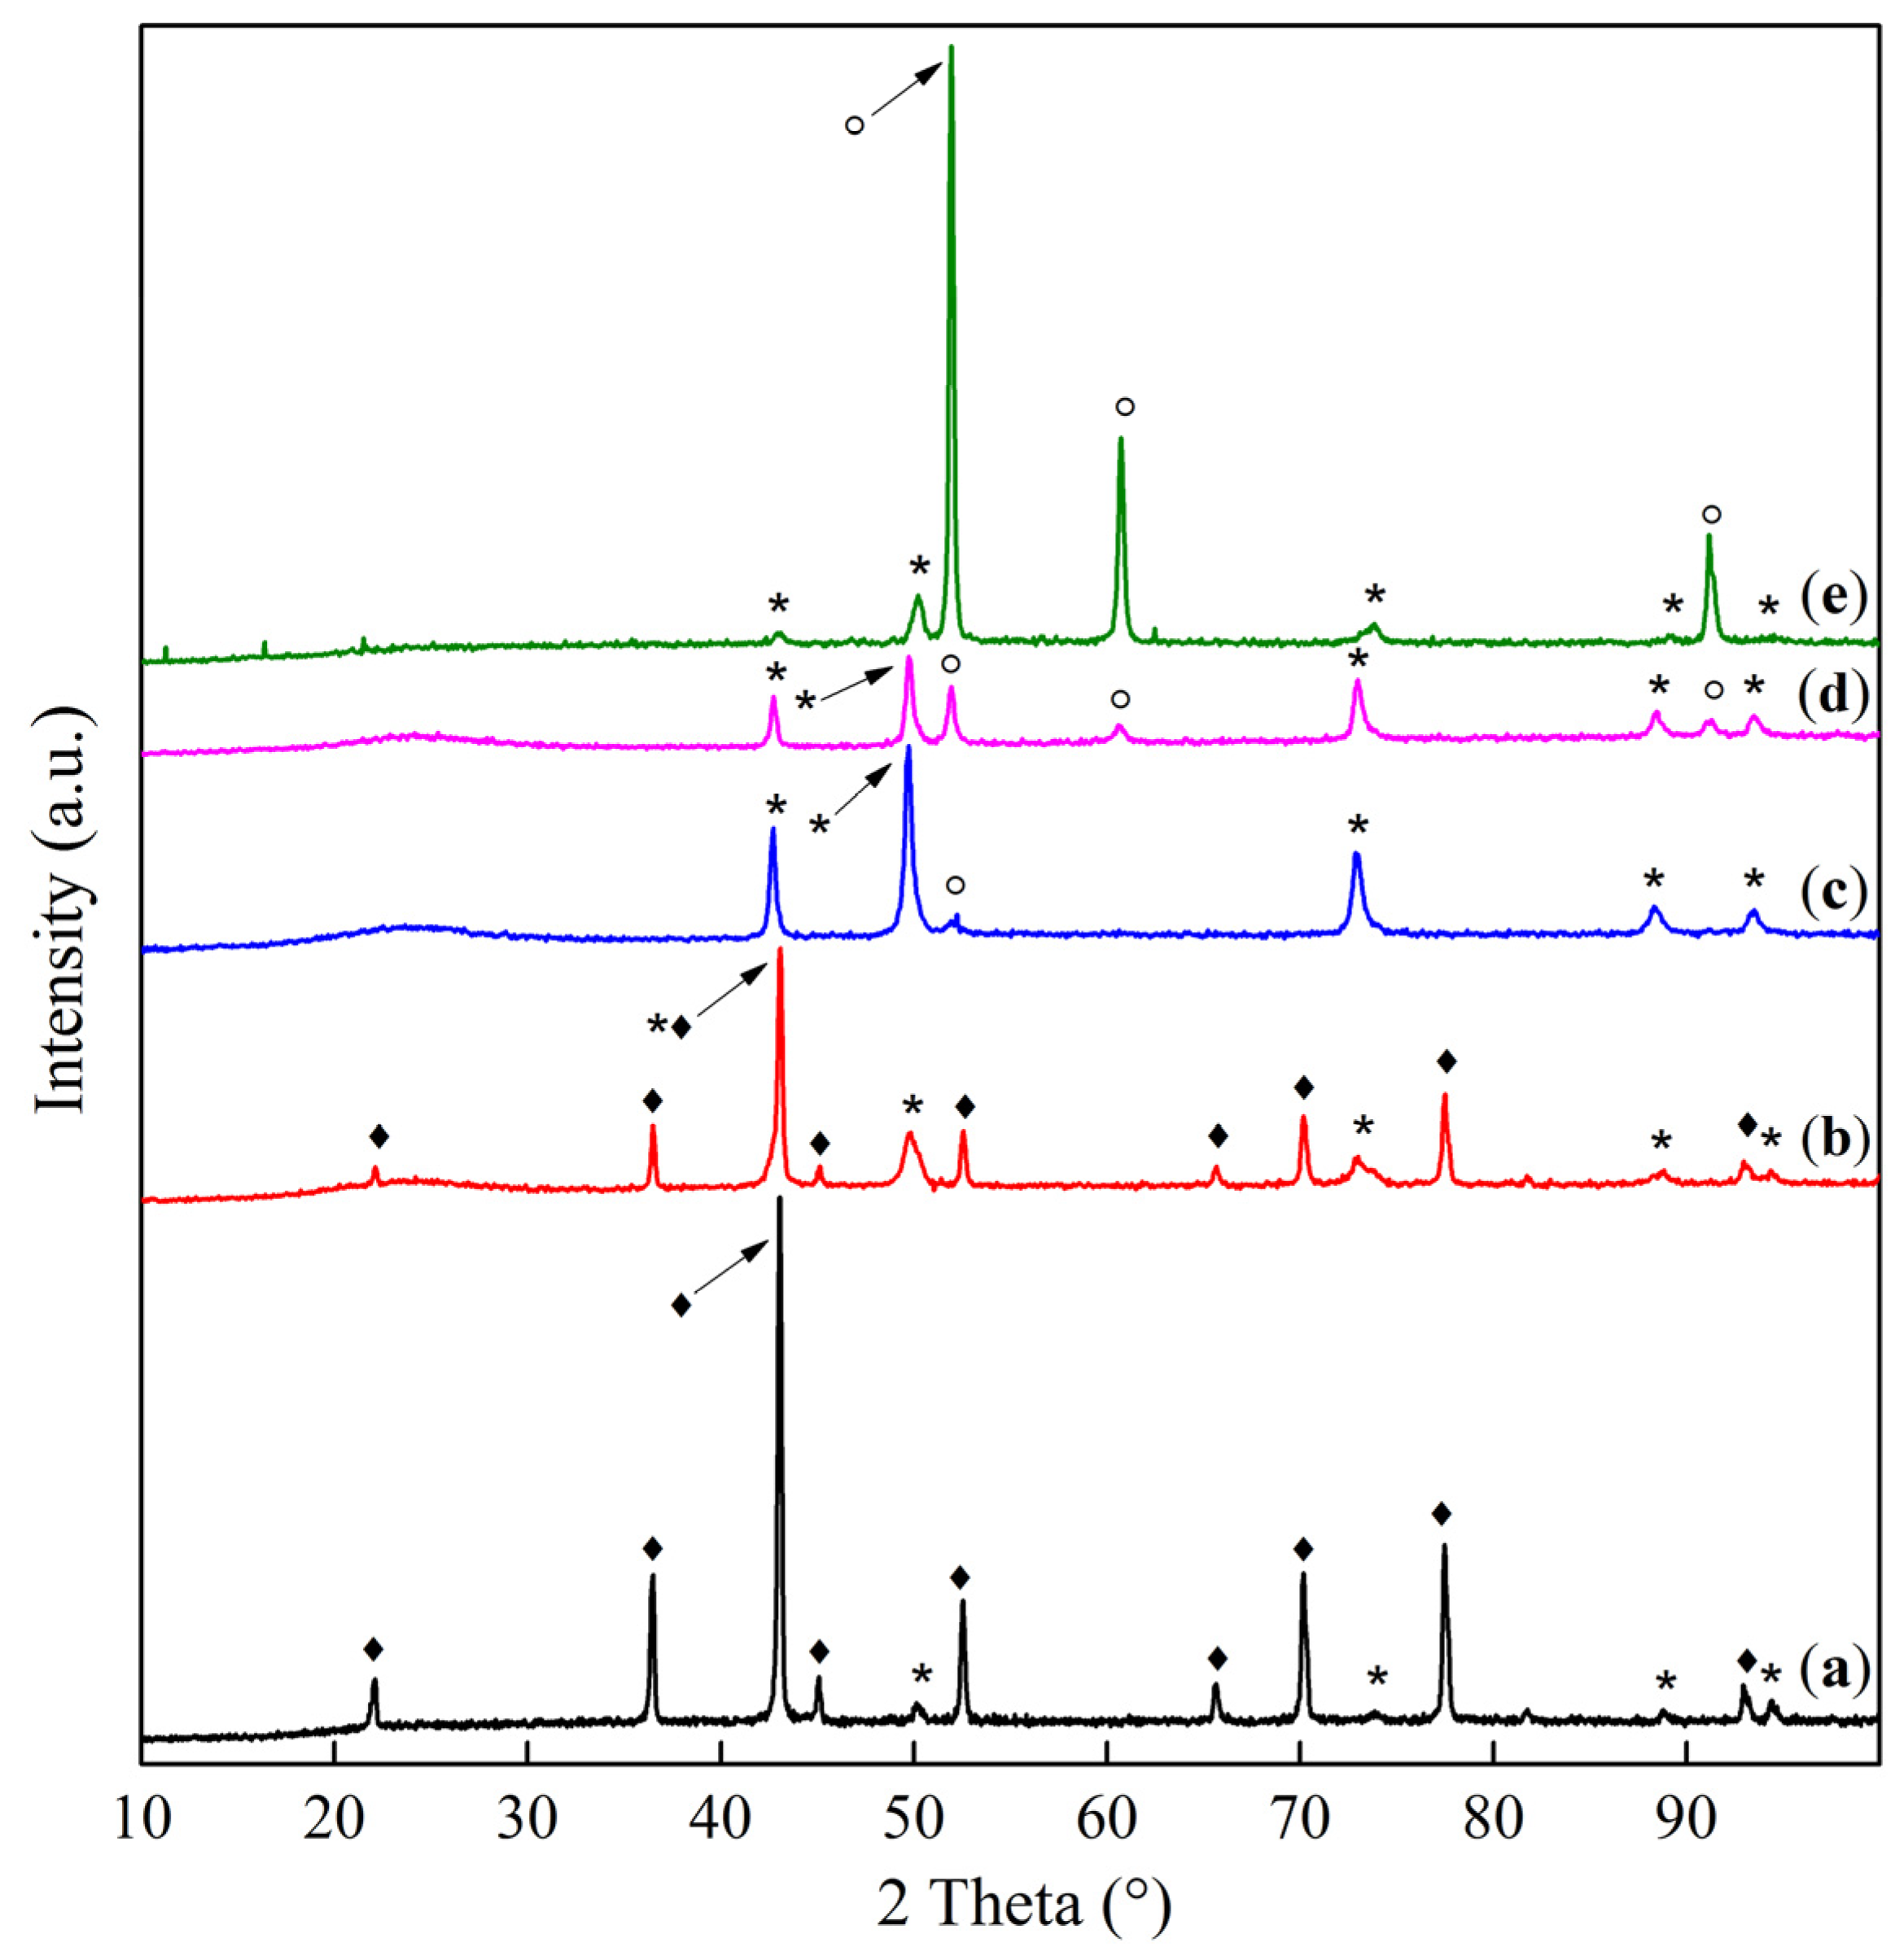
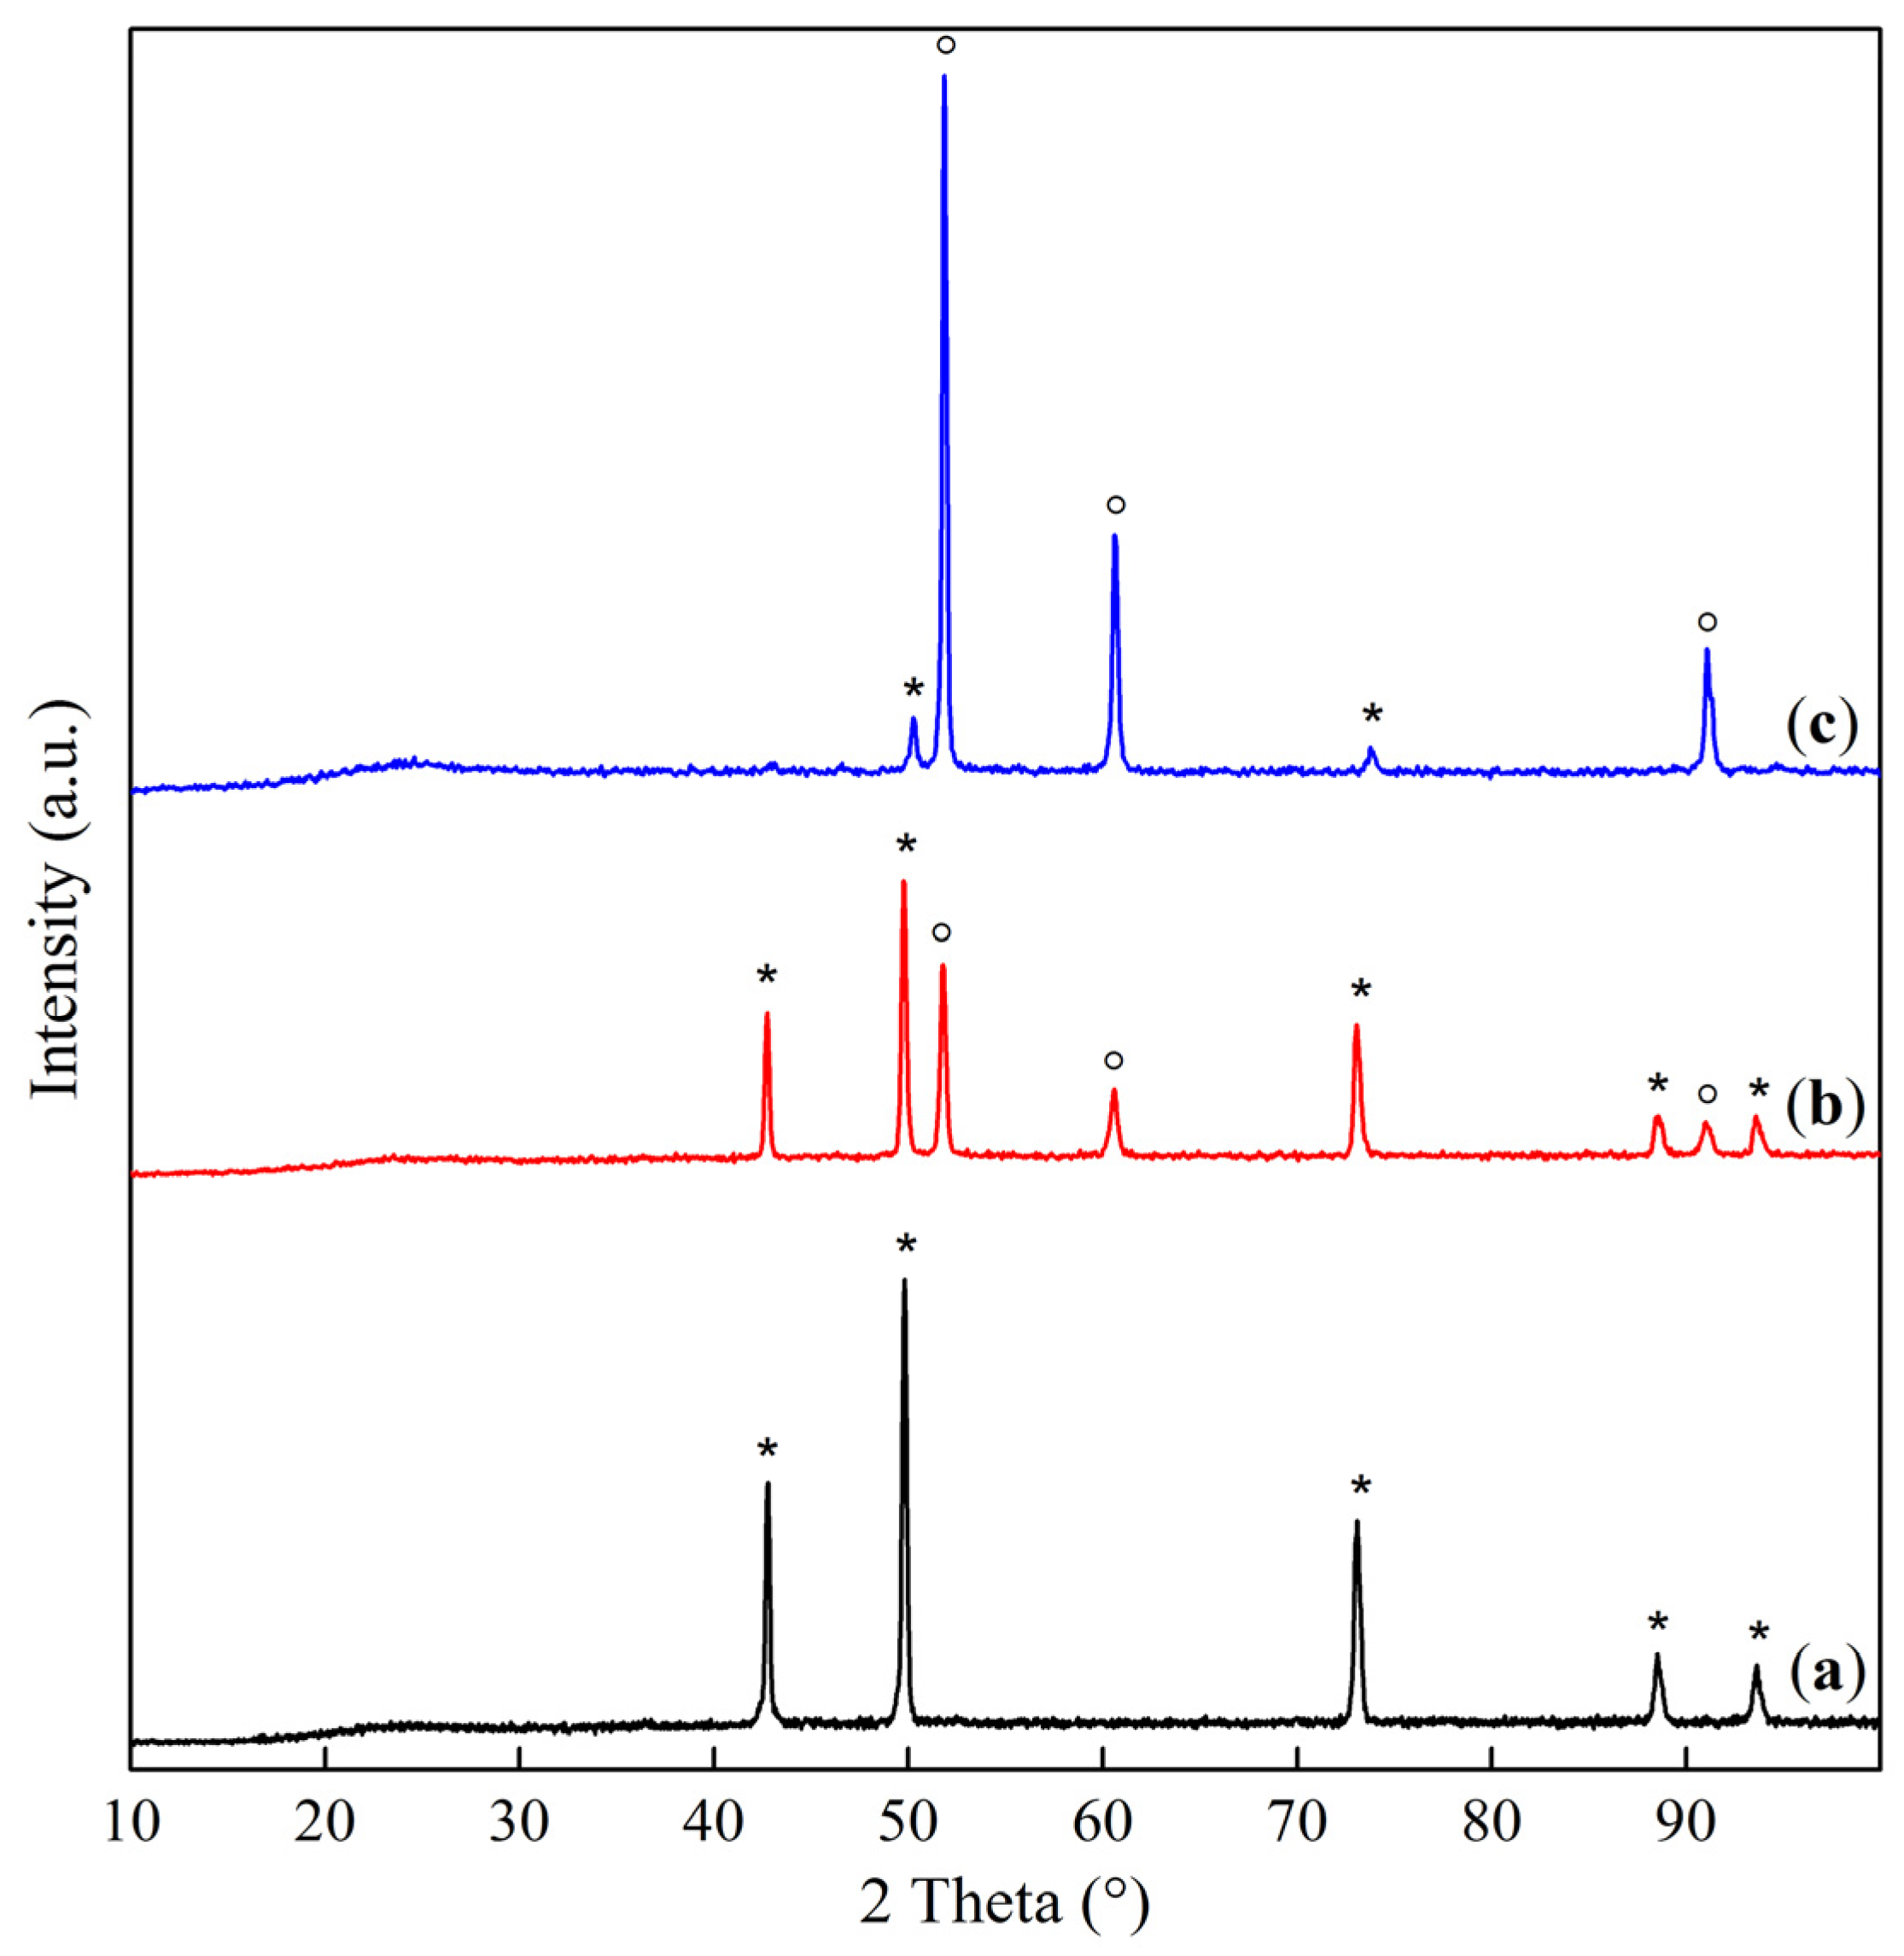
| Sample | Interplanar Distances (Å) | Lattice Parameter (Å) | Phase Composition |
|---|---|---|---|
| Co–Mg(300) | 2.8593, 2.4436, 2.0213, 1.5559, 1.4291 | 8.086 | MgCo2O4 |
| Co–Mg(400) | 2.8649, 2.4471, 2.0231, 1.5571, 1.4303 2.4471, 2.1118, 1.4912 | 8.095 4.223 | MgCo2O4 (Co, Mg)O, (MgO) |
| Co–Mg(550) | 2.8598, 2.4438, 2.0219, 1.5564, 1.4296 2.4438, 2.1112, 1.4883 | 8.088 4.219 | MgCo2O4 (Co, Mg)O, (MgO) |
| Co–Mg(650) | 2.8604, 2.4389, 2.0220, 1.5564, 1.4297 2.4389, 2.1094, 1.4963 | 8.089 4.219 | MgCo2O4 (Co, Mg)O |
| Co–Mg(750) | 2.8588, 2.4378, 2.0209, 1.5558, 1.4291 2.4378, 2.1139, 1.4951 | 8.085 4.228 | MgCo2O4, (Co, Mg)O |
| Co–Mg(800) | 2.8630, 2.4408, 2.0232, 1.5568, 1.4299 2.4408, 2.1221, 1.5002 | 8.093 4.244 | MgCo2O4 (Co, Mg)O |
| Co–Mg(900) | 2.8607, 2.4535, 2.0184, 1.5566, 1.4269 2.4535, 2.1247, 1.5020 | 8.086 4.249 | MgCo2O4 (Co, Mg)O |
| Co–Mg(1000) | 2.4542, 2.1254, 1.5029 | 4.251 | (Co, Mg)O |
| Co–Mg(1100) | 2.4543, 2.1256, 1.5028 | 4.251 | (Co, Mg)O |
| Co–Mg(1300) | 2.4585, 2.1283, 1.5041 | 4.256 | (Co, Mg)O |
| Co–Mg(1100 + 750) | 2.8625, 2.4466, 2.0284, 1.5614, 1.4363 2.4466, 2.1291, 1.5079 | 8.086 4.246 | MgCo2O4/Co3O4, (Co, Mg)O |
| Co3O4 | 2.8585, 2.4375, 2.0209, 1.5557, 1.4290 | 8.084 | Co3O4 |
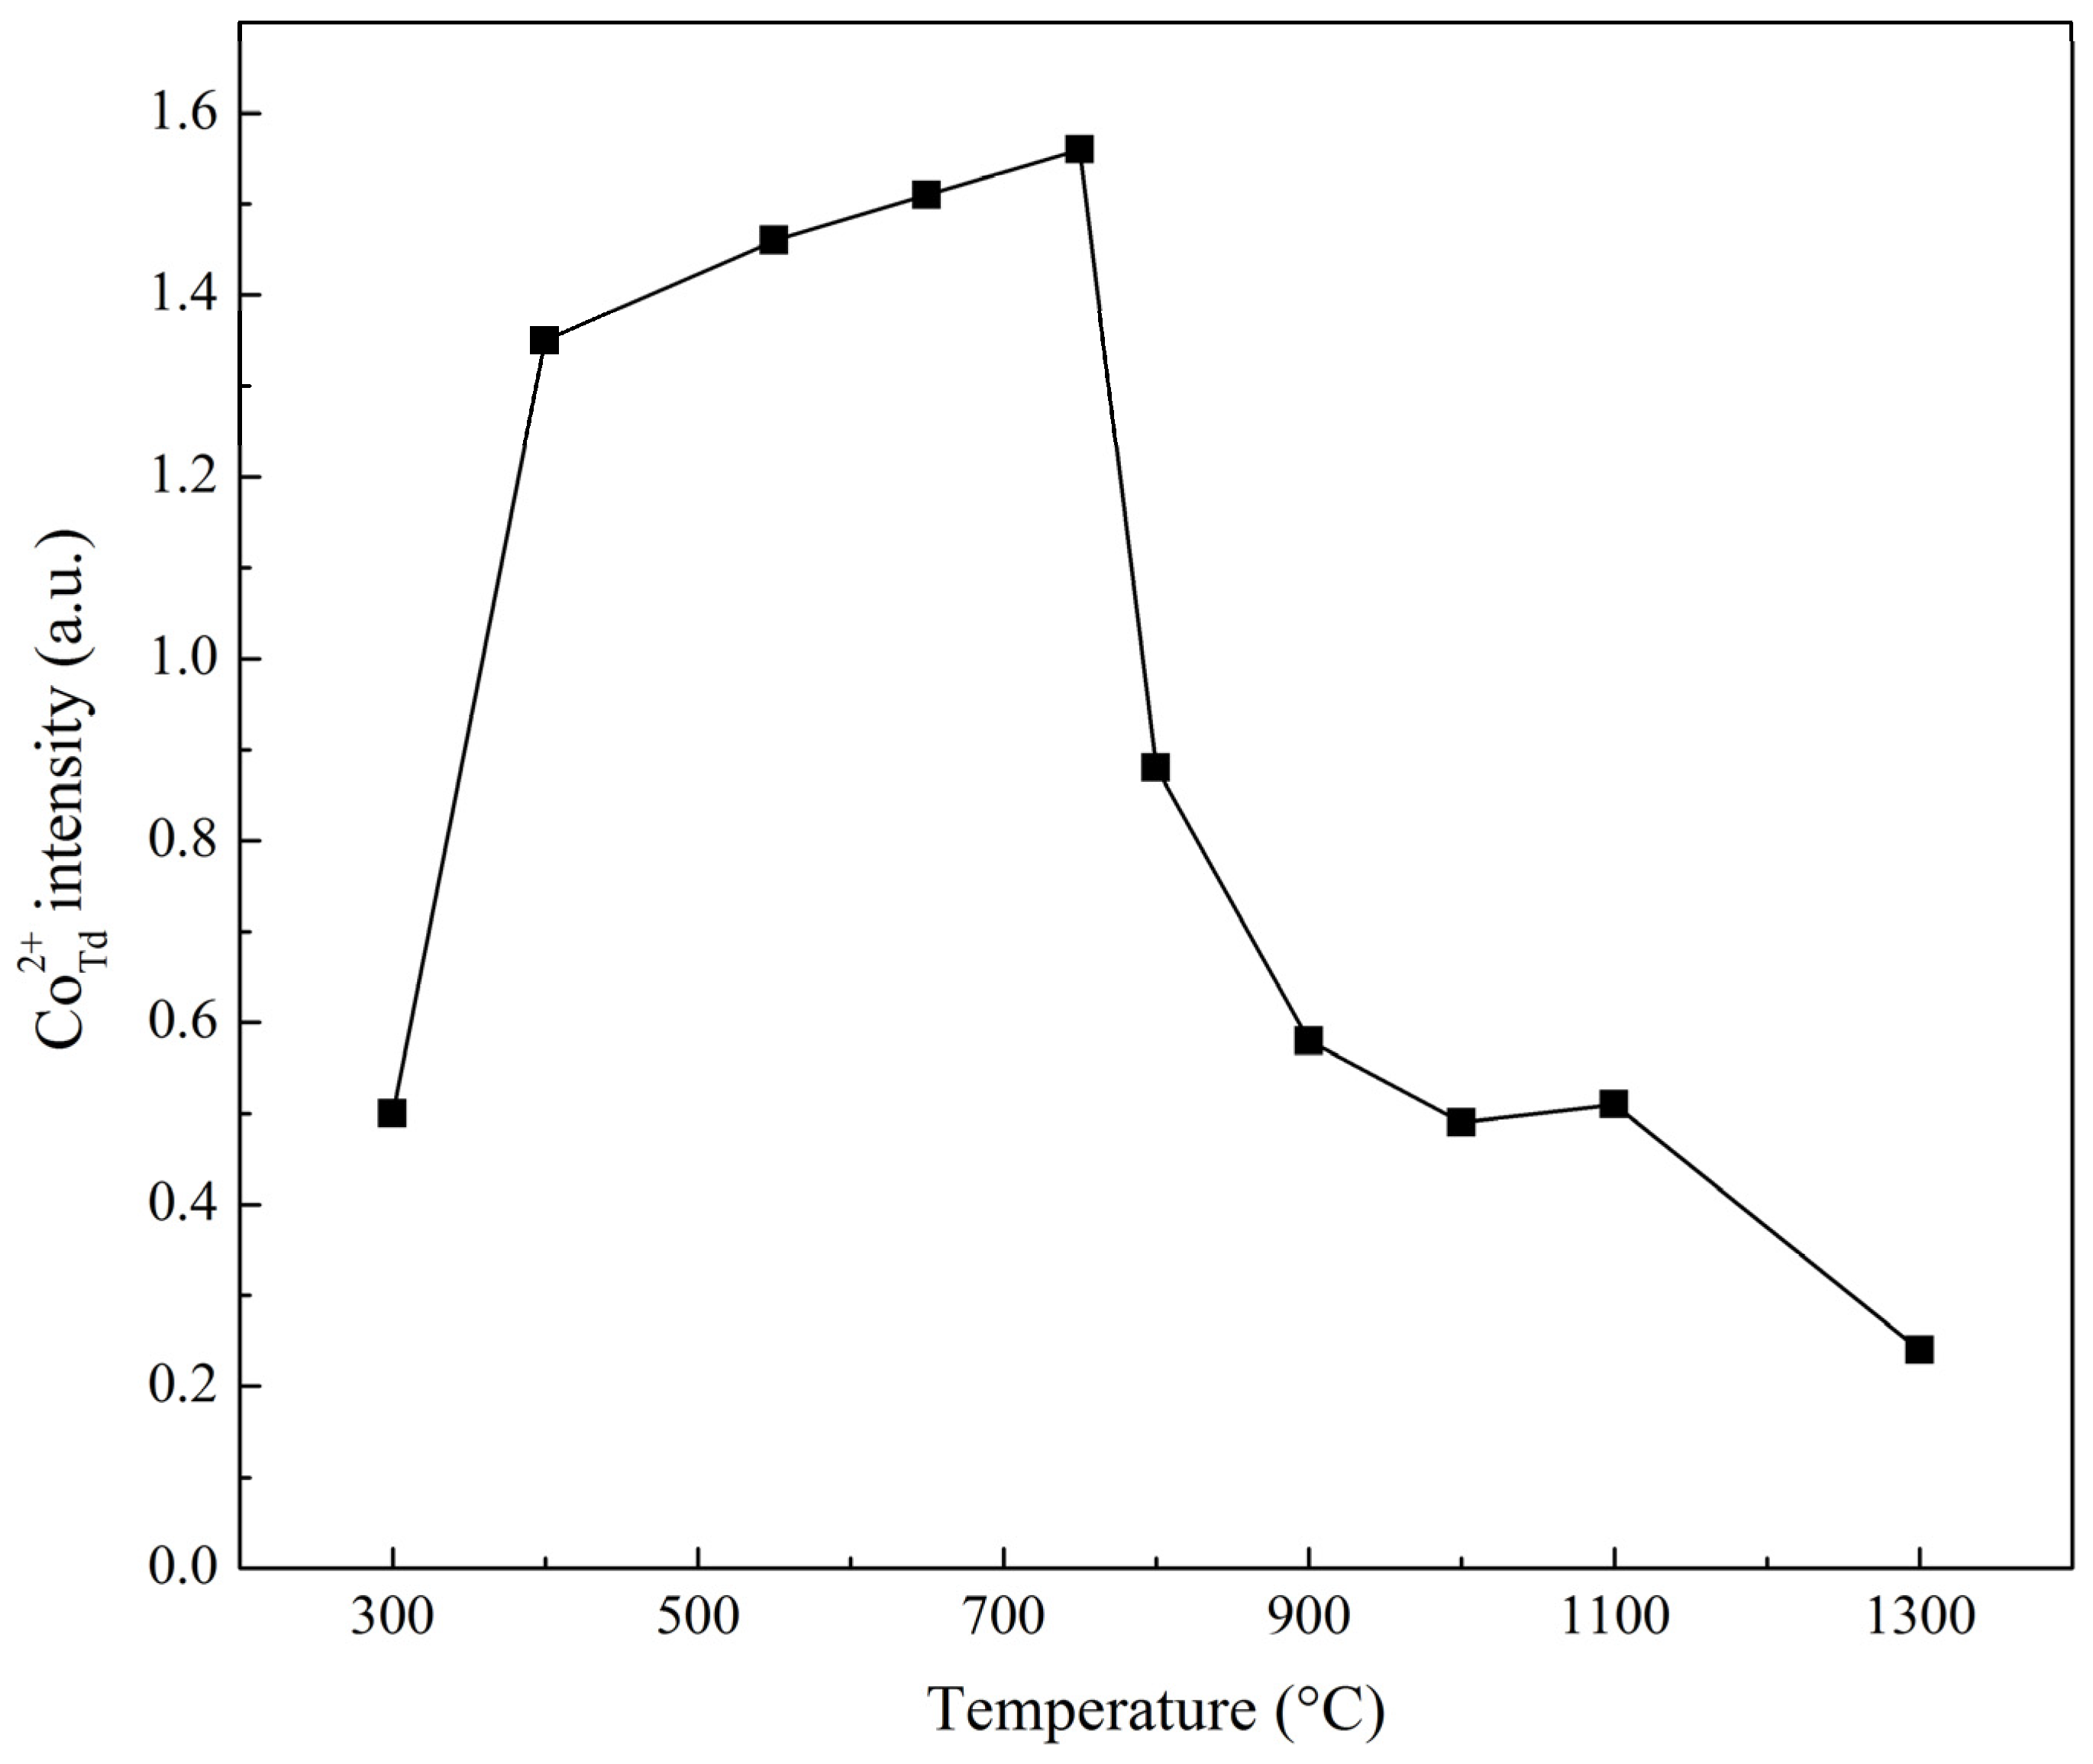
| Sample | Ratio of Signal and Standard Intensities |
|---|---|
| Co–Mg(300) | 0.50 |
| Co–Mg(400) | 1.35 |
| Co–Mg(550) | 1.46 |
| Co–Mg(650) | 1.51 |
| Co–Mg(750) | 1.56 |
| Co–Mg(800) | 0.88 |
| Co–Mg(900) | 0.58 |
| Co–Mg(1000) | 0.49 |
| Co–Mg(1100) | 0.51 |
| Co–Mg(1300) | 0.24 |
| Co3O4 | 6.63 |
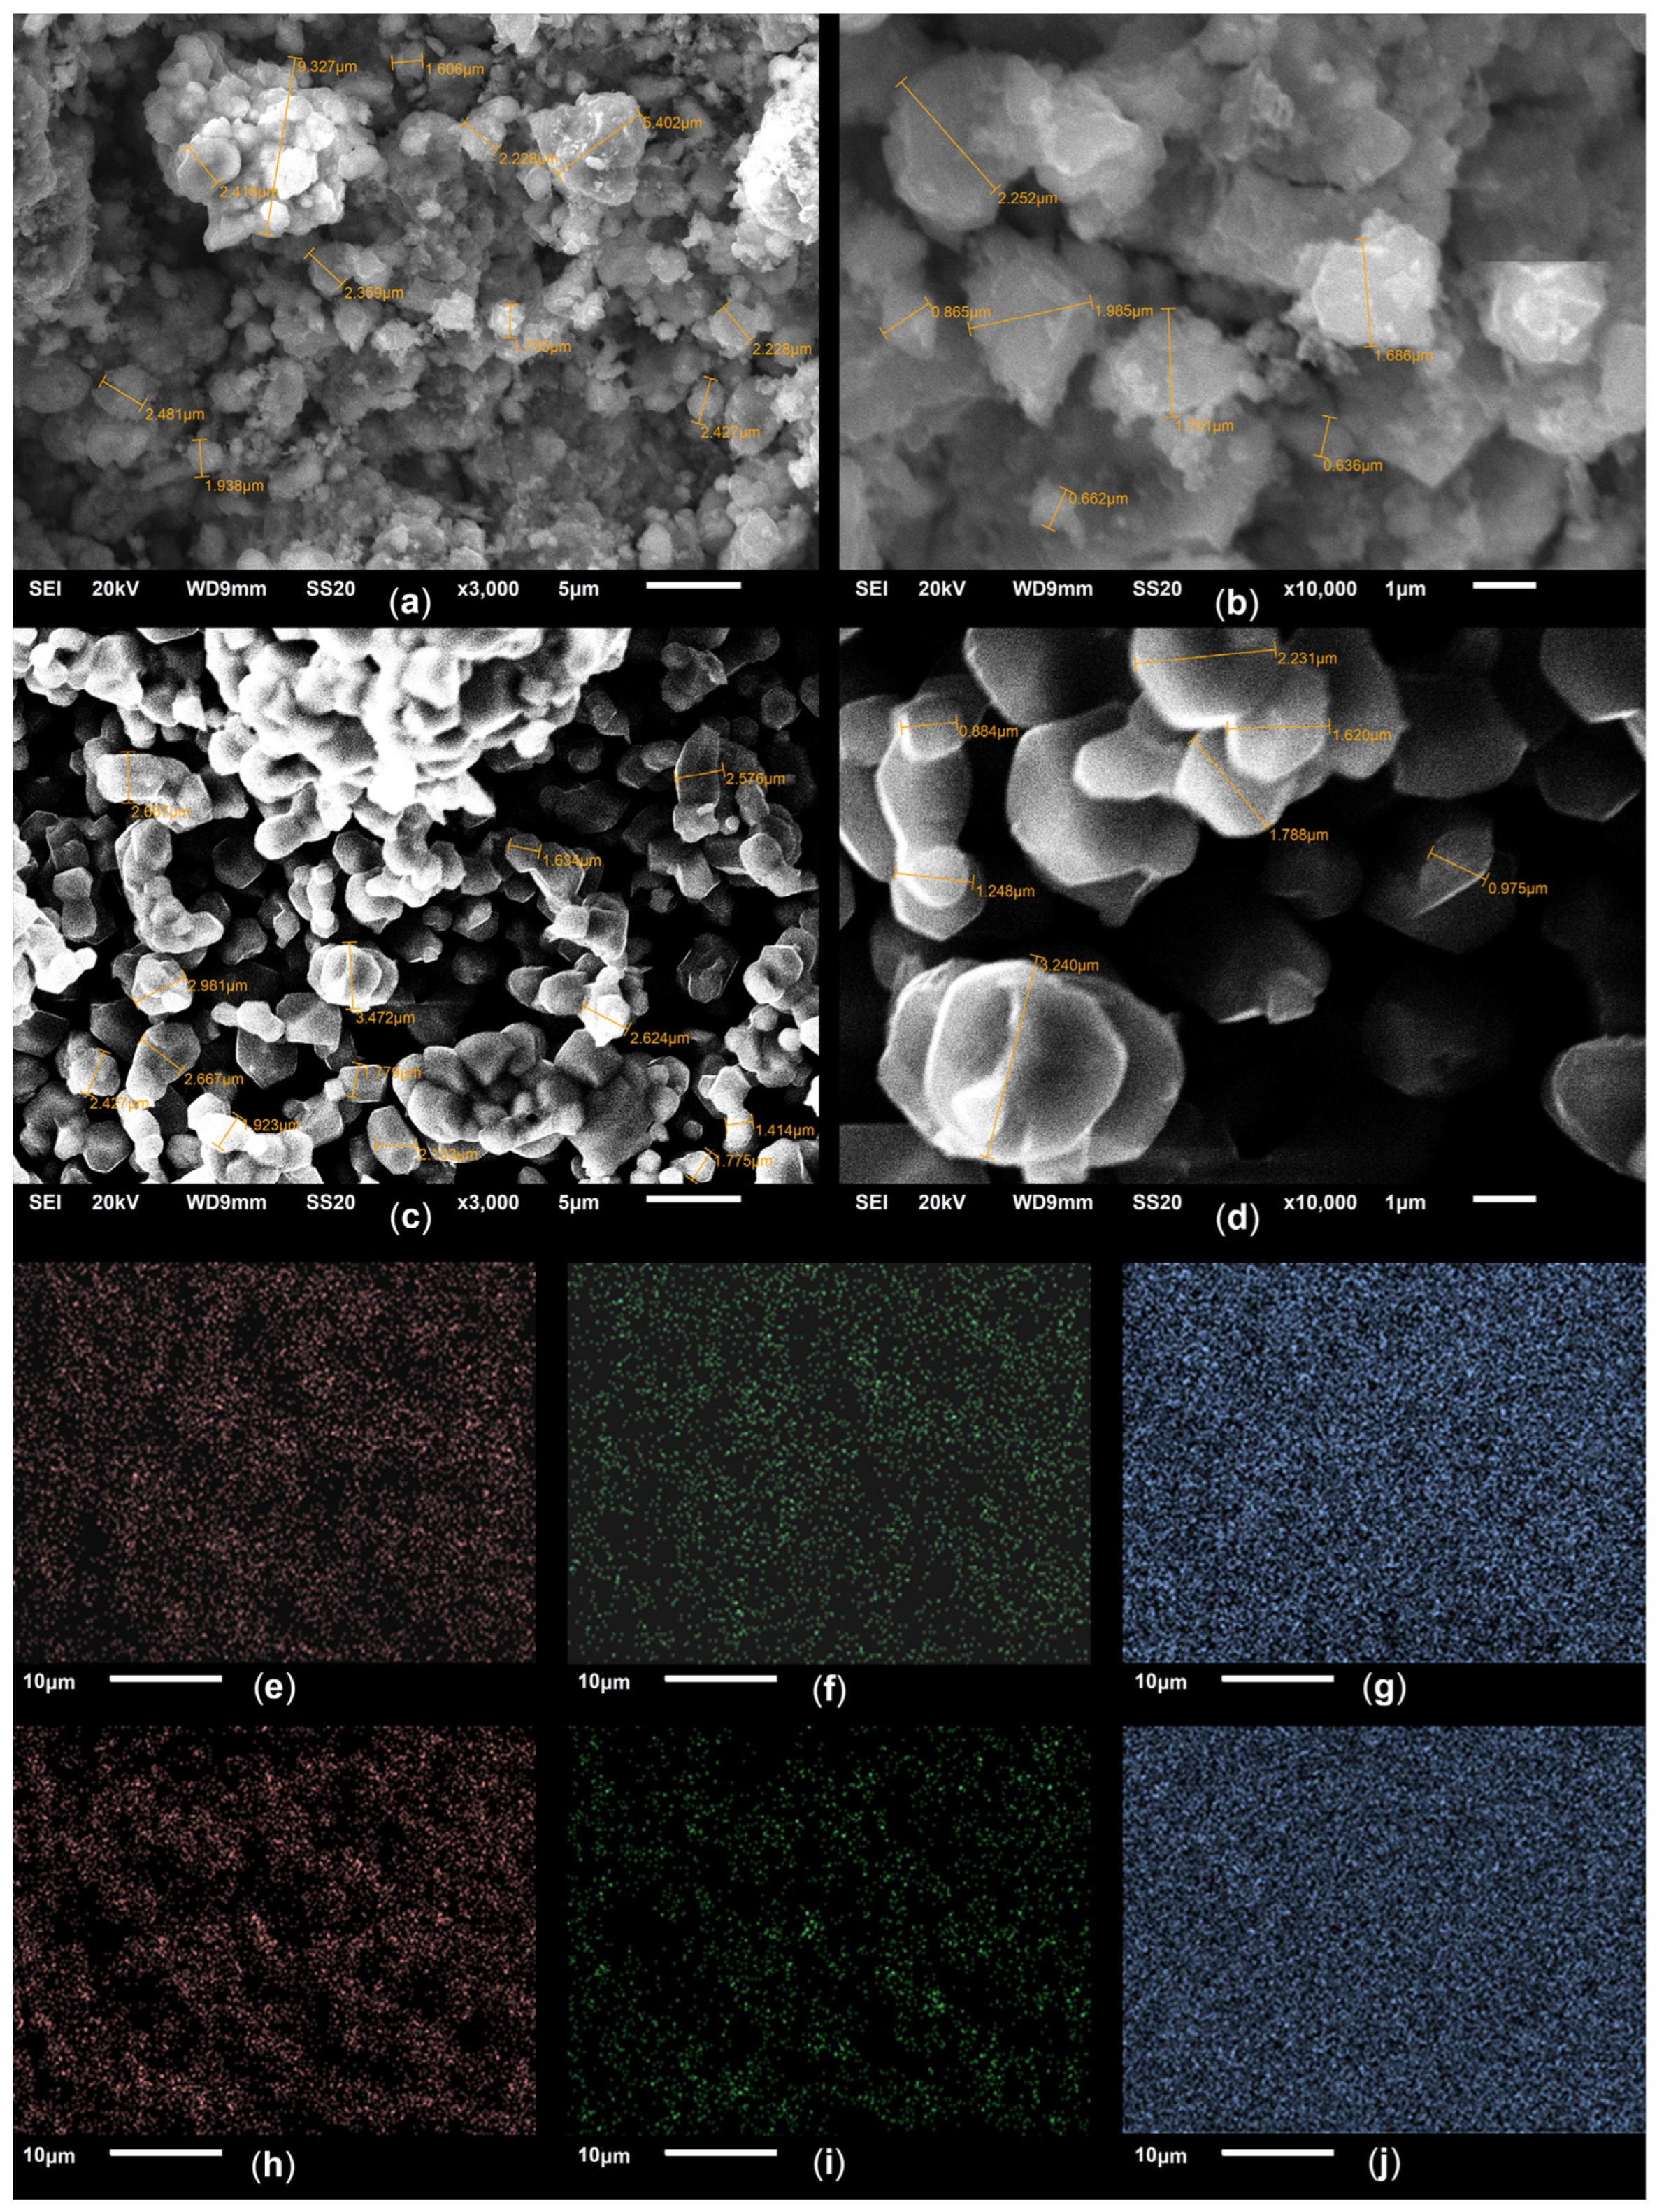
| Sample | Point of Analysis | Amount of Element per Unit Mg | Sum of Elements | ||
|---|---|---|---|---|---|
| O | Mg | Co | |||
| Co–Mg(400) | Point 1 | 1.54 | 1.00 | 1.24 | 3.78 |
| Point 2 | 1.78 | 1.00 | 1.28 | 4.06 | |
| Point 3 | 1.64 | 1.00 | 1.32 | 3.96 | |
| Average | 1.64 | 1.00 | 1.28 | 3.92 | |
| Co–Mg(750) | Point 1 | 1.85 | 1.00 | 1.61 | 4.46 |
| Point 2 | 1.90 | 1.00 | 1.81 | 4.71 | |
| Point 3 | 1.91 | 1.00 | 1.64 | 4.55 | |
| Average | 1.89 | 1.00 | 1.69 | 4.58 | |
| Co–Mg(1100) | Point 1 | 3.03 | 1.00 | 3.35 | 7.38 |
| Point 2 | 2.95 | 1.00 | 3.13 | 7.08 | |
| Point 3 | 3.05 | 1.00 | 3.24 | 7.29 | |
| Average | 3.00 | 1.00 | 3.24 | 7.24 | |
| Co–Mg(1100 + 750) | Point 1 | 3.30 | 1.00 | 6.09 | 10.39 |
| Point 2 | 3.14 | 1.00 | 4.59 | 8.73 | |
| Point 3 | 1.83 | 1.00 | 2.30 | 5.13 | |
| Average | 2.51 | 1.00 | 3.77 | 7.28 | |
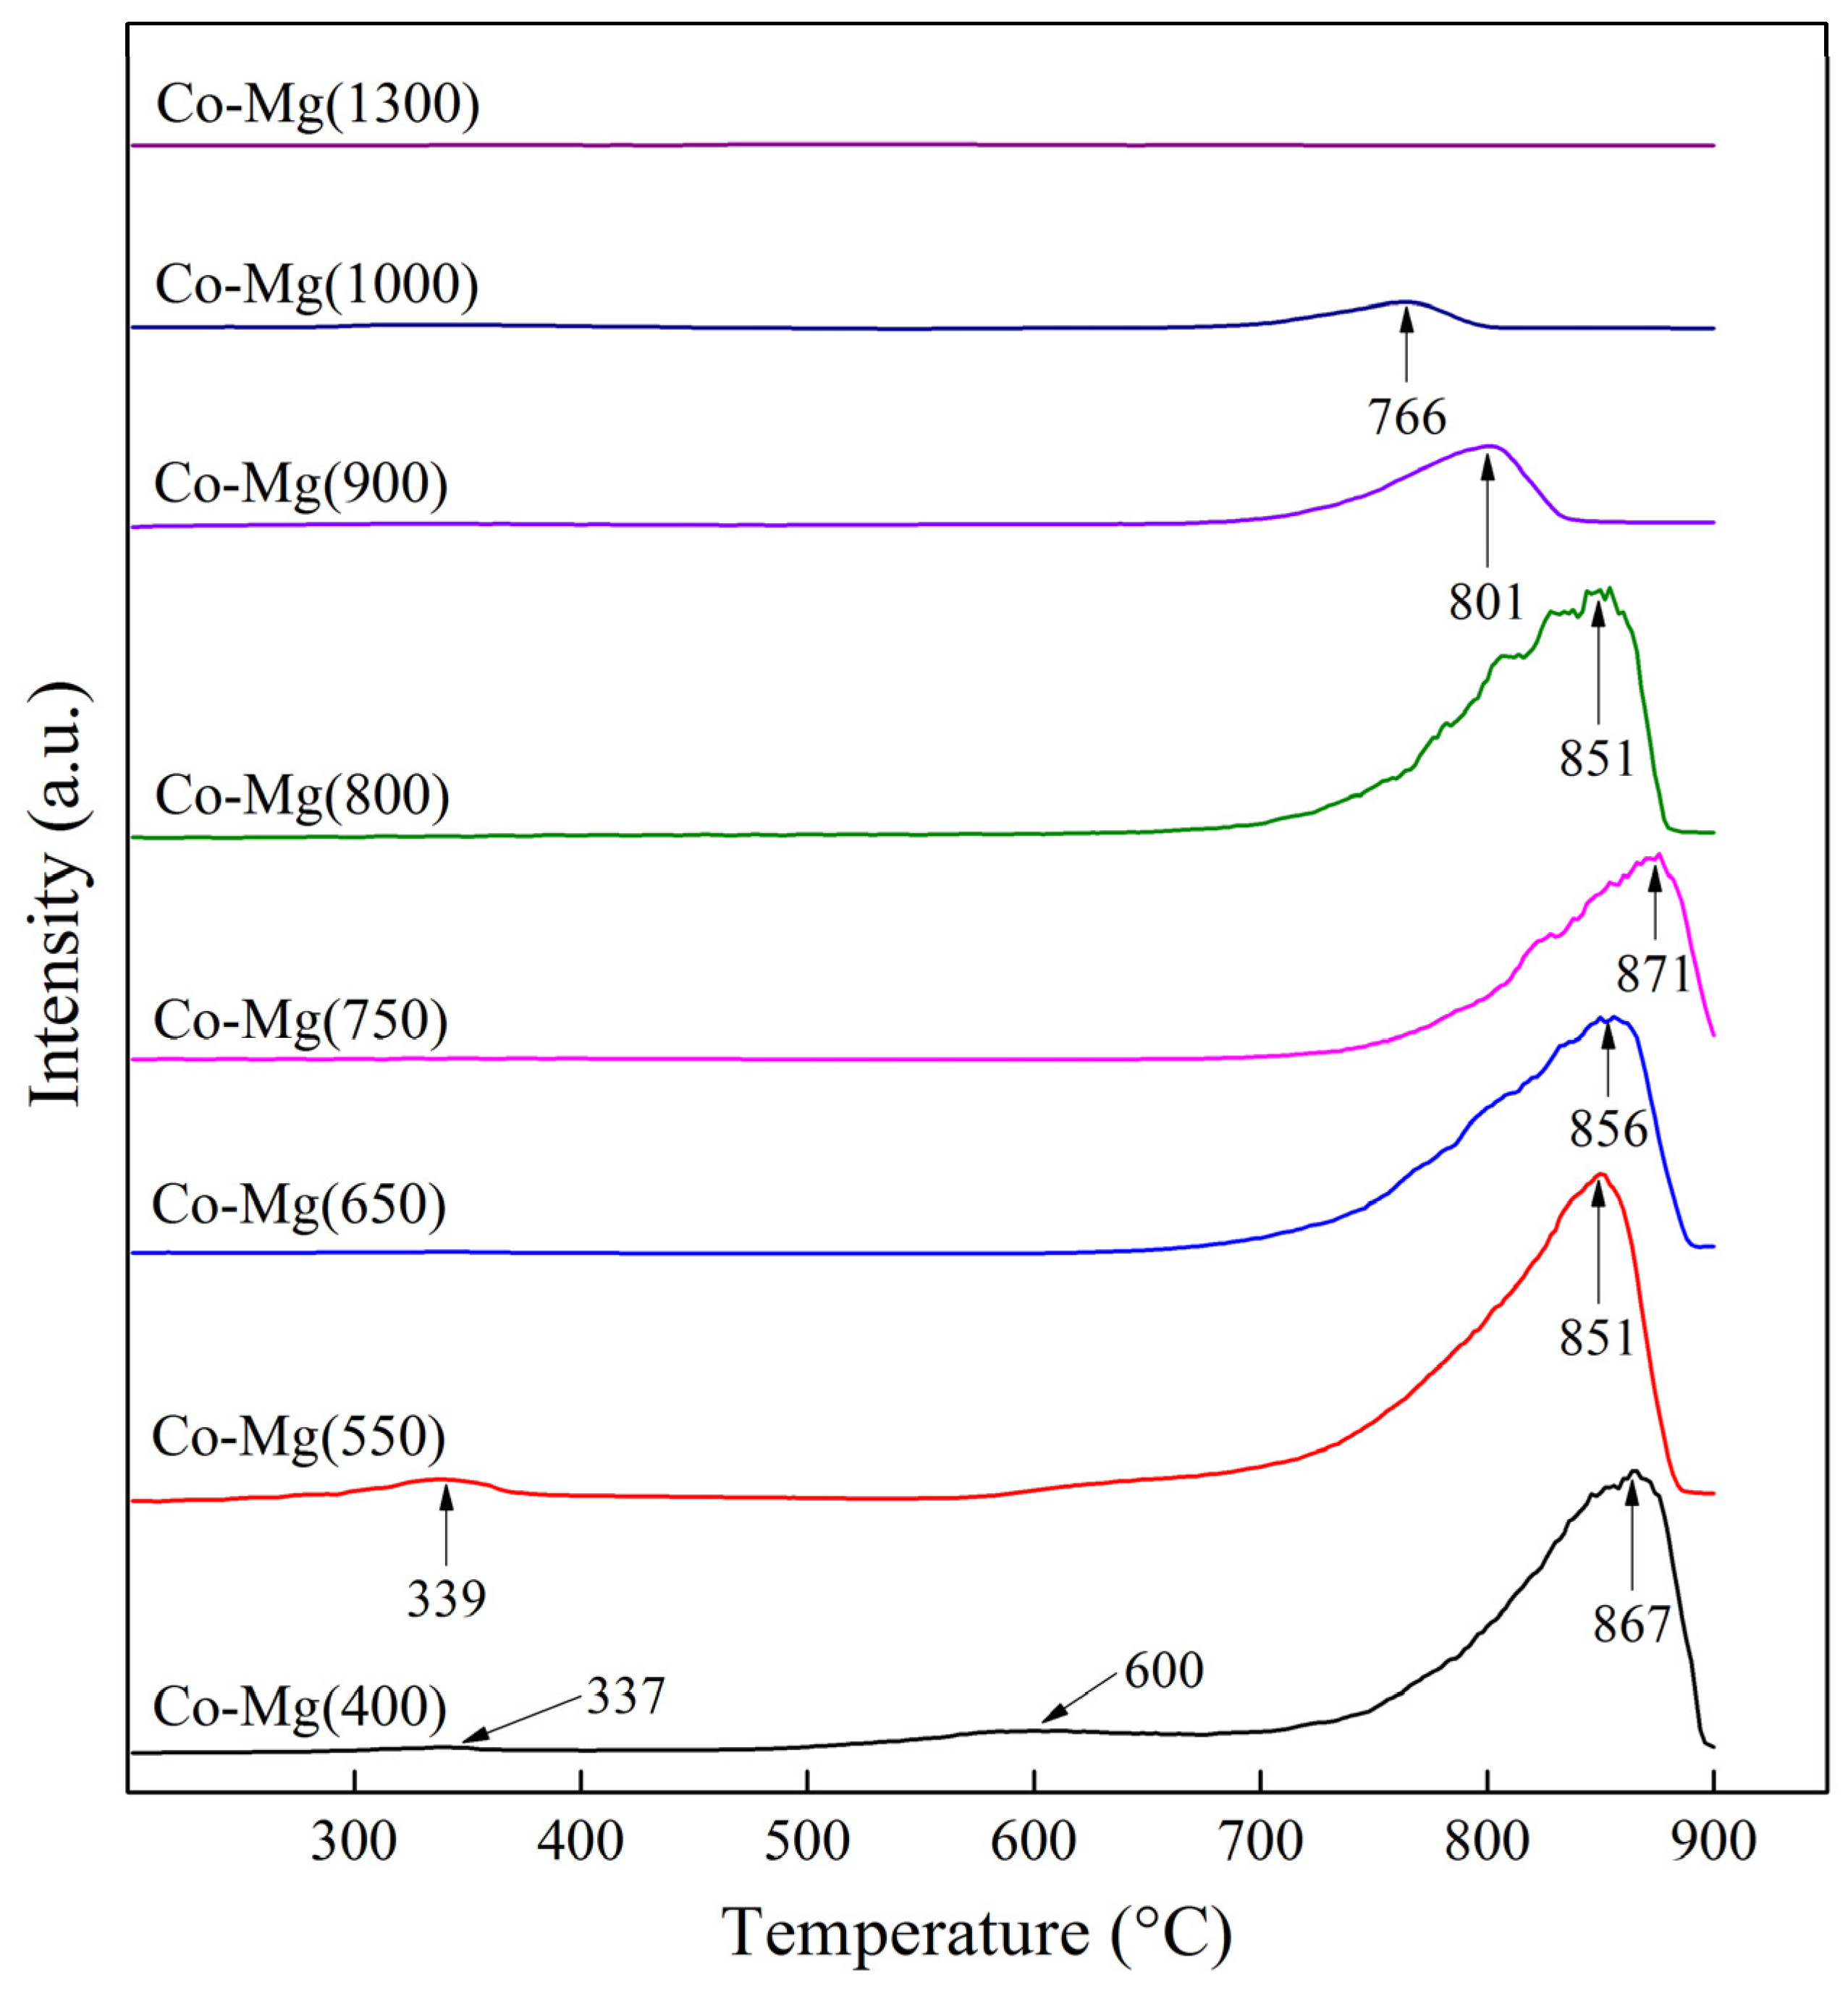
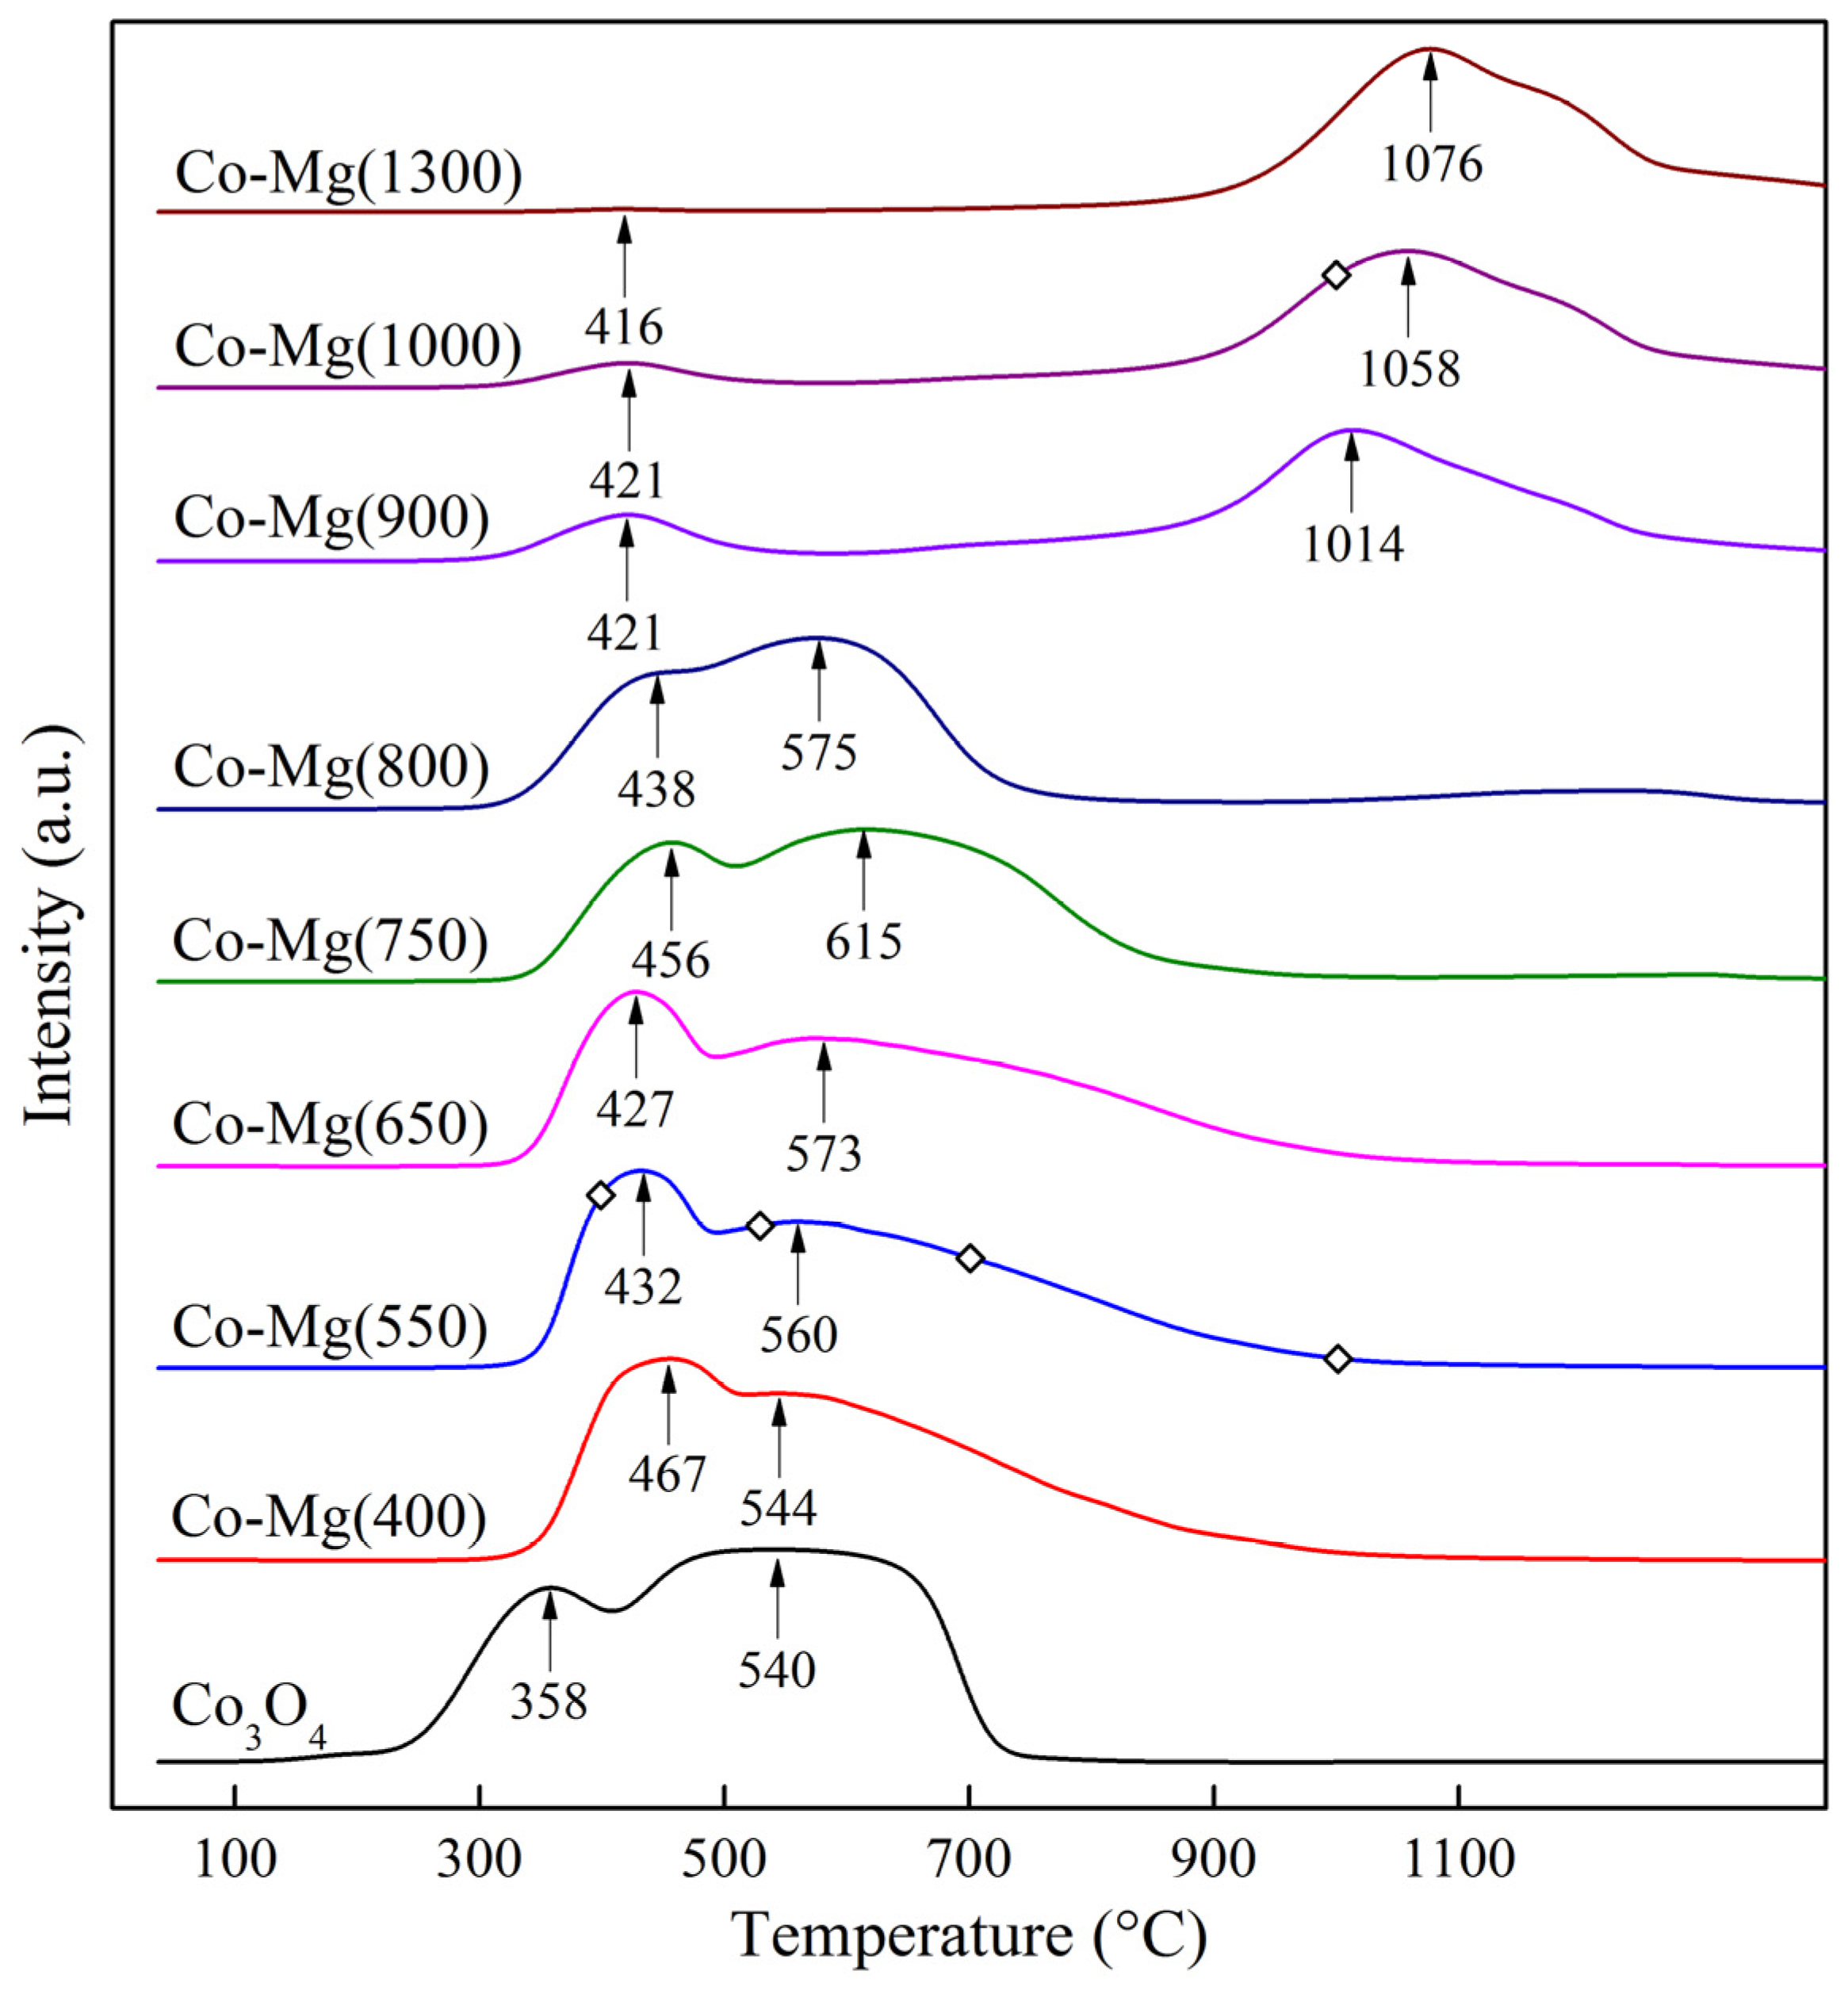
| Sample | Desorption Peak Temperatures (°C) | Volume of O2 Release in the Temperature Range (mL/g) | Activation Energies (kJ/mol) | |||||
|---|---|---|---|---|---|---|---|---|
| 1 | 2 | 3 | 1 | 2 | 3 | |||
| Co–Mg(400) | 337 | 600 | 867 | 14.32 | 652.50 | 49.1 | 80.6 | 168.0 |
| (200–450) | (500–900) | |||||||
| Co–Mg(550) | 339 | 651 | 851 | 58.60 | 719.92 | 44.0 | 116.1 | 142.3 |
| (200–450) | (550–900) | |||||||
| Co–Mg(650) | 335 | - | 856 | 8.02 | 516.79 | 9.5 | - | 192.0 |
| (200–450) | (600–900) | |||||||
| Co–Mg(750) | 343 | - | 871 | 8.22 | 459.03 | 11.0 | - | 212.5 |
| (200–450) | (600–900) | |||||||
| Co–Mg(800) | - | - | 851 | 11.43 | 500.64 | 17.5 | - | 203.8 |
| (200–450) | (600–900) | |||||||
| Co–Mg(900) | 328 | - | 801 | 18.44 | 150.99 | 18.8 | - | 201.3 |
| (200–450) | (600–900) | |||||||
| Co–Mg(1000) | 335 | - | 766 | 12.8 | 38.46 | 25.2 | - | 232.3 |
| (200–450) | (600–900) | |||||||
| Co–Mg(1300) | 365 | - | 695 | 2.40 | 6.20 | 10.4 | - | 213.9 |
| (200–450) | (500–900) | |||||||
| Temperature (°C) | Peak 1 | Peak 2 | Total Peak Area | Peak Area Ratio |
|---|---|---|---|---|
| Co3O4 | 4.51 | 13.10 | 17.61 | 1:2.90 |
| Co–Mg(400) | 5.53 | 9.34 | 14.71 | 1:1.69 |
| Co–Mg(550) | 4.81 | 10.04 | 14.86 | 1:2.09 |
| Co–Mg(650) | 4.20 | 10.25 | 14.48 | 1:2.44 |
| Co–Mg(750) | 3.57 | 9.74 | 13.32 | 1:2.73 |
| Co–Mg(800) | 2.82 | 9.48 | 12.29 | 1:3.36 |
| Co–Mg(900) | 1.49 | 9.71 | 11.19 | 1:6.52 |
| Co–Mg(1000) | 1.03 | 9.90 | 10.93 | 1:9.61 |
| Co–Mg(1300) | 0.07 | 9.76 | 9.83 | – |
| Sample | Specific Area (m2/g) | T50% (°C) | E (kJ/mol) |
|---|---|---|---|
| Co–Mg(550) | 9.6 | 492 | 62.1 |
| Co–Mg(750) | 7.7 | 513 | 74.9 |
| Co–Mg(900) | 3.8 | 521 | 81.8 |
| Co–Mg(1100) | 2.2 | 551 | 93.6 |
| Co(1)-Mg(1)(550) | 14.9 | 488 | 77.6 |
| Co(1)-Mg(1)(1100) | 2.8 | 560 | 99.2 |
Disclaimer/Publisher’s Note: The statements, opinions and data contained in all publications are solely those of the individual author(s) and contributor(s) and not of MDPI and/or the editor(s). MDPI and/or the editor(s) disclaim responsibility for any injury to people or property resulting from any ideas, methods, instructions or products referred to in the content. |
© 2024 by the authors. Licensee MDPI, Basel, Switzerland. This article is an open access article distributed under the terms and conditions of the Creative Commons Attribution (CC BY) license (https://creativecommons.org/licenses/by/4.0/).
Share and Cite
Zhylkybek, M.; Khussain, B.; Sass, A.; Torlopov, I.; Baizhumanova, T.; Tungatarova, S.; Brodskiy, A.; Xanthopoulou, G.; Rakhmetova, K.; Sarsenova, R.; et al. Cobalt–Magnesium Oxide Catalysts for Deep Oxidation of Hydrocarbons. Catalysts 2024, 14, 136. https://doi.org/10.3390/catal14020136
Zhylkybek M, Khussain B, Sass A, Torlopov I, Baizhumanova T, Tungatarova S, Brodskiy A, Xanthopoulou G, Rakhmetova K, Sarsenova R, et al. Cobalt–Magnesium Oxide Catalysts for Deep Oxidation of Hydrocarbons. Catalysts. 2024; 14(2):136. https://doi.org/10.3390/catal14020136
Chicago/Turabian StyleZhylkybek, Magira, Bolatbek Khussain, Alexandr Sass, Ivan Torlopov, Tolkyn Baizhumanova, Svetlana Tungatarova, Alexandr Brodskiy, Galina Xanthopoulou, Kenzhegul Rakhmetova, Rabiga Sarsenova, and et al. 2024. "Cobalt–Magnesium Oxide Catalysts for Deep Oxidation of Hydrocarbons" Catalysts 14, no. 2: 136. https://doi.org/10.3390/catal14020136
APA StyleZhylkybek, M., Khussain, B., Sass, A., Torlopov, I., Baizhumanova, T., Tungatarova, S., Brodskiy, A., Xanthopoulou, G., Rakhmetova, K., Sarsenova, R., Kassymkan, K., & Aubakirov, Y. (2024). Cobalt–Magnesium Oxide Catalysts for Deep Oxidation of Hydrocarbons. Catalysts, 14(2), 136. https://doi.org/10.3390/catal14020136