Article

Mechanisms for the Production and Suppression of Hydrogen Peroxide at the Hydrogen Electrode in Proton Exchange Membrane Fuel Cells and Water Electrolyzers: Theoretical Considerations

Hydrogen and Fuel Cell Nanomaterials Center, University of Yamanashi, 6-43 Miyamae-cho, Kofu 400-0021, Yamanashi, Japan
*
Author to whom correspondence should be addressed.
Catalysts 2024, 14(12), 890; https://doi.org/10.3390/catal14120890
Submission received: 2 October 2024 / Revised: 26 November 2024 / Accepted: 28 November 2024 / Published: 4 December 2024
(This article belongs to the Section Electrocatalysis)

Abstract

:
Hydrogen peroxide is inevitably produced at the hydrogen electrode in both the proton exchange membrane fuel cell (PEMFC) and the proton exchange membrane water electrolyzer (PEMWE) when platinum-based catalysts are used. This peroxide attacks and degrades the membrane, seriously limiting its lifetime. Here we review some of our previous efforts to suppress peroxide production using PtFe as a hydrogen evolution reaction (HER) catalyst and PtCo as a hydrogen oxidation reaction (HOR) catalyst. The mechanisms, which involve the chemical reaction of adsorbed hydrogen with oxygen, are examined using density functional theory. The onset of excess peroxide production at 0.1 V above the reversible potential has not been adequately explained thus far, and therefore a new mechanism is proposed here. This involves a unique reaction site including hydrogen adsorbed at (110) step edges adjacent to (111) terraces on the Pt surface, as well as on Pt alloys and other metals such as Rh and Ir. This mechanism helps explain the recent finding of the Wadayama group that Ir single crystal surfaces such as Ir(111) and Ir(110) produce little peroxide during the HOR. It also points the way toward the design of new catalysts for the hydrogen electrode that suppress peroxide production while retaining high HOR and HER activity.

Graphical Abstract

1. Introduction

Proton exchange membrane fuel cells (PEMFCs) and water electrolyzers (PEMWEs) are both expected to play important roles in the highly anticipated “hydrogen economy” or “hydrogen society” [1,2]. In order to accelerate their widespread acceptance, however, their costs must be lowered. One strategy that can be effective in lowering costs is to lengthen the lifetime, which decreases the total cost of ownership (TCO) [3]. A key factor in limiting lifetime is degradation due to the undesired production of hydrogen peroxide at the negative (hydrogen) electrode, which can directly attack cell components, including the catalyst support and membrane. The problem arises because oxygen can diffuse easily through the membrane from the positive electrode, and, although it is partly reduced to water, it is also partly reduced to hydrogen peroxide in a two-electron process.
O2 + 2H+ + 2e → H2O2 E0 = 0.685 V vs. SHE
O2 can also react chemically with adsorbed hydrogen:
O2 + 2Had → H2O2
which could occur either with O2 already adsorbed (Langmuir–Hinshelwood mechanism) or with O2 diffusing from the gas or liquid phase (Eley–Rideal mechanism). The generated peroxide can also decompose into two ·OH radicals in the presence of metallic ions, and these radicals are extremely reactive:
H2O2 → 2·OH
Thus far, we have identified two different specific pathways involving either underpotentially deposited hydrogen (HUPD), which has been proposed to be H within the plane of the top layer of Pt atoms [4] or bridging H [5,6], or overpotentially deposited hydrogen (HOPD), which has been generally agreed upon to be on-top H [4,5,6]:
Pathway 1—direct HOPD
O2 (chemisorbed) + HOPD → HO2,ad
O2 (physisorbed) + HOPD → HO2,ad
HO2,ad + HOPD → H2O2 (free)
Pathway 2—activation of HUPD
HUPD → HOPD
HOPD + O2 (end-on) → HO2,ad
HO2,ad + HOPD → H2O2 (free)
Based on these pathways, it was hypothesized that it would be possible to minimize peroxide production by decreasing the amount of adsorbed H [7]. In earlier work, it had been found that Pt–M alloys, where M = Fe, Co or Ni, adsorb H less strongly than pure Pt [8]. Thus, PtFe was examined and found to suppress peroxide production during the hydrogen evolution reaction (HER) (Figure 1A and Figure S1), based on the lower coverage of both HUPD and HOPD, as calculated with density functional theory (DFT). It was found that the presence of O2 interfered with the HER due to the stronger adsorption of O2 than H, but this effect is relatively small due to the effective O2 pressure, which is much less than 1 atm, and the low percentage of 2-electron reduction to H2O2. The most serious effect of the presence of O2 is the membrane degradation caused by hydroxy radicals generated via H2O2 decomposition. Thus, the finding that the use of the Pt–Fe HER catalyst was effective in mitigating the degradation of the Nafion membrane and to prolong the cell operation is very important [7].
It was also realized that a lower coverage of HUPD would provide more adjacent Pt sites for the bridged configuration of adsorbed O2, which we have proposed to be an obligatory reactant in the 4-electron oxygen reduction reaction (ORR) [9,10]. This topic will also be examined in greater detail in the present work.
Figure 1. Experimental evidence for H2O2 production at low potentials in acid solution obtained with a channel-flow double-electrode system, in which O2 can be reduced at the working electrode, with varying potential, and H2O2 is detected at the collecting electrode, which is set at a potential at which H2O2 is oxidized. (A) Potential dependence of H2O2 oxidation current density for various catalysts measured in O2-saturated 0.1 M HClO4 solution at 80 °C, Pt black, commercial Pt/C and PtxAL–PtFe/C, where AL is an abbreviation for “atomic layers,” [7]; (B) potential-dependent H2O2 oxidation current density, j(H2O2), for commercial Pt/C and PtxAL–PtCo/C, measured in 10% air/H2-saturated 0.1 M HClO4 at 80 °C; (C) hydrodynamic voltammograms for the ORR in O2-saturated 0.1 M HClO4 at Nafion-coated PtxAL–PtCo/C and commercial-Pt/C electrodes at 80 °C. The commercial catalyst, c–Pt/C in panel A was TEC10E50E (E-type carbon, 50 wt% Pt), while that in panels B and C was TEC10F30E (F-type carbon, 30 wt% Pt). All data were obtained at a flow rate of 111 cm s−1 and a potential scan rate of 5 mV s−1. The Pt collecting electrode was held at a potential of 1.4 V [7,11].
Catalysts 14 00890 g001
It was subsequently found that a Pt–Co catalyst for the hydrogen oxidation reaction (HOR) suppressed peroxide production at low potentials [11,12] (Figure 1B,C). As seen in Figure 1C, there are two potential regions with different hydrogen peroxide production behavior: one that commences at ca. 0.5 V, and a second with higher slope that commences at ca. 0.1 V. It was thought at that time that HOPD formed at potentials as high as 0.1 V.
Figure 2 shows the DFT-calculated reaction profile for Pathway 1, reaction 4, in which O2 is adsorbed at the (110) step on a model Pt(221) surface, which we have found to capture some of the characteristics of a Pt nanoparticle. Adsorbed HOPD reacts to produce HO2,ad as the first step in the overall peroxide production. The activation energy for this reaction on the Pt–Co(221) surface was calculated to be 0.60 eV, much larger than that on pure Pt(221), 0.28 eV. However, it was later realized that this pathway should be expected to be most important at potentials below 0.0 V vs. a reversible hydrogen electrode (RHE), where HOPD, i.e., on-top H on (111) terraces, is predicted to exist on the Pt surface [13].
Figure 3 shows Pt(111) surfaces with full coverage (θH = 1) of bridging H in a hexagonal array, which was identified as HUPD by Ishikawa and coworkers [5,6]. The open Pt atoms within each hexagon are the sites at which on-top H attaches at more negative potentials, as seen on the right (B). The latter were identified as HOPD. At less negative potentials, at which HOPD has not yet formed, these sites are open and can accommodate O2 adsorption, as in Pathway 2, reaction 6, involving end-on (Pauling configuration) O2 adsorption. This pathway can account for peroxide production in the potential range in which HUPD exists on Pt(111), as clearly shown by Markovic et al. [14] and as can be observed at higher potentials in Figure 1C (upper panel). Thus, an HUPD must be activated to the HOPD state by breaking one Pt–H bond. This process is seen to require an activation energy of ca. 0.2 eV. However, even though the reaction is written in two steps, Equations (7) and (8), as seen in Figure 4, it is actually a concerted process, in which the two steps occur simultaneously. Interestingly, MacNaughton et al. found in situ evidence using X-ray absorption spectroscopy and XPS for a peroxo species on hydrogen-covered Pt(111) in contact with O2 [15]. Their results indicated that the O–O bond was parallel to the surface, whereas the O–H bond was perpendicular to the Pt surface, similar to the configuration shown in Figure 4 for HO2,ad.
Corresponding calculations for the PtCo system are still in progress. These are challenging due to the computational difficulty, since a 6 × 6 unit cell would have been required to accommodate the underlying Pt3Co lattice. In addition, the spin introduced by Co leads to problems with scf convergence. Nevertheless, it can be expected that the activation energy would be significantly smaller due to the initially smaller HUPD adsorption energy, as previously reported for Pt/Pt3Co(221) [8].
As already noted above, peroxide production begins to increase at potentials as high as 0.5 V vs. RHE. This could be partly due to the effect of the carbon support, which contains quinone functional groups that are known to catalyze peroxide production [16]. However, this current is much smaller for the PtCo catalyst in this potential range, which would not be expected if the support surface were producing most of the peroxide. Therefore, the diminished peroxide production is most likely due to the lower HUPD coverage. In previous work, we showed results for a Pt black catalyst [12]. The peroxide production on the latter surface was quite small, but this was due to the low surface area. In fact, it was shown that the peroxide production rate at 0.0 V was highly linear versus the electrochemical surface area, suggesting that the reaction, at least, at this potential, is not structure-sensitive, meaning that essentially every surface Pt atom can be an active site. Even on Pt black, there was a detectable peroxide oxidation current beginning at ca. 0.08 V [12]. As mentioned above, according to the HOPD/HUPD model developed by Ishikawa and coworkers, HOPD should only appear at potentials below 0.0 V, because the HUPD coverage is still not complete at that potential, reaching only ca. 0.66 [17,18]. Thus, we have sought to devise a new mechanism for peroxide production that involves the formation of the Had species that exists on (110) steps, which appears at ca. 0.1 V in the cyclic voltammogram in the absence of O2 and which is the same as the precursor to the HER [19]. This will be the main subject of the present work.
Our proposed third pathway is thus:
Pathway 3—reduction by H(110),step
O2,ads + H(110),step → HO2,ads
HO2,ads + H(110),step → H2O2 (free)
This mechanism has two interesting aspects: (1) it accounts for the onset of peroxide production at 0.1 V, where the type of HOPD that exists on (111) facets would not have significant coverage, and (2) it provides a unique geometry, in which an end-on adsorbed O2 would be in very close proximity to the active H(110),step, as shown later. We should also note here that our original rationale to consider HOPD as the reactant (Pathway 1) was based on the well-known infrared signature (2080 cm−1) of on-top hydrogen that is found in situ at ca. 0.1 V in acid solution on polycrystalline Pt [20,21]. However, as shown by Santana and Ishikawa, this spectral peak is actually not due to the type of on-top H found on (111) terraces (Figure 3). That peak was not found experimentally on Pt(111) single crystal surfaces [22,23] but was found on Pt(110), which includes essentially the same type of site as the (110) step under discussion here. Thus, even though this species is a kind of on-top H, by definition, it should be included as a form of HUPD, since it appears at potentials above 0.0 V.
This mechanism can also help to explain results of Nakamori et al., in which they used Pt–Ru as a hydrogen catalyst [24], as well as results of non-Pt-based catalysts. Recently, the Wadayama group, following the early work of Neergat et al. [25]. found that Ir single crystal surfaces such as Ir(111) and Ir(110) produced much less peroxide than Pt(111) [26], due to their low affinity for adsorbed hydrogen, according to DFT calculations [27]. It is worth pointing out here that, even on high-quality Pt(111) single crystal surfaces, there is a certain number of (110) steps, which can exert a disproportionate effect. They also reported that Pt(111)–Ir(111) bimetallic surfaces were highly active for the HOR and produced little peroxide [28]. With these results in mind, we have carried out calculations for O2 adsorption and H adsorption in the present work and we discuss the results in terms of the three pathways proposed above for peroxide production.

2. Results and Discussion

The unique geometry of the proposed active site is shown in Figure 5 for a Pt(221) surface, which includes a three-row-wide (111) terrace and a (110) step. As in our previous work, the configurations of the HUPD as Hbr and the active state of Had as H(110),step are based on the work of Ishikawa and coworkers [5,6,19], which so far provides the model that best accounts for the existence of two distinct adsorbed forms of H on Pt(111) and their respective characteristics. In the present case, we have made the length of the rows three Pt atoms in order to better fit the honeycomb HUPD (Hbr) surface array. On the step, two on-top hydrogen atoms can adsorb at a single Pt atom, creating a “V” [19]. The lower H is very close to an end-on adsorbed O2 molecule, similar to those pictured in Figure 3. If the latter rotates around its vertical axis, it comes into direct contact with the H(110),edge and can react, as shown in the figure, with the energy of rotation being negligible, to produce the adsorbed HO2 intermediate, which can again react with another H(110),edge to produce free H2O2. We have not modeled that step in the present work, under the assumption that the energetics will be similar to that of the first step. The O2 and H adsorption energies on the (111) terrace of the Pt(221) surface would be very similar to those on the (111) surface itself, the latter having been reported in [7]. To favor the end-on O2 configuration, the H adsorption must be strong enough, and O2 adsorption weak enough, so that the end-on O2 molecule does not convert to the bridging configuration. In the present work, these values were determined to be −0.54 eV for Hbr (HUPD) and −0.45 eV for O2,br on the (111) terraces of Pt(221). To test our hypothesis, we carried out similar calculations for Rh(221), Ir(221) Pt/Fe/Pt(221), simplified to Pt/Fe(221), as well as Pt/Rh(221) and Pt/Ir(221) (Figure 6, Figure 7 and Figure 8, Table 1 and a comparison with other work in Table S1). For the Pt/Fe(221) surface, the H and O2 adsorption energies were also balanced, and both were much smaller than those on Pt(221). For both of these surfaces, the initial end-on configuration is apparently stable, meaning that a geometrically optimized structure was obtained, even though the differential energy, i.e., just for O2, was positive, i.e., repulsive interaction with the surface. The reaction (Equation (8)) led to a stable product, HO2, in the case of Pt but an unstable product in the case of Pt/Fe. The initial state for HUPD-covered Pt, with the end-on O2 configuration, could be considered a metastable intermediate in the peroxide production, and thus its energy, 0.16 eV, is a kind of activation energy. This is significantly smaller than that, ca. 0.3 eV for Pathway 1 for Pt (Figure 2) and ca. 0.2 for Pathway 2 (Figure 4).
The Pt/Rh(221) and Pt/Ir(221) surfaces exhibited characteristics that were midway between those of Pt221) and Pt/Fe(221). The end-on O2 was stable on both HUPD-covered surfaces, more so than on Pt/Fe(221), on which the O2 was not attached to the surface. The final HO2 products for Pt/Fe, Pt/Rh and Pt/Ir were highly unstable, highly stable and slightly stable, respectively. These results by themselves would favor Pt/Rh(221) as a low-peroxide catalyst.
However, another important factor is the electrochemical potential at which the H(110),edge appears. This value cannot be calculated directly but can be estimated based on the experimental value of 0.1 V vs. RHE for pure Pt, together with the calculated Fermi energy EF of −5.879 eV, as we recently proposed for PtFeNi HER catalysts [29].
U M H = E F , P t , H 110 E F , M H + 0.1
Here, UMH is the electrochemical potential of the H-covered metal surface, whether covered with HUPD only or HUPD + H(110),edge. The calculated values are given in Table 2. These values can only provide a rough indication of the appearance potentials for H(110),edge, specifically, the values for 10H, but they do help to explain why Pt/Fe(221), even though it is seen to produce a very loosely bonded HO2 species, does not predict substantial H2O2 production, as found in the experiment, since it is predicted to require a potential of −0.014 V, i.e., an advantage of 114 mV compared with Pt(221). Rh(221) is predicted to require a very negative potential, nearly −0.3 V, to form H(110),edge, but, when covered with a monolayer of Pt, behaves much like pure Pt, but still with an advantage of ca. 66 mV, while Pt/Ir(221) is predicted to have an advantage of 56 mV.
In terms of actual adsorption energies, both Rh(111) [30] and Ir(111) [26] exhibit H adsorption behavior that is similar to that of Pt(111), with HUPD adsorption being apparent in the cyclic voltammograms. The H adsorption energies for HUPD on the (111) terraces of Rh(221) and Ir(221) were slightly less than those on Pt(221). The results for Rh(221) are consistent with the experimental measurements of Jerkiewicz and coworkers for polycrystalline Rh [4]. It was noted by that group that the hydrogen adsorption energies for all of the Pt-group metals are similar. The present DFT calculations are also in essential agreement with those of Greeley and Mavrikakis [31], as well as those of Liu et al. for various Ir single crystal surfaces [27]. Thus, even though the H adsorption energies for the (111) terraces are smaller than those on Pt(111) terraces, as already noted, this is not the only factor involved in the decreased H2O2 production. The O2 adsorption must also be considered.
The stronger affinity of Ir surfaces for oxygen in comparison with Pt has been recognized, although it is difficult to find data on molecular O2 adsorption (see the DFT calculations of Klyukin et al.) [32]. The same situation applies for Rh surfaces. Comelli et al. have stated that molecular O2 is only found on Rh surfaces that already are partially covered with oxygen atoms [33]. Indeed, until recently, it has been difficult to determine with certainty the molecular O2 adsorption energy on Pt surfaces, due to the ability of steps to catalyze its dissociation [34,35]. Recent DFT studies rarely include molecular O2 adsorption; however, our result, −0.45 eV, is in agreement with that of Ou et al. for Pt(111) [36], but slightly smaller than that of Eichler and Hafner, −0.68 eV [37].
The previously mentioned results of Nakamori et al. for Pt–Ru are also consistent with the present approach, since Ru is well-known to have a higher affinity for oxygenated species than pure Pt. So-called “bifunctional” Pt–Ru catalysts were developed by Watanabe and Motoo for methanol oxidation [38] and CO oxidation [39], and, making use of this principle, Ishikawa and coworkers used DFT calculations to explain the mechanism in detail [40].
It is clear why the end-on configuration for O2 is stable for H-covered Pt(221), i.e., it is surrounded by HUPD (Hbr), and it also clear why it is unstable on Rh(221) and Ir(221), i.e., the bridged configuration O2,br is much more stable. On Pt/Fe(221), the calculations showed that the end-on O2 was so weakly adsorbed that it desorbed spontaneously. The very strong O2 adsorption on the Rh(221) and Ir(221) surfaces also ensures that the product of the reaction (HO2,ad) will be strongly adsorbed at the step (Figure 6). When these metals are covered with Pt, however, their behavior becomes much more like that of pure Pt.
Also of interest are the recent results of Hayashi et al. in which they report results for Pt–Ir bimetallic surfaces [28]. These authors reported that up to a 1/3 monolayer of Pt on Ir(111) was effective in suppressing peroxide production while providing high HOR activity. This type of surface can be seen to provide the type of active site that we are proposing in Figure 5, i.e., the Pt(110) step, at which the HOR and HER are highly active, together with a lower terrace, Ir(111), on which O2 adsorption is strong and favors the bridging configuration. We have not modeled this system thus far because it requires a larger atomic model, but we can nevertheless understand essentially how it works. The edge of the Pt islands would behave like the steps in the Pt/Ir(221) system modeled in this work, with a more negative UMH than pure Pt, and we know that O2,br adsorbs much more strongly on Ir(111) than on Pt(111) terraces, so that end-on O2 adsorption would not be expected to be stable.
In order to produce peroxide, the O–O bond must remain intact, and therefore, the O2 adsorption energy must be small enough that the bond is not broken. Siahrostami et al. have examined this problem from the viewpoint of HO2 adsorption on Pt-based alloys and other alloys, and have found that there is a volcano relationship between the free energy of HO2 adsorption and the activity for peroxide production [41]. They found that the Pt–Hg surface was among the most efficient for peroxide production. Other, more recent efforts along these lines have been reviewed [42].
The novel aspect of the present research is that it involves very specific mechanisms and reactive sites that can explain most of the available experimental results, depending upon the potential range. In the range from 0.3 V down to 0.1 V, important for the HOR at high current densities, Pathway 2 is considered most favorable, because it involves HUPD, which begins to adsorb on Pt and Pt-based catalysts in this potential range. In the range from 0.1 to 0.0 V, important for the HOR at low current densities and open circuit, Pathway 3 is favorable, because it involves the H(110)edge species, which starts to form at 0.1 on pure Pt. It also explains why Pt-alloys such as Pt–Fe and Pt–Co produce less H2O2, since the formation of H(110)edge is shifted to less positive potentials, as discussed above and as shown by Sheng et al. [43]. For potentials less than 0.0 V, important for the HER, Pathway 1 is favorable, since it involves the presence of HOPD on (111) terraces, which become prevalent in this range.
At this point, we would like to summarize the three pathways examined in the present work for H2O2 production (Table 3). Thus, the key factors that help to minimize H2O2 production while maintaining high HOR or HER activity are as follows:
  • The O2,br adsorption should be stronger than that of HUPD, so that the 4-electron ORR will be favored vs. the 2-electron process to produce H2O2 (Pathways 2 and 3);
  • Even if #1 is not satisfied, θH can be decreased significantly, both by decreasing the adsorption energy Ead,H and the appearance potentials UMHUPD (Pathway 2) and UMH(110),edge (Pathway 3) via alloying;
  • The coverage of HUPD is also important, because high coverage tends to stabilize the end-on adsorption of O2 on the (111) terraces. These coverages are dependent upon the UMHUPD values, which are very close to the UMH(110),edge values;
  • The HOR and HER activities are favored by decreased H adsorption energies at both the (110) step and the (111) terrace, with the effect of the latter being particularly apparent for the HOR [8];
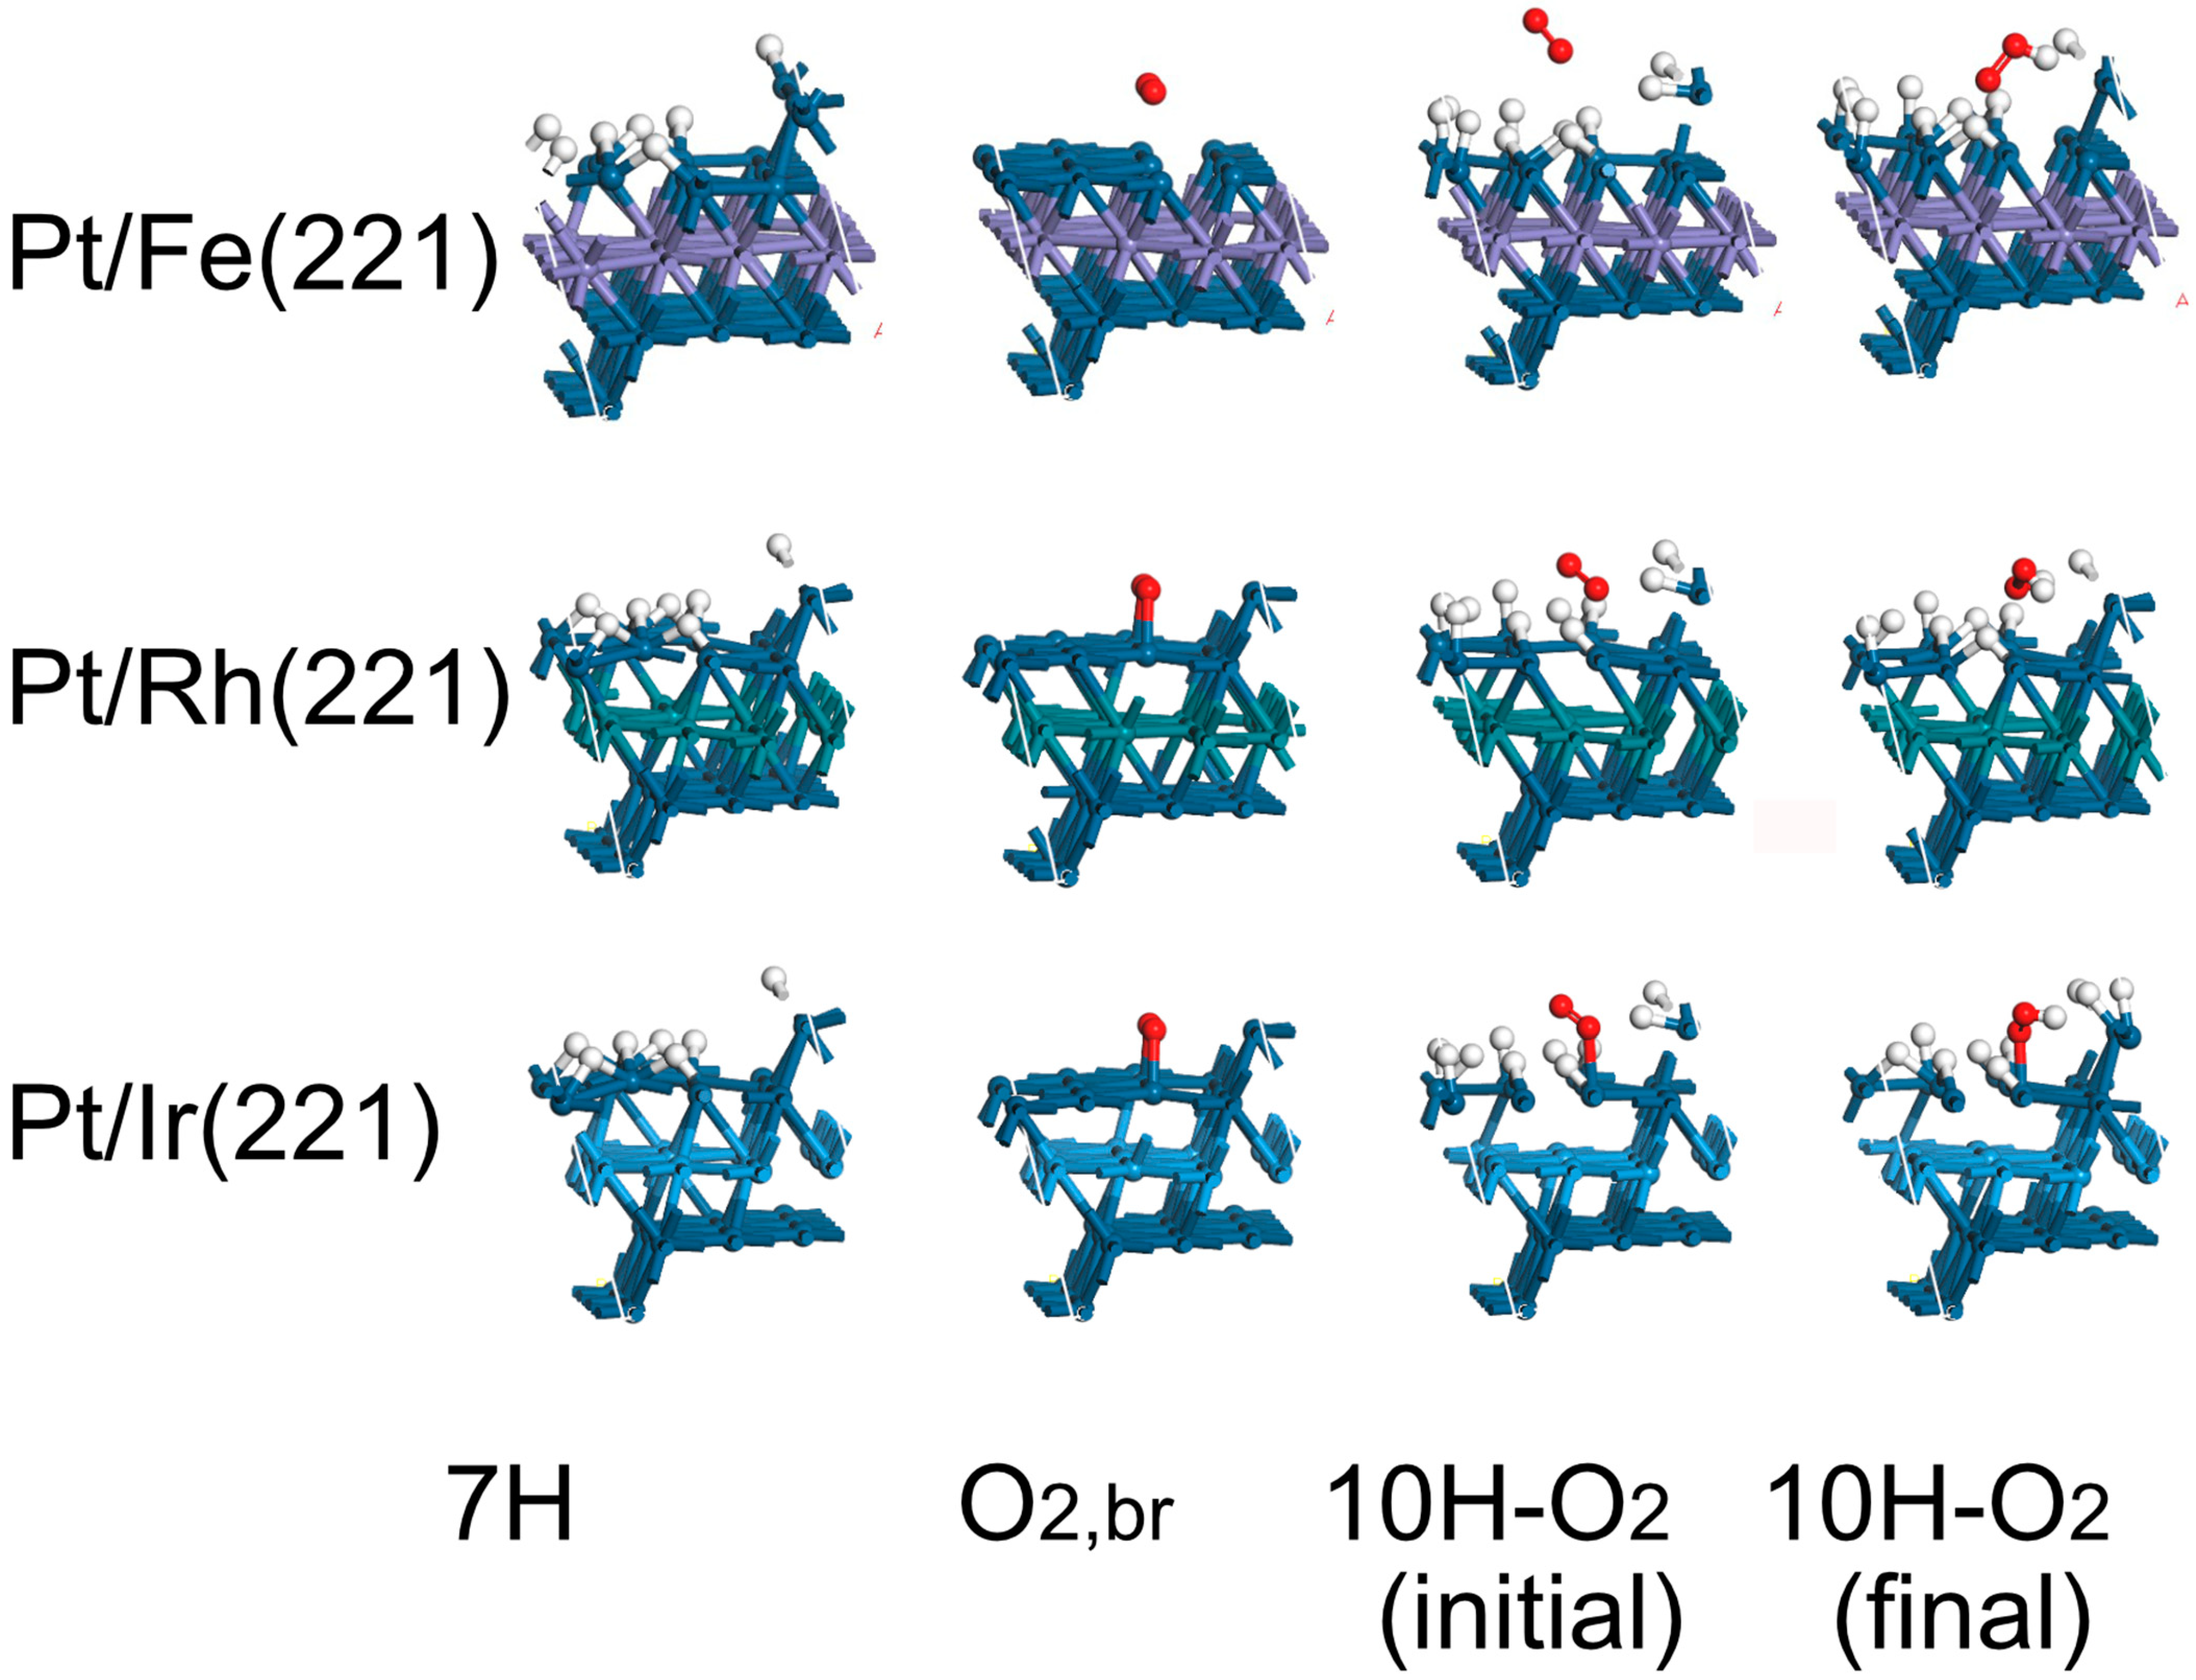
  • Based on the above guidelines, PtFe, PtRh and PtIr all are predicted to have high activity for the HOR and HER with low activity for H2O2 production. The Pt monolayer on Ir(111) model is also attractive if it is possible to prepare in high area form;
  • Of course, the final choice of catalyst also requires consideration of cost, durability and ability to prepare a suitable material. The durability of both Rh and Ir is expected to be superior to that of Fe as an alloying element.

3. DFT Calculations

The calculations were carried out with the DMol3 package (BIOVIA, Materials Studio Visualizer, versions 2021 and 2023) [44]. The geometric optimizations for periodic boundary conditions were carried out with the hardness-conserving semilocal pseudopotential [45] and the PBE functional [46]. The geometry optimizations were carried out with fine-quality settings (convergence criteria 1 × 10⁻⁵ Ha, maximum force 0.002 Ha/Å, maximum displacement 0.005 Å with a numeric quality basis set with polarization functions), and an scf convergence criterion of 1 × 10⁻⁶ Ha, with energy calculations being carried out with an all-electron relativistic basis. To facilitate scf convergence, a minimum kinetic energy was applied to the electrons (thermal smearing), 0.0005 Ha, which is 1/10 of the usual value of 0.005 Ha. These low values were used in order to facilitate scf convergence as well as to avoid unwanted effects of excessive electron energy, as described by Basiuk et al. [47]. In the (221) models, only the coordinates of the bottom layer were fixed.
The H adsorption energy was calculated with Equation (12):
E n H = 1 n E P t n / 2 H 2 E P t + E n / 2 H 2
Here, n is the number of H atoms. This yields the adsorption energy per H atom and can be compared directly with the experimental enthalpy values reported in the literature, for example, those of Jerkiewicz, which are designated as H a d s 0 H c h e m (see Table S1) [4]. It should be noted that, in previous publications, we have reported H2 adsorption values, which are larger than those reported in the present work by a factor of two. The earlier approach had been adopted in order to match the convention in reporting the adsorption of molecular O2:
E O 2 = E P t O 2 E P t + E O 2
The differential adsorption energy of O2 on a surface already populated with adsorbed H was calculated as follows:
E n H O 2 = E P t n H O 2 E P t n H + E O 2

4. Conclusions

The two previous models for peroxide production at the hydrogen electrode in PEMFCs and PEMWEs are reviewed: Pathway 1, in which O2 is adsorbed at Pt(110) step edges and reacts with HOPD adsorbed on the lower (111) terrace, and Pathway 2, in which HUPD is activated thermally to HOPD and reacts with end-on adsorbed O2. In order to explain the acceleration of peroxide production below 0.1 V, a third pathway is newly proposed, in which the H(110),edge species reacts with end-on-adsorbed O2 on the lower (111) terrace. The new pathway is consistent with published results for pure Pt, Pt-alloy, pure Ir and Pt–Ir bimetallic surfaces. It can also be used to design new catalysts for the HOR and HER that suppress peroxide production and thus prolong the life of the proton-exchange membrane.
The mechanism and unique reactive site can be thought of as further examples of bifunctional catalysis, as already mentioned, or, more accurately, adjacent dual-site catalysis, in which two adjacent catalytic sites perform complementary functions, although in the present case we have sought to inhibit rather than catalyze the peroxide production reaction. Previous examples include the studies of methanol oxidation [38] and CO oxidation on Pt–Ru bimetallic surfaces [39], CO-tolerant HOR catalysts [8], the HER on Pt–Co catalysts [11], the HOR on Pt–Ir bimetallic surfaces [28], and the OER on FeCoSx surfaces [48]. This emerging field has been reviewed recently [49].

Supplementary Materials

The following supporting information can be downloaded at: https://www.mdpi.com/article/10.3390/catal14120890/s1: 1. Experimental evidence for the interference of the O2 reduction reaction (ORR) during the hydrogen oxidation reaction; Figure S1: Hydrodynamic voltammograms for the HER in N2- and O2-saturated 0.1 M HClO4 solution (mean flow rate of 111 cm s−1) at Nafion-coated Pt black, c-Pt/C and PtxAL–PtFe/C electrodes at 80 °C. The potential scan rate was set at 5 mV s−1. The potential of the Pt collecting electrode was set at 1.4 V to detect H2O2 produced at the catalysts; 2. Comparison of the present DFT adsorption energies with previous work; Table S1: Comparison of adsorption energies from the literature and the present work, ΔEad(H) and ΔEad(O2), referred to gas-phase H2 and O2; References [50,51,52] are cited in the Supplementary Materials.

Author Contributions

Methodology, G.S., K.K. and D.A.T.; Writing-original draft, D.A.T.; Conceptualization, G.S., K.K. and D.A.T.; Funding acquisition and supervision, M.U. and A.I. All authors have read and agreed to the published version of the manuscript.

Funding

This work was partially supported by funds for the “Superlative, stable, and scalable performance fuel cell” (SPer-FC) and the “Electrolytes, catalysts and catalyst layers with extraordinary efficiency, power and durability for PEFCs to 2030” (ECCEED’30-FC) projects from NEDO of Japan.

Data Availability Statement

All data are included in the article and Supporting Materials.

Acknowledgments

The authors gratefully acknowledge support from The New Energy and Industrial Technology Development Organization (NEDO) of Japan. The authors gratefully acknowledge the vision and guidance of Hiroyuki Uchida, University of Yamanashi.

Conflicts of Interest

The authors declare no conflict of interest.

References

  1. Watanabe, M.; Tryk, D.A. Fuel Cells: An Overview with Emphasis on Polymer Electrolyte Fuel Cells. In Electrochemical Science for a Sustainable Society: A Tribute to John O’M Bockris; Uosaki, K., Ed.; Springer International Publishing: Cham, Switzerland, 2017; pp. 51–94. [Google Scholar] [CrossRef]
  2. Yap, J.; McLellan, B. A Historical Analysis of Hydrogen Economy Research, Development, and Expectations, 1972 to 2020. Environments 2023, 10, 11. [Google Scholar] [CrossRef]
  3. Link, S.; Stephan, A.; Speth, D.; Plötz, P. Rapidly Declining Costs of Truck Batteries and Fuel Cells Enable Large-Scale Road Freight Electrification. Nat. Energy 2024, 9, 1032–1039. [Google Scholar] [CrossRef]
  4. Jerkiewicz, G. Hydrogen Sorption at/in Electrodes. Prog. Surf. Sci. 1998, 57, 137–186. [Google Scholar] [CrossRef]
  5. Ishikawa, Y.; Mateo, J.J.; Tryk, D.A.; Cabrera, C.R. Direct Molecular Dynamics and Density-Functional Theoretical Study of the Electrochemical Hydrogen Oxidation Reaction and Underpotential Deposition of H on Pt(111). J. Electroanal. Chem. 2007, 607, 37–46. [Google Scholar] [CrossRef]
  6. Mateo, J.J.; Tryk, D.A.; Cabrera, C.R.; Ishikawa, Y. Underpotential Deposition of Hydrogen on Pt(111): A Combined Direct Molecular Dynamics/Density Functional Theory Study. Mol. Simul. 2008, 34, 1065–1072. [Google Scholar] [CrossRef]
  7. Shi, G.; Yano, H.; Tryk, D.A.; Nohara, S.; Uchida, H. High Hydrogen Evolution Activity and Suppressed H2O2 Production on Pt-Skin/PtFe Alloy Nanocatalysts for Proton Exchange Membrane Water Electrolysis. Phys. Chem. Chem. Phys. 2019, 21, 2861–2865. [Google Scholar] [CrossRef]
  8. Shi, G.; Yano, H.; Tryk, D.A.; Iiyama, A.; Uchida, H. Highly Active, Co-Tolerant, and Robust Hydrogen Anode Catalysts: Pt-M(M = Fe, Co, Ni) Alloys with Stabilized Pt-Skin Layers. ACS Catal. 2017, 7, 267–274. [Google Scholar] [CrossRef]
  9. Shi, G.; Tano, T.; Tryk, D.A.; Iiyama, A.; Uchida, M.; Kakinuma, K. Temperature Dependence of Oxygen Reduction Activity at Pt/Nb-Doped SnO2 Catalysts with Varied Pt Loading. ACS Catal. 2021, 11, 5222–5230. [Google Scholar] [CrossRef]
  10. Shi, G.; Hashimoto, T.; Tryk, D.A.; Tano, T.; Iiyama, A.; Uchida, M.; Kakinuma, K. Enhanced Oxygen Reduction Electrocatalysis on Ptcosn Alloy Nanocatalyst Mediated by Ta-Doped SnO2 Support for Polymer Electrolyte Fuel Cells. Electrochim. Acta 2021, 390, 138894. [Google Scholar] [CrossRef]
  11. Shi, G.; Tryk, D.A.; Iwataki, T.; Yano, H.; Uchida, M.; Iiyama, A.; Uchida, H. Unparalleled Mitigation of Membrane Degradation in Fuel Cells Via a Counter-Intuitive Approach: Suppression of H2O2 Production at the Hydrogen Anode Using a Ptskin–PtCo Catalyst. J. Mater. Chem. A 2020, 8, 1091–1094. [Google Scholar] [CrossRef]
  12. Uchida, H.; Shi, G.; Imran, M.; Tryk, D.A. Particle-Size Effect of Pt Anode Catalysts on H2O2 Production Rate and H2 Oxidation Activity at 20 to 80 °C. J. Electrochem. Soc. 2022, 169, 014516. [Google Scholar] [CrossRef]
  13. Conway, B.E.; Jerkiewicz, G. Nature of Electrosorbed H and Its Relation to Metal Dependence of Catalysis in Cathodic H2 Evolution. Solid State Ionics 2002, 150, 93–103. [Google Scholar] [CrossRef]
  14. Markovic, N.M.; Adzic, R.R.; Cahan, B.D.; Yeager, E.B. Structural Effects in Electrocatalysis: Oxygen Reduction on Platinum Low Index Single-Crystal Surfaces in Perchloric Acid Solutions. J. Electroanal. Chem. 1994, 377, 249–259. [Google Scholar] [CrossRef]
  15. MacNaughton, J.B.; Naslund, L.A.; Anniyev, T.; Ogasawara, H.; Nilsson, A. Peroxide-Like Intermediate Observed at Hydrogen Rich Condition on Pt(111) after Interaction with Oxygen. Phys. Chem. Chem. Phys. 2010, 12, 5712–5716. [Google Scholar] [CrossRef] [PubMed]
  16. Hossain, M.S.; Tryk, D.; Yeager, E. The Electrochemistry of Graphite and Modified Graphite Surfaces: The Reduction of O2. Electrochim. Acta 1989, 34, 1733–1737. [Google Scholar] [CrossRef]
  17. Conway, B.E.; Jerkiewicz, G. Relation of Energies and Coverages of Underpotential and Overpotential Deposited H at Pt and Other Metals to the ‘Volcano Curve’ for Cathodic H2 Evolution Kinetics. Electrochim. Acta 2000, 45, 4075–4083. [Google Scholar] [CrossRef]
  18. Climent, V.; Feliu, J. Single Crystal Electrochemistry as an in Situ Analytical Characterization Tool. Ann. Rev. Anal. Chem. 2020, 13, 201–222. [Google Scholar] [CrossRef]
  19. Santana, J.A.; Mateo, J.J.; Ishikawa, Y. Electrochemical Hydrogen Oxidation on Pt(110): A Combined Direct Molecular Dynamics/Density Functional Theory Study. J. Phys. Chem. C 2010, 114, 4995–5002. [Google Scholar] [CrossRef]
  20. Kunimatsu, K.; Senzaki, T.; Tsushima, M.; Osawa, M. A Combined Surface-Enhanced Infrared and Electrochemical Kinetics Study of Hydrogen Adsorption and Evolution on a Pt Electrode. Chem. Phys. Lett. 2005, 401, 451–454. [Google Scholar] [CrossRef]
  21. Kunimatsu, K.; Senzaki, T.; Samjeske, G.; Tsushima, M.; Osawa, M. Hydrogen Adsorption and Hydrogen Evolution Reaction on a Polycrystalline Pt Electrode Studied by Surface-Enhanced Infrared Absorption Spectroscopy. Electrochim. Acta 2007, 52, 5715–5724. [Google Scholar] [CrossRef]
  22. Ogasawara, H.; Ito, M. Hydrogen Adsorption on Pt(100), Pt(110), Pt(111) and Pt(1111) Electrode Surfaces Studied by in Situ Infrared Reflection Absorption Spectroscopy. Chem. Phys. Lett. 1994, 221, 213–218. [Google Scholar] [CrossRef]
  23. Nakamura, M.; Kobayashi, T.; Hoshi, N. Structural Dependence of Intermediate Species for the Hydrogen Evolution Reaction on Single Crystal Electrodes of Pt. Surf. Sci. 2011, 605, 1462–1465. [Google Scholar] [CrossRef]
  24. Nakamori, Y.; Suzuki, N.; Tanaka, K.; Aoki, T.; Nohira, T.; Hagiwara, R. Pt–Ru Anode Catalyst to Suppress H2O2 Formation Due to Oxygen Crossover. J. Electrochem. Soc. 2018, 165, F463. [Google Scholar] [CrossRef]
  25. Neergat, M.; Gunasekar, V.; Singh, R.K. Oxygen Reduction Reaction and Peroxide Generation on Ir, Rh, and Their Selenides–a Comparison with Pt and Ruse. J. Electrochem. Soc. 2011, 158, B1060. [Google Scholar] [CrossRef]
  26. Hayashi, K.; Tomimori, T.; Chida, Y.; Todoroki, N.; Wadayama, T. Hydrogen Peroxide Generation and Hydrogen Oxidation Reaction Properties of Ir(111)-, (100)-, and (110)-Low-Index Single-Crystal Surfaces. J. Phys. Chem. C 2021, 125, 21481–21487. [Google Scholar] [CrossRef]
  27. Liu, C.; Zhu, L.; Wen, X.; Yang, Y.; Li, Y.-W.; Jiao, H. Hydrogen Adsorption on Ir(111), Ir(100) and Ir(110)—Surface and Coverage Dependence. Surf. Sci. 2020, 692, 121514. [Google Scholar] [CrossRef]
  28. Hayashi, K.; Tomimori, T.; Sato, R.; Todoroki, N.; Wadayama, T. Enhanced Electrochemical Hydrogen Oxidation Reaction and Suppressed Hydrogen Peroxide Generation Properties on Pt/Ir(111) Bimetallic Surfaces. Phys. Chem. Chem. Phys. 2023, 25, 2770–2775. [Google Scholar] [CrossRef]
  29. Shi, G.; Tano, T.; Tryk, D.A.; Iiyama, A.; Uchida, M.; Terao, K.; Osada, H.; Yamaguchi, M.; Tamoto, K.; Kakinuma, K. Nanostructured Pt-NiFe Oxide Catalyst for Hydrogen Evolution Reaction in Alkaline Electrolyte Membrane Water Electrolyzers. ACS Catal. 2024, 14, 9460–9468. [Google Scholar] [CrossRef]
  30. Jerkiewicz, G.; Zolfaghari, A. Determination of the Energy of the Metal-Underpotential-Deposited Hydrogen Bond for Rhodium Electrodes. J. Phys. Chem. 1996, 100, 8454–8461. [Google Scholar] [CrossRef]
  31. Greeley, J.; Mavrikakis, M. Surface and Subsurface Hydrogen: Adsorption Properties on Transition Metals and near-Surface Alloys. J. Phys. Chem. B 2005, 109, 3460–3471. [Google Scholar] [CrossRef]
  32. Klyukin, K.; Zagalskaya, A.; Alexandrov, V. Ab Initio Thermodynamics of Iridium Surface Oxidation and Oxygen Evolution Reaction. J. Phys. Chem. C 2018, 122, 29350–29358. [Google Scholar] [CrossRef]
  33. Comelli, G.; Dhanak, V.R.; Kiskinova, M.; Prince, K.C.; Rosei, R. Oxygen and Nitrogen Interaction with Rhodium Single Crystal Surfaces. Surf. Sci. Rep. 1998, 32, 165–231. [Google Scholar] [CrossRef]
  34. Gee, A.T.; Hayden, B.E. The Dynamics of O2 Adsorption on Pt(533): Step Mediated Molecular Chemisorption and Dissociation. J. Chem. Phys. 2000, 113, 10333–10343. [Google Scholar] [CrossRef]
  35. Ueta, H.; Kurahashi, M. Dynamics of O2 Chemisorption on a Flat Platinum Surface Probed by an Alignment-Controlled O2 Beam. Angew. Chem. Int. Ed. 2017, 56, 4174–4177. [Google Scholar] [CrossRef] [PubMed]
  36. Ou, L.; Yang, F.; Liu, Y.; Chen, S. First-Principle Study of the Adsorption and Dissociation of O2 on Pt(111) in Acidic Media. J. Phys. Chem. C 2009, 113, 20657–20665. [Google Scholar] [CrossRef]
  37. Eichler, A.; Hafner, J. Molecular Precursors in the Dissociative Adsorption of O2 on Pt(111). Phys. Rev. Lett. 1997, 79, 4481–4484. [Google Scholar] [CrossRef]
  38. Watanabe, M.; Motoo, S. Electrocatalysis by Ad-Atoms Part II. Enhancement of the Oxidation of Methanol on Platinum by Ruthenium Ad-Atoms. J. Electroanal. Chem. 1975, 60, 267–273. [Google Scholar] [CrossRef]
  39. Watanabe, M.; Motoo, S. Electrocatalysis by Ad-Atoms: Part III. Enhancement of the Oxidation of Carbon Monoxide on Platinum by Ruthenium Ad-Atoms. J. Electroanal. Chem. 1975, 60, 275–283. [Google Scholar] [CrossRef]
  40. Perez, A.; Vilkas, M.J.; Cabrera, C.R.; Ishikawa, Y. Density Functional Theory Study of Water Activation and COads + OHads Reaction on Pure Platinum and Bimetallic Platinum/Ruthenium Nanoclusters. J. Phys. Chem. B 2005, 109, 23571–23578. [Google Scholar] [CrossRef]
  41. Siahrostami, S.; Verdaguer-Casadevall, A.; Karamad, M.; Deiana, D.; Malacrida, P.; Wickman, B.; Escudero-Escribano, M.; Paoli, E.A.; Frydendal, R.; Hansen, T.W.; et al. Enabling Direct H2O2 Production through Rational Electrocatalyst Design. Nat. Mater. 2013, 12, 1137–1143. [Google Scholar] [CrossRef]
  42. Chang, Y.; Yang, J.; Zhang, M.; Yue, M.; Wang, W.; Li, J.; Wang, J.; Song, K.; Liu, Y.; Zuo, Y.; et al. Pt-Based Electrocatalysts Design for Oxygen Reduction toward Hydrogen Peroxide. J. Alloys Compd. 2024, 1005, 176091. [Google Scholar] [CrossRef]
  43. Sheng, W.C.; Zhuang, Z.B.; Gao, M.R.; Zheng, J.; Chen, J.G.G.; Yan, Y.S. Correlating Hydrogen Oxidation and Evolution Activity on Platinum at Different pH with Measured Hydrogen Binding Energy. Nat. Commun. 2015, 6, 5848. [Google Scholar] [CrossRef] [PubMed]
  44. Delley, B. From Molecules to Solids with the DMol3 Approach. J. Chem. Phys. 2000, 113, 7756–7764. [Google Scholar] [CrossRef]
  45. Delley, B. Hardness Conserving Semilocal Pseudopotentials. Phys. Rev. B 2002, 66, 155125. [Google Scholar] [CrossRef]
  46. Perdew, J.P.; Burke, K.; Ernzerhof, M. Generalized Gradient Approximation Made Simple. Phys. Rev. Lett. 1996, 77, 3865. [Google Scholar] [CrossRef]
  47. Basiuk, V.A.; Prezhdo, O.V.; Basiuk, E.V. Thermal Smearing in DFT Calculations: How Small Is Really Small? A Case of La and Lu Atoms Adsorbed on Graphene. Mater. Today Commun. 2020, 25, 101595. [Google Scholar] [CrossRef]
  48. Xu, S.; Feng, S.; Yu, Y.; Xue, D.; Liu, M.; Wang, C.; Zhao, K.; Xu, B.; Zhang, J.-N. Dual-Site Segmentally Synergistic Catalysis Mechanism: Boosting CoFeSx Nanocluster for Sustainable Water Oxidation. Nat. Commun. 2024, 15, 1720. [Google Scholar] [CrossRef]
  49. Zhou, M.; Kong, W.; Xue, M.; Li, H.; Khan, M.A.; Liu, B.; Lu, F.; Zeng, X. Recent Progress of Dual-Site Catalysts in Emerging Electrocatalysis: A Review. Catal. Sci. Technol. 2023, 13, 4615–4634. [Google Scholar] [CrossRef]
  50. Hyman, M.P.; Medlin, J.W. Effects of Electronic Structure Modifications on the Adsorption of Oxygen Reduction Reaction Intermediates on Model Pt(111)-Alloy Surfaces. J. Phys. Chem. C 2007, 111, 17052–17060. [Google Scholar] [CrossRef]
  51. Li, R.; Li, H.; Liu, J. First Principles Study of O2 Dissociation on Pt(111) Surface: Stepwise Mechanism. Int. J. Quantum Chem. 2016, 116, 908–914. [Google Scholar] [CrossRef]
  52. De Darwent, B.B. NSRDS-NBS 31; Bond Dissociation Energies in Simple Molecules. National Bureau of Standards: Gaithersburg, MD, USA, 1970.
Figure 2. DFT energy profiles calculated for the reaction O2,ad + HOPD,ad → HO2,ad on Pt(221) (green line and squares) and Pt skin/PtCo(221) (blue line and circles) surfaces. The left models correspond to the initial state, O2,ad + 2HUPD,ad + 1HOPD,ad, which pass through the transition states in the middle to the product state HO2,ad + 2HUPD,ad at right. The reaction coordinate is the O–H distance for the O–H bond in HO2. Platinum atoms are dark blue; cobalt atoms light blue; oxygen and hydrogen are shown in red and white, respectively. (Based on [11]).
Catalysts 14 00890 g002
Figure 3. Atomic models of the Pt(111)-3 × 3, 4-layer model with adsorbed O2 and Had: (A) 9HUPD or (B) 9HUPD + 2HOPD. Two hexagons of HUPD are shown, with the Hbr on the right side of both panels having the central Pt either (A) empty or (B) with an on-top HOPD. Color scheme: Pt–dark blue; O–red; H–white. (Based on [11]).
Catalysts 14 00890 g003
Figure 4. DFT energy profiles calculated for the reaction O2,ad + 9HUPD,ad → HO2,ad + 8HUPD,ad on Pt(111) (lower profile, green line and circles) and O2,ad + 11HUPD,ad → HO2,ad + 10HUPD,ad (upper profile, blue line and squares) surfaces, with the H-covered surfaces as reference, so the energies reflect the contribution of O2 alone. The reaction coordinate is the O–H distance for the O–H bond in HO2. Color scheme: Pt–dark blue; O–red; H–white. (Based on [11]).
Catalysts 14 00890 g004
Figure 5. Geometry of the proposed reactive site proposed in the present work to account for the increased production of peroxide at 0.1 V vs. RHE in an acid environment. Color scheme—Pt (dark blue), O (red), H (white).
Catalysts 14 00890 g005
Figure 6. Comparison of adsorption energies for H and O2 on Pt(221), Rh(221), Ir(221), Pt/Fe(221), Pt/Rh(221) and Pt/Ir(221): 7HUPD, O2,br, 10H–O2, initial and 10H–O2, final. The 10H consist of 7 HUPD, 1Htop and 2H(110),edge.
Catalysts 14 00890 g006
Figure 7. Atomic models corresponding to the adsorption energies in Figure 6 for Pt(221), Rh(221) and Ir(221). Color scheme—Pt (dark blue), Rh (dark green), Ir (dark blue), O (red), H (white).
Catalysts 14 00890 g007
Figure 8. Atomic models corresponding to the adsorption energies in Figure 6 for Pt/Fe(221), Pt/Rh(221) and Pt/Ir(221). Color scheme—Pt (dark blue), Fe (purple), Rh (dark green), Ir (light blue), O (red), H (white).
Catalysts 14 00890 g008
Table 1. Hbr (HUPD) and O2,br adsorption energies (eV) calculated in the present work.
SurfaceHbr (HUPD)O2,br10H–O2, Initial10H–O2, Final
Pt(221)−0.54−0.450.16−0.45
Rh(221)−0.45−1.46−0.99−1.41
Ir(221)−0.38−1.26−1.20−0.76
Pt/Fe(221)−0.23−0.200.030.31
Pt/Rh(221)−0.42−0.53−0.09−0.89
Pt/Ir(221)−0.44−0.650.36−0.14
Table 2. Electrochemical onset potentials UMH calculated in the present work.
M-nHPt(221)Rh(221)Ir(221)Pt/Fe(221)Pt/Rh(221)Pt/Ir(221)10H–O2, Final
M-7H0.118−0.2940.058−0.0320.0860.083−0.45
M-10H0.100−0.2950.045−0.0140.0340.044−1.41
Note—7H include HUPD; 10H include 7HUPD, 1Htop and 2H(110),edge.
Table 3. H2O2 production pathways discussed in the present work.
PathwayHO2Potential aOnsetRemedy b
1OPD(110) edge<0.0 VsuddenDecr. θH
2UPDEnd-on<0.5 VgradualDecr. θH, incr. Ead,O2
3(110) edgeEnd-on<0.1 VsuddenDecr. θH, incr. Ead,O2
a These values are roughly equivalent to the UMH values for pure Pt and can be shifted negatively by alloying (see Table 2). b θH can be decreased both by decreasing Ead,H and making UMH more negative.
Disclaimer/Publisher’s Note: The statements, opinions and data contained in all publications are solely those of the individual author(s) and contributor(s) and not of MDPI and/or the editor(s). MDPI and/or the editor(s) disclaim responsibility for any injury to people or property resulting from any ideas, methods, instructions or products referred to in the content.

