1. Introduction
The development and industrial establishment of technologies that utilise renewable energies to electrify and connect sectors is becoming increasingly important. Sector coupling technologies, for example Power-to-X processes, are key for electrified chemical industry to reduce CO
2 emissions cross-sector [
1,
2].
The use of plasma technologies for electrification is an important part of Power-to-X research. The temperatures in non-thermal and warm plasmas, ranging from room temperature to 2000 K, allow chemical reactions to be carried out using electricity from renewable sources. In addition to the thermal effect, which is a good substitute for conventional natural gas combustion for heat generation, plasma also excites the molecules through electron collisions. These vibrational excitations lead to energy-efficient transitions along the anharmonic oscillator of the molecules up to fission [
3,
4].
In addition to improvements to the electrical circuit and chemical activity through the introduction of catalysts, engineering modifications in reactor development also have great potential for the further development of plasma technologies. Reactor engineering is an important field necessary to optimise existing processes and take further steps towards industrial application. Aspects such as scaling effects, thermal management, and flow control play important roles [
4,
5,
6].
In addition to thermal management, e.g., whether to quench or not [
7], the optimisation of the reaction volume also plays an important role. One example in is the generation of a larger plasma volume through changes in flow or the implementation of magnetic fields. There are various approaches to generating a rotating arc. Most of them have been used for some time in thermal and sometimes also in warm plasmas. One possibility is the use of vortex flows, which are also known as tornado, tangential flow, or swirl. With this approach, for example, Kalra et al. achieved arc-rotation frequencies of 100 to 500 Hz using volume flows between 30 and 150 SLM [
8]. Using a setup with ring electrodes and tangential entry holes, Ananthanarasimhan et al. generated a rotating arc with frequencies at approx. 70 Hz with a volume flow of 50 SLM and observed it using a high-speed camera [
9]. The use of eddy streams requires relatively high-volume flows and a turbulent flow. Depending on the application, this can have a positive or negative effect. For plasma-based CO
2-splitting, for example, a laminar flow is more favourable [
10,
11].
In this case, another method of rotating the arc can help, specifically the utilisation of the Lorentz force via the integration of a magnetic field. This can be performed electrically via a coil, although this is probably less suitable for industrial applications due to the additional power required. Alternatively, permanent magnets can be used. Magnetically rotating arcs have been investigated in literature, for example, by Wang et al. [
12] with a thermal plasma and by Zhang et al. [
13] with a warm plasma. Wang et al. found frequencies from 400 to 800 Hz for thermal arc rotation, using currents of 100 A and magnetic fields around 30 mT [
12]. Zhang et al. investigated a rotating warm plasma arc with a cathode cylinder and observed rotation frequencies of 30 Hz at magnetic flux densities of 10 mT and a gas flow of 8 SLM [
13].
Looking at the generation of the most rotating arc plasmas, they are categorised as having low voltages and high currents. However, this also leads to very high temperatures and less vibrational excitations. This shift of excitation has the problem of losses in efficiency and corrosion of the electrodes. If the current on the HV side is limited during the process via a power electronic circuit, the glow-to-arc operating point can be achieved. This operating point is classified in the warm plasmas and is characterised by a higher energy efficiency compared to the thermal plasma arc due to more vibrational excitation than direct dissociation. This high efficiency is presented in some studies on gliding arc plasmas as well as in the studies by Renninger et al. on rotating glow-to-arc plasma. The rotating glow-to-arc plasma is generated with a current limiting power electronic and magnetically accelerated for increased plasma volume. In comparison to most rotating arc investigations, the converter generates a high-voltage low-current plasma instead of a low-voltage high-current plasma [
14,
15].
The presented work combines insights into the development of a rotating glow-to-arc plasma reactor towards a versatile and stable gas-conversion reactor, which is able to facilitate the activation of small and stable molecules like CO2, N2, and CH4. The technology can thus provide clean alternatives to existing, large-volume processes in the production of chemicals and fuels. The provided insights are broadly applicable to the reaction engineering of plasma reactors, contributing to their general development and their role in transforming the electrification of the chemical industry.
In this study, a reactor setup with a rotating glow-to-arc is investigated and optimized. Questions regarding the plasma reaction engineering being handled include the following: How uniform is the energy input over the reactor volume? Are there dead volumes in which gas passes through without contact with the plasma? Is it possible to optimise the homogeneity and thus the efficiency of the reactor by reducing unstable phenomena such as jumps in the plasma arc during rotation? From an engineering point of view, aspects of the plasma reactor are addressed, which serve as a basis for process control and monitoring as well as further detailed investigations and modelling.
2. The Inhomogeneous Behavior of the Plasma
The investigation concludes there are different influences on the stability and the power deviation of the plasma. In the first step of optimization, the plasma power was increased by using a bigger ring electrode diameter compared to the reactor presented by Renninger et al. [
14,
15]. The increased pin-to-ring distance was expected to improve the overall performance as inhomogeneous discharge behavior near the electrodes would have a smaller contribution because the stable region of the arc would be increased. The increase in the ring electrode diameter led to a power increase from 200 W to 1.2 kW (in CO
2). However, it exposed new challenges especially in terms of upcoming problems with the plasma stability.
2.1. Instabilities Through the Uplift Force
As the rapid heating of the gas with the gas discharge led to effects of uplift convection, the discharge was not inclined to jump over to the cathode ring located below the HV pin electrode. This problem leads to unsuccessful ignition and strong deviations in plasma power. In addition to the instability of the arc, the heat transfer to a catalyst bed potentially placed under the plasma is also significantly impaired if the arc is further away from it. To prevent the arc from escaping upwards, a balance of forces between the drag force and the uplift force must be achieved. If it is assumed that the arc is a horizontal air cylinder, the simplified Equations (1) and (2) apply for the equilibrium of gas drag force and the uplift force
, shown in
Figure 1.
Assuming that the arc has a diameter of
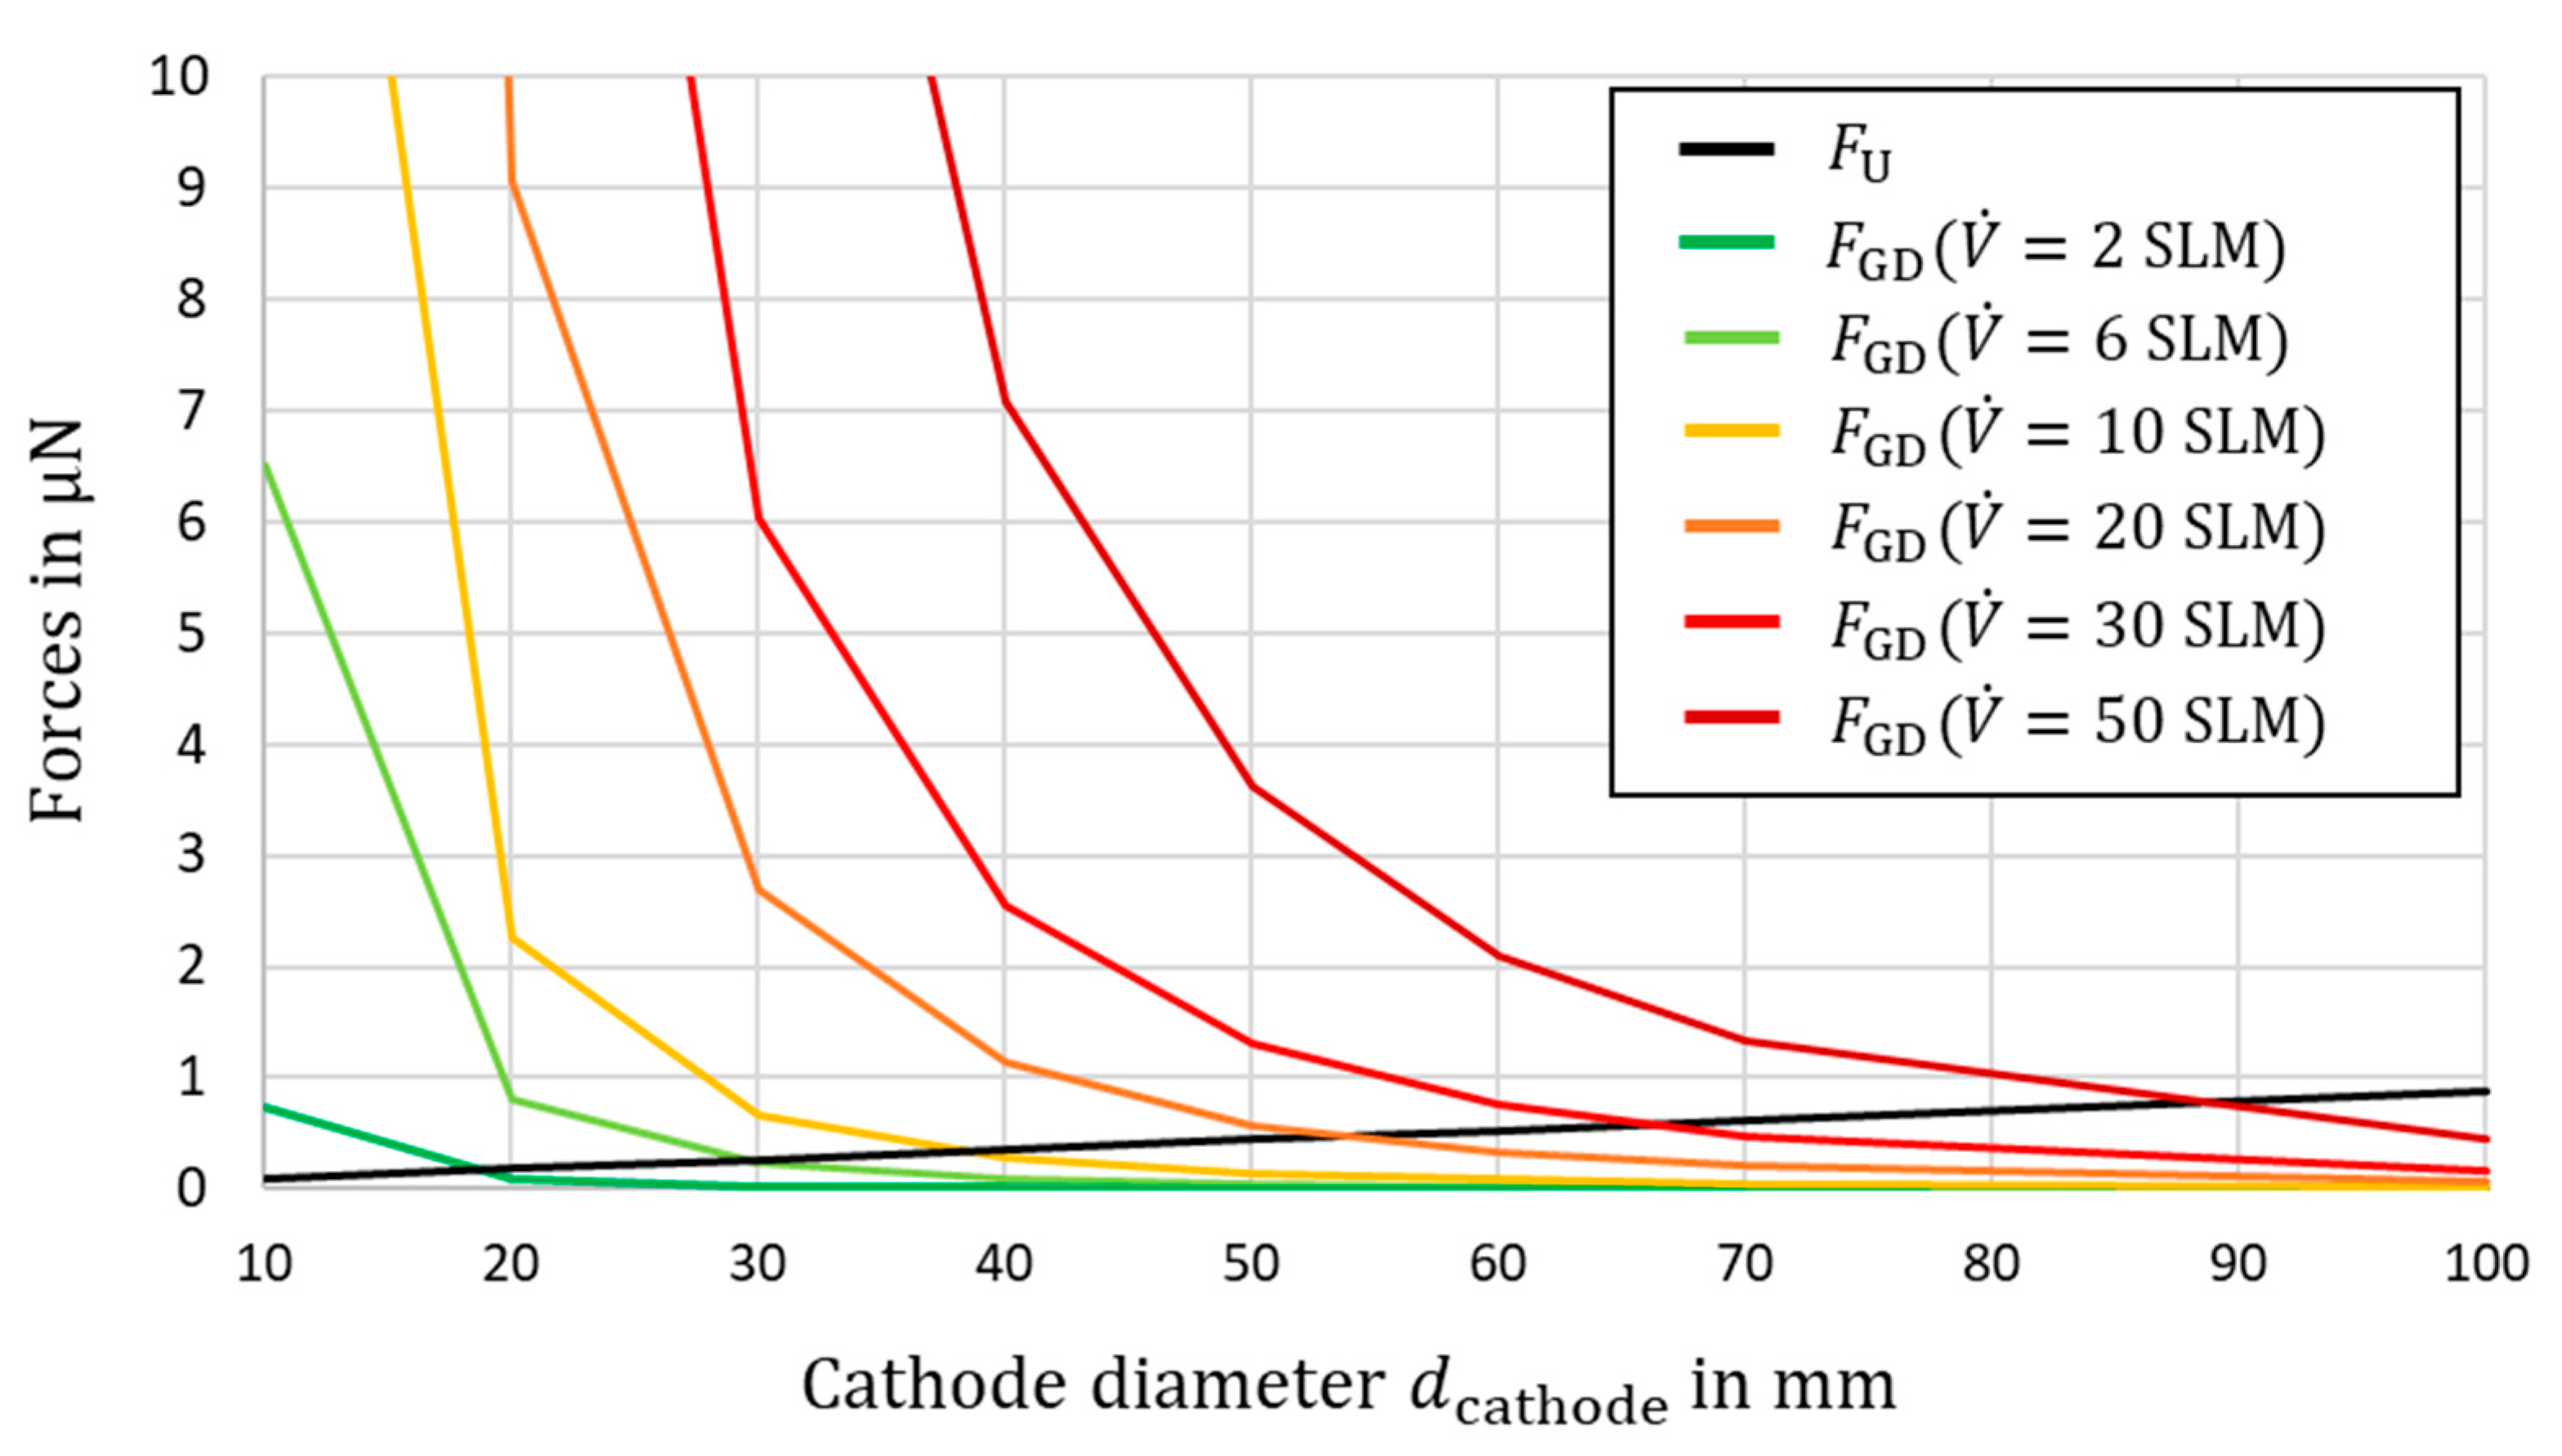
and the plasma has a temperature of 2000 K, the theoretically required volume flow can be determined, which is necessary as a function of the cathode diameter so that the arc is no longer pushed upwards by uplift convection. In
Figure 2, the forces
and
are calculated across the range of variation in the cathode diameter as well as the volume flow. It shows that at a certain diameter, the resistance force is dropping significantly because of a decrease in velocity. In case of the 80 mm diameter, a volume flow of 45 SLM would be necessary to withstand the uplift force, which also impacts the specific energy input and the conversion ratio.
It must be considered that assumptions have been made which may also deviate in reality. In addition, a small imbalance in the force balance should not completely prevent plasma operation. From an experimental point of view, however, we know that tests were carried out up to volume flows of 15 SLM and no stable plasma could be achieved.
To ensure successful plasma ignition, we decided to turn around the electrode setup and change the gas flow direction. A flow in the same direction as the uplift convection guarantees that the arc jumps from anode to cathode and that a better heat transfer in the gas flow direction is possible.
2.2. Instabilities Through Arc Phenomena
However, there were still large fluctuations in the plasma power, which the observations with the high-speed camera in the open reactor and with N
2 plasma provide information on.
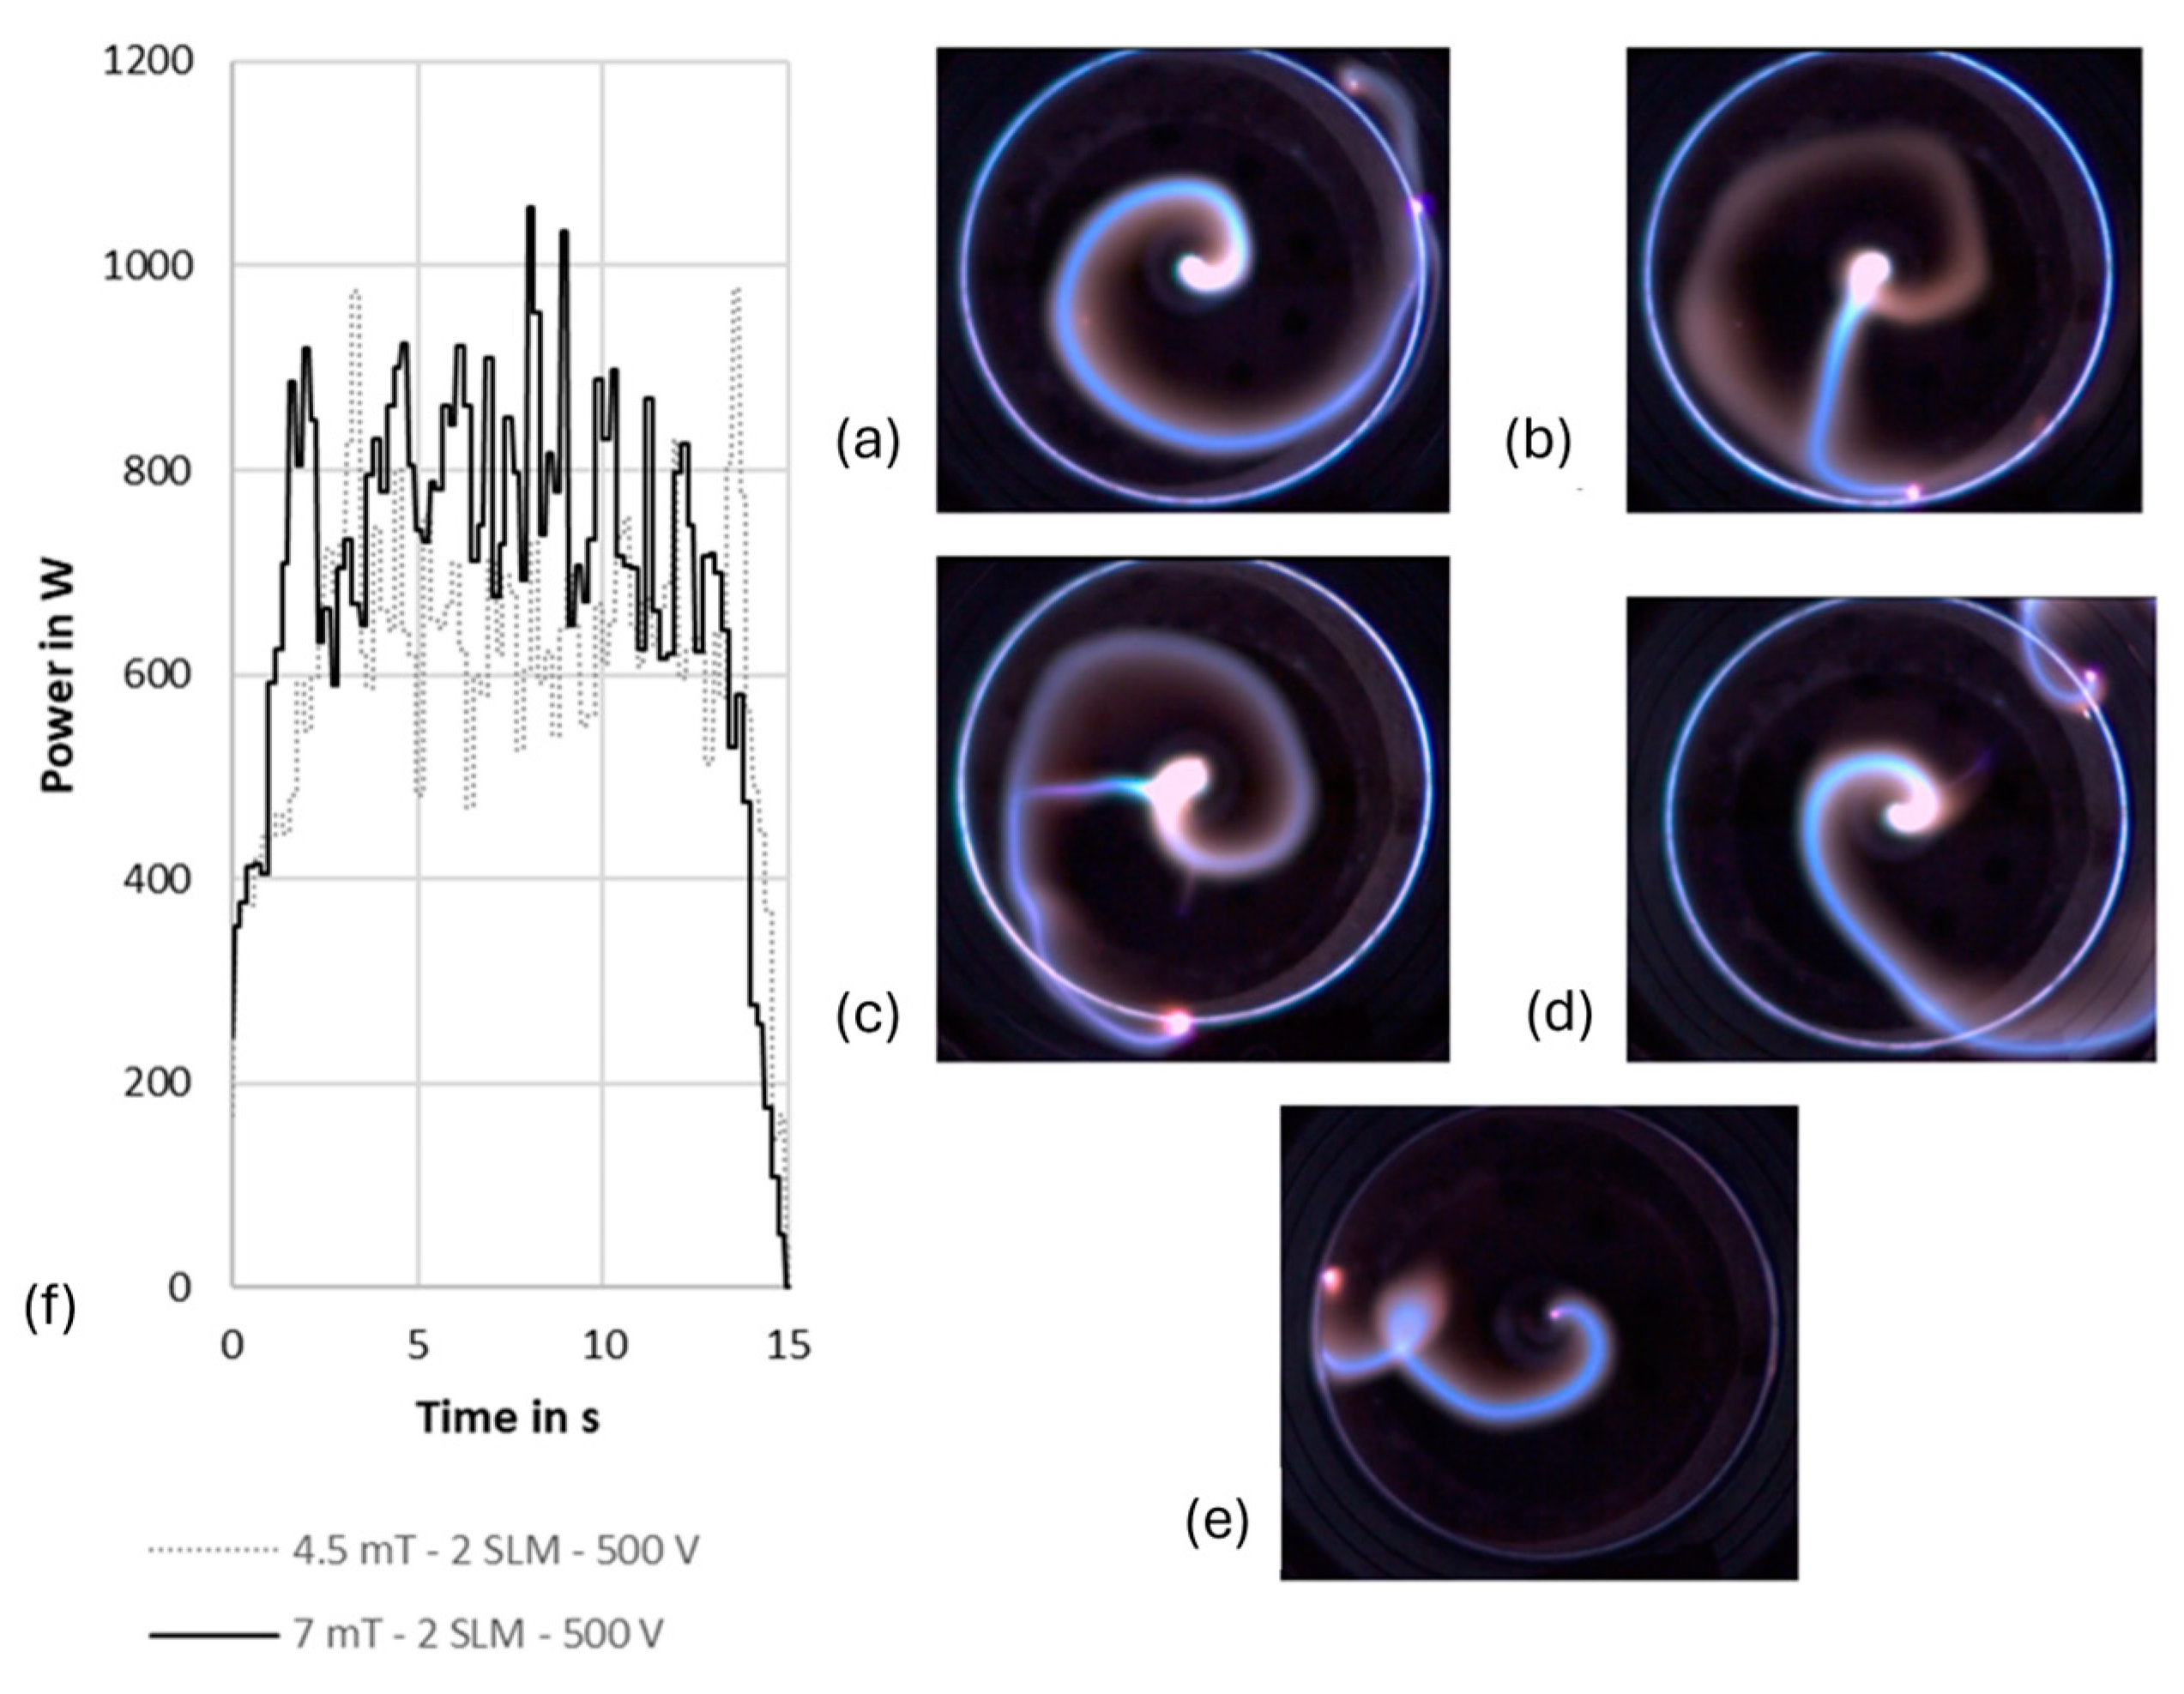
Figure 3 shows examples of two power runs recorded by the power supply, which were performed with a magnetic flux density of
, a volume flow of
, and an input voltage of
. The power oscillations, recorded by the power supply at a frequency of 5 Hz, are clearly recognizable. Next to the graph there are pictures of instability phenomena, recorded with the high-speed camera.
The shown phenomena of plasma power fluctuation include arc chattering (see (a)); breakdowns (see (b)), in which the arc collapses and reshapes; shortcuts (see (c)), seen as partial collapse and spiralizing, which can be subdivided into three-dimensional (see (d)) and planar ones (see (e)) and describe the formation and breakdown of spiral structures. The phenomena shown in (a) to (e) emphasise well how the arc length varies in the rotation process and the power deviations occurring when the previous arc extinguishes and the new arc appears.
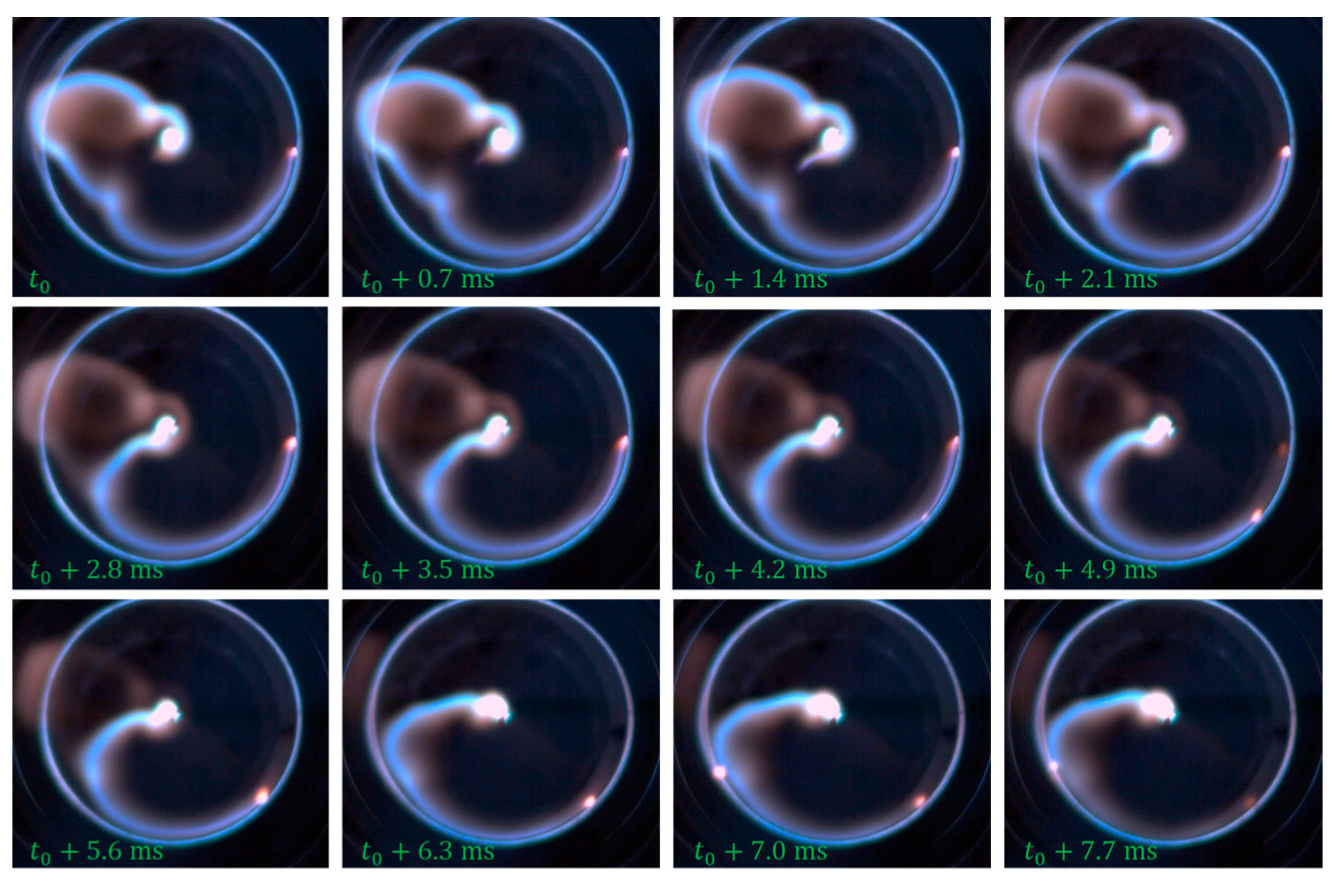
Figure 4 shows time steps that reveal both shortcut and arc chattering, recorded by the high-speed camera. The arc chattering describes the movement of the arc close to the ring electrode, as the connection point of the arc and the ring is not travelling smoothly but stepwise. The steps have a duration of around 0.5 to 1 ms and span a broad range of distances depending on the process conditions. The chattering effect is characterized by a smooth and stable rotation of most parts of the arc and a highly localized reformation of the arc near the ring electrode. Therefore, arc chattering is considered as a characteristic phenomenon of the process, which is not predetermined to be good or bad for gas-conversion reactions. However, it might give insights into the reaction progress, if the phenomena are well-understood. It might be used as an in operando indicator as it could be determined under process conditions. The shown shortcut in
Figure 4 forms in approx. 2 ms, but the exact occurrence of this and other phenomena like spiralizing is hard to assign to a time period.
The illustrations also clearly show how arc chattering occurs and how it leads to the rotation of the arc. The acting Lorentz force pushes the electrons of the beam in the direction of rotation. This results in an elongation of the arc. As long as the applied power on the primary side of the plasma driver is high enough, the arc is extended further. This process stops when the arc reaches a radius equal to the cathode radius. At a certain point, the resistivity of the gas between it and the cathode decreases, the electrons overcoming the small distance by arc chattering, because it is energetically favourable over maintaining the long arc. This creates a new cathode contact point. However, the force on the electrons can also shape the arc into a spiral and the gas flow can move the arc in a further direction, which sometimes prevents simple chattering and ends in a breakdown.
Considering the plasma phenomena from a reaction-engineering perspective, these inhomogeneities of the plasma disc lead to an uneven transfer of energy to the molecules. This leads to an increase in the dead volume, which can result in lower conversions and efficiencies. There is also a higher risk of the plasma collapsing, which means that continuous operation cannot be guaranteed. In addition, bends that are too long, especially with loops or further expansion, can lead to a change in the temperature gradient and thus to increased heat losses in the reactor. Theoretically, the best conversion of the molecules takes place when the arc jumps and re-forms as little as possible, which is the case with less power fluctuation and with an almost identical angular velocity of the plasma arc over the radius.
3. Optimization of Plasma Stability Through Mechanical Limitation of the Degree of Freedom
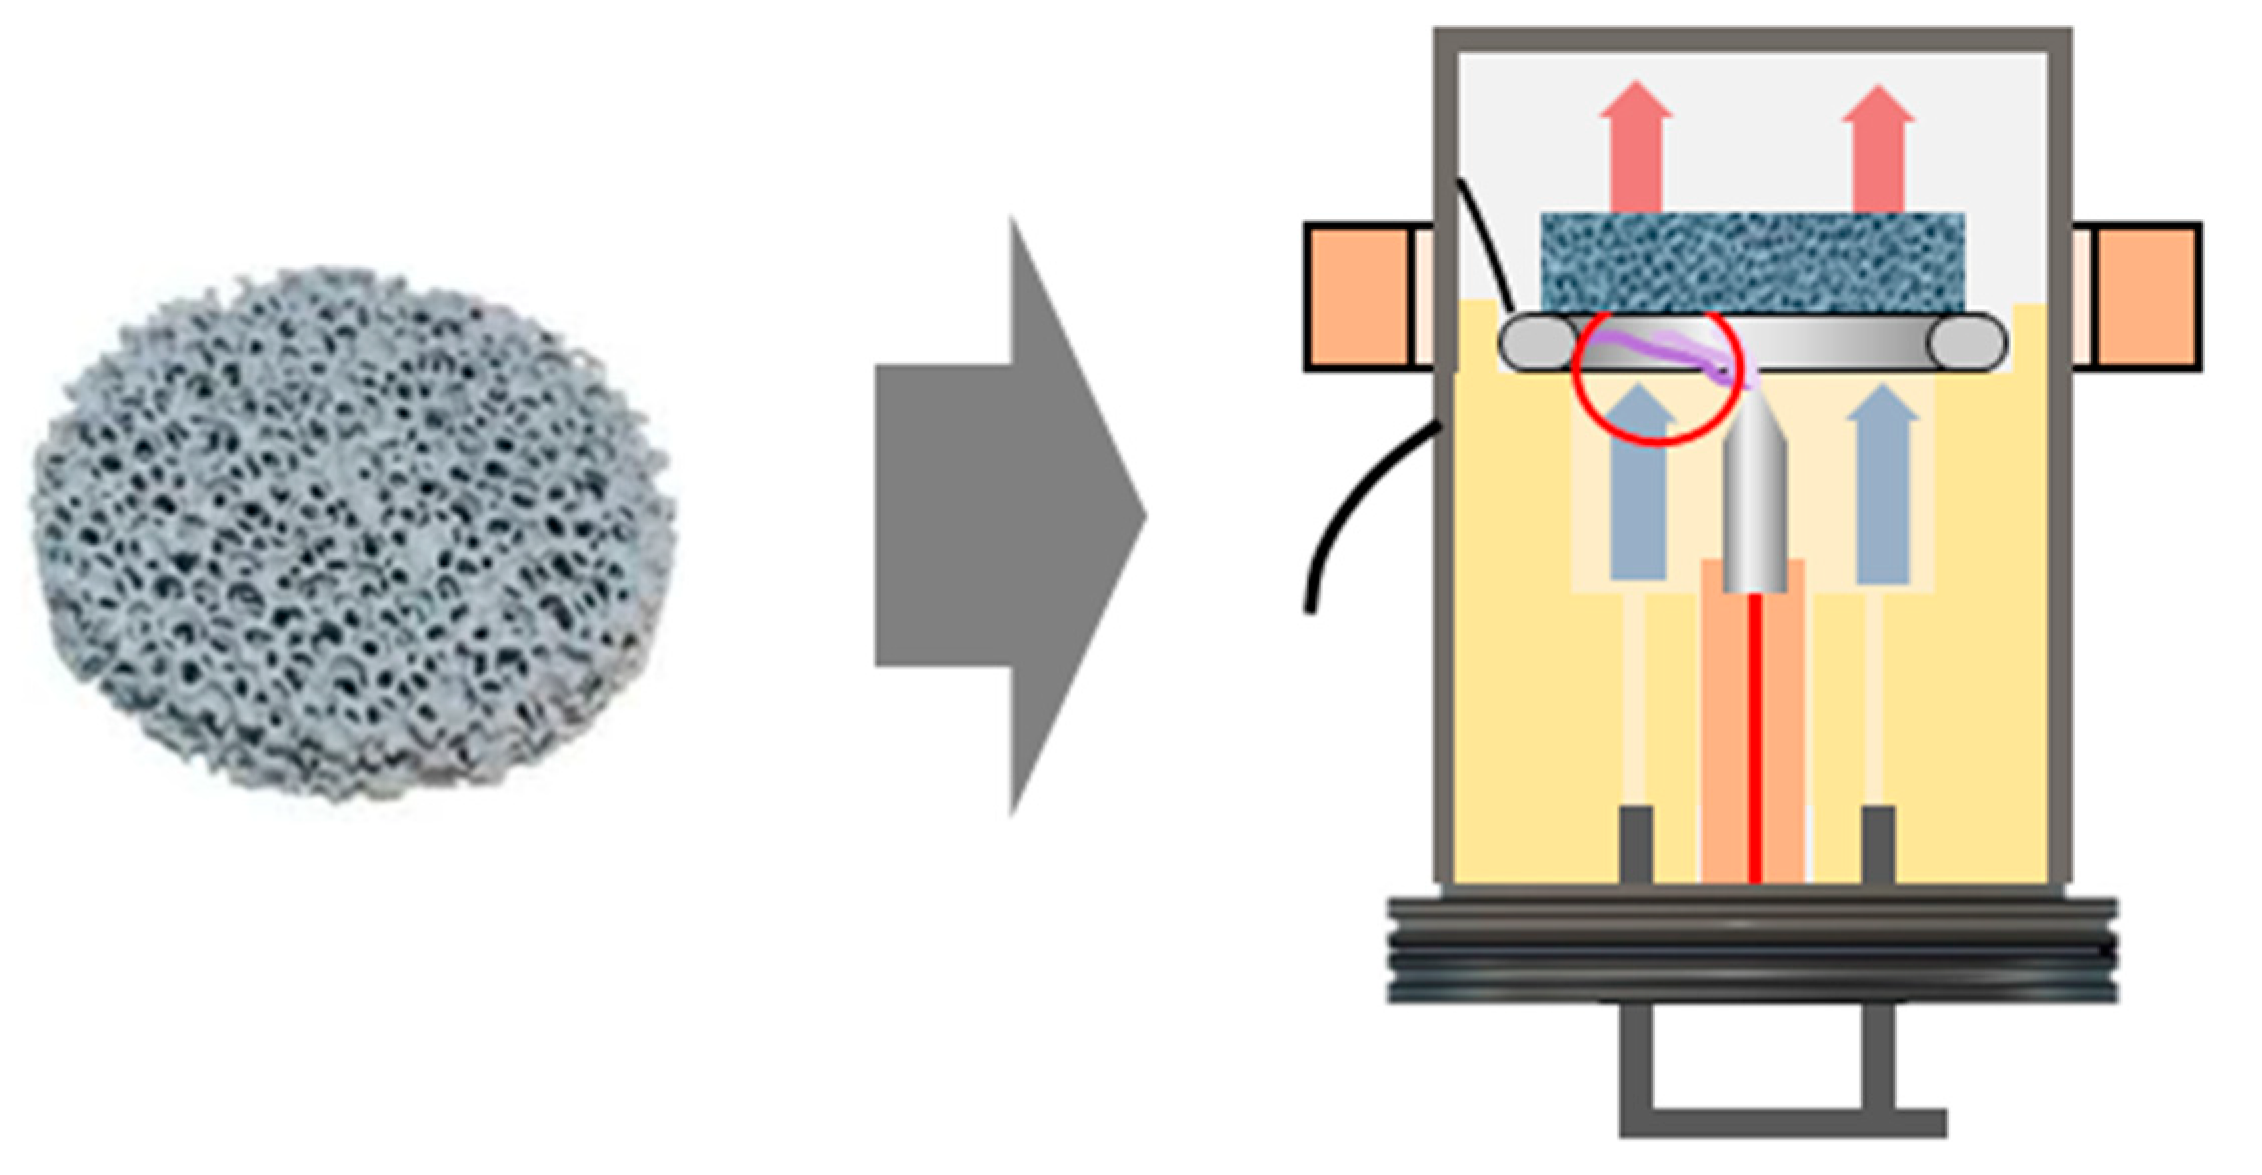
In order to minimize the plasma instability through the explained phenomena, we decided to include a ceramic foam as an engineering optimization of the reactor design, shown in
Figure 5. The integration of silicon carbide (SiC) foam directly on the cathode ring leads to a mechanical reduction in the degrees of freedom in the direction of uplift convection. The gas can flow unhindered through the ceramic, the plasma arc is held back against the direction of thermal convection and flow. This limitation avoids unnecessarily long plasma arcs and reduces inhomogeneity in the third dimension.
A direct comparison of the
behavior clearly shows the differences between the standard deviation with and without SiC.
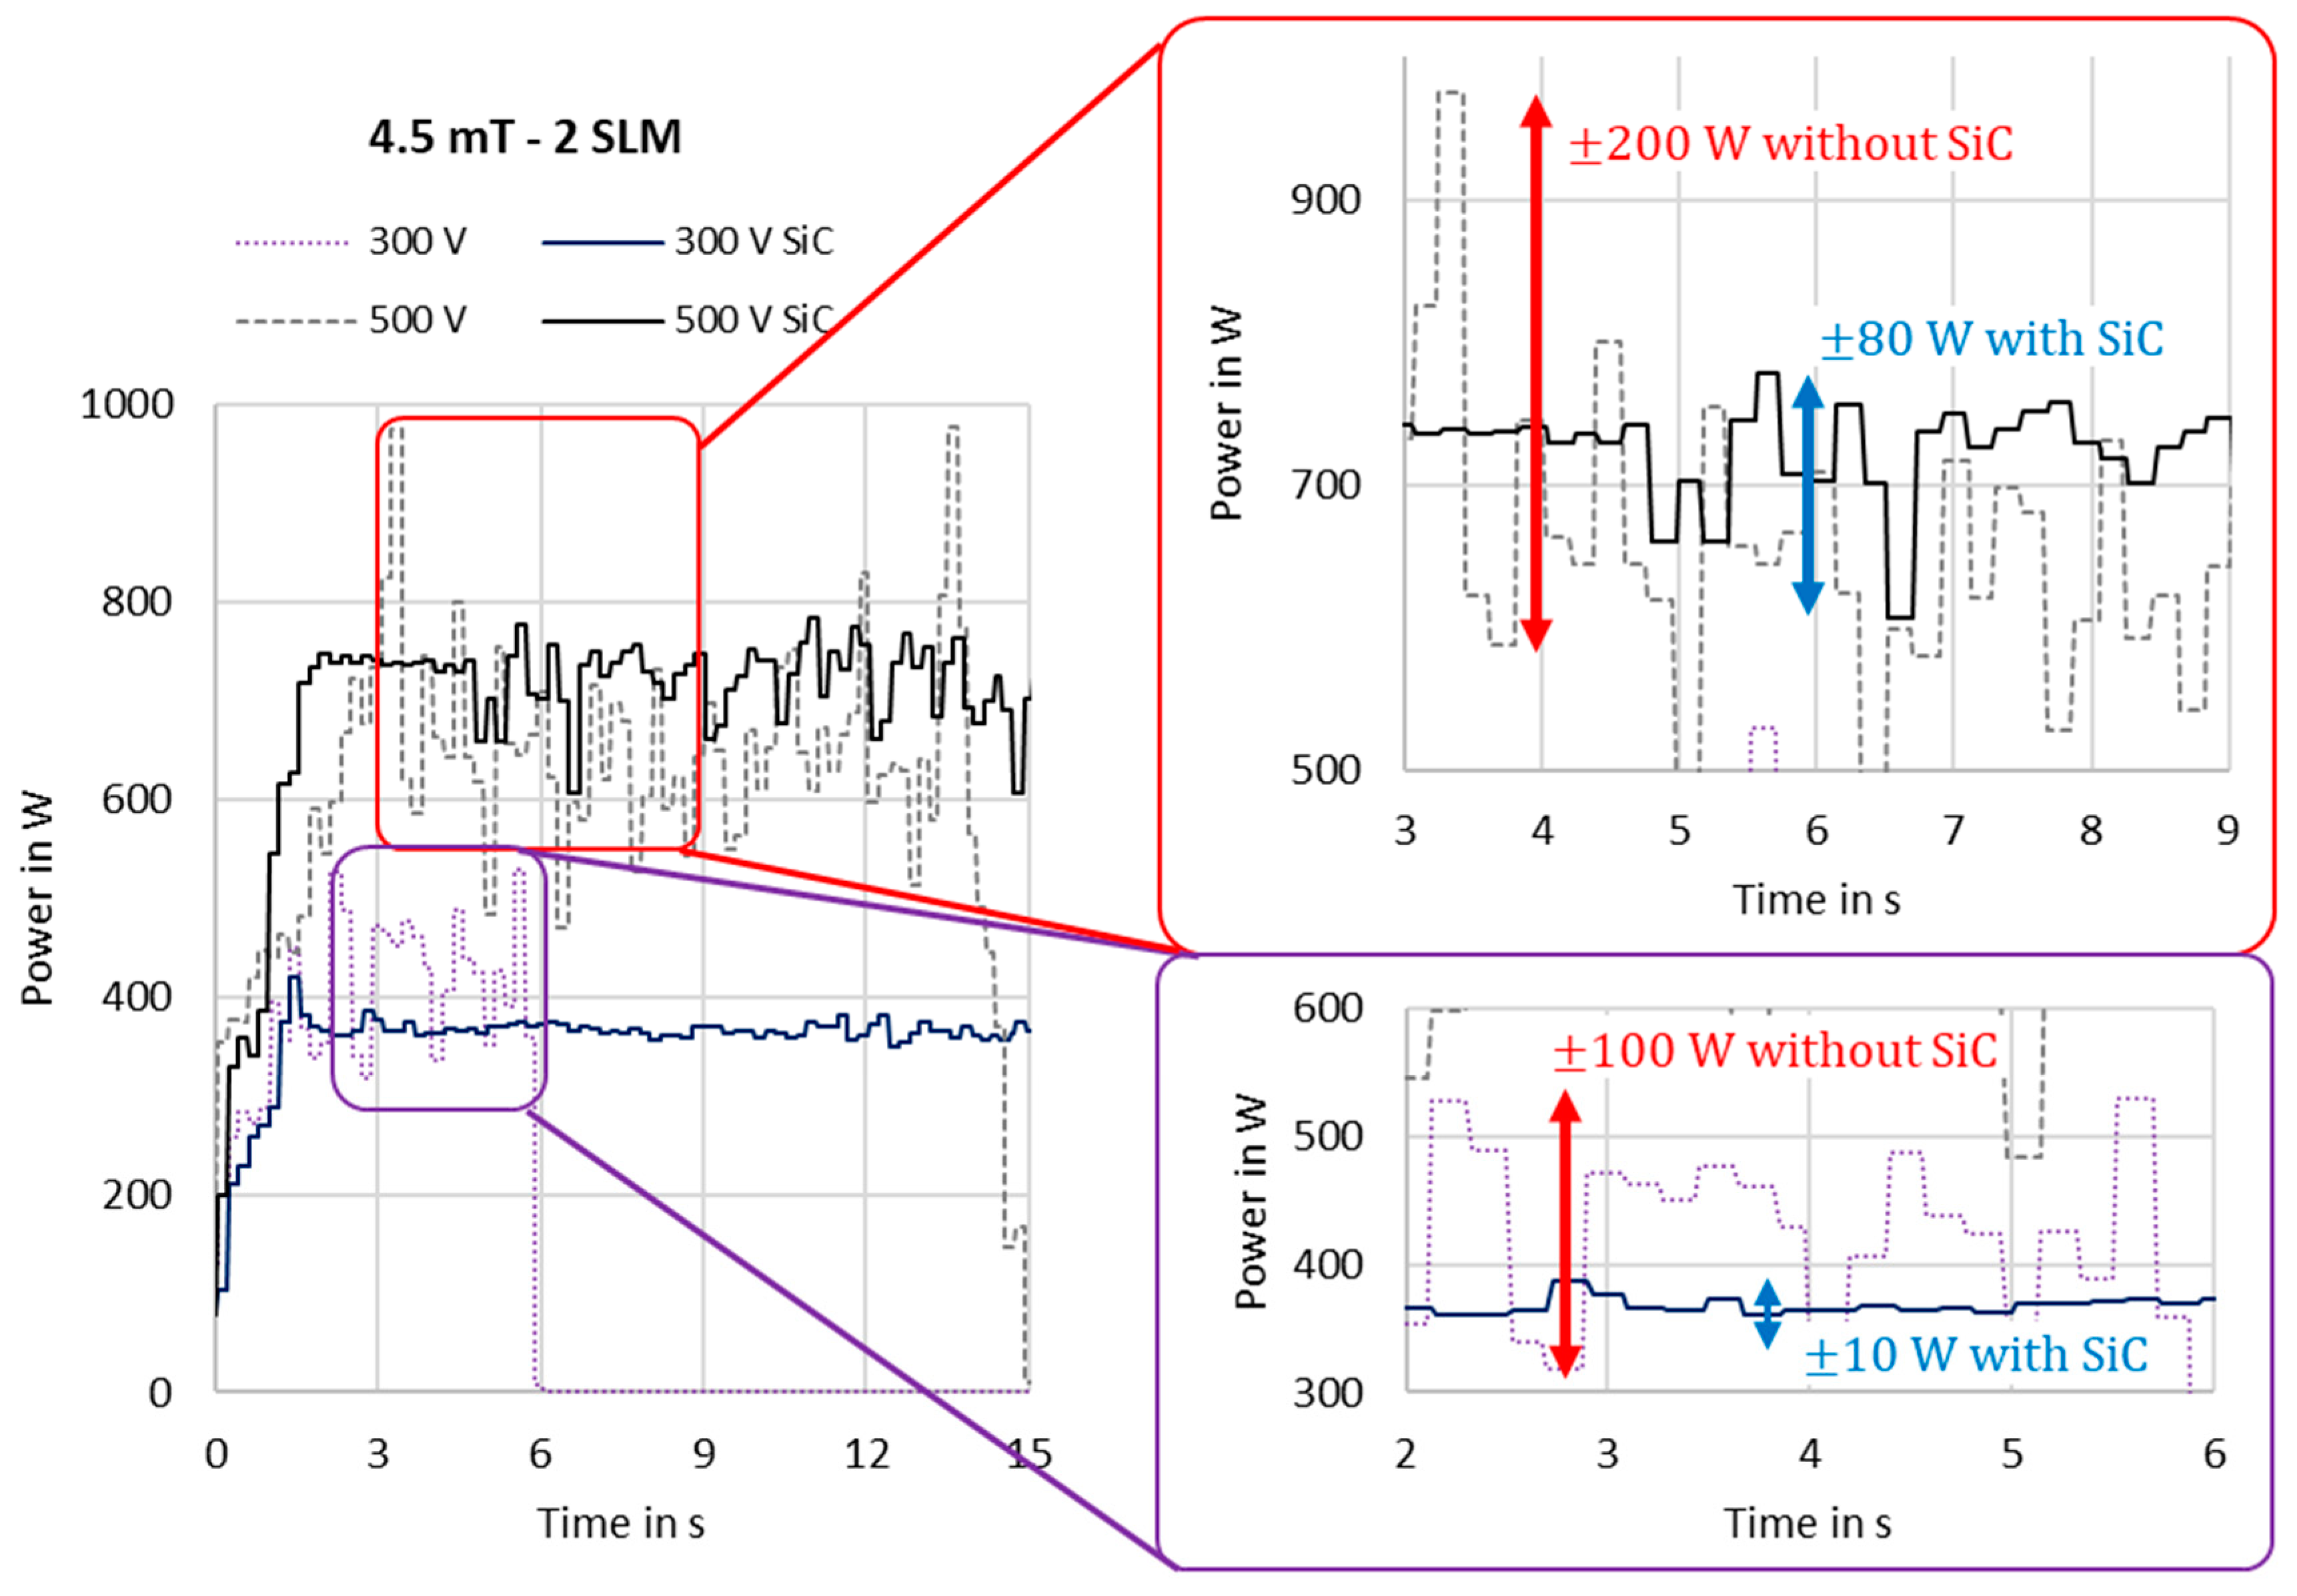
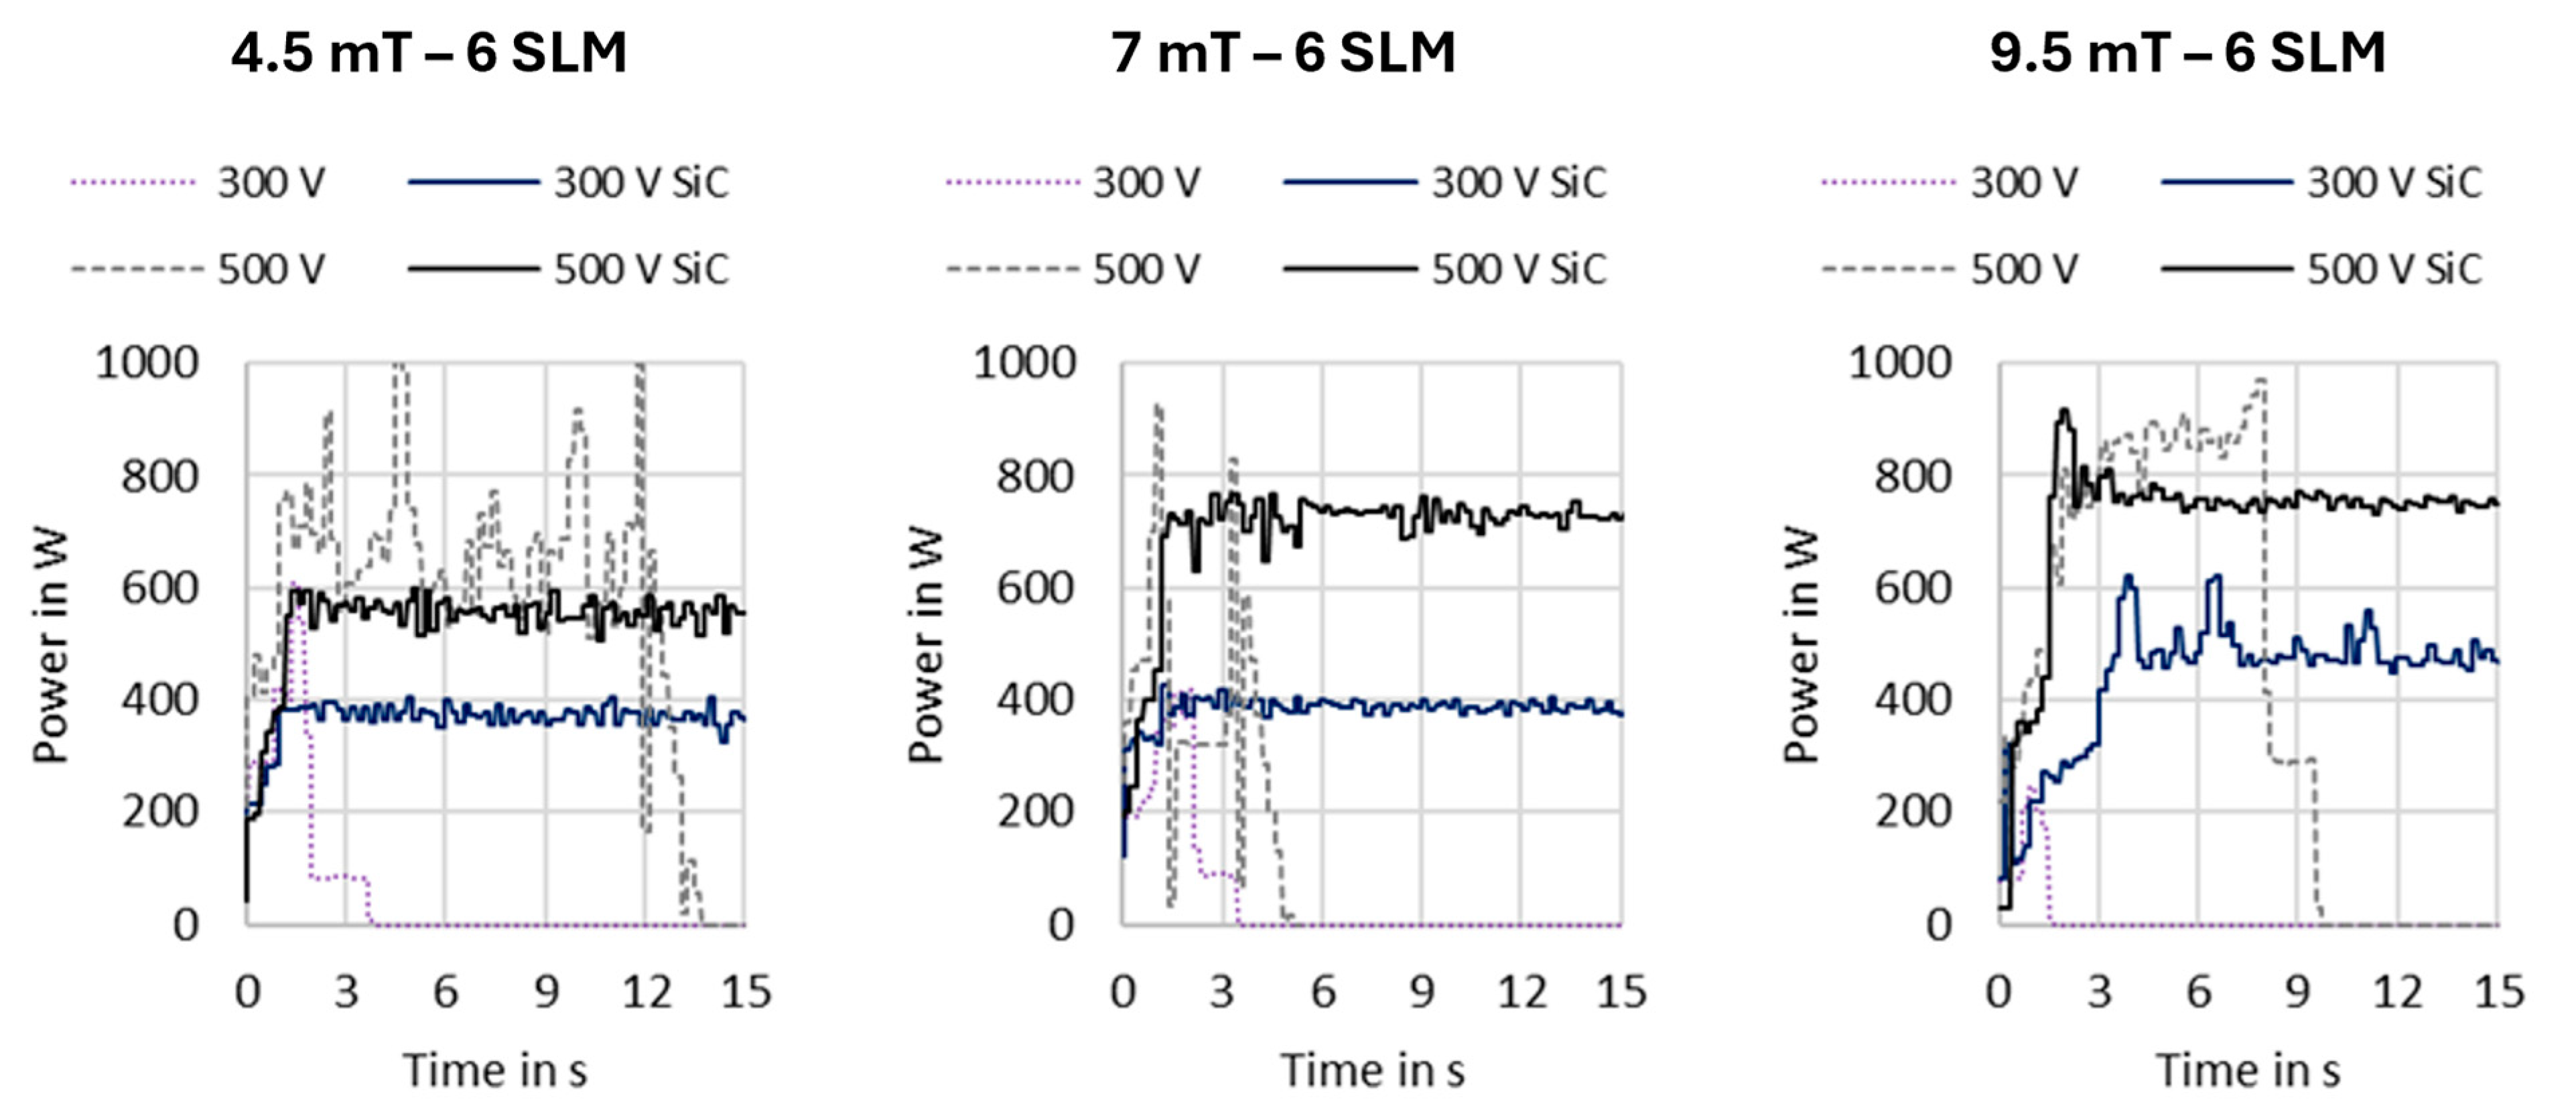
Figure 6 and
Figure 7 display the plasma starting behavior under different operating conditions without and with the integration of the SiC foam. The graphs show that without SiC we have significant instability which leads to a lower average power and fewer high-power peaks, which could harm the reactor or the electrical components. The figures clearly underline how the power fluctuation is reduced by restricting the arc. It is particularly notable that no stable plasma could be maintained in the experiments with 300 V input voltage without SiC. With SiC, on the other hand, a very smooth power curve was observed at approx. 400 W, especially at low magnetic field strengths. At 500 V, it was possible to keep the plasma stable even without SiC, but the differences in the deviation were very large. Also, the increase in the magnetic flux density and the volume flow to
and
, shown in
Figure 7, lead to unstable plasma even with a higher input voltage.
The plasma power deviation is around five-times higher in the cases without SiC. The higher stability also influenced the power increase with an increasing magnetic field. Keeping all parameter identical, it would be expected that an increased magnetic field would result in a higher plasma power. This is nicely observed in the experiments conducted with SiC but not in the experiments without SiC. Without SiC, the instability of the arc causes dominating disturbances in the system and erratic power development is recorded. For further details, please see
Table A1 (input voltage 300 V) and
Table A2 (input voltage 500 V)
Appendix A. They show the average power and the standard deviation for all variations compared with and without SiC. The time range was restricted, so the first slope and the power drop at switch-off/termination were not considered.
4. Observation of Operating Conditions on the Arc Behavior
The rotation of the arc is analysed in the following observations. The influences of various operating parameters on the rotation frequency and on occurring phenomena such as arc chattering are presented.
4.1. Rotational Arc Frequency
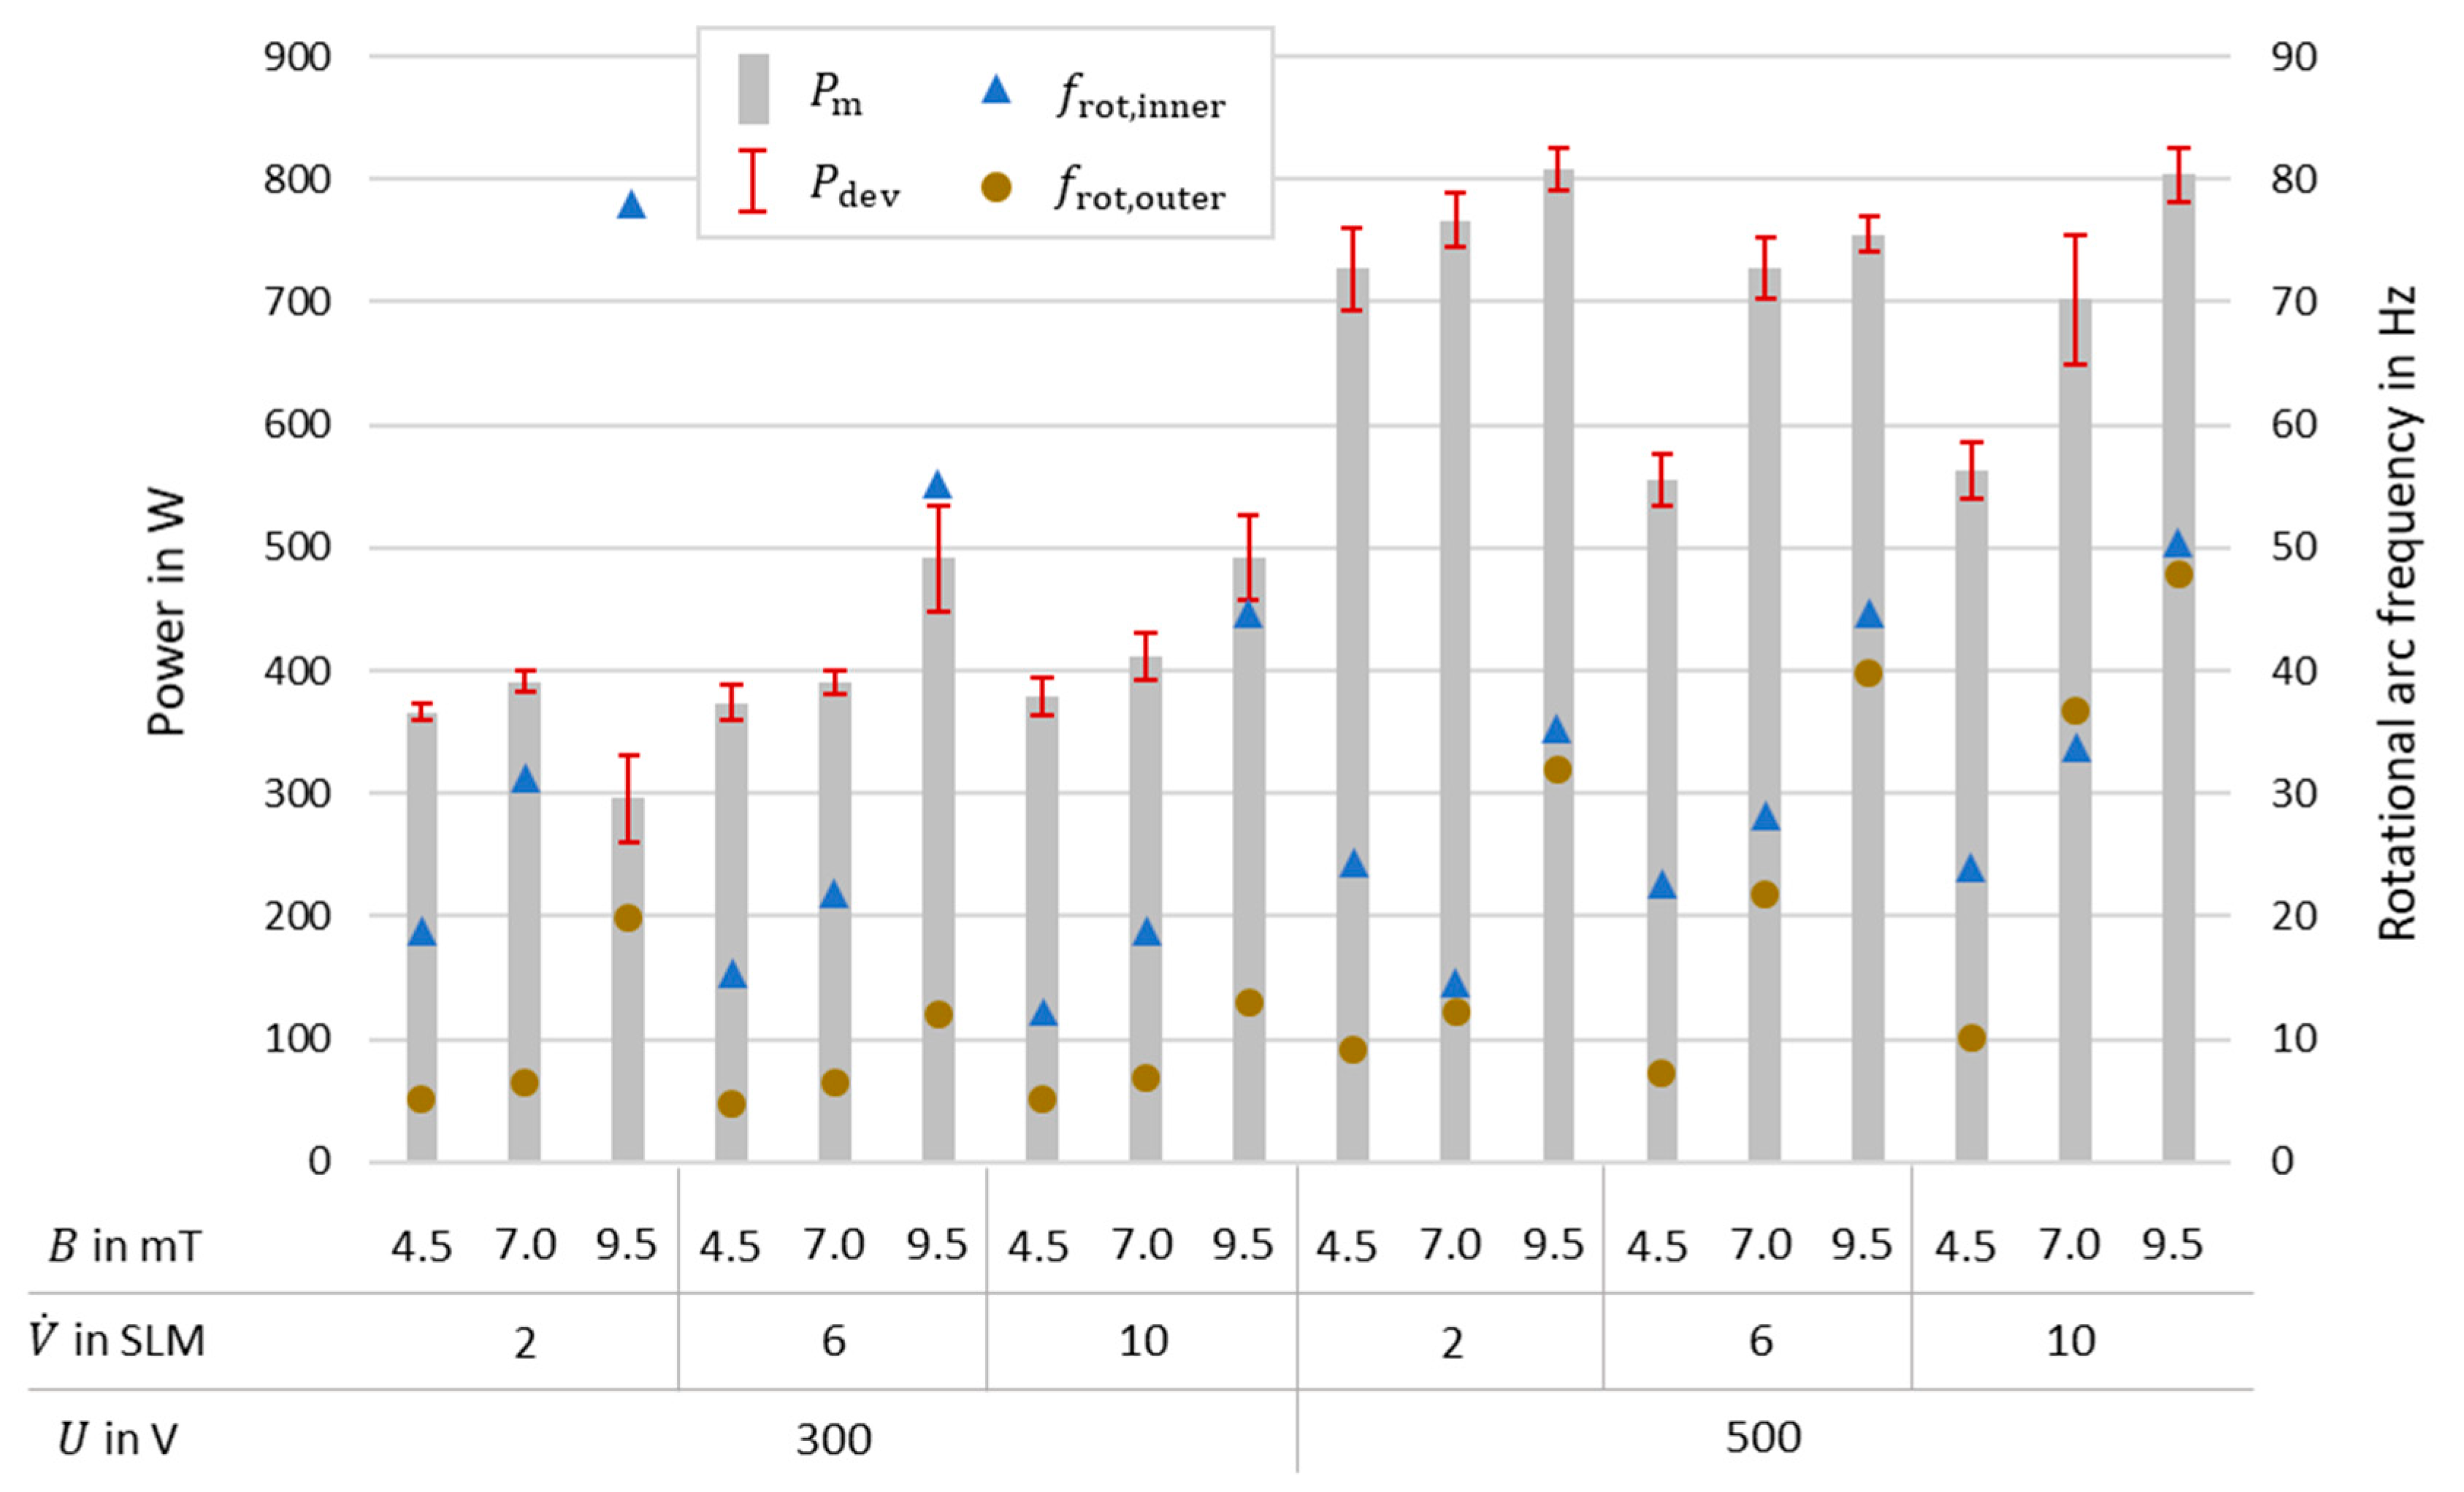
Figure 8 compares only the tests with integrated SiC. In addition to the average power and the standard deviation, the frequencies of the arc rotation recorded with the high-speed camera are also shown.
When comparing the graphs, there is a noticeable trend that an increase in the magnetic flux leads to an increase in power; this is due to the elongation of the arc caused by the increased Lorentz force on the electron beam. Lengthening the arc increases the plasma voltage at the electrode setup. Due to a current-limiting electrical circuit, this increase in voltage is reflected in an increase in current on the LV side, which, when multiplied by the constant input voltage, results in increased power. This increase in power with increasing is different for varying volume flows of the gas and depending on the input voltage.
The rotation frequencies of the arc shown are mean values taken from three randomly picked video sequences at different operating times. When comparing them, we can clearly see that the frequency increases as expected with increasing magnetic flux. At low voltage levels, this increase is not linear. At higher voltage levels, the increase in frequency is linear, especially at higher volumetric currents, but the increase is significantly greater than at 300 V. It is also noticeable that the frequencies increase when all three parameters are increased, which makes sense due to the physical definition of the Lorentz force. However, an increased frequency of arc rotation does not necessarily lead to a higher power. The highest power was achieved at 9.5 mT, 500 V, and 2 SLM.
In theory, the jumping of the cathode point can be avoided if the rotation speeds at the anode and cathode have a similar speed. If this is the case, it leads to fewer fluctuations in power and therefore more efficient energy transfer. If one considers the frequency differences of a rotation of the arc along the cathode and along the anode, this is only partially true when compared with the power fluctuation. At an input voltage of 300 V, the frequencies outside and inside are relatively far apart. With the high-speed camera, it was possible to see that although an arc rotation occurs at higher magnetic fields, new arcs are always formed which have the same cathode point or only a slight shift. This does not result in a large fluctuation in power, but it does lead to a lower homogeneity of the plasma.
Zhang et al. derived Equation (3) to estimate the rotation frequency of a magnetically driven rotating arc plasma, which considers the Lorentz force as well as a drag force [
13]:
If this equation is used, then using an average current of approx. 0.5 A at an input voltage of 500 V and taking into account the drag coefficient used in Ch3.1 and an arc diameter of 1.5 mm, a rotation frequency varying from 5 to 7 Hz depending on the volume flow and magnetic flux density is obtained. The equation therefore appears to at least estimate the correct scale, but the assumptions of the arc diameter and resistance coefficient and the assumption of a steady state are not sufficiently accurate to arrive at the real values. With a reduction in the arc diameter to 1 mm and a reduction in by half, the frequency for 4.5 mT approximates very well; for higher values, the approximation is not meaningful for our reactor.
In general, applying a drag coefficient to describe the dynamics of a plasma arc presents several challenges, as arcs lack distinct physical boundaries, significantly alter local gas density, and exhibit temperature gradients that impact gas viscosity and density. Unlike solid bodies with clear shapes and edges, an arc gradually transitions into the surrounding gas, creating a diffusion zone without a precise separation from its environment. The arc’s high temperatures lead to substantial density variations within the surrounding gas. These fluctuations make assigning a constant drag coefficient problematic, as both density and viscosity change continuously with distance from the arc’s core. Traditional drag coefficients, which rely on well-defined boundaries, are difficult to apply here because the arc’s gradual diffusion into the surrounding air complicates determining an effective cross-sectional area. This lack of a precise “edge” further obscures the drag effects the arc experiences. Additionally, the arc’s dynamic plasma properties—such as electron density, ionization levels, and collision frequency—continuously influence the arc’s resistive and emissive characteristics, altering its interaction with surrounding gases. This dynamic behavior challenges the assumption of a stable drag coefficient, as the arc’s environment is constantly changing. Using drag coefficients for these conditions should be seen as providing only an orientational value, as they may deviate significantly from actual values. As a result, drag coefficients are insufficient for accurately predicting rotational frequencies in this context.
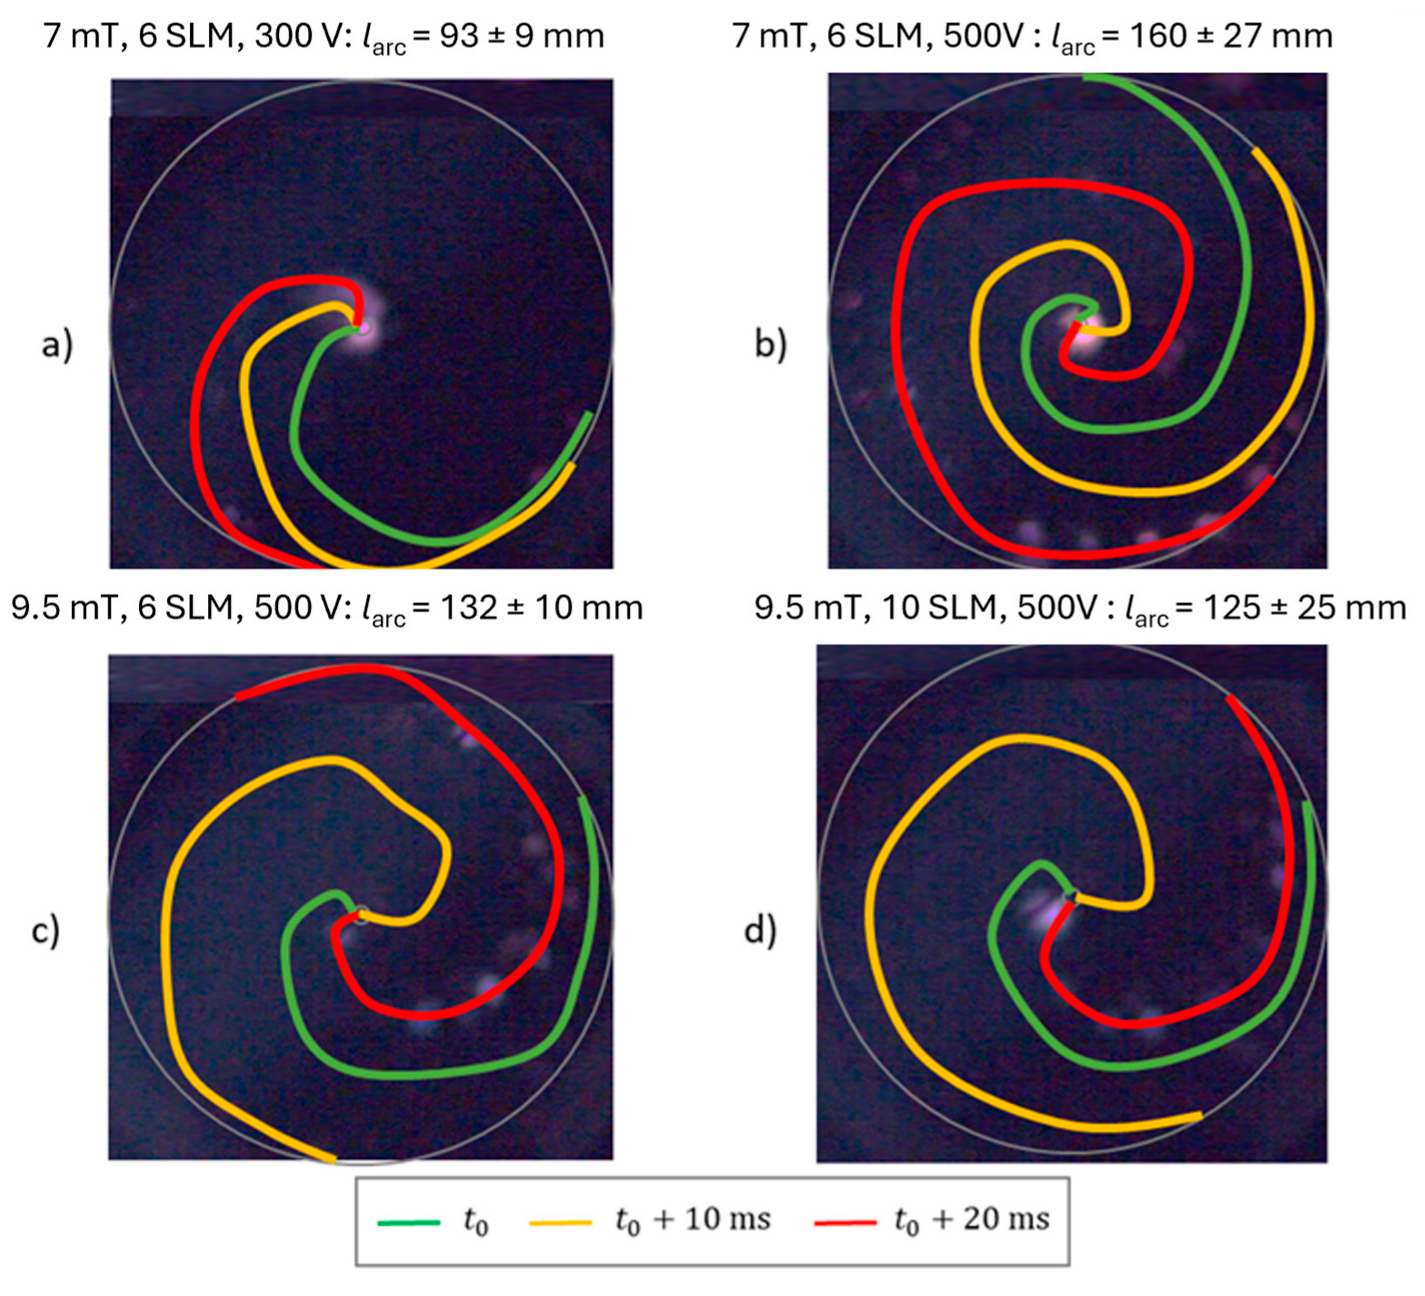
Figure 9 shows a few recordings from the high-speed camera and their qualitative evaluation of the arc movement. Frames were selected from the videos with an interval of 10 ms. The plasma arc was traced in the respective frames. In the last frame, the two previous arcs were inserted, displaying three plasma arcs. The four selected experiments are characterised by small inhomogeneity in the power curve. In the video, they are characterised by the fact that there are only minor cathode jumps, defined as arc chattering, and no other phenomena occur.
The comparison of graph (a) to (b) clearly shows the difference between the two voltage levels of 300 V and 500 V input voltage. The rotational frequencies of the arc under the experimental conditions were determined to be 11 Hz for condition (a) at 7 mT, 6 SLM, and 300 V; 18 Hz for condition (b) at 7 mT, 6 SLM, and 500 V; 36 Hz for condition (c) at 9.5 mT, 6 SLM, and 500 V; and 46 Hz for condition (d) at 9.5 mT, 10 SLM, and 500 V. The time increments shown in
Figure 9 represent the temporal spacing of individual snapshots used to track the arc’s position over its rotational cycle. The angle of rotation correlates with these time increments and the observed frequency, as the arc completes one full revolution over the reciprocal of the frequency. Thus, the temporal resolution of the data enables clear visualization of the arc’s position at discrete intervals within its rotational cycle, consistent with the experimentally measured frequencies. The length of the rotating arc is increased approximately linearly by a factor between 1.3 and 1.9. The ratio of the average power of both experiments is 1.87 and is therefore slightly higher than the voltage ratio, but still in the upper range of the arc length ratio. If we look at the arc length with an increase in the magnetic flux density in (c), no further lengthening of the arc can be seen. If the change in arc length over time is compared, smaller deviations can be recognised here, which is also evident in the lower power fluctuation (
Figure 8). Increasing the volume flow also has no significant effect on the arc length or speed.
When looking at the arc movement, mostly chattering alone is happening, and shortcuts, spirals, and breakdowns happen rarely. To identify those frequencies, a further investigation was performed with a measurement of the plasma current
. The deviations of the plasma current result from the change in arc length and should therefore also reflect the phenomena already shown in
Section 3.
Figure 10 shows the current curve and an FFT (Fast Fourier Transformation) spectrum of the stable operating point with 9.5 mT, 6 SLM, and 500 V.
Various fluctuations can be recognised in the behavior of
. Firstly,
decreases continuously with small jumps until it reaches a critical value and then increases again. As the current is anti-proportional to the plasma voltage, this decrease corresponds to the lengthening of the arc. The jumps that can be seen are the phenomena that correspond to arc chattering with a smaller or larger distance, depending on the extent. The sections that repeat within approx. 20 ms are covered in the FFT spectrum with a frequency of 45 Hz and thus correspond to the rotation frequency of the arc observed by the camera. Taking the arc length development into account, this means that the arc performs a type of reset after each round and is back in chattering mode. This indicates a possible inhomogeneity of the magnetic field or the flow field.
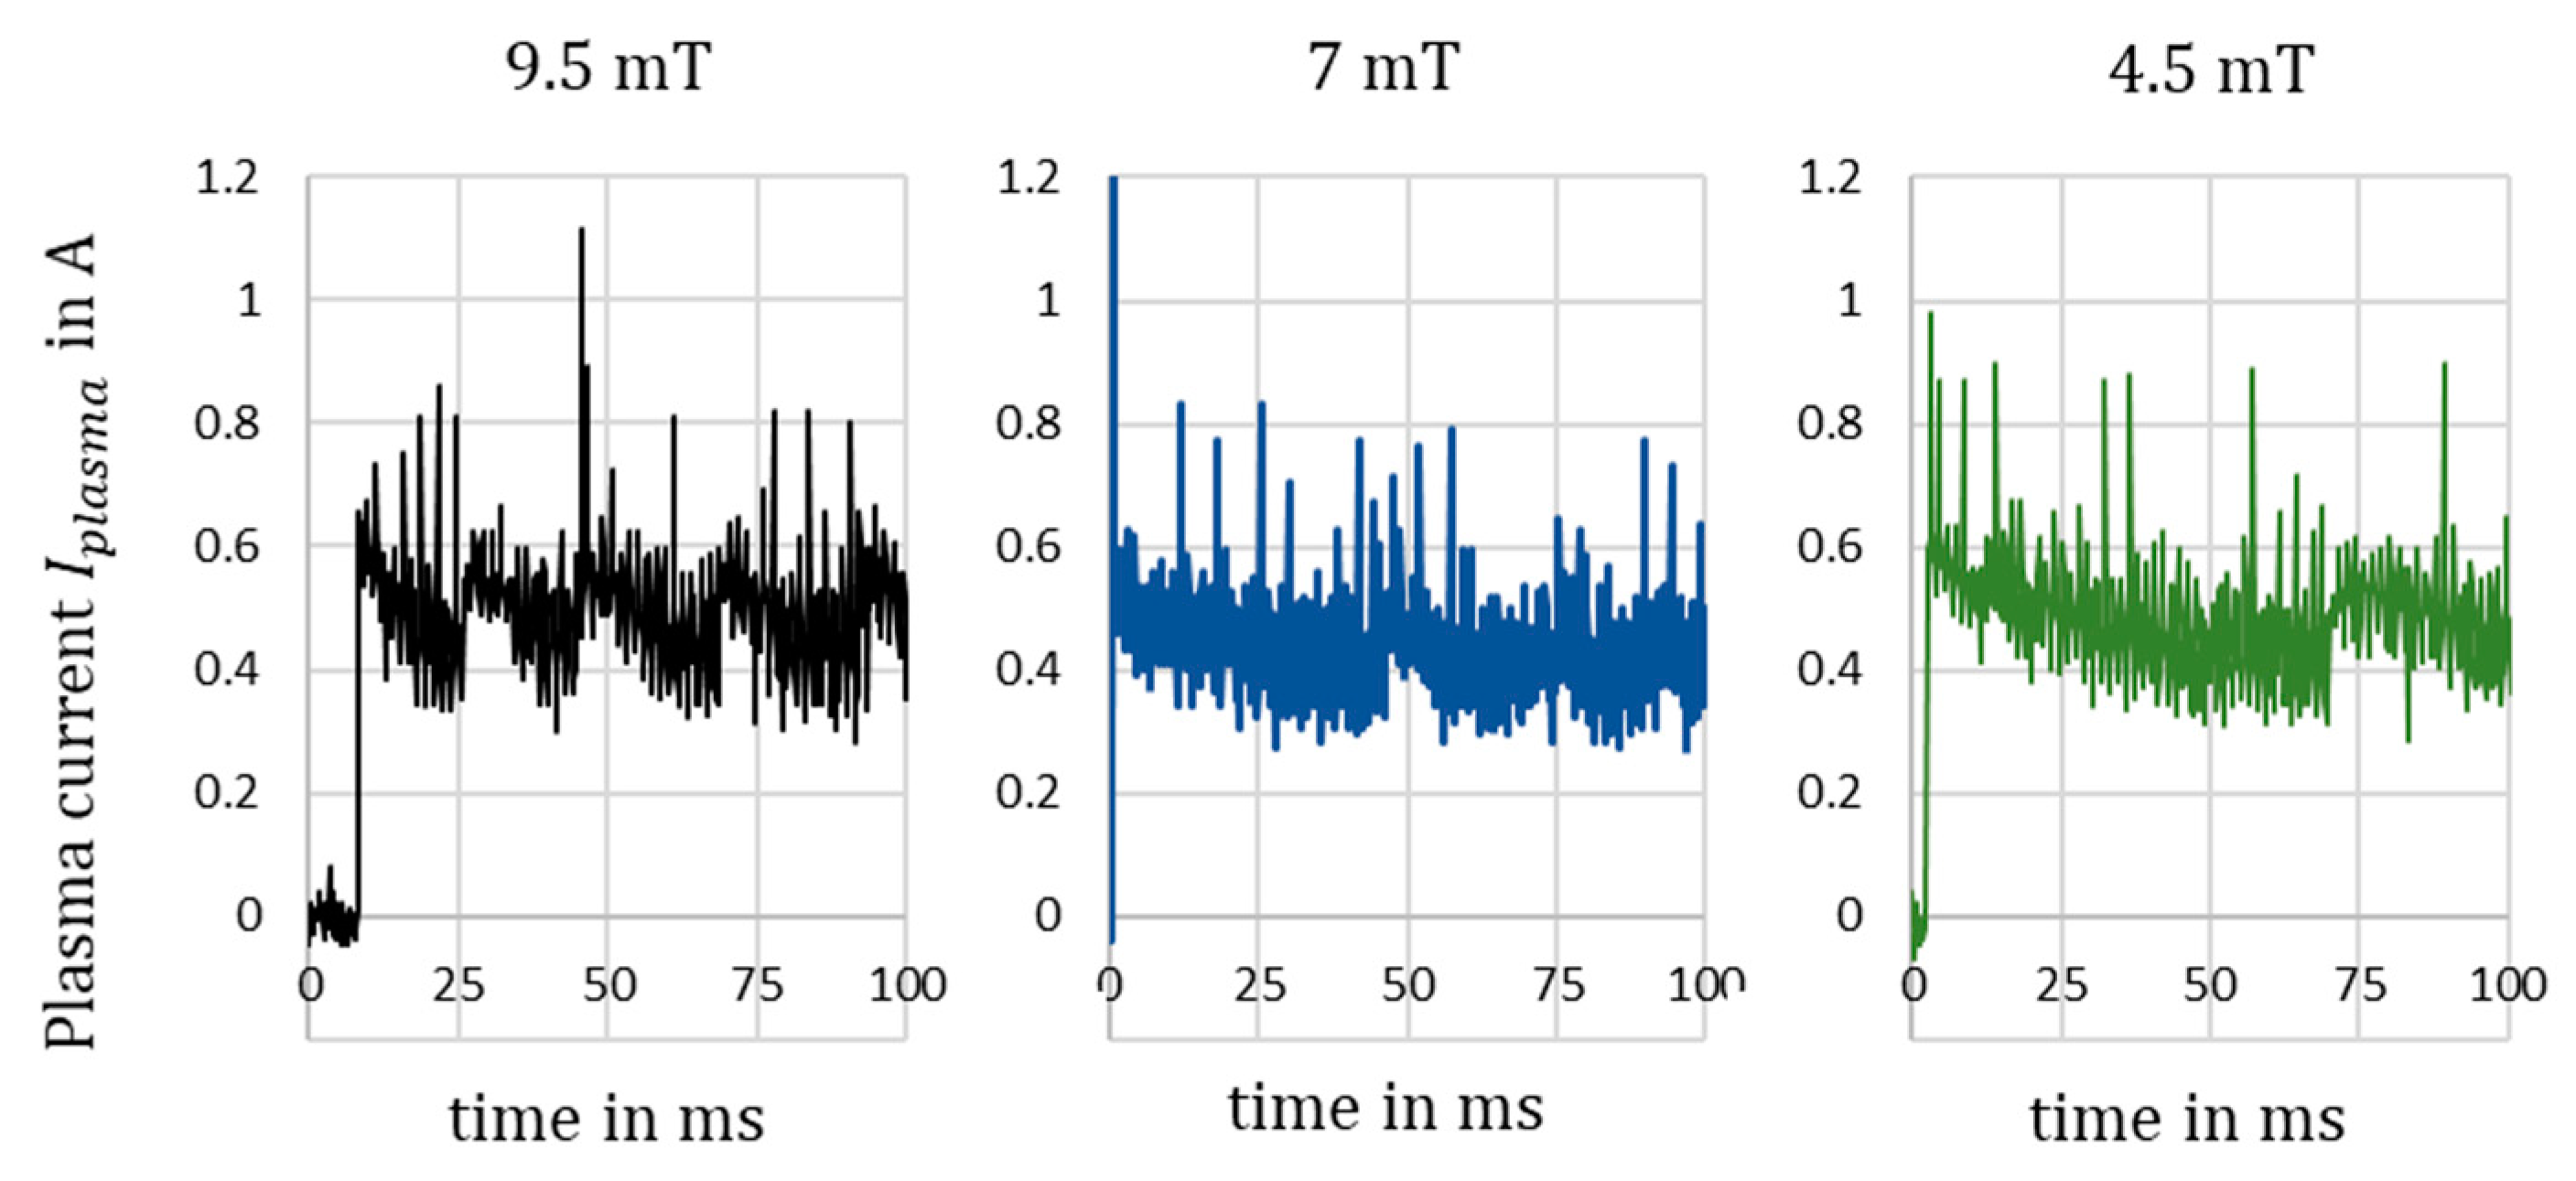
Figure 11 shows the
curves over 100 ms for different magnetic fields. As in
Figure 10, a rotation frequency can be seen which is relatively similar to that identified optically.
It is interesting to note that the frequencies with the highest amplitude are clearly above the rotation frequency of the arc. We assume these frequencies are coming from the small deviations defined as arc chattering.
4.2. Chattering Frequencies
In parallel to the rotation frequency, the chattering frequency is also an interesting characteristic. Based on the optimised observations, see
Figure 10, the chattering phenomenon lasts between 0.4 and 2 ms in the case under consideration. If this arc movement is constant, frequencies between 500 and 2500 Hz should be observable.
In order to compare the dominant higher frequencies in the signal, an optimized frequency analysis was performed with the Welch method. Sections were selected from the measurements that cover up to 10 s and thus comprise up to 54,000 measurement points. Segment lengths of 1024 were used, a Hamming window function was applied, and an overlap of 50% was used. Based on the analysis, the spectral power densities were determined in dB/Hz and plotted over the frequencies. Due to the sampling frequency of 5400 Hz, phenomena with frequencies up to 2700 Hz are analysed according to Nyquist. This means that frequency durations down to a minimum of 0.37 ms can be analysed, which corresponds to the time of one frame of the high-speed camera. By using power spectra, it is possible to store frequency data with fewer data points and to extract the necessary data for process control more easily using functions such as findpeaks.
As per the Lorentz law given in Equation (4), the force experienced by the charged particle moving perpendicular to the uniform magnetic field is dependent on the electric field and the magnetic field.
Theoretically the variation in magnetic flux density and electric potential would impact the arc dynamics. Therefore, experimental investigations were performed to study different arc dynamic phenomena in relation to magnetic flux density and power, including various other parameters.
In this work, the analyses were carried out under different parameter variations: magnetic flux, volume flow, input voltage, material of the cathode, thickness and diameter of the cathode, and adaptation of the gas.
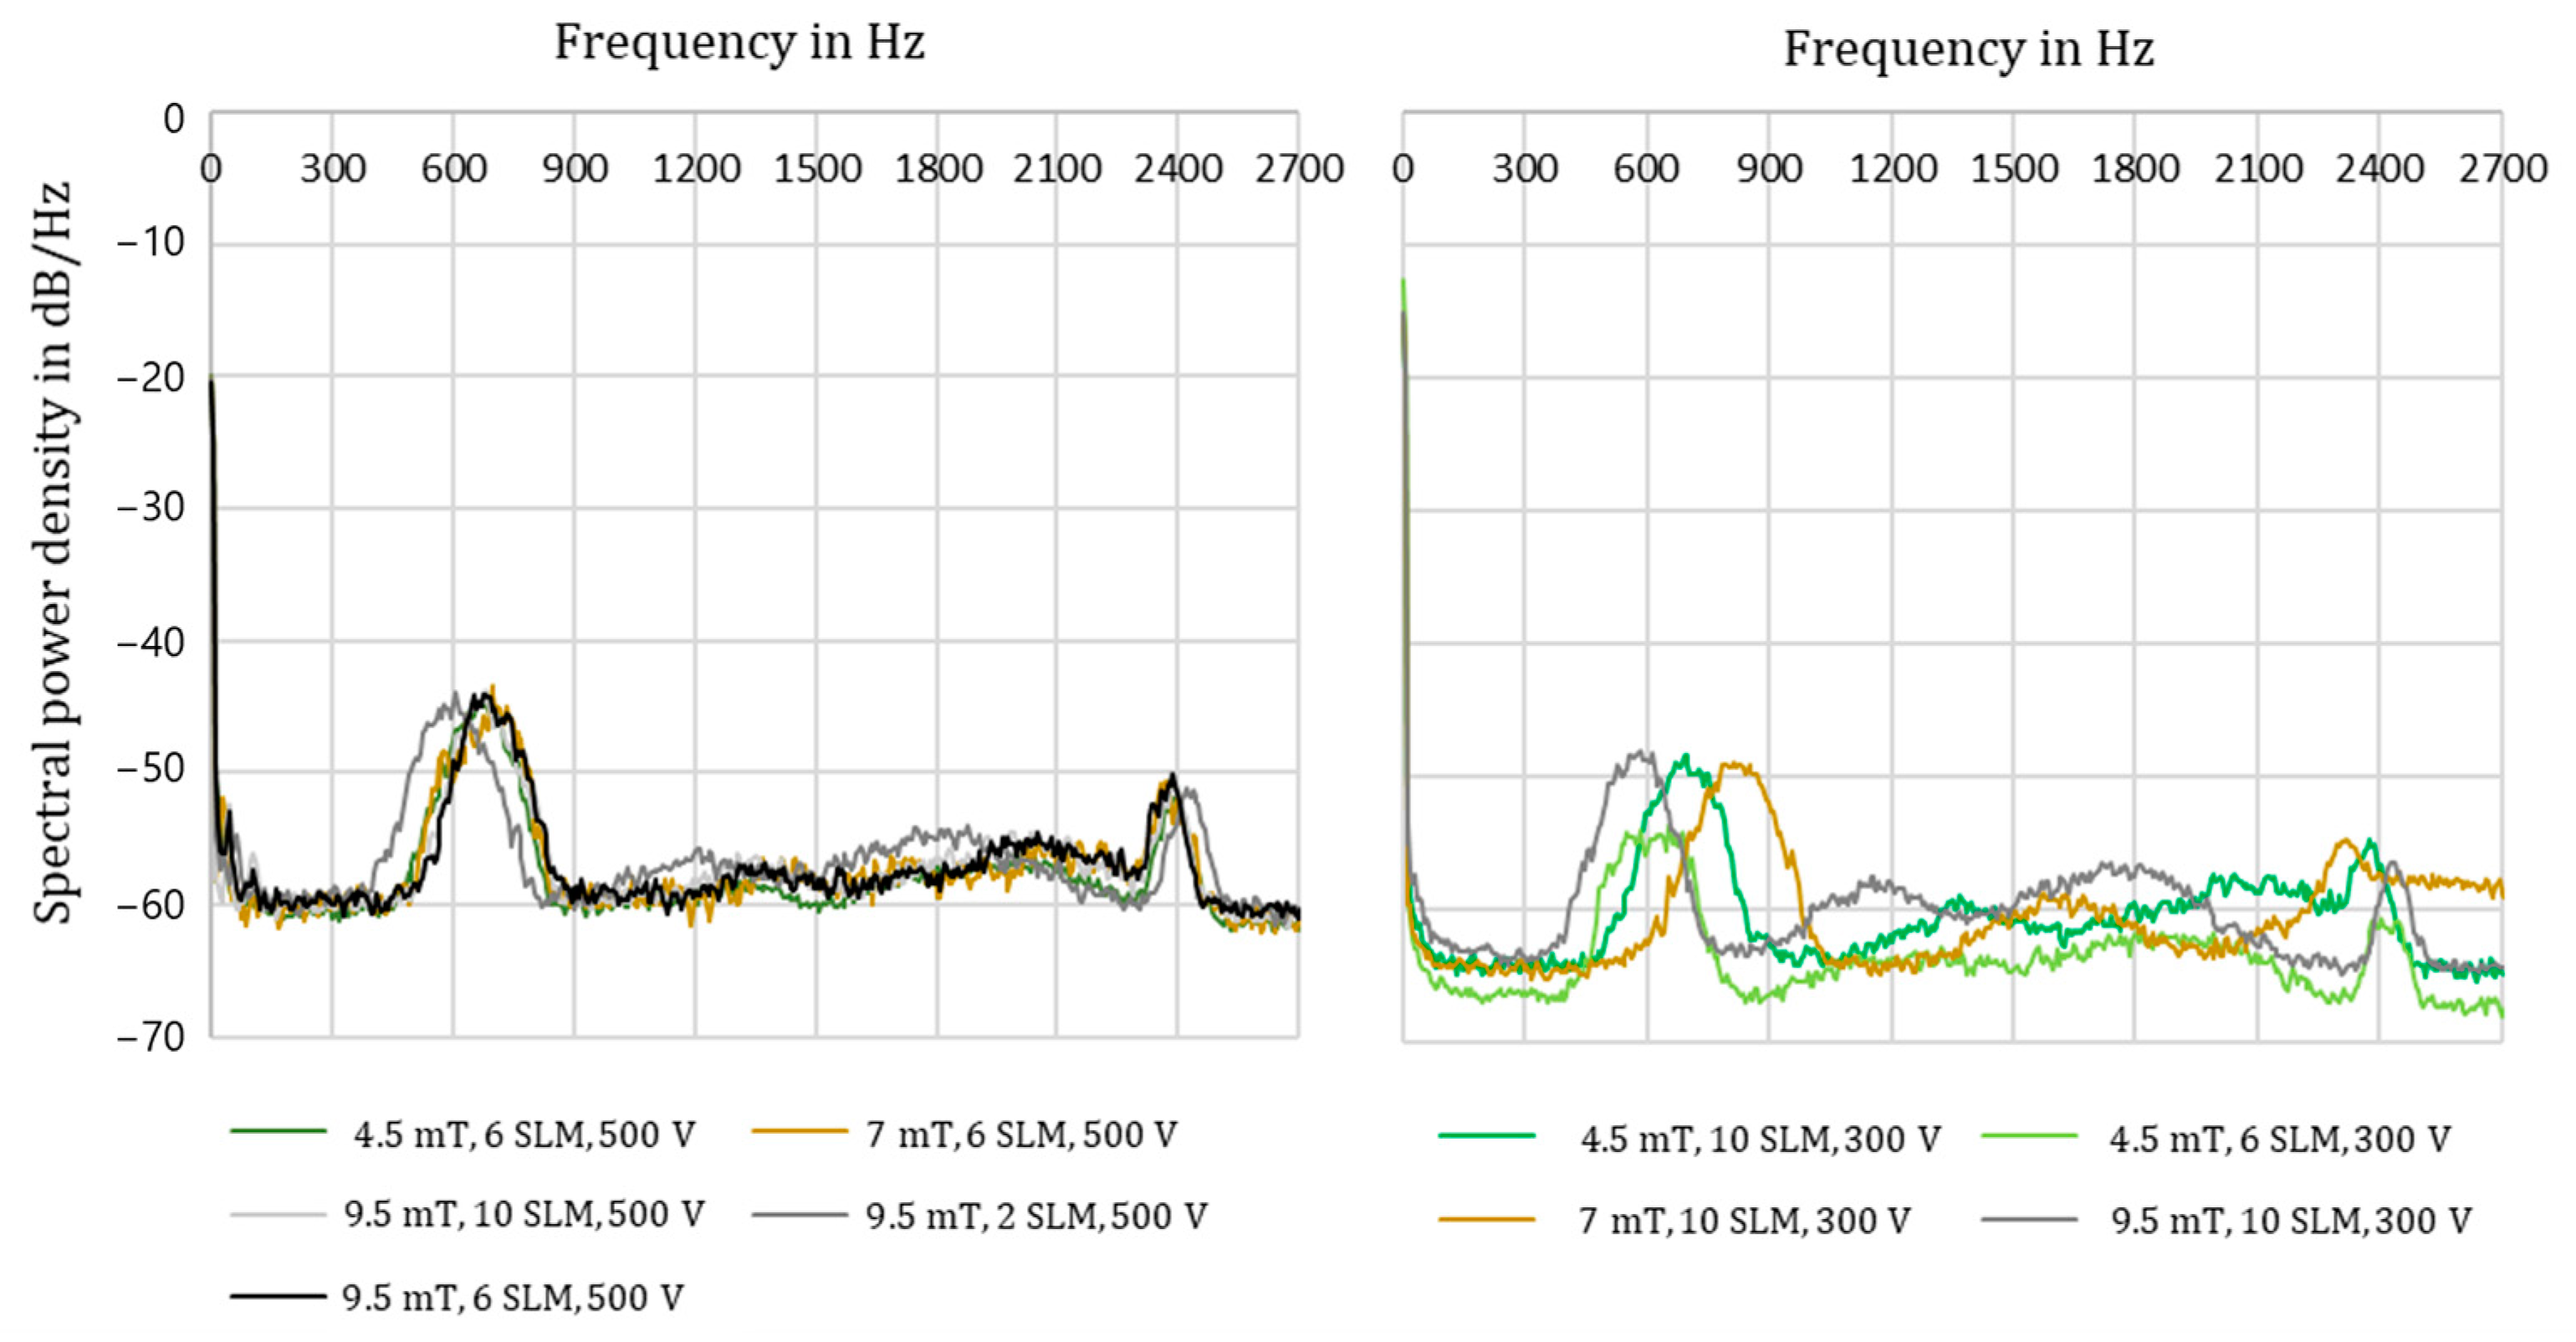
Firstly, it was investigated to what extent the parameters magnetic flux density, volume flow, and input voltage have an influence on chattering frequency. The plots are shown in
Figure 12.
At 500 V, the figures show a dominant frequency that ranges between 600 and 800 Hz, which has a repetition of 1.25 to 1.67 ms. At 300 V input voltage, this frequency is spread over a wider range from 550 to 900 Hz, which may be due to a higher number of breakdowns and less arc chattering. No clear dependence on magnetic field or volume flow can be recognized. Also, the use of silicon carbide or the electrode geometry, which was varied via thickness and diameter, seem not to have any significant influence on the frequencies.
Looking at individual measurements in which the dominant frequencies showed deviations, it is only noticeable that, as expected, there is a slightly higher standard deviation of at a lower frequency. Thus, the instability seems to correlate with a higher frequency of the dominant frequency. If we compare this instability with the instability that occurs when SiC is removed, it is relatively low, but may still be useful for fine-tuning aspects. For comparison, the standard deviation when using SiC in the experiments varies between 15 and 20% due to arc chattering and breakdowns, while for plasma without SiC it is >30%, if it stays stable.
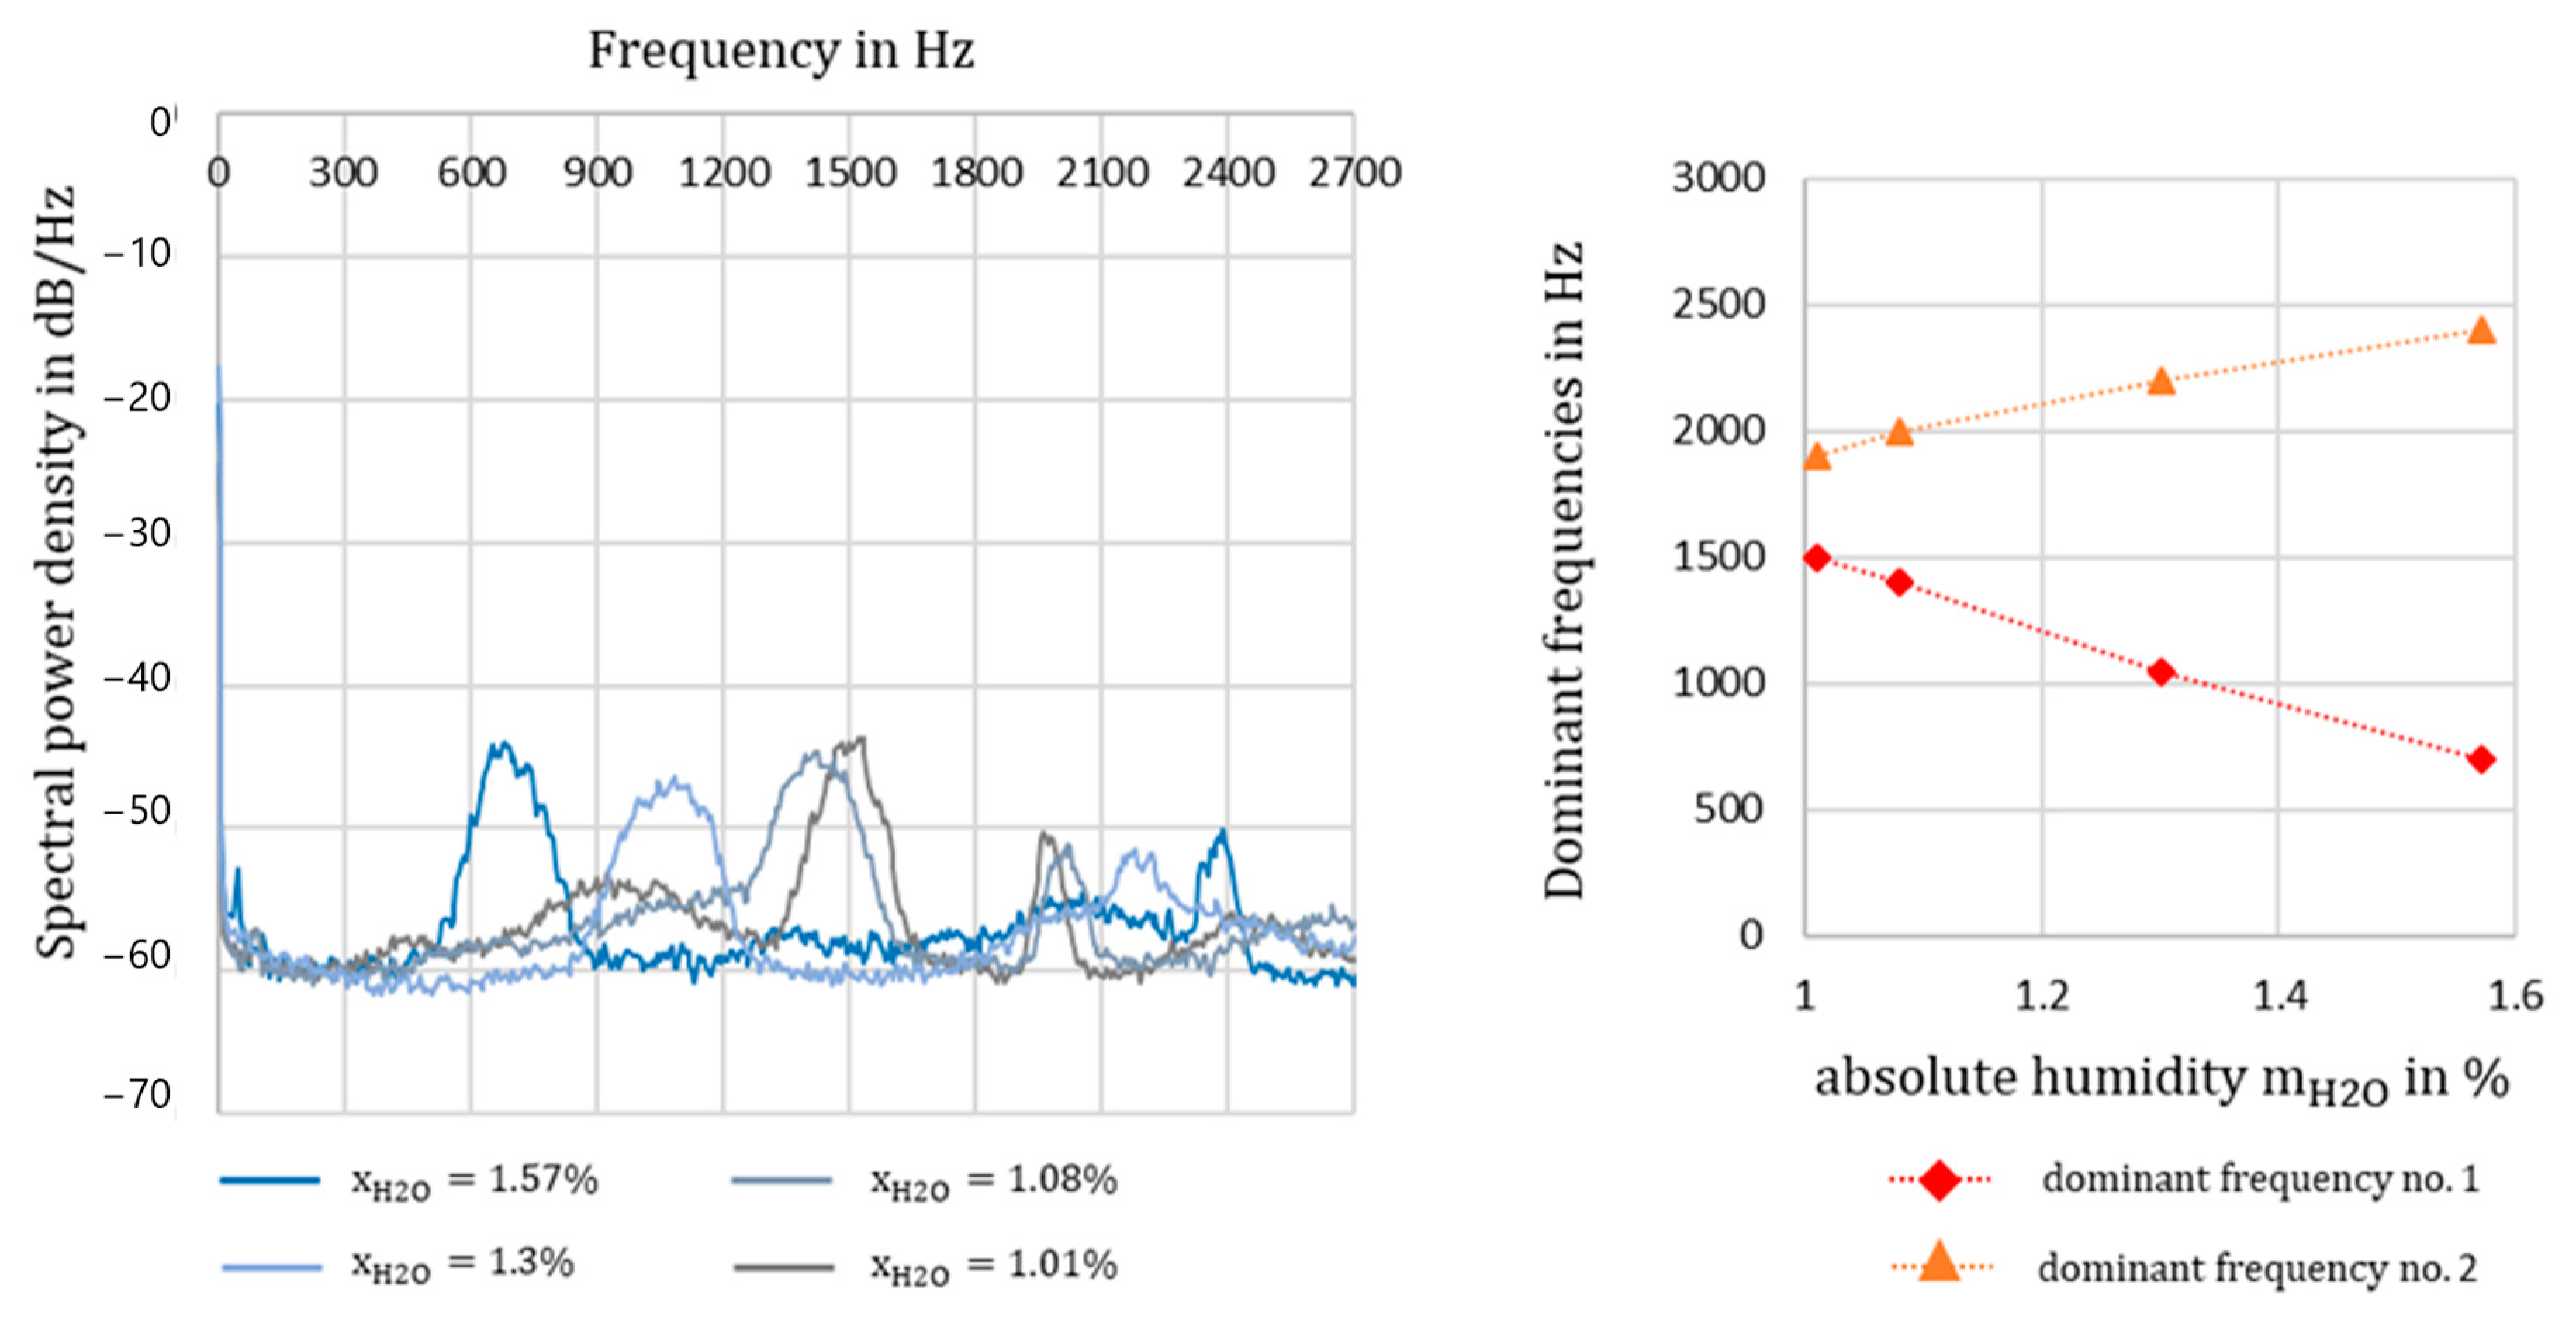
The greatest influence on the dominant frequencies was observed with a variation in humidity, as shown in
Figure 13. The absolute humidity was varied between 1.01%
and 1.57%
.
Higher humidity resulted in a lower frequency and a higher deviation of the two detected dominant frequencies. At low humidity, the frequencies are closer together and the dominant frequency is higher, which promises a cleaner run. It seems to be a trend we do not have an explanation for yet.
If we assume that these two frequencies describe the arc-chattering phenomenon, which occurs in dominant frequency No. 1 along the cathode and in dominant frequency No. 2 along the anode, an increase in the distance leads to an elongation of the arc up to spiralising. The amplitudes of were also compared for verification purposes. The curves show a decrease in the mean value with increasing humidity, and thus an increase in the arc length and an increasing deviation.
The current curves vary between
with a standard deviation of 18% for
, and
with a standard deviation of 22% for
. The variation shows that even the water content in the form of air humidity influences the characteristics and stability of the plasma. These observations can be particularly useful for experiments with the addition of water vapour, such as CO
2 hydrogenation [
16].
5. Estimation of the Plasma Residence Time Distribution
In reaction engineering, the residence time distribution at active centres plays an important role when considering catalytic processes. The residence time is generally described as the time that a molecule or a quantity of substance spends in the reactor until it leaves and it has a significant influence on the conversion. However, due to various phenomena, real reactors do not have a uniformly distributed residence time and reactions do not take place everywhere in the reactor. In purely plasma-based gas conversion, the arc can be equated with the active centre of a catalytic process. In catalytic processes, reactants bind to the surface of a catalyst in the active centre and are converted into products with lower activation energy. The activation energy in the active centre of plasma catalysis is lowered by electron collision and the associated vibrational excitation. In reaction technology, the reaction rate describes the number and availability of active centres. In plasma catalysis, this can be assigned to the number of theoretically possible contacts between the arc and gas molecules. However, not only the number of possible hits but also the homogeneity of the plasma volume is necessary for the comparison, which is defined by the occurrence of inhomogeneities in the arc rotation. In addition to the reaction rate, transport processes and diffusion also play an important role in reaction technology. In plasma-based reactions, diffusion can be equated with the vibrational behavior of the molecules and the electron energy channel distribution. It plays a role in whether a molecule only needs one hit of the arc or whether it needs several hits and how it is excited. Identical to catalytic reaction technology, dispersion and flow profiles also play a role in plasma-based conversion. Depending on the flow velocity and behavior, it can happen that not all molecules flow through the cathode at the assumed velocity due to turbulence or similar and are therefore not hit as expected.
In the following section, the theoretical number of contacts
between the arc and a molecule are estimated using variations in
,
, and
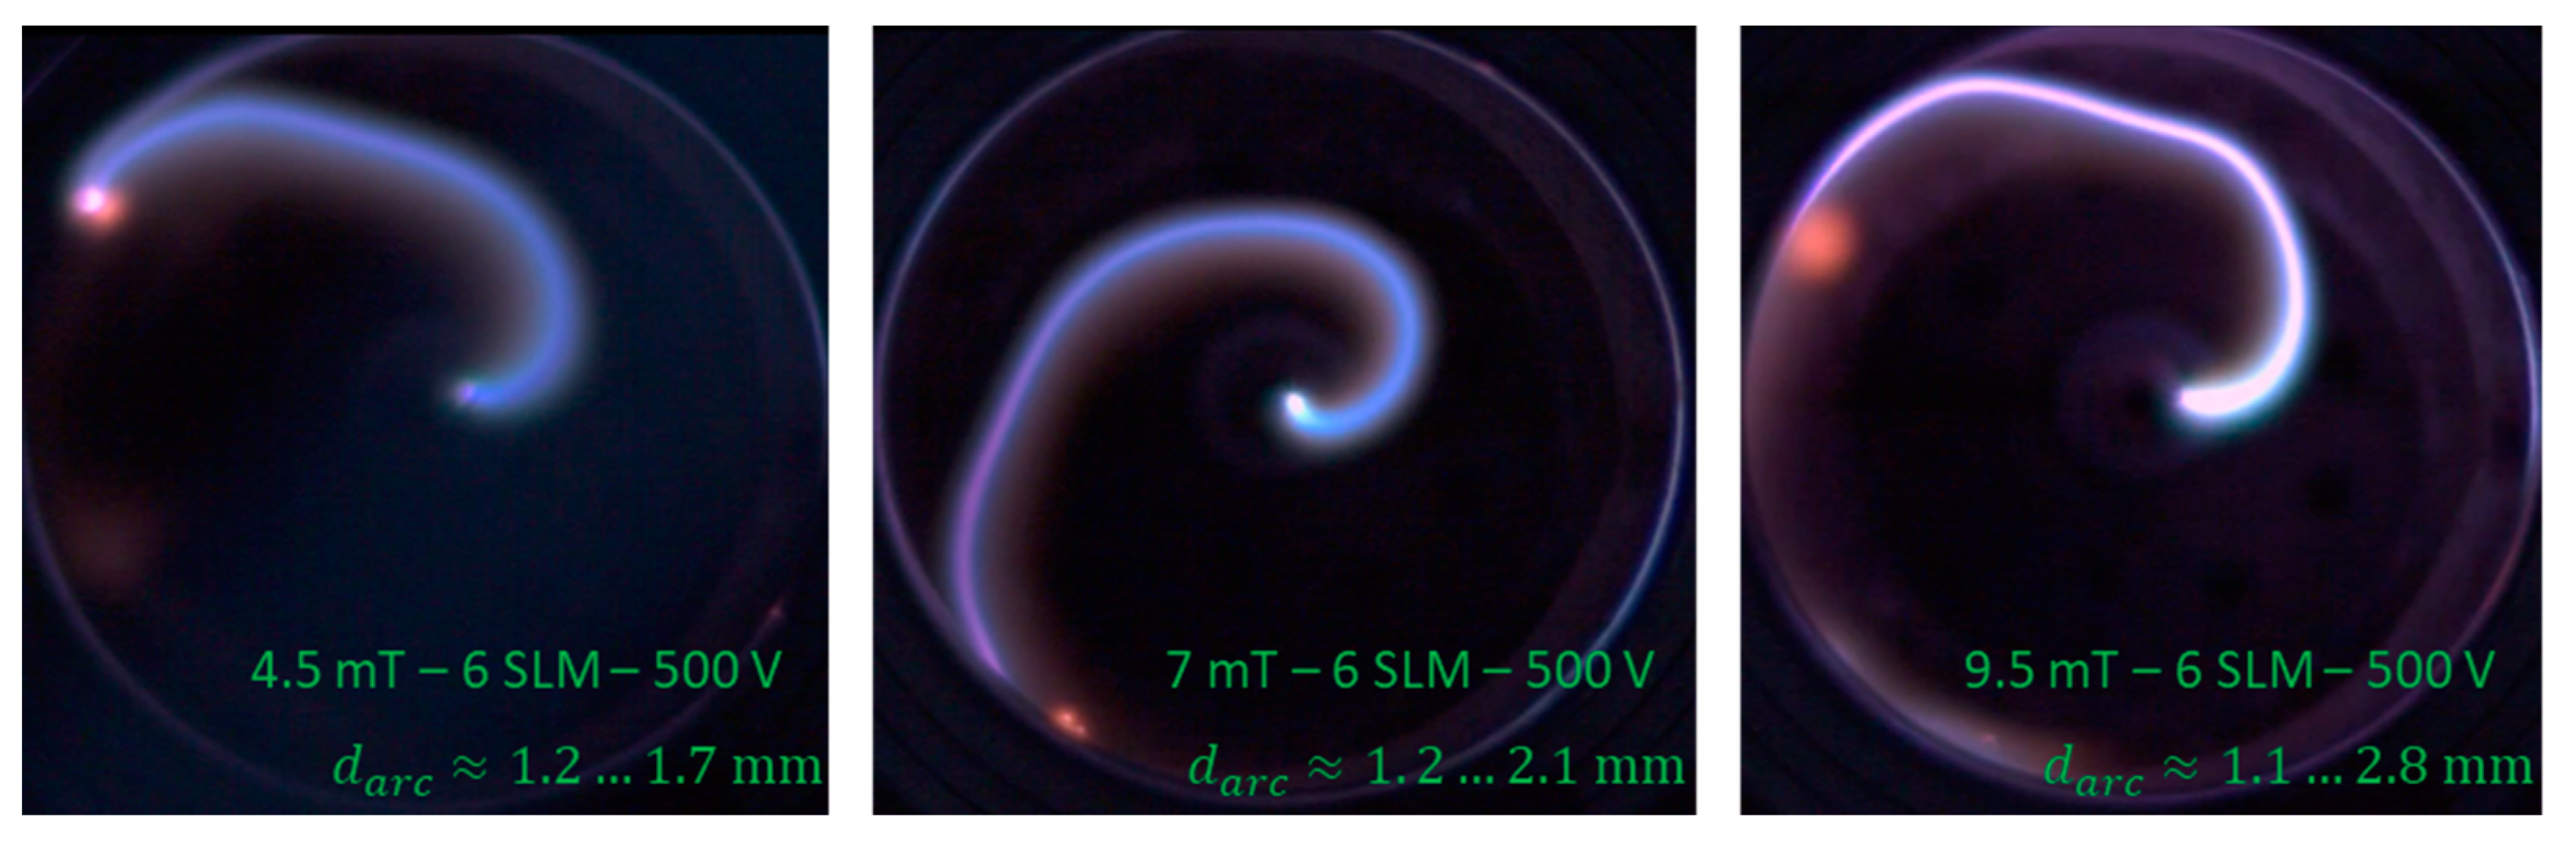
. The estimation is based on the experimentally determined frequency of the arc. The outer frequency is used, so that the entire surface of the cathode is covered. Initially, the images taken with the high-speed camera were taken into consideration for the assumption of the plasma arc diameter. Since the images with SiC foam make it difficult to view the arc, the images of the open reactor were considered for simplification.
Figure 14 shows three different images from which the approximate thickness of the arc was read for the assumption. Based on the images from the high-speed camera, an arc thickness of 1.5 mm was assumed. As the available analytics do not allow us to say whether the edge area of the arc also excites molecules, i.e., electron distribution, or whether molecules are already excited in the area of the arc without light emissions, a variation of ±0.5 mm (i.e., ±33%) is also given.
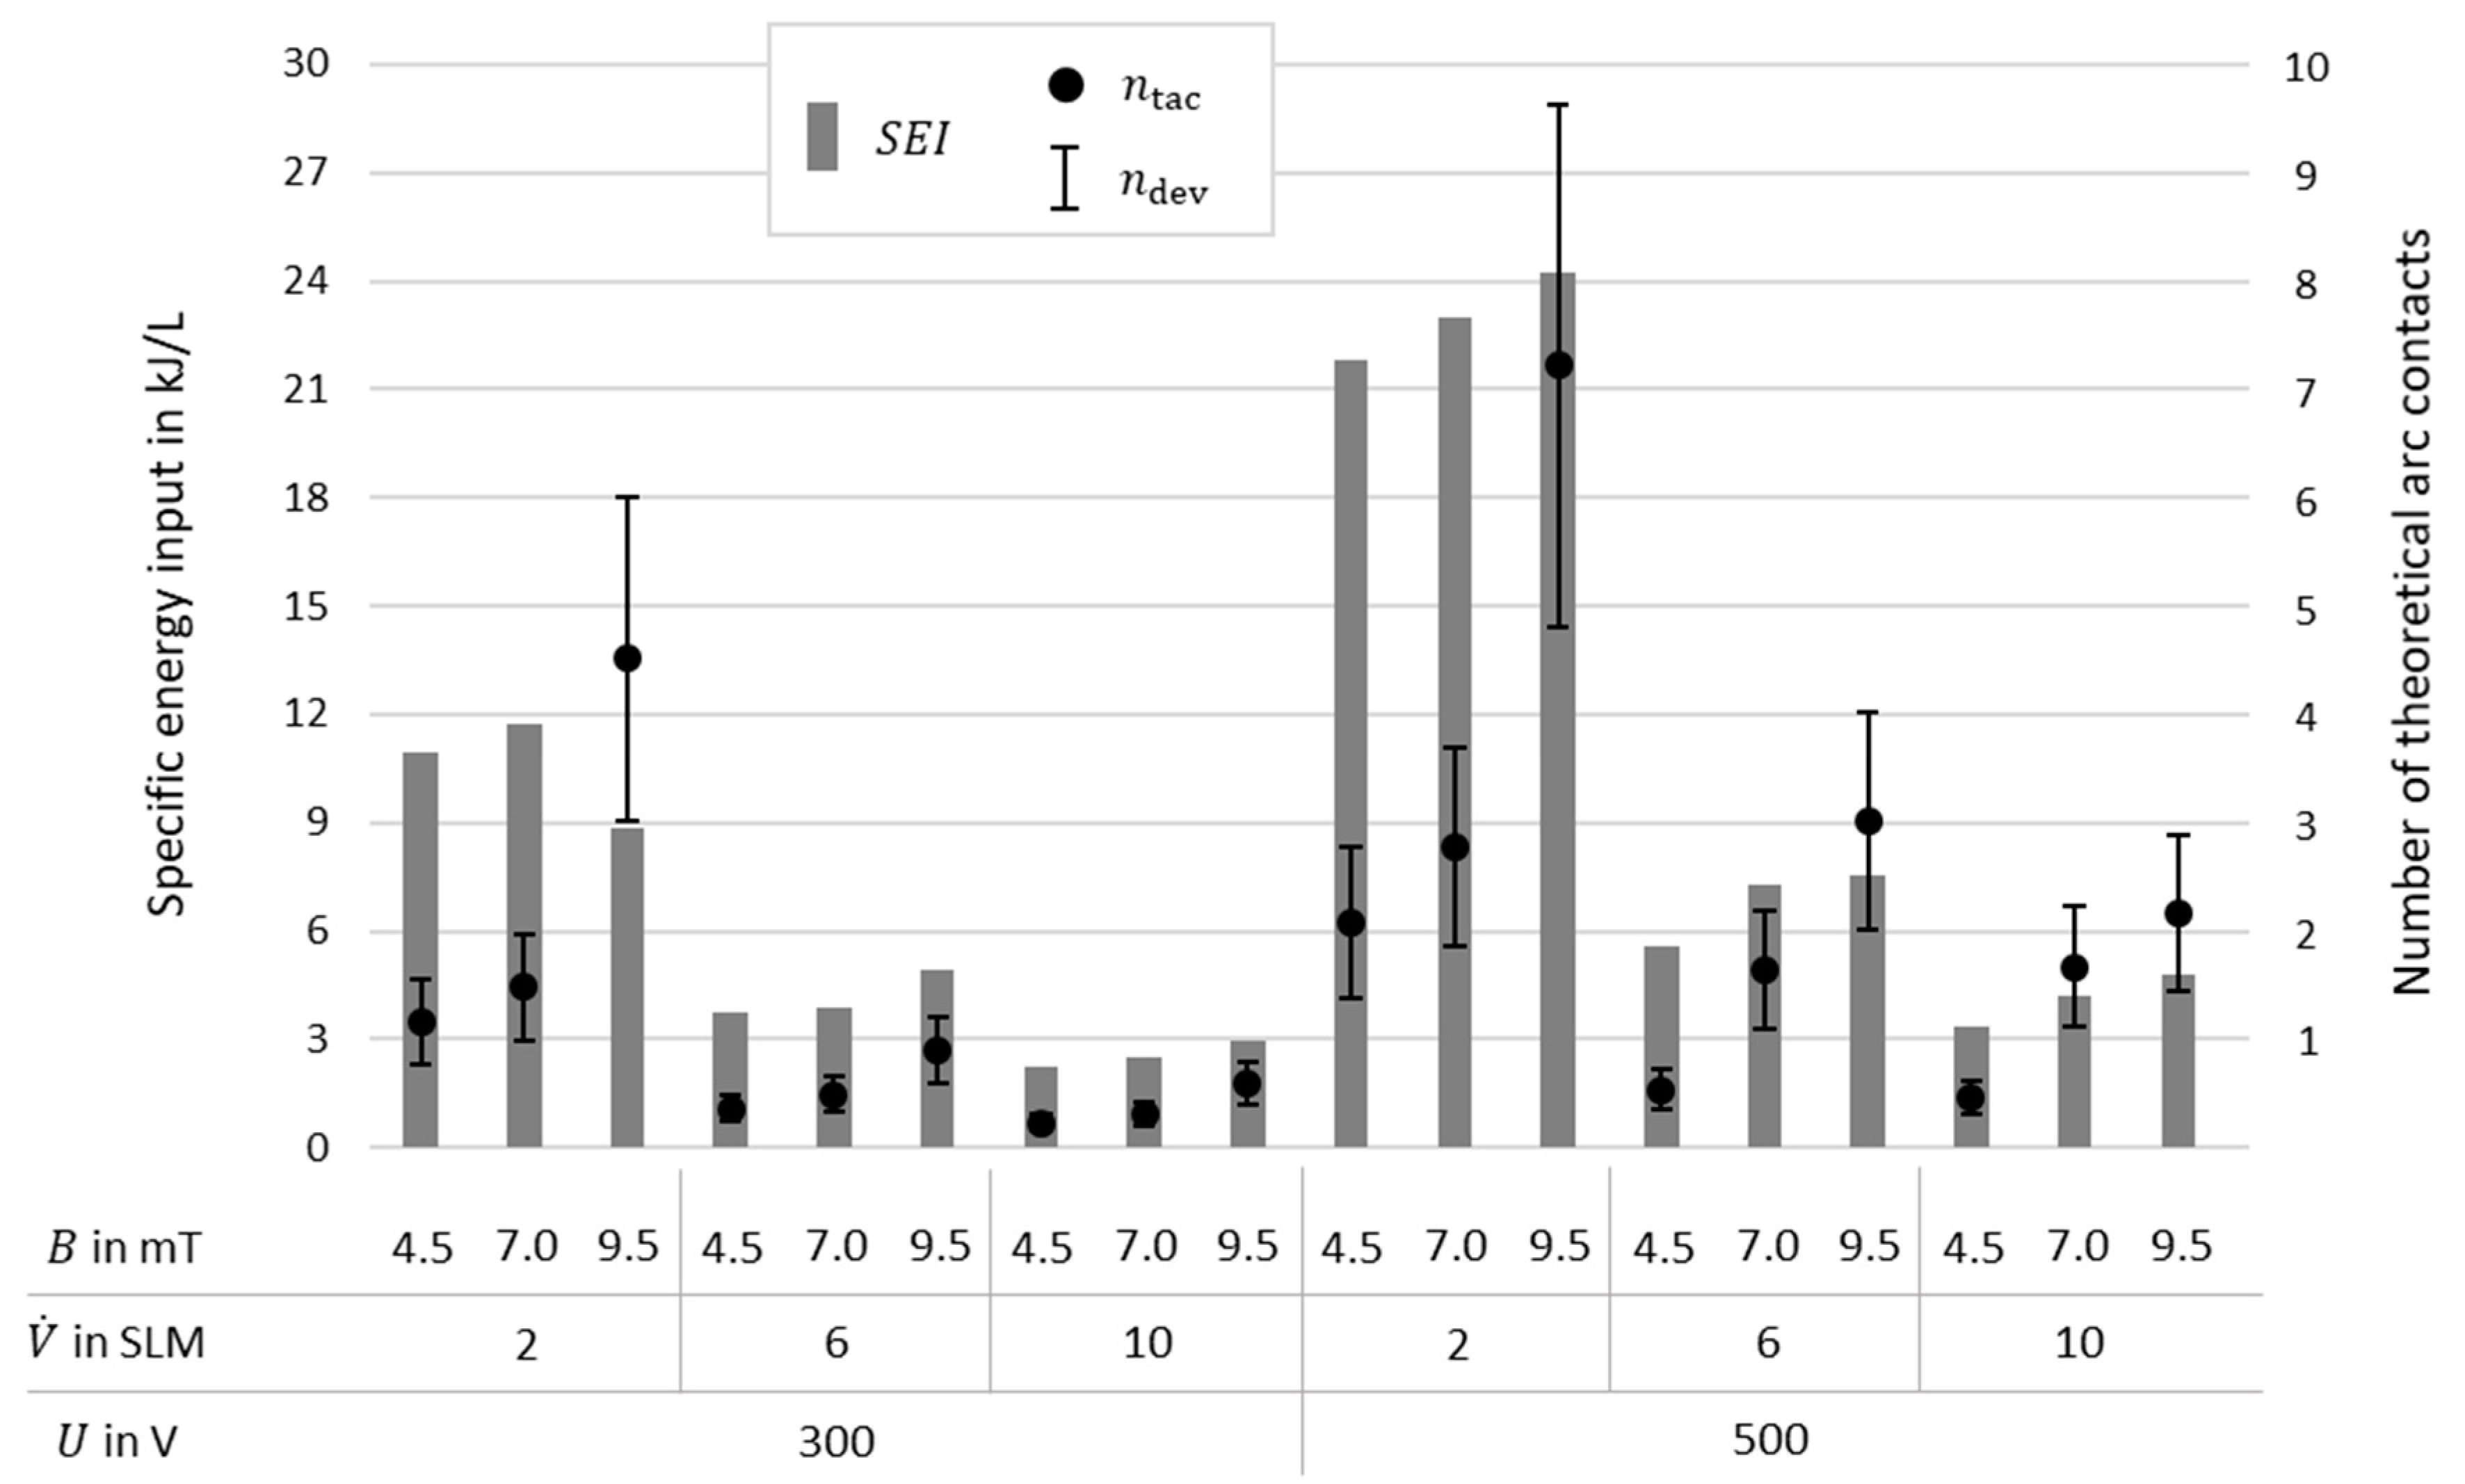
Figure 15 shows the specific energy input (
) and the
over the mentioned variations in magnetic flux density, volume flow, and input voltage. In addition, the deviation of
is given, which respects a ±33% variation in the arc diameter. It is interesting to note that
does not correspond linearly with
. This means that a higher magnetic field, if the plasma stability is guaranteed, generally affects significantly more molecules without much more energy input. However, this does not mean that increasing the magnetic field strength always optimizes the system. Because of spiralizing and breakdown phenomena, there is always a sweet spot for increasing the magnetic field for a certain cathode diameter, gas flow, and input voltage. Also, it must be considered that an
above 10 is generally not desirable for an efficient gas-conversion reaction.
The general definition of the specific energy input
is defined by the electrical power and the mass flow, volume flow, or material flow [
3].
However, if we want to know how much energy is really supplied to the gas and how much benefit it has for the gas conversion, the dead volume must also be considered. With the new definition of an effective specific energy input
, it is easier to visualise how much energy actually goes into the molecules using a rotating glow-to-arc reactor.
However, it must be considered that the calculation of contains some assumptions when applying the definition or must still be adjusted using experimental series or simulations. In addition, inhomogeneities occur, some of which can be identified and analysed on the basis of frequencies, but some of which also occur stochastically and therefore cannot be calculated. Especially, as soon as chemical reactions are combined with arc interactions, even more effects are added.
The concept of is designed to provide a more accurate assessment of energy transfer within the plasma by considering the theoretical number of contacts between the arc and the molecules, ntac. This parameter represents the fraction of the plasma volume actively contributing to molecular excitation and conversion, refining the traditional definition of specific energy input to account for the “real” active plasma volume.
In our experiments, demonstrates how the arc-rotation frequency, gas flow dynamics, and reactor geometry influence the efficiency of energy utilization. For example, higher rotational frequencies can increase the number of arc–molecule interactions, leading to improved energy transfer and enhanced molecular activation. However, this effect may be limited by the residence time of molecules in the plasma zone, which can constrain the extent of energy absorption even as interaction rates rise.
By incorporating , we connect plasma behavior to chemical conversion efficiency, providing a framework for optimizing reactor conditions. While the calculation of involves some assumptions, such as residence time distribution (PRTD) and inhomogeneities in arc–molecule interactions, it offers a meaningful step toward understanding and enhancing energy transfer in plasma systems. Future work will refine these assumptions through targeted experimental and simulation studies, supporting the development of plasma processes with higher energy and conversion efficiencies.
6. Experimental Setup
The experimental setup is presented in
Figure 16. It consists of electrical, mechanical, and analytical components.
The plasma driver was provided by Cyclize [
17] and reflects a further development of the plasma driver for rotating glow-to-arc discharges by Renninger et al. [
14]. The plasma driver is able to provide constant current to non-thermal arc discharge rang-ing from short circuit to 10 kV. The system is powered from AC mains and rated for
,
, and
. The plasma drive system comprises a high-voltage current-controlled DC-DC converter. This converter is realized by a resonant converter topology and it operates in the inductive region of the converter characteristics. The electrode setup consisted of a round pin electrode positioned centrally within a ring electrode, with a total gap of 40 mm measured as the distance between the pin and the inner edge of the ring. The ring electrode had a convex shape, with its inner surface curved outward, and a total gap of 40 mm was measured as the shortest distance between the tip of the pin electrode and the nearest point on the inner surface of the ring. For the given electrode distance, gas flow rate, gas type, magnetic field intensity, and room conditions, the plasma resistance remains nearly constant. The current into the plasma is limited by two characteristic parameters, namely the operating frequency and the input voltage.
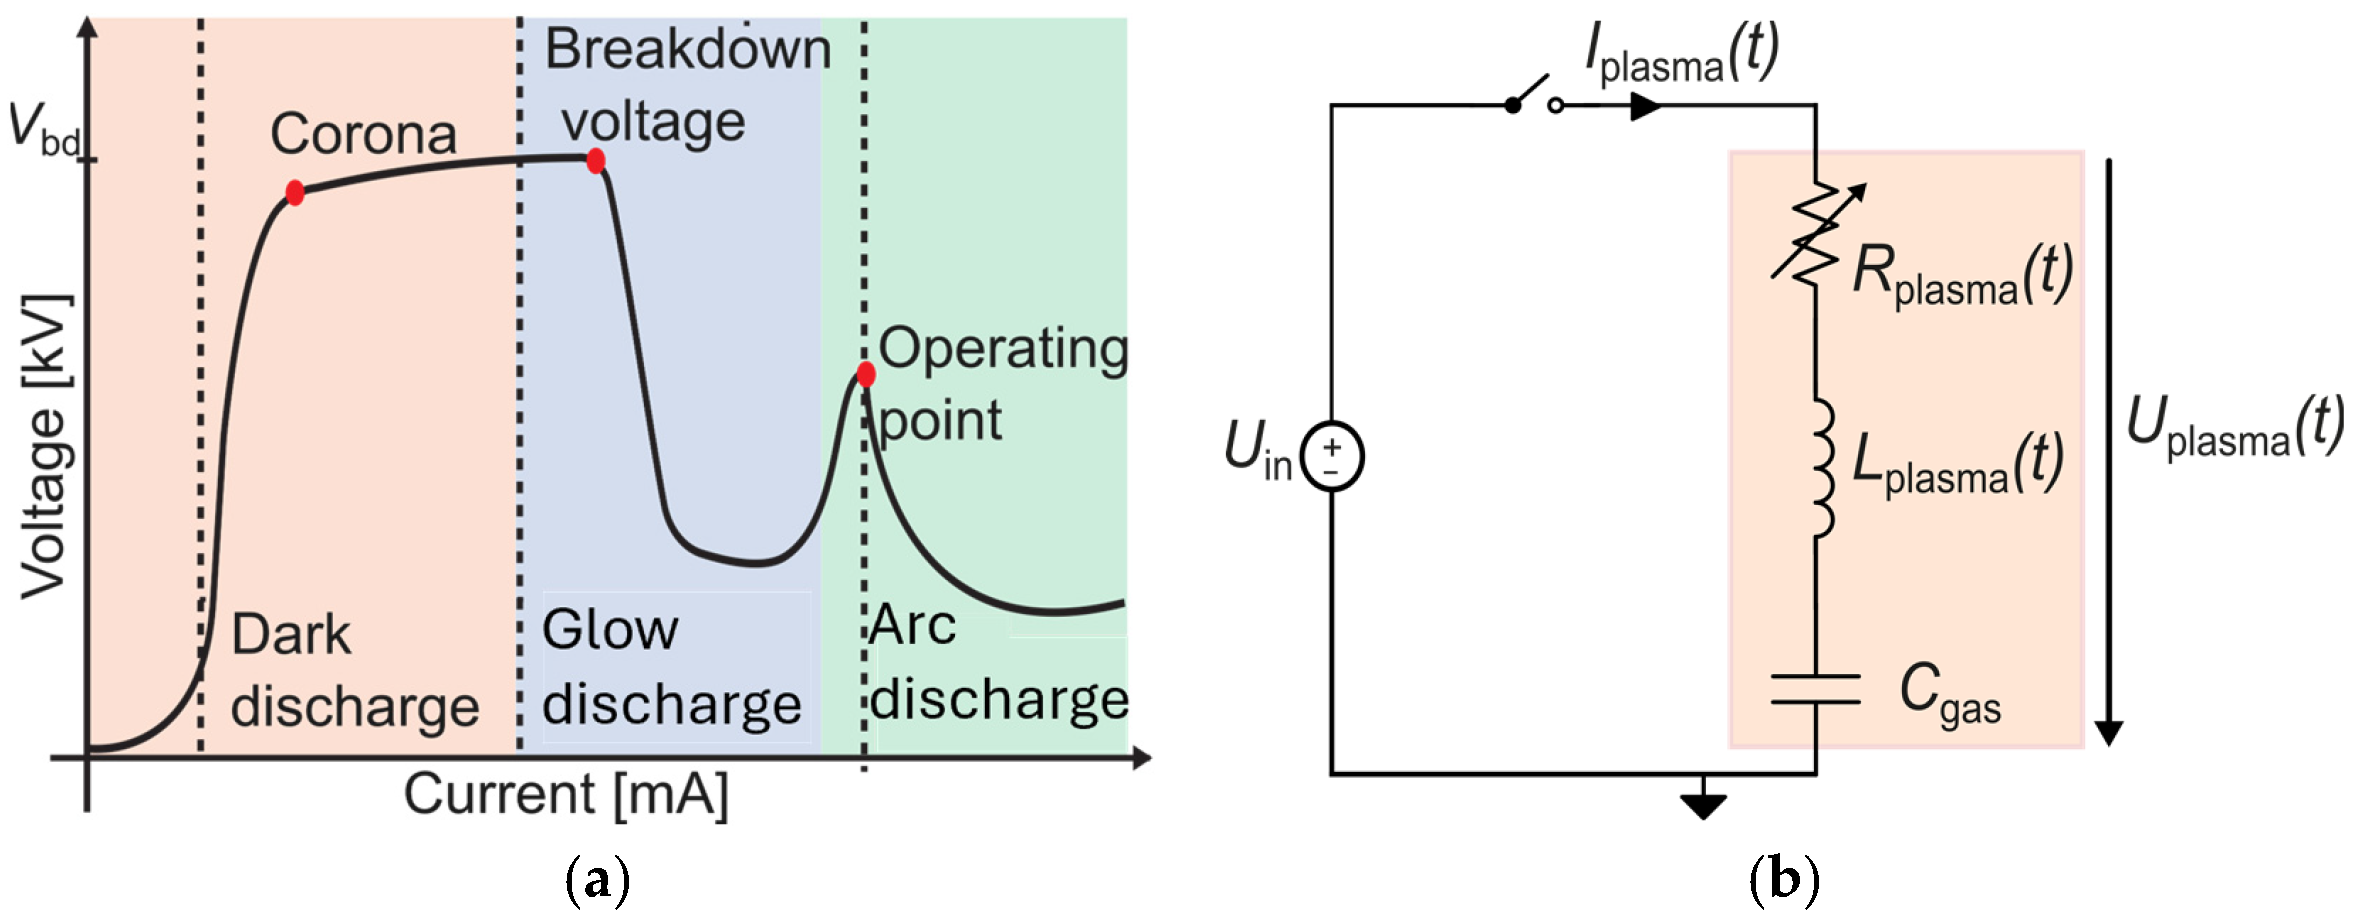
The equivalent circuit model ECM of the electrode setup before and after ignition is given as in
Figure 17b, where
Rplasma is the plasma resistance,
Lplasma is the plasma inductance, and
Cgas is the capacitance between the electrodes.
Cgas is the capacitance across the electrodes which is determined by the distance between the electrodes and the dielectric strength of the medium between the electrodes. And once the plasma is ignited,
Cgas is extinguished. As the VI characteristic of plasma,
Figure 17a shows the negative differential behavior where the high resistance of the medium drops down once the plasma is ignited. Conventionally, the plasma is assumed to have infinite conductivity, whereas in the plasma medium filled with gas at a fixed gas pressure, the collision of electrons would result in a reduction in conductivity [
18]. Thus, the resistance
Rplasma is a variable parameter and it varies with humidity, room temperature, gas type, gas pressure, and electrode distance. In the rotating gliding arc reactor; therefore, an LLC converter is utilized to limit the current into the plasma as depicted in
Figure 17b. In thermal plasma applications,
Rplasma is negligible and only the inductive behavior of the plasma is considered.
The plasma driver is connected to an AC-DC power supply with a maximum power of 5 kW, safety current limitation functions, and a sample frequency of 5 Hz.
The mechanical components of the plasma reactor consist of stainless-steel ISO-K parts, insulation ceramics made of vermiculite, and the electrode setup with a pin anode and ring cathode. Ignition to overcome the breakdown voltage is achieved mechanically with a stainless-steel rod via a short circuit between the pin and ring. The experiments are performed in nitrogen to eliminate chemical phenomena while determining the general arc dynamics.
A current probe CP6990 from ELDITEST is mounted across the cathode cable back to the plasma driver. The current probe has current rating of 4 A/40 A, bandwidth of DC to 1.5 MHz, DC measurement accuracy of ±4%, and a rise time of 0.23 us. The current measurement data are viewed in the digital oscilloscope from Rhode and Schwarz RTB2004, which has a sampling rate of 2.5 Giga Samples/second, 10-bit ADC, and a bandwidth of 70 MHz to 300 MHz. An optical observation was carried out with a high-speed camera, the Chronos 1.4 (CR14-1.1-8C). The camera can record with up to 40,413 FPS at 320 × 96 pixels. For our recordings, we increased the resolution to 800 × 600 pixels, resulting in a maximum FPS of 2871.91.
7. Conclusions
This study addresses the reaction-engineering aspects of a rotating glow-to-arc plasma reactor. The analysis has shown that the increase in cathode diameter in rotating glow-to-arc reactors does not automatically bring more power and less boundary effects, it also exposes plasma instability problems. The increase in power from 200 W to 1.2 kW (in CO
2) was successful, but led to instability problems through the uplift force and different phenomena. The arc phenomena were defined and presented, like the arc chattering, breakdowns, shortcuts, and spiralizing. Most of the phenomena occur relatively stochastically and without significant frequency. Similar phenomena have already been found in the literature, so they should generally occur in these type of plasma reactor [
13].
This study demonstrated that integrating a silicon carbide (SiC) ceramic foam as a mechanical restriction within the reactor markedly improves plasma stability. The SiC foam minimizes plasma instability by reducing arc movement, confining thermal convection, and balancing volume flow within the force dynamics of the plasma arc. This optimization achieved through SiC not only stabilizes the plasma but also leads to a steady increase in power output, particularly at lower voltage levels, sustaining plasma conditions that are otherwise challenging at a 300 V input voltage.
The analysis of arc-rotation frequencies and chattering frequencies, defined in terms of the time and nature of each phenomenon, reveals their distinct roles in plasma stability and power efficiency. Higher rotation frequencies correlate directly with enhanced homogeneity and stability, while other phenomena like shortcuts and spiralizing introduce power fluctuations that can reduce efficiency. Observations further showed that operational factors like magnetic flux density and the gas flow rate impact the arc’s rotational dynamics, resulting in a balanced force distribution that contributes to overall stability.
Frequency analysis using Fast Fourier Transformation (FFT) demonstrated that moisture content also impacts plasma behavior. Furthermore, the increase in power output with magnetic flux density was attributed to the Lorentz force elongating the arc, though this effect showed dependence on the parameter settings, with potential efficiency losses at higher values.
Lastly, by examining plasma residence time distribution (PRTD) and effective specific energy input , we observed that optimizing these parameters could enhance molecular interactions with the arc, maximizing energy transfer. These findings on PRTD are analogous to active centre theory in catalytic processes, suggesting a pathway for more efficient energy utilization in plasma-based applications.
In summary, the combined use of SiC foam and controlled magnetic flux, along with careful management of rotation and chattering frequencies, supports improved plasma homogeneity, stability, and energy efficiency in plasma gas-conversion applications.
To further enhance the understanding and control of arc behavior in plasma reactors, future work will focus on expanding and refining the measurement setup. Currently, arc frequencies are primarily observed through optical means, which limits analysis under closed reactor conditions. Integrating electronic sensors, such as high-temperature thermocouples capable of withstanding temperatures exceeding 1000 °C, positioned on the cathode ring, could enable real-time electronic monitoring. This enhancement would facilitate parameter regulation, allowing for rapid adjustments to maintain optimal arc stability.
Future investigations should also aim to improve assumptions about the electron beam, including electron density measurements for a clearer understanding of arc thickness and current density. Current density within the anode cable does not directly represent the plasma’s electron beam current density. By calculating the current density in the plasma arc as a function of electron mobility in the electric field, we can better approximate the active region within the plasma setup. Accurate measurements of electron density and plasma voltage using a Langmuir probe could further refine these calculations, offering insights into electron–atom collisions and mean free path times. The chances of collision between electrons and molecules, also affecting the energy transfer from plasma to gas molecules can, when measuring all necessary values, be estimated with the collision cross-section, but it requires further investigation in plasma physics [
18]. In addition to the extension of the experimental setup, modelling can be used as a supporting measure, for example, to simulate the electron density in elongating gliding arcs [
19]. This improved characterization of the plasma setup and investigation would support the precise tuning of parameters, optimizing plasma behavior for more stable and efficient gas-conversion processes. These improved measurement techniques and insights into energy input will be highly applicable to gas-conversion processes such as CO
2-splitting and biogas conversion, where understanding and controlling plasma chemistry is crucial.
Applying these findings will enable a more precise regulation of chemical reactions, advancing the efficiency and selectivity in gas-conversion reactions and paving the way for more sustainable, fossil-free production methods.
Author Contributions
Conceptualization, S.J.K. and P.R.; methodology, S.J.K., H.C. and P.R.; experimental, S.J.K., H.C. and J.B.; validation, H.C. and P.R.; formal analysis, S.J.K.; investigation, S.J.K., H.C. and J.B.; resources, P.R. and K.P.B.; data curation, S.J.K. and J.B.; writing—original draft preparation, S.J.K., H.C. and P.R.; writing—review and editing, S.J.K. and P.R.; visualization, S.J.K., J.B. and H.C.; supervision, P.R. and K.P.B.; project administration, P.R. and K.P.B.; funding acquisition, S.J.K., P.R., and K.P.B. All authors have read and agreed to the published version of the manuscript.
Funding
This research was part of the PlasmaFly joint project. Project PlasmaFly is funded with a total of EUR 1.5 million by the Federal Ministry for Digital and Transport as part of the Funding Programme Renewable Fuels. The funding guideline for the development of renewable fuels is coordinated by NOW GmbH and supported by the project management agencies VDI/VDE Innovation + Technik GmbH and Fachagentur Nachwachsende Rohstoffe e.V. (Agency for Renewable Resources); grant number 16RK14013A.
Data Availability Statement
Data can be provided upon request.
Acknowledgments
The authors would like to thank the founder, the university, the institute, and friends and family for daily support.
Conflicts of Interest
The authors declare no conflicts of interest.
Appendix A
Table A1.
Average power and deviation at 300 V under variation in volume flow, magnetic field, and silicon carbide placement.
Table A1.
Average power and deviation at 300 V under variation in volume flow, magnetic field, and silicon carbide placement.
| 300 V |
|---|
| Volume flow | 2 SLM | 6 SLM | 10 SLM |
| Magnetic flux density | No SiC | With SiC | No SiC | With SiC | No SiC | With SiC |
| 4.5 mT | | | | | | |
| 7 mT | | | | | | |
| 9.5 mT | | | | | | |
Table A2.
Average power and deviation at 500 V under variation in volume flow, magnetic field, and silicon carbide placement.
Table A2.
Average power and deviation at 500 V under variation in volume flow, magnetic field, and silicon carbide placement.
| 500 V |
|---|
| Volume flow | 2 SLM | 6 SLM | 10 SLM |
| Magnetic flux density | No SiC | With SiC | No SiC | With SiC | No SiC | With SiC |
| 4.5 mT | | | | | | |
| 7 mT | | | | | | |
| 9.5 mT | | | | | | |
References
- Henning, H.-M.; Ausfelder, F.; Drake, F.; Erlach, B.; Fischedick, M.; Kost, C.; Münch, W.; Pittel, K.; Rehtanz, C.; Sauer, J.; et al. “Sektorkopplung”–Untersuchungen und Überlegungen zur Entwicklung eines integrierten. Energiesystems 2017, 15. [Google Scholar] [CrossRef]
- Seithümmer, V.B.; Lutz, J.V.; Kaufmann, S.J.; Chinnaraj, H.; Rößner, P.; Birke, K.P. Powering the future: Germany’s Wasserstoffstrategie in the transition to climate neutrality–case study on green hydrogen for the chemical industry. Energy Adv. 2024. [Google Scholar] [CrossRef]
- Snoeckx, R.; Bogaerts, A. Plasma technology—A novel solution for CO2 conversion? Chem. Soc. Rev. 2017, 46, 5805–5863. [Google Scholar] [CrossRef] [PubMed]
- Bogaerts, A.; Centi, G. Plasma Technology for CO2 Conversion: A Personal Perspective on Prospects and Gaps. Front. Energy Res. 2020, 8, 111. [Google Scholar] [CrossRef]
- Vertongen, R.; Bogaerts, A. How important is reactor design for CO2 conversion in warm plasmas? J. CO2 Util. 2023, 72, 102510. [Google Scholar] [CrossRef]
- Tu, X.; Whitehead, J.C.; Nozaki, T. Plasma Catalysis; Springer International Publishing: Cham, Switzerland, 2019; ISBN 978-3-030-05188-4. [Google Scholar]
- Vermeiren, V.; Bogaerts, A. Plasma-Based CO2 Conversion: To Quench or Not to Quench? J. Phys. Chem. C 2020, 124, 18401–18415. [Google Scholar] [CrossRef]
- Kalra, C.; Cho, Y.; Gutsol, A.; Fridman, A.; Rufael, T. Gliding arc in tornado using a reverse vortex flow. Rev. Sci. Instrum. 2005, 76, 25110. [Google Scholar] [CrossRef]
- Ananthanarasimhan, J.; Lakshminarayana, R.; Anand, M.S.; Dasappa, S. Influence of gas dynamics on arc dynamics and the discharge power of a rotating gliding arc. Plasma Sources Sci. Technol. 2019, 28, 85012. [Google Scholar] [CrossRef]
- Li, L.; Zhang, H.; Li, X.; Kong, X.; Xu, R.; Tay, K.; Tu, X. Plasma-assisted CO2 conversion in a gliding arc discharge: Improving performance by optimizing the reactor design. J. CO2 Util. 2019, 29, 296–303. [Google Scholar] [CrossRef]
- Renninger, S. Sustainable Production of Carbon Monoxide by Direct Current Gas Discharge. Ph.D. Thesis; In Energie & Nachhaltigkeit–Nachhaltige CO2-Kreisläufe; Cuvillier Verlag: Göttingen, Germany, 2023; ISBN 978-3-73697-745-7. [Google Scholar]
- Wang, C.; Cui, H.; Zhang, Z.; Xia, W.; Xia, W. Observation of arc modes in a magnetically rotating arc plasma generator. Contrib. Plasma Phys. 2017, 57, 395–403. [Google Scholar] [CrossRef]
- Zhang, H.; Li, X.D.; Zhang, Y.Q.; Chen, T.; Yan, J.H.; Du, C.M. Rotating Gliding Arc Codriven by Magnetic Field and Tangential Flow. IEEE Trans. Plasma Sci. 2012, 40, 3493–3498. [Google Scholar] [CrossRef]
- Renninger, S.; Stein, J.; Lambarth, M.; Birke, K.P. An optimized reactor for CO2 splitting in DC atmospheric pressure discharge. J. CO2 Util. 2022, 58, 101919. [Google Scholar] [CrossRef]
- Renninger, S.; Rößner, P.; Stein, J.; Lambarth, M.; Birke, K.P. Towards High Efficiency CO2 Utilization by Glow Discharge Plasma. Processes 2021, 9, 2063. [Google Scholar] [CrossRef]
- Wang, W.; Snoeckx, R.; Zhang, X.; Cha, M.S.; Bogaerts, A. Modeling Plasma-based CO2 and CH4 Conversion in Mixtures with N2, O2, and H2O: The Bigger Plasma Chemistry Picture. J. Phys. Chem. C 2018, 122, 8704–8723. [Google Scholar] [CrossRef]
- Cyclize GmbH. Cyclize GmbH Website. Available online: https://cyclize.de/de/ (accessed on 30 October 2024).
- Wong, C.S.; Mongkolnavin, R. Elements of Plasma Technology; Springer Singapore: Singapore, 2016; ISBN 978-981-10-0115-4. [Google Scholar]
- Kolev, S.; Bogaerts, A. Similarities and differences between gliding glow and gliding arc discharges. Plasma Sources Sci. Technol. 2015, 24, 65023. [Google Scholar] [CrossRef]
Figure 1.
Force balance on arc at plasma reactor with stream direction top to bottom.
Figure 1.
Force balance on arc at plasma reactor with stream direction top to bottom.
Figure 2.
Uplift and gas drag force on the plasma arc plotted over the diameter of the cathode at various volume flows .
Figure 2.
Uplift and gas drag force on the plasma arc plotted over the diameter of the cathode at various volume flows .
Figure 3.
Instabilities of plasma power: Power over time (f); arc phenomena (right): (a) arc chattering; (b) breakdown; (c) shortcut; (d) and (e) spiralizing.
Figure 3.
Instabilities of plasma power: Power over time (f); arc phenomena (right): (a) arc chattering; (b) breakdown; (c) shortcut; (d) and (e) spiralizing.
Figure 4.
Timesteps of arc phenomena shortcut and arc chattering at operating conditions of , , and .
Figure 4.
Timesteps of arc phenomena shortcut and arc chattering at operating conditions of , , and .
Figure 5.
Silicon carbide ceramic foam included in the reactor.
Figure 5.
Silicon carbide ceramic foam included in the reactor.
Figure 6.
Plasma stability without SiC and with SiC at a magnetic flux density of , a volume flow of and at input voltages of .
Figure 6.
Plasma stability without SiC and with SiC at a magnetic flux density of , a volume flow of and at input voltages of .
Figure 7.
Plasma stability without SiC and with SiC for different operating conditions.
Figure 7.
Plasma stability without SiC and with SiC for different operating conditions.
Figure 8.
Changes in plasma power and rotational arc frequency at different magnetic flux densities, mass flow, and voltages.
Figure 8.
Changes in plasma power and rotational arc frequency at different magnetic flux densities, mass flow, and voltages.
Figure 9.
Arc tracing through SiC at different magnetic fields, voltages, and mass flows. The conditions lead to rotational frequencies of (a) 11 Hz at 7 mT, 6 SLM, and 300 V; (b) 18 Hz at 7 mT, 6 SLM, and 500 V; (c) 36 Hz at 9.5 mT, 6 SLM, and 500 V; and (d) 46 Hz at 9.5 mT, 10 SLM, and 500 V.
Figure 9.
Arc tracing through SiC at different magnetic fields, voltages, and mass flows. The conditions lead to rotational frequencies of (a) 11 Hz at 7 mT, 6 SLM, and 300 V; (b) 18 Hz at 7 mT, 6 SLM, and 500 V; (c) 36 Hz at 9.5 mT, 6 SLM, and 500 V; and (d) 46 Hz at 9.5 mT, 10 SLM, and 500 V.
Figure 10.
Curve of with stable operating conditions (9.5 mT, 6 SLM, and 500 V), measured with the current probe and FFT spectrum (right), plotting the signal amplitude over the frequency.
Figure 10.
Curve of with stable operating conditions (9.5 mT, 6 SLM, and 500 V), measured with the current probe and FFT spectrum (right), plotting the signal amplitude over the frequency.
Figure 11.
Curve of over the first 100 ms of an experiment for different magnetic flux densities at , and .
Figure 11.
Curve of over the first 100 ms of an experiment for different magnetic flux densities at , and .
Figure 12.
Spectral power density at different variations in magnetic flux density, volume flow, and input voltage.
Figure 12.
Spectral power density at different variations in magnetic flux density, volume flow, and input voltage.
Figure 13.
Spectral power density at different variations in the humidity (left) and the dominant frequencies over the humidity (right).
Figure 13.
Spectral power density at different variations in the humidity (left) and the dominant frequencies over the humidity (right).
Figure 14.
Arc images of experiments with different operating conditions with noted arc diameters.
Figure 14.
Arc images of experiments with different operating conditions with noted arc diameters.
Figure 15.
Changes in specific energy input and the number of theoretical arc contacts with molecules at different magnetic flux densities, mass flow, and voltages.
Figure 15.
Changes in specific energy input and the number of theoretical arc contacts with molecules at different magnetic flux densities, mass flow, and voltages.
Figure 16.
Experimental setup. Electrical components: plasma driver, DC power supply. Reactor components: electrodes, magnet holder, mass flow controller. Analytical components: oscilloscope, current probe, high-speed camera.
Figure 16.
Experimental setup. Electrical components: plasma driver, DC power supply. Reactor components: electrodes, magnet holder, mass flow controller. Analytical components: oscilloscope, current probe, high-speed camera.
Figure 17.
(a) Voltage–current graph with discharge modes; (b) equivalent electrical circuit.
Figure 17.
(a) Voltage–current graph with discharge modes; (b) equivalent electrical circuit.
| Disclaimer/Publisher’s Note: The statements, opinions and data contained in all publications are solely those of the individual author(s) and contributor(s) and not of MDPI and/or the editor(s). MDPI and/or the editor(s) disclaim responsibility for any injury to people or property resulting from any ideas, methods, instructions or products referred to in the content. |
© 2024 by the authors. Licensee MDPI, Basel, Switzerland. This article is an open access article distributed under the terms and conditions of the Creative Commons Attribution (CC BY) license (https://creativecommons.org/licenses/by/4.0/).


