Article

Effect of Calcination Temperature in Large-Aperture Medium-Entropy Oxide (FeCoCuZnNa)O on CO2 Hydrogenation for Light Olefins

by
Zhijiang Ni
1,*,
Xiaoyu Chen
1,
Lin Su
1,
Hanyu Shen
1 and
Chaochuang Yin
2
1
School of Mechanical Engineering & Urban Rail Transit, Changzhou University, Changzhou 213001, China
2
School of Chemistry and Materials Engineering, Liupanshui Normal University, Liupanshui 553004, China
*
Author to whom correspondence should be addressed.
Catalysts 2024, 14(11), 818; https://doi.org/10.3390/catal14110818
Submission received: 28 October 2024 / Revised: 9 November 2024 / Accepted: 11 November 2024 / Published: 13 November 2024
(This article belongs to the Section Catalytic Materials)

Abstract

:
The catalytic hydrogenation of carbon dioxide is not only a way to mitigate the greenhouse effect but also provides high-value chemicals. In this work, a medium-entropy oxide catalyst (FeCoCuZnNa)O was prepared by the sol–gel method for highly active and selective hydrogenation of CO2 to value-added hydrocarbons. When reacted at 290 °C, 2.5 MPa, and 2500 mL·gcat−1·h−1, the CO2 conversion and selectivity of olefin were affected by the calcination temperature of the catalyst, and the best performances were 39% and 41.3%. The large pore size and oxygen vacancies (Ov) formed by (FeCoCuZnNa)O promote the activation of CO2 and promote the C-C coupling reaction of Fe5C2 in a hydrogenation reaction. The promoted C-C coupling reaction was related to the surface enrichment of iron species. The presence of Ov also inhibited the excessive hydrogenation reaction, further improving the selectivity of light olefins. In addition, (FeCoCuZnNa)O did not show significant deactivation within 75 h, indicating that the catalyst has strong industrial potential.

Graphical Abstract

1. Introduction

Effective utilization of CO2 is highly desired for building the future greener industry. Catalytic conversion of CO2 is a promising solution to solve the problem of excessive carbon dioxide emission [1,2,3,4,5]. Fe-based catalysts are commonly used for CO2 hydrogenation to produce light olefins, which involves two main steps: reverse water–gas shift (RWGS) and catalytic Fischer–Tropsch synthesis (FT) at active sites [6,7]. However, low selectivity and poor stability of target products are often the main problems of traditional iron-based catalysts.
The incorporation of alkali (such as Na, K, Cs, and Rb) metals and transition (such as Co, Cu, and Zn) metals as catalysts is widely recognized to significantly enhance the catalytic performance of iron catalysts [8,9,10,11,12]. Alkali metals are often used as catalysts in catalytic reactions, such as Na in alkaline conditions. Liang et al. [13] investigated the effect of a Na accelerator on the hydrogenation of CO2 from Fe-based catalysts to olefins, and they found that the addition of Na enhances the adsorption capacity of CO2, facilitates the formation and stability of the active substance Fe5C2, and inhibits the secondary hydrogenation reaction of alkenes [14]. Transition elements are usually used as structural promoters to modulate the size of Fe particles and enhance exposure to active Fe metal surface. For example, the study conducted by Satthawong et al. [8] found that the combination of a small quantity of Fe with Co metal on alumina in an Fe-Co catalyst effectively enhanced the hydrogenation process of CO2 to C2+ hydrocarbons. Wang et al. [15] developed and designed a bimetallic catalyst supported by γ-alumina on Fe-Cu for CO2 hydrogenation to produce C2+ hydrocarbons. Compared with the monometallic Fe catalyst, the Fe-Cu bimetallic catalyst significantly enhanced the formation of C2+ hydrocarbons and inhibited the formation of CH4. Zhang et al. [16] used in situ XPS characterization to investigate the interactions of Fe–Zn bimetallic catalysts during CO2 hydrogenation to produce linear α-olefins. It was observed that the addition of Zn inhibited the oxidation of FeCx and changed the equilibrium ratio of FeCx/FeOx during the reaction, thereby promoting C-C coupling and enhancing olefin synthesis. In summary, iron-based catalysts can be modified or doped with other transition metals to show good activity and stability in the carbon dioxide hydrogenation reaction, but traditional metal oxides include only one or two principal metal elements with others at lower fractions and thus lack broad compositional tunability, limiting the improvement of hydrogenation catalysis [17].
Recently, medium-entropy oxides (MEOs) containing multiple main metal elements have received more and more attention in the field of chemical catalysis. MEOs consist of three or four metal cations of equal or near-equal molar concentration, randomly distributed at the same lattice position in the crystal structure. Therefore, MEOs have a wide range of tunable combinations for different catalytic domains [17,18,19]. The multi-metal synergistic effects make them easily tuned for a catalyst–adsorbate interaction and have great potential to maximize their intrinsic catalytic activity. The ionic radii of Co, Cu, Zn, and Fe are 63, 72, 74, and 64 pm, respectively. The similar ionic radii of these elements facilitate good solubility in ternary and quaternary systems, enabling the formation of stable medium-entropy oxide crystal structures [20,21,22,23]. Meanwhile, the strong electron interaction between Co, Cu, Zn and Fe atoms can also significantly improve the catalytic performance.
In this work, we propose a strategy to investigate the effect of the hydrogenation performance of the (FeCoCuZnNa)O catalysts by varying their Ov content. Among them, Fe, Co, Cu, and Zn are the main metal elements. Subsequently, the influence of the physicochemical properties of the catalyst on the hydrogenation performance was analyzed by various characterization techniques. The results show that the catalyst calcined at 800 °C exhibited a more dispersed active phase, which promoted the element C-C coupling. At the same time, the MEO underwent lattice distortion, forming a large number of oxygen vacancies, which significantly improves the conversion rate of CO2 and further promotes the formation of light olefins. Finally, the in situ infrared diffuse reflection was used to reveal the dynamic evolution process of the catalyst in the hydrogenation reaction.

2. Results and Discussion

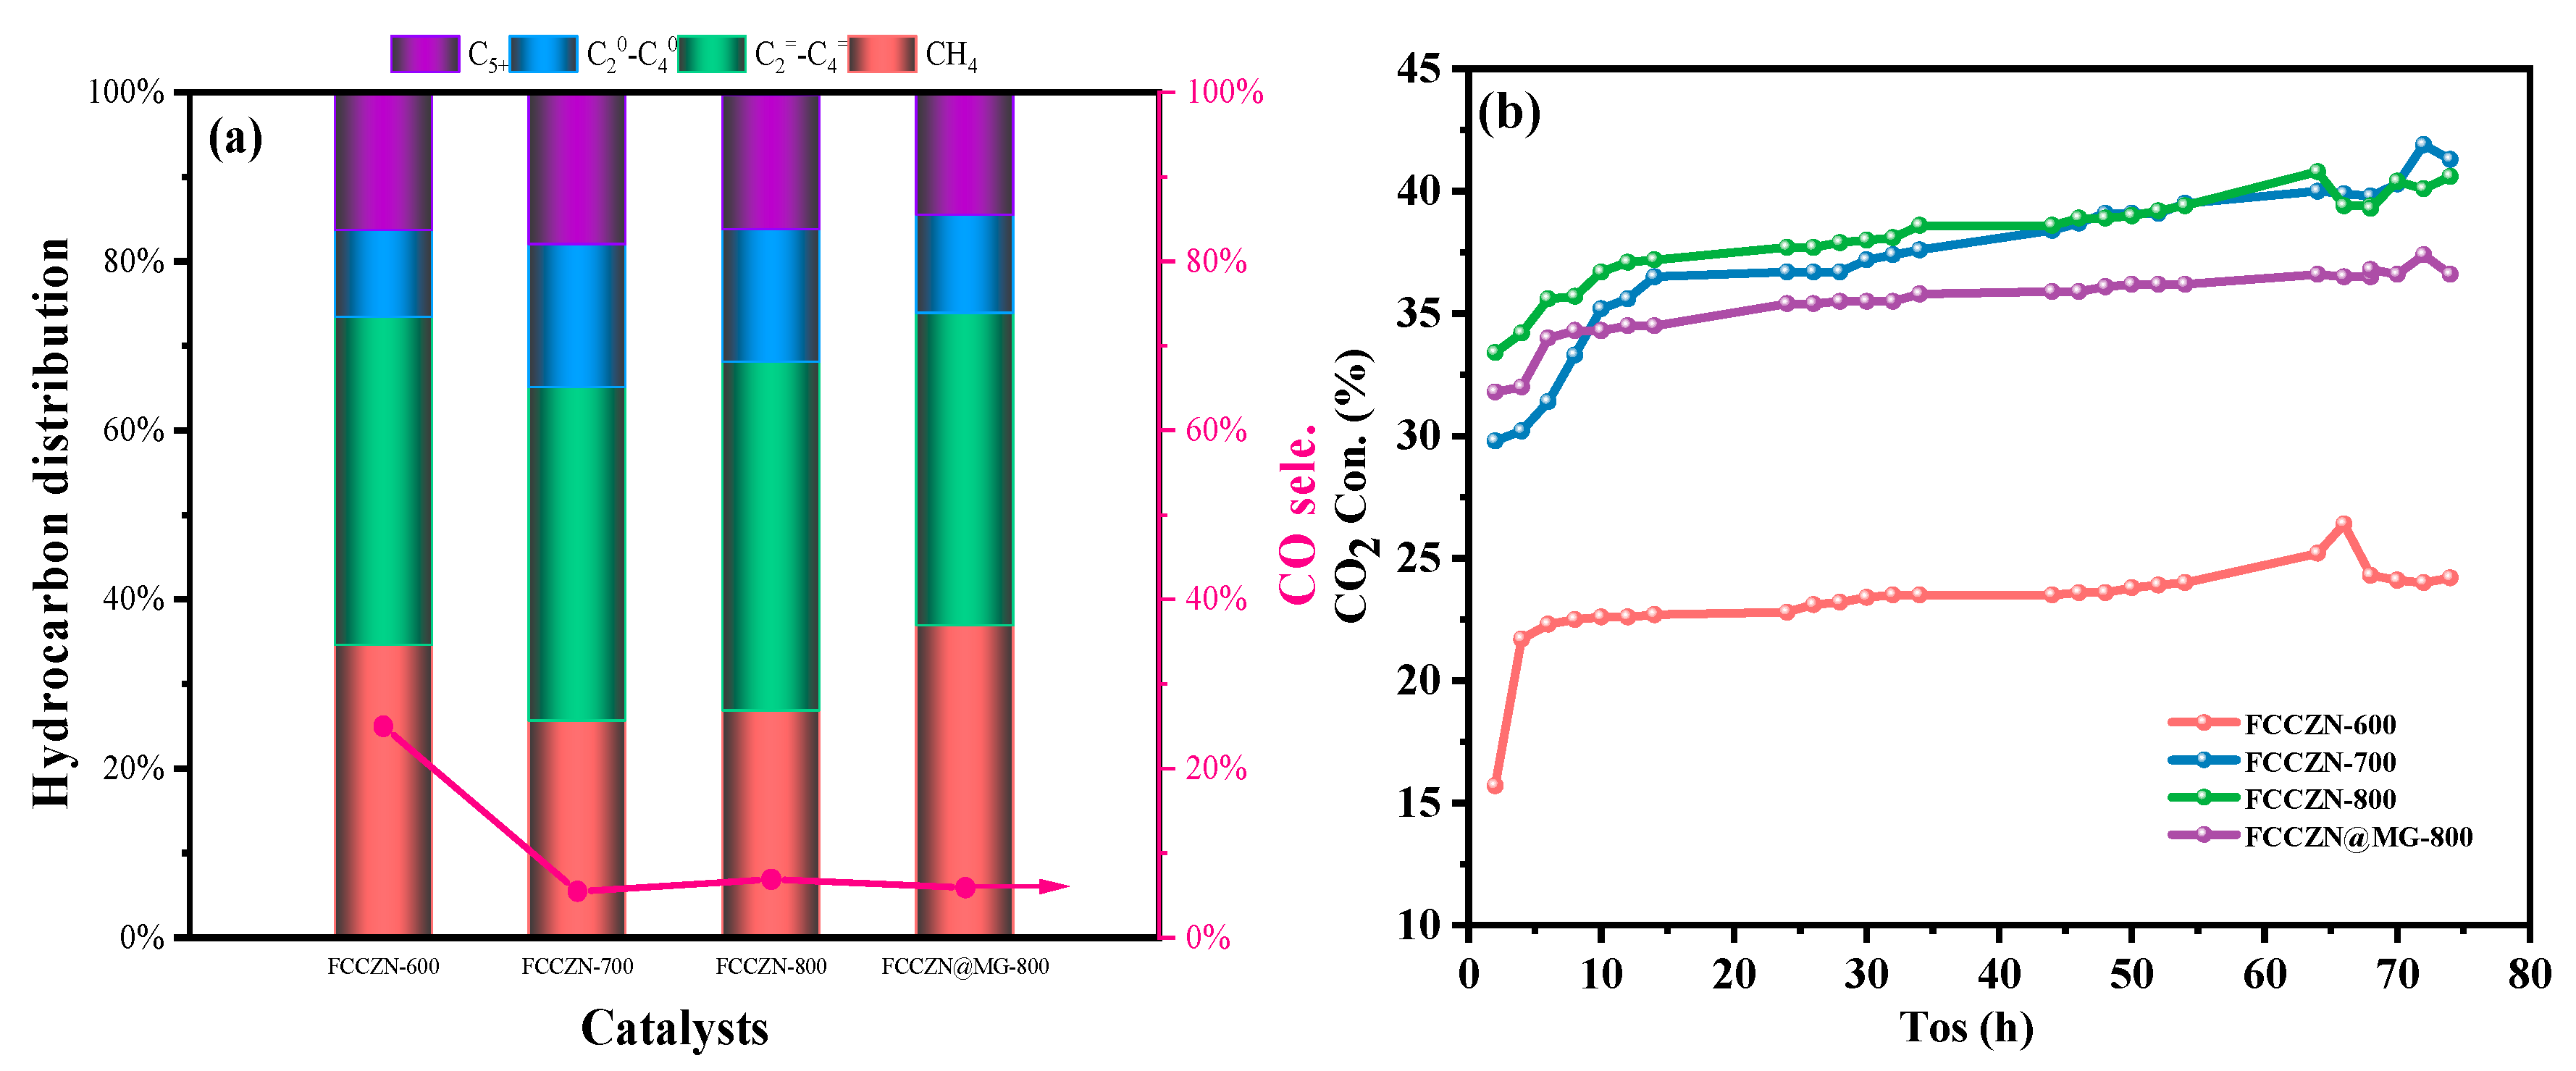
2.1. Catalytic Performances of Catalysts

The preparation process of the MEOs is shown in Figure 1. The catalytic performance of the MEOs was tested at reaction conditions of 290 °C, 2.5 Mpa, and 2500 mL·gcat−1·h−1 in a feed gas of H2/CO2 = 3. Figure 2a and Table 1 show the respective performances of the catalysts. The impact of the calcination temperature on reaction performance of the catalysts has been investigated. The CO2 conversion rate of FCCZN-600 was only 23%. With the increase of calcination temperature, the CO2 conversion rate of FCCZN-700 directly increased significantly to 38.6%, and the CO2 conversion rate of FCCZN-800 was only 0.4% more than that of FCCZN-700. Therefore, the significant change in the CO2 conversion rate in the catalyst may come from changes in the catalyst’s active phase and Ov. The subsequent structural and chemical characterization confirmed this. As the calcination temperature increased, the CH4 and CO selectivity of the FCCZN catalysts showed a trend of first decreasing and then increasing. Among them, the CH4 and CO selectivity of FCCZN-600 were 34.6% and 25%, respectively, which were much higher than the 29.1% and 5.5% of FCCZN-700 and 26.8% and 6.9% of FCCZN-800. This indicates that the FCCZN-700 and FCCZN-800 catalysts may have more and more dispersed metal active sites. However, the selectivity of the products ( C 2 = - C 4 = , C 2 0 - C 4 0 , C5+) shows a volcanic trend, with FCCZN-800 having the highest yield of light olefins (Figure 2c). It is interesting that FCCZN-600 exhibited the lowest alkane selectivity of 10.3%, allowing its olefin selectivity to reach an excellent 38.8%. This indicates that FCCZN-700 and FCCZN-800 are more likely to produce unfavorable by-products from secondary hydrogenation compared to FCCZN-600. The picture of Figure 2d provides details of light hydrocarbon distributions (C2-C4) together with light olefins ( C 2 = - C 4 = ). Interestingly, FCCZN-600 demonstrated a notable preference for C2 hydrocarbons, achieving a selectivity of 16.5%, while FCCZN-700 had the highest selectivity of 14.2% for C4 hydrocarbons. In contrast, the selectivity of FCCZN-800 for C3 hydrocarbons was up to 14.9%. Meanwhile, FCCZN-700 had the highest alkane selectivity, so its O/P is only 2.2. This may be due to the excessive secondary hydrogenation of FCCZN-700. Furthermore, the performance of these catalysts was tested for 75 h to investigate their long-time stability (Figure 2b and Figure S1). After 75 h of reaction, the performance of the FCCZN catalysts were still stable; the CO2 conversion and hydrocarbon yield were not significantly altered, suggesting excellent prospects for industrial applications.

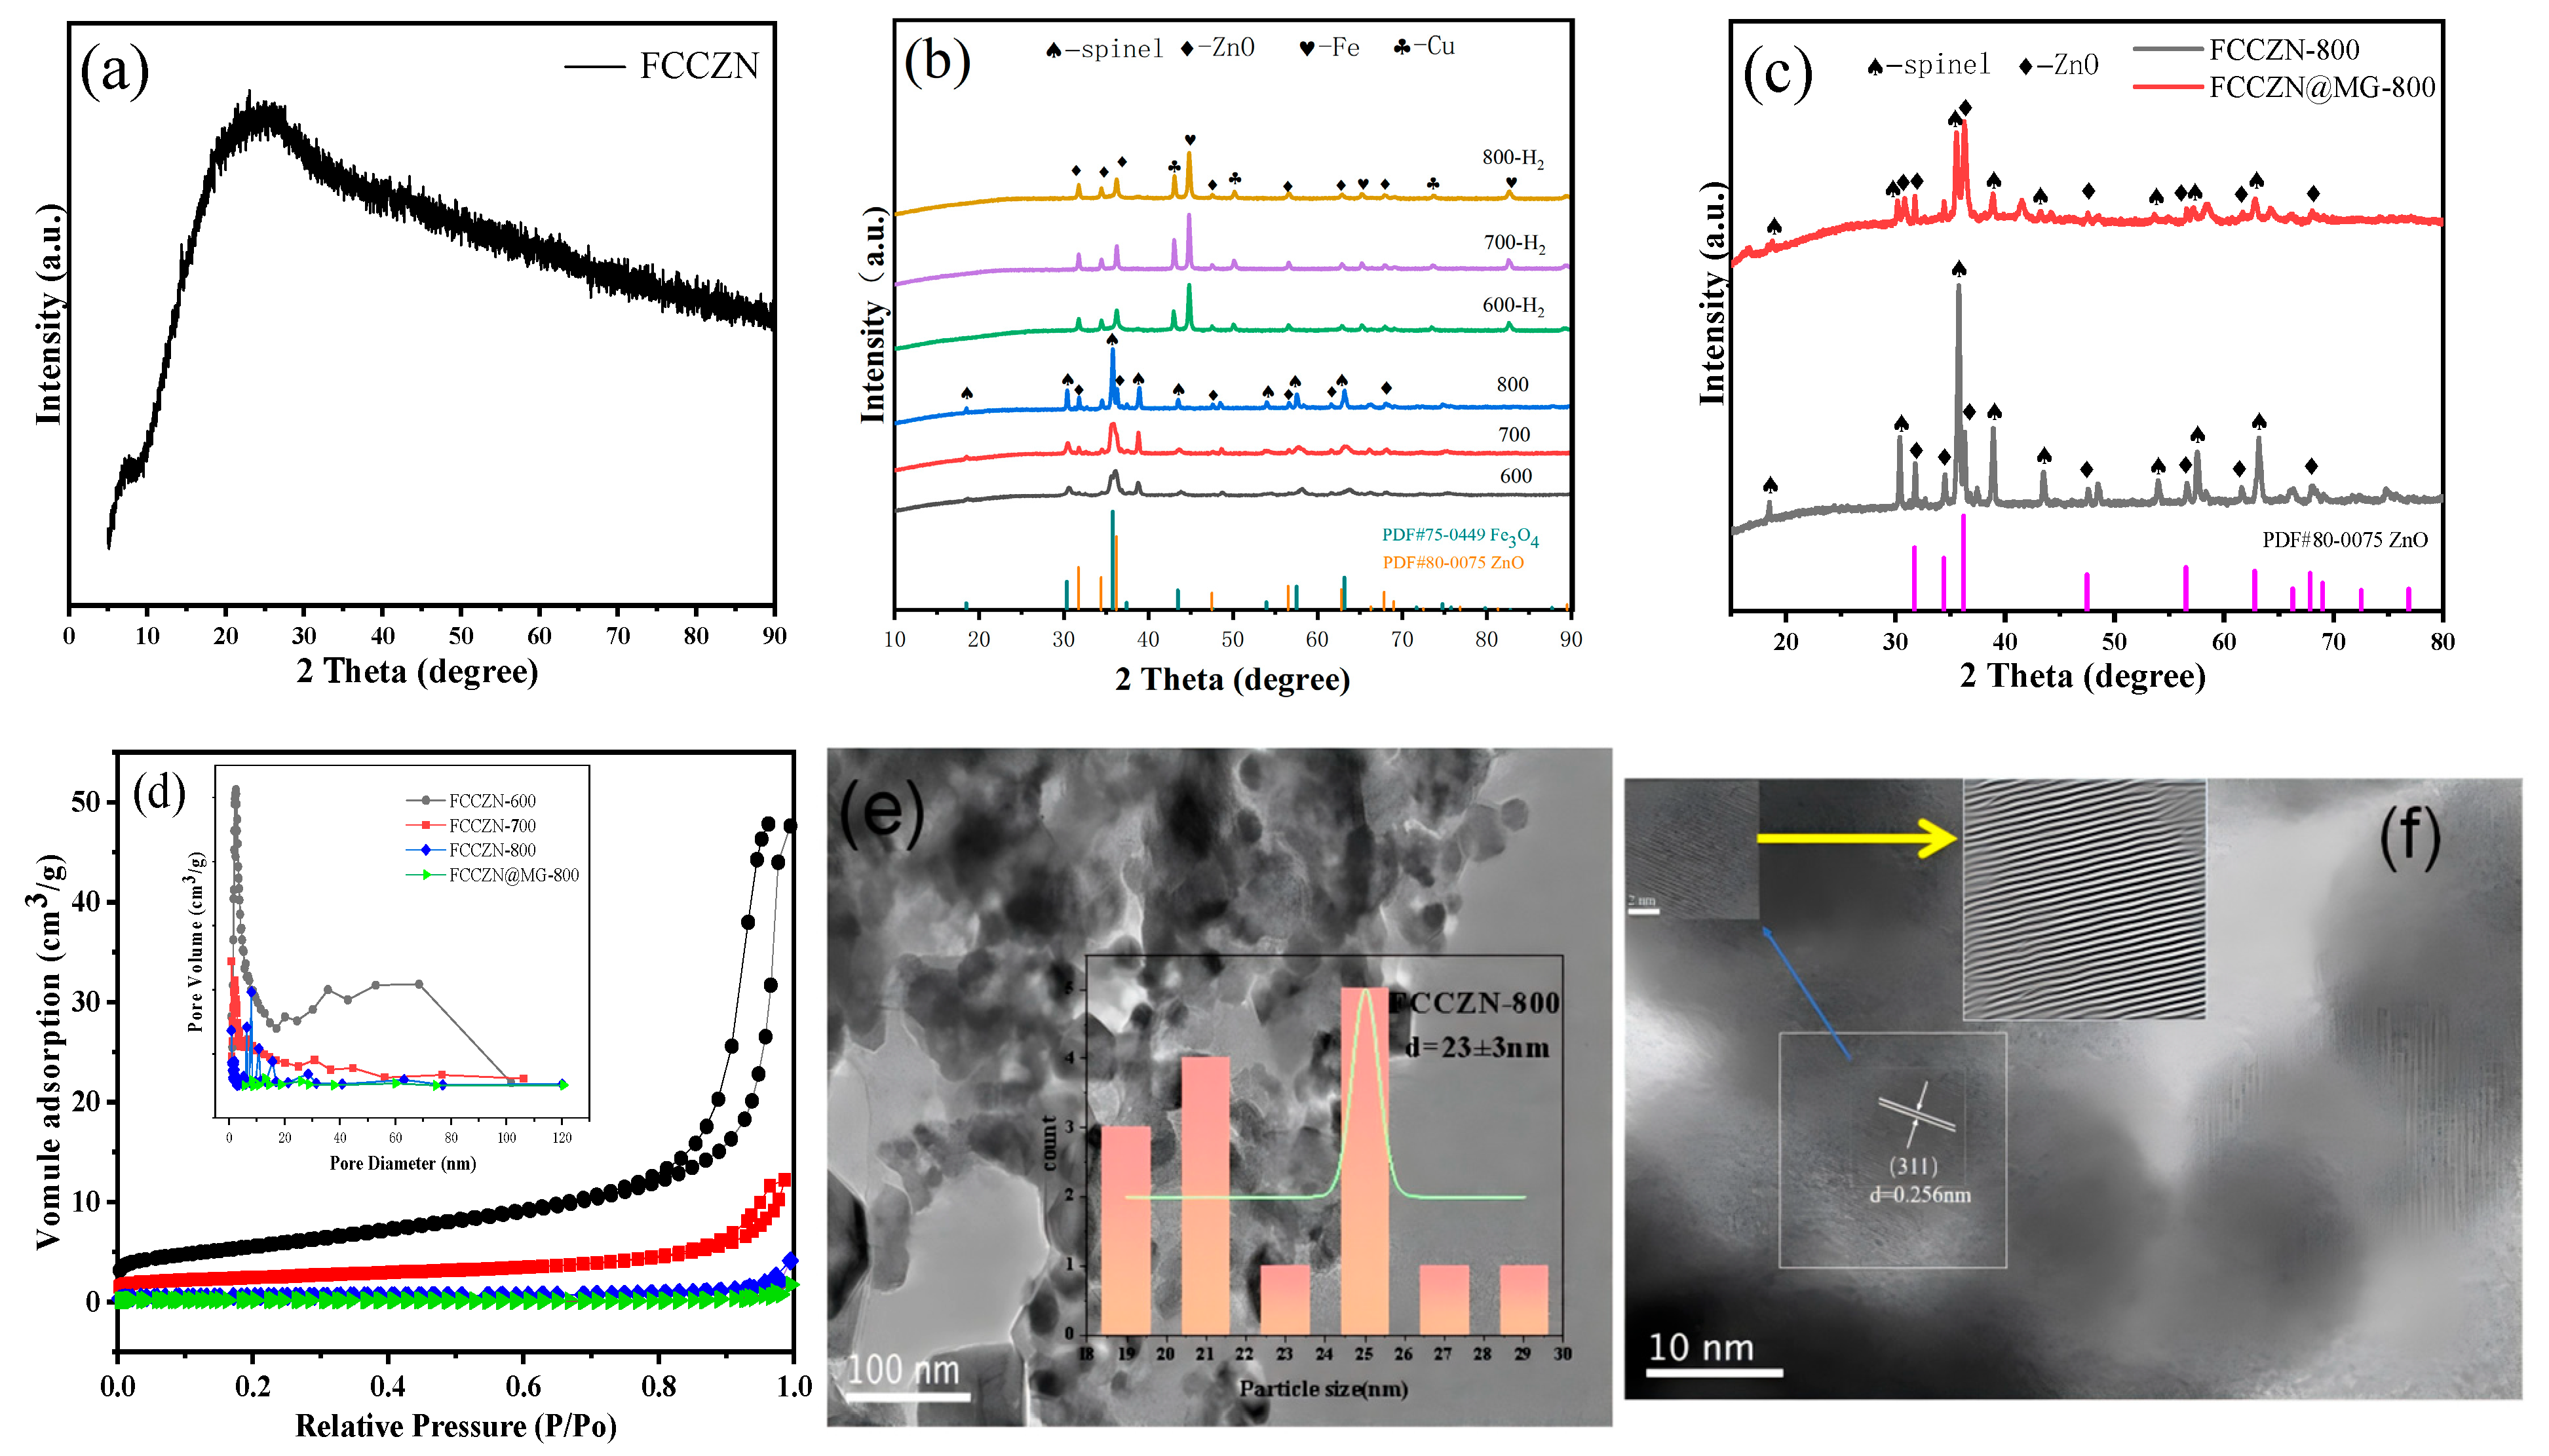
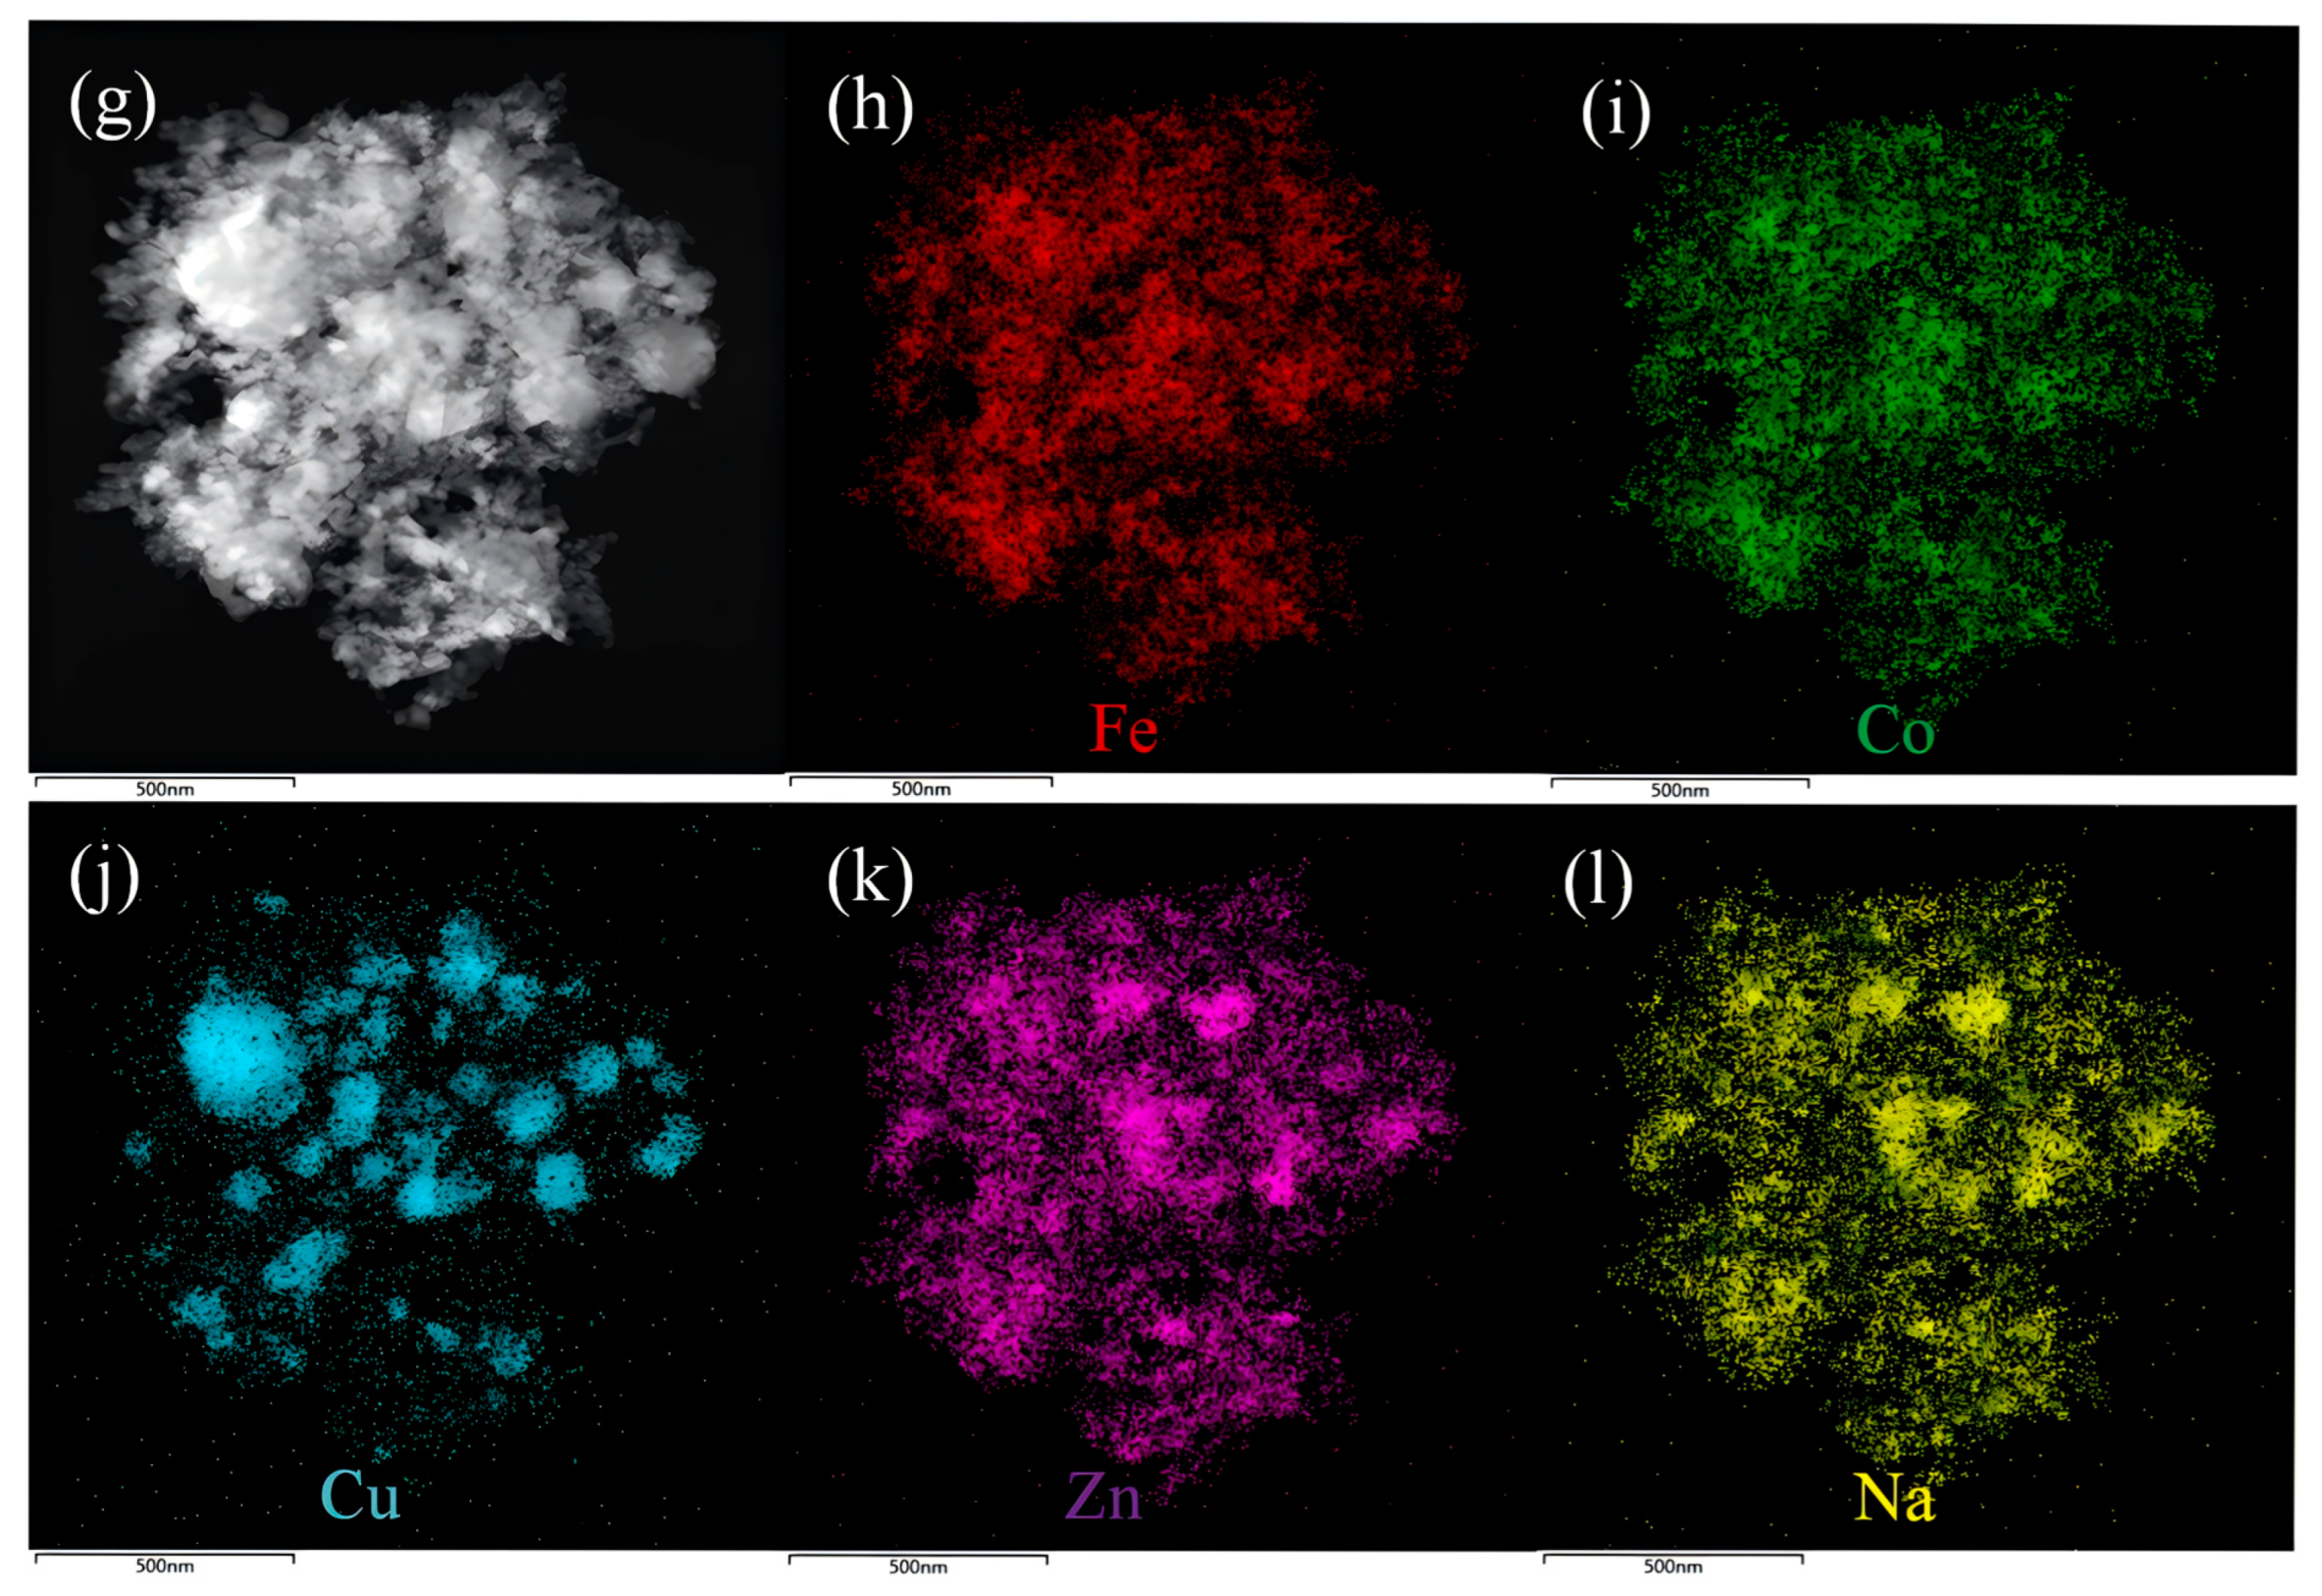
2.2. Textural and Morphological Characteristics of FCCZN Catalysts

The XRD results of our analysis confirm the formation of FCCZN catalysts, as depicted in Figure 3a. The XRD spectrum of the FCCZN catalysts exhibits a broad peak at approximately 26°, indicating the formation of an amorphous polymer framework [24]. The presence of an amorphous polymer framework suggests that the five different metals are uniformly distributed within the polymer. As depicted in Figure 3b, the FCCZN-600, FCCZN-700, and FCCZN-800 samples exhibited the characteristic diffraction patterns of the spinel Fe3O4 phase (JCPDS No. 51-0997) and ZnO phase (JCPDS No. 80-0075) (Figure 3c). However, it was evident that the crystallization process had already initiated at 600 °C when observing FCCZN-600, FCCZN-700, and FCCZN-800. In comparison to 600 °C and 700 °C, FCCZN-800 exhibited better crystallinity and stronger diffraction peak characteristics. Obviously, they both have a spinel structure. However, we found that the XRD pattern of FCCZN-600 showed a small amount of segregation of the ZnO phases, while the segregation of ZnO was more pronounced in FCCZN-700 and FCCZN-800. The segregation of ZnO may be attributed to the Jahn–Teller effect, wherein the local deformation of the oxygen sublattice around zinc ions leads to structural deformation, thereby impeding the incorporation of some excess ZnO into the spinel lattice for solid solution formation [25,26]. Consequently, the FCCZN catalyst exhibited a mixed-phase nature. As depicted in Figure 3b, in the hydrogen atmosphere, some elemental iron and a small amount of elemental copper precipitated from the Fe3O4 spinel. No diffraction patterns associated with Co substance were observed in any of the catalyst samples, whereas EDS mapping revealed that the Co substance was uniformly distributed on the catalyst surface (Figure 3g). However, FCCZN@MG-800 exhibited strong ZnO diffraction peaks (Figure 3c).
The physicochemical properties of the prepared catalysts were characterized using BET analysis, as shown in Figure 3d. The N2 adsorption–desorption isotherms of the FCCZN-600 exhibited typical Type IV isotherms accompanied by H3 hysteresis loops, indicating particle aggregation. As the calcination temperature increased from 600 to 800 °C, the specific surface area of the fresh catalysts decreased from 19.6 m2/g to 1.8 m2/g (Table 2). This indicates that the surface mesoporous structure of FCCZN-800 partially collapsed at the calcination temperature of 800 °C. However, the pore size was distributed in an inverted volcanic shape, and FCCZN-800 had the largest pore size, which is conducive to the reactive adsorption of gases.
The crystal structure and element distribution were studied at the microscopic level by TEM, HETEM, and EDS. The TEM image of Figure 3e and Figure S2a,c shows that the synthesized FCCZN catalysts powder was composed of uniform small grains. The sizes of the grains were between 18 and 36 nm. In the HRTEM images (Figure 3f and Figure S2b,d), clear D spacing of 0.253, 0.255, and 0.256 nm corresponds to the Fe3O4 (311) planes. However, the lattice spacing is slightly different from that of standard Fe3O4. This difference can be attributed to the lattice distortion caused by doping atoms with different ionic radii in the catalyst lattice. These lattice defects can greatly improve the performance of carbon dioxide hydrogenation catalysis by improving the adsorption ability of the reaction intermediate. The element distribution and microstructure of MEO were further studied using an energy spectrometer. Figure 3j–l indicates that for the synthetic MEO, Fe, Co, Cu, Zn, and Na were evenly scattered in the grains; this is consistent with the XPS score results (Figure S3).

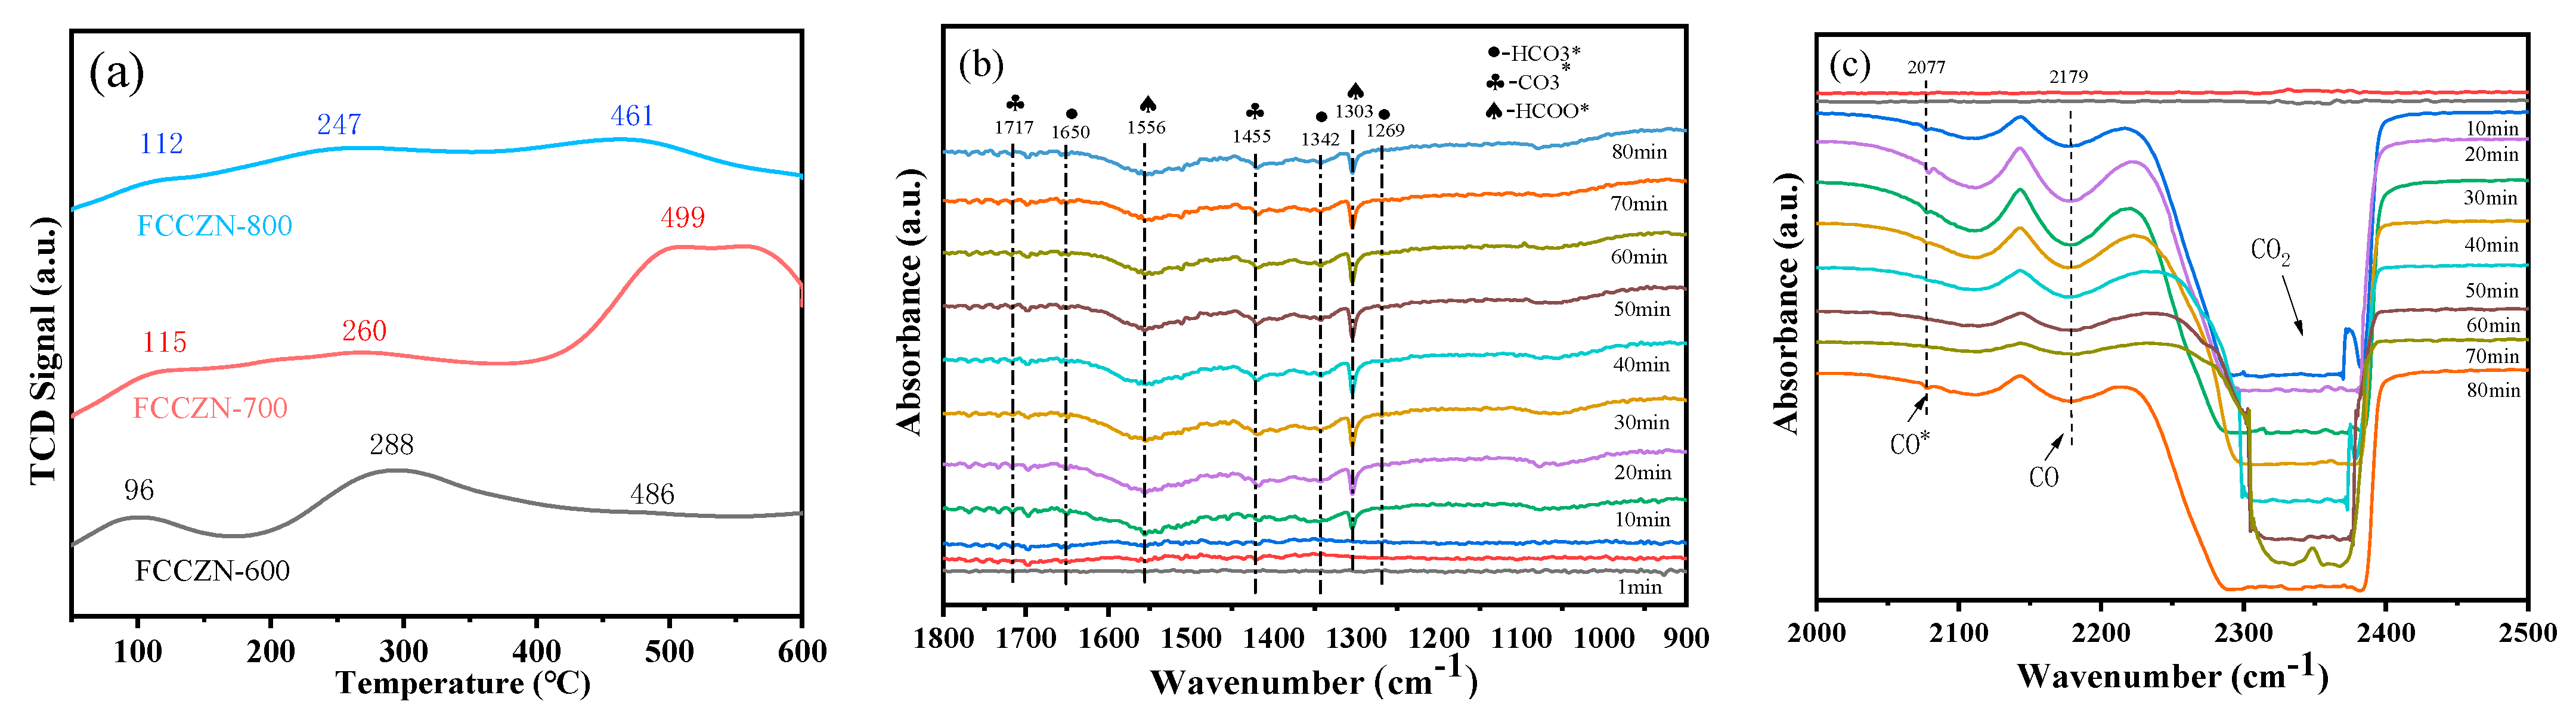
2.3. Chemical Adsorption Properties of FCCZN Catalysts

As shown in Figure 4a, the reduction of Fe and Cu elements occurred in the FCCZN catalysts in a H2 atmosphere. As the reduction temperature increased from 250 °C to 400 °C, Fe elements were further reduced and precipitated. However, FCCZN-600 had the lowest intensity of the Cu diffraction peak, while the Cu species was able to effectively inhibit methanogenesis. Therefore, this may be the reason why FCCZN-700 and FCCZN-800 have lower methane selectivity than FCCZN-600. To assess the calcination temperature on catalyst reducibility, fresh catalysts were characterized using H2 temperature-programmed reduction (H2-TPR) with online mass spectrometry to record H2 signals. As shown in Figure 4b, the peak of MEO at 200–420 °C belongs to the process of CuO reduction to Cu, and the peaks at 280–600 °C belong to the process of Fe3O4 reduction to Fe [27]. The calcination temperature of the catalyst has a great influence on the peak temperature and consumption of α and β peaks, and the peak temperature of the α and β peaks is in the same order: FCCZN-800 < FCCZN-700 < FCCZN-600. Meanwhile, FCCZN-800 had the largest β peak of consumption (Table S1). This indicates that FCCZN-800 has a stronger reducing ability with the increase in calcination temperature. The large pore size is conducive to the exposure of the Fe phase of the FCCZN-800 catalyst and the reaction of reactive gas. Meanwhile, FCCZN-800 had the largest lattice distortion effect, making it easier for metals to migrate to the surface. As shown in Figure 4e,f, the reacted FCCZN-800 catalyst did not show significant agglomeration compared with the fresh FCCZN-800, and the active phase Fe5C2 was uniformly exposed to the catalyst surface.

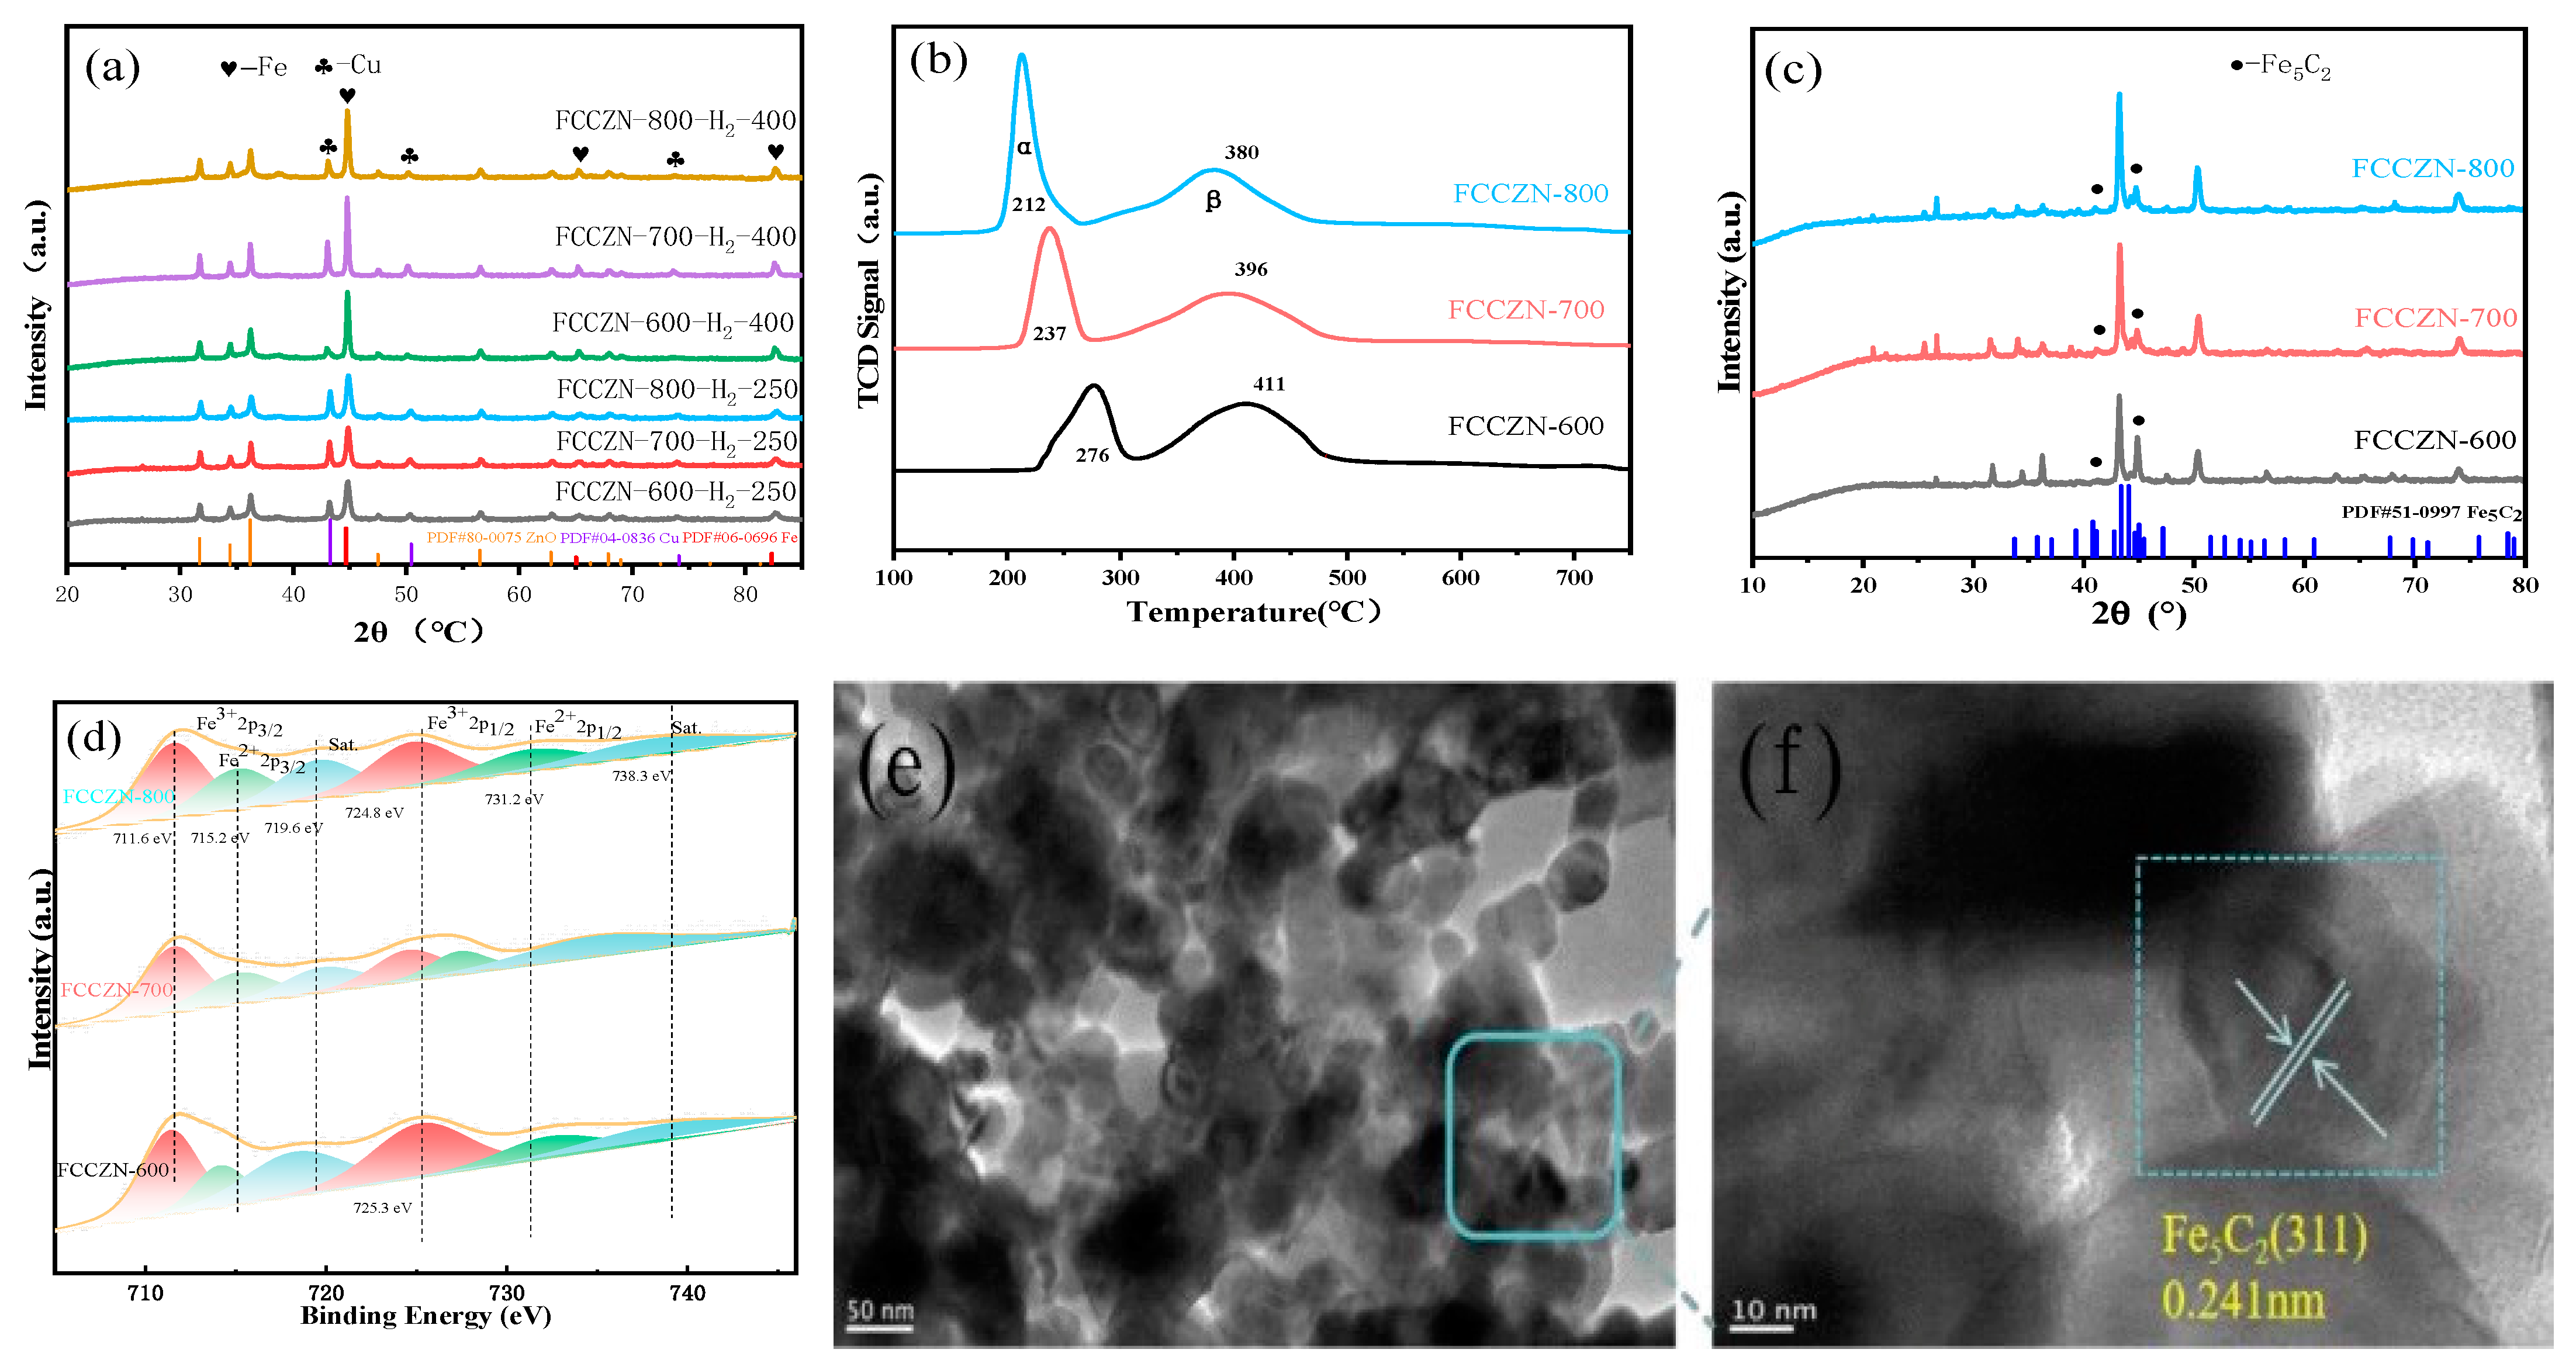
2.4. Electronic Characteristics of FCCZN Catalysts

MSI is an electronic effect in which the electrons of reduced oxide supports with low valence are transferred to the active metals, thereby affecting the chemisorption and catalytic performance of the metals. As shown in Figure 4d, the Fe 2p spectrum was fitted with six peaks with the spin-orbital characteristics of Fe2+ and Fe3+. The peaks centered at 711.60 and 724.8 eV correspond to Fe3+ 2p3/2, while those could be ascribed to Fe2+ 2p1/2 at 715.2 and 731.2 eV. Two shakeup satellite peaks of Fe were visible at 719.6 and 738.3 eV, indicating the mixed-valence state of iron in the MEO. Compared with FCCZN-600, the Fe3+ 2p1/2 binding energy of the FCCZN-800 was reduced by about ~0.5 eV, which may be due to the interaction of oxygen vacancies with iron species, which enriches the surface electron density of iron species, thereby promoting the adsorption of CO2 by providing more electrons to fill the lowest unoccupied molecular orbital of CO2 [28]. Meanwhile, the surface Fe2+/Fe3+ ratio of FCCZN-800 was determined to be 0.40, higher than that of FCCZN-700 (0.37) and FCCZN-600 (0.35), indicating that there are more surface oxygen vacancies to achieve charge balance via the conversion of Fe3+ to Fe2+ over FCCZN-800 (Table S2). Therefore, the enrichment of iron species and the enhancement of electron transfer ability are the key to promoting C-C coupling.

2.5. Effect of Different Oxygen Vacancy Content on Catalysts

The O 1s spectra of oxygen species also indicate some differences among the three catalysts above (Figure 5a). There are three characteristic peaks around ~529.0, ~531.5, and ~533.8 eV corresponding to lattice oxygen (O(latt)), oxygen vacancy (Ov), and adsorbed oxygen (O(ad)). Notably, it was evident that the intensity of oxygen vacancy at ~531.5 eV increased in the FCCZN-700 and FCCZN-800 catalysts. The concentration of oxygen vacancies was Ov % = Ov/(O(ad) + Ov + O(latt)). Because high-temperature calcination increases the kinetic energy of the atoms in the catalyst lattice, more oxygen atoms can escape the lattice and form oxygen vacancies. Therefore, the relative contents of oxygen vacancies were calculated and increased in the order of FCCZN-600 < FCCZN-700 < FCCZN-800, which is essential to promote the enrichment of carbon in the FCCZN catalysts. Consequently, Fe5C2 is more likely to form in FCCZN-800, thereby facilitating the production of olefins over alkanes. In contrast, FCCZN-600 is less able to fully react with the feed gas CO₂ due to the limited presence of active phase Fe5C2 on its surface, leading to the generation of a substantial amount of CO. This reduction in the H₂/CO ratio further drives FCCZN-600 towards promoting methane formation. Meanwhile, an O2-TPD experiment was conducted to study the dynamic behavior of various amounts of oxygen on the FCCZN catalyst, which were further determined after hydrogen reduction (Figure 5b). In general, sample oxygen desorption peaks can be divided into three regions, namely, chemisorbed oxygen (Oads) desorption (I), surface lattice oxygen (Osurf) desorption (II), and bulk lattice oxygen (Obulk) desorption (III). Notably, FCCZN-800 had the most chemisorption oxygen (Oads), indicating that FCCZN-800 had the most Ov, which is consistent with the O 1s curve results above. As shown in Figure S4a, as the calcination temperature of the FCCZN catalysts increased, the surface Ov concentration also increased, while the C 2 = - C 4 = selectivity increased. FCCZN-800 exhibited the highest C 2 = - C 4 = selectivity among the investigated samples and also possessed the highest surface Ov. As shown in Figure S4b, it was found that the oxygen vacancies were linearly correlated with the CO2 conversion rate and STY, indicating that the existence of Ov on the surface of FCCZN-800 was conducive to the adsorption and activation of CO2.
The adsorption and activation of CO2 are crucial to CO2 hydrogenation. CO2-TPD was performed to understand the effects of oxygen vacancies on the adsorption behavior of the feed gas on the FCCZN catalysts, and the results are shown in Figure 5c. The FCCZN catalysts exhibited two desorption peaks, the first being the weak physisorption peak of alkali metal Na to CO2 and the second being the desorption peak of CO2. Compared with FCCZN-600, the CO2 desorption peaks of FCCZN-800 shifted to the high-temperature direction. This can be explained by the fact that Ovs promote CO2 adsorption [29,30]. FCCZN-600 and FCCZN-700 had large CO2 desorption peaks in the range of 700~800 °C, indicating that the higher calcination temperature accelerated the decomposition of the mesoporous structure and led to more carbon dioxide emissions. Therefore, Ovs can effectively improve the conversion rate of carbon dioxide.

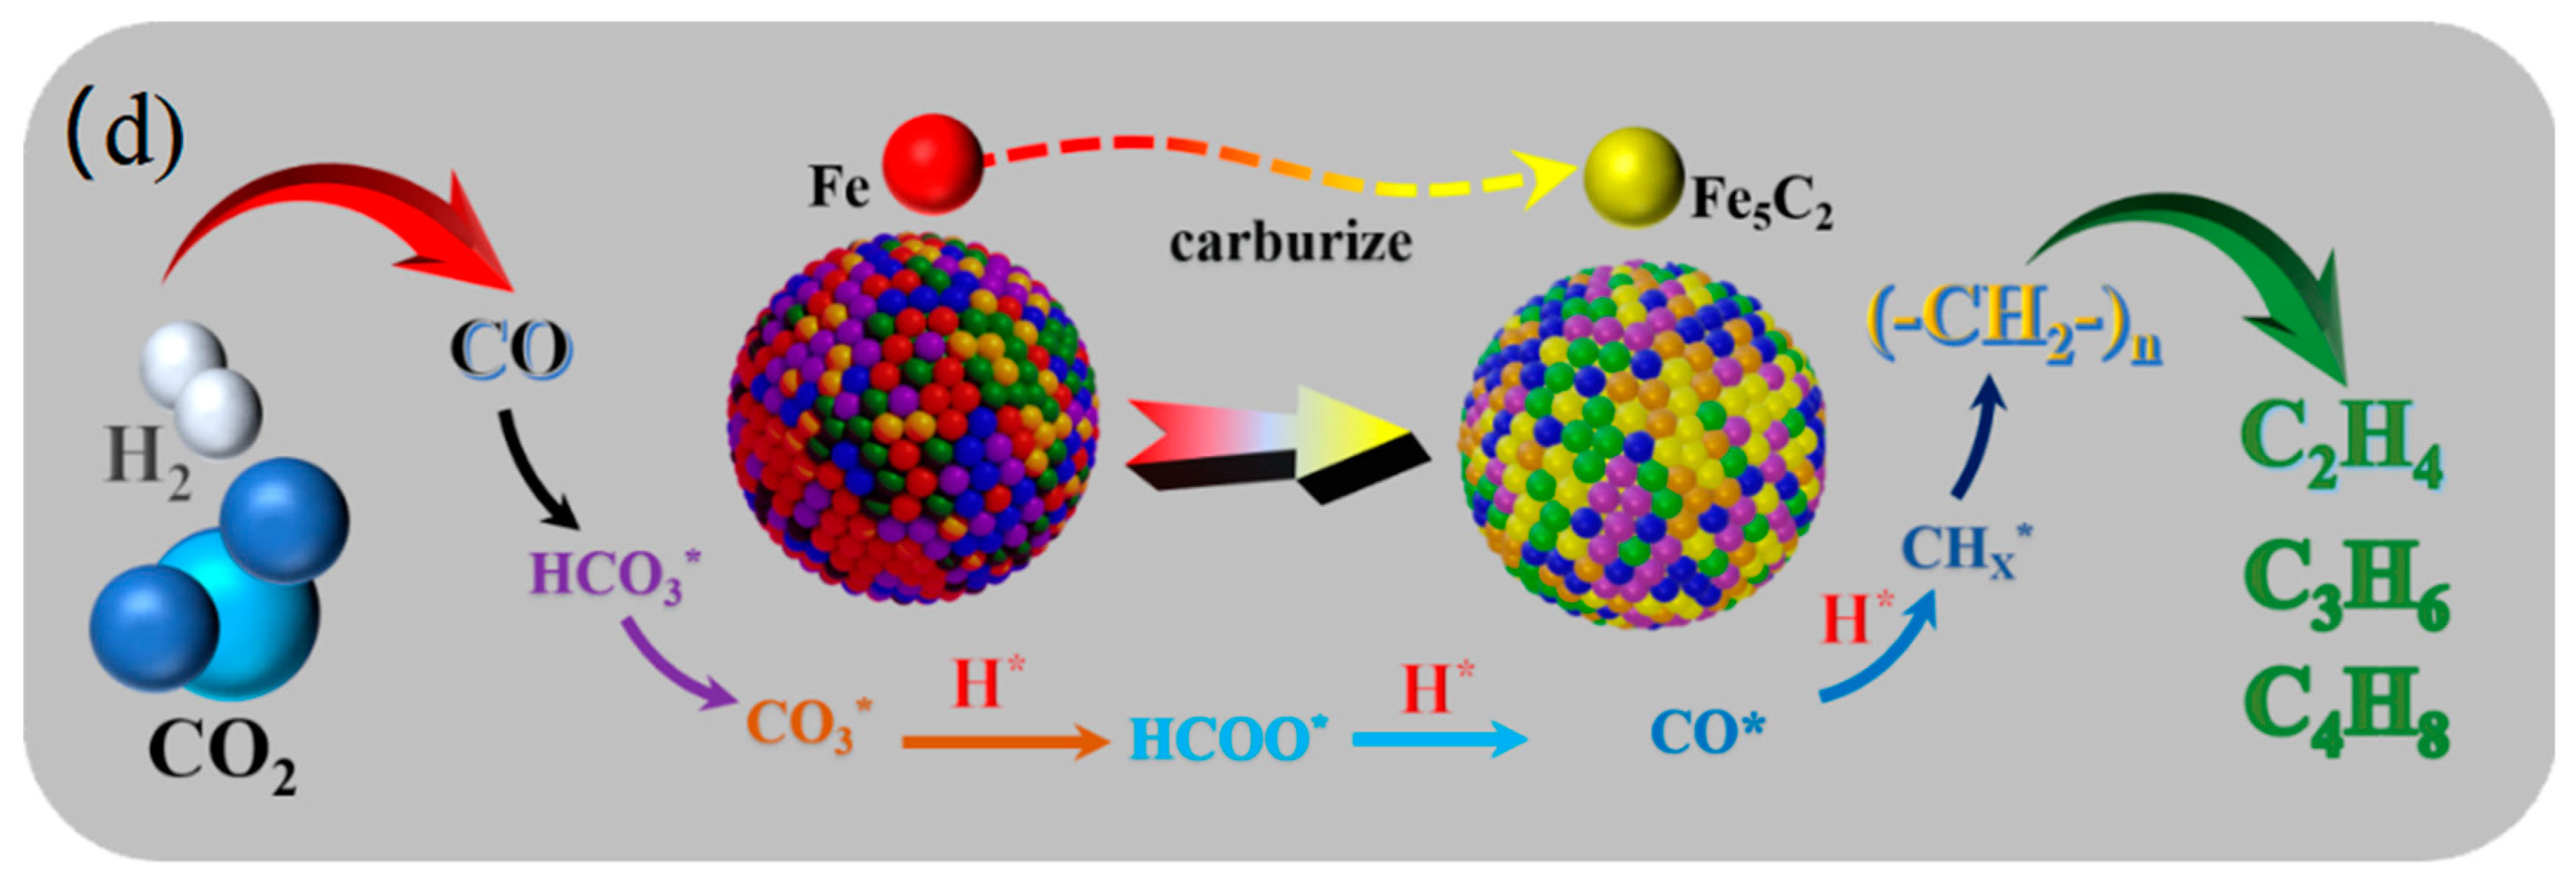
2.6. Reaction Mechanism Study of CO2 Hydrogenation to Light Olefins

The adsorption and activation of H2 are crucial to CO2 hydrogenation. The effect of oxygen vacancies on the adsorption behavior of the feed gas on fresh catalysts was investigated by H2-TPD, and the results are shown in Figure 6. As shown in Figure 6a, all the samples had two distinct peaks in the range of 0-400 °C. With the increase of the roasting temperature, the hydrogen adsorption peak of the FCCZN catalyst gradually weakened and shifted to a lower temperature, indicating that high-temperature calcination inhibited the hydrogenation reaction and prevented the alkylation of the product. It is worth noting that FCCZN-700 exhibited a large desorption peak related to hydrogen overflow at higher temperatures (>400 °C), possibly due to competitive adsorption of H2.
Figure 6d shows a diagram of the reaction mechanism for CO2 hydrogenation. In order to further understand the reaction pathway and products of MEO in the hydrogenation of carbon dioxide to produce olefins, we conducted an in situ infrared diffuse reflection experiment (Figure 6a,b). The experimental results are helpful to reveal the reaction mechanism. After infusing the reactant gas (CO2/H2 = 1/3) to increase the reaction pressure to 2.5 MPa over the reduced catalyst, prominent peaks typical of pressured CO2 were observed in the feed gas (2400–2300 cm−1). However, in the first 10 minutes, the substances are activated and just beginning to react, so we do not observe significant products. Shortly after, typical CO2 adsorption peaks of carbonate (CO3*), bicarbonate (HCO3*), and formic acid species (HCOO*) were found in the region of 1800-1000 cm−1 [31,32]. Therefore, we conclude that the catalyst had a good adsorption of CO2. Notably, the peaks at 1650, 1342, and 1269 cm−1 suggest the existence of HCO3*; those at 1717 and 1455 cm-1 can be assigned to CO3*; and those at 1556 and 1303 cm−1 correspond to HCOO*. Throughout the reaction, the emergence of CO3*, HCO3*, and HCOO* corroborates the occurrence of the reverse water–gas shift (RWGS) reaction [33,34]. Additionally, the peaks at 2179 cm−1 are indicative of gaseous CO, providing compelling evidence of the adsorption and dissociation of CO2 on the catalyst surface. The spectral characteristics at 2077 cm−1 represent the bridging adsorption peak of CO*, which is mainly due to the direct dissociation of CO2 into CO* by oxygen vacancies, which is a key intermediate for C-C coupling to CHx*. CHx* is further hydrogenated to produce light olefins.

2.7. Regulation of Calcination Temperature on Catalyst Structure and Activity

Using BET, H2-TPR, and TEM, it can be found that different calcination temperatures change the large-aperture structure and reducing capacity of the catalyst. However, XPS and CO2-TPD showed that different calcination temperatures caused the lattice distortion of medium-entropy oxides to form oxygen vacancies, which, in turn, affected the hydrogenation of CO2 to light olefins. Therefore, the preparation of light olefins by CO2 hydrogenation was studied from two aspects: catalyst structure and different oxygen vacancies.
Different calcination temperatures change the large-aperture structure and reducing capacity of the catalyst. Compared with MEO prepared by the traditional hand-grinding method, the MEO catalysts have the advantage of stronger gas adsorption capacity due to their unique large-aperture structure. As the calcination temperature increases, the reducing capacity of the catalyst is enhanced, and the reduced iron phase facilitates the carbonization of the active phase Fe5C2, which can be confirmed by XRD and TEM modes. This facilitates C-C coupling to further generate light olefins.
FCCZN catalysts form different degrees of oxygen vacancies at different calcination temperatures. Oxygen vacancies not only greatly improve the CO2 conversion rate of the catalyst but also effectively promote the electron surface enrichment of iron species, promote the synthesis of F-C bonds, and strengthen C-C coupling. In combination with H2-TPD and in situ infrared spectroscopy, high-temperature calcination inhibits excessive hydrogenation and prevents excessive chain growth, which is a key factor in the formation of light olefins.

3. Experimental Section

3.1. Synthesis of Catalysts

The MEOs were synthesized via a wet-chemistry sol–gel process. A total of 2.0 g of polyethylene–polypropylene glycol (F127) was dissolved in a mixture of water (184 mL) and ethanol (32 mL). An ammonia solution (2.5 mL) was then added. After 0.5 h, a tannic acid (TA) solution (80 mL, 0.025 g/mL) and a formaldehyde solution (1.9 mL, 37–40 wt%) were added under stirring. After stirring for 24 h, 10 mL of the metal precursor solution containing Co(NO3)2·6H2O (1 mmol), Cu(NO3)2·6H2O (1 mmol), Zn(NO3)2·6H2O (1 mmol), Fe(NO3)3·9H2O (1 mmol), and NaNO3 (0.04 mmol) were added. After further stirring for 12 h, the product was treated in a hydrothermal reactor at 100 °C for 12 h. After hydrothermal treatment, the solution was centrifugally washed three times, poured into a Petri dish, and dried overnight in an oven at 180 °C. The centrifuged products were then dried in an oven for 12 h and heated in a tubular furnace at 5 °C/min. MEOs are closely related to the calcination temperature. Therefore, in order to study the effects of different calcination temperatures on the catalysts, we prepared three groups of catalysts with different calcination temperatures, which are respectively expressed as (FeCoCuZnNa)O-600, (FeCoCuZnNa)O-700, and (FeCoCuZnNa)O-800, collectively known as FCCZN-M (M = 600 °C, 700 °C, and 800 °C). Preparation of the FCCZN@MG-800 catalyst was as follows: The molar of Co(NO3)2·6H2O (1 mmol), Cu(NO3)2·6H2O (1 mmol), Zn(NO3)2·6H2O (1 mmol), Fe(NO4)3·9H2O (1 mmol), and NaNO3 (0.04 mmol) was put into the grinding basin, after 10 min of uniform grinding to produce mixed dark mucous, then dried and calcined (under the same conditions as the FCCZN catalysts).

3.2. Sample Characterization

The structural characterization of related samples, including powder X-ray diffraction (XRD), inductively coupled plasma atomic emission spectroscopy (ICP-AES), low-temperature N2 adsorption, high-resolution transmission electron microscopy (HRTEM) with energy-dispersive X-ray (EDX) spectroscopy, X-ray photoelectron spectroscopy (XPS), hydrogen temperature-programmed reduction (H2-TPR), hydrogen temperature-programmed desorption (H2-TPD), O2 or CO2 temperature-programmed desorption (O2-TPD, CO2-TPD), and in-situ infrared spectroscopy, is provided in the Supporting Information.

3.3. Catalyst Evaluation

In a tubular quartz fixed-bed reactor with a diameter of 10 mm, in order to avoid the blockage and non-flow of the reaction tube, a small amount of quartz wool was inserted at both ends of the fixed bed, and the middle part of the fixed bed was filled with 40–60 mesh quartz sand and a powder catalyst. Before the FT reaction, the catalyst needed to be reduced with high-purity hydrogen; the reduction conditions were 400 °C, 0.4 MPa, a reaction space velocity of 2500 mL gcat−1·h−1, and a continuous reaction time of 18 h. After cooling to room temperature, the mixed reaction gas with a CO2/H2 ratio of 1:3 was sent to a fixed-bed reactor for Fischer–Tropsch synthesis. The reaction was typically performed at a pressure of 2.5 MPa and a temperature of 290 °C, and the samples were analyzed by an in-line gas chromatograph equipped with a thermal conductivity detector (TCD) and a flame ionization detector (FID). The contents of H2, CO, CO2, and N2 were detected by a thermal conductivity detector (TCD) with a Carboxen column. C1-C5+ hydrocarbons were detected by a flame ionization detector (FID) with an alumina column. All the listed data were obtained at 75 h on-stream when the steady state was achieved.
The conversion of C O 2 ( C O 2   c o n v . ) and the selectivities of the hydrocarbons ( C n H m s e l . ), CO ( C O s e l . ), and C 2 = C 4 =   ( C 2 = C 4 = s e l . ) were calculated using the following equations:
C O 2 c o n v . ( % ) = C O 2 i n C O 2 o u t C O 2 i n × 100
C O s e l . ( % ) = C O o u t C O 2 i n C O 2 o u t × 100
C n H m s e l . ( % ) = C n H m × n 1 n C n H m × n × 100
C 2 = C 4 = s e l . ( % ) = 2 4 C n H 2 n × n 1 n C n H m × n × 100
C a r b o n b a l a n c e ( % ) = C O o u t + 1 n C n H m × n + C O 2 o u t C O 2 i n × 100
where C O 2 i n and C O 2 o u t express the mole of   C O 2 at the inlet and the outlet of the reactor, respectively. C O o u t is the mole of CO in the outlet. C n H m is the mole of the hydrocarbon product with carbon number n.
S T Y C 2 = C 4 = = 2 4 C n H 2 n × n × M C 2 = C 4 =
where S T Y C 2 = C 4 = is the time–space yield of C 2 = C 4 = based on the unit mass catalyst ( g g c a t 1 h 1 ) .

4. Conclusions

In this work, a large-aperture structure of medium-entropy oxide catalysts were prepared through the composition of different elements, successfully achieving a uniform distribution of five metal elements in the structure and effectively exerting synergistic catalytic effects of the elements. Different calcination temperatures changed the structure and reduction performance of the medium-entropy oxide catalysts, which promoted the formation of the active phase Fe5C2 on the one hand and inhibited the excessive hydrogenation reaction on the other. Meanwhile, the oxygen vacancies formed by high-temperature calcination greatly promote the conversion of CO2, which further promotes the reaction to olefins. This work provides a medium-entropy oxide catalyst with high activity and high thermal stability for the hydrogenation of carbon dioxide to light olefins.

Supplementary Materials

The following supporting information can be downloaded at: https://www.mdpi.com/article/10.3390/catal14110818/s1.

Author Contributions

Z.N.: Writing—original draft, methodology, investigation, data curation, funding acquisition. X.C.: Writing—review and editing, project administration. L.S.: Writing—review and editing, investigation. H.S.: Writing—review and editing, investigation. C.Y.: Writing—review and editing, supervision, project administration, conceptualization. All authors have read and agreed to the published version of the manuscript.

Funding

This work was financially supported by the National Natural Science Foundation of China (Grant No. 21905031), the Guizhou Provincial Basic Research Program (Natural Science) ([2022]534), and the Science Foundation of Changzhou university (ZMF18020299).

Data Availability Statement

The data presented in this study are openly available.

Conflicts of Interest

The authors declare no conflicts of interest. The funders had no role in the design of the study; in the collection, analyses, or interpretation of the data; in the writing of the manuscript; or in the decision to publish the results.

References

  1. Kondratenko, E.V.; Mul, G.; Baltrusaitis, J.; Larrazábal, G.O.; Pérez-Ramírez, J. Status and Perspectives of CO2 Conversion into Fuels and Chemicals by Catalytic, Photocatalytic and Electrocatalytic Processes. Energy Environ. Sci. 2013, 6, 3112. [Google Scholar] [CrossRef]
  2. Pan, Y.; Ding, X.; Zhang, C.; Zhu, M.; Yang, Z.; Han, Y.-F. Effects of Different Reductive Agents on Zn-Promoted Iron Oxide Phases in the CO2–Fischer–Tropsch to Linear α-Olefins. Catalysts 2023, 13, 594. [Google Scholar] [CrossRef]
  3. Sun, C.; Jiang, Z.; Li, W.; Hou, Q.; Li, L. Changes in Extreme Temperature over China When Global Warming Stabilized at 1.5 °C and 2.0 °C. Sci. Rep. 2019, 9, 14982. [Google Scholar] [CrossRef] [PubMed]
  4. Bootpakdeetam, P.; Igboenyesi, O.V.; Dennis, B.H.; MacDonnell, F.M. Superhydrophobic Surface Modification of a Co-Ru/SiO2 Catalyst for Enhanced Fischer-Tropsch Synthesis. Catalysts 2024, 14, 638. [Google Scholar] [CrossRef]
  5. Guo, L.; Sun, J.; Ge, Q.; Tsubaki, N. Recent Advances in Direct Catalytic Hydrogenation of Carbon Dioxide to Valuable C2+ Hydrocarbons. J. Mater. Chem. A 2018, 6, 23244–23262. [Google Scholar] [CrossRef]
  6. Davis, B.H. Fischer−Tropsch Synthesis: Comparison of Performances of Iron and Cobalt Catalysts. Ind. Eng. Chem. Res. 2007, 46, 8938–8945. [Google Scholar] [CrossRef]
  7. Hu, B.; Frueh, S.; Garces, H.F.; Zhang, L.; Aindow, M.; Brooks, C.; Kreidler, E.; Suib, S.L. Selective Hydrogenation of CO2 and CO to Useful Light Olefins over Octahedral Molecular Sieve Manganese Oxide Supported Iron Catalysts. Appl. Catal. B Environ. 2013, 132–133, 54–61. [Google Scholar] [CrossRef]
  8. Satthawong, R.; Koizumi, N.; Song, C.; Prasassarakich, P. Bimetallic Fe–Co Catalysts for CO2 Hydrogenation to Higher Hydrocarbons. J. CO2 Util. 2013, 3–4, 102–106. [Google Scholar] [CrossRef]
  9. Orege, J.I.; Liu, N.; Amoo, C.C.; Wei, J.; Ge, Q.; Sun, J. Boosting CO2 Hydrogenation to High-Value Olefins with Highly Stable Performance over Ba and Na Co-Modified Fe Catalyst. J. Energy Chem. 2023, 80, 614–624. [Google Scholar] [CrossRef]
  10. Xu, Y.; Zhai, P.; Deng, Y.; Xie, J.; Liu, X.; Wang, S.; Ma, D. Highly Selective Olefin Production from CO2 Hydrogenation on Iron Catalysts: A Subtle Synergy between Manganese and Sodium Additives. Angew. Chem. Int. Ed. 2020, 59, 21736–21744. [Google Scholar] [CrossRef]
  11. Zhang, Z.; Huang, G.; Tang, X.; Yin, H.; Kang, J.; Zhang, Q.; Wang, Y. Zn and Na Promoted Fe Catalysts for Sustainable Production of High-Valued Olefins by CO2 Hydrogenation. Fuel 2022, 309, 122105. [Google Scholar] [CrossRef]
  12. Chirik, P.J. Iron- and Cobalt-Catalyzed Alkene Hydrogenation: Catalysis with Both Redox-Active and Strong Field Ligands. Acc. Chem. Res. 2015, 48, 1687–1695. [Google Scholar] [CrossRef] [PubMed]
  13. Liang, B.; Duan, H.; Sun, T.; Ma, J.; Liu, X.; Xu, J.; Su, X.; Huang, Y.; Zhang, T. Effect of Na Promoter on Fe-Based Catalyst for CO2 Hydrogenation to Alkenes. ACS Sustain. Chem. Eng. 2019, 7, 925–932. [Google Scholar] [CrossRef]
  14. Chernavskii, P.A.; Kazak, V.O.; Pankina, G.V.; Perfiliev, Y.D.; Li, T.; Virginie, M.; Khodakov, A.Y. Influence of Copper and Potassium on the Structure and Carbidisation of Supported Iron Catalysts for Fischer–Tropsch Synthesis. Catal. Sci. Technol. 2017, 7, 2325–2334. [Google Scholar] [CrossRef]
  15. Wang, W.; Jiang, X.; Wang, X.; Song, C. Fe–Cu Bimetallic Catalysts for Selective CO2 Hydrogenation to Olefin-Rich C2 + Hydrocarbons. Ind. Eng. Chem. Res. 2018, 57, 4535–4542. [Google Scholar] [CrossRef]
  16. Zhang, C.; Cao, C.; Zhang, Y.; Liu, X.; Xu, J.; Zhu, M.; Tu, W.; Han, Y.-F. Unraveling the Role of Zinc on Bimetallic Fe5C2 –ZnO Catalysts for Highly Selective Carbon Dioxide Hydrogenation to High Carbon α-Olefins. ACS Catal. 2021, 11, 2121–2133. [Google Scholar] [CrossRef]
  17. Shi, Z.; Wang, L.; Huang, Y.; Kong, X.Y.; Ye, L. High-Entropy Catalysts: New Opportunities toward Excellent Catalytic Activities. Mater. Chem. Front. 2024, 8, 179–191. [Google Scholar] [CrossRef]
  18. Gild, J.; Samiee, M.; Braun, J.L.; Harrington, T.; Vega, H.; Hopkins, P.E.; Vecchio, K.; Luo, J. High-Entropy Fluorite Oxides. J. Eur. Ceram. Soc. 2018, 38, 3578–3584. [Google Scholar] [CrossRef]
  19. Sarkar, A.; Wang, Q.; Schiele, A.; Chellali, M.R.; Bhattacharya, S.S.; Wang, D.; Brezesinski, T.; Hahn, H.; Velasco, L.; Breitung, B. High-Entropy Oxides: Fundamental Aspects and Electrochemical Properties. Adv. Mater. 2019, 31, 1806236. [Google Scholar] [CrossRef]
  20. Anand, G.; Wynn, A.P.; Handley, C.M.; Freeman, C.L. Phase Stability and Distortion in High-Entropy Oxides. Acta Mater. 2018, 146, 119–125. [Google Scholar] [CrossRef]
  21. Zhang, R.-Z.; Reece, M.J. Review of High Entropy Ceramics: Design, Synthesis, Structure and Properties. J. Mater. Chem. A 2019, 7, 22148–22162. [Google Scholar] [CrossRef]
  22. Mi, J.; Chen, X.; Ding, Y.; Zhang, L.; Ma, J.; Kang, H.; Wu, X.; Liu, Y.; Chen, J.; Wu, Z.-S. Activation of Partial Metal Sites in High-Entropy Oxides for Enhancing Thermal and Electrochemical Catalysis. Chin. J. Catal. 2023, 48, 235–246. [Google Scholar] [CrossRef]
  23. Meng, Z.; Gong, X.; Xu, J.; Sun, X.; Zeng, F.; Du, Z.; Hao, Z.; Shi, W.; Yu, S.; Hu, X.; et al. A General Strategy for Preparing Hollow Spherical Multilayer Structures of Oxygen-Rich Vacancy Transition Metal Oxides, Especially High Entropy Perovskite Oxides. Chem. Eng. J. 2023, 457, 141242. [Google Scholar] [CrossRef]
  24. Wang, G.; Qin, J.; Feng, Y.; Feng, B.; Yang, S.; Wang, Z.; Zhao, Y.; Wei, J. Sol–Gel Synthesis of Spherical Mesoporous High-Entropy Oxides. ACS Appl. Mater. Interfaces 2020, 12, 45155–45164. [Google Scholar] [CrossRef] [PubMed]
  25. Wei, J.; Sun, Z.; Luo, W.; Li, Y.; Elzatahry, A.A.; Al-Enizi, A.M.; Deng, Y.; Zhao, D. New Insight into the Synthesis of Large-Pore Ordered Mesoporous Materials. J. Am. Chem. Soc. 2017, 139, 1706–1713. [Google Scholar] [CrossRef]
  26. Qiu, P.; Ma, B.; Hung, C.-T.; Li, W.; Zhao, D. Spherical Mesoporous Materials from Single to Multilevel Architectures. Acc. Chem. Res. 2019, 52, 2928–2938. [Google Scholar] [CrossRef]
  27. Cai, W.; Han, H.; Hu, C.; Ye, C.; Cao, Y.; Wang, Y.; Fu, J.; Zhao, Y.; Bu, Y. Fabrication of Transition Metal (Mn, Co, Ni, Cu)-Embedded Faveolate ZnFe2O4 Spinel Structure with Robust CO2 Hydrogenation into Value-Added C2+ Hydrocarbons. ChemCatChem 2023, 15, e202201403. [Google Scholar] [CrossRef]
  28. Wang, C.; Zhang, J.; Gao, X.; Ma, Q.; Fan, S.; Zhao, T.-S. CO2 Hydrogenation to Linear α-Olefins on FeCx/ZnO Catalysts: Effects of Surface Oxygen Vacancies. Appl. Surf. Sci. 2023, 641, 158543. [Google Scholar] [CrossRef]
  29. Nolen, M.A.; Tacey, S.A.; Kwon, S.; Farberow, C.A. Theoretical Assessments of CO2 Activation and Hydrogenation Pathways on Transition-Metal Surfaces. Appl. Surf. Sci. 2023, 637, 157873. [Google Scholar] [CrossRef]
  30. Ra, E.C.; Kim, K.H.; Lee, J.H.; Jang, S.; Kim, H.E.; Lee, J.H.; Kim, E.H.; Kim, H.; Kwak, J.H.; Lee, J.S. Selective Light Hydrocarbon Production from CO2 Hydrogenation over Na/ZnFe2O4 and CHA-Zeolite Hybrid Catalysts. ACS Catal. 2024, 14, 3492–3503. [Google Scholar] [CrossRef]
  31. Zhao, K.; Wang, L.; Calizzi, M.; Moioli, E.; Züttel, A. In Situ Control of the Adsorption Species in CO2 Hydrogenation: Determination of Intermediates and Byproducts. J. Phys. Chem. C 2018, 122, 20888–20893. [Google Scholar] [CrossRef]
  32. Yanagisawa, Y.; Takaoka, K.; Yamabe, S.; Ito, T. Interaction of CO2 with Magnesium Oxide Surfaces: A TPD, FTIR, and Cluster-Model Calculation Study. J. Phys. Chem. 1995, 99, 3704–3710. [Google Scholar] [CrossRef]
  33. Yang, R.; Zhang, Y.; Iwama, Y.; Tsubaki, N. Mechanistic Study of a New Low-Temperature Methanol Synthesis on Cu/MgO Catalysts. Appl. Catal. Gen. 2005, 288, 126–133. [Google Scholar] [CrossRef]
  34. Borchert, H.; Jurgens, B.; Zielasek, V.; Rupprechter, G.; Giorgio, S.; Henry, C.; Baumer, M. Pd Nanoparticles with Highly Defined Structure on MgO as Model Catalysts: An FTIR Study of the Interaction with CO, O2, and H2 under Ambient Conditions. J. Catal. 2007, 247, 145–154. [Google Scholar] [CrossRef]
Figure 1. Scheme of FCCZN catalyst formation during synthesis.
Catalysts 14 00818 g001
Figure 2. (a) The CO2 hydrogenation performance on the FCCZN-x (x = 700 °C/800 °C/900 °C), FCCZN@MG-800. Reaction condition: T = 290 °C, P = 2.5 MPa, H2/CO2 = 3, GHSV = 2500 mL·gcat−1·h−1. (b) Catalysts over 75 h time-on-stream. (c) Hydrocarbon selectivity of FCCZN catalysts. (d) Light olefin selectivity of FCCZN catalysts.
Catalysts 14 00818 g002aCatalysts 14 00818 g002b
Figure 3. XRD patterns of (a) unannealed FCCZN, (b) fresh FCCZN-M and reduced FCCZN-M, (c) and fresh FCCZN-800 and FCCZN@MG-800. (d) N2 adsorption–desorption isotherms and pore size distributions (inset) of MEOs. HRTEM images and grain size of FCCZN-800 (e,f). STEM image (g) and Fe (h), Co (i), Cu (j), Zn (k), and Na (l) elemental distributions in FCCZN-800 examined at nanometer scale using STEM-EDS.
Catalysts 14 00818 g003aCatalysts 14 00818 g003b
Figure 4. (a) XRD pattern of fresh catalysts at different calcination temperatures reduced by hydrogen at 250℃ and 400℃. (b) H2-TPR profiles of fresh FCCZN catalysts. (c) Used catalysts. (d) XPS spectra of Fe 2p for fresh catalysts. (e,f) TEM-images of used FCCZN-800.
Catalysts 14 00818 g004
Figure 5. (a) XPS spectra of O 1s for fresh FCCZN catalysts. (b) O2-TPD profiles of the synthesized FCCZN catalysts. (c) CO2-TPD of the reduced FCCZN catalysts.
Catalysts 14 00818 g005
Figure 6. (a) H2-TPD of the reduced FCCZN catalysts. (b,c) In situ DRIFTS spectra during CO2 hydrogenation over reduced FCCZN catalysts. (d) Reaction mechanism of direct preparation of low-carbon olefins on FCCZN catalysts.
Catalysts 14 00818 g006aCatalysts 14 00818 g006b
Table 1. Comparison of the FTS catalytic performances among the FCCZN catalysts and FCCZN@MG-800.
CatalystCO2 Con (%)Selectivity a (%) O/PSTY (mmol g−1·h−1)
CH4 C 2 = - C 4 = C 2 0 - C 4 0 C5+CO
FCCZN-60023.334.638.810.316.3253.10.0278
FCCZN-70038.629.139.513.517.95.52.20.0455
FCCZN-80039.026.841.315.716.26.92.60.0495
FCCZN@MG-80036.136.937.011.614.45.93.20.0324
Reaction condition: T = 290 °C, P = 2.5 MPa, H2/CO2 = 3, GHSV = 2500 mL·gcat−1·h−1, TOS = 75 h; reduced in 99.9% H2 for 18 h at 400 °C before CO2 hydrogenation. a O/P is the molar ratio of olefin ( C 2 = - C 4 = ) to paraffin ( C 2 0 - C 4 0 ).
Table 2. Structural characteristics and chemical composition of FCCZN-M catalysts and FCCZN@MG-800 with different calcination temperatures.
CatalystFe Loading (wt%) aCo Loading (wt%) aCu Loading (wt%) aZn Loading (wt%) aSSA (m2/g) bAPS (nm) b
FCCZN-60024.9824.3225.1124.5319.617.6
FCCZN-70025.0524.6324.9924.308.614.8
FCCZN-80024.8824.4324.9624.681.833.2
FCCZN@MG-80025.1424.5024.5424.810.650.7
a Measured by ICP; b measured by N2 physical adsorption.
Disclaimer/Publisher’s Note: The statements, opinions and data contained in all publications are solely those of the individual author(s) and contributor(s) and not of MDPI and/or the editor(s). MDPI and/or the editor(s) disclaim responsibility for any injury to people or property resulting from any ideas, methods, instructions or products referred to in the content.

