Article

Size Effect of Cu Particles on Interface Formation in Cu/ZnO Catalysts for Methanol Synthesis

1
School of Physical Science and Technology, ShanghaiTech University, Shanghai 201210, China
2
CAS Key Laboratory of Low-Carbon Conversion Science & Engineering, Chinese Academy of Sciences, Shanghai 201210, China
*
Authors to whom correspondence should be addressed.
These authors contributed equally to this work.
Catalysts 2023, 13(8), 1190; https://doi.org/10.3390/catal13081190
Submission received: 14 June 2023 / Revised: 23 July 2023 / Accepted: 2 August 2023 / Published: 8 August 2023
(This article belongs to the Special Issue Catalytic Transformations of CO2 into High Valuable Products)

Abstract

:
Cu/ZnO/Al2O3 catalysts are extensively utilized in methanol synthesis from CO and CO2, which is a vital industrial process and a promising strategy for mitigating CO2 emissions when renewable green hydrogen is employed. Despite the considerable efforts to study CO2 hydrogenation over Cu/ZnO, understanding the structure of active sites on Cu/ZnO has remained a major challenge. We studied a series of Cu/ZnO catalysts with various Cu particle sizes and found a volcano-like pattern in methanol selectivity with respect to the Cu particle size. TEM, XPS, and TPD measurements demonstrated the migration of ZnOx species onto the Cu particle surface and showed a correlation between the ZnOx-Cu interface and methanol yield. The size of supported Cu particles affects the migration of Zn species onto Cu particle surfaces. Our study has thus explicated the role of the ZnOx-Cu interface in catalyzing CO2 hydrogenation to methanol.

Graphical Abstract

1. Introduction

The transformation of CO2 into value-added chemicals presents a promising approach to achieving a carbon-neutral process. Methanol (CH3OH) serves as an energy storage agent and is frequently employed as a chemical feedstock to produce other chemicals, solvents, and gasoline additives [1,2]. The hydrogenation of CO2 for CH3OH production is considered an effective strategy for CO2 utilization [3], and Cu/ZnO/Al2O3 (CZA) catalysts are widely used in industrial methanol production [4], with Cu/ZnO proposed as catalytically active components. So far, the design of efficient catalysts for CO2 hydrogenation has aimed to find appropriate configurations to improve the dissociative adsorption of CO2 and the selectivity towards methanol. Optimizing the interfacial sites between Cu and ZnO has shown promise in enhancing methanol synthesis [5,6,7].
The structure of active sites in CZA catalysts varies significantly based on the size of the supported metal particles, likely due to interfacial evolution and migration phenomena [8,9]. Regarding the synergistic effects between Cu and ZnO, previous studies on the Cu/ZnO/Al2O3 catalysts have shown clear evidence in HRTEM images for the formation of disordered ZnOx overlayer [10] or metastable “graphite-like” ZnO layers [11] during the reductive activation of catalysts. In addition, Kattel et al. and Chen et al. reported that the hydrogenation of CO2 to methanol on Cu/ZnO catalysts might mainly take place at the interface between ZnO and Cu [5,12]. Meanwhile, CO2 hydrogenation is a reaction sensitive to catalyst structure [13], which is critically influenced by the size of Cu particles and the migration ability of zinc oxide, leading to the formation of active interfacial sites.
Regarding the size effect of Cu particles in methanol synthesis, recent studies have presented controversial results. For instance, Arena et al. reported a volcano-like trend in the metal surface area of Cu-ZnO/ZrO2 catalysts with respect to the Zn/Cu ratio, favoring methanol production with poorly dispersed Cu particles [14]. Conversely, Natesakhawat et al. found that incorporating Ga2O3 and Y2O3 into CuZnZr catalysts increased the specific surface area of Cu, resulting in higher methanol synthesis rates due to the presence of more coordinatively unsaturated atoms in smaller Cu particles [15]. The controversy could be complicated by the influence of supports [4] and additives [16] in catalyzing the methanol synthesis process. Thus, it is necessary to examine the role of differently sized Cu nanoparticles (NPs) in CO2 hydrogenation with simpler Cu/ZnO model catalysts. While the influence of ZnO migration onto Cu particles has been considered, investigating the relationship between ZnO coating capacity and Cu particle size is still warranted.
In this study, we synthesized Cu NPs with varying sizes on ZnO by adjusting the Cu loading using the co-precipitation method. Through a combination of characterization techniques and reaction measurements, we established a correlation between the catalyst structure and its catalytic performance in methanol synthesis. Our results suggested a strong relationship between the production rate of methanol and the interfacial area between Cu and ZnO. This interfacial area was attributed to the migration of zinc species, forming a coating layer on the Cu particle surface during the reduction process. The migration phenomenon was significantly influenced by metal–support interactions (MSIs) and particle size. Our study provides valuable insights into the formation of active sites in methanol synthesis and offers strategies for enhancing Cu/ZnO-based catalysts for methanol production.

2. Results

2.1. Structural Characterization of As-Prepared Cu/ZnO Catalyst

Cu/ZnO catalysts (CZ catalysts) with different Cu mass loadings of 0.5, 2, and 5 wt% were synthesized and named 0.5-CZ, 2-CZ, and 5-CZ, respectively. XRD analysis on the as-prepared 0.5-CZ, 2-CZ, and 5-CZ catalysts (Figure 1a) showed peaks corresponding to the (111) facet of CuO (JCPDS card no. 45-0937) [17], and the (100), (002), and (101) facets of ZnO (JCPDS card no. 36-1451) [18]. The surface chemical state of 0.5-CZ, 2-CZ, and 5-CZ catalysts was also measured using XPS. The Zn 2p3/2 peak at 1021.6 eV suggested the chemical state of Zn species was mainly ZnO [19] (Figure S1a). The O 1s spectra showed the presence of carbonate or hydroxylate species on the catalyst surface after calcination [20] (Figure S1b). As the Cu loading increased, the diffraction peaks of ZnO exhibited a shift towards higher angles, indicating lattice contraction, which could be attributed to the incorporation of Cu into the ZnO lattice. Additionally, the peak width of CuO(111) and ZnO(110) decreased with increasing Cu loading, suggesting the growth of Cu and ZnO crystals and implying that the Cu loading influenced the stability of ZnO. Table 1 presented the average particle size of CuO, calculated from the diffraction signal of CuO(111) using the Scherrer equation; the BET surface area and total pore volume of the calcined samples are also summarized. In agreement with XRD results, the increased Cu loading is accompanied by a decrease in the specific surface area of CZ catalysts. In addition, larger Cu metal particles formed on the surface blocked the ZnO pores according to the pore size data [19].
The metal–support interaction and reducibility of Cu species in the catalysts were investigated using TPR analysis (Figure 1b). Since ZnO is difficult to reduce at below 700 °C [21,22], the observed peaks in the graph are attributed to the reduction of copper species. Peaks in the low-temperature region correspond to the reduction in highly dispersed CuO, and the peaks in the high-temperature region correspond to the reduction in the bulk phase of CuO [23]. The reduction peak temperature decreases as the Cu loading increase. In H2-TPR, the 0.5-CZ catalyst exhibited reduction peaks with the highest peak temperatures, which could be attributed to a stronger interaction between Cu and ZnO at lower Cu loading [24]. Since the size of Cu particles increased with Cu loadings, the larger Cu nanoparticles would show weaker interactions with ZnO, which facilitated the reduction process [25]. Consistent with XRD measurements, Figure 1c shows XPS of Cu 2p, from which the peaks at 962.4 and 933.6 eV are found to correspond to the Cu 2p1/2 and Cu 2p3/2 together with intense satellite peaks at 942.4 and 944.6 eV, these two peaks overlapping, and XPS Cu 2p spectra also showed that Cu species on as-prepared CZ catalysts are mainly in the state of Cu2+, as evidenced by the presence of shake-up satellite peaks [26,27]. Accordingly, SEM images of as-prepared CZ catalysts (Figure S2) also showed particle aggregation, with larger particles formed as the Cu loading increased.

2.2. Structural Characterization of Cu/ZnO Catalyst after H2 Reduction

The absorption edge observed in the Cu K-edge XANES corresponds to the primary 1s → 4p transition. Cu0 and Cu+, both having a d0 configuration, lack a hole in the 3d orbital, while Cu2+ adopts a d9 configuration. Consequently, Cu2+ exhibits a weak pre-edge peak, indicating the allowed 1s → 3d transition and serving as a significant characteristic for divalent copper. Figure 2a showed that the Cu K-edge XANES spectrum of the as-prepared sample exhibited a weak pre-edge peak around 8977.6 eV, similar to that of CuO reference [28] and indicating a divalent oxidation state for the as-prepared catalyst [29,30]. The XANES spectrum of Cu foil exhibits the edge absorption (the first inflexion point) at 8979 eV together with a well-resolved doublet in the post-edge region [31]. In the Cu2O reference compound, a distinct peak at approximately 8981.4 eV is assigned to the 1s → 4pxy transition, followed by another peak at around 8995.7 eV, which arises from the 1s → 4pz transition due to the influence of ligand field effect [32].
In the H2 gas, XANES spectra of the 2-CZ catalyst gave a pre-edge feature at 8977.6 eV [33], suggesting the presence of ionic Cu at below 150 °C (Figure 2a). After H2 reduction at 250 °C, XANES features of the 2-CZ catalyst resemble that of the Cu foil, implying the reduction of Cu2+ into metallic Cu0. LCF analysis in Figure S7 plotted the changes in the relative concentration of different Cu species, illustrating the reduction of CZ catalysts in H2. Note that, the small fraction of ionic Cu species might be due to the limited reduction time in XAS measurements. As shown in Figure 2b, patterns at 2θ of 43.3° and 50.4°, assigned to Cu(111) and Cu(200) phases (JCPDS card no. 04-0836), XRD patterns of CZ catalysts after reduction showed also the emergence of Cu(111) and Cu(200) phases, indicating the reduction of CuO to Cu following H2 treatment.
Since XRD peak intensity is influenced by a number of factors, such as reduced crystallinity and crystalline size effects, we have normalized ZnO(002) peak intensity relative to the strongest peak intensity according to previous reports [34,35]. A change in the peak intensity of ZnO(002) indicated that a strong interaction between the polar ZnO(002) facet and Cu induced significant morphological changes in ZnO during CO2 hydrogenation [36,37,38]. HRTEM images on the Cu/ZnO/Al2O3 catalysts have demonstrated the presence of disordered ZnOx overlayer on Cu nanoparticles after reductive activation [10], which could reduce the relative intensity of ZnO(002) diffraction peaks. Consistently, our HRTEM studies on the reduced Cu/ZnO catalysts showed also the covering of Cu nanoparticles by ZnOx overlayers. We have thus attributed the decrease in the relative intensity of ZnO(002) to the reduction of ZnO(002) and the migration of ZnOx species onto Cu nanoparticles forming overlayers. Among the three catalysts, Figure 2c suggested a most significant reduction in ZnO(002) peak intensity of 2-CZ due to the substantial formation and migration of ZnOx species onto Cu particles after H2 reduction, in agreement with our HRTEM measurements.
HR-TEM was further employed to study the CZ catalysts (Figure 3), which showed the presence of ZnO(002) and Cu(111) phases, with lattice spacings of 0.26 nm and 0.21 nm [39], respectively. Fast Fourier transform (FFT) of the bright-field HR-TEM images showed diffraction spots linked to various crystal planes of ZnO and Cu.
With increased Cu loading, the brightness of diffraction spots corresponding to the Cu(111) and ZnO(002) planes markedly enhanced, indicating the growth of Cu(111) and ZnO(002) accompanying the growth of Cu and ZnO particles. By selecting the specific region of crystal diffraction spots in the FFT images, spatial chemical distributions (in dark-field TEM images) of Cu and ZnO species for CZ catalysts were obtained (see details in Supplementary Materials, Figures S3–S6). Figure 4 showed that reduced 0.5-CZ and 5-CZ catalysts display smaller contact regions between Cu and ZnO than those on the 2-CZ catalyst, suggesting the migration behavior of ZnO layers is dependent on the size of Cu particles during the reduction process (Figure S6).
Quasi-in situ XPS experiments on the CZ catalysts after H2 reduction showed the binding energy (BE) of Cu 2p3/2 peak at 932.5 eV (Figure 5a), indicating the presence of Cu+ or Cu0 species [22,40]. The Zn 2p3/2 peak (Figure S1c) at around 1021.6 eV corresponds to Zn2+ species [19]. The Zn/Cu atomic ratios from XPS measurements increased significantly after H2 reduction compared to as-prepared CZ catalysts. This implies that the coating of Cu particles by ZnO layers increased the surface density of ZnO-Cu interfacial sites. We also estimated the surface density of oxygen vacancies (OV) by fitting the O 1s peak with three components (Oα, Oβ, and Oγ) and calculating the peak intensity ratio of I/(I + I + I) [41]. The three peaks of Oα, Oβ, and Oγ are located at 530.3 eV, 531.6 eV, and 532.3 eV, which could be attributed to lattice oxygen (OL), oxygen defect (OV), and weakly bound species (OC, such as hydroxyl groups or carbonates), respectively (Figure 5b) [20,42,43]. OV was found to increase significantly for all catalysts after H2 reduction, with the 2-CZ catalyst exhibiting a higher concentration (~20.4%) than the 0.5-CZ (~16.5%) and 5-CZ (~17.7%) catalysts.
Furthermore, the atomic ratios of Zn/Cu obtained via XPS measurements increased significantly after H2 reduction compared to as-prepared CZ catalysts (Figure 5c), and the increase in Zn/Cu ratio was generally observed for all three catalysts after reductive activation. Although a number of factors, such as the sintering of Cu nanoparticles, the penetration of Cu particles into the ZnO bulk, and the encapsulation of Cu particles by ZnOx layers could contribute to the changes in the Zn/Cu ratio, we found the encapsulation of Cu particles by ZnOx overlayers most probable, combining XPS, XRD and HRTEM measurements. XRD patterns of the three catalysts after reduction exhibited no significant change in peak intensities of Cu(111) compared to as-prepared catalysts (Figure S8), suggesting that the agglomeration of Cu particles was not significant. The penetration of Cu particles into bulk ZnO was also not obvious since the process would lead to the decomposition of Cu particles and homogeneous distribution of Cu ions within the ZnO bulk, which was not evident from XRD and HRTEM measurements. Rather, the encapsulation of Cu nanoparticles by ZnOx overlayers, as evidenced from HRTEM images, could prevent the agglomeration of Cu particles, consistent with XRD results. Figure 5c showed the evolution of the surface atomic ratio of Zn/Cu, as calculated from the XPS Zn 2p and Cu 2p spectra on the CZ catalysts after H2 reduction. A significant increase was observed in the 2-CZ catalyst, indicating a distinct migration of ZnOx species onto Cu particles and a simultaneous increase in OV. In contrast, the 5-CZ catalyst exhibited a limited increase in the Zn/Cu atomic ratio, implying that ZnOx migration onto Cu particles was hindered by the larger particle size of Cu. The increase in the Zn/Cu atomic ratio in the 0.5-CZ catalyst was also less than that in the 2-CZ catalyst, indicating the migration of ZnOx species is strongly dependent on the Cu particle size.

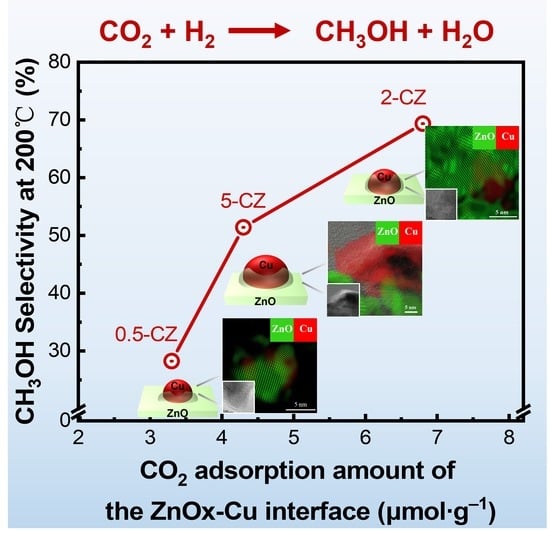
2.3. Catalytic Activity and CO2 Adsorption Ability of Cu-ZnO Catalysts

The steady-state catalytic activities of the CZ catalysts were measured in a fixed-bed reactor, and the 2-CZ catalyst displayed the highest reaction activity across the entire temperature range (Figure 6a and Figure S9). As the temperature increased, the conversion of CO2 gradually rose while the selectivity towards methanol significantly decreased. The conversion of CO2 increased with increasing Cu loading, while the selectivity towards methanol behaved differently and showed a volcano shape with regard to Cu loading. CO production increased with the rise of reaction temperature due to the competitive reaction of the reverse water–gas shift reaction. The differences between the three catalysts used in this study in reaction selectivity could originate from the various distribution of Cu sites and Cu-ZnO interfacial sites, in addition to their differences in structure and geometry. From a mass-specific reaction rate perspective (Figure 6b), the 2-CZ catalyst exhibited the highest specific production rate of CH3OH compared to the other catalysts within the temperature range of 200 °C to 260 °C. Considering the loading of Cu, the 2-CZ catalyst was found more catalytically efficient than other CZ catalysts, which could be attributed to the more significant migration of ZnOx species onto the surface of Cu particles in the 2-CZ catalyst. The formation of ZnOx-Cu interfacial sites greatly enhanced the selectivity towards methanol.
In order to gain further insights into the superior performance of the 2-CZ catalyst, CO2-TPD was employed to investigate the CO2 adsorption properties of the CZ catalysts, as depicted in Figure 6c. The TPD profiles can be deconvoluted into several peaks, indicating the desorption from different types of basic sites. Peaks α, β, and γ correspond to CO2 desorption from weakly basic sites associated with the hydroxyl group, moderately basic sites attributed to Zn–O pairs, and strongly basic sites linked to low-coordinated oxygen atoms [44], respectively. Among these, moderately basic sites have been suggested as active sites for CO2 hydrogenation [45]. Based on the TPD profiles, Table 2 presents the quantitative measurements of basic sites on the CZ catalysts. The CO2 desorption peaks in the range of 350 °C~600 °C shift to lower temperature with increasing Cu loading, probably due to the interface structural changes of the catalysts. The β desorption peak was found to be the largest for the 2-CZ catalyst, and the β2 and β3 peaks could be attributed to CO2 desorption at the interfacial sites and ZnO overlayers. The peak area of β2 and β3 can be, therefore, regarded to quantify the enhancement of CO2 adsorption. From above, a correlation between the migration of ZnOx species onto Cu particles, the adsorption property of CO2, and methanol selectivity could be built.
From above, it is evident that ZnOx species migrated onto the surface of Cu nanoparticles, forming overlayers partially covering the Cu surface during the reduction process. This migration led to the formation of ZnOx-Cu interfaces, which played a crucial role in significantly enhancing the selectivity for methanol production. Notably, the size of supported Cu particles exerted an influence on the migration of ZnOx species onto the surfaces of Cu particles. Moreover, a positive correlation was observed between the selectivity of CH3OH and the sum of β2 and β3 peaks. This correlation implies that the ZnOx-Cu interfaces could serve as active sites in the CO2 hydrogenation to methanol reaction, thereby enhancing the adsorption and hydrogenation of CO2, as depicted in Figure 7.

3. Materials and Methods

3.1. Chemicals and Starting Materials

Zinc nitrate hexahydrate (Zn(NO3)2·6H2O, AR, CAS 10196-18-6), copper(II) nitrate trihydrate (Cu(NO3)2·3H2O, AR, CAS 10031-43-3), deionized water (DI water) and sodium carbonate (Na2CO3, AR, CAS 497-19-8). All the starting materials and chemicals were used without further purification.

3.2. Preparation of Catalysts

Cu/ZnO powder catalysts with Cu loading of 0.5, 2, and 5 wt% (feed ratio) were prepared using a co-precipitation method. A total of 1.0 g of Zn(NO3)2·6H2O (AR) and corresponding Cu(NO3)2·3H2O (AR) were dissolved in 150 mL of deionized water to obtain the precursor solution. At room temperature, saturated Na2CO3 (AR) solution was added to the solution at a rate of 3 mL/min with vigorous stirring to adjust the pH to 9.5. The solution was stirred for another 3 h. The products were collected with vacuum filtering with DI water and washed 3 times. After washing and drying, the catalysts were calcined in air atmosphere at 300 °C for 2 h.
Cu/ZnO catalysts with different Cu loadings of 0.5, 2, and 5 wt% were synthesized according to the method prepared above, named 0.5-CZ, 2-CZ, and 5-CZ, respectively.

3.3. Catalyst Characterization

The N2 adsorption measurements were carried out at 77 K using an Autosorb-iQ-MP-AG instrument (Autosorb-iQ, Quantachrome, Boynton Beach, FL, USA). Then, 100 mg sample was degassed in vacuum (<0.1 Torr) for 8 h at 200 °C prior to analysis. The surface area, average pore size, and total pore volume were determined with the Brunauer–Emmett–Teller (BET) method and Barrett–Joyner–Halenda (BJH) model, respectively.
The X-ray diffraction (XRD, D8 ADVANCE, Bruker, Mannheim, Germany) pattern was operated at 40 kV and 40 mA with a Cu Kα radiation source (λ = 0.15418 nm). XRD patterns were collected with 2θ value from 10° to 90° at a scanning rate of 0.02°/s. Identification of the phases was carried out using the ICDD-JCPDS database. The Scherrer equation was applied to calculate the grain size.
Inductively coupled plasma optical emission spectrometry (ICP-AES, Optima 2000 DV, Perkin Elmer, Waltham, MA, USA) was employed to measure the total metal elements composition of the catalysts. The samples were dissolved using concentrated nitric acid prior to ICP-AES analysis. Each sample was measured at least three times to acquire the average value.
X-ray photoelectron spectroscopy (XPS, ESCALAB 250Xi, Thermo Fisher Scientific, Waltham, MA, USA) analysis was performed with an Al Kα Anode (1486.6 eV) and a spot size of 500 μm. All the spectra were fitted via Casa XPS Software using a Gaussian–Lorentzian spectral line shape and Shirley-type background. The surface molar ratios of catalysts were quantified by O 1s, C 1s, Cu 2p3/2, and Zn 2p3/2 peak area with inelastic mean free path (IMFP). For XPS measurements, the samples were sealed and transferred with a pure N2-protected chamber to avoid surface chemical state changes in the air after the reaction. Raw XPS data were used with no preliminary smoothing. Gaussian–Lorentzian product functions were used to simulate the line shapes of the fitting components. Atomic ratios were computed from peak intensity ratios normalized with atomic sensitivity factors [46].
High-resolution TEM (HRTEM, JEOL-2100Plus, JEOL, Tokyo, Japan) images were recorded on a JEOL-2100Plus operated at an accelerating voltage of 200 kV. Cu and ZnO species in HRTEM images were distinguished using lattice spacing analysis. By performing FFT transformation on HRTEM images and applying Fourier filters on the lattice, we could locate the filtered lattice fringe with their corresponding locations in HRTEM images after inversion. As such, the distribution of Cu and ZnO species could be identified.
SEM images were recorded using a JSM-IT500 HR/LA (JEOL, Tokyo, Japan) operated at an accelerating voltage of 10 kV.
The reduction evolution profiles of catalysts were conducted on a Quantachrome Chemstar TPx Instrument (Quantachrome, Boynton Beach, FL, USA) equipped with a thermal conductivity detector (TCD) to detect H2 consumption. Then, 100 mg of catalysts were placed in a U-type quartz tube and were heated (5 °C/min) from room temperature to 800 °C in 10% H2/Ar (30 mL/min). Fresh samples were pretreated in flowing Ar (30 mL/min) at 300 °C for 1 h to remove absorbed impurities prior to tests.
The temperature-programmed CO2 desorption (CO2-TPD) experiment was also conducted on a Quanta Chrome Chemstar TPx Instrument. Then, 150 mg of sample was pretreated at 300 °C for 2 h in a flow of 10% H2/Ar (20 mL/min). After cooling down to room temperature and saturating CO2 adsorption in flowing 5% CO2/He (20 mL/min) for 1 h, the sample was purged in pure He for 30 min and raised to 800 °C. CO2 desorption was monitored using a TCD detector.
The in situ energy dispersive X-ray absorption (In situ XAS) spectroscopy measurements on catalysts were performed on the BL-05U Beamline of Shanghai Synchrotron Radiation Facility (SSRF), operated at 3.5 GeV with a constant current of 220 mA. The spectra were recorded in a transmission mode with a curved crystal-based Si (111) Bragg polychromator with a XIMEA camera. The energy resolution is 0.14 eV. Cu K-edge (8979 eV) X-ray absorption near-edge structure (XANES) spectra for samples 2-CZ and 5-CZ were collected by heating the samples from room temperature to 250 °C in pure H2. The energy was calibrated using measuring X-ray absorption spectrum of Cu metal foil and by assigning the first inflection point in the rising portion of the absorption spectra as 8979 eV. The obtained data were analyzed using IFEFFIT suite of software programs [47].

3.4. Catalyst Characterization

Catalytic activity tests were conducted using a fixed-bed reactor with a quartz tube (inner diameter: 8 mm). Then, 500 mg sample was pretreated in a H2 flow (1 bar, 30 mL/min) at 250 °C for 2 h and subsequently cooled to ambient temperature under N2 flow (30 mL/min). The reaction gas was a mixture of 24% CO2, 72% H2, and 4% N2 as an internal standard. The reaction was carried out at 200/220/240/260 °C, keeping thermal stability for 3 h in each temperature phase to achieve steady-state reactivity. During the catalytic evaluation process, when reaching the desired temperatures, data were collected at least four times, and the average data were calculated. Product analysis was performed using an online gas chromatograph (Agilent GC-8890) outfitted with a thermal conductivity detector (TCD) and a flame ionization detector (FID). The CO2 conversion (denoted as XCO2) was calculated according to an internal standard method (4% N2 as an internal standard), assuming that the amount of N2 remained constant in the reaction process. The equation is as follows:
X C O 2 % = A i n C O 2   A i n N 2   A o u t C O 2   A o u t N 2   A i n C O 2   A i n N 2   × 100 = 1 A i n N 2 A o u t C O 2 A i n C O 2 A o u t N 2 × 100
S i % = f i A o u t i f i A o u t i × 100
where A represents the chromatographic peak area of the corresponding component, f is the corresponding molar correction factor of the component, and i represents products such as CH3OH, CO, and CH4.
The unit mass formation rate of CH3OH and CO Rw (μmol·gcat−1·s−1) is calculated as follows:
R w   C O   o r   C H 3 O H = X C O 2 × F C O 2 × S C O   o r   C H 3 O H m
X C O 2 is the conversion rate of CO2 (%), F C O 2 is the molar flow rate of CO2 (mol·s−1), S C O   o r   C H 3 O H is the selectivity of CO or CH3OH (%), and m is the catalyst weight (g).

4. Conclusions

In summary, we have utilized the coprecipitation method to prepare CZ catalysts with varying amounts of Cu. By inducing ZnOx migration onto Cu particles via H2 reduction treatment, the CZ catalysts showed a significant increase in ZnOx-Cu interfacial sites. XRD, TEM, and TPD measurements confirmed the dynamic evolution of ZnOx migration onto Cu particles, which were found dependent on Cu particle sizes. Our results showed a volcano-like relationship between Cu particle size and methanol selectivity, highlighting the significant role played by the Cu/ZnO interface in the CO2 hydrogenation-to-methanol reaction. Our study has thus offered valuable insights into understanding the fundamental size effect in catalysts.

Supplementary Materials

The following supporting information can be downloaded at: https://www.mdpi.com/article/10.3390/catal13081190/s1, Figure S1: XPS spectra of (a) Zn 2p and (b) O 1s of the calcined Cu/ZnO catalysts. (c) XPS spectra of Zn 2p for reduced catalysts.; Figure S2: SEM images of calcined (a) 0.5-CZ, (b) 2-CZ, and (c) 5-CZ catalysts.; Figure S3: Extracted lattice features of HR-TEM Figure 4a. (a) Corresponding FFT patterns. (b,c) Fourier filtered lattice features of (b) ZnO species and (c) Cu species. (d) lattice features stained (ZnO-green, Cu-red).; Figure S4: Extracted lattice features of HR-TEM Figure 4b. (a) Corresponding FFT patterns. (b,c) Fourier filtered lattice features of (b) ZnO species and (c) Cu species. (d) lattice features stained (ZnO-green, Cu-red).; Figure S5: Extracted lattice features of HR-TEM Figure 4c. (a) Corresponding FFT patterns. (b-c) Fourier filtered lattice features of (b) ZnO species and (c) Cu species. (d) lattice features stained (ZnO-green, Cu-red).; Figure S6: HR-TEM images for reduced Cu/ZnO catalysts (a) 0.5-CZ, (b) 2-CZ, (c) 5-CZ. (a1–c1) Corresponding FFT patterns and (a2–c2) Fourier-filtered Cu, ZnO lattice features stained (ZnO-green, Cu-red).; Figure S7: Comparison of the LCF (Linear Combination Fitting) results at Cu K-edge over the catalyst with 2 wt% Cu loading.; Figure S8: (a) XRD patterns of calcined catalysts with different Cu-loadings. (b) XRD patterns of reduced catalysts with different Cu-loadings. Each value was the standard deviation determined on the basis of at least three individual tests obtained by JADE.; Figure S9: CO2 conversion (XCO2) of Cu/ZnO catalysts. Error bars for the activity represent the standard deviation from at least three parallel measurements.; Table S1: Carbon balance of the reaction. Catalyst 50 mg, H2/CO2 = 3, GHSV = 12,000 mL gcat−1 h−1, 1 MPa.

Author Contributions

Conceptualization, L.Z. (Lirong Zhao), L.Z. (Lunjia Zhang), Z.W. and F.Y.; methodology, F.Y. and Z.W.; software, C.H. and Z.W.; Resources, H.W. and Z.W.; validation, L.Z. (Lirong Zhao) and L.Z. (Lunjia Zhang); formal analysis, L.Z. (Lirong Zhao) and L.Z. (Lunjia Zhang); investigation, L.Z. (Lirong Zhao), L.Z. (Lunjia Zhang) and K.C.; data curation, L.Z. (Lirong Zhao) and L.Z. (Lunjia Zhang); writing—original draft preparation, L.Z. (Lirong Zhao) and L.Z. (Lunjia Zhang); writing—review and editing, all authors; visualization, L.Z. (Lirong Zhao) and L.Z. (Lunjia Zhang); supervision, Z.W., F.Y. and H.W.; project administration, F.Y.; funding acquisition, F.Y. All authors have read and agreed to the published version of the manuscript.

Funding

This work was financially supported by the National Natural Science Foundation of China (21972144, 92045303, 91945302, M-0384, 21991152) and the Science and Technology Commission of Shanghai Municipality (20JC1416700). The authors thank the support from Analytical Instrumentation Center, under contract number SPST-AIC10112914, at ShanghaiTech University.

Data Availability Statement

Data are contained within the article or Supplementary Materials.

Conflicts of Interest

The authors declare no conflict of interest.

References

  1. Chai, R.; Liu, Y.; Wang, J.; Liu, Q.; Rui, Z. CO2 utilization and sequestration in Reservoir: Effects and mechanisms of CO2 electrochemical reduction. Appl. Energy 2022, 323, 119584. [Google Scholar] [CrossRef]
  2. Lang, X.D.; He, L.N. Integration of CO2 reduction with subsequent carbonylation: Towards extending chemical utilization of CO2. ChemSusChem 2018, 11, 2062–2067. [Google Scholar] [CrossRef] [PubMed]
  3. Jeong, K.; Hong, T.; Kim, J. Development of a CO2 emission benchmark for achieving the national CO2 emission reduction target by 2030. Energy Build. 2018, 158, 86–94. [Google Scholar] [CrossRef]
  4. Ertl, G.; Knözinger, H.; Weitkamp, J. (Eds.) Handbook of Heterogeneous Catalysis; VCH: Weinheim, Germany, 1997; Volume 2, pp. 427–440. [Google Scholar]
  5. Kattel, S.; Ramírez, P.J.; Chen, J.G.; Rodriguez, J.A.; Liu, P. Active sites for CO2 hydrogenation to methanol on Cu/ZnO catalysts. Science 2017, 355, 1296–1299. [Google Scholar] [CrossRef] [Green Version]
  6. Sun, Y.; Chen, L.; Bao, Y.; Zhang, Y.; Wang, J.; Fu, M.; Wu, J.; Ye, D. The applications of morphology controlled ZnO in catalysis. Catalysts 2016, 6, 188. [Google Scholar] [CrossRef] [Green Version]
  7. Li, M.M.-J.; Zeng, Z.; Liao, F.; Hong, X.; Tsang, S.C.E. Enhanced CO2 hydrogenation to methanol over CuZn nanoalloy in Ga modified Cu/ZnO catalysts. J. Catal. 2016, 343, 157–167. [Google Scholar] [CrossRef]
  8. Wang, H.; Gu, X.-K.; Zheng, X.; Pan, H.; Zhu, J.; Chen, S.; Cao, L.; Li, W.-X.; Lu, J. Disentangling the size-dependent geometric and electronic effects of palladium nanocatalysts beyond selectivity. Sci. Adv. 2019, 5, eaat6413. [Google Scholar] [CrossRef] [Green Version]
  9. Kuld, S.; Thorhauge, M.; Falsig, H.; Elkjær, C.F.; Helveg, S.; Chorkendorff, I.; Sehested, J. Quantifying the promotion of Cu catalysts by ZnO for methanol synthesis. Science 2016, 352, 969–974. [Google Scholar] [CrossRef] [Green Version]
  10. Behrens, M.; Studt, F.; Kasatkin, I.; Kühl, S.; Hävecker, M.; Abild-Pedersen, F.; Zander, S.; Girgsdies, F.; Kurr, P.; Kniep, B.-L. The active site of methanol synthesis over Cu/ZnO/Al2O3 industrial catalysts. Science 2012, 336, 893–897. [Google Scholar] [CrossRef]
  11. Lunkenbein, T.; Schumann, J.; Behrens, M.; Schlögl, R.; Willinger, M.G. Formation of a ZnO overlayer in industrial Cu/ZnO/Al2O3 catalysts induced by strong metal–support interactions. Angew. Chem. 2015, 127, 4627–4631. [Google Scholar] [CrossRef]
  12. Chen, H.; Cui, H.; Lv, Y.; Liu, P.; Hao, F.; Xiong, W.; Luo, H.a. CO2 hydrogenation to methanol over Cu/ZnO/ZrO2 catalysts: Effects of ZnO morphology and oxygen vacancy. Fuel 2022, 314, 123035. [Google Scholar] [CrossRef]
  13. Van Den Berg, R.; Prieto, G.; Korpershoek, G.; Van Der Wal, L.I.; Van Bunningen, A.J.; Lægsgaard-Jørgensen, S.; De Jongh, P.E.; De Jong, K.P. Structure sensitivity of Cu and CuZn catalysts relevant to industrial methanol synthesis. Nat. Commun. 2016, 7, 13057. [Google Scholar] [CrossRef] [PubMed]
  14. Arena, F.; Barbera, K.; Italiano, G.; Bonura, G.; Spadaro, L.; Frusteri, F. Synthesis, characterization and activity pattern of Cu–ZnO/ZrO2 catalysts in the hydrogenation of carbon dioxide to methanol. J. Catal. 2007, 249, 185–194. [Google Scholar] [CrossRef]
  15. Natesakhawat, S.; Lekse, J.W.; Baltrus, J.P.; Ohodnicki Jr, P.R.; Howard, B.H.; Deng, X.; Matranga, C. Active sites and structure–activity relationships of copper-based catalysts for carbon dioxide hydrogenation to methanol. ACS Catal. 2012, 2, 1667–1676. [Google Scholar] [CrossRef]
  16. Gao, P.; Li, F.; Zhao, N.; Xiao, F.; Wei, W.; Zhong, L.; Sun, Y. Influence of modifier (Mn, La, Ce, Zr and Y) on the performance of Cu/Zn/Al catalysts via hydrotalcite-like precursors for CO2 hydrogenation to methanol. Appl. Catal. A Gen. 2013, 468, 442–452. [Google Scholar] [CrossRef]
  17. Pawar, S.M.; Kim, J.; Inamdar, A.I.; Woo, H.; Jo, Y.; Pawar, B.S.; Cho, S.; Kim, H.; Im, H. Multi-functional reactively-sputtered copper oxide electrodes for supercapacitor and electro-catalyst in direct methanol fuel cell applications. Sci. Rep. 2016, 6, 21310. [Google Scholar] [CrossRef] [Green Version]
  18. Raoufi, D.; Raoufi, T. The effect of heat treatment on the physical properties of sol–gel derived ZnO thin films. Appl. Surf. Sci. 2009, 255, 5812–5817. [Google Scholar] [CrossRef]
  19. Karelovic, A.; Ruiz, P. The role of copper particle size in low pressure methanol synthesis via CO2 hydrogenation over Cu/ZnO catalysts. Catal. Sci. Technol. 2015, 5, 869–881. [Google Scholar] [CrossRef]
  20. Xie, B.; Kumar, P.; Tan, T.H.; Esmailpour, A.A.; Aguey-Zinsou, K.-F.; Scott, J.; Amal, R. Doping-mediated metal–support interaction promotion toward light-assisted methanol production over Cu/ZnO/Al2O3. ACS Catal. 2021, 11, 5818–5828. [Google Scholar] [CrossRef]
  21. Liang, M.; Kang, W.; Xie, K. Comparison of reduction behavior of Fe2O3, ZnO and ZnFe2O4 by TPR technique. J. Nat. Gas Chem. 2009, 18, 110–113. [Google Scholar] [CrossRef]
  22. Melian-Cabrera, I.; Granados, M.L.; Fierro, J. Pd-modified Cu–Zn catalysts for methanol synthesis from CO2/H2 mixtures: Catalytic structures and performance. J. Catal. 2002, 210, 285–294. [Google Scholar] [CrossRef]
  23. Guo, H.; Li, S.; Peng, F.; Zhang, H.; Xiong, L.; Huang, C.; Wang, C.; Chen, X. Roles investigation of promoters in K/Cu–Zn catalyst and higher alcohols synthesis from CO2 hydrogenation over a novel two-stage bed catalyst combination system. Catal. Lett. 2015, 145, 620–630. [Google Scholar] [CrossRef]
  24. Xiong, K.; Zhou, G.; Zhang, H.; Shen, Y.; Zhang, X.; Zhang, Y.; Li, J. Bridging Mo2C–C and highly dispersed copper by incorporating N-functional groups to greatly enhance the catalytic activity and durability for carbon dioxide hydrogenation. J. Mater. Chem. A 2018, 6, 15510–15516. [Google Scholar] [CrossRef]
  25. da Silva, R.J.; Pimentel, A.F.; Monteiro, R.S.; Mota, C.J. Synthesis of methanol and dimethyl ether from the CO2 hydrogenation over Cu· ZnO supported on Al2O3 and Nb2O5. J. CO2 Util. 2016, 15, 83–88. [Google Scholar] [CrossRef]
  26. Yin, A.; Guo, X.; Dai, W.-L.; Fan, K. The nature of active copper species in Cu-HMS catalyst for hydrogenation of dimethyl oxalate to ethylene glycol: New insights on the synergetic effect between Cu0 and Cu+. J. Phys. Chem. C 2009, 113, 11003–11013. [Google Scholar] [CrossRef]
  27. Poulston, S.; Parlett, P.; Stone, P.; Bowker, M. Surface oxidation and reduction of CuO and Cu2O studied using XPS and XAES. Surf. Interface Anal. Int. J. Devoted Dev. Appl. Tech. Anal. Surf. Interfaces Thin Film. 1996, 24, 811–820. [Google Scholar] [CrossRef]
  28. Rudolph, J.; Jacob, C.R. Revisiting the dependence of Cu K-edge X-ray absorption spectra on oxidation state and coordination environment. Inorg. Chem. 2018, 57, 10591–10607. [Google Scholar] [CrossRef] [Green Version]
  29. Kau, L.S.; Spira-Solomon, D.J.; Penner-Hahn, J.E.; Hodgson, K.O.; Solomon, E.I. X-ray absorption edge determination of the oxidation state and coordination number of copper. Application to the type 3 site in Rhus vernicifera laccase and its reaction with oxygen. J. Am. Chem. Soc. 1987, 109, 6433–6442. [Google Scholar] [CrossRef]
  30. Moen, A.; Nicholson, D.G.; Rønning, M. Studies on the pre-edge region of the X-ray absorption spectra of copper (I) oxide and the diamminecopper (I) ion. J. Chem. Soc. Faraday Trans. 1995, 91, 3189–3194. [Google Scholar] [CrossRef]
  31. Meitzner, G.; Iglesia, E. New insights into methanol synthesis catalysts from X-ray absorption spectroscopy. Catal. Today 1999, 53, 433–441. [Google Scholar] [CrossRef] [Green Version]
  32. Yilmaz, M.; Handoko, A.D.; Parkin, I.P.; Sankar, G. Probing the electronic and geometric structures of photoactive electrodeposited Cu2O films by X-ray absorption spectroscopy. J. Catal. 2020, 389, 483–491. [Google Scholar] [CrossRef]
  33. Gaur, A.; Klysubun, W.; Nair, N.N.; Shrivastava, B.; Prasad, J.; Srivastava, K. XAFS study of copper (II) complexes with square planar and square pyramidal coordination geometries. J. Mol. Struct. 2016, 1118, 212–218. [Google Scholar] [CrossRef]
  34. Fujita, S.-I.; Moribe, S.; Kanamori, Y.; Kakudate, M.; Takezawa, N. Preparation of a coprecipitated Cu/ZnO catalyst for the methanol synthesis from CO2—Effects of the calcination and reduction conditions on the catalytic performance. Appl. Catal. A Gen. 2001, 207, 121–128. [Google Scholar] [CrossRef]
  35. Chen, F.; Zhang, P.; Xiao, L.; Liang, J.; Zhang, B.; Zhao, H.; Kosol, R.; Ma, Q.; Chen, J.; Peng, X. Structure–Performance Correlations over Cu/ZnO Interface for Low-Temperature Methanol Synthesis from Syngas Containing CO2. ACS Appl. Mater. Interfaces 2021, 13, 8191–8205. [Google Scholar] [CrossRef]
  36. Liao, F.; Huang, Y.; Ge, J.; Zheng, W.; Tedsree, K.; Collier, P.; Hong, X.; Tsang, S.C. Morphology-dependent interactions of ZnO with Cu nanoparticles at the materials’ interface in selective hydrogenation of CO2 to CH3OH. Angew. Chem. 2011, 123, 2210–2213. [Google Scholar] [CrossRef]
  37. Lei, H.; Nie, R.; Wu, G.; Hou, Z. Hydrogenation of CO2 to CH3OH over Cu/ZnO catalysts with different ZnO morphology. Fuel 2015, 154, 161–166. [Google Scholar] [CrossRef]
  38. Wang, H.; Lu, Z.; Lu, D.; Li, C.; Fang, P.; Wang, X. The synthesis of Cu/plate-like ZnO nanostructures and their self-assembly mechanism. Solid State Sci. 2016, 55, 69–76. [Google Scholar] [CrossRef]
  39. Yurieva, T.M.; Plyasova, L.M.; Zaikovskii, V.I.; Minyukova, T.P.; Bliek, A.; van den Heuvel, J.C.; Davydova, L.P.; Molina, I.Y.; Demeshkina, M.P.; Khassin, A.A. In situ XRD and HRTEM studies on the evolution of the Cu/ZnO methanol synthesis catalyst during its reduction and re-oxidation. Phys. Chem. Chem. Phys. 2004, 6, 4522–4526. [Google Scholar] [CrossRef]
  40. Biesinger, M.C.; Lau, L.W.; Gerson, A.R.; Smart, R.S.C. Resolving surface chemical states in XPS analysis of first row transition metals, oxides and hydroxides: Sc, Ti, V, Cu and Zn. Appl. Surf. Sci. 2010, 257, 887–898. [Google Scholar] [CrossRef]
  41. Jiang, F.; Wang, S.; Liu, B.; Liu, J.; Wang, L.; Xiao, Y.; Xu, Y.; Liu, X. Insights into the influence of CeO2 crystal facet on CO2 hydrogenation to methanol over Pd/CeO2 catalysts. ACS Catal. 2020, 10, 11493–11509. [Google Scholar] [CrossRef]
  42. Abliz, A.; Huang, C.-W.; Wang, J.; Xu, L.; Liao, L.; Xiao, X.; Wu, W.-W.; Fan, Z.; Jiang, C.; Li, J. Rational design of ZnO: H/ZnO bilayer structure for high-performance thin-film transistors. ACS Appl. Mater. Interfaces 2016, 8, 7862–7868. [Google Scholar] [CrossRef]
  43. Pal, S.; Gogurla, N.; Das, A.; Singha, S.; Kumar, P.; Kanjilal, D.; Singha, A.; Chattopadhyay, S.; Jana, D.; Sarkar, A. Clustered vacancies in ZnO: Chemical aspects and consequences on physical properties. J. Phys. D Appl. Phys. 2018, 51, 105107. [Google Scholar] [CrossRef] [Green Version]
  44. Dong, X.; Li, F.; Zhao, N.; Tan, Y.; Wang, J.; Xiao, F. A study on the order of calcination and liquid reduction over Cu-based catalyst for synthesis of methanol from CO2/H2. Catal. Lett. 2017, 147, 1235–1242. [Google Scholar] [CrossRef]
  45. Witoon, T.; Kachaban, N.; Donphai, W.; Kidkhunthod, P.; Faungnawakij, K.; Chareonpanich, M.; Limtrakul, J. Tuning of catalytic CO2 hydrogenation by changing composition of CuO–ZnO–ZrO2 catalysts. Energy Convers. Manag. 2016, 118, 21–31. [Google Scholar] [CrossRef]
  46. Wagner, C.D.; Davis, L.E.; Zeller, M.V.; Taylor, J.A.; Raymond, R.H.; Gale, L.H. Empirical atomic sensitivity factors for quantitative analysis by electron spectroscopy for chemical analysis. Surf. Interface Anal 1981, 3, 211–225. [Google Scholar] [CrossRef]
  47. Newville, M. IFEFFIT: Interactive XAFS analysis and FEFF fitting. J. Synchrotron Radiat. 2001, 8, 322–324. [Google Scholar] [CrossRef] [PubMed]
Figure 1. (a) XRD patterns of calcinated catalysts. (b) H2-TPR profiles of calcinated catalysts. (c) XPS spectra of Cu 2p for calcinated Cu/ZnO catalysts.
Catalysts 13 01190 g001
Figure 2. (a) In situ XANES spectra at Cu K-edge of 2-CZ catalyst obtained during 1 bar H2 reduction process. (b) XRD patterns of reduced catalysts with different Cu-loadings. (c) The ratio of the peak intensity of ZnO(002) (2θ = 34.4°) relative to ZnO(100) (2θ = 31.7°).
Catalysts 13 01190 g002
Figure 3. TEM images of reduced (a) 0.5-CZ, (b) 2-CZ, and (c) 5-CZ catalysts. HR-TEM images of reduced (d) 0.5-CZ, (e) 2-CZ, and (f) 5-CZ catalysts.
Catalysts 13 01190 g003
Figure 4. HR-TEM images for reduced Cu/ZnO catalysts (a) 0.5-CZ, (b) 2-CZ, (c) 5-CZ. (a1c1) Corresponding FFT patterns and (a2c2) Fourier-filtered Cu, ZnO lattice features stained (ZnO-green, Cu-red).
Catalysts 13 01190 g004
Figure 5. Quasi-in situ XPS spectra of (a) Cu 2p and (b) O 1s for reduced catalysts; (c) surface Zn/Cu atomic ratio obtained using XPS and increasing atomic ratio of Zn/Cu after reduction as a function of Cu loading.
Catalysts 13 01190 g005
Figure 6. Catalytic activity of Cu-ZnO catalysts. (a) CO2 conversion (XCO2) and CH3OH selectivity (SCH3OH). Each error bar was the standard deviation determined on the basis of at least three individual tests. (b) Methanol production rate (RCH3OH) and CO production rate (RCO) per grams of catalysts. (c) CO2-TPD profiles of Cu/ZnO catalysts. (d) Methanol production rate (RCH3OH) per grams of catalysts (reaction temperature: 240 °C) as a function of increasing ratio of CO2-TPD identified interface sites (β2 + β3). Catalytic activity was tested with 50 mg of catalysts with a gas mixture of H2/CO2 = 3 at 1 MPa, GHSV = 12,000 mL·g·cat−1·h−1.
Catalysts 13 01190 g006aCatalysts 13 01190 g006b
Figure 7. Illustration of different interface structures of reduced CZ catalysts.
Catalysts 13 01190 g007
Table 1. Structural properties of fresh catalysts.
SamplePore Volume a/(cm3·g−1)SBET b/(m2·g−1)Pore Size/(nm)dCuO c/(nm)dZnO d/(nm)
0.5-CZ0.28242.625.88.411.3
2-CZ0.22633.617.315.017.7
5-CZ0.12725.48.720.120.8
a Total pore volume and pore size calculated using Barrett–Joyner–Halenda (BJH) model; b Surface area using Brunauer–Emmett–Teller (BET) method; c,d CuO and ZnO particle size using the Scherrer equation calculated from the X-ray diffraction of CuO (111) (2θ = 38.7°) and ZnO (110) (2θ = 56.6°).
Table 2. The amount and distribution of basic sites of Cu/ZnO catalysts.
SampleTotal Amount of Basic Sites/(μmol∙g–1)Peak Position/(°C)
βγβ1β2β3
0.5-CZ4.76.4289420516
2-CZ8.73.8279413515
5-CZ8.14.9286376498
Disclaimer/Publisher’s Note: The statements, opinions and data contained in all publications are solely those of the individual author(s) and contributor(s) and not of MDPI and/or the editor(s). MDPI and/or the editor(s) disclaim responsibility for any injury to people or property resulting from any ideas, methods, instructions or products referred to in the content.

