Abstract
Extensive research has been conducted on platinum nanoparticles or clusters supported on zeolite for various catalytic applications, primarily due to the well-defined structure contained within the pore. The preparation and characterization of these particles have been thoroughly examined using advanced techniques such as X-ray absorption fine structures (XAFSs), both in situ and ex situ. In this study, we employed the Wavelet method to analyze the structure of platinum nanoparticles encapsulated within the supercage of a Y zeolite, where XAFS data were collected over a temperature range of 100 K to 423 K, both with and without hydrogen. The adsorption of hydrogen caused a relaxation in the structure of the platinum nanoparticles, thus leading to a decrease in the Pt–Pt distance and resulting in a lower Debye–Waller factor compared to bare nanoparticles. This structural change induced by hydrogen chemisorption aligns with the findings of the density functional theory (DFT) calculations for Pt13 nanoparticles located in the supercage. The relaxation of the structure results in charge redistribution, thereby ultimately generating atomic hydrogen with a partial negative charge, which is crucial for catalytic processes.
1. Introduction
Zeolite has been widely studied as a substrate for preparing metal nanoparticles or single-atom catalysts to model catalytic reactions under controlled conditions [1,2,3,4,5,6]. The use of Y zeolite supported metal catalysts has garnered significant attention over the past thirty years. Y zeolite, with Na as a counter cation, provides a well-defined pore size of approximately 1.3 nm, which is suitable for catalysis or ship-in-bottle synthesis, as illustrated in Figure 1 [7]. Y zeolite contains a supercage with a diameter of 1.3 nm and a sodalite cage, respectively, thereby facilitating the diffusion of guest molecules such as hydrocarbons. The framework also consists of silica tetrahedra connected to alumina tetrahedra, thereby resulting in a Si/Al ratio of 2 to 3 [8,9,10]. A counter cation such as Na is used to compensate for the framework charge, thus making it exchangeable to accommodate catalytically active metal precursors. Subsequently, the counter cation transforms into the metal catalyst within the supercage, as the portal of the sodalite cage consists of a six-membered ring, which is difficult to penetrate for large molecules or cations with ligands.
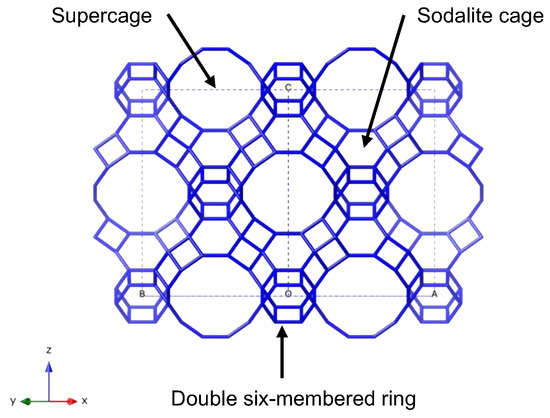
Figure 1.
The structure of Y zeolite exhibits a supercage, a sodalite cage, and the interconnecting double six-membered ring. For illustrative purposes, the oxygen atom has been omitted, and the connectivity of silicon (Si) is depicted.
Platinum, as a noble metal catalyst for a wide range of catalytic reactions, has been extensively studied since the early 1950s [11,12,13,14]. In the case of Y zeolite, platinum nanoparticles or clusters have been synthesized and characterized using various spectroscopic methods to gather information about their atomic structures. It is widely recognized that the size of the Pt nanoparticles ranges from 13 to 55 Pt atoms per particle, as estimated through techniques such as X-ray absorption fine structure (XAFS) analysis, chemisorption, and high-resolution TEM [15,16]. The coordination of the Pt nanoparticles is typically around 5–6, which is consistent with the estimated size [16].
The Pt nanoparticle within Y zeolite exhibits distinct physicochemical properties, including structure relaxation induced by adsorbates, which can be observed through XAFS analysis under controlled atmospheres. It has been demonstrated that hydrogen adsorption on the Pt nanoparticle within the supercage of Y zeolite results in an increase in the Pt–Pt bond distance and an increase in the Debye–Waller factor. These changes can be attributed to the relaxation of the structure caused by the chemisorption of the adsorbate [17,18,19,20,21,22].
In this study, we employed the wavelet method to analyze XAFS data, thus aiming to elucidate the occurrence of structural relaxation induced by the adsorbate upon hydrogen chemisorption. The wavelet method involves utilizing wavelet transforms, as well as mathematical functions that are capable of decomposing signals into different frequency components [23,24,25]. By applying wavelet transforms to the XAFS data, the oscillatory signals representing interactions between the absorbing atom and its neighboring atoms can be extracted and analyzed. This approach enables the extraction of XAFS data pertaining to the local atomic structure, thereby facilitating the determination of bond distances, coordination numbers, and thermal disorder within complex XAFS spectra characterized by overlapping signals and noise. Compared to conventional Fourier transform methods, the wavelet method offers enhanced effectiveness in resolving and accurately determining the structural properties of metal particles.
To complement the analysis of the XAFS data, density functional theory calculations [26,27,28] were conducted to investigate the impact of hydrogen adsorption on the metal nanoparticle within the supercage of Y zeolite. A model structure of Y zeolite incorporating a Pt nanoparticle was constructed to illustrate the structural changes induced by hydrogen chemisorption. Two particle sizes were considered for comparison: one with 13 Pt atoms and another with 55 Pt atoms. This choice allowed us to examine the influence of first and second shell coordination on the resulting particle sizes, respectively.
2. Result and Discussion
Figure 2 presents the XAFS spectrum and radial distribution function of the Pt nanoparticle enclosed within the supercage of Y zeolite, with and without hydrogen, thus highlighting the significant structural transformation induced by hydrogen chemisorption. The atomic structure of the Pt nanoparticle remained intact, and the coordination number remained unchanged before and after hydrogen chemisorption. However, the bond distance and the Debye–Waller factor experienced significant changes due to the interactions between the metal and hydrogen, as well as between the metal and the zeolite framework [21,22]. These changes were closely related to the modifications in the electronic structure [18].

Figure 2.
(Left) The k3χ(k) spectrum of the Pt nanoparticle confined within the supercage, both in the presence and absence of hydrogen. (Right) The corresponding radial distribution function is shown after Fourier transformation.
The wavelet transform (WT), which is similar to the Fourier transform, has been applied to extract the XAFS signal in terms of both the k and r space simultaneously, as shown in Figure 3. The Pt–Pt coordination at 0.27 nm is clearly depicted in the WT contour, which is consistent with the conventional XAFS data analysis in k or r space independently. It is noteworthy that the Pt–Pt contribution spread across all k ranges, thereby indicating different types of interactions, which can be interpreted as metal–support interactions. The WT contour was obtained using the Morlet method with η = 5 and σ = 1, thus optimizing the resolution [25]. For data analysis, wavelet data with Feff8 [29] as a reference were utilized to produce more reliable results, as shown in Table 1. Notably, the reliability factor was drastically reduced to below 1% when compared to traditional k- or r-space fitting.
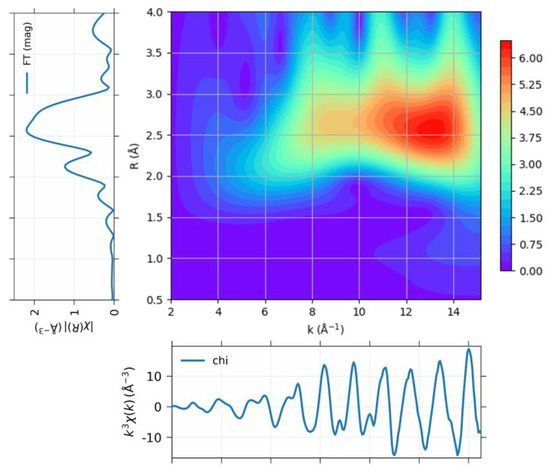
Figure 3.
The projection of the wavelet of the XAFS data for Pt nanoparticle obtained at 100 K, to (Bottom) k space and (Top left) r space. The (Top right) panel shows the wavelet transform using Morlet method with η = 5 and σ = 1 for optimum resolution [23,25].

Table 1.
The structural parameter for the sample obtained through the XAFS data analysis using wavelet method.
The structural parameters for the Pt nanoparticle with hydrogen were obtained through curve fitting of the wavelet of the XAFS data, as presented in Figure 4. To determine the many-body reduction factor, a Pt foil was utilized, while the coordination number of the Pt–Pt was fixed at 12. The bond distance of Pt–Pt decreased with increasing temperature, while the coordination number of the Pt–Pt bond was constrained to the value obtained at 100 K using the obtained many-body reduction factor of 0.9. The chemisorption of the hydrogen resulted in a significant increase in the Pt–Pt bond distance compared to that of the bare Pt nanoparticle. The change in the Pt–Pt bond distance was reflected in the WT contour, thus indicating the change in the scattering factor, as shown in Figure 5. The Pt–Pt scattering centered at 0.26 nm underwent changes upon hydrogen chemisorption, as depicted in Figure 5a and Figure 6a. Such scattering was spread throughout the k space in the absence of the hydrogen, thereby indicating the presence of metal–support interaction. As the temperature increased to 423 K, the WT contour of both Pt nanoparticles became similar due to hydrogen desorption.
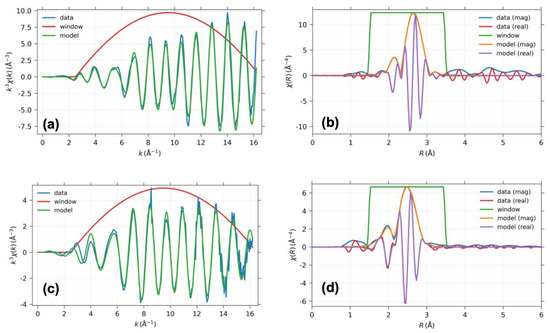
Figure 4.
The projection of the wavelet to k space and r space for the XAFS data on the Pt nanoparticle (a,b) with hydrogen and (c,d) without hydrogen, respectively.
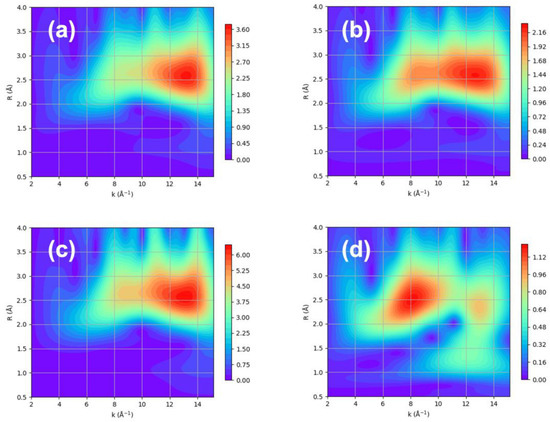
Figure 5.
The WT contour using Morlet method with η = 5 and σ = 1 over XAFS data of Pt nanoparticles with adsorbed hydrogen obtained at (a) 100 K, (b) 225 K, (c) 300 K, and (d) 423 K.
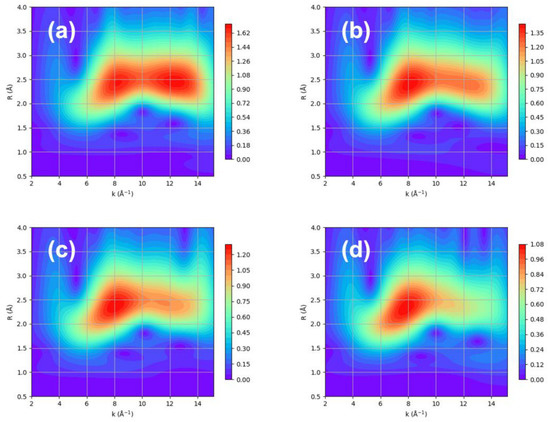
Figure 6.
The WT contour using Morlet method with η = 5 and σ = 1 over XAFS data of naked Pt nanoparticles obtained at (a) 100 K, (b) 225 K, (c) 300 K, and (d) 423 K.
Therefore, hydrogen chemisorption either removes or intensifies the Pt–Pt scattering at a high k. The comparison of the WT contour with and without hydrogen clearly shows a difference at a low k. It can be speculated that the metal–support interaction can increase without hydrogen, whereas hydrogen chemisorption allows for an increase in the Pt–Pt interaction and a decrease in the metal–support interaction. This is indeed reflected in the Debye–Waller factor, which represents the thermal vibration and statistical distribution between Pt–Pt bonds, as shown in Figure 7 [30].
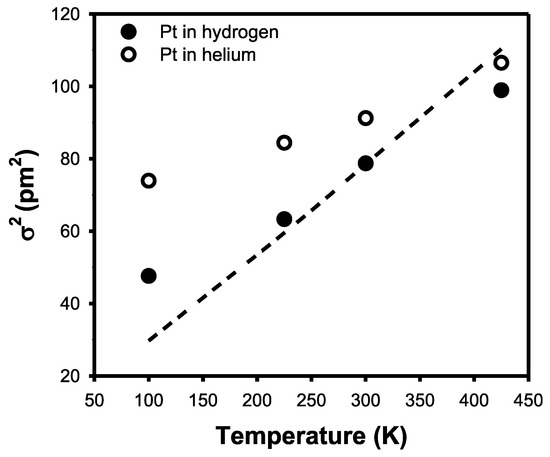
Figure 7.
The Debye–Waller factor of the Pt nanoparticles with hydrogen and without hydrogen, respectively. The dashed line corresponds to that of Pt black, which is the bulk standard.
The Debye–Waller factor of the Pt nanoparticles with hydrogen was found to be much lower than that of the naked Pt nanoparticles. Bulk Pt exhibited a similar Debye–Waller factor to that of the Pt nanoparticles with hydrogen. Therefore, the large Debye–Waller factor of the naked Pt nanoparticles can be attributed to the metal–support interaction, which can be difficult to detect. Considering the coordination of 6.8 or 6.4 for the Pt nanoparticles, it is speculated that the nanoparticle contains 13–55 atoms per particle [21,22]. The Debye–Waller factor of such a small nanoparticle can be increased due to the metal–support interaction [18]. However, it is speculated that hydrogen chemisorption minimizes the effect of the metal–support interaction. Nevertheless, further clarification is needed using other methods such as density functional theory calculations.
The X-ray absorption near-edge spectra of the Pt nanoparticles with and without hydrogen are shown in Figure 8, along with the corresponding first derivatives of the absorption. The absorption edge shifted by 1.02 eV with the hydrogen-adsorbed particles compared to the naked Pt nanoparticles. The shift to a higher energy can be qualitatively attributed to an increase in the oxidation state of the Pt nanoparticle. Previously, such changes in the X-ray absorption near-edge structure have been attributed to the complex scattering of the Pt–H bonding [18]. However, further verification is necessary to demonstrate the change in the oxidation state and charge transfer.

Figure 8.
(Left) The X-ray absorption near-edge spectrum of the Pt nanoparticles with and without hydrogen. (Right) The corresponding differential function showing the absorption edge shift.
The Na Y zeolite model was adopted from the website of the International Zeolite Association, with the unit cell composition modified to Na8[(AlO2)8(SiO2)16] [7]. The unit cell parameters were a = b = c = 1.77747 nm and α = β = γ = 60°, which represent the primitive cell that represents the supercage where the Pt nanoparticle can be included. Initially, a 55 Pt atom nanoparticle was encapsulated in the supercage, as shown in Figure 9. The distribution of the Pt–Pt distances in the nanoparticles was also presented to verify the initial structure, which exhibited a face-centered cubic structure with a distance of 0.2782 nm. After optimization, the distance contracted to 0.2696 nm. The structures of the Na Y and Pt components were optimized using Ω point calculation. The structure of each component was also optimized to obtain the stabilization energy, as shown in Table 2.
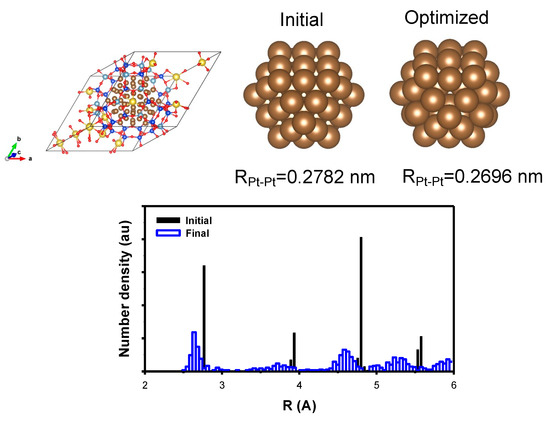
Figure 9.
(Top) The model structure of Pt nanoparticle containing 55 Pt atoms encapsulated in Y zeolite; the initial Pt nanoparticle is shown with the average distance and the corresponding optimized one. (Bottom) The distribution of the Pt–Pt distance is shown to support the result of the optimization. The cell was also optimized to include the effect of the metal–support interaction. (yellow) Na, (blue) Si, (pale blue) Al, (brown) Pt, and (red) O atom, respectively.

Table 2.
The atomic structural parameters derived from the optimization of the Pt nanoparticle encapsulated in Y zeolite where the cell was also optimized. The average charge of each element was obtained using the density derivative atomic point (DDAP) charge method implemented in the CP2K package for comparison [26,27,28].
The charge of each element was obtained using the density derivative atomic point (DDAP) charge method implemented in the CP2K package [26,27,28]. Also, the stabilization energy was estimated following the equation, , where the is the optimized total energy for the given system, which shows a rough estimate the metal support interaction. The charge-neutral framework exhibited good agreement with the previously reported results. The encapsulation of a Pt nanoparticle containing 55 atoms at ~1.35 nm in distance, corresponding to the second shell structure, which fit the supercage of 1.3 nm in diameter, showed a stabilization energy of 0.84 eV and a charge distribution of a negative charge on the framework with a positive charge of 0.047. The independent optimization of the Pt nanoparticles without the framework resulted in practically zero charge. Therefore, the metal–support interaction led to partial oxidation of the Pt, although it was minimal. Additionally, the structure optimization resulted in an increase in the unit cell volume to accommodate the Pt nanoparticle.
To construct the Pt nanoparticle with hydrogen, a large amount of hydrogen needs to be introduced to achieve a high H/Pt ratio, approximately one, including reversible and irreversible hydrogen adsorption [15,16]. However, under the current conditions, such a large amount of hydrogen can complicate the problem. Therefore, the Pt nanoparticles consisting of 13 atoms, representing only the first shell, were modeled in the same way as the Pt nanoparticles containing 55 atoms, as shown in Figure 10. The corresponding charge of the Pt was found to be 0.042, which was similar to that of the Pt nanoparticles containing 55 atoms. Surprisingly, the stabilization energy increased to 6.35 eV, and the corresponding unit cell volume decreased by 0.7%, thereby indicating a significant metal–support interaction. Furthermore, the change in the Pt–Pt bond distance was also similar to that observed for the Pt nanoparticles containing 55 atoms. Indeed, the structure is susceptible to change due to the metal–support interaction, as suggested by the higher stabilization energy and slightly shorter Pt–Pt bond distance. Additionally, the distribution of Pt–Pt distances is wide, thereby indicating significant interaction with the framework.
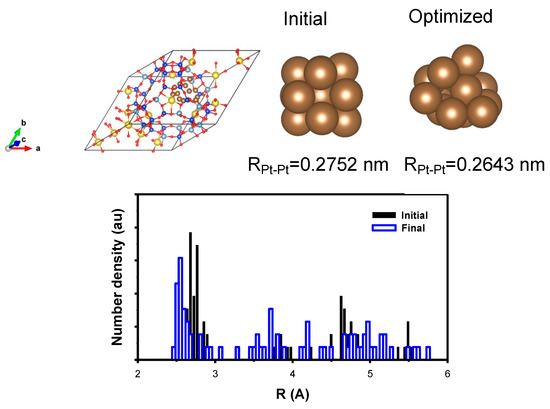
Figure 10.
(Top) The model structure of Pt nanoparticle containing 13 Pt atoms encapsulated in Y zeolite; the initial Pt nanoparticle is shown with the average distance and the corresponding optimized one. (Bottom) The distribution of the Pt–Pt distance is shown to support the result of the optimization. The cell was also optimized to include the effect of the metal–support interaction. (yellow) Na, (blue) Si, (pale blue) Al, (brown) Pt, and (red) O atom, respectively.
For the Pt nanoparticles consisting of 13 atoms, twelve hydrogen atoms were introduced to achieve a high H/Pt ratio of approximately one. As a result, the surface Pt atoms each had one hydrogen atom, which is consistent with experimental results [17,18,19] as appeared in Figure 11. Upon hydrogen adsorption, the optimized structures exhibited Pt–Pt and Pt–H distances of 0.2728 nm and 0.1566 nm, respectively, without any noticeable changes in the distance distribution.
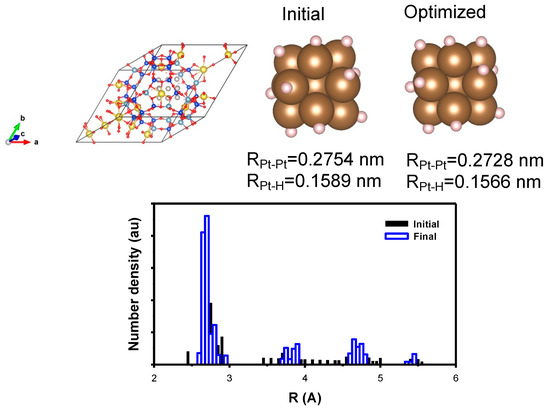
Figure 11.
(Top) The model structure of Pt nanoparticle with hydrogen containing 13 Pt atoms encapsulated in Y zeolite; the initial Pt nanoparticle is shown with the average distance and the corresponding optimized one. (Bottom) The distribution of the Pt–Pt distance is shown to support the result of the optimization. The cell was also optimized to include the effect of the metal-support interaction. (yellow) Na, (blue) Si, (pale blue) Al, (brown) Pt, (red) O, and (pink) H atom, respectively.
The comparison of structural parameters, such as the Pt–Pt bond distance, was found to be similar to that of XAFS data analysis. Furthermore, the oxidation state of the Pt increased significantly to 0.186, which was more than four times higher, while the hydrogen exhibited a negative charge of −0.225. The calculation of the Pt nanoparticles containing 13 atoms without the zeolite framework showed that the charge distribution was similar to that of the encapsulated nanoparticles in the supercage, with values in parentheses indicating similarity. However, the stabilization energy of the Pt nanoparticles containing 13 atoms decreased to 1.26 eV upon hydrogen adsorption. This suggested that hydrogen adsorption induced a charge transfer from Pt to H, thereby resulting in a decrease in the metal–support interaction and a more stable nanoparticle structure. The hydrogen chemisorption energy per Pt atom was estimated to be 0.56 eV, which is consistent with previous reports. Meanwhile, the change in the Pt oxidation state, with and without hydrogen chemisorption, correlated with the shift observed in the X-ray absorption near-edge spectrum. Additionally, the presence of partially negative hydrogen or hydride can enhance our understanding of the role of adsorbed hydrogen regarding Pt in catalytic reactions such as hydrogenation and hydrogenolysis.
3. Materials and Methods
3.1. Catalyst Preparation
The method for preparing Pt nanoparticles supported on Na Y zeolite Na5 6[(AlO2)56(SiO2)136] has been described elsewhere [15,16,21,22]. In summary, Na Y zeolite powder was mixed in a 1.0–3.0 × 10⁻³ M aqueous solution (100 mL g−1 zeolite) of [Pt(NH3)4][NO3]2 (Aldrich) and left overnight at room temperature (RT). Ultraviolet absorption spectra of the supernatant solution confirmed that nearly all Pt(NH3)42+ ions were exchanged from the solution onto the zeolite during this period. The zeolite was then filtered, washed with doubly distilled water, and dried in a vacuum oven at RT. This sample was activated inside a Pyrex U-tube flow reactor by gradually heating it to a specific temperature at a rate of 0.44 K·min−1 and maintaining that temperature for 2 h while flowing dried O2 gas (passed through a molecular sieve trap, >1 L min−1 g−1). The O2 gas was evacuated at 573 K. Subsequently, the sample was reduced by flowing H2 gas (99.999%, passed through a MnO/SiO2 trap, >200 mL min−1 g−1), heating it linearly to 573 K over 4 h, and maintaining it at this temperature for 2 h. To remove chemisorbed hydrogen from the surface of the resulting Pt nanoparticles, the temperature was raised to 673 K over 2 h under 1 × 10⁻³ kPa and held under this condition for 1 h. These samples were used in situ or exposed to air at RT. The air-exposed samples were rereduced in H2 at 573 K for further experiments. The Pt content of these samples was determined to be 4 wt% through chemical analysis. The resulting samples are denoted as Pt/Y.
3.2. Characterization Method
For XAFS measurements, a sample powder weighing 0.12 g was compressed into a self-supporting wafer with a diameter of 10 mm for Pt/Y. The wafer was then subjected to another round of reduction in flowing H2 at 573 K using a Pyrex reactor. Subsequently, the sample wafer was transferred in situ into a connected XAFS cell. Kapton windows (Du Pont, 125 μm thick) were affixed to the XAFS cell using Torr Seal (Varian) for X-ray absorption measurements. Prior to introducing hydrogen into the XAFS cell, the wafer was evacuated at 673 K to remove any chemisorbed hydrogen on the Pt nanoparticle. Hydrogen could then be introduced into the XAFS cell at room temperature (RT).
XAFS spectra were collected above the Pt LIII edge (11,562 eV) at RT using beamline 10B at the Photon Factory in Tsukuba and also the Pohang Accelerator Laboratory in Korea. The injection beam energy was set at 2.5 GeV, and the ring current was maintained between 250 to 350 mA throughout the measurements. A Si(311) double-crystal monochromator with a typical resolution of ΔE/E ≈ 1.2 × 10⁻⁴ at the Pt LIII edge was used. The energy steps in the absorption edge and XAFS regions were 0.5 eV and 2.2 eV, respectively. The X-ray intensity was measured using a gas ionization chamber. The detector gases for incident and transmitted X-ray intensities were composed of 85% N2–15% Ar and 100% Ar, respectively.
3.3. XAFS Data Analysis and DFT Simulation
To determine the atomic structure of the Pt nanoparticles supported on Na Y, XAFS spectra were analyzed using the Athena and Artemis packages [15,22,31]. The raw data analysis followed standard procedures using the IFEFFIT software package. The spectra underwent calibration, averaging, pre-edge background subtraction, and post-edge normalization using the Athena program within the IFEFFIT software package. Fourier transformation of the k3-weighted EXAFS oscillations, k3χ(k), from k space to r space, was performed within a range of 3.0–14.0 Å−1 to generate a radial distribution function. Data fitting was conducted using the Artemis program in IFEFFIT, utilizing Feff8, with an ab initio self-consistent real-space multiple-scattering code, for simultaneous calculations of X-ray absorption spectra and electronic structure. In the context of XAFS analysis, wavelet transforms provide an extension to Fourier transforms by effectively separating waveform contributions in both time and frequency domains (or, in the case of XAFS, k and r domains) [25,32]. In the present work, the wavelet-based approach was employed to extract the structural parameter from XAFS data, without relying solely on r-space or k-space analysis, in order to enhance the quality of the fitting process.
The initial structural model of the NaY zeolite in primitive lattice containing Pt nanoparticles was subjected to geometry optimization through density functional theory (DFT) calculations, which were initially performed with fixed cell parameters and later optimized. These DFT calculations were conducted using the Gaussian plane waves method within the CP2K package, thereby employing the generalized gradient approximation (GGA) with the Perdew–Burke–Ernzerhof (PBE) exchange functional [33]. The energy cutoff for the plane waves was set at 500 Ry. Goedecker, Teter, and Hutter (GTH) pseudopotential approximation [34] and double-zeta basis sets (DZVP) [35] cutoff radius of 10 Å [36]. Additionally, density-derived atomic point charges (DDAPC) were computed using the optimized electron density from DFT calculations [37]. These charges provide information on the charge redistribution and transfer between the metal and hydrogen, which are specifically related to changes in charge distribution upon hydrogen chemisorption. All the optimized crystal structure information files can be found in the supplementary information (Tables S1–S3).
4. Conclusions
The current study focused on Pt nanoparticles encapsulated in the supercage and examined the impact of hydrogen on the nanoparticle structure and metal–support interaction. This investigation utilized X-ray absorption fine structure data analysis with the wavelet method and rigorous density functional theory calculations. The results consistently demonstrated that hydrogen adsorbed on Pt carries a negative charge, as confirmed by both density functional theory calculations and X-ray absorption near-edge structure analysis. Simultaneously, the presence of partially oxidized Pt leads to an increase in the X-ray absorption energy. Further research is underway to explore the effects of hydrogen on other noble metals, such as Ru, Ir, Rh, and Pd nanoparticles encapsulated in the supercage. The emphasis is placed on quantitatively elucidating these effects using density functional theory calculations. Certainly, the impact of hydrogen-induced structural relaxation on Pt nanoparticles confined within Y zeolite may be predominantly restricted to the metal–support interaction influenced by the aluminosilicate framework. However, with other supports such as silica and alumina, this effect can also occur, albeit to varying degrees.
Supplementary Materials
The following supporting information can be downloaded at: https://www.mdpi.com/article/10.3390/catal13081191/s1, Table S1. Optimized Crystallographic Information File for Pt55 in NaY zeolite; Table S2. Optimized Crystallographic Information File for Pt13 in NaY zeolite; Table S3. Optimized Crystallographic Information File for Pt13-H12 in NaY zeolite.
Author Contributions
Conceptualization, S.J.C. and C.P.; methodology, S.J.C.; validation, S.J.C., C.H.K. and C.P.; formal analysis, S.J.C.; investigation, S.J.C., C.H.K. and C.P.; data curation, S.J.C.; writing—original draft preparation, S.J.C.; writing—review and editing, S.J.C., C.H.K. and C.P. All authors have read and agreed to the published version of the manuscript.
Funding
This work was supported by the project for Cooperative R&D between Industry, Academy, and Research Institute (RS-2023-00225235), which is funded by the Ministry of SMEs and Startups and also by the Ministry of Trade, Industry, and Energy (project No. 20015736) in Republic of Korea.
Data Availability Statement
Data is contained within the article.
Acknowledgments
This work was supported by the project for Cooperative R&D between Industry, Academy, and Research Institute (RS-2023-00225235), which is funded by the Ministry of SMEs and Startups and also by the Ministry of Trade, Industry, and Energy (project No. 20015736) in Republic of Korea. The authors also acknowledge the Pohang Accelerator Laboratory (PAL) for beamline use.
Conflicts of Interest
The authors declare no conflict of interest.
References
- Chen, L.-H.; Sun, M.; Wang, Z.; Yang, W.; Xie, Z.; Su, B. Hierarchically structured zeolites: From design to application. Chem. Rev. 2020, 120, 11194–11294. [Google Scholar] [CrossRef]
- Dusselier, M.; Davis, M.E. Small-pore zeolites: Synthesis and catalysis. Chem. Rev. 2018, 118, 5265–5329. [Google Scholar] [CrossRef]
- Liu, H.; Jiang, T.; Han, B.; Liang, S.; Zhou, Y. Selective phenol hydrogenation to cyclohexanone over a dual supported Pd–Lewis acid catalyst. Science 2009, 326, 1250–1252. [Google Scholar] [CrossRef]
- Horáček, J.; Šťávová, G.; Kelbichová, V.; Kubička, D. Zeolite-Beta-supported platinum catalysts for hydrogenation/hydrodeoxygenation of pyrolysis oil model compounds. Catal. Today 2013, 204, 38–45. [Google Scholar] [CrossRef]
- Wang, J.; Li, Q.; Yao, J. The effect of metal–acid balance in Pt-loading dealuminated Y zeolite catalysts on the hydrogenation of benzene. Appl. Catal. A Gen. 1999, 184, 181–188. [Google Scholar] [CrossRef]
- Wang, L.; Zhang, J.; Yi, X.; Zheng, A.; Deng, F.; Chen, C.; Ji, Y.; Liu, F.; Meng, X.; Xiao, F.S. Mesoporous ZSM-5 zeolite-supported Ru nanoparticles as highly efficient catalysts for upgrading phenolic biomolecules. ACS Catal. 2015, 5, 2727–2734. [Google Scholar] [CrossRef]
- Baerlocher, C.; McCusker, L.B.; Olson, D.H. Atlas of Zeolite Framework Types; Elsevier: Amsterdam, The Netherlands, 2007. [Google Scholar]
- Corma, A.; Fornes, V.; Martín-Aranda, R.; Garcia, H.; Primo, J. Zeolites as base catalysts: Condensation of aldehydes with derivatives of malonic esters. Appl. Catal. 1990, 59, 237–248. [Google Scholar] [CrossRef]
- Verboekend, D.; Nuttens, N.; Locus, R.; Van Aelst, J.; Verolme, P.; Groen, J.C.; Perez-Ramirez, J.; Sels, B.F. Synthesis, characterisation, and catalytic evaluation of hierarchical faujasite zeolites: Milestones, challenges, and future directions. Chem. Soc. Rev. 2015, 45, 3331–3352. [Google Scholar] [CrossRef] [PubMed]
- Verboekend, D.; Keller, T.C.; Mitchell, S.; Pérez-Ramírez, J. Hierarchical FAU- and LTA-type zeolites by post-synthetic design: A new generation of highly efficient base catalysts. Adv. Func. Mater. 2012, 23, 1923–1934. [Google Scholar] [CrossRef]
- Kouzu, M.; Kuwako, T.; Ohto, Y.; Suzuki, K.; Kojima, M. Single stage Upgrading with the Help of Bifunctional Catalysis of Pt Supported on Solid Acid for Converting Product Oil of Triglyceride Thermal Cracking into Drop-in Fuel. Fuel Process. Technol. 2020, 202, 106364. [Google Scholar] [CrossRef]
- Geng, L.; Gong, J.; Qiao, G.; Ye, S.; Zheng, J.; Zhang, N.; Chen, B. Effect of Metal Precursors on the Performance of Pt/SAPO-11 Catalysts for n-Dodecane Hydroisomerization. ACS Omega 2019, 4, 12598–12605. [Google Scholar] [CrossRef]
- Said, S.; Zaky, M.T. Pt/SAPO-11 Catalysts: Effect of Platinum Loading Method on the Hydroisomerization of n-Hexadecane. Catal. Lett. 2019, 149, 2119–2131. [Google Scholar] [CrossRef]
- Sun, Q.; Wang, N.; Yu, J. Advances in Catalytic Applications of Zeolite-Supported Metal Catalysts. Adv. Mater. 2021, 33, e2104442. [Google Scholar] [CrossRef]
- Cho, S.J.; Ahn, W.S.; Hong, S.B.; Ryoo, R. Investigation of the Platinum Cluster Size and Location on Zeolite KL with 129Xe NMR, XAFS, and Xenon Adsorption. J. Phys. Chem. 1996, 100, 4996–5003. [Google Scholar] [CrossRef]
- Ryoo, R.; Cho, S.J.; Pak, C.; Kim, J.G.; Ihm, S.K.; Lee, J.Y. Application of the xenon-adsorption method for the study of metal cluster formation and growth on Y zeolite. J. Am. Chem. Soc. 1992, 114, 76–82. [Google Scholar] [CrossRef]
- Nakatsuji, H.; Hada, M.; Yonezawa, T. Theoretical Study on the Chemisorption of a Hydrogen Molecule on Palladium. J. Am. Chem. Soc. 1987, 109, 1902–1912. [Google Scholar] [CrossRef]
- Oudenhuijzen, M.K.; Bitter, J.H.; Koningsberger, D.C. The Nature of the Pt-H Bonding for Strongly and Weakly Bonded Hydrogen on Platinum. A XAFS Spectroscopy Study of the Pt-H Antibonding Shape Resonance and Pt-H EXAFS. J. Phys. Chem. B 2001, 105, 4616–4622. [Google Scholar] [CrossRef]
- Zhou, C.; Wu, J.; Nie, A.; Forrey, R.C.; Tachibana, A.; Cheng, H. On the Sequential Hydrogen Dissociative Chemisorption on Small Platinum Clusters: A Density Functional Theory Study. J. Phys. Chem. C 2007, 111, 12773–12778. [Google Scholar] [CrossRef]
- Ge, G.X.; Yan, H.X.; Jing, Q.; Luo, Y.H. Theoretical Study of Hydrogen Adsorption on Ruthenium Clusters. J. Clust. Sci. 2011, 22, 473–489. [Google Scholar] [CrossRef]
- Cho, S.J.; Ryoo, R. Design of bimetallic nanoparticles. Int. J. Nanotechnol. 2006, 3, 194–215. [Google Scholar] [CrossRef]
- Ryoo, R.; Cho, S.J.; Pak, C.; Lee, J.Y. Clustering of platinum atoms into nanoscale particle and network on NaY zeolite. Catal. Lett. 1993, 20, 107–115. [Google Scholar] [CrossRef]
- Timoshenko, J.; Kuzmin, A. Wavelet data analysis of EXAFS spectra. Comput. Phys. Commun. 2009, 180, 920–925. [Google Scholar] [CrossRef]
- Funke, H.; Scheinost, A.C.; Chukalina, M. Wavelet analysis of extended X-ray absorption fine structure data. Phys. Rev. B 2005, 71, 094110. [Google Scholar] [CrossRef]
- Muñoz, M.; Argoul, P.; Farges, F. Continuous Cauchy wavelet transform analyses of EXAFS spectra: A qualitative approach. Am. Mineral. 2003, 88, 694–700. [Google Scholar] [CrossRef]
- CP2k Developers Group. CP2k: Open Source Molecular Dynamics. Available online: http://www.cp2k.org (accessed on 18 October 2020).
- Hutter, J.; Iannuzzi, M.; Schiffmann, F.; VandeVondele, J. cp2k: Atomistic simulations of condensed matter systems. WIREs Comput. Mol. Sci. 2014, 4, 15–25. [Google Scholar] [CrossRef]
- Kühne, T.D.; Iannuzzi, M.; Ben, M.; Rybkin, V.V.; Seewald, P.; Stein, F.; Laino, T.; Khaliullin, R.Z.; Schütt, O.; Schiffmann, F.; et al. CP2K: An Electronic Structure and Molecular Dynamics Software Package-Quickstep: Efficient and Accurate Electronic Structure Calculations. J. Chem. Phys. 2020, 152, 194103. [Google Scholar] [CrossRef]
- Lavrentyev, A.A.; Nikiforov, I.Y.; Dubeiko, V.A.; Gabrelian, B.V.; Rehr, J.J. The use of the FEFF8 code to calculate the XANES and electron density of states of some sulfides. J. Synchrotron Radiat. 2001, 8, 288–290. [Google Scholar] [CrossRef]
- Fornasini, P.; Grisenti, R. On EXAFS Debye-Waller factor and recent advances. J. Synchrotron Radiat. 2015, 22, 1242–1257. [Google Scholar] [CrossRef]
- Ravel, B.; Newville, M. ATHENA, ARTEMIS, HEPHAESTUS: Data analysis for X-ray absorption spectroscopy using IFEFFIT. J. Synchrotron Radiat. 2005, 12, 537–541. [Google Scholar] [CrossRef] [PubMed]
- Newville, M. Larch: An Analysis Package for XAFS and Related Spectroscopies. J. Phys. Conf. Ser. 2013, 430, 012007. [Google Scholar] [CrossRef]
- Perdew, P.; Burke, K.; Ernzerhof, M. Generalized Gradient Approximation Made Simple. Phys. Rev. Lett. 1996, 77, 3865–3868. [Google Scholar] [CrossRef] [PubMed]
- Goedecker, S.; Teter, M.; Hutter, J. Separable dual-space Gaussian pseudopotentials. Phys. Rev. B 1996, 54, 1703. [Google Scholar] [CrossRef] [PubMed]
- VandeVondele, J.; Hutter, J. Gaussian basis sets for accurate calculations on molecular systems in gas and condensed phases. J. Chem. Phys. 2007, 127, 114105. [Google Scholar] [CrossRef] [PubMed]
- Grimme, S.; Antony, J.; Ehrlich, S.; Krieg, H. A consistent and accurate ab initio parametrization of density functional dispersion correction (DFT-D) for the 94 elements H-Pu. J. Chem. Phys. 2010, 132, 154104. [Google Scholar] [CrossRef] [PubMed]
- Blochl, P.E. Electrostatic decoupling of periodic images of plane-wave-expanded densities and derived atomic point charges. J. Chem. Phys. 1995, 103, 7422–7428. [Google Scholar] [CrossRef]
Disclaimer/Publisher’s Note: The statements, opinions and data contained in all publications are solely those of the individual author(s) and contributor(s) and not of MDPI and/or the editor(s). MDPI and/or the editor(s) disclaim responsibility for any injury to people or property resulting from any ideas, methods, instructions or products referred to in the content. |
© 2023 by the authors. Licensee MDPI, Basel, Switzerland. This article is an open access article distributed under the terms and conditions of the Creative Commons Attribution (CC BY) license (https://creativecommons.org/licenses/by/4.0/).