Article

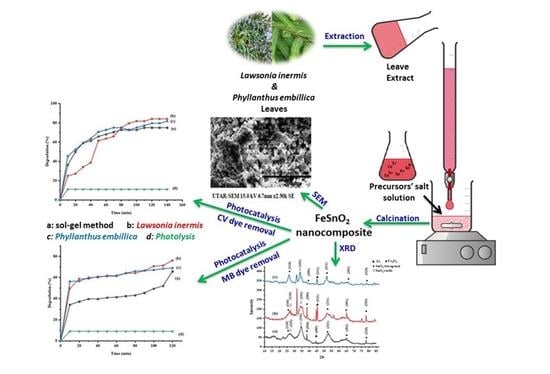
The Impact of Different Green Synthetic Routes on the Photocatalytic Potential of FeSnO2 for the Removal of Methylene Blue and Crystal Violet Dyes under Natural Sunlight Exposure

1
Department of Chemistry, Forman Christian College (A Chartered University), Ferozepur Road, Lahore 54600, Pakistan
2
Department of Basic and Applied Chemistry, Faculty of Science and Technology, University of Central Punjab, Khayaban-e-Jinnah Road, Johar Town, Lahore 54782, Pakistan
3
Lee Kong Chian Faculty of Engineering and Science, Universiti Tunku Abdul Rahman, Bandar Sungai Long, Kajang 43000, Selangor, Malaysia
4
Department of Chemistry, School of Natural Sciences (SNS), National University of Science and Technology (NUST), H-12, Islamabad 46000, Pakistan
5
Chemistry Department, Faculty of Science, King Khalid University, P.O. Box 9004, Abha 61413, Saudi Arabia
6
Biology Department, Faculty of Science, King Khalid University, P.O. Box 9004, Abha 61413, Saudi Arabia
*
Authors to whom correspondence should be addressed.
Catalysts 2023, 13(7), 1135; https://doi.org/10.3390/catal13071135
Submission received: 24 May 2023 / Revised: 29 June 2023 / Accepted: 6 July 2023 / Published: 21 July 2023
(This article belongs to the Special Issue Advanced Materials for Application in Catalysis)

Abstract

:
FeSnO2 nanocomposites were synthesized via the green method using aqueous leaf extracts of Lawsonia inermis and Phyllanthus embilica plants. The role of polyphenols based on reduction potentials for the synthesis of FeSnO2 was also highlighted. The synthesized materials were examined by using TGA and DSC, FT-IR, XRD, and SEM with EDX analysis. Tetragonal rutile and distorted hexagonal structures were observed in SEM images of the FeSnO2 nanocomposites and compared with an FeSnO2 nanocomposite prepared using the sol-gel method. Scherer’s formula yielded crystallite sizes of 29.49, 14.54, and 20.43 nm; however, the average crystallite size assessed employing the Williamson–Hall equation was found to be 20.85, 11.30, and 14.86 nm by using the sol-gel and green techniques, using extracts from Lawsonia inermis and Phyllanthus embilica. The band gap was determined by using the Tauc and Wood equations, and photocatalytic activity was analyzed to determine the degradation of methylene blue (MB) and crystal violet (CV) under the illumination of natural sunlight. It was observed that the sample prepared by means of the green method using the leaf extract of Lawsonia inermis showed the best photocatalytic activity of 84%, with a particle size of 14.54 nm, a 3.10 eV band gap, and a specific surface area of 55.68 m2g−1.

Graphical Abstract

1. Introduction

The textile and paper industries employ carcinogenic thiazine contaminants such as methylene blue (MB) for dyeing. This poses a high risk to human health and harms the eyes and neurological system. Continuous exposure to these contaminants results in stomach infections, nausea, vomiting, diarrhea, and breathing difficulties [1]. Crystal violet (CV), also known as gentian violet or hexamethylpararosaniline chloride, belongs to a group of triphenylmethane dyes. The intestinal microflora can easily convert crystal violet into a highly carcinogenic leuco form [2]. Approximately 15% of these dyes are wasted during their application [3]. The removal of these hazardous dyes from waste can be achieved by using certain degradation methods like advanced oxidation [4] and chemical oxidation [5]. There are certain concerns regarding the toxicity, expense, and inadequate degradation related to the above-mentioned techniques [6]. However, nanotechnology offers an economical and environmentally friendly solution to these problems by using photocatalysis [7,8]. Photocatalysis is a phenomenon wherein light activates a photocatalyst, i.e., a semiconductor, by generating photo-excitons, which ultimately leads to the removal of organic pollutants through a degradation mechanism [9,10]. The role of photocatalysts is vital in achieving the maximum removal of pollutants; therefore, it is highly desirable to explore efficient photocatalysts for the removal of contaminants.
The n-type semiconductor SnO2 has a large bandgap energy (3.5 eV) and is used in optoelectronic devices, electrode materials, secondary lithium batteries, dye-based solar cells, gas sensors, and catalysis [11,12,13,14,15,16]. Its beneficial properties can be further improved by preparing the nanocomposite with different metals [17]. Transition metals are being extensively used for this purpose to enhance the electrical, structural, and optical properties of SnO2 [18]. These metals can be coupled with metal oxide through nanocomposite formation techniques such as sol-gel, co-precipitation, hydrothermal processes, wet-impregnation, and green synthetic routes [19]. Among these methods, the synthesis of nanocomposites through green methods using plant extracts is considered advantageous over other chemical methods [20].
In green synthesis, plant extracts containing polyphenols such as gallic acid, ascorbic acid, naphthoquinones, etc., are usually responsible for the reduction of metallic ions [21]. Researchers investigated the role of polyphenols in the green synthesis of metal–metal oxide nanocomposites using extracts of different plants [21,22]. In this study, an effort was made for the first time to synthesize a bimetallic FeSnO2 nanocomposite using Lawsonia inermis (Hina) and Phyllanthus emblica (Indian goose berry/Amla), while emphasizing the role of polyphenols, as previous attempts were focused on synthesizing FeSnO2 nanocomposites by means of chemical and thermal methods [23,24]. In addition, the photocatalytic activity of FeSnO2 synthesized using green methods was compared with the activity of FeSnO2 prepared using the sol-gel method. Lawsonia inermis and Phyllanthus embilica were selected due to their sufficient polyphenolic contents and abundance in Pakistan [25,26]. Moreover, these plants have been utilized effectively for the green synthesis of NPs due to their antioxidant, antimicrobial, and antipruritic activities [27,28]. Aqueous extracts of Lawsonia inermis leaves contain 486.2 μg/g lawsone (2-hydroxy-1, 4-naphthoquinone), which is the main bioactive compound in this plant [29]. The total polyphenol contents in aqueous extracts of Lawsonia inermis and Phyllanthus embillica leaves are reported to be 100.2 ± 3.5 and 513.83 ± 20.52 mg/g gallic acid equivalent, respectively [30].

2. Results and Discussion
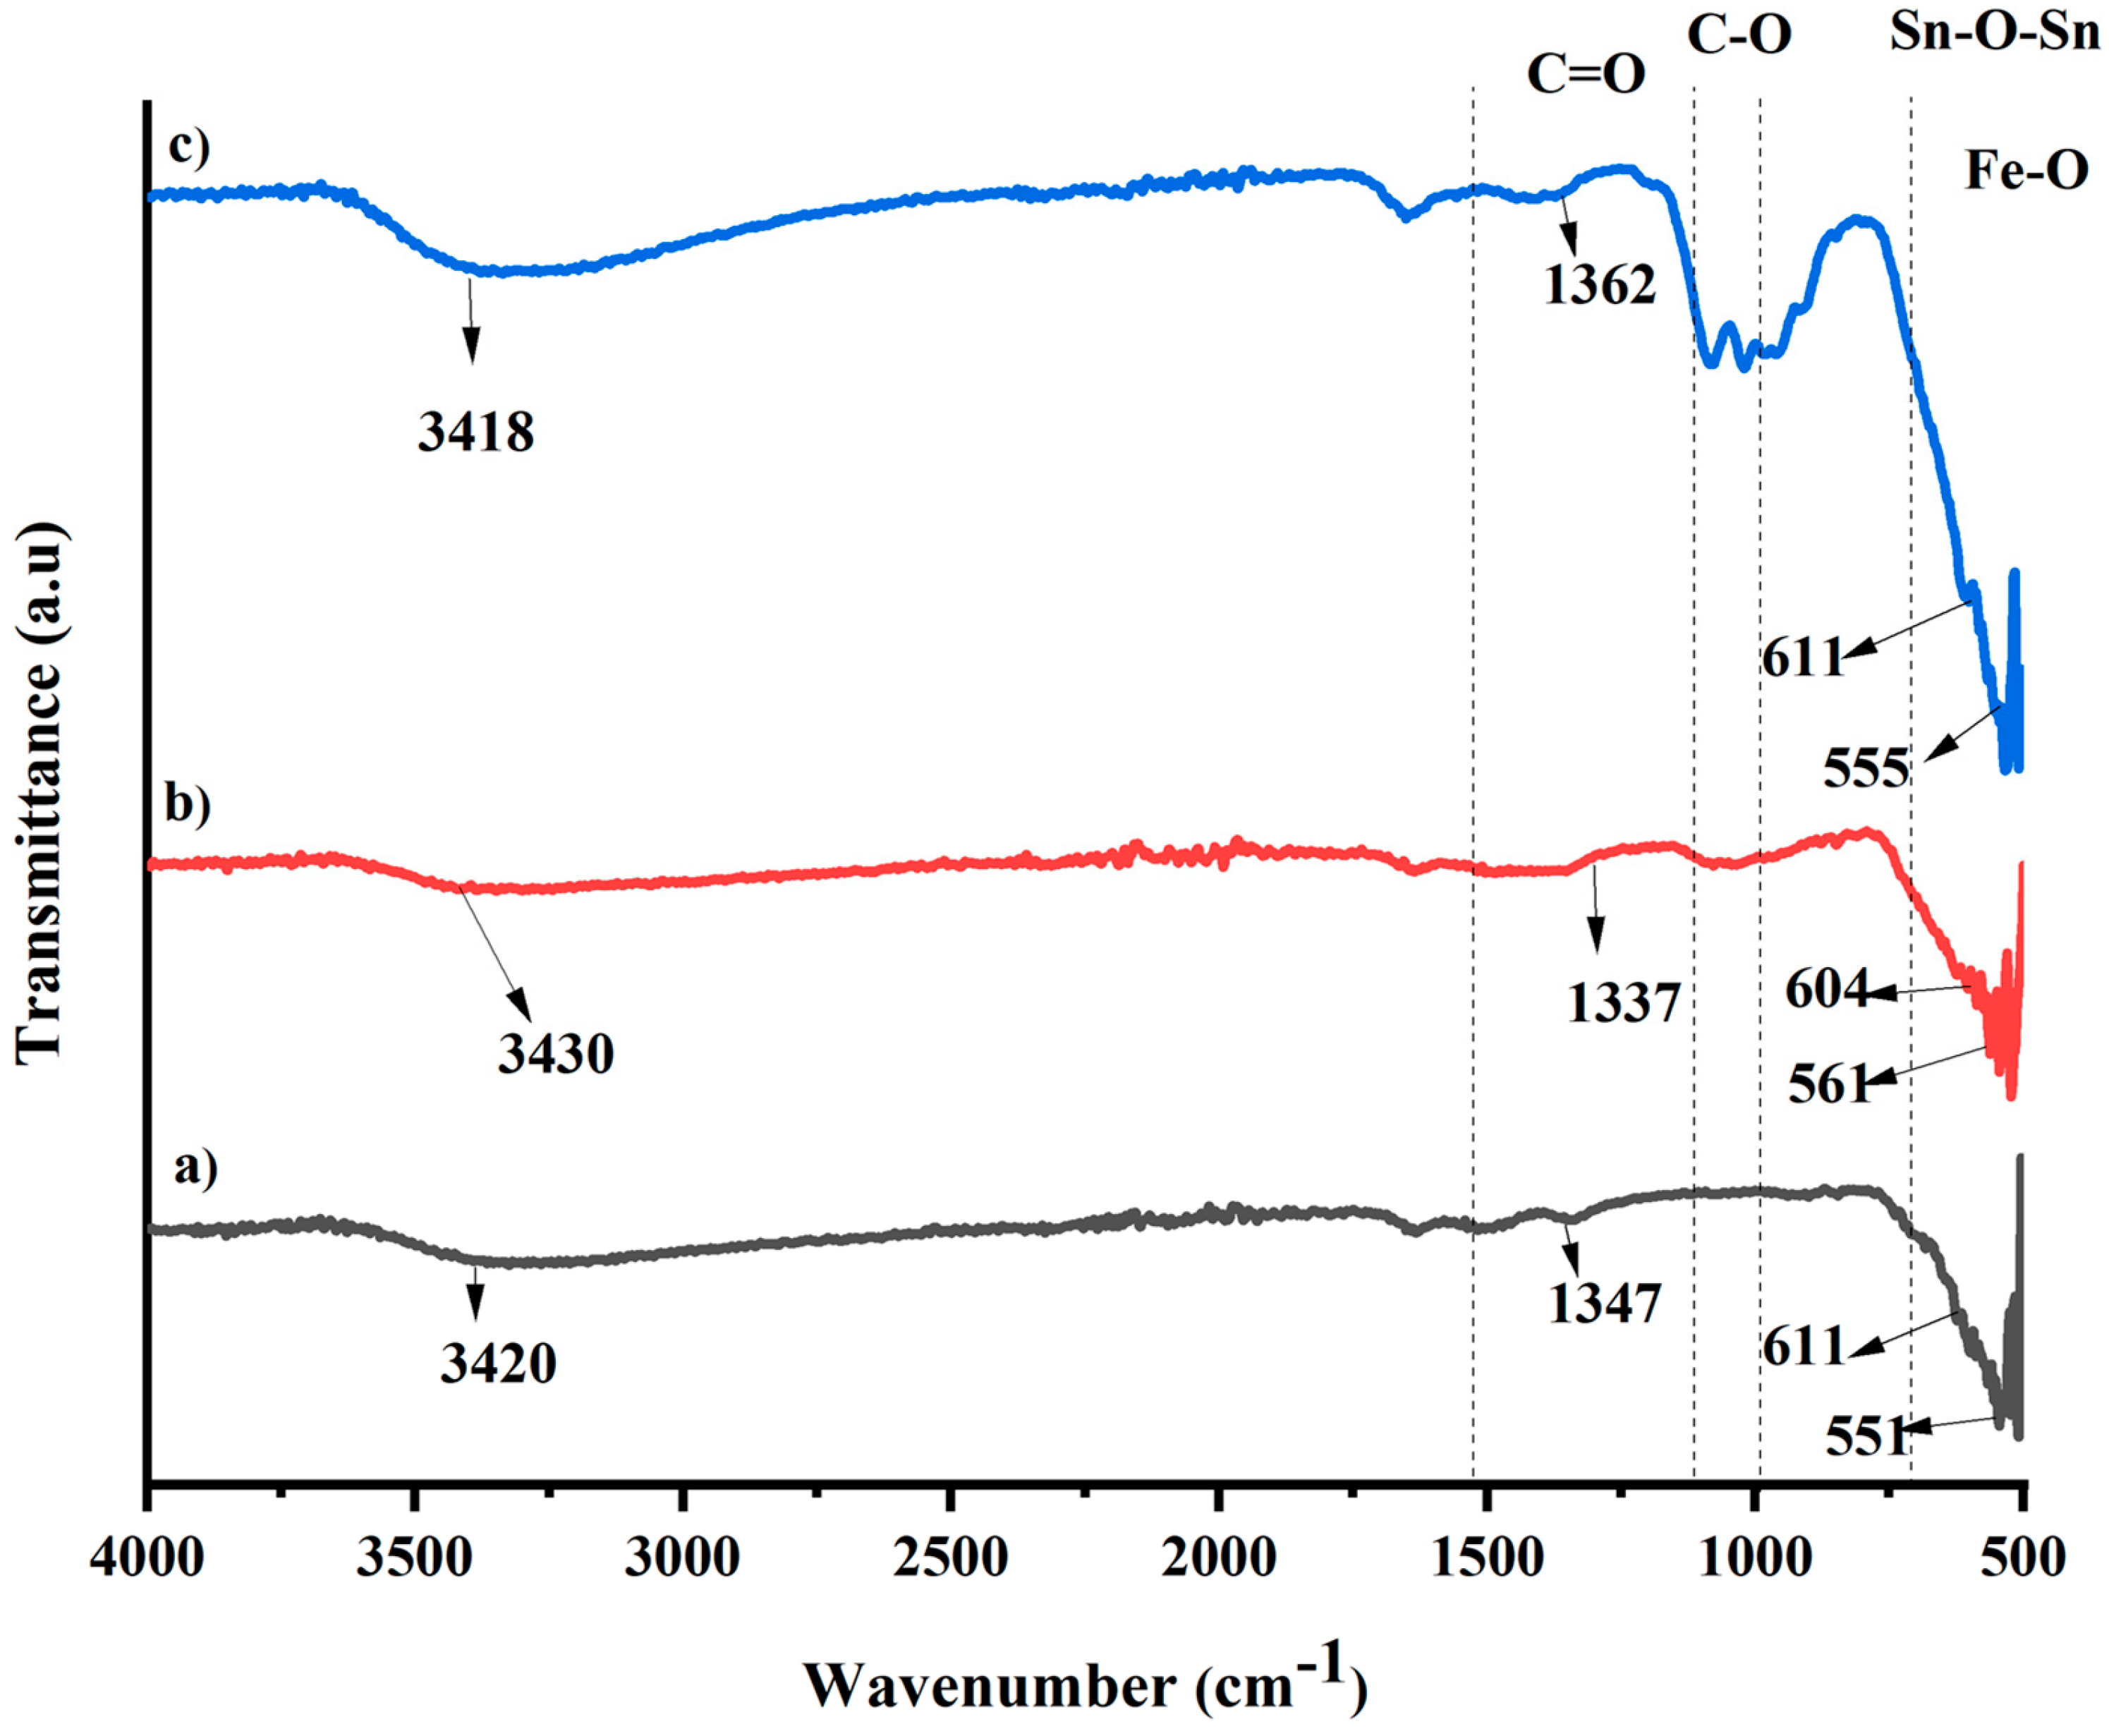
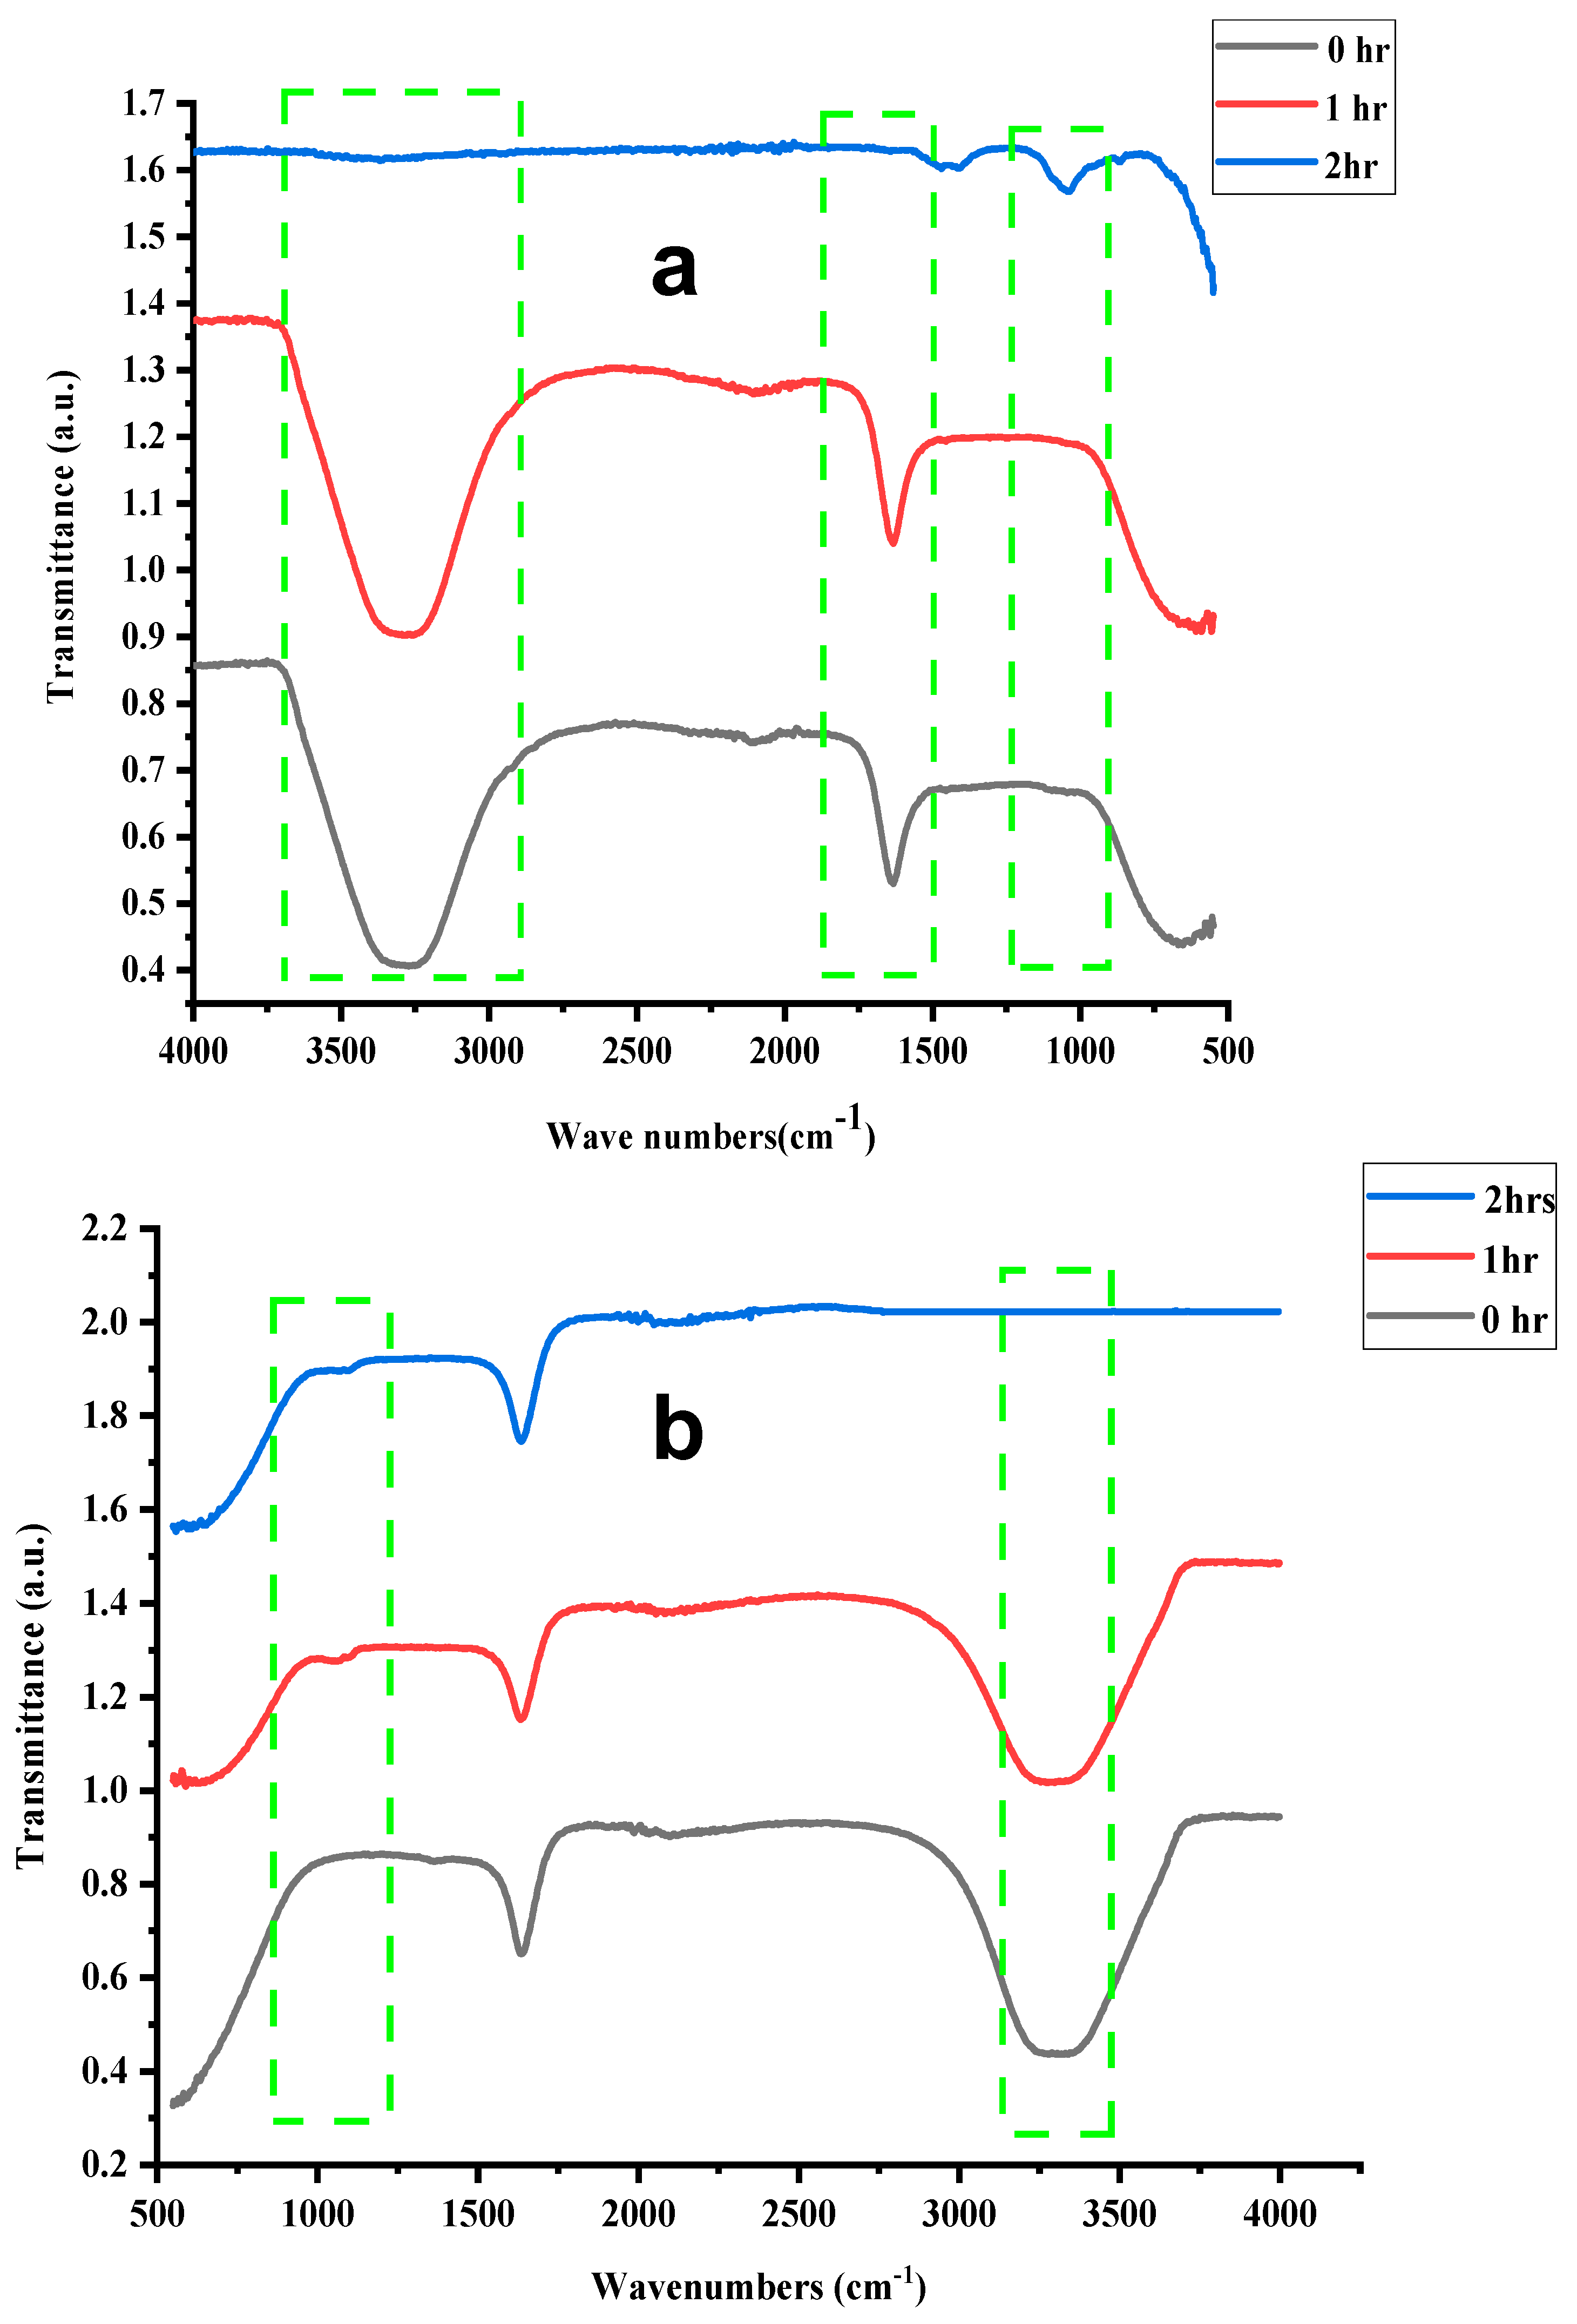
2.1. FT-IR Analysis

Figure 1 shows the comparison of FT-IR spectra of FeSnO2 synthesized via green routes and the sol-gel method, wherein the Sn-O-Sn vibration at 400–700 cm−1 was observed due to condensation reaction [31]. The peak at 651–555 cm−1 was reported due to the Sn-O extending mode of Sn-O-Sn, while the peak at 534 cm−1 was attributed to Sn-OH [32]. The peaks obtained at 551, 561 and 555 cm−1 for Sn-O stretching and 611, 604 and 611 cm−1 for Fe-O stretching present in the nanocomposites synthesized using the sol-gel method as well as Lawsonia inermis and Phyllanthus embillica leaf extracts are compatible with previous work [33]. The wide peaks at 3420, 3430, and 3418 cm−1 and the narrow peaks at 1347, 1337, and 1362 are due to OH and C=O groups of polyphenols or the absorption of atmospheric water and CO2 on the surface of the nanocomposite [33].
FT-IR analysis of plant extracts was also carried out to determine the different functional groups. The presence of vibration peaks at 3200–3300 cm−1 show the OH group present in the plant extracts (Figure 2a,b). The peak at 2930 cm−1 represents the existence of an alkane group (C-C), while the peaks at 2216, 2187,1618, 1401, 1073, 1000 and 872 cm−1 are due to the presence of a C=N bond, thiocyanate, C=O stretching (quinone), a C=C bond, alkyl substituted ether, C-O stretching and aromatic rings due to phytochemicals present in plants extract, respectively [34,35].
Moreover, the bond length (R) of Sn-O and Fe-O was determined using FTIR data by applying Badger’s formula and force constant k (dynes.cm−1), as shown in Equations (1) and (3).
R = Cij k + dij 3
The force constant, k, is expressed in mega-dynes per centimeter. In the periodic table’s period, the number of bound atoms determines the fitting constants Cij and dij. The Cij values for Fe-O and Sn-O are 0.5 and 0.49, respectively, whereas the dij values are 1.06 and 1.18, respectively [36].
By employing the fundamental harmonic Equation (2), which is directly connected to the degree of bond stiffness, Hook’s law was utilized to compute the force constant (k) of the bond [37]. Shorter bonds have greater force constant values and are stronger than longer ones (k).
v = 1 2 π c k / μ
where µ, as determined by Equation (3), is the decreased mass (kg) of bound atoms [38].
μ = m 1 m 2 m 1 + m 2
where m 1 and m 2 are the bonded atoms’ atomic masses. Equation (2) can be changed to
k = v 2 4 π 2   c 2   μ
The bond length of Fe-O and Sn-O in FeSnO2 was calculated and results are given in Table 1. The values show that a slight increase in bond lengths was observed due to the influence of different methods.

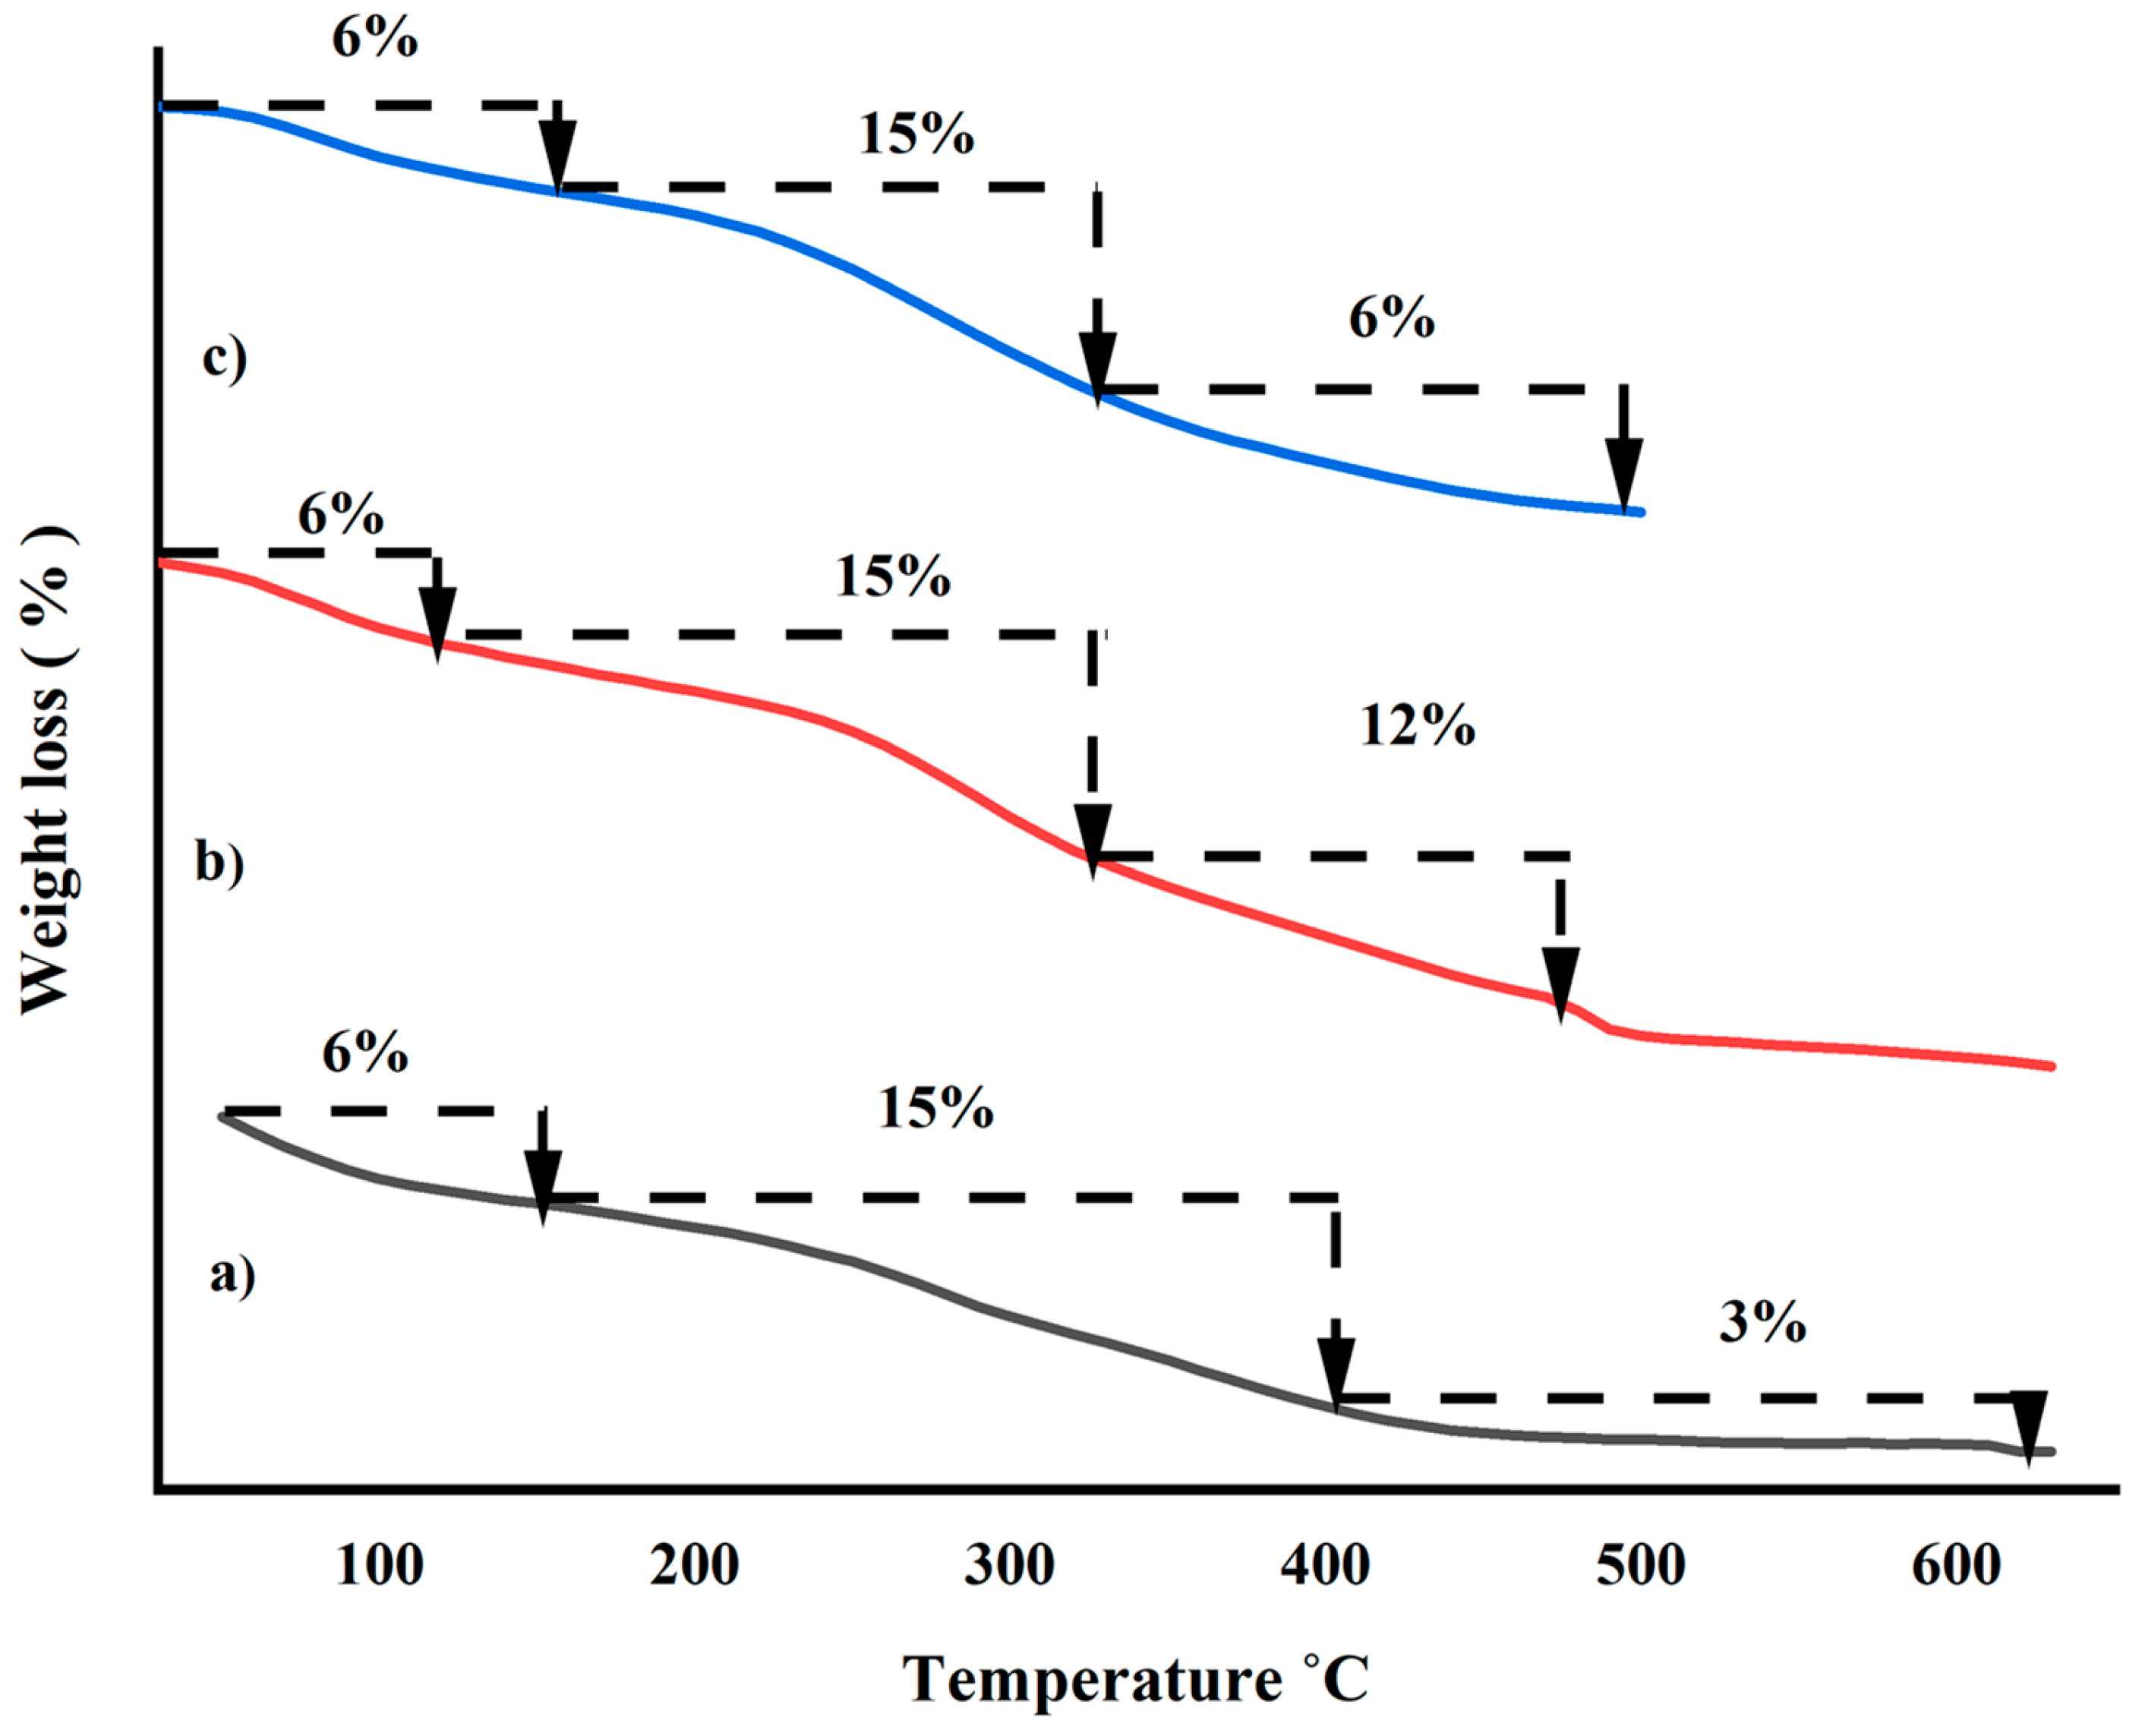
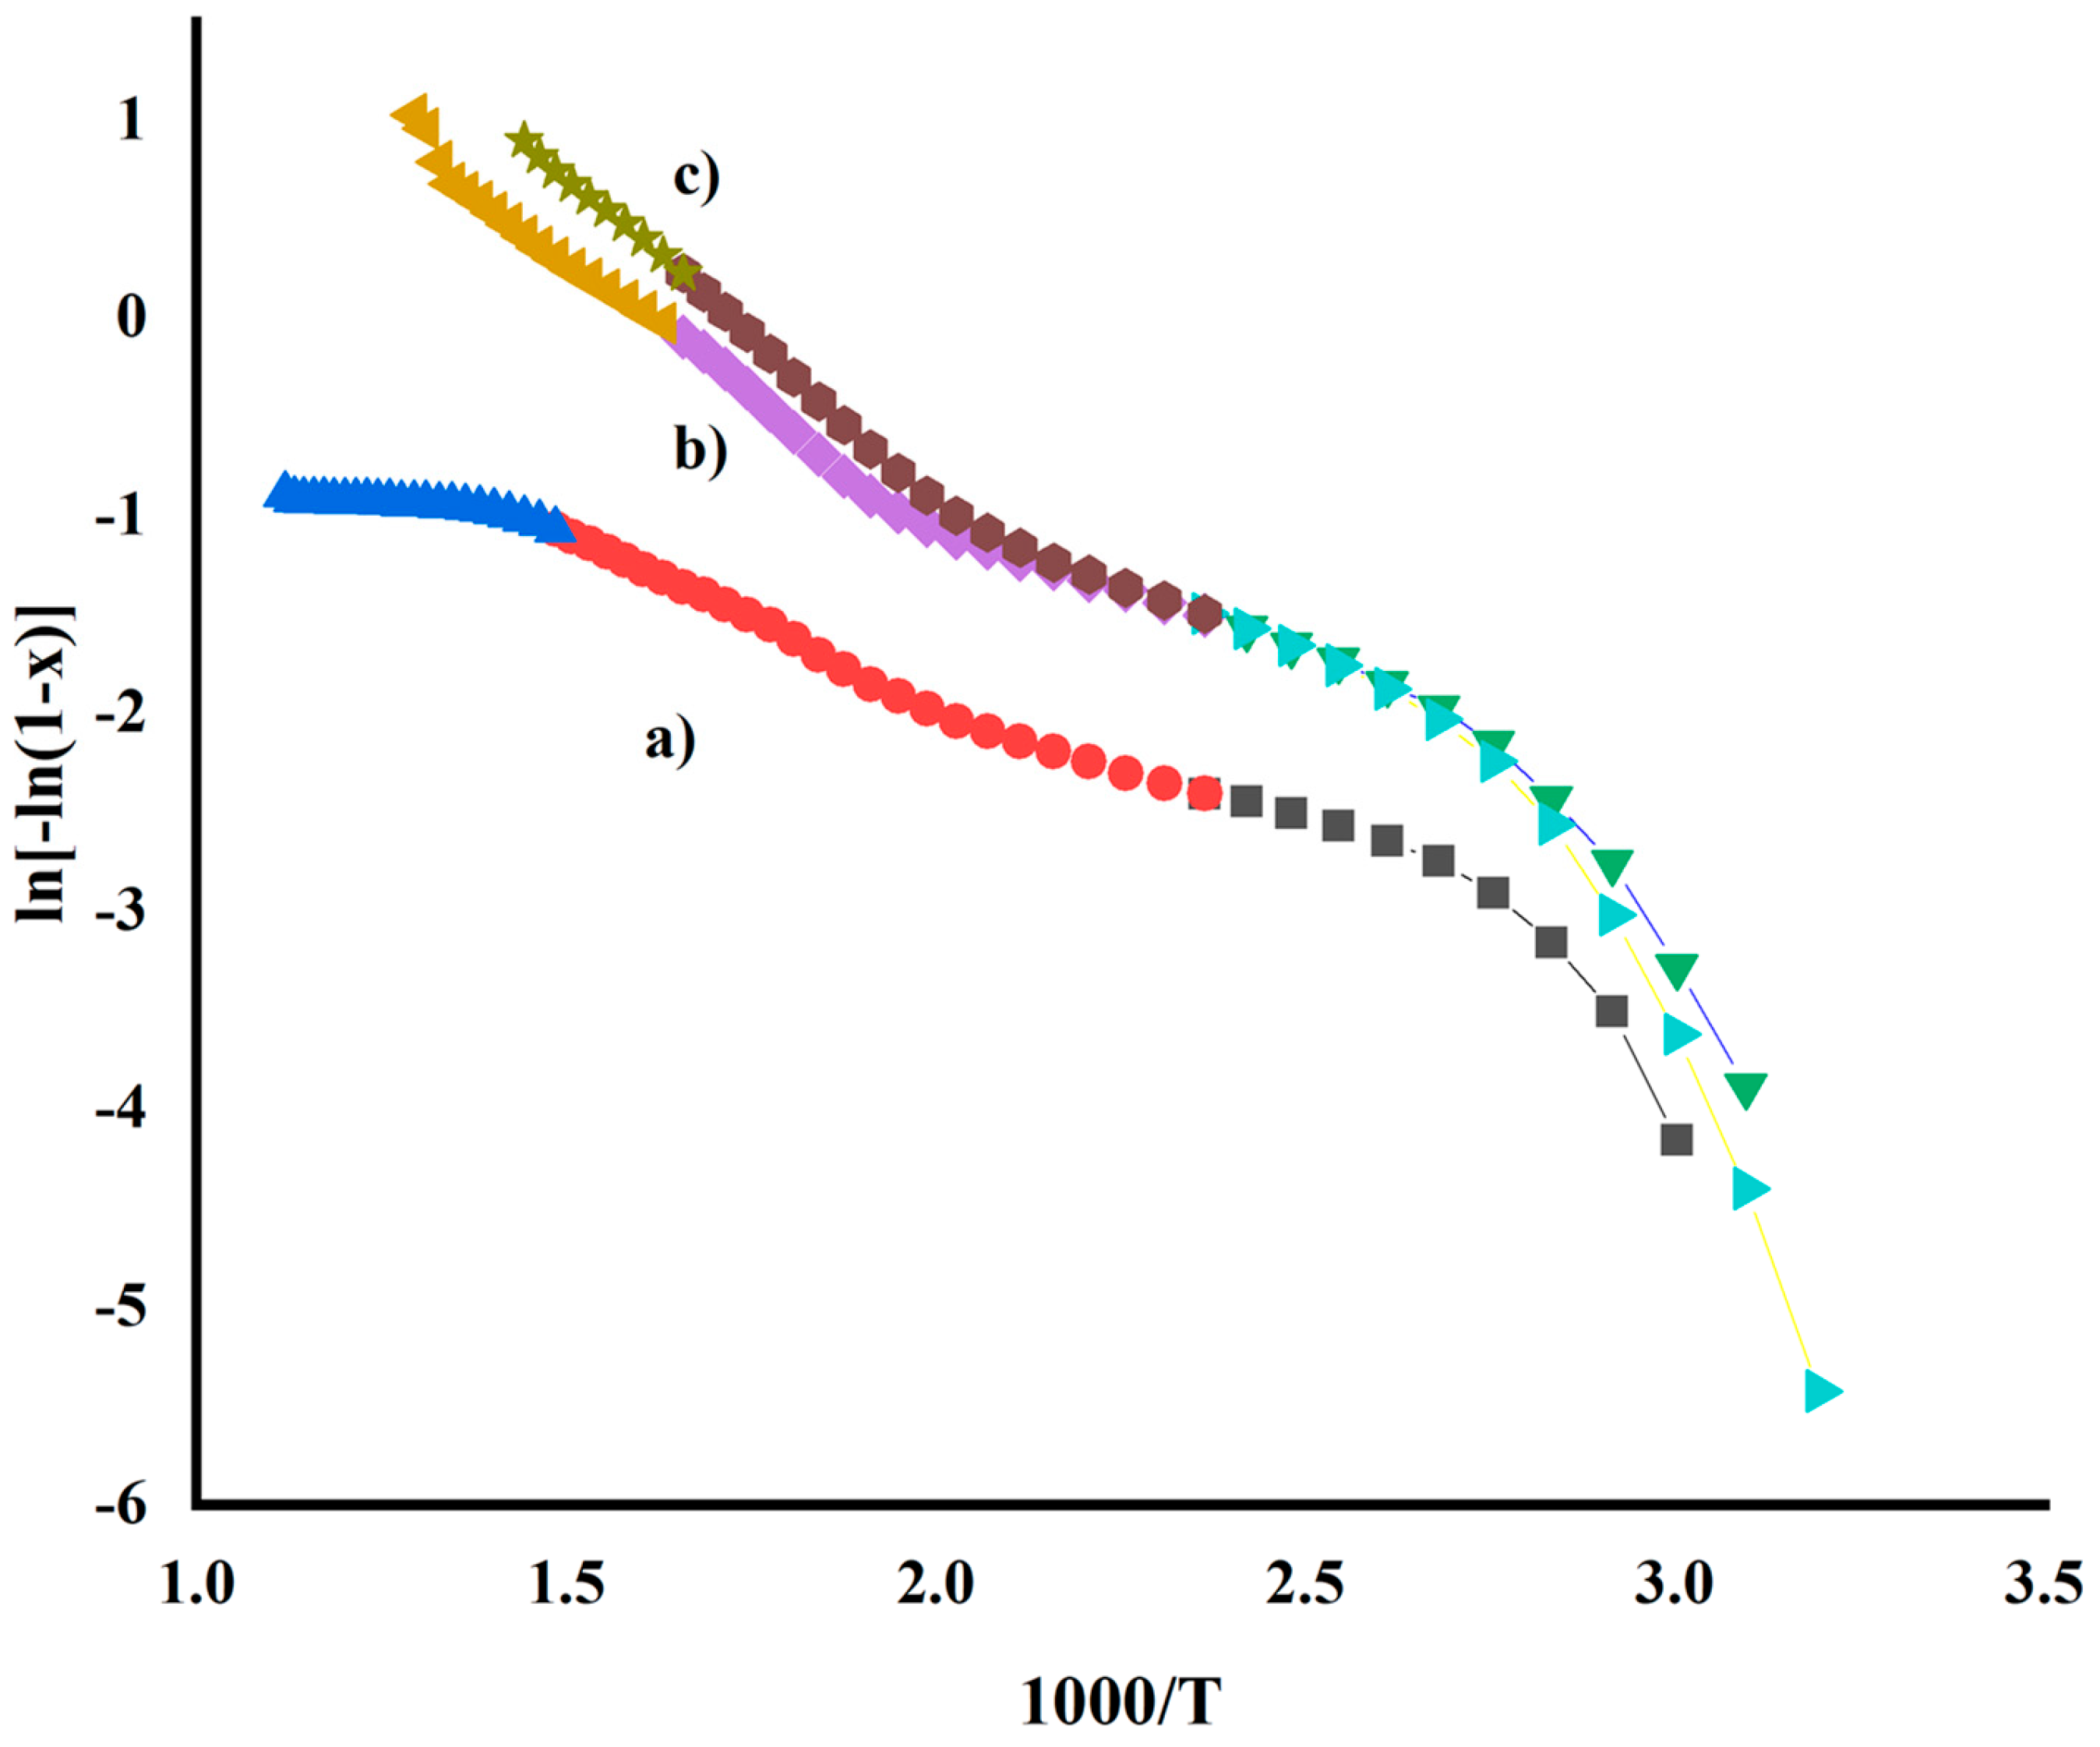
2.2. Thermogravimetric/Differential Scanning Calorimetric Analysis

The thermal degradation of FeSnO2 nanocomposites synthesized using the sol-gel and green methods was investigated via thermogravimetric analysis. To determine the volatiles emitted when samples were heated to temperatures between 50 and 600 °C, the samples were heated at a rate of 20 °C per minute. The total percentage weight loss observed was 24%, 33% and 27% for FeSnO2 nanocomposites synthesized using the sol-gel and green methods employing Lawsonia inermis and Phyllanthus embillica leaf extracts, respectively (Figure 3a–c). The lowest weight loss was observed when using the sol-gel method, while the highest weight loss was observed when using the green method employing Lawsonia inermis leaf extract due to the adsorption of phytochemicals at the surface of the FeSnO2 nanocomposite. In the TGA curve, three stages are observed, namely dehydration, decarboxylation and condensation, in which the removal of surface water, CO2 and structurally bonded water take place, respectively.
First-order reaction theory was used to estimate the kinetic parameters (Equation (5)) [17]. The energy of activation and other various thermodynamic parameters were calculated for sol-gel- and green-synthesized FeSnO2 nanocomposites using Lawsonia inermis and Phyllanthus embillica leaf extracts, as shown in Table 2.
dx dt = k 1 x
where
x = w i w t w i w f
where wi is the original weight, wt is the weight at any specific time and wf is the final weight of the sample. Equation (5) may be written as
ln 1 x = kt
The graph between ln(1 − x) and time is plotted in Figure 4. The straight line confirmed that all transformation phases were first-order reactions. Equation (7) was used to produce a graph, and the slope of each line represented the value of the rate constant (k). Equation (8) was used to calculate half-life.
t 1 / 2 = 0.693 k
Thermodynamic characteristics of all the samples were determined using the modified Coats and Redfern model, as indicated in Equation (9).
ln ln 1 x = ln ART 2 β E a E a RT
where T is the absolute temperature, R is the general gas constant (8.3143 Jmol−1 K−1), A is the pre-exponential factor, and the heating rate is 20 °C per minute. We may determine the energy of activation by charting the graph between ln[−ln(1 − x)] and 1000/T for each phase (Figure 5).

2.3. X-ray Diffraction Analysis and Phase Determination

Synthesized FeSnO2 and its structure and phase were studied using XRD analysis and the PAN-analytical library (high score on X’Pert). All of the XRD patterns of FeSnO2 are given in Figure 6. The diffractogram of FeSnO2 synthesized via the sol-gel method is presented in Figure 6a. The diffraction peaks obtained at 2θ values of 26.67°, 37.95°, 51.78°, 65.97° and 78.26° correspond to the tetragonal structure of SnO2, having lattice planes of (110), (200), (211), (301) and (320), respectively. The rest of the peaks at 26.8° and 33.8° correspond to the rutile structure of SnO2, with lattice planes of (110) and (101), respectively (JCPDS data card No. 41-1445) [41]. The peak at 44° corresponds to hexagonal Fe2O3 with an hkl value of (111) [42]. Figure 6b,c show the XRD patterns of FeSnO2 nanocomposites synthesized by using Lawsonia inermis and Phyllanthus embillica leaf extracts. Both samples showed almost identical patterns of diffraction peaks. A sharp and prominent peak at a 2θ value of 44.5° and a small peak at 65.9° were observed in both diffractograms (Figure 6b,c). This corresponds to well-defined pure cubic Fe (0) with lattice planes of (111) and (200), respectively (JCPDS data card No. 01-085-1410) [22,29].
The comparison of the XRD of FeSnO2 synthesized by using the sol-gel method and green synthesis with Lawsonia inermis and Phyllanthus embillica leaf extracts shows that plant polyphenols have been proven to be efficient in reducing Fe3+ to Fe0, as shown in Figure 6b,c while the nanocomposite constructed via the sol-gel method showed the existence of Fe2O3. No separate peak of the FeSnO2 nanocomposite is shown in the diffractogram because Fe0 and Fe3+ present in the FeSnO2 nanocomposite are smaller in size as compared to the Sn4+ ions and may be incorporated into the Sn4+ ion sites in the SnO2 crystal lattice in a coordinated manner, without altering the structure of the original SnO2 [42].
Scherrer’s Equation (10) was used to calculate crystallite size.
d = k   λ β cos θ
where k is a constant with a value of 0.98, β is the peak’s FWHM at a certain diffraction angle, and λ is the wavelength of the X-rays that were blasted (0.154 nm). The FeSnO2 nanocomposites synthesized via the sol-gel method and green synthesis employing leaf extracts of Lawsonia inermis and Phyllanthus embillica yielded crystallite sizes of 9.32, 1.01, and 4.2 nm using Scherrer’s Equation, respectively. Using the Williamson–Hall Equation, the average crystallite size and strain ε were also determined, as shown in Equation (11).
β cos θ = 4 ε sin θ + k λ d
where d is the average crystallite size and ε is the lattice strain calculated from the slope [43]. The strain present in the FeSnO2 nanocomposites synthesized via the sol-gel method and green synthesis using Lawsonia inermis and Phyllanthus embillica leaf extracts was calculated as being 0.012, 4.2 × 10⁻³, and 9.5 × 10⁻³, respectively. Small values of strain indicate the broadening of peaks due to small size [44]. Values of both sizes and strains are reported in Table 3. The number of flaws in a crystal per unit volume is known as the δ. It is directly related to crystal hardness. With a decrease in crystallite size, the dislocation density increases. This can be calculated by using Equation (12).
δ = 1 D 2
where D is the crystallite size in nm.
The specific surface area is the area occupied by 1 g of a sample and depends on the size of the nanocomposite. A smaller size leads to greater SSA. It can be determined by using Equation (13).
SSA = 6 × 10 3 D × ρ
where D is the crystallite size and ρ is the density of the nanocomposite.
W-H is the size assessed using the Williamson–Hall Equation and SEM is the size calculated using a scanning electron microscope.

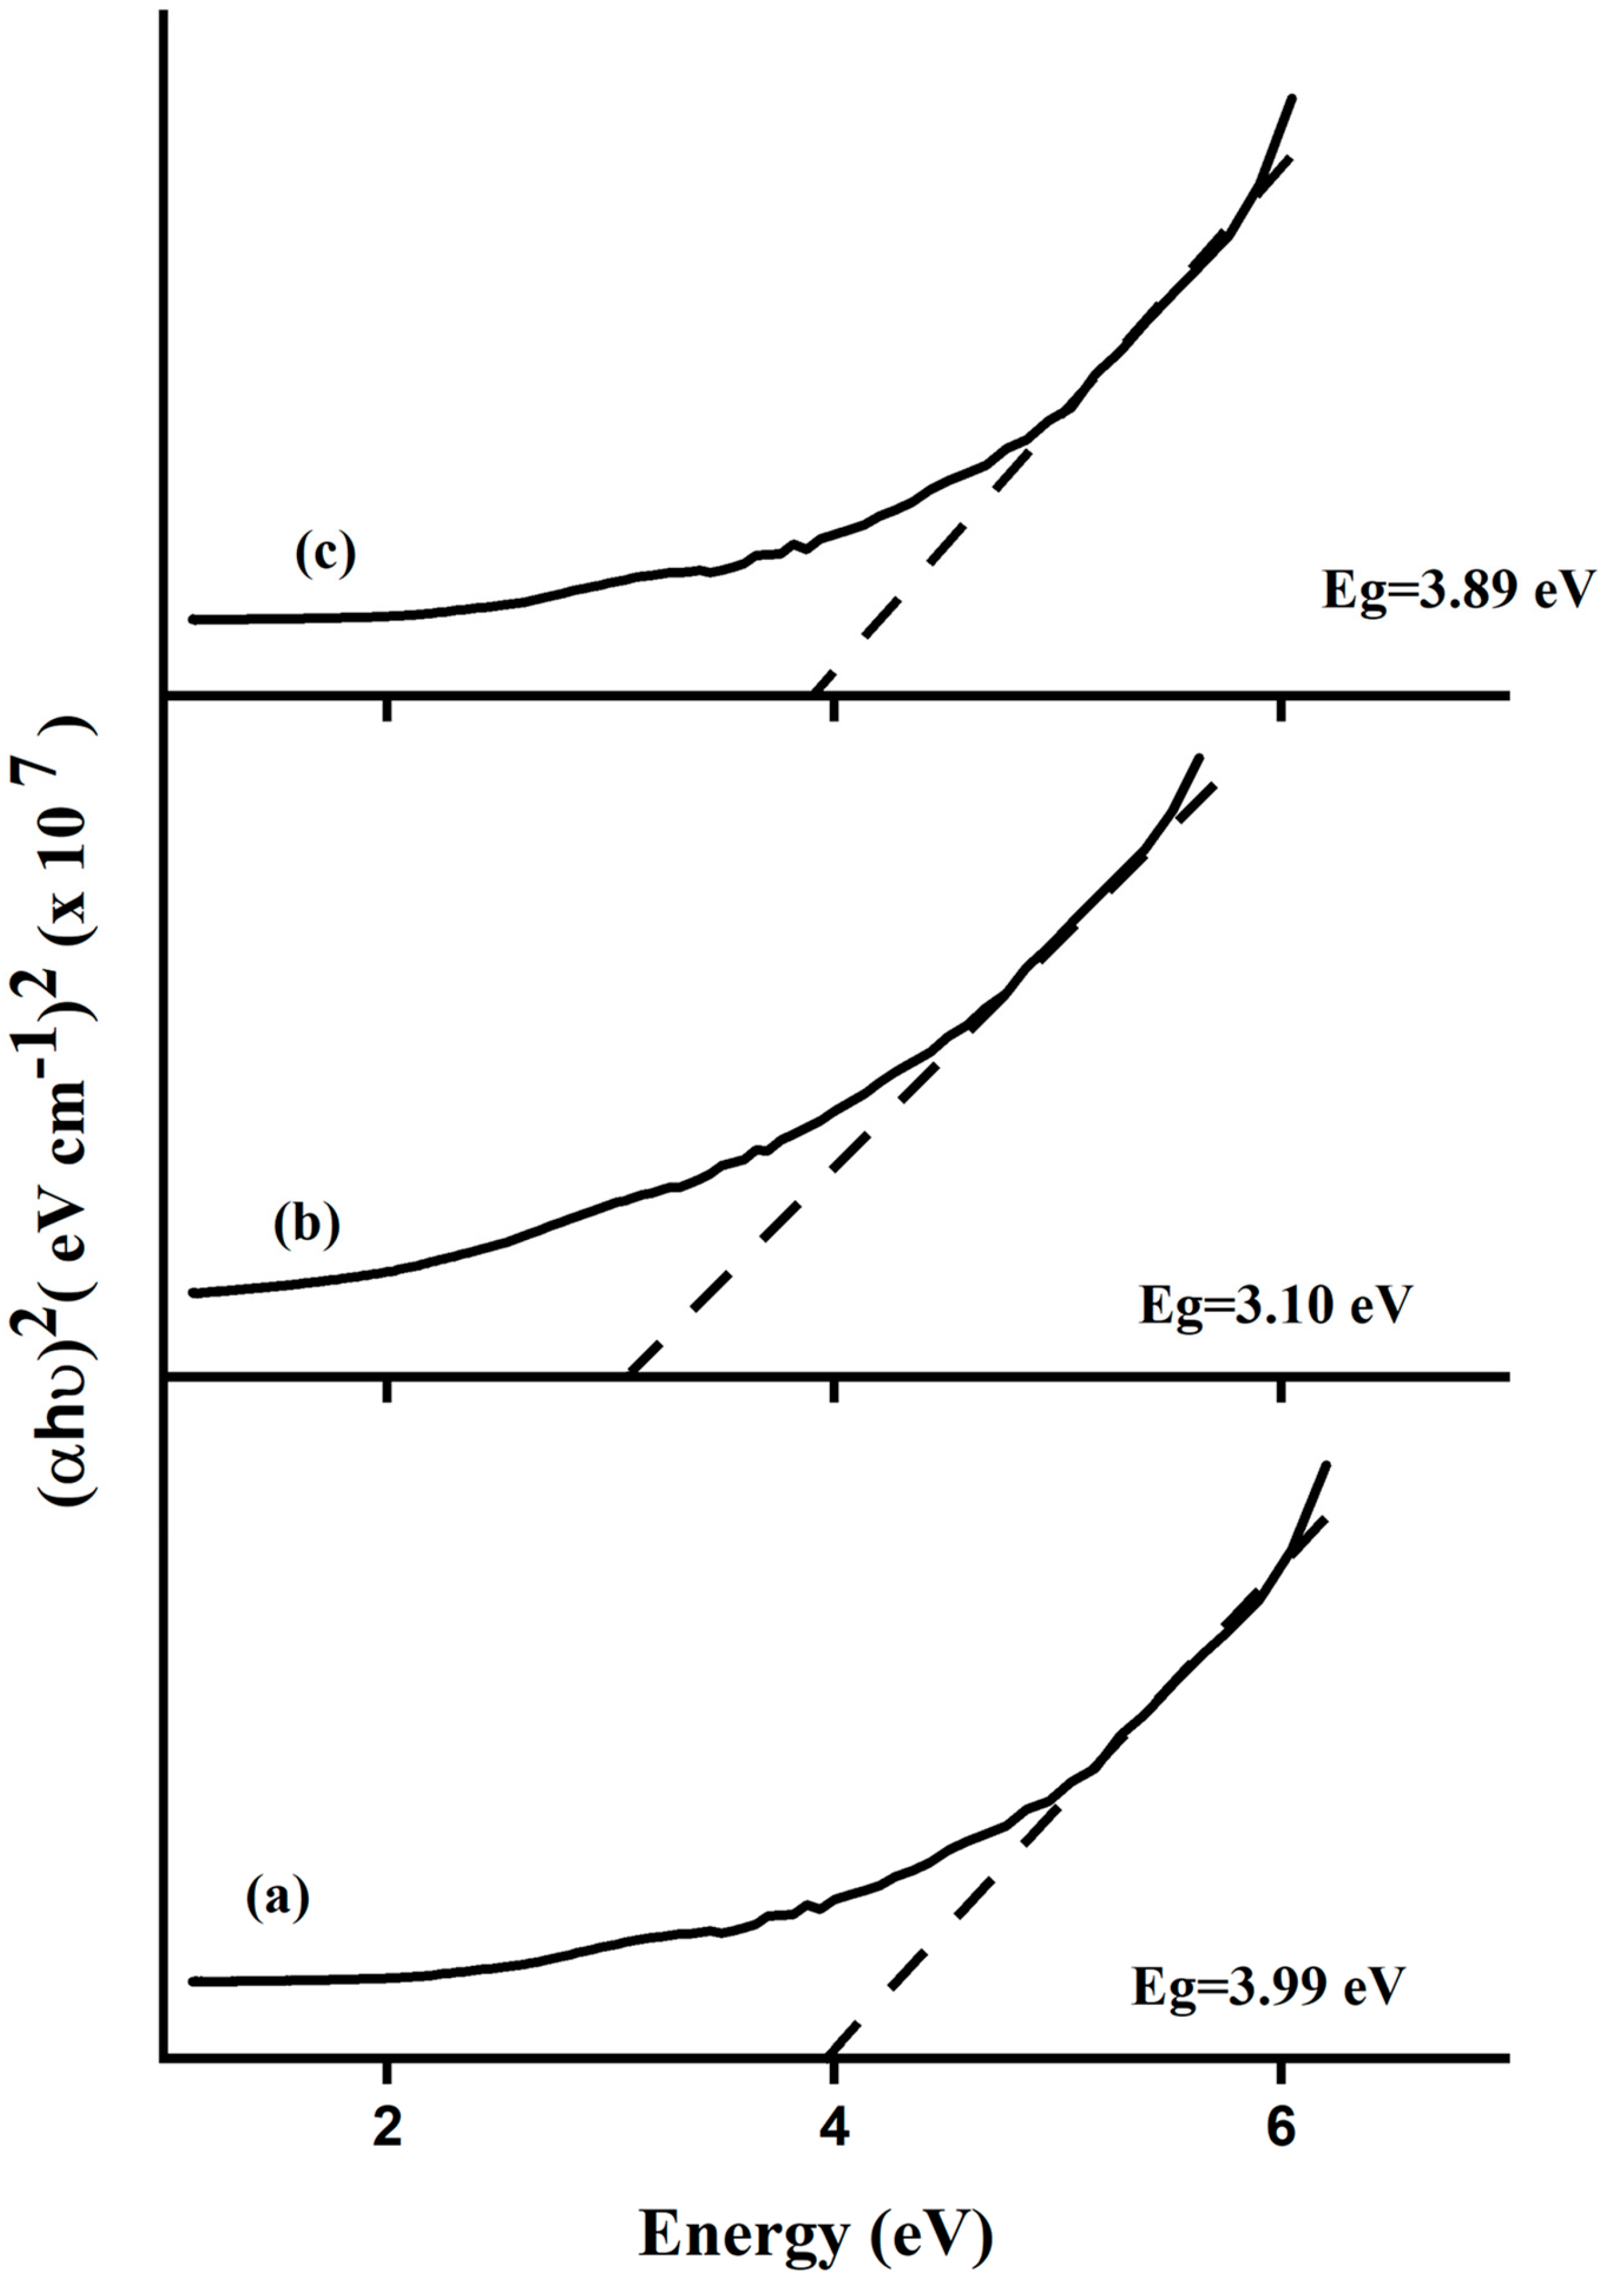
2.4. Optical Studies

Optical properties were studied by using a UV-visible spectrophotometer. The band gap of the FeSnO2 nanocomposite synthesized from the sol-gel method and green methods using Lawsonia inermis and Phyllanthus embillica leaf extracts was determined by using the Wood and Tauc equation (14).
h ν 1 / n = A h ν E g
where the exponent n values for the direct authorized, indirect allowed, directly prohibited, and indirect forbidden transitions, respectively, are 1/2, 2, 3/2, and 3. The absorption coefficient, which may be computed using Equation (15), α, is cms, where hv is the energy in eV.
= 2.303 × 1000 × ρ l × c × M × A
where ρ is the theoretical density of SnO2 (6.95 gcm−3) [43] and Fe (7.86 gcm−3) [44], A is the absorbance, l is the path length (1 cm), c is the concentration in moles cm−1 and M is the molar mass of the composite in g mol−1.
The band gaps in Figure 7 were calculated for the direct allowed transition by using the Wood and Tauc Equation (15) as 3.99, 3.10 and ~3.89 eV, respectively. The band gap of chemically and thermally synthesized FeSnO2 as reported in the literature lies in the range of (3.52–3.69 eV) [33]. When green-generated FeSnO2 nanocomposites were compared with those synthesized using the sol-gel technique, a red shift in the band gap was observed. The lowest value of the band gap was observed for the FeSnO2 nanocomposite synthesized via the green method by using Lawsonia inermis leaf extract (3.10 eV).

2.5. SEM and EDX Analyses

SEM-EDX analysis was used to study surface morphology and elemental analysis. Porous sheath-like tetragonal rutile and distorted hexagonal structures were observed for the FeSnO2 nanocomposites synthesized by using the sol-gel methods and green methods employing Lawsonia inermis and Phyllanthus embillica leaf extracts (Figure 8a–c). Each element’s weight percentage was calculated using EDX analysis. The theoretical weight percentage of major species was found to be 33.2, 13.5 and 48.2% for Fe, Sn and O, respectively, for FeSnO2 synthesized via the sol-gel method. Meanwhile, 36.1, 10.2, 50.1 and 2.1% Fe, Sn, O and C, respectively, were detected in FeSnO2 synthesized via the green method using Lawsonia inermis leaf extract, and 33.81, 47.44, 18.12 and 2.8% Fe, Sn, O and C, respectively, were present in FeSnO2 synthesized via the green method using Phyllanthus embillica leaf extract. Elemental analysis shows the presence of iron, tin and oxygen in all of the samples at different ratios (Figure 9d–f). This may be related to the different abilities of each plant extract to reduce or stabilize metals and metal oxides.

2.6. Photocatalytic Studies

The photocatalytic studies present the higher photocatalytic activity of FeSnO2 synthesized via the green method using Lawsonia inermis leaf extract for the degradation of both MB and CV through exposure to natural sunlight in comparison (Table 4) to FeSnO2 synthesized using Phyllanthus embillica leaf extracts and the sol-gel method, as shown in Figure 9 and Figure 10. The results show that the FeSnO2 nanocomposite synthesized via the sol-gel method exhibited 66% and 75% photocatalytic efficiency for the degradation of MB and CV dyes, respectively, whereas the FeSnO2 nanocomposites synthesized using the green method using Lawsonia inermis and Phyllanthus embillica leaf extracts showed 76% and 69% degradation efficiency for MB, and 84% and 81% degradation efficiency for crystal violet, respectively. The decreasing trend of the photocatalytic activity of FeSnO2 synthesized via different routes for the degradation of MB and CV is given below:
FeSnO2 synthesized using Lawsonia inermis ˃ FeSnO2 synthesized using Phyllanthus embillica ˃ FeSnO2 synthesized using the sol-gel method.
The highest degradation of both MB and CV dyes was observed for the FeSnO2 nanocomposite synthesized with the green method by using Lawsonia inermis leaf extract, displaying a small band gap energy of 3.1 eV, while the lowest degradation was shown for the FeSnO2 nanocomposite synthesized via the sol-gel method, displaying the highest band gap energy of 3.99 eV. This higher degradation efficiency demonstrated by FeSnO2 synthesized using the green method using Lawsonia inermis is attributed to the role of polyphenols present in the extract in reducing the metal ions and the stabilization of the prepared nanocomposite, which will ultimately affect the composition of the photocatalyst and then the surface morphology of the materials as shown in Figure 8. Moreover, the enhanced activity is also attributed to the shifting of the band gap to a lower energy, as shown in Figure 7. As illustrated in Figure 11 and Figure 12, the Langmuir–Hinshelwood kinetic model for pseudo-first-order processes was used to predict the rates of CV and MB degradation. A deviation from the model was observed for all photocatalysts for the removal of MB, while the rate increased linearly in the first 60 min of sunlight exposure for the degradation of CV.
The mechanism of degradation of MB and CV can be explained by using FeSnO2 under solar light photocatalysis. Due to exposure to solar light, FeSnO2 nanocomposites produced electrons (e and holes (h+) in the conduction band (CB) and valance band (VB), respectively, during photocatalysis. While the photogenerated electrons combined with the adsorbed oxygen molecule to make superoxide radical anions, which then reacted with the protons to produce the hydroperoxyl radical, the hole (h+) oxidized the water or hydroxyl ions to produce OH free radicals. The following equations explain the mechanism of photodegradation of dyes under the illumination of natural sunlight:
FeSnO2 + Sunlight → FeSnO2 (eCB + hVB+)
FeSnO2 (h VB+) + H2O → FeSnO2 + H++ OH
FeSnO2 (hVB+) + OH → FeSnO2 + OH
FeSnO2 (eCB) + O2 → FeSnO2 + O2
O2 + H+OH
OH + Dye (MB or CV) → Degradation product
To investigate the involvement of reactive oxygen species such as hydroxyl (OH) free radicals and superoxide anion (O2) radicals responsible for the degradation of organic pollutants, p-benzoquinone and isopropyl alcohol were added under the same conditions as in the photocatalytic dye degradation experiment to trap O2 and OH [45]. Upon the addition of p-benzoquinone, no significant effect was noted in the degradation of MB and CV, whereas the degradation of these dyes was reduced significantly with the addition of isopropyl alcohol. It is inferred from this investigation that the photocatalytic degradation of CV and MB by FeSnO2 synthesized using the green method using Lawsonia inermis leaf extract is mainly due to OH instead of superoxide anion (O2) radicals [45].
Moreover, the FT-IR spectra of dyes after 60 and 120 min of sunlight exposure in the presence of the FeSnO2 nanocomposite synthesized from Lawsonia inermis leaf extract during the degradation process were recorded to establish the existence of new functional groups which further justify the degradation process. Figure 13a shows a band in the region of 1500–1700 cm−1 depicting the aromatic ring structure and showing C=C stretching diminishing gradually until 2 h. It is evident from Figure 13a that in the case of degraded MB, the above-mentioned peaks are absent, while the appearance of a small peak in the region of 1000–1100 cm−1 shows the formation of a new fragment [46]. The peak at 3400–3500 cm−1 in the CV FTIR spectrum (Figure 13b) is ascribed to the stretching vibration of the hydroxyl group. N-H bending vibrations are represented by the bands that can be seen at 1640 cm−1. A decrease in the intensity of these peaks after 2 h shows the efficiency of the FeSnO2 nanocomposite synthesized from Lawsonia inermis leaf extract [47].

2.7. Mechanism of the Green Synthesis of FeSnO2 Nanocomposites

The understanding of the nanocomposite production process depends heavily on electrochemistry. The green synthesis of NPs takes place according to the redox potential values of polyphenols and metal precursor ions. Polyphenols show redox potential in the range of 0.3–0.8 V (Equation (22)). This redox potential can reduce certain metals in specific oxidation states, but not all metals. To synthesize FeSnO2, it is sufficient to only reduce Fe3+ to Fe2+ (the redox potential of Fe3+ to Fe2+ is 0.771 V), but not to Fe (0), as its redox potential is more negative (−0.44 V) [48,49]. However, plant polyphenol anions have a different tendency. Different polyphenol anions (Ar-O1−/Ar-O2−) have redox potential values that vary from −0.88 to −1.81 V, which is more adverse than the redox potential of Fe metal (−0.44 V). This opens up the possibility for the reduction of Fe3+ and Fe2+ to Fe0 [49]. Meanwhile, the redox potential of Sn is less negative than the redox potential of polyphenols, and so it will not be reduced, as shown in Equations (23)–(28) [43].
Ar OH + e   Ar O   E 0 = + 0.3   to + 0.8   V  
Ar O + e   Ar O 2   E 0 = 0.88   to 1.81   V  
Fe 2 + + 2 e   Fe 0   E 0   = 0.447   V
Fe 3 + + 3 e   Fe 0   E 0   = 0.03   V
Fe 3 + + e   Fe 2 +   E 0   = + 0.771   V
Sn 4 + + 2 e Sn 2 +   E 0 = + 0.15   V  
Sn 2 + + 2 e Sn E 0 = 0.14   V  
Polyphenol anions are generated by treating NaOH with plant extract (Figure 14). In an alkaline environment, the deprotonation of polyphenols takes place and the resulting phenolate ions act as a complexing and reducing agent for iron ions (Figure 14) [49]. Gallic acid [50], ellagic acid, ascorbic acid, chebulic acid, chebulinic acid, amlic acid, chebulagic acid, phyllantidine and alkaloids phyllantine are the major phytochemicals reported in the aqueous extract of Phyllanthus embilica leaf extract [43]. The aqueous extract of Lawsonia inermis leaves is a rich source of 2-hydroxy-1:4 napthaquinone, glucose, gallic acid, and mannitol [51]. These phytochemicals are believed to be involved in the synthesis and stabilization of NPs (Table 5).
In this study, the role of different methods (the sol-gel and green methods) in the synthesis of FeSnO2 nanocomposites has been investigated. Furthermore, the mechanism of synthesizing metal/metal oxide (FeSnO2) nanocomposites has been explained.

2.8. XPS Analysis

To ascertain the surface compositions and chemical states of the FeSnO2 composite, XPS measurements were also carried out. The high-resolution XPS spectra of the Fe 2p regions of the FeSnO2 sample before and after the photocatalytic process are shown in Figure 15a. The Fe 2p of metallic Fe is responsible for the peak at 706.31 in the spectra of Fe, which indicates the existence of a zero-valent Fe. Two peaks in the Sn 3d deconvoluted spectra were found at binding energies of 487.27 and 495.63 eV, which were associated with the 3d5/2 and 3d3/2 Sn4+ ions in FeSnO2 (Figure 15b), respectively. Two peaks at 531.2 and 532.61 eV are shown in Figure 15c, and they are taken from the high-resolution XPS spectra of the O 1s state in the FeSnO2 composite. We can demonstrate that Fe is present in Fe0 and Sn is present in Sn4+ in the FeSnO2 composite by combining the XPS and XRD data.

3. Experimental Details

3.1. Chemicals and Reagents

Sigma Aldrich (St. Louis, MO, USA) was utilized to acquire the FeCl3 · 6H2O, SnCl4 · 5H2O, and NaOH, which were used directly after purchase with no further purification. The plant extract and all of the solutions were prepared using deionized water. A Medilab hot plate (Medilab, Karachi, Pakistan) was used for stirring and the maintenance of temperature.

3.2. Preparation of Plant Extract

The fresh leaves of Lawsonia inermis (Henna) and Phyllanthus embilica (Amla), presented in Figure 16, were collected from the botanical garden at Forman Christian College (a chartered university), Lahore, Pakistan. To eliminate surface dirt, leaves were thoroughly cleaned in deionized water followed by drying in the shade for a week. An industrial crusher was used to crush leaves and a fine powder was obtained after passing through a mesh. Then, 2 g of the dry powder was added to 50 mL of deionized water and was stirred on a hotplate at 60 °C for two hours. The extract was filtered and kept in a refrigerator at 4 °C until use in other experiments [21,22].

3.3. Synthesis of FeSnO2 Nanocomposite

Two methods were used for the synthesis of the FeSnO2 nanocomposites.

3.3.1. FeSnO2 Nanocomposite Synthesis via Sol-Gel Technique

In a typical synthesis, a 10 mL equimolar (0.1 M) solution of FeCl3 · 6H2O and SnCl4 · 5H2O was prepared and mixed in a 250 mL beaker. Then, a 0.1 M solution of NaOH was added to the above mixture with a feed rate of 2 mL every 5 min with constant stirring at 60 °C until a pH of 8 was attained. After being rinsed with deionized water for neutralization, the precipitated material was separated by means of centrifugation at 10,000 rpm. The final viscous product was kept in an oven at 100 °C for drying and calcined at 450–620 °C for two hours in a Ney Vulcan muffle furnace and stored in an airtight vial for characterization. Moreover, Table 6 displays specific sample preparation information.

3.3.2. Green Route for the Synthesis of FeSnO2 Nanocomposite

The 50 mL plant extract as prepared above was poured into the precursor solution at a feed rate of 2 mL every 5 min with vigorous stirring at 60 °C. The pH of the reaction was maintained at 8 by using NaOH. The precipitated mass was centrifuged, washed, dried, and calcined at 450–620 °C and stored in an airtight vial for characterization.

3.4. Characterization Techniques

The optical characteristics and photocatalytic degradation of MB and CV were calculated using spectroscopic analysis and an ultraviolet (UV visible) spectrophotometer. The optical band gap was determined by dispersing the product in deionized water. The 0.02 M product was sonicated in a Fisher Scientific Sonicator (Fisher Scientific, Waltham, MA, USA). Cary 630 Agilent technologies (Agilent, Santa Clara, CA, USA) and Bruker Alpha II (Bruker, Billerica, MA, USA) were used for FTIR analysis at room temperature. SDT Q 600 (TA Instruments, New Castle, DE, USA) was used for thermal gravimetric analysis (TGA) to determine the thermal decomposition of the synthesized product at a rate of 20 °C/min in a nitrogen environment. A Shimadzu (LabX XRD-6000) X-ray diffractometer (Shimadzu, Kyoto, Japan) was used to determine XRD patterns by using Cu Kα radiation (λ = 631 nm). Elemental analysis and the morphology of the samples were investigated using a Hitachi (S-3400N, Tokyo, Japan) SEM fitted with an energy-dispersive X-ray spectroscopy detector.

3.5. Photocatalytic Activity

The FeSnO2 nanocomposite’s photocatalytic activity was tested against MB and CV. In this process, 20 mg each of FeSnO2 synthesized using the sol-gel and green methodologies were dispersed by using a magnetic stirrer in 25 mL of a 20 ppm aqueous solution of MB dye. The photocatalytic activity was conducted under the illumination of natural sunlight (830 ± 50 × 102 lx) during August 2022 for a fixed period from 10:00 am to 12:00 pm at 27 ± 3 °C. To achieve adsorption–desorption equilibrium before being exposed to sunlight, the solution was kept in the dark for 30 min. The adsorption capacity was then determined using the technique described by Sameera et al. [55]. A similar procedure was followed for the degradation of CV. The degradation efficiency of the FeSnO2 nanocomposite was observed by measuring absorbance at λ-max 664 and 584 nm for MB and CV, respectively, using Equation (29).
η % = 1 A t A 0 × 100
where At is the absorbance at any moment, A0 is the initial dye absorbance, and ƞ is the degradation efficiency in percent.

4. Conclusions

FeSnO2 nanocomposites were successfully synthesized by using the sol-gel method and green methods using Lawsonia inermis and Phyllanthus embillica leaf extracts. Tetragonal rutile and distorted hexagonal structures were observed for the FeSnO2 nanocomposite synthesized by using the sol-gel method, while modified tetragonal rutile and distorted hexagonal structures were observed in SEM images of the FeSnO2 nanocomposite synthesized using the green method using Lawsonia inermis leaf extract. The crystallite size determined by using Scherer’s formula was 29.49, 14.54, and 20.43 nm, respectively, while the average crystallite size calculated by using the Williamson–Hall equation was observed as being 20.85, 11.30, and 14.86 nm for the composites synthesized by using the sol-gel method and green methods using Lawsonia inermis and Phyllanthus embillica leaf extracts, respectively. The band gap was determined to be 3.99 eV, 3.10 eV and 3.89 eV with a percentage degradation of 66, 76 and 69% for MB and 75, 84 and 81% for crystal violet for the FeSnO2 nanocomposites synthesized using the sol-gel method and green methods using Lawsonia inermis and Phyllanthus embillica leaf extracts, respectively. Among the synthesized photocatalysts, the FeSnO2 nanocomposite synthesized using the green method using Lawsonia inermis leaf extract was found to be efficient, with a band gap energy of 3.10 eV, well-defined small crystallites, and high percentage degradation of MB and crystal violet. Moreover, photocatalytic studies reveal the degradation of dyes by hydroxy radicals instead of superoxide anion radicals. No toxic chemicals or surfactants were used during the synthesis process, and thus the procedure was found to be green and sustainable.

Author Contributions

Conceptualization, writing-original draft Preparation, A.S. and M.A.F.; methodology, software, acquisition of data, formal analysis, K.-K.C. and R.N.; validation, performed major experimental works, supervision, M.T.Q. and S.I.; reviewed original manuscript, acquisition of funding and critical revision, N.S.A. and H.A.I. All authors have read and agreed to the published version of the manuscript.

Funding

The authors extend their appreciation to the Deanship of Scientific Research at King Khalid University for supporting this work through research groups program under grant number RGP.2/273/44.

Data Availability Statement

The datasets generated during and/or analyzed during the current study are available from the corresponding author upon reasonable request.

Acknowledgments

The authors extend their appreciation to the Deanship of Scientific Research at King Khalid University for supporting this work through research groups program under grant number RGP.2/273/44.

Conflicts of Interest

The authors declare no conflict of interest.

References

  1. Din, M.I.; Khalid, R.; Najeeb, J.; Hussain, Z. Fundamentals and photocatalysis of methylene blue dye using various nanocatalytic assemblies—A critical review. J. Clean. Prod. 2021, 298, 126567. [Google Scholar] [CrossRef]
  2. Šafařı, I.; Šafařı, M. Detection of low concentrations of malachite green and crystal violet in water. Water Res. 2002, 36, 196–200. [Google Scholar] [CrossRef] [PubMed]
  3. Fosso-Kankeu, E.; Waanders, F.; Geldenhuys, M. Impact of nanoparticles shape and dye property on the photocatalytic degradation activity of TiO2. Int. J. Sci. Res. 2016, 5, 528–535. [Google Scholar]
  4. Roy, M.; Saha, R. Dyes and their removal technologies from wastewater: A critical review. Int. J. Health Policy Manag. 2015, 2, 160–166. [Google Scholar]
  5. Dutta, K.; Mukhopadhyay, S.; Bhattacharjee, S.; Chaudhuri, B. Chemical oxidation of methylene blue using a Fenton-like reaction. J. Hazard. Mater. 2001, 84, 57–71. [Google Scholar] [CrossRef]
  6. Soltani, N.; Saion, E.; Hussein, M.Z.; Erfani, M.; Abedini, A.; Bahmanrokh, G.; Navasery, M.; Vaziri, P. Visible light-induced degradation of methylene blue in the presence of photocatalytic ZnS and CdS nanoparticles. Int. J. Mol. Sci. 2012, 13, 12242–12258. [Google Scholar] [CrossRef]
  7. Panimalar, S.; Uthrakumar, R.; Selvi, E.T.; Gomathy, P.; Inmozhi, C.; Kaviyarasu, K.; Kennedy, J. Studies of MnO2/g-C3N4 hetrostructure efficient of visible light photocatalyst for pollutants degradation by sol-gel technique. J. Surf. Interfaces 2020, 20, 100512. [Google Scholar] [CrossRef]
  8. Chikhale, L.; Shaikh, F.; Mulla, I.; Suryavanshi, S. Synthesis, structural and optical properties of Fe-doped nanocrystalline SnO2. J. Mater. Sci. Mater. Electron. 2017, 28, 12063–12069. [Google Scholar] [CrossRef]
  9. Zhou, C.; Lai, C.; Huang, D.; Zeng, G.; Zhang, C.; Cheng, M.; Hu, L.; Wan, J.; Xiong, W.; Wen, M. Highly porous carbon nitride by supramolecular preassembly of monomers for photocatalytic removal of sulfamethazine under visible light driven. Appl. Catal. B 2018, 220, 202–210. [Google Scholar] [CrossRef]
  10. Zhang, Z.; Ma, Y.; Bu, X.; Wu, Q.; Hang, Z.; Dong, Z.; Wu, X. Facile one-step synthesis of TiO2/Ag/SnO2 ternary heterostructures with enhanced visible light photocatalytic activity. Sci. Rep. 2018, 8, 10532. [Google Scholar] [CrossRef] [Green Version]
  11. Divya, J.; Pramothkumar, A.; Hilary, H.; Jayanthi, P.J. Impact of copper (Cu) and iron (Fe) co-doping on structural, optical, magnetic and electrical properties of tin oxide (SnO2) nanoparticles for optoelectronics applications. J. Mater. Sci. Mater. 2021, 32, 16775–16785. [Google Scholar] [CrossRef]
  12. Wei, K.; Gu, X.Y.; Chen, E.Z.; Wang, Y.Q.; Dai, Z.; Zhu, Z.R.; Kang, S.Q.; Wang, A.C.; Gao, X.P.; Sun, G.Z.; et al. Dissymmetric interface design of SnO2/TiO2 side-by-side bi-component nanofibers as photoanodes for dye sensitized solar cells: Facilitated electron transport and enhanced carrier separation. J. Colloid Interface Sci. 2021, 583, 24–32. [Google Scholar] [CrossRef]
  13. Tennakone, K.; Bandara, J.; Bandaranayake, P.K.M.; Kumara, G.R.A.; Konno, A. Enhanced efficiency of a dye-sensitized solar cell made from MgO-coated nanocrystalline SnO2. Jpn. J. Appl. Phys. 2001, 40, L732. [Google Scholar] [CrossRef]
  14. Lee, J.S.; Sim, S.K.; Min, B.; Cho, K.; Kim, S.W.; Kim, S. Structural and optoelectronic properties of SnO2 nanowires synthesized from ball-milled SnO2 powders. J. Cryst. Growth 2004, 267, 145–149. [Google Scholar] [CrossRef]
  15. Li, G.; Fan, Y.; Hu, Q.; Zhang, D.; Ma, Z.; Cheng, Z.; Xu, J. Morphology and size effect of Pd nanocrystals on formaldehyde and hydrogen sensing performance of SnO2 based gas sensor. J. Alloys Compd. 2022, 906, 163765. [Google Scholar] [CrossRef]
  16. Liu, S.Y.; Wang, Q.; Ou, L.H.; Du, H.L.; Long, Y.; Zhen, W.J. Solid-Phase Synthesis of Non-metal (S, N)-Doped Tin Oxide Nanopowders at Room Temperature and its Photodegradation Properties for Wastewater of Biomass Treatment. J. Inorg. Organomet. Polym. Mater. 2022, 32, 2748–2762. [Google Scholar] [CrossRef]
  17. Khan, I.; Saeed, K.; Khan, I. Nanoparticles: Properties, applications and toxicities. Arab. J. Chem. 2019, 12, 908–993. [Google Scholar] [CrossRef]
  18. Messaadi, C.; Ghrib, T.; Jalali, J.; Ghrib, M.; Alyami, A.A.; Gaidi, M.; Silvan, M.M.; Ezzaouia, H. Synthesis and characterization of SnO2-TiO2 nanocomposites photocatalysts. Curr. Nanosci. 2019, 15, 398–406. [Google Scholar] [CrossRef]
  19. Zhang, J.; Rahman, Z.U.; Zheng, Y.; Zhu, C.; Tian, M.; Wang, D. Nanoflower like SnO2-TiO2 nanotubes composite photoelectrode for efficient photocathodic protection of 304 stainless steel. Appl. Surf. Sci. 2018, 457, 516–521. [Google Scholar] [CrossRef]
  20. Ahmed, I.A.; Hussein, H.S.; ALOthman, Z.A.; ALanazi, A.G.; Alsaiari, N.S.; Khalid, A. Green synthesis of Fe–Cu bimetallic supported on alginate-limestone nanocomposite for the removal of drugs from contaminated water. Polymers 2023, 15, 1221. [Google Scholar] [CrossRef]
  21. Ahmed, A.A.; Rizvi, Z.R.; Shahzad; Farrukh, M.A. Neodymium oxide nanoparticles synthesis using phytochemicals of leaf extracts of different plants as reducing and capping agents: Growth mechanism, optical, structural and catalytic properties. J. Chin. Chem. Soc. 2022, 69, 462–475. [Google Scholar] [CrossRef]
  22. Wanakai, S.I.; Kareru, P.G.; Makhanu, D.S.; Madivoli, E.S.; Maina, E.G.; Nyabola, A.O. Catalytic degradation of methylene blue by iron nanoparticles synthesized using Galinsoga parviflora, Conyza bonariensis and Bidens pilosa leaf extracts. SN Appl. Sci. 2019, 1, 1148. [Google Scholar] [CrossRef] [Green Version]
  23. Iram, F.; Farrukh, M. Transferring Nanotechnology Concept towards Business Perspectives; Daya Publishing House: New Delhi, India, 2015; pp. 165–183. [Google Scholar]
  24. Fresno, F.; Tudela, D.; Coronado, J.M.; Fernández-García, M.; Hungría, A.B.; Soria, J. Influence of Sn4+ on the structural and electronic properties of Ti1−x Snx O2 nanoparticles used as photocatalysts. Phys. Chem. Chem. Phys. 2006, 8, 2421–2430. [Google Scholar] [CrossRef]
  25. Jain, V.; Shah, D.; Sonani, N.; Dhakara, S.; Patel, N. Pharmacognostical and preliminary phytochemical investigation of Lawsonia inermis L. leaf. Rom. J. Biol.-Plant Biol. 2010, 55, 127–133. [Google Scholar]
  26. Mohamed, T.S.; Refahy, L.A.-G.; Romeih, M.H.; Hamed, M.M.; Ahmed, H.O.; El-Hashash, M.A.-A. Chromatographic Isolation and Characterization of Certain Bioactive Chemical Ingredients of Phyllanthus emblica Extracts and Assessment of Their Potentials as Antiviral and Anticancer Agents. Egypt. J. Chem. 2022, 65, 179–192. [Google Scholar] [CrossRef]
  27. Gupta, A.; Bonde, S.R.; Gaikwad, S.; Ingle, A.; Gade, A.K.; Rai, M. Lawsonia inermis-mediated synthesis of silver nanoparticles: Activity against human pathogenic fungi and bacteria with special reference to formulation of an antimicrobial nanogel. IET Nanobiotechnol. 2014, 8, 172–178. [Google Scholar] [CrossRef]
  28. Masum, M.M.I.; Siddiqa, M.M.; Ali, K.A.; Zhang, Y.; Abdallah, Y.; Ibrahim, E.; Qiu, W.; Yan, C.; Li, B. Biogenic synthesis of silver nanoparticles using Phyllanthus emblica fruit extract and its inhibitory action against the pathogen Acidovorax oryzae strain RS-2 of rice bacterial brown stripe. Front. Microbiol. 2019, 10, 820. [Google Scholar] [CrossRef]
  29. Naseem, T.; Farrukh, M.A. Antibacterial activity of green synthesis of iron nanoparticles using Lawsonia inermis and Gardenia jasminoides leaves extract. J. Chem. 2015, 2015, 912342. [Google Scholar] [CrossRef] [Green Version]
  30. Oda, Y.; Nakashima, S.; Kondo, E.; Nakamura, S.; Yano, M.; Kubota, C.; Masumoto, Y.; Hirao, M.; Ogawa, Y.; Matsuda, H. Comparison of lawsone contents among Lawsonia inermis plant parts and neurite outgrowth accelerators from branches. J. Nat. Med. 2018, 72, 890–896. [Google Scholar] [CrossRef]
  31. Elangovan, M.; Dhanarajan, M.; Elangovan, I.; Elangovan, M. Determination of bioactive compounds from the petroleum ether leaf extract of moringa oleifera and Phyllanthus emblica using GC-MS analysis. World J. Pharm. Res 2015, 4, 1284–1298. [Google Scholar]
  32. Huda, A.; Handoko, C.T.; Bustan, M.D.; Yudono, B.; Gulo, F. New route in the synthesis of Tin (II) oxide micro-sheets and its thermal transformation. Mater. Lett. 2018, 211, 293–295. [Google Scholar] [CrossRef]
  33. Perveen, H.; Farrukh, M.A.; Khaleeq-ur-Rahman, M.; Munir, B.; Tahir, M.A. Synthesis, structural properties and catalytic activity of MgO-SnO2 nanocatalysts. Russ. J. Phys. Chem. A 2015, 89, 99–107. [Google Scholar] [CrossRef]
  34. Wagini, N.H.; Soliman, A.S.; Abbas, M.S.; Hanafy, Y.A.; Badawy, E.-S.M. Phytochemical analysis of Nigerian and Egyptian henna (Lawsonia inermis L.) leaves using TLC, FTIR and GCMS. Plant 2014, 2, 27–32. [Google Scholar] [CrossRef] [Green Version]
  35. Khalid, A.; Ahmad, P.; Uddin Khandaker, M.; Modafer, Y.; Almukhlifi, H.A.; Bazaid, A.S.; Aldarhami, A.; Alanazi, A.M.; Jefri, O.A.; Uddin, M.M.; et al. Biologically Reduced Zinc Oxide Nanosheets Using Phyllanthus emblica Plant Extract for Antibacterial and Dye Degradation Studies. J. Chem. 2023, 2023, 3971686. [Google Scholar] [CrossRef]
  36. Segueni, L.; Rahal, A.; Benhaoua, B.; Allag, N.; Benhaoua, A.; Aida, M. Iron doping SnO2 thin films prepared by spray with moving nozzle: Structural, morphological, optical, and type conductivities. Dig. J. Nanomater. Biostruct. 2019, 14, 923–934. [Google Scholar]
  37. Badger, R.M. The relation between internuclear distances and the force constants of diatomic molecules. Phys. Rev. 1935, 48, 284. [Google Scholar] [CrossRef] [Green Version]
  38. Kaya, S.; Chamorro, E.; Petrov, D.; Kaya, C. New insights from the relation between lattice energy and bond stretching force constant in simple ionic compounds. Polyhedron 2017, 123, 411–418. [Google Scholar] [CrossRef]
  39. Kaupp, M.; Danovich, D.; Shaik, S. Chemistry is about energy and its changes: A critique of bond-length/bond-strength correlations. Coord. Chem. Rev. 2017, 344, 355–362. [Google Scholar] [CrossRef]
  40. Jiang, W.; Zhou, M.; Liu, Z.; Sun, D.; Vardeny, Z.V.; Liu, F. Structural, electronic, and magnetic properties of tris (8-hydroxyquinoline) iron (III) molecules and their magnetic coupling with ferromagnetic surface: First-principles study. J. Condens. Matter Phys. 2016, 28, 176004. [Google Scholar] [CrossRef] [Green Version]
  41. Ghalkhani, M.; Beheshtian, J.; Firooz, A.A. Synthesis of undoped and Fe nanoparticles doped SnO2 nanostructure: Study of structural, optical and electrocatalytic properties. J. Mater. Sci. Mater. Electron. 2017, 28, 7568–7574. [Google Scholar] [CrossRef]
  42. Bashir, M.; Ali, S.; Farrukh, M.A. Green synthesis of Fe2O3 nanoparticles from orange peel extract and a study of its antibacterial activity. J. Korean Phys. Soc. 2020, 76, 848–854. [Google Scholar] [CrossRef]
  43. Eslami, S.; Ebrahimzadeh, M.A.; Biparva, P. Green synthesis of safe zero valent iron nanoparticles by Myrtus communis leaf extract as an effective agent for reducing excessive iron in iron-overloaded mice, a thalassemia model. RSC Adv. 2018, 8, 26144–26155. [Google Scholar] [CrossRef] [PubMed]
  44. Ibarguen, C.A.; Mosquera, A.; Parra, R.; Castro, M.; Rodríguez-Páez, J. Synthesis of SnO2 nanoparticles through the controlled precipitation route. Mater. Chem. Phys. 2007, 101, 433–440. [Google Scholar] [CrossRef]
  45. Preethi, T.; Senthil, K.; Pachamuthu, M.P.; Balakrishnaraja, R.; Sundaravel, B.; Geetha, N.; Bellucci, S. Effect of Fe Doping on Photocatalytic Dye-Degradation and Antibacterial Activity of SnO2 Nanoparticles. Adsorp. Sci. Technol. 2022, 2022, 9334079. [Google Scholar] [CrossRef]
  46. Javaid, A.; Farrukh, M.A. Comparison of photocatalytic and antibacterial activities of allotropes of graphene doped Sm2O3 nanocomposites: Optical, thermal, and structural studies. J. Chin. Chem. Soc. 2023, 70, 32–45. [Google Scholar] [CrossRef]
  47. Ayed, L.; Cheriaa, J.; Laadhari, N.; Cheref, A.; Bakhrouf, A. Biodegradation of crystal violet by an isolated Bacillus sp. Ann. Microbiol. 2009, 59, 267–272. [Google Scholar] [CrossRef]
  48. Iamsaard, S.; Arun, S.; Burawat, J.; Sukhorum, W.; Wattanathorn, J.; Nualkaew, S.; Sripanidkulchai, B. Phenolic contents and antioxidant capacities of Thai-Makham Pom (Phyllanthus emblica L.) aqueous extracts. J. Zhejiang Univ. Sci. B 2014, 15, 405–408. [Google Scholar] [CrossRef]
  49. Liu, Y.; RamaRao, N.; Miller, T.; Hadjipanayis, G.; Teplyakov, A.V. Controlling physical properties of iron nanoparticles during assembly by “click chemistry”. J. Phys. Chem. C 2013, 117, 19974–19983. [Google Scholar] [CrossRef]
  50. Chaudhary, G.; Goyal, S.; Poonia, P. Lawsonia inermis Linnaeus: A phytopharmacological review. Int. J. Pharm. Sci. Drug Res. 2010, 2, 91–98. [Google Scholar]
  51. Khan, K.H. Roles of Emblica officinalis in medicine—A review. Bot. Res. Int. 2009, 2, 218–228. [Google Scholar]
  52. De Siqueira Leite, K.C.; Garcia, L.F.; Sanz, G.; Colmati, F.; de Souza, A.R.; da Costa Batista, D.; Luque, R. Electrochemical characterization of a novel nimesulide anti-inflammatory drug analog: LQFM-091. J. Electroanal. Chem. 2018, 818, 92–96. [Google Scholar] [CrossRef]
  53. López Alarcón, C.I.; Pérez Cruz, F.; Villamena, F.; Zapata Torres, G.; Das, A.; Headley, C.; Quezada, E.; Olea Azar, C. Selected hydroxycoumarins as antioxidants in cells: Physicochemical and reactive oxygen species scavenging studies. J. Phys. Org. Chem. 2013, 26, 773–783. [Google Scholar]
  54. Wardman, P. Reduction potentials of one-electron couples involving free radicals in aqueous solution. J. Phys. Chem. Ref. Data 1989, 18, 1637–1755. [Google Scholar] [CrossRef] [Green Version]
  55. Al-Saeedi, S.I.; Areej, A.; Qamar, M.T.; Alhujaily, A.; Iqbal, S.; Alotaibi, M.T.; Aslam, M.; Qayyum, M.A.; Bahadur, A.; Awwad, N.S. Isotherm and kinetic studies for the adsorption of methylene blue onto a novel Mn3O4-Bi2O3 composite and their antifungal performance. Front. Environ. Sci. 2023, 11, 500. [Google Scholar] [CrossRef]
Figure 1. The comparison of FT-IR spectra of FeSnO2 synthesized using the (a) sol-gel method and green methods using (b) Lawsonia inermis and (c) Phyllanthus embillica leaf extracts.
Catalysts 13 01135 g001
Figure 2. FTIR spectra of aqueous leaf extract of (a) Lawsonia inermis and (b) Phyllanthus embilica.
Catalysts 13 01135 g002
Figure 3. TGA curves of FeSnO2 synthesized using the (a) sol-gel method and green methods using (b) Lawsonia inermis and (c) Phyllanthus embillica leaf extracts.
Catalysts 13 01135 g003
Figure 4. ln(1 − x) versus time plot for FeSnO2 synthesized using the (a) sol-gel method and green methods using (b) Lawsonia inermis and (c) Phyllanthus embillica leaf extracts.
Catalysts 13 01135 g004
Figure 5. Redfern and Coats plot for FeSnO2 synthesized using the (a) sol-gel method and green methods using (b) Lawsonia inermis and (c) Phyllanthus embillica leaf extracts.
Catalysts 13 01135 g005
Figure 6. XRD patterns of FeSnO2 synthesized using the (a) sol-gel method and green methods using (b) Lawsonia inermis and (c) Phyllanthus embillica leaf extracts.
Catalysts 13 01135 g006
Figure 7. Bandgap evaluation of FeSnO2 synthesized using the (a) sol-gel method and green met-ods using (b) Lawsonia inermis and (c) Phyllanthus embillica leaf extracts using the Wood and Tauc plot.
Catalysts 13 01135 g007
Figure 8. SEM images and EDX spectra of FeSnO2 nanocomposite synthesized via the (a,d) sol-gel method and the (b,e) green method using Lawsonia inermis leaf extract and (c,f) Phyllanthus embillica leaf extract.
Catalysts 13 01135 g008
Figure 9. Percentage degradation of MB by FeSnO2 photocatalysts synthesized using the (a) sol-gel method and green methods using (b) Lawsonia inermis and (c) Phyllanthus embillica leaf extracts under exposure to natural sunlight. (d) Photolysis of MB.
Catalysts 13 01135 g009
Figure 10. Percentage degradation of CV by FeSnO2 photocatalysts synthesized using the (a) sol-gel method and green methods using (b) Lawsonia inermis and (c) Phyllanthus embillica leaf extracts under exposure to natural sunlight. (d) Photolysis of the CV.
Catalysts 13 01135 g010
Figure 11. The comparison of the rate of removal of crystal violet (CV) dye by FeSnO2 synthesized via the (a) sol-gel method and green methods using (b) Lawsonia inermis and (c) Phyllanthus embillica leaf extracts.
Catalysts 13 01135 g011
Figure 12. The comparison of the rate of removal of methylene blue (MB) dye by FeSnO2 synthesized via the (a) sol-gel method and green methods using (b) Lawsonia inermis and (c) Phyllanthus embillica leaf extracts.
Catalysts 13 01135 g012
Figure 13. FTIR spectra of (a) methylene blue and (b) crystal violet dyes after 60 and 120 min during the degradation process by FeSnO2 synthesized using Lawsonia inermis leaf extract.
Catalysts 13 01135 g013
Figure 14. Synthesis of polyphenol ions and the possible mechanism of the green synthesis of FeSnO2 nanocomposites.
Catalysts 13 01135 g014
Figure 15. High-resolution XPS spectra of (a) Fe 2p, (b) Sn 3d and (c) O 1s in the FeSnO2 composite.
Catalysts 13 01135 g015
Figure 16. The representative leaves of (a) Lawsonia inermis and (b) Phyllanthus embilica.
Catalysts 13 01135 g016
Table 1. Calculated bond length (Å) of Fe-O and Sn-O.
SamplesFe-OSn-O
CalculatedLiteratureCalculatedLiterature
FeSnO2 synthesized via the sol-gel method2.281.92–1.99 [39]2.432.3 [40]
FeSnO2 synthesized via the green method using Lawsonia inermis leaf extract 2.292.42
FeSnO2 synthesized via the green method using Phyllanthus embillica leaf extract 2.282.43
Table 2. Through TGA, kinetic and thermodynamic parameters are calculated.
SamplesPhaseTemp (K)Rate Constant (k) (min−1)Half-Life (min)Ea (Jmol−1 × 10³)ΔH (Jmol−1 × 10³)ΔS (Jmol−1 K−1)ΔG (Jmol−1 × 10³)
Uncalcined FeSnO2 from sol-gel14230.01739.1020.1516.63−263.2316.90
26730.02132.4813.447.84−296.778.14
38930.004170.682.774.64−323.494.32
Uncalcined FeSnO2 using Lawsonia inermis leaf extract13930.04116.6136.0832.81−206.0333.01
25930.06310.9414.349.413−282.969.69
37530.1594.3514.8814.88−272.5615.15
Uncalcined FeSnO2 using Phyllanthus embillica leaf extract14230.04216.5036.2932.78−210.2232.99
26030.1126.1821.0115.99−265.6916.26
36930.2602.6619.4119.41−259.4819.67
Table 3. Structural and optical parameters of synthesized FeSnO2.
SamplesCrystallite Size (nm)
SizeWH (nm)
SizeSEM nm
Strain εBand Gap (eV)Dislocation Density (δ) (nm)−2SSA (m2g−1)
Schrrer W-H
FeSnO2 synthesized via the sol-gel method 29.49 20.851.2 × 10−23.991.15 × 10−327.45
FeSnO2 synthesized via the green method using Lawsonia inermis leaf extract14.54 11.304.2 × 10−33.104.73 × 10−355.68
FeSnO2 synthesized via the green method using Phyllanthus embillica leaf extract 20.43 14.869.5 × 10−33.892.39 × 10−339.63
Table 4. Comparison of degradation efficiency presented by the synthesized composites in this study with previous studies.
Sr.
No
SamplesBand Gap
(eV)
Degradation Efficiency (%)Time (min)Dye UsedReference
14% Fe doped SnO22.6587.2200Methyl orange[45]
2Fe doped TiO2- SnO2-15.2460Methylene blue[23]
3FeSnO2 (sol-gel)3.8966120Methylene blueThis study
4FeSnO2 (Lawsonia inermis leaves)3.1076120Methylene blueThis study
5FeSnO2 (Phyllanthus embillica leave)3.9969120Methylene blueThis study
6FeSnO2 (sol-gel)3.8975120Crystal violetThis study
7FeSnO2 (Lawsonia inermis leaves)3.0184120Crystal violetThis study
8FeSnO2 (Phyllanthus embillica leaves)3.9981120Crystal violetThis study
Table 5. Redox potential values of some phytochemicals present in the plants used.
Phyto
Chemicals
Chemical FormulaStructural FormulaRedox Potential (V)Reference
ScopoltinC10H8 O4Catalysts 13 01135 i0010.737[52,53]
Ascorbic AcidC6H8O6Catalysts 13 01135 i0020.015[54]
Ellagic acidC14H6O8Catalysts 13 01135 i0030.187[54]
Gallic AcidC7H6O5Catalysts 13 01135 i0040.267[21]
Table 6. The methods used to prepare the samples.
Sample CodeSynthesis of FeSnO2 Nanocomposite UsingMethod
(a)NaOHsol-gel
(b)Lawsonia inermis leaf extractGreen synthesis
(c)Phyllanthus embilica leaf extractGreen synthesis
Disclaimer/Publisher’s Note: The statements, opinions and data contained in all publications are solely those of the individual author(s) and contributor(s) and not of MDPI and/or the editor(s). MDPI and/or the editor(s) disclaim responsibility for any injury to people or property resulting from any ideas, methods, instructions or products referred to in the content.

