Article

A Novel Ochratoxin A Aptasensor Based on Three-Dimensionally Ordered Macroporous RGO-AuNPs-MoS2 Enhanced Electrocatalysis of Methylene Blue and AuNPs-Fe3O4@C Composite as Signal Probe Carrier

1
College of Food Engineering, Anhui Science and Technology University, Chuzhou 233100, China
2
College of Biotechnology and Pharmaceutical Engineering, Nanjing Tech University, Nanjing 211816, China
3
College of Chemistry and Molecular Engineering, Nanjing Tech University, Nanjing 211816, China
4
College of Food Science and Pharmaceutical Engineering, Nanjing Normal University, Nanjing 210023, China
*
Authors to whom correspondence should be addressed.
Catalysts 2023, 13(7), 1088; https://doi.org/10.3390/catal13071088
Submission received: 18 June 2023 / Revised: 7 July 2023 / Accepted: 9 July 2023 / Published: 11 July 2023
(This article belongs to the Special Issue Advances in Photocatalysis and Electrocatalysis Applications)

Abstract

:
In this work, a novel electrochemical aptasensor for the detection of ochratoxin A (OTA) was developed using a three-dimensionally ordered macroporous (3DOM) reduced graphene oxide–Au nanoparticles–molybdenum disulfide (RGO-AuNPs-MoS2) composite material as the sensing interface and Au nanoparticles–carbon-coated ferroferric oxide (AuNPs-Fe3O4@C) composite as the signal amplifier. The 3DOM RGO-AuNPs-MoS2 composite exhibited excellent conductivity and catalytic activity. The 3DOM RGO-AuNPs-MoS2 film was electrodeposited onto the Au electrode surface to immobilize DNA capture probe (CP), which was then hybridized with DNA helper strands (HS) and OTA aptamer (OPT) to form a Y-shaped structure. In the presence of OTA, the OPT was released from the electrode and then combined with AuNPs-Fe3O4@C containing the signal DNA1-metheylene blue (S1-MB) and DNA2-metheylene blue (S2-MB). The current response coming from MB was proportional with the OTA concentration. Under optimal conditions, the linear range of the aptasensor was 1 fg/mL to 0.1 μg/mL, with a detection limit as low as 0.56 fg/mL. The aptasensor was also used to detect OTA in rice and wheat samples, and the results were in agreement with those obtained by liquid chromatography-mass spectrometry (HPLC-MS).

Graphical Abstract

1. Introduction

Ochratoxins (OT) are toxic secondary metabolites produced by the fungi of the genera Aspergillus and Penicillium, comprising seven structurally similar compounds [1]. Among them, Ochratoxin A (OTA) is the most toxic and closely related to human health [2,3]. OTA was classified as a Group 2B carcinogen by the international agency for research on cancer (IARC) [4]. OTA is often detected in food, including wheat, corn, coffee, spices, beer, grapes, and animal meat products [5,6], posing a great threat to human health. As OTA cannot be completely removed from food, countries around the world have set limits on the amount of OTA found in food to reduce its adverse effects on human health. The European Union has set limits of 5, 10, and 2 μg/kg for OTA in unprocessed cereals, dried fruits, and grape juice, respectively (EU NO.519/2012), while China has set limits of 5, 5, and 2 μg/kg for OTA in cereals, beans, and wine, respectively (GB 2761-2017). Due to the low levels of OTA detected and the wide range of products tested, there is an increased need for efficient, easy-to-operate, and highly sensitive detection methods.
Traditional methods for detecting OTA include high-performance liquid chromatography (HPLC) [7], HPLC-tandem mass spectrometry (HPLC-MS) [8], liquid chromatography-fluorescence detection (LC-FLD) [9], and enzyme-linked immunosorbent assay (ELISA) [10]. Although these methods have high sensitivity, they have high equipment requirements, involve tedious sample preparation, and require a high level of professional knowledge for experimental personnel. In recent years, researchers have increasingly turned to the use of electrochemical methods to detect OTA due to the advantages of simple equipment, ease of use, and high sensitivity. Qiu et al. constructed a highly sensitive electrochemical DNA sensor for OTA detection based on aptamer and hybrid chain reaction, with a detection limit of 2 pg/mL for OTA [11]. Yang et al. used MOFs to develop an electrochemical aptamer sensor with a detection limit of 10 pg/mL for OTA [12]. Although electrochemical methods have achieved high sensitivity for OTA, the complexity of actual samples has placed higher demands on the stability and sensitivity of electrochemical detection methods.
Nanomaterials have excellent properties and offer new ideas for the construction of electrode interface materials. Graphene and molybdenum disulfide (MoS2) have been hotspots in recent years due to their large specific surface area, good conductivity, and excellent electrocatalytic performance and have been widely used in the field of electrochemical biosensors [13,14,15,16,17,18,19]. Gold nanoparticles (AuNPs) have good biocompatibility and can bind stably to thiol-modified DNA, making them widely used in electrochemical biosensors [20,21,22]. Recent studies have shown that nanocomposites not only retain their unique properties but also achieve new properties through synergistic effects between different materials, such as AuNPs/graphene oxide (GO) composite [23], AuNPs/MoS2 composite [24], and GO/MoS2 composite [25]. Therefore, composite materials are also widely used in the construction of electrochemical biosensors.
In this work, we employed a dual amplification strategy involving the preparation of a three-dimensionally ordered macroporous (3DOM) RGO-AuNPs-MoS2 electrode as a carrier for immobilizing DNA and an AuNPs-Fe3O4@C combined with MB-modified DNA as a signal probe to achieve ultra-sensitive detection of OTA. The 3DOM RGO-AuNPs-MoS2 film has a larger specific surface area and excellent catalytic activity, accelerating electron transfer, extending the linear range, and reducing the signal response time. The Y-shaped DNA structure formed during the sensor construction process is highly ordered and stable, making the sensor more stable. The AuNPs-Fe3O4@C can fix more MB-modified DNA through Au–S bonds, and the two types of MB-modified DNA were fixed to the electrode surface through complementarity, further enhancing the response current of MB. Therefore, a newly fabricated OTA aptasensor was constructed, which could also be applied for the detection of OTA in real rice and wheat powder samples.

2. Results and Discussion

2.1. Characterization of 3DOM RGO-AuNPs-MoS2 Modified Electrode

In order to investigate the electrochemical properties of the 3DOM RGO-AuNPs-MoS2 electrode fabrication process, Cyclic voltammetry (CV) and electrochemical impedance spectroscopy (EIS) were used for electrochemical characterization. Figure 1A shows the CV curves of different modified electrodes, where curves a, b, c, and d correspond to the bare electrode, 3DOM RGO, 3DOM RGO-AuNPs, and 3DOM RGO-AuNPs-MoS2, respectively. It can be seen from the figure that the peak current corresponding to 3DOM RGO is higher than that of the bare electrode, which is due to the deposition of RGO on the electrode surface, and RGO has good conductivity, promoting electron transfer. Similarly, AuNPs also have good conductivity, so the peak current of 3DOM RGO-AuNPs obtained by co-deposition is further increased. When 3DOM RGO-AuNPs-MoS2 is obtained, the corresponding peak current reaches the maximum, indicating that 3DOM RGO-AuNPs-MoS2 has better conductivity than 3DOM RGO-AuNPs, which is the synergistic effect of RGO, AuNPs, and MoS2. After the electrode was modified with 3DOM RGO, 3DOM RGO-AuNPs, and 3DOM RGO-AuNPs-MoS2, the differences between the oxidation peak potential and the reduction peak potential decreased by 0.074 V, 0.171 V, and 0.235 V, respectively, compared to the bare electrode. This observation strongly suggests that RGO, AuNPs, and MoS2 all exhibit electrocatalytic activity towards [Fe(CN)6]3−/4−. According to Randled–Sevcik Formula (1) [26]:
ip = 2.69 × 10⁵n3/2AD1/2ν1/2C
where ip represents the peak current, n represents the number of electron transfers in the electrochemical process (n = 1), D is the diffusion coefficient equal to 6.7 × 10⁻⁶ cm2/s, ν is the scan rate equal to 0.1 V/s, C is the electrolyte concentration, and A is the electroactive area. The electroactive areas of various electrodes were calculated, which are 0.142 cm2, 0.159 cm2, 0.189 cm2, and 0.220 cm2 for bare electrode, 3DOM RGO-modified electrode, 3DOM RGO-AuNPs-modified electrode, and 3DOM RGO-AuNPs-MoS2-modified electrode, respectively. Compared with 3DOM RGO and 3DOM RGO-AuNPs, the electroactive area of the 3DOM RGO-AuNPs-MoS2 electrode is increased by 1.384-fold and 1.164-fold, respectively.
The EIS of the different electrodes is shown in Figure 1B. The interfacial charge-transfer resistance (Rct) values of the bare electrode (curve a) and the 3DOM RGO-modified electrode (curve b) are 251 and 174 Ω, respectively, indicating that the RGO modification on the electrode surface promotes electron transfer due to the excellent conductivity of RGO. Curve c corresponds to the EIS of the 3DOM RGO-AuNPs-modified electrode, with an Rct value of 82 Ω, indicating that the conductivity of the 3DOM RGO-AuNPs film is further enhanced. The EIS of the 3DOM RGO-AuNPs-MoS2-modified electrode (curve d) is almost a straight line, with an Rct value of 33 Ω, indicating that the electron transfer rate is the fastest among all the modified electrodes. Therefore, the EIS characterization results are in agreement with the CV results.
In order to confirm the successful preparation of the 3DOM RGO-AuNPs-MoS2 electrode, it was also characterized by SEM and EDS. As shown in Figure 1C, a clear porous structure was observed with a pore size of approximately 430 nm, which is almost equal to the diameter of the silicon sphere. Meanwhile, the pore wall is a composite of RGO-AuNPs-MoS2, and the pore bottom is an open gold surface. This indicates that the obtained porous structure has a large pore volume, which facilitates the loading of more DNA, thereby achieving optimal performance of the 3DOM RGO-AuNPs-MoS2 electrode. In addition, Figure 1D shows the EDS spectrum, which confirmed that the atomic ratio of Mo and S was 1:2 and the elemental composition of the 3DOM RGO-AuNPs-MoS2 film was Mo, S, Au, C, and O. These results confirm that we successfully prepared the 3DOM RGO-AuNPs-MoS2 film.

2.2. Characterization of AuNPs-Fe3O4@C

The morphology of synthesized Fe3O4@C and AuNPs-Fe3O4@C was characterized by TEM. Figure 2A shows the TEM image of Fe3O4@C, revealing a black spherical core with an average diameter of about 230 nm and a gray shell with an average thickness of approximately 50 nm, indicating the successful synthesis of core-shell structured Fe3O4@C. The TEM image of AuNPs-Fe3O4@C is shown in Figure 2B, where uniformly sized AuNPs with an average diameter of about 13.7 nm are evenly distributed on the surface of Fe3O4@C. This is attributed to the negatively charged AuNPs being adsorbed onto the positively charged PDDA-modified Fe3O4@C surface through electrostatic interactions.

2.3. Electrochemical Characterization of the OTA Aptasensor

The construction process of the OTA aptasensor was investigated by CV and EIS. Figure 3A shows the CV curves obtained after different modification steps, where curve a represents the CV of the 3DOM RGO-AuNPs-MoS2 electrode. After the surface modification of the 3DOM RGO-AuNPs-MoS2 electrode with CP, the peak current of the redox reaction decreased significantly, and the peak potential difference increased (curve b). This is due to the negatively charged phosphate groups on the oligonucleotides hindering the approach of [Fe(CN)6]3−/4− to the electrode and the thiol groups on the electrode surface hindering the transfer of electrons, indicating the successful immobilization of CP on the electrode surface. Subsequently, the non-specific binding sites were blocked by MCH, and the non-specific binding sites were passivated, resulting in a further decrease in the peak current of the redox reaction (curve c). After the hybridization with HS, HS was immobilized on the electrode surface by complementary base pairing, leading to a further decrease in the peak current of the redox reaction (curve d). Finally, after the hybridization with OPT, the peak current of the redox reaction decreased to the lowest value, indicating the successful immobilization of OPT on the electrode surface. Meanwhile, the electrode modification process was also characterized by EIS, and the result is shown in Figure 3B. The Rct values of the 3DOM RGO-AuNPs-MoS2 electrode, CP/3DOM RGO-AuNPs-MoS2 electrode, MCH/CP/3DOM RGO-AuNPs-MoS2 electrode, HS/MCH/CP/3DOM RGO-AuNPs-MoS2 electrode, and OPT/HS/MCH/CP/3DOM RGO-AuNPs-MoS2 electrode were 33 Ω (curve a), 748 Ω (curve b), 1034 Ω (curve c), 1677 Ω (curve d), and 1973 Ω (curve e), respectively, indicating that the OTA aptasensor was successfully constructed. Furthermore, the coverage (θ) of CP on the electrode surface was calculated using the following formula: θ = 1 − (Rct(a)/Rct(b)) × 100%, where Rct(a) and Rct(b) are the Rct values of the 3DOM RGO-AuNPs-MoS2 electrode and the CP/3DOM RGO-AuNPs-MoS2 electrode, respectively. The calculated θ value was 95.6%, exhibiting a relatively high coverage of CP.

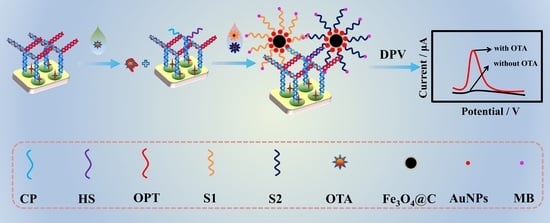
2.4. Signal Amplification Using the Y-Shaped DNA Structure and the Signal Amplification Effect of AuNPs-Fe3O4@C Nanoprobes

The performance of the electrochemical aptasensor can be enhanced through signal amplification. In this study, it was achieved using a Y-shaped DNA structure and AuNPs-Fe3O4@C nanocomposites (Figure 4). In order to validate the amplification effect, three situations were designed: (1) signal probes were S1/AuNPs and S2/AuNPs; (2) signal probes were only S1/AuNPs-Fe3O4@C; and (3) signal probes were S1/AuNPs-Fe3O4@C and S2/AuNPs-Fe3O4@C. As shown in Figure 4, the aptasensor shows a significant current response to MB, indicating that 3DOM RGO-AuNPs-MoS2 has electrocatalytic activity towards MB. When the signal probe was S1/AuNPs-Fe3O4@C (blue curve), the response current of MB was larger than the signal probes of S1/AuNPs and S2/AuNPs (black curve), increasing from 3.26 to 4.65 Μa (Figure 4A). It can be seen from the Figure 4B that when the signal probes were S1/AuNPs-Fe3O4@C and S2/AuNPs-Fe3O4@C (red curve), the response current of MB was the highest at 6.22 μA. This indicates that the performance of the aptasensor was significantly improved by the introduction of the Y-shaped DNA structure and the application of AuNPs-Fe3O4@C nanocomposites.

2.5. Optimization of Experimental Conditions

In order to achieve optimal performance of the OTA aptasensor, it is essential to optimize the experimental conditions. This study mainly investigates the effects of factors such as the amount of CP, the hybridization time of CP and HS, the reaction time of OTA and OPT, and the reaction temperature of OTA and OPT.

2.5.1. Amount of CP

The amount of CP immobilized on the electrode affects the hybridization of HS and OPT, which in turn determines the ability to capture OTA, thereby affecting the performance of the aptasensor. The concentration of CP used in the experimental process was 10 μM. As shown in Figure 5A, as the amount of CP increased from 4 to 10 μL, the response current of the electrode to [Fe(CN)6]3−/4− gradually decreased, and when the amount was further increased, the current response remained basically unchanged. Therefore, in order to save costs, 10 μL was determined as the optimal amount of CP.

2.5.2. Hybridization Time between CP and HS

The amount of HS bound to the electrode is closely related to the hybridization time of CP and HS. Specifically, 10 μL of 10 μM HS was drop-coated onto the CP-modified electrode surface, and the electrode was incubated at 37 °C for 1.0 h, 1.5 h, 2.0 h, 2.5 h, and 3.0 h, respectively, to observe the changes in response current. As shown in Figure 5B, as the hybridization time of CP and HS increased from 1.0 to 2.0 h, the response current of the electrode to [Fe(CN)6]3−/4− gradually decreased. However, when the hybridization time was further extended, the current response remained essentially unchanged. Therefore, in order to improve the experimental efficiency, 2.0 h was determined as the optimum hybridization time for CP and HS.

2.5.3. Reaction Time of OPT with OTA

The OTA and OPT reactions require a certain amount of time, and the reaction time varies with different concentrations of OTA. In order to obtain the best effect, the OTA concentrations of 1 pg/mL, 0.01 ng/mL, and 0.1 ng/mL were used in optimization experiments. As shown in Figure 5C. it can be observed that the optimal reaction times are 30 min, 30 min, and 40 min when the OTA concentrations are 1 pg/mL (curve a), 0.01 ng/mL (curve b), and 0.1 ng/mL (curve c), respectively. Therefore, 40 min was selected as the optimal reaction time for OTA and OPT to ensure better results.

2.5.4. Reaction Temperature of OPT with OTA

The effect of temperature on a reaction is absolute. A low temperature leads to a slower reaction, while an increase in temperature can accelerate the reaction due to the fact that the diffusion phenomenon increases as the temperature rises. However, excessively high temperatures can affect the structure of the substance and thus disrupt the reaction. In this study, the concentration of OTA was set at 0.01 ng/mL for the temperature optimization experiments. As shown in Figure 5D, the response current of the electrode to MB also increases with increasing temperature. The response current reaches its maximum at 37 °C and gradually decreases as the temperature rises. This is because the internal base pair conformations of DNA are highly temperature dependent, particularly in the stretching and opening degrees of freedom; then, the excessively high temperature destroys the DNA double helix structure, causing HS to fall off the electrode and thus reducing the response current [27]. Therefore, 37 °C was selected as the optimal temperature for the reaction between OTA and OPT.

2.6. Amperometric Determination of OTA with Aptasensor

The DPV response of different concentrations of OTA under optimal conditions is shown in Figure 6A. The response current increases with the increase of OTA concentration within a certain range. Under the excellent electrocatalytic performance of 3DOM RGO-AuNPs-MoS2 towards MB, Figure 6B shows a linear relationship between the change in peak current (Δip = ipi0, where i0 represents the response current without OTA) and the logarithm of OTA concentration, resulting in a linear detection range of 1 fg/mL to 0.1 μg/mL and a detection limit of 0.56 fg/mL (S/N = 3) [28]. The linear regression equation is Δip = (0.561 ± 0.022)lgCOTA + (9.655 ± 0.252) (n = 5), with a correlation coefficient of 0.9967. The linear range and detection limit of this OTA aptasensor were compared with those of other reported sensors, as shown in Table 1, and the results indicated that our work outperformed previous studies. This excellent performance is attributed to the AuNPs-Fe3O4@C nanocomposite, which binds more MB and enhances the DPV response current.

2.7. Specificity, Reproducibility, Regenerability, and Stability of the OTA Aptasensor

The specificity of a sensor is one of the important indicators for measuring its performance. In order to investigate the specificity of the aptasensor for OTA, other mycotoxins including aflatoxin B1 (AFB1), aflatoxin B2 (AFB2), aflatoxin M1 (AFM1), and zearalenone (ZEN) were also detected by the aptasensor at a concentration of 0.01 ng/mL. As shown in Figure 7A, the aptasensor produced a significant electrochemical signal for OTA, while there was no significant change for the other mycotoxins, indicating that it has a strong anti-interference ability. To further investigate the reproducibility of the aptasensor, five different electrodes were prepared for the determination of OTA, and one electrode was selected to detect AFB1 for five consecutive times. The RSD of the detection results were 5.7% and 3.8%, respectively, indicating that the aptasensor has good reproducibility. The regenerability of the aptasensor is another extremely important feature that can reduce experimental costs. DNA was involved in the construction process of the aptasensor, and the double helix structure of DNA can be denatured at a certain temperature; thus, the sensor can be regenerated by raising the temperature. The aptasensor was placed in 80 °C hot water for 3 min to obtain a regenerated sensor. The experimental results showed that the sensor maintained good hybridization performance after five regenerations, as shown in Figure 7B, indicating that the sensor has good regenerability. Finally, the stability of the aptasensor was also investigated by storing it at 4 °C for 4 weeks and testing it weekly, and at room temperature for 72 h and testing it every 12 h. With the addition of 0.01 ng/mL OTA, the response current did not decrease significantly and remained at 89.3% and 86.4%, respectively. This is because the Y-shaped DNA structure has good structural stability, which can improve the stability of the aptasensor.

2.8. Real Sample Detection

The concentration of OTA in the extract of rice and wheat powder was determined using the standard addition method, and the results are presented in Table 2. The results show that the detection results of the aptasensor are in good agreement with those of the commercial HPLC-MS method, with the relative error (RE) ranging from −2.2% to +1.7% and from −3.3% to +2.4%, respectively, suggesting the potential practical application of the developed OTA aptasensor.

3. Materials and Methods

3.1. Fabrication of the 3DOM RGO-AuNPs-MoS2 Film

In this study, a three-dimensional SiO2 nanosphere array was prepared using the method previously reported by our group [35]. The array was then immersed in a 0.1 M KCl (Linfeng Chemical Reagent Co., Ltd., Shanghai, China) solution containing 1.0 mg/mL GO (Hengqiu Co., Ltd., Suzhou, China), 0.2 mM HAuCl4·4H2O (Chemical Reagent Co., Ltd., Nanjing, China), and 5 mM (NH4)2MoS4 (Sigma Chemical Co., Ltd., St. Louis, MO, USA) for 5 min. Then, the deposition process was carried out by controlling the deposition charge to 20 mC and applying a voltage range of −1.4 V to 0.6 V at a rate of 20 mV/s, while N2 was used to prevent interference from oxygen. After the co-deposition of RGO, AuNPs, and MoS2, a 3-dimensional ordered macroporous (3DOM) RGO-AuNPs-MoS2 film was obtained by treating the sample with a 5% HF solution (Sinopharm Chemical Reagent Co., Ltd., Shanghai, China) for 2 min to dissolve the template.

3.2. Fabrication of the OTA Aptasensor

The construction process of the OTA aptasensor is shown in Scheme 1. Sequence information for all oligonucleotides is provided in Table S1. Firstly, the obtained 3DOM RGO-AuNPs-MoS2 electrode was electrochemically cleaned in 0.5 M H2SO4, and CV scanning was performed at a rate of 100 mV/s in the potential range of 0–1.6 V until repeatable CV curves (Chenhua Instrument Company, Shanghai, China) were obtained. Then, 10 μL of 10 μM DNA capture probe (CP) was dropped onto the surface of the 3DOM RGO-AuNPs-MoS2 electrode, incubated overnight at 37 °C, washed with PBS to remove residual CP, and further treated with 2 mM MCH for 2 h to block unbound active sites. Subsequently, 10 μL of 10 μM DNA helper strands (HS) and 10 μL of 10 μM OTA aptamer (OPT) were dropped onto the electrode surface, incubated at 37 °C for 2.0 h, and washed with PBS. Different concentrations of OTA (1 fg/mL–0.1 μg/mL) were then dropped onto the electrode surface, reacted at 37 °C for 40 min, and washed with PBS. Finally, 10 μL of S1/AuNPs-Fe3O4@C and 10 μL of S2/AuNPs-Fe3O4@C were dropped onto the electrode surface, incubated at 37 °C for 2.0 h, and then washed with PBS for DPV detection. In the absence of OTA, no response current was obtained, and as the OTA concentration increased, the response current also increased.

4. Conclusions

In this study, a 3DOM RGO-AuNPs-MoS2 electrode was successfully prepared as an interface for DNA immobilization, and AuNPs-Fe3O4@C composite was synthesized to fix MB for the signal probe, which was used to construct an electrochemical biosensor for OTA detection by combining with an OTA aptamer for specific recognition. The good conductivity of RGO and AuNPs enhanced the electron transfer on the electrode surface, and the large specific surface area of the 3DOM RGO-AuNPs-MoS2 structure increased the DNA loading capacity, while the AuNPs-Fe3O4@C composite could fix more MB than a single substance, and the 3DOM RGO-AuNPs-MoS2 exhibited excellent catalytic activity towards MB, thus improving the performance of the aptasensor. In addition, the Y-shaped structure improved the stability of the OTA aptasensor. The detection limit of the sensor for OTA reached 0.56 fg/mL, and it was applied to detect OTA in rice and wheat powder samples, with results in agreement with the commercial HPLC-MS method. This sensor established a platform for the detection of mycotoxins, and by changing the aptamer for mycotoxins, more aptasensors of the same type could be developed for the detection of other mycotoxins.

Supplementary Materials

The following supporting information can be downloaded at: https://www.mdpi.com/article/10.3390/catal13071088/s1. Table S1: Oligonucleotides used in this study. Materials and reagents; Fabrication of the composite of AuNPs-Fe3O4@C; Fabrication of the biocomposite of S1/S2-AuNPs-Fe3O4@C; Electrochemical measurement; Real sample preparation [36,37,38,39].

Author Contributions

Conceptualization, G.P. and X.C.; methodology, G.P.; software, G.P.; validation, X.Z. and K.Z.; formal analysis, X.Z. and K.Z.; investigation, G.P., X.Z. and K.Z.; resources, X.C. and H.H.; data curation, G.P.; writing—original draft preparation, G.P.; writing—review and editing, G.P., X.C. and H.H.; visualization, G.P.; supervision, G.P. and X.C.; project administration, X.C. and H.H.; funding acquisition, G.P., X.C. and H.H. All authors have read and agreed to the published version of the manuscript.

Funding

This work was financially supported by the Anhui Provincial Natural Science Foundation (No. 2008085QC157), the Natural Science Research Project for Colleges and Universities of Anhui Province (No. KJ2021A0887), the Talent Introduction Foundation of Anhui Science and Technology University (No. SPYJ202002), and the Natural Science Research Project of Anhui Science and Technology University (No. 2021zrzd11).

Data Availability Statement

The data presented in this study can be obtained from the first author.

Conflicts of Interest

The authors declare no conflict of interest.

References

  1. Chen, R.P.; Sun, Y.F.; Huo, B.Y.; Zhao, X.D.; Huang, H.; Li, S.; Bai, J.L.; Liang, J.; Gao, Z.X. A Copper Monosulfide-Nanoparticle-Based Fluorescent Probe for the Sensitive and Specific Detection of Ochratoxin A. Talanta 2021, 222, 121678. [Google Scholar] [CrossRef]
  2. De Ruyck, K.; De Boevre, M.; Huybrechts, I.; De Saeger, S. Dietary Mycotoxins, Co-exposure, and Carcinogenesis in Humans: Short Review. Mutat. Res.-Rev. Mutat. 2015, 766, 32–41. [Google Scholar] [CrossRef] [Green Version]
  3. Fromme, H.; Gareis, M.; Völkel, W.; Gottschalk, C. Overall Internal Exposure to Mycotoxins and Their Occurrence in Occupational and Residential Settings-An Overview. Int. J. Hyg. Environ. Health 2016, 219, 143–165. [Google Scholar] [CrossRef]
  4. Bianco, M.; Sonato, A.; De Girolamo, A.; Pascale, M.; Romanato, F.; Rinaldi, R.; Arima, V. An Aptamer-Based SPR-Polarization Platform for High Sensitive OTA Detection. Sens. Actuators B-Chem. 2017, 241, 314–320. [Google Scholar] [CrossRef]
  5. Petzinger, E.; Ziegler, K. Ochratoxin A from A Toxicological Perspective. J. Vet. Pharmacol. Ther. 2000, 23, 91–98. [Google Scholar] [CrossRef] [PubMed]
  6. Pfohl-Leszkowicz, A.; Manderville, R.A. Ochratoxin A: An Overview on Toxicity and Carcinogenicity in Animals and Humans. Mol. Nutr. Food Res. 2007, 51, 61–99. [Google Scholar] [CrossRef] [PubMed]
  7. Flajs, D.; Domijan, A.M.; Ivić, D.; Cvjetković, B.; Peraica, M. ELISA and HPLC Analysis of Ochratoxin A in Red Wines of Croatia. Food Control 2009, 20, 590–592. [Google Scholar] [CrossRef]
  8. Campone, L.; Piccinelli, A.L.; Celano, R.; Pagano, I.; Russo, M.; Rastrelli, L. Rapid and Automated on-Line Solid Phase Extraction HPLC–MS/MS with Peak Focusing for the Determination of Ochratoxin A in Wine Samples. Food Chem. 2018, 244, 128–135. [Google Scholar] [CrossRef]
  9. Frenette, C.; Paugh, R.J.; Tozlovanu, M.; Juzio, M.; Pfohl-Leszkowicz, A.; Manderville, R.A. Structure-Activity Relationships for the Fluorescence of Ochratoxin A: Insight for Detection of Achratoxin A Metabolites. Anal. Chim. Acta 2008, 617, 153–161. [Google Scholar] [CrossRef]
  10. Zou, X.; Chen, C.; Huang, X.; Chen, X.; Wang, L.; Xiong, Y. Phage-Free Peptide ELISA for Ochratoxin A Detection Based on Biotinylated Mimotope as A Competing Antigen. Talanta 2016, 146, 394–400. [Google Scholar] [CrossRef]
  11. Qing, Y.; Li, X.; Chen, S.; Zhou, X.; Luo, M.; Xu, X.; Qiu, J. Differential Pulse Voltammetric Ochratoxin A Assay Based on the Use of An Aptamer and Hybridization Chain Reaction. Microchim. Acta 2017, 184, 863–870. [Google Scholar] [CrossRef]
  12. Li, D.L.; Zhang, X.; Ma, Y.; Deng, Y.; Hu, R.; Yang, Y. Preparation of An OTA Aptasensor Based on A Metal-Organic Framework. Anal. Methods 2018, 10, 3273–3279. [Google Scholar] [CrossRef]
  13. Sethi, J.; Van Bulck, M.; Suhail, A.; Safarzadeh, M.; Perez-Castillo, A.; Pan, G. A label-free biosensor based on grapheme and reduced grapheme oxide dual-layer for electrochemical determination of beta-amyloid biomarkers. Microchim. Acta 2020, 187, 288. [Google Scholar] [CrossRef] [PubMed] [Green Version]
  14. Safarzadeh, M.; Suhail, A.; Sethi, J.; Sattar, A.; Jenkins, D.; Pan, G. A label-free DNA-immunosensor based on aminated rGO electrode for the quantification of DNA methylation. Nanomaterials 2021, 11, 985. [Google Scholar] [CrossRef] [PubMed]
  15. Bollella, P.; Fusco, G.; Tortolini, C.; Sanzò, G.; Favero, G.; Gorton, L.; Antiochia, R. Beyond Graphene: Electrochemical Sensors and Biosensors for Biomarkers Detection. Biosens. Bioelectron. 2017, 89, 152–166. [Google Scholar] [CrossRef]
  16. Zarepour, A.; Ahmadi, S.; Rabiee, N.; Zarrabi, A.; Iravani, S. Self-Healing MXene-and Graphene-Based Composites: Properties and Applications. Nano-Micro Lett. 2023, 15, 100. [Google Scholar] [CrossRef]
  17. Su, S.; Cao, W.; Liu, W.; Lu, Z.; Zhu, D.; Chao, J.; Wang, L. Dual-Mode Electrochemical Analysis of MicroRNA-21 Using Gold Nanoparticle-Decorated MoS2 Nanosheet. Biosens. Bioelectron. 2017, 94, 552–559. [Google Scholar] [CrossRef]
  18. Loan, P.T.K.; Zhang, W.; Lin, C.T.; Wei, K.H.; Li, L.J.; Chen, C.H. Graphene/MoS2 Heterostructures for Ultrasensitive Detection of DNA Hybridisation. Adv. Mater. 2014, 26, 4838–4844. [Google Scholar] [CrossRef]
  19. Gan, X.; Zhao, H.; Quan, X. Two-Dimensional MoS2: A Promising Building Block for Biosensors. Biosens. Bioelectron. 2017, 89, 56–71. [Google Scholar] [CrossRef]
  20. Wang, H.; Yao, S.; Liu, Y.; Wei, S.; Su, J.; Hu, G. Molecularly Imprinted Electrochemical Sensor Based on Au Nanoparticles in Carboxylated Multi-Walled Carbon Nanotubes for Sensitive Determination of Olaquindox in Food and Feedstuffs. Biosens. Bioelectron. 2017, 87, 417–421. [Google Scholar] [CrossRef]
  21. Shuai, H.L.; Huang, K.J.; Zhang, W.J.; Cao, X.; Jia, M.P. Sandwich-Type MicroRNA Biosensor Based on Magnesium Oxide Nanoflower and Graphene Oxide-Gold Nanoparticles Hybrids Coupling with Enzyme Signal Amplification. Sens. Actuat. B-Chem. 2017, 243, 403–411. [Google Scholar] [CrossRef]
  22. Tian, L.; Qian, K.; Qi, J.; Liu, Q.; Yao, C.; Song, W.; Wang, Y. Gold Nanoparticles Superlattices Assembly for Electrochemical Biosensor Detection of MicroRNA-21. Biosens. Bioelectron. 2018, 99, 564–570. [Google Scholar] [CrossRef]
  23. Baek, S.H.; Roh, J.; Park, C.Y.; Kim, M.W.; Shi, R.; Kailasa, S.K.; Park, T.J. Cu-Nanoflower Decorated Gold Nanoparticles-Graphene Oxide Nanofiber as Electrochemical Biosensor for Glucose Detection. Mat. Sci. Eng. C-Mater. 2020, 107, 110273. [Google Scholar] [CrossRef] [PubMed]
  24. Zhang, Y.; Li, X.; Li, D.; Wei, Q. A Laccase Based Biosensor on AuNPs-MoS2 Modified Glassy Carbon Electrode for Catechol Detection. Colloids Surf. B 2020, 186, 110683. [Google Scholar] [CrossRef]
  25. Ji, H.; Hu, S.; Jiang, Z.; Shi, S.; Hou, W.; Yang, G. Directly Scalable Preparation of Sandwiched MoS2/Graphene Nanocomposites via Ball-Milling with Excellent Electrochemical Energy Storage Performance. Electrochim. Acta 2019, 299, 143–151. [Google Scholar] [CrossRef]
  26. Zhou, J.; Zhao, Y.; Bao, J.; Huo, D.; Fa, H.; Shen, X.; Hou, C. One-Step Electrodeposition of Au-Pt Bimetallic Nanoparticles on MoS2 Nanoflowers for Hydrogen Peroxide Enzyme-Free Electrochemical Sensor. Electrochim. Acta 2017, 250, 152–158. [Google Scholar] [CrossRef]
  27. Meyer, S.; Jost, D.; Theodorakopoulos, N.; Peyrard, M.; Lavery, R.; Everaers, R. Temperature dependence of the DNA double helix at the nanoscale: Structure, elasticity, and fluctuations. Biophys. J. 2013, 105, 1904–1914. [Google Scholar] [CrossRef] [Green Version]
  28. Xu, S.; Dai, B.; Zhao, W.; Jiang, L.; Huang, H. Electrochemical detection of β-lactoglobulin based on a highly selective DNA aptamer and flower-like Au@ BiVO4 microspheres. Anal. Chim. Acta 2020, 1120, 1–10. [Google Scholar] [CrossRef]
  29. Shao, B.; Ma, X.; Zhao, S.; Lv, Y.; Hun, X.; Wang, H.; Wang, Z. Nanogapped Au (Core)@ Au-Ag (Shell) Structures Coupled with Fe3O4 Magnetic Nanoparticles for The Detection of Ochratoxin A. Anal. Chim. Acta 2018, 1033, 165–172. [Google Scholar] [CrossRef]
  30. Shen, P.; Li, W.; Ding, Z.; Deng, Y.; Liu, Y.; Zhu, X.; Zheng, T. A Competitive Aptamer Chemiluminescence Assay for Ochratoxin A Using A Single Silica Photonic Crystal Microsphere. Anal. Biochem. 2018, 554, 28–33. [Google Scholar] [CrossRef]
  31. Zejli, H.; Goud, K.Y.; Marty, J.L. Label Free Aptasensor for Ochratoxin A Detection Using Polythiophene-3-Carboxylic Acid. Talanta 2018, 185, 513–519. [Google Scholar] [CrossRef]
  32. Liu, R.; Wu, H.; Lv, L.; Kang, X.; Cui, C.; Feng, J.; Guo, Z. Fluorometric Aptamer Based Assay for Ochratoxin A Based on the Use of Exonuclease III. Microchim. Acta 2018, 185, 254. [Google Scholar] [CrossRef] [PubMed]
  33. Lin, C.; Zheng, H.; Sun, M.; Guo, Y.; Luo, F.; Guo, L.; Chen, G. Highly Sensitive Colorimetric Aptasensor for Ochratoxin A Detection Based on Enzyme-Encapsulated Liposome. Anal. Chim. Acta 2018, 1002, 90–96. [Google Scholar] [CrossRef] [PubMed]
  34. Dai, S.; Wu, S.; Duan, N.; Wang, Z. A Luminescence Resonance Energy Transfer Based Aptasensor for The Mycotoxin Ochratoxin A Using Upconversion Nanoparticles and Gold Nanorods. Microchim. Acta 2016, 183, 1909–1916. [Google Scholar] [CrossRef]
  35. Chen, X.; Wang, Y.; Zhou, J.; Yan, W.; Li, X.; Zhu, J.J. Electrochemical Impedance Immunosensor Based on Three-Dimensionally Ordered Macroporous Gold Film. Anal. Chem. 2008, 80, 2133–2140. [Google Scholar] [CrossRef]
  36. Xie, W.; Gu, L.; Sun, X.; Liu, M.; Li, S.; Wang, Q.; He, D. Ferrocene Derived Core-Shell Structural Fe3O4@C Nanospheres for Superior Lithium Storage Properties. Electrochim. Acta 2016, 220, 107–113. [Google Scholar] [CrossRef]
  37. Grabar, K.C.; Freeman, R.G.; Hommer, M.B.; Natan, M.J. Preparation and Characterization of Au Colloid Monolayers. Anal. Chem. 1995, 67, 735–743. [Google Scholar] [CrossRef]
  38. Tan, Y.; Chu, X.; Shen, G.L.; Yu, R.Q. A Signal-Amplified Electrochemical Immunosensor for Aflatoxin B1 Determination in Rice. Anal. Biochem. 2009, 387, 82–86. [Google Scholar] [CrossRef] [PubMed]
  39. Li, Z.; Ye, Z.; Fu, Y.; Xiong, Y.; Li, Y. A Portable Electrochemical Immunosensor for Rapid Detection of Trace Aflatoxin B1 in Rice. Anal. Methods 2016, 8, 548–553. [Google Scholar] [CrossRef]
Figure 1. CVs (A) and EIS (B) at different electrodes: (a) bare electrode, (b) 3DOM RGO–modified electrode, (c) 3DOM RGO-AuNPs–modified electrode and (d) 3DOM RGO-AuNPs-MoS2–modified electrode. SEM image of 3DOM RGO-AuNPs-MoS2 (C). (D) The EDS spectra of 3DOM RGO-AuNPs-MoS2.
Catalysts 13 01088 g001
Figure 2. TEM images of Fe3O4@C (A) and AuNPs-Fe3O4@C (B).
Catalysts 13 01088 g002
Figure 3. CVs (A) and EIS (B) at different modification steps: (a) 3DOM RGO-AuNPs-MoS2 electrode, (b) after immobilization of CP, (c) passivated by MCH, (d) hybridization with HS, and (e) hybridization with OPT.
Catalysts 13 01088 g003
Figure 4. DPV obtained on OTA/OPT/HS/CP/3DOM RGO-AuNPs-MoS2 electrode after incubation with (A) S1/AuNPs-Fe3O4@C (blue curve) and (B) S1/AuNPs-Fe3O4@C and S2/AuNPs-Fe3O4@C (red curve) for 2 h. The insets show detailed illustrations of the aptasensor geometries.
Catalysts 13 01088 g004
Figure 5. (A) Effects of the amount of CP1; (B) the hybridization times between CP and HS on the CV peaks of 3DOM RGO-AuNPs-MoS2 electrode. (C) Effects of the reaction time between OPT and different concentrations of OTA (1 pg/mL (curve a), 0.01 ng/mL (curve b) and 0.1 ng/mL (curve c)); (D) the reaction temperature between OPT and 0.01 ng/mL OTA on the DPV peaks of the aptasensor.
Catalysts 13 01088 g005
Figure 6. (A) Typical DPV curves of the developed aptasensor with different concentrations of OTA: (a) 0, (b) 1 fg/mL, (c) 0.01 pg/mL, (d) 0.1 pg/mL, (e) 1 pg/mL, (f) 0.01 ng/mL, (g) 0.1 ng/mL, (h) 1 ng/mL, (i) 0.01 μg/mL, and (j) 0.1 μg/mL. (B) The linear relationship between the DPV peak current change and the logarithm of the concentrations of OTA.
Catalysts 13 01088 g006
Figure 7. (A) DPV current changes of the developed OTA aptasensor in the presence of various mycotoxins (OTA, AFB1, AFB2, AFM1, and ZEN) of 0.01 ng/mL. (B) Regeneration of the aptasensor for 0.01 ng/mL OTA detection.
Catalysts 13 01088 g007
Scheme 1. Schematic diagram of the aptasensor for OTA detection.
Catalysts 13 01088 sch001
Table 1. Comparison of OTA detection with other aptasensors.
TechniqueLinear RangeLODReferences
SERS0.01–50 ng/mL0.004 ng/mL[29]
Chemiluminescence0.001–1 ng/mL1 pg/mL[30]
EIS0.125–2.5 ng/mL0.125 ng/mL[31]
Fluorescence8–1000 ng/mL4.7 ng/mL[32]
Colorimetric0.05–2 ng/mL0.023 ng/mL[33]
LRET0.05–100 ng/mL27 pg/mL[34]
SPR0.2–40 ng/mL5 pg/mL[4]
DPV1 × 10−6–100 ng/mL0.56 fg/mLThis work
Table 2. Determination of OTA in rice and wheat samples by the proposed aptasensor and HPLC-MS.
SampleNo.Added
(ng/mL)
HPLC-MS
(ng/mL) a
Proposed Aptasensor
(ng/mL) a
RE
(%)
10.80.7830.796+1.7
Rice2109.9079.632−2.8
32020.20519.766−2.2
10.80.8130.786−3.3
Wheat powder2109.7259.893+1.7
32019.79720.282+2.4
a Average of three measurements.
Disclaimer/Publisher’s Note: The statements, opinions and data contained in all publications are solely those of the individual author(s) and contributor(s) and not of MDPI and/or the editor(s). MDPI and/or the editor(s) disclaim responsibility for any injury to people or property resulting from any ideas, methods, instructions or products referred to in the content.

