Article

CO2 to Value-Added Chemicals: Synthesis and Performance of Mono- and Bimetallic Nickel–Cobalt Nanofiber Catalysts

1
Department of Chemistry and Biochemistry, Rowan University, Glassboro, NJ 08028, USA
2
Chemistry Department, Long Island University (Post), Brookville, NY 11548, USA
3
Department of Physics and Astronomy, Rowan University, Glassboro, NJ 08028, USA
4
Department of Civil and Environmental Engineering, Glassboro, NJ 08028, USA
5
Department of Polymer Science and Engineering, Kyungpook National University, Daegu 41566, Republic of Korea
6
Key Laboratory of Bio-Based Material Science and Technology, Ministry of Education, Northeast Forestry University, Harbin 150040, China
*
Authors to whom correspondence should be addressed.
Catalysts 2023, 13(6), 1017; https://doi.org/10.3390/catal13061017
Submission received: 25 May 2023 / Revised: 13 June 2023 / Accepted: 15 June 2023 / Published: 18 June 2023

Abstract

:
In an epoch dominated by escalating concerns over climate change and looming energy crises, the imperative to design highly efficient catalysts that can facilitate the sequestration and transformation of carbon dioxide (CO2) into beneficial chemicals is paramount. This research presents the successful synthesis of nanofiber catalysts, incorporating monometallic nickel (Ni) and cobalt (Co) and their bimetallic blend, NiCo, via a facile electrospinning technique, with precise control over the Ni/Co molar ratios. Application of an array of advanced analytical methods, including SEM, TGA–DSC, FTIR-ATR, XRD, Raman, XRF, and ICP-MS, validated the effective integration and homogeneous distribution of active Ni/Co catalysts within the nanofibers. The catalytic performance of these mono- and bimetallic Ni/Co nanofiber catalysts was systematically examined under ambient pressure conditions for CO2 hydrogenation reactions. The bimetallic NiCo nanofiber catalysts, specifically with a Ni/Co molar ratio of 1:2, and thermally treated at 1050 °C, demonstrated a high CO selectivity (98.5%) and a marked increase in CO2 conversion rate—up to 16.7 times that of monometallic Ni nanofiber catalyst and 10.8 times that of the monometallic Co nanofiber catalyst. This significant enhancement in catalytic performance is attributed to the improved accessibility of active sites, minimized particle size, and the strong Ni–Co–C interactions within these nanofiber structures. These nanofiber catalysts offer a unique model system that illuminates the fundamental aspects of supported catalysis and accentuates its crucial role in addressing pressing environmental challenges.

1. Introduction

Amidst the mounting urgency to address climate change and energy crisis, catalysis emerges as a vital tool in the global response [1]. The increasing concentration of carbon dioxide (CO2) in the atmosphere, a key driver of global warming, presents both a challenge and an opportunity [2]. Catalysts serve a pivotal role in the transformation of this potent greenhouse gas into value-added chemicals, thus offering a dual advantage of greenhouse gas reduction and energy-efficient chemical production [3]. Catalytic CO2 hydrogenation has emerged as a noteworthy and promising scientific strategy that could mitigate both of these global issues [4,5]. This technique allows us to harness the problematic CO2 and convert it into beneficial energy fuels and chemicals, such as carbon monoxide (CO), methane (CH4), and methanol (CH3OH) [6]. This not only offers a potential pathway to reduce atmospheric CO2 levels but also presents an avenue towards a sustainable hydrocarbon-based energy cycle, thereby contributing to a balanced carbon footprint globally [7,8] However, realizing this promise is not without its challenges. The thermodynamic stability of CO2 makes its direct conversion into energy fuels and chemicals particularly difficult, especially under lower pressure and temperature conditions [9]. Previous research efforts have seen the development of copper (Cu)-based and nickel (Ni)-based catalysts, both presenting their unique advantages and limitations [10,11]. While Cu-based catalysts have shown encouraging selectivity towards CO and CH3OH, their CO2 conversion rates leave much to be desired [12,13]. On the other hand, Ni-based catalysts have demonstrated considerable catalytic conversion under mild conditions, favoring the production of CH4 over CO and CH3OH [14,15]. However, CO, a crucial building block for synthetic fuels and oxygenates via Fischer–Tropsch or methanol synthesis reactions, is the more desirable product [16]. Consequently, the task at hand involves enhancing the CO selectivity of Ni-based catalysts without undermining their CO2 conversion efficiency.
The complexities of CO2 hydrogenation on Ni-based catalysts extend to the reaction’s intermediate processes and product selectivity, both of which are closely tied to the binding energy of CO [17]. The oxidized state of Ni showcases a reduced CO binding energy in comparison to its metallic state [18]. This suggests a plausible route to enhance CO product selectivity during CO2 hydrogenation by leveraging the oxidized valence state of Ni. However, practically harnessing oxidized Ni for the CO-selective CO2 hydrogenation proves to be challenging due to the intrinsic tendency of nickel to reduce to its metallic state under hydrogenation conditions [19]. Therefore, various strategies have been pursued to augment the CO selectivity of Ni-based catalysts. These methods involve tuning the metal–support interaction, manipulating the catalyst loading, altering the catalyst size, and employing catalyst promoters such as sodium (Na) and potassium (K) [20,21]. Each of these techniques aims to circumvent the limitations of using oxidized Ni and effectively augment the selective production of CO during CO2 hydrogenation.
Bimetallic catalysts have recently gained significant attention due to their unique reactivity patterns, often diverging from those of their monometallic counterparts [22]. These patterns arise from geometric and electronic effects, which lead to notable perturbations in the metals’ d-band electron density, thereby influencing their catalytic performance [23]. The influence of bimetallic synergies on catalytic activity has been observed in various studies. Bharathan et al., for instance, discovered that a gold–nickel (Au@Ni) core–shell catalyst exhibited a greater phenyl acetylene hydrogenation activity compared to the individual Ni and Au counterparts [24]. Likewise, Yao et al. found that copper–nickel (Cu–Ni) bimetallic catalysts displayed enhanced catalytic activity in the selective hydrogenation of nitrocyclohexane to cyclohexanone oxime [25]. These findings underscore the key principle that introducing an additional active metal to Ni can modulate its electronic properties, subsequently leading to an improvement in adjusting the Ni valence state for catalysis [26,27]. Bimetallic structures containing Ni have also been researched for their potential in modifying the selectivity of CO2 hydrogenation [28]. Reddy et al. unveiled that adjusting Cu/Ni molar ratios enhanced CO2 hydrogenation selectivity, as the formation of a Cu–Ni alloy due to Cu core atoms migrating to the Ni surface increases CO desorption and suppresses methane production, thereby elucidating the potential to regulate CO2 hydrogenation selectivity through managing the electronic structure of the Ni surface [29].
In the present study, we undertook the synthesis of both monometallic and bimetallic Ni–Co catalysts utilizing a blend electrospinning method, a straightforward yet powerful technique. Electrospinning, recognized for its simplicity and versatility, leverages electrohydrodynamic atomization to fabricate continuous nanofibers and form 3D constructs with hierarchical porosity [30]. These constructs result from the strategic stacking of nanofibers, which can be organized or random, thereby enabling the uniform distribution of active metal precursors within the solutions and subsequent nanofibers [31,32,33]. A significant advantage of electrospinning is its capacity to precisely control metal loadings and ratios in the resultant nanofiber catalysts [34]. These fabricated nanofibers are characterized by an expansive and continuous surface area that amplifies the accessibility of the catalyst’s active sites [35]. Additionally, the high porosity of these structures bolsters the mass diffusion rates of reactants and products [36]. We developed mono- and bimetallic Ni/Co nanofiber catalysts and embarked on a systematic exploration of their physical and chemical properties, alongside their catalytic performance in CO2 hydrogenation under ambient pressure and low-temperature conditions. Our results revealed that the bimetallic NiCo nanofiber catalysts, particularly those with a Ni/Co molar ratio of 1:2 and thermally treated at 1050 °C, exhibited a significantly enhanced catalytic activity in CO2 hydrogenation and a high CO selectivity. This performance far outpaced their monometallic counterparts prepared under identical conditions. These findings solidify the potential of NiCo nanofiber catalysts in the sphere of supported catalysis, underscoring their substantial promise in tackling global environmental challenges.

2. Results and Discussion

2.1. Physical Structure of Mono- and Bimetallic Ni–Co Nanofibers

Composite nanofibers containing monometallic Ni, monometallic Co, and bimetallic NiCo with molar ratios of 1:0.5, 1:1, and 1:2 were produced via an electrospinning process. The process employed blend solutions consisting of Ni(OAc)2 as a Ni precursor, Co(OAc)2 as a Co precursor, PAN as a carbon nanofiber precursor, and DMF as a solvent. The Ni/Co acetates and PAN exhibited excellent solubility and compatibility in DMF, forming uniformly colored solutions, their shades varying with the specific metal salt(s) in use. This ensured the even distribution of Ni2+ and Co2+ ions alongside PAN molecules in the solution, which subsequently translated to homogeneously integrated species within the resultant nanofibers via electrospinning. The electrospinning process progressed steadily, yielding a 20 cm × 20 cm × 0.2 cm nonwoven mat of uniform M(OAc)2–PAN composite nanofibers, as depicted in Figure 1. These composite nanofibers exhibited a consistent diameter across their entire lengths and among different fibers, with no detectable particles or irregularities, reinforcing the uniformity of the embedded metal salts and polymer. Following electrospinning, these composite nanofibers underwent thermal treatment in an inert atmosphere at 450, 850, and 1050 °C to transform the Ni/Co salts to their metallic forms and PAN to carbon nanofibers. This thermal processing led to noticeable brittleness in the heated samples, with the monometallic Ni or Co nanofibers appearing more brittle than the bimetallic NiCo variants treated at equivalent temperatures, possibly due to stronger metal–support interaction in the bimetallic nanofibers. The surfaces of the nanofibers heated at 450 °C were smooth, with no detectable metal particles. However, as the temperature escalated to 850 °C, certain nanoparticles materialized on the nanofiber surface, potentially due to Ni/Co sintering. Interestingly, the monometallic Co nanofibers exhibited numerous nanofibrils, which may be related to the formation of carbon nanotubes, given that Co serves as a robust catalyst for such reactions [37]. Further heating to 1050 °C resulted in a proliferation of nanoparticles, predominantly greater than 10 nm, on the nanofiber surface due to high-temperature metal sintering. Nonetheless, a considerable quantity of nanoparticles under 10 nm remained evident on the nanofiber surfaces.
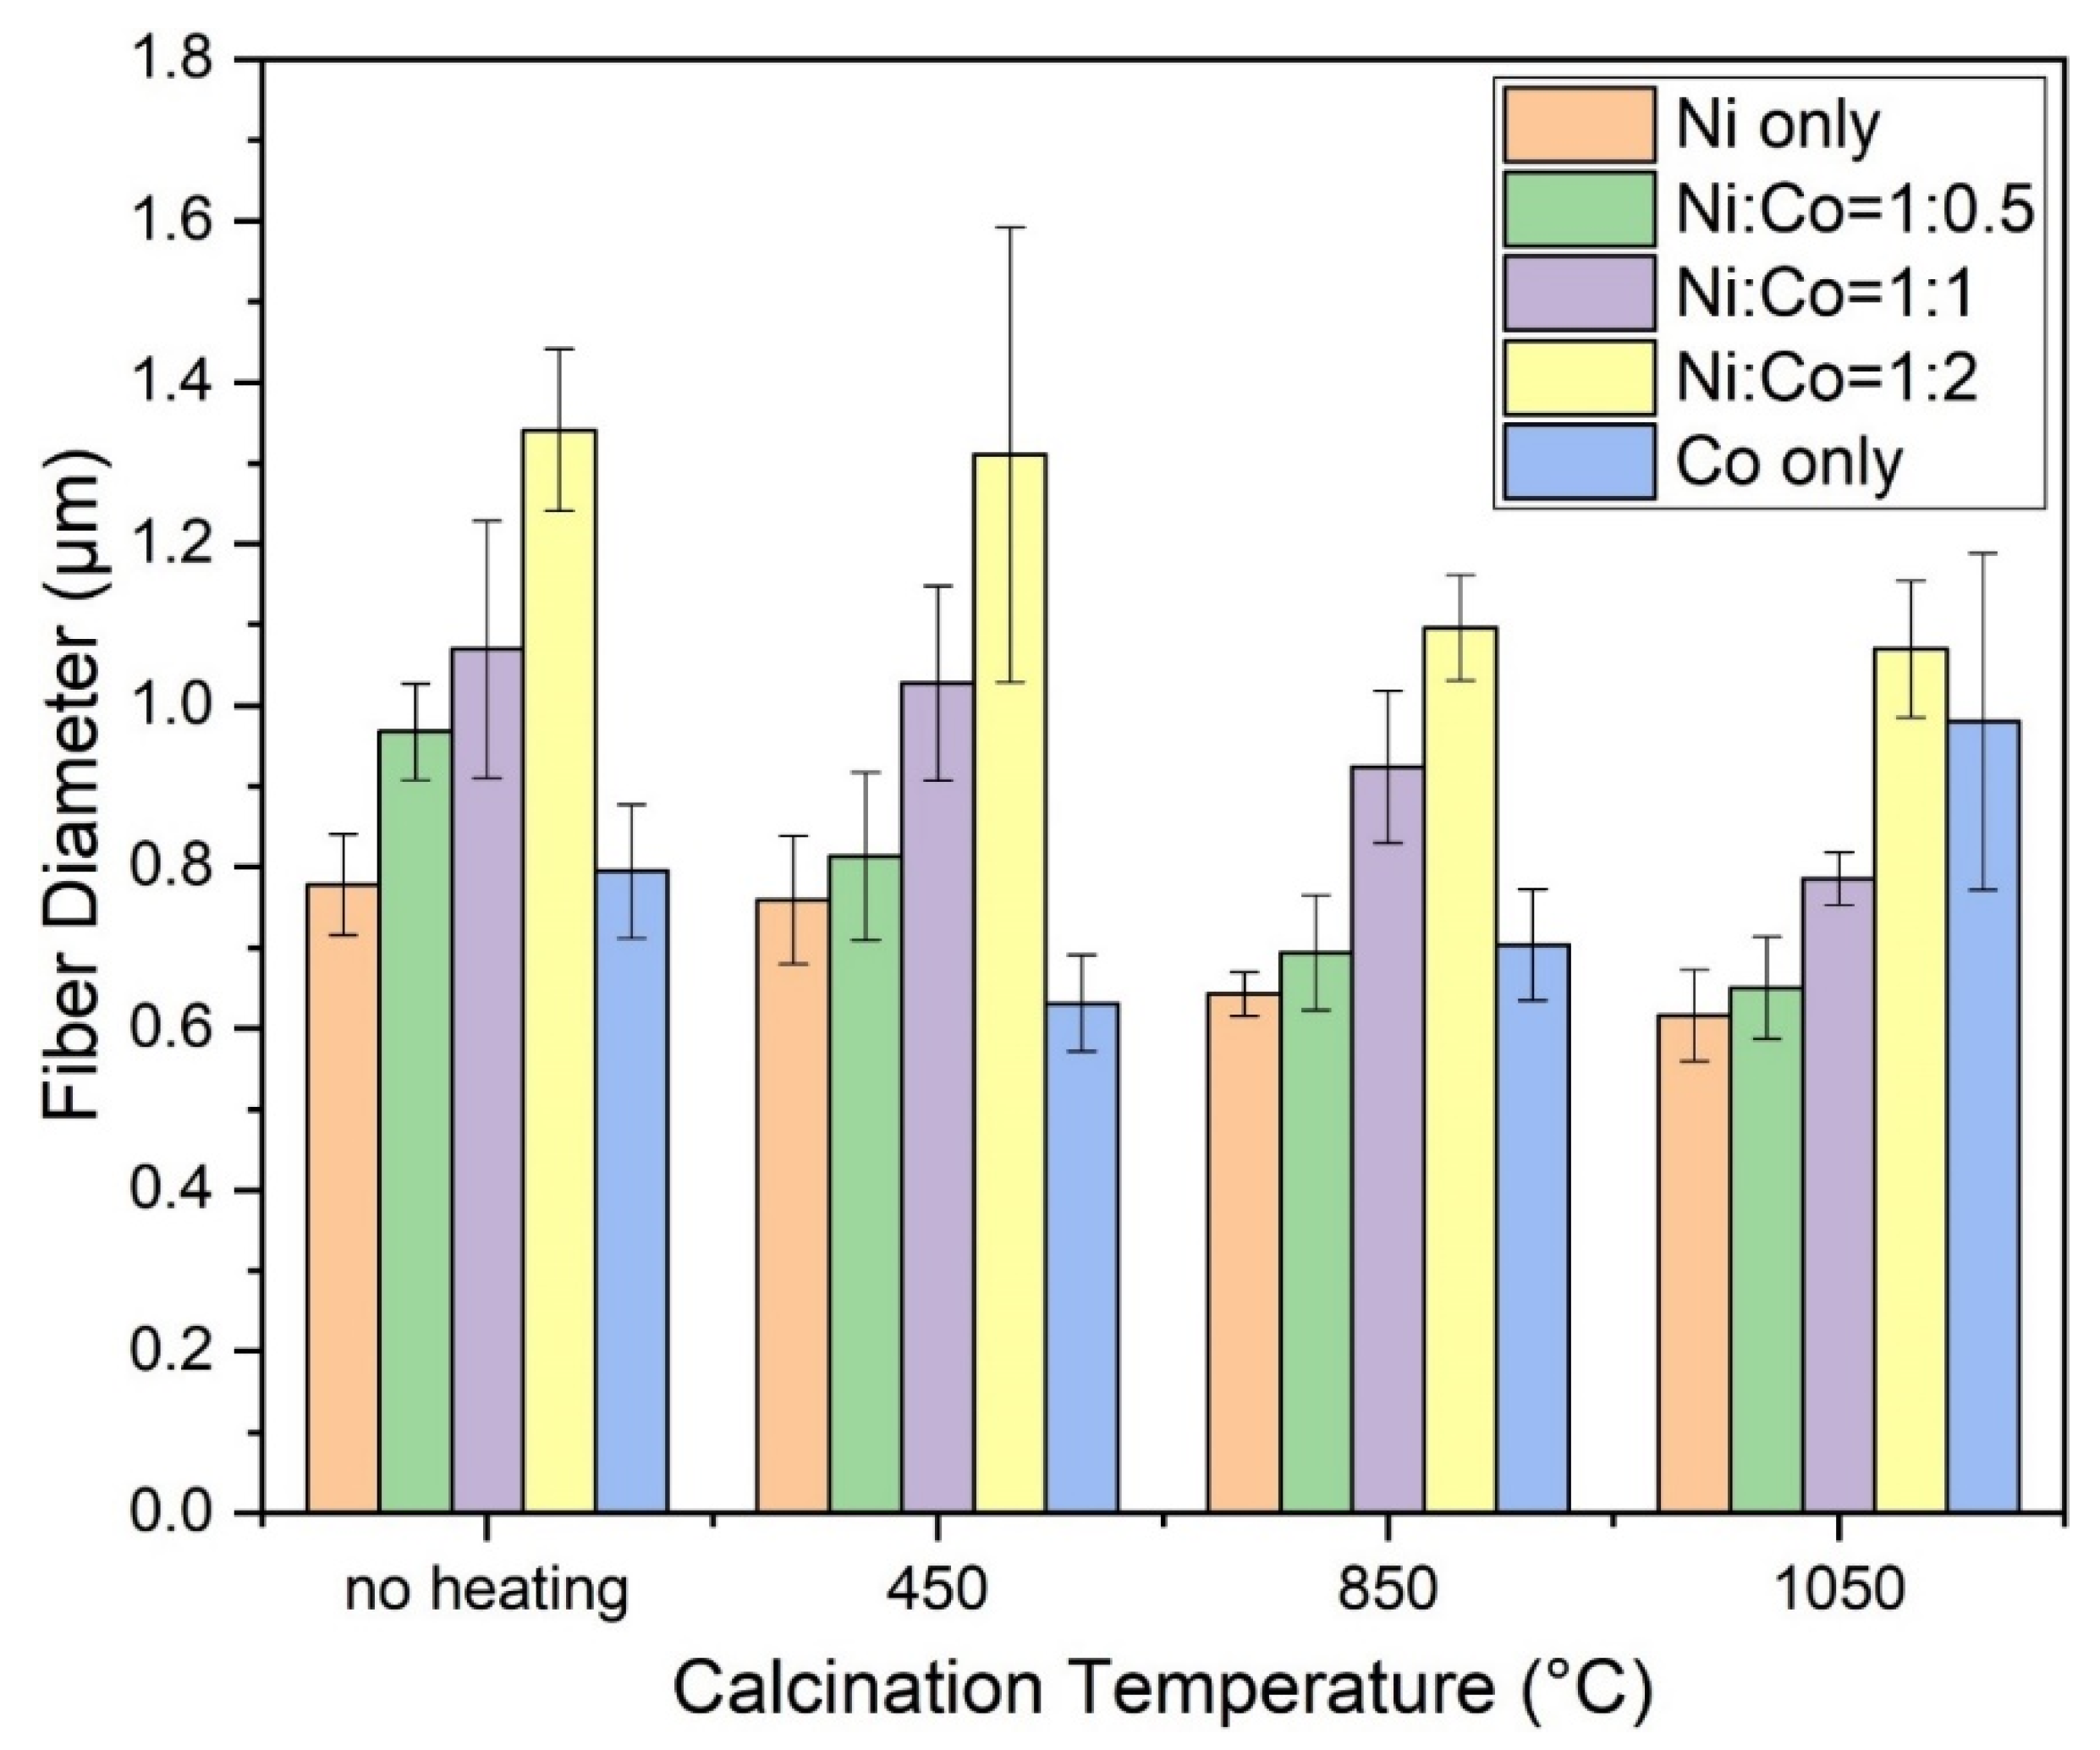
To quantitatively comprehend the alterations in the nanofiber’s physical structure, we conducted size measurements and statistical analyses on over 100 representative fibers from each sample, as depicted in Figure 2. Before thermal treatment, the monometallic Ni and Co composite nanofibers exhibited an average diameter of 778 ± 63 nm and 795 ± 83 nm, respectively. As the Ni/Co ratios changed from 1:0.5 to 1:2, a corresponding increase in the bimetallic composite fiber’s diameter was observed, enlarging from 968 ± 60 nm to 1341 ± 100 nm, which is likely attributable to heightened total metal loadings. After thermal treatment at 450 °C, all the nanofibers demonstrated a size reduction compared to the as-spun fibers, although the majority saw a reduction of less than 10%. This minimal decrease suggests that while thermal degradation of precursors occurred, it was not fully realized. Upon increasing the temperature to 850 °C, except for the monometallic Co nanofibers, all other fibers exhibited a substantial size reduction nearing 20%. Contrarily, monometallic Co nanofibers underwent an 11% size increase compared to the 450 °C samples. This trend persisted even for the sample heated at 1050 °C, solidifying that such an increase is consistent, rather than an anomaly. SEM observations (Figure 1E) suggest that this growth might be attributed to the formation of carbonaceous species on the nanofibers at elevated temperatures. The monometallic Ni and bimetallic 1/0.5, 1/1, and 1/2 NiCo nanofibers, post-treatment at 1050 °C, displayed further diameter reductions to 616 nm, 650 nm, 786 nm, and 1070 nm, respectively. However, the reduction rate appeared to decelerate, indicative of a successful precursor transition to their respective forms, thereby stabilizing the structure under thermal treatment.
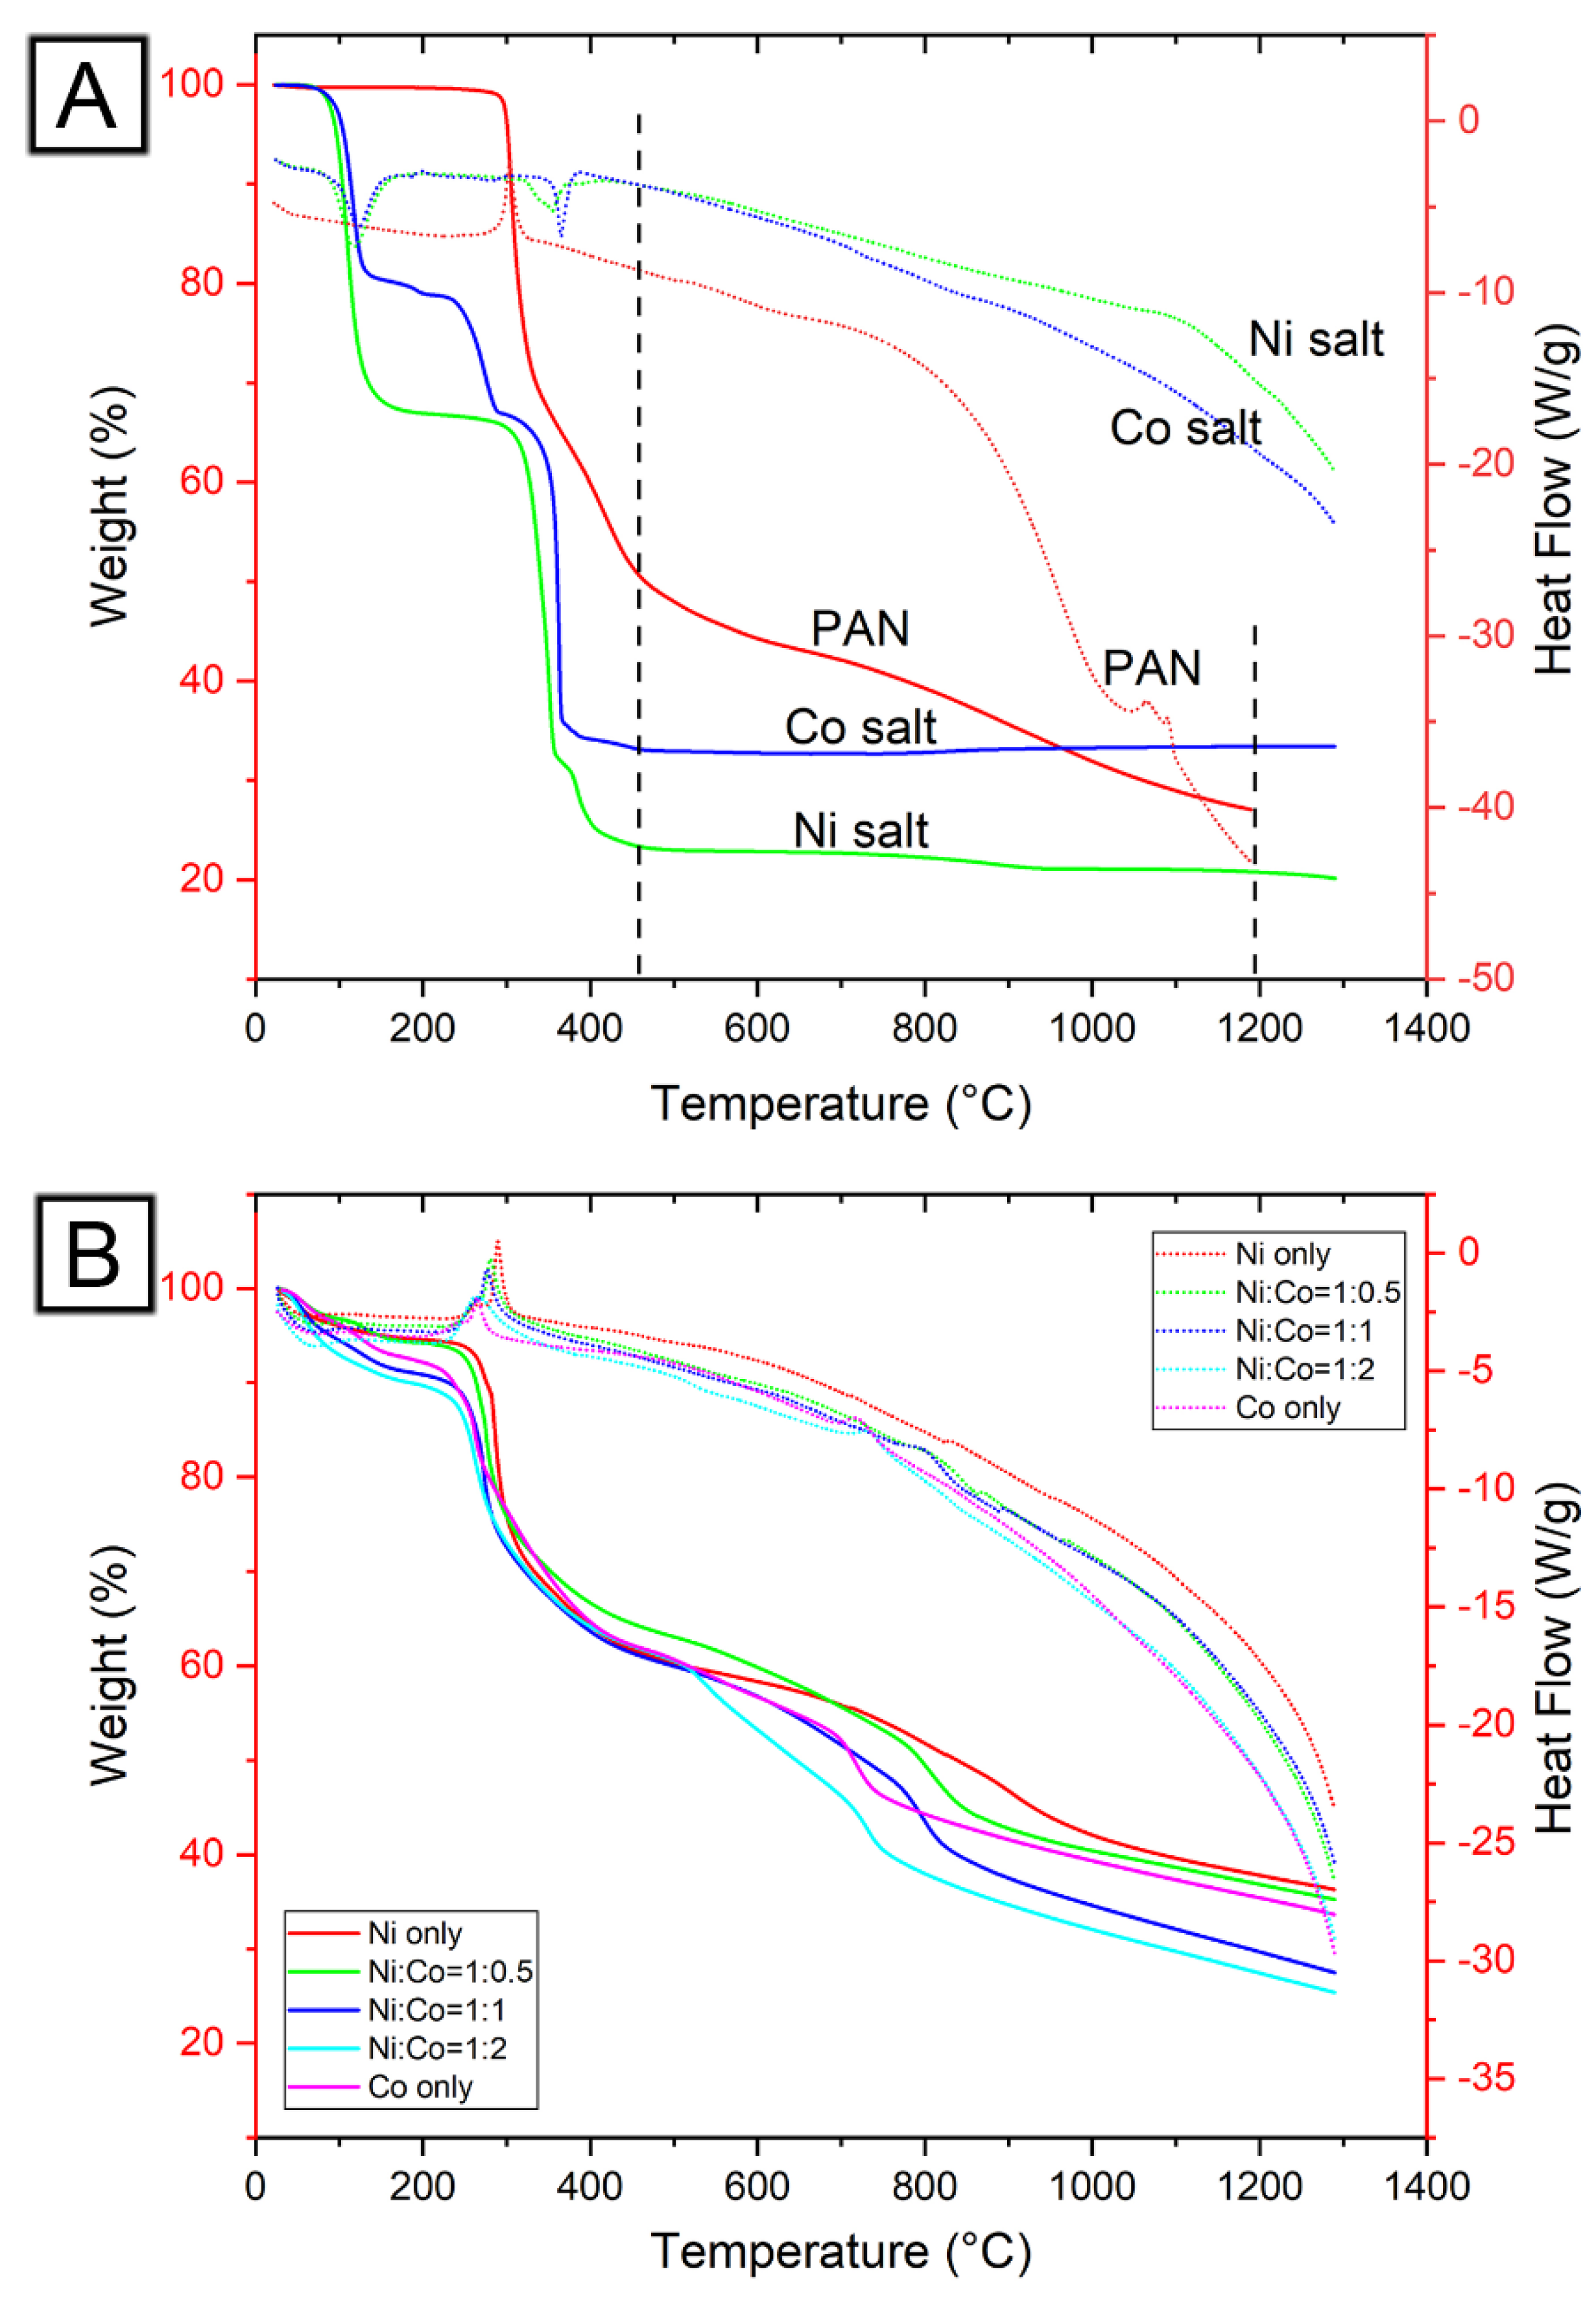
The thermal degradation behavior of the precursors and composite nanofibers was evaluated using simultaneous TGA–DSC. The resulting data, showcasing both the physical mass losses and corresponding chemical reactions, are depicted in Figure 3. Figure 3A delineates the degradation profiles of the three raw precursors: PAN, Ni(OAc)2, and Co(OAc)2. The PAN displayed minimal mass variation below 280 °C, attributed possibly to moisture elimination, with a meager 1% change. Post 280 °C, PAN exhibited two exothermic peaks, attributable to organic components expulsion at 303 °C [38], and carbon atoms transformation into tightly bonded carbon crystals around 1065 °C [39]. Simultaneously, the noncarbon atoms were progressively removed, causing an overall mass loss of approximately 72.2% at 1200 °C. Conversely, both the Ni and Co precursor salts exhibited two endothermic peaks, indicating water removal from the hydrate (first peak) and acetate group decomposition (second peak) [40]. For instance, the nickel(II) acetate tetrahydrate displayed an initial weight loss of 33.2%, slightly higher than the theoretically calculated 28.9%, attributed to environmental water molecule adsorption. The acetate removal’s subsequent weight loss was 44.0%, in close approximation to the calculated 47.4%. The residual content, around 22.8%, corresponded closely to the theoretical Ni percentage (23.6%), suggesting the residue to be Ni, not NiO. However, the cobalt(II) acetate tetrahydrate’s residual content (30.5%) exceeded the theoretical Co percentage (23.7%), supporting the formation of CoO [41]. Furthermore, the acetate-associated weight loss was recorded at 35.5%, closely aligning with the theoretically calculated figure for acetate minus an oxygen atom (34.5%), thereby supporting the formation of CoO [42]. Importantly, between the temperatures of 475–1200 °C, both Ni and Co had negligible weight loss, indicative of their thermal stability under inert atmospheric conditions. In Figure 3B, the thermal degradation profiles of Ni/Co composite nanofibers are detailed. The relatively low Ni/Co percentages (5–15%) attenuated the visibility of endothermic degradation peaks within the ranges of 110–130 °C and 350–370 °C in their DSC thermograms. The PAN-degradation-associated exothermic peaks ranged from 230–330 °C. Remarkably, the thermal degradation patterns of monometallic Ni/Co and bimetallic NiCo, with increasing Co content, were analogous to one another within the 475–1300 °C range, despite the final weight loss correlating positively with the increase of Co content in the composite nanofibers.

2.2. Chemical Composition and Crystalline Structure of Nanofiber Catalysts

The evolution of the chemical composition before and after thermal treatment at varying temperatures was scrutinized using the FTIR-ATR technique. Figure 4 shows the spectra of as-spun nanofibers, along with those treated at 450, 850, and 1050 °C. The as-spun composite nanofibers all displayed characteristic absorptions for PAN, Ni(OAc)2, and Co(OAc)2. Notably, peaks at 2243 and 1662 cm−1 corresponded to the strong polarity of the nitrile group (C≡N stretching) in PAN. Additional characteristic PAN peaks were identified at 2936 cm−1 (alkyl C–H stretching) and 1452 cm−1 (CH2 and CH3 bending) [43]. The absorption at 1568 cm−1 represented the characteristic peak of the carboxyl group in the salt form of the acetate group [44]. After heating at 450 °C, all samples displayed broad bands ranging from 1696 cm−1 to 650 cm−1. The nitrile group was entirely absent, replaced by bands signifying C=N (1576 cm−1), C–C (1270 cm−1), and C=C (800 cm−1) due to a complex series of elimination, cyclization, and aromatization reactions [45]. This corroborated the TGA–DSC analysis, indicating complete removal of the acetate group at 450 °C, a finding further affirmed by the FTIR-ATR analysis. Upon escalating the heating to 850 °C and 1050 °C, the overall shape of all sample spectra evolved, reflecting the characteristic feature of conductive carbon and metal structures, where the electric field’s penetration depth into a conducting solid is inversely proportional to the wave number [46]. This affirmed the successful transformation of precursors into metals (or metal oxides) and graphitized carbon nanofibers.
To further substantiate the conversion of PAN, Ni(OAc)2, and Co(OAc)2 into carbon and metals, we characterized all nanofibers pre- and post-thermal treatment at 450, 850, and 1050 °C, as shown in Figure 5. All as-spun composite nanofibers displayed a broad peak centered around 16.8°, a characteristic indicative of amorphous PAN polymer. In the presence of less than 10% metal loading, peaks specific to Ni/Co acetates were not detectable. However, at a Ni/Co loading of 15% (Ni:Co = 1:2), several faint peaks emerged, with the most prominent one at 2θ = 12.8°, corresponding to the (011) plane of Co(OAc)2 (PDF 00-025-0372). Following the 450 °C heat treatment, PAN transitioned into amorphous carbon-based structures, signified by a broad band at 24.3° [47]. A faint broad peak at 44.4° emerged, attributable to the (111) plane of the fcc structures of Ni, Co, or NiCo. Crystal sizes, inferred from FWHM, were below 10 nm. Upon raising the heat treatment to 850 °C, the intensity of the (111) peak considerably increased due to particle growth at higher temperatures. Average particle sizes for all five samples fell within a 10–15 nm range, estimated from the most prominent (111) peak. This average metal particle size escalated to 20–25 nm upon heating to 1050 °C, corroborating SEM observations (Figure 1). Simultaneously, the peak at 24.3°C became more defined, indicative of carbon graphitization above 850 °C, assignable to the (002) plane of graphitized carbon [48]. The characteristic (111) peak of NiO at 2θ = 37.2° was not detected, thus affirming no NiO formation [49]. Intriguingly, no CoO phase was detected in XRD patterns of monometallic Co and bimetallic NiCo nanofibers heated at 850 and 1050 °C. According to the literature, CoO has a strong peak at 36.7°, assignable to the (111) plane [50]. Its absence from all XRD patterns implies no CoO formation. This conclusion appears contradictory to the TGA–DSC analysis, which suggested CoO formation (Figure 3A). However, this discrepancy might be due to the fact that CoO was generated when heating cobalt(II) acetate in an inert atmosphere without PAN. Conversely, when cobalt(II) acetate was heated alongside PAN, the latter or its derivatives might have served as a reducing agent, transforming Co2+ into metallic Co. Given PAN’s oxidation during its thermal degradation process, it is highly plausible that Co2+ acted as the oxidizing agent, subsequently reduced to metallic Co [51].
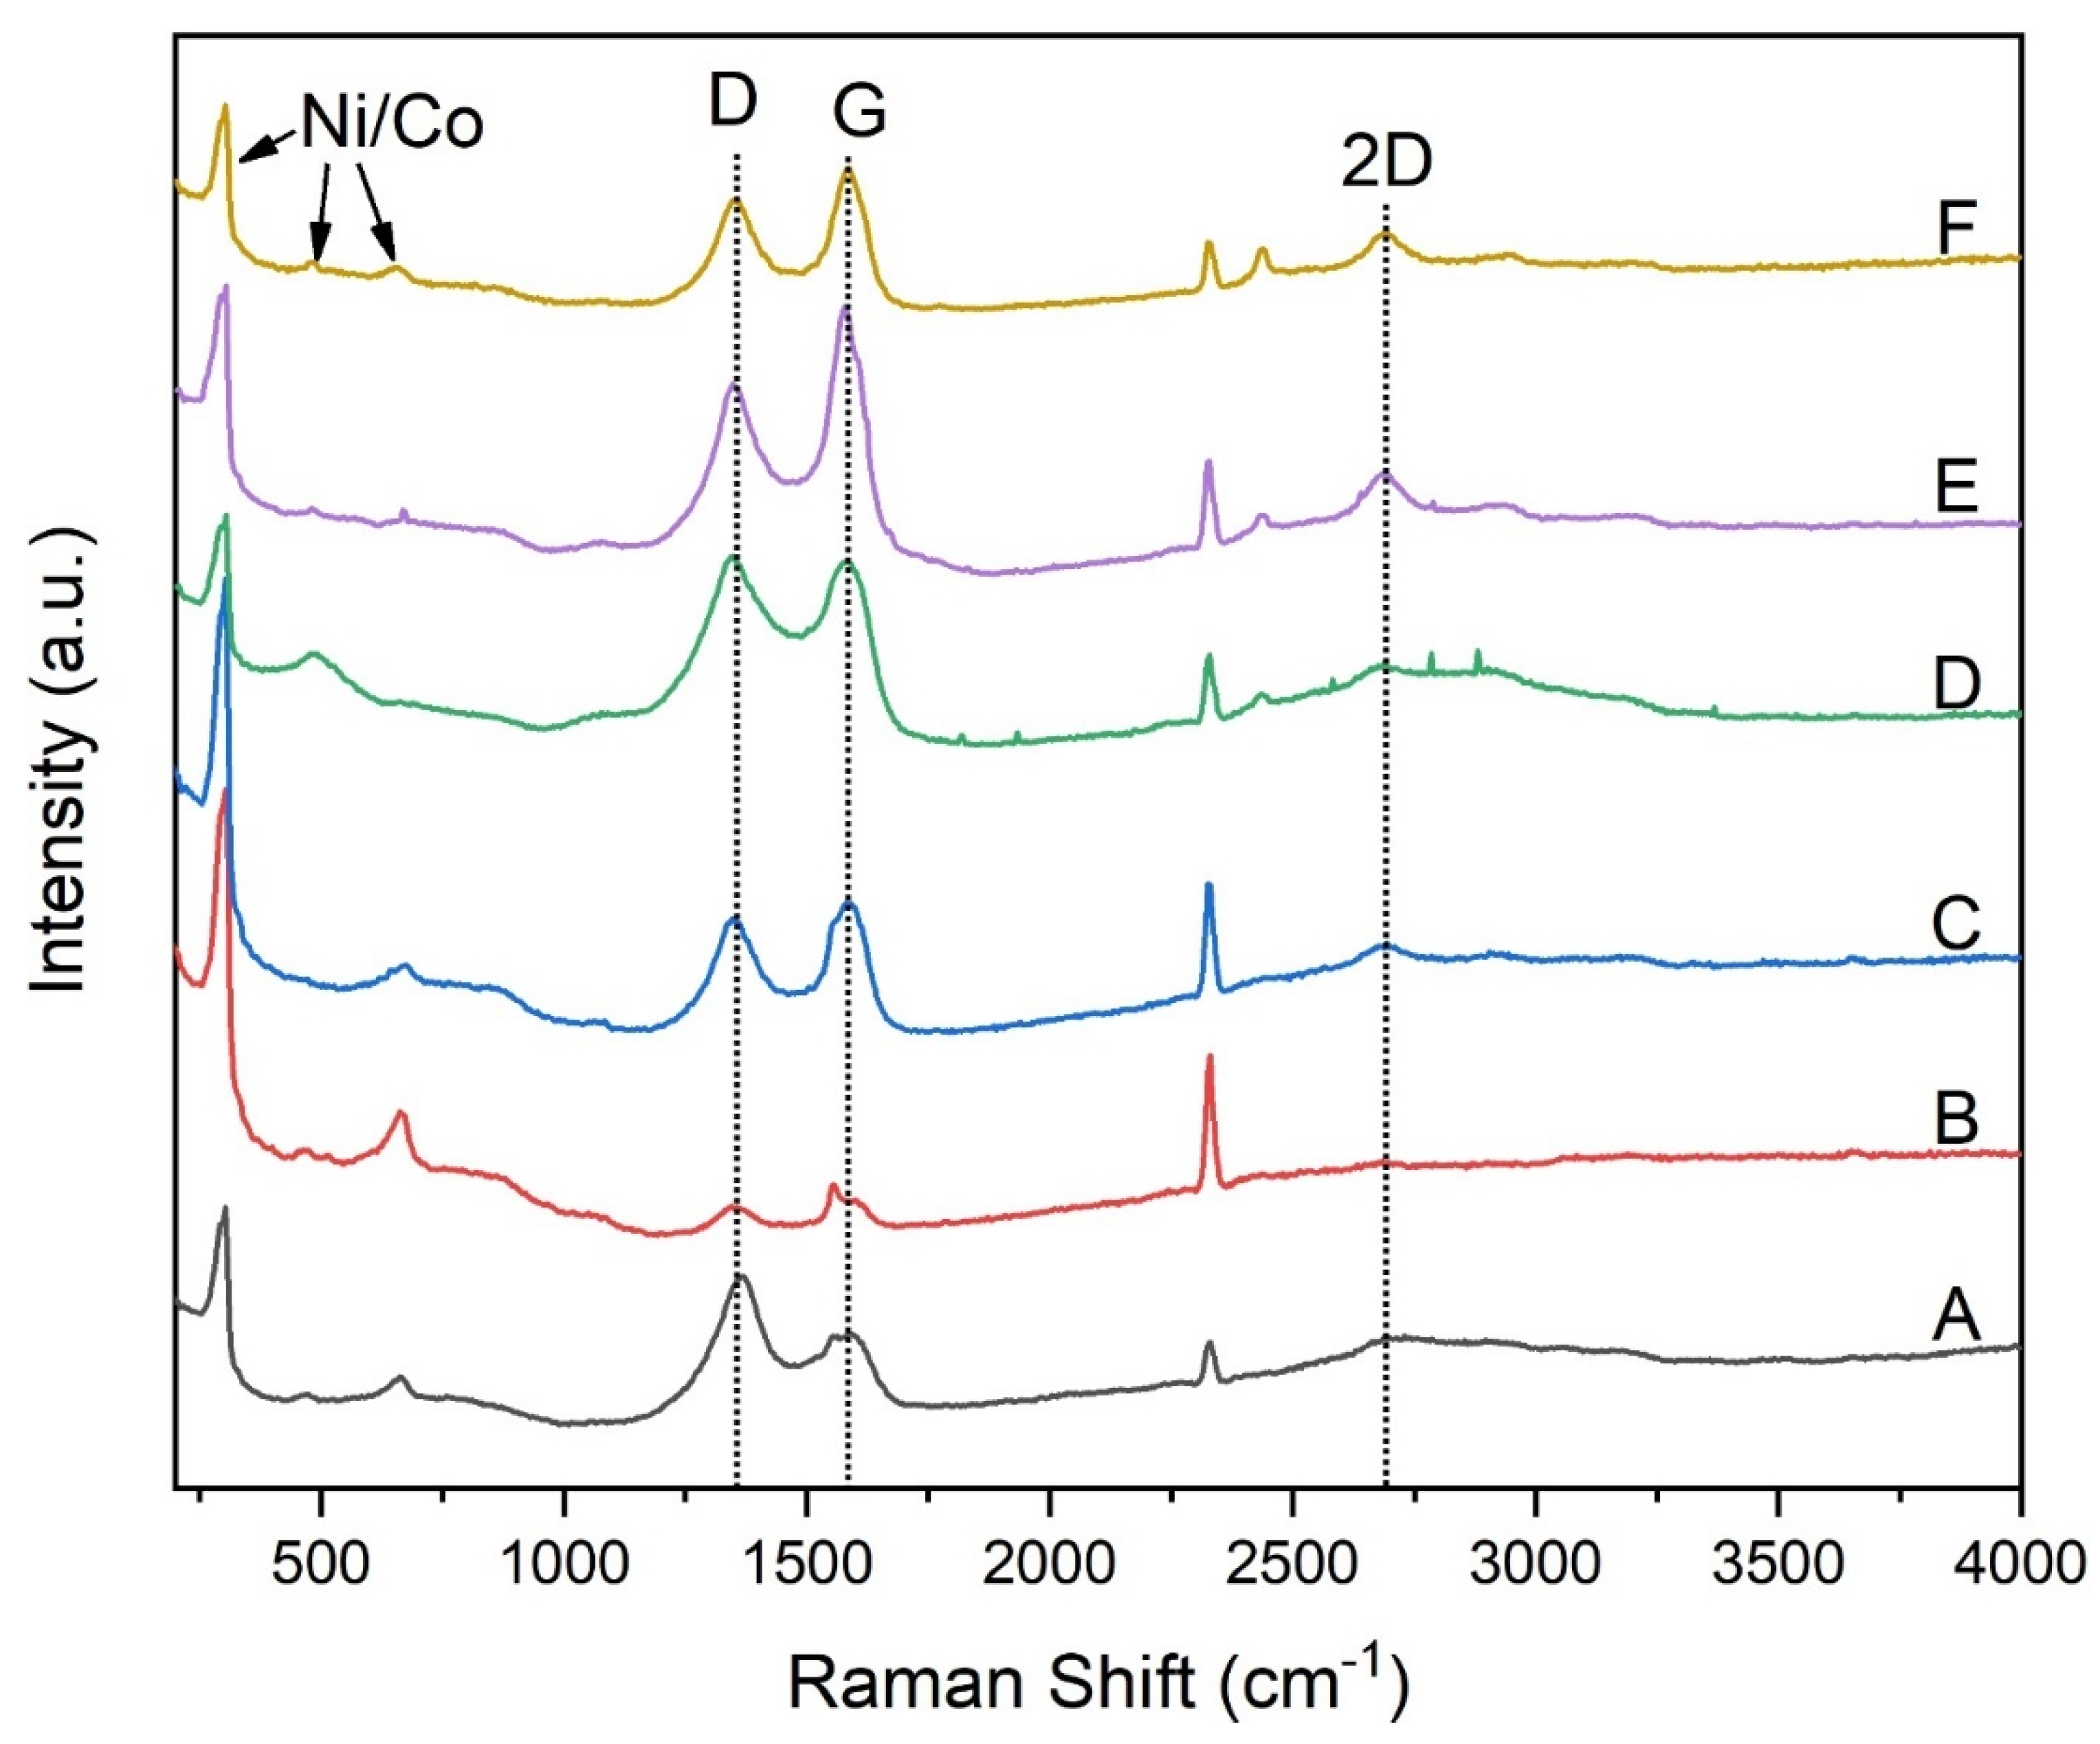
The Raman spectra of bimetallic NiCo nanofibers (Ni:Co = 1:2) thermally treated at 450, 850, and 1050 °C encompass two broad peaks located at 1350 cm−1 and 1588 cm−1, identified as the D band and G band, respectively [52]. The G band corresponds to the sp2-bonded carbon atoms, resulting from the doubly degenerate E2g symmetry at the Brillouin zone center. Conversely, the D band is associated with defects and disorders in the carbon lattice, originating from the double resonant processes near the K point of the Brillouin zone boundary [53]. Furthermore, a 2D (or G’) band at 2693 cm−1 is linked to the stacking order of graphene layers, ensuing from the two-phonon scattering process, and implicates an in-plane transverse optical mode near the zone boundary K point [54]. As the heating temperature escalated from 450 °C to 1050 °C, a decline in the D band’s intensity coupled with an enhancement in the G band’s intensity was observed (Figure 6A–C). This shift corroborates the formation of highly crystalline carbon domains within the nanofibers, aligning with the nanofiber graphitization witnessed in XRD. A similar trend was noted in NiCo nanofibers with a Ni/Co ratio of 1/1 (Figure 6D,E), which yielded highly crystalline carbon nanofibers at 1050 °C. Moreover, monometallic Ni nanofibers subjected to 1050 °C heat treatment also exhibited a relatively higher G band intensity than the D band, suggesting that graphitization is temperature-dependent. Correspondingly, the increased intensity of the 2D band with elevated temperature further illustrates the growth of graphene layers within these carbon nanofibers. Metal symmetric and asymmetric stretching frequencies fall within the 150–750 cm−1 range, contingent upon metal–metal bonds and metal–ligand interactions [55]. The enhancement of metal-related peak intensity is due to the excitation of molecules at the red end of their d–d transition [56]. The prominent peaks at 302, 482, and 664 cm−1 are ascribed to Ni–Ni, Co–Co, and Ni–Co stretching modes, along with augmented Ni–C and Co–C interactions [57]. The most pronounced peaks were identified in the Raman spectra of bimetallic NiCo with a 1/2 molar ratio (Figure 6B,C) at 850 and 1050 °C, underscoring robust bonding among metals and strong interactions between metals and carbon.

2.3. Catalytic Performance of Mono- and Bimetallic Nanofiber Catalysts for CO2 Hydrogenation

The catalytic performance of nanofiber catalysts was assessed using a flow-bed reactor at atmospheric pressure. The Ni/Co elemental contents within the nanofibers were quantified via ICP-MS and XRF, yielding results consistent with the estimated metal loadings and Ni/Co molar ratios. For instance, ICP-MS confirmed that the NiCo nanofibers contained 4.91% Ni and 10.41% Co, and XRF revealed a Ni/Co molar ratio of 1.03/2.11, agreeing with the theoretical value of a 1/2 Ni/Co molar ratio. Five different nanofiber catalysts, comprising two monometallic and three bimetallic variations with specified metal loadings and Ni/Co ratios, underwent reduction and activation at 350 °C for 2 h in a 50% H2 stream. During the reduction reactions, no hydrocarbons, such as alkanes (e.g., CH4, C2H6, C3H8, C4H10, C5H12, C6H14) and alkenes (e.g., C2H4, C3H6, C4H8, C5H10, and C6H12), and other nonhydrocarbon products, such as CO, CH3OH, and H2O, were detected by the online gas chromatography, indicating no reactions between the carbon support and H2. CO2 hydrogenation was then gauged at five distinct temperatures: 275, 300, 325, 350, and 400 °C in a 3:1:1 H2:N2:CO2 stream at atmospheric pressure. At each temperature, six GC injections were executed, hence yielding six data points for product analysis. In all the above catalyst tests, carbon nanofibers were used as blank references, which were inert in CO2 hydrogeneration.
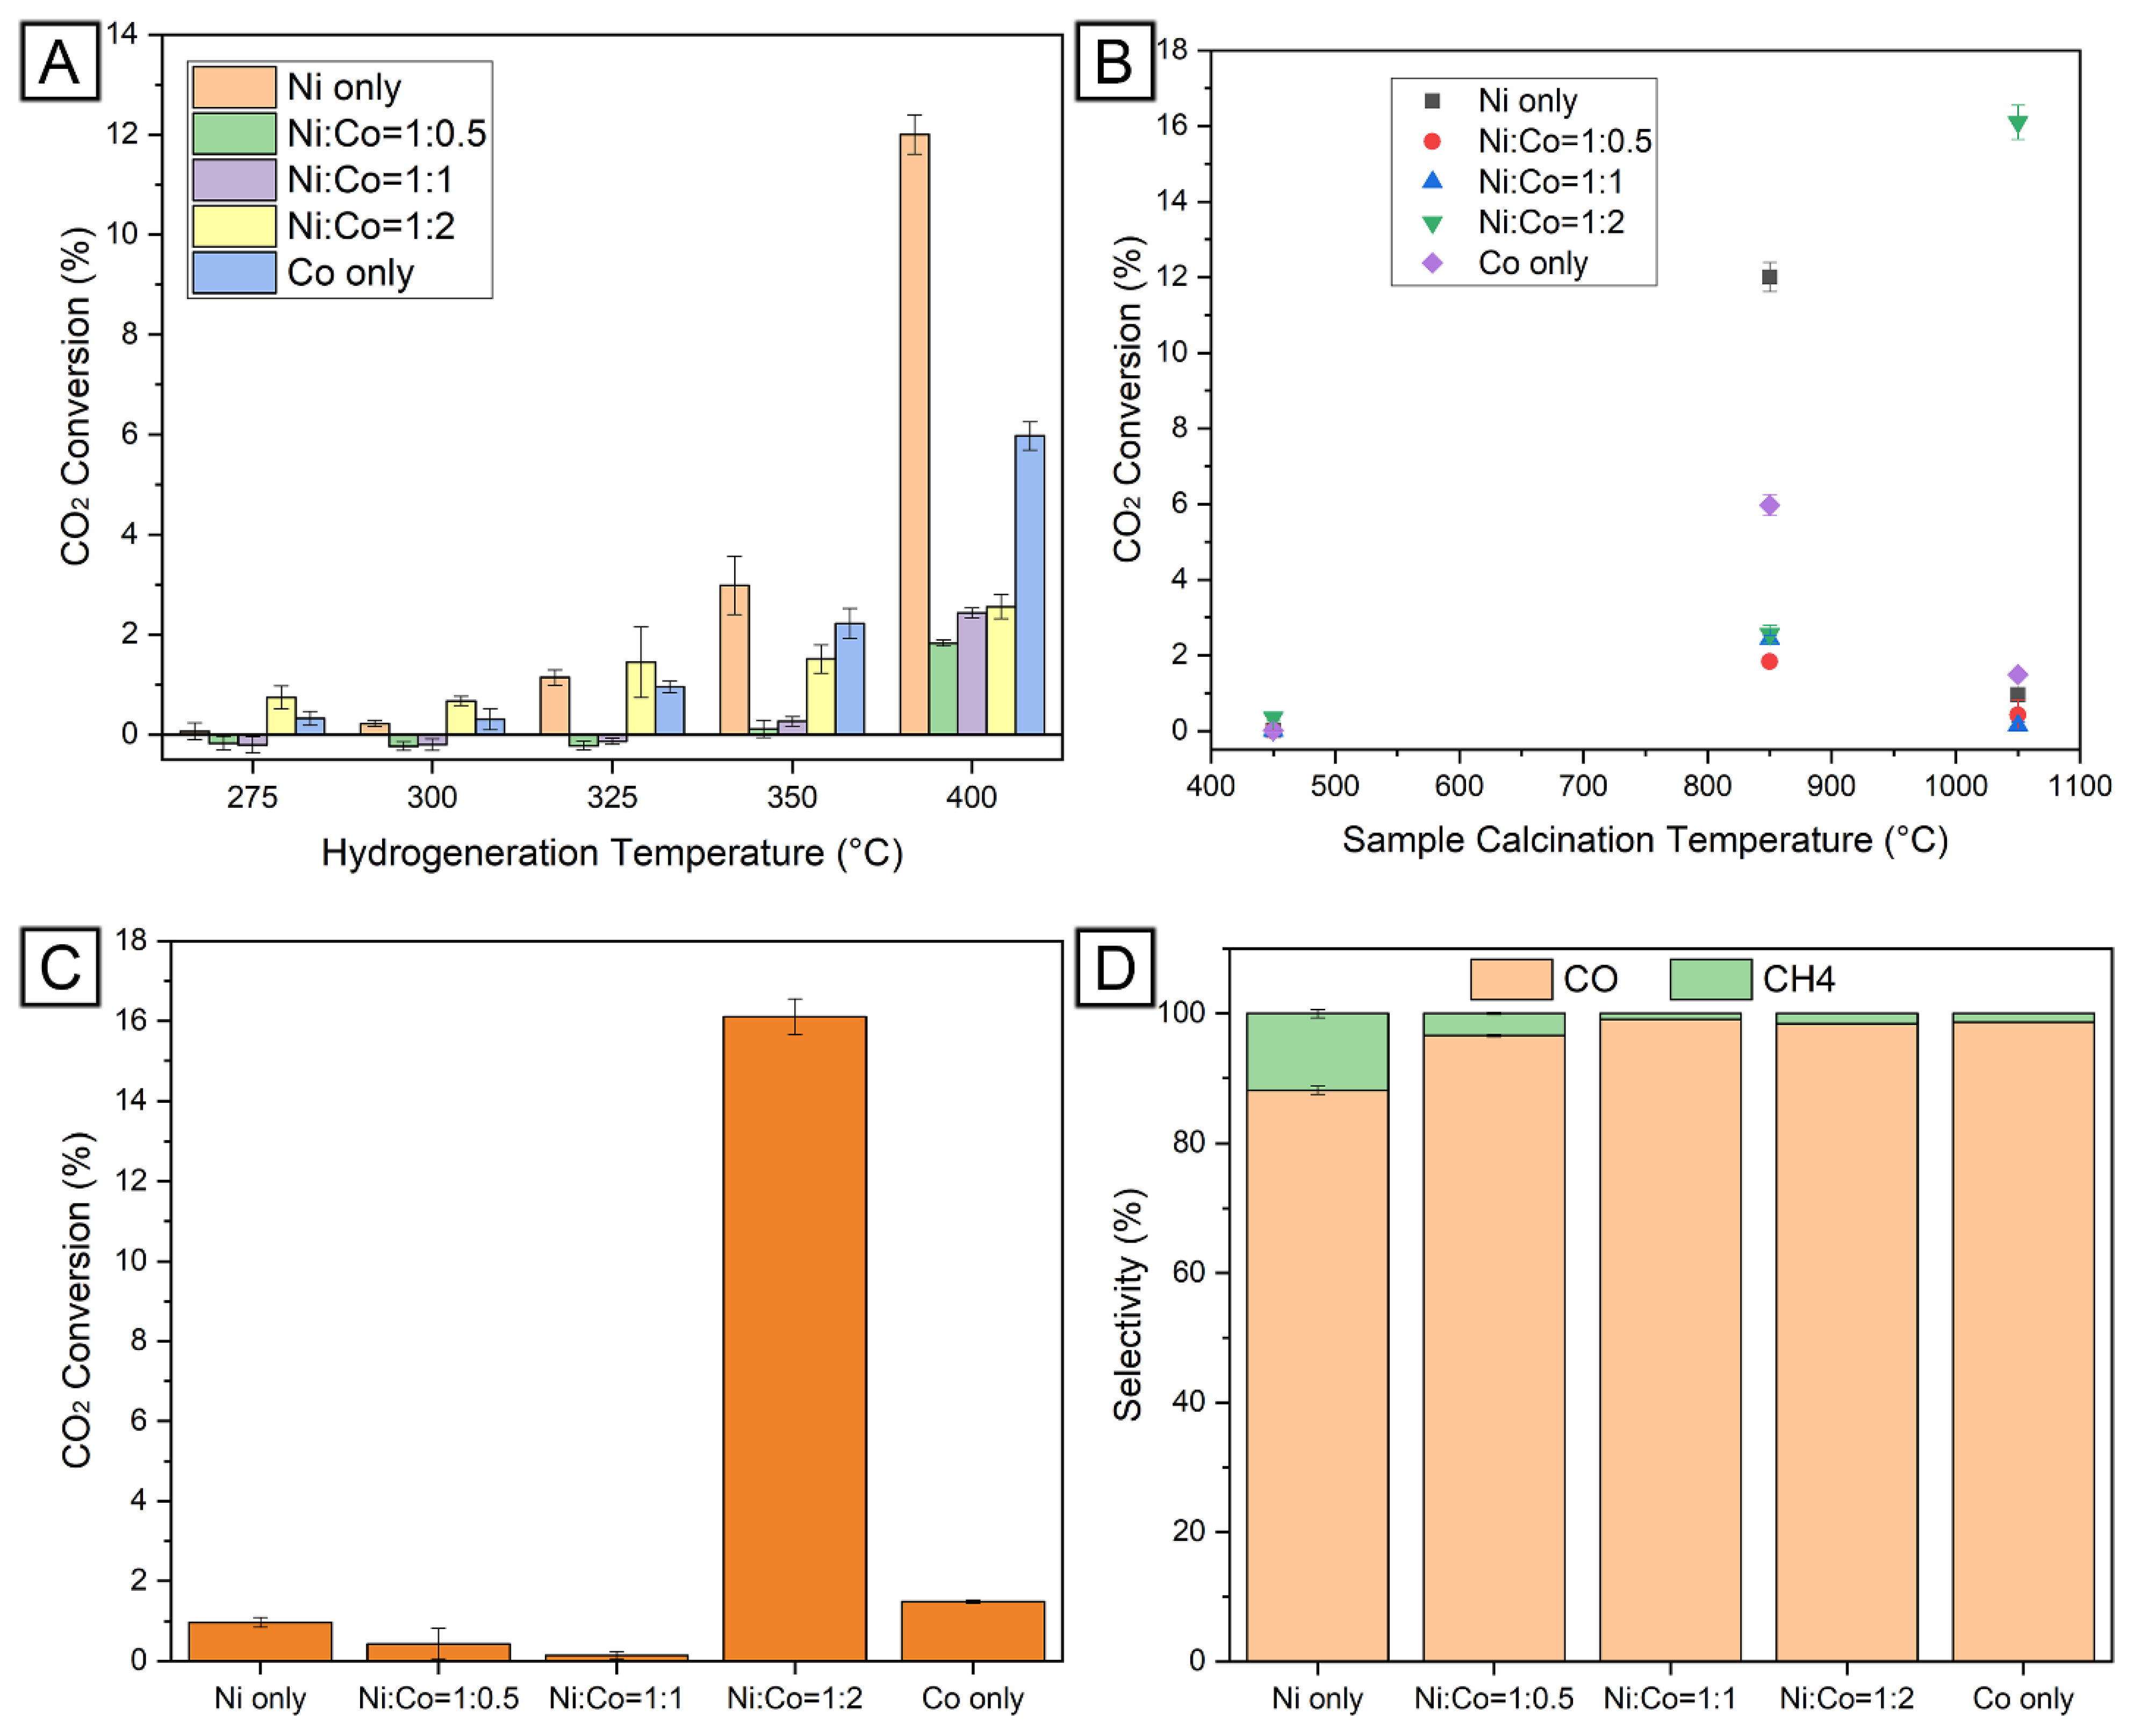
As illustrated in Figure 7A, CO2 conversion ascended as the temperature increased from 275 to 400 °C, with an apex at 400 °C. This outcome indicates that higher temperatures favor CO2 conversion. Interestingly, among the five nanofiber catalysts preheated at 850 °C, the monometallic Ni and Co catalysts exceeded the bimetallic NiCo catalysts in CO2 conversion, achieving 12.01% and 5.97%, respectively. Given the optimal performance at 400 °C for CO2 hydrogenation, the activity of nanofiber catalysts thermally treated at 450, 850, and 1050 °C were analyzed and compared under identical testing conditions at a 400 °C reaction temperature (Figure 7B). All nanofiber catalysts heated at 450 °C demonstrated no activity for CO2 hydrogenation. Despite the conversion of Ni/Co acetates into their metallic forms, as suggested by TGA–DSC, XRD, and Raman analyses, the lack of activity might be attributed to amorphous carbon deposition on nanoparticle surfaces, which hindered the accessibility of active sites to reactive species [33].
However, when the thermal treatment temperature was raised to 850 °C, all nanofiber catalysts displayed discernible activity for CO2 hydrogenation. The highest CO2 conversion was observed with monometallic Ni nanofiber catalysts, potentially due to their small Ni nanoparticle size and resistance to carbon deposition [58]. Notably, the measured average sizes of Ni and Co nanoparticles were 10.1 nm and 14.1 nm, respectively, while a 1/1 NiCo ratio resulted in a 15.3 nm size based on their XRD (111) planes. Post-heating to 1050 °C, except for the 1/2 NiCo bimetallic nanofiber catalysts, all other nanofiber catalysts were essentially deactivated. Figure 7C reveals CO2 conversions of 0.96% and 1.48% for monometallic Ni and Co nanofiber catalysts, respectively. The bimetallic NiCo nanofibers with 1/0.5 and 1/1 Ni/Co molar ratios achieved CO2 conversions of 0.42% and 0.14%, respectively. However, a significant surge to 16.1% in CO2 conversion was observed with the 1/2 NiCo nanofiber catalysts, being 16.7 times greater than that of Ni and 10.8 times more than Co. This stark increase underscores the enhanced performance of the 1/2 NiCo nanofiber catalysts. The primary products of CO2 hydrogenation were found to be CO and CH4. Figure 7D presents the selectivity of these two products. In particular, the selectivity for CO was recorded at 88.1% for Ni, 96.6% for 1/0.5 NiCo, 99.1% for 1/1 NiCo, 98.4% for 1/2 NiCo, and 98.7% for Co.
The underlying factors contributing to the enhanced catalytic efficiency of the 1/2 NiCo nanofiber catalysts presented an interesting point of study. Figure 8 illustrates the distribution and size of nanoparticles across the surface of the nanofibers. Based on XRD data, the average nanoparticle size approximates 5 nm for the samples treated at 450 °C. These nanoparticles were uniformly distributed on the nanofibers with no evident signs of clustering (Figure 8A). Despite this, the 450 °C NiCo nanofiber catalyst remained inactive, potentially due to the deposition of amorphous carbon species on the nanoparticles (Figure 5E and Figure 6A). The samples treated at 850 °C exhibited indications of particle size growth due to high-temperature sintering (Figure 8B). As the thermal treatment was raised to 1050 °C, large particles with diameters ranging from 100–200 nm were observed (Figure 8C). However, most of the particles remained below 25 nm, aligning well with the XRD measurements (Figure 5E). Figure 8D reveals sintered NiCo particles exceeding 200 nm in size when the temperature was raised to 1250 °C, with no smaller nanoparticles identifiable on the nanofibers.
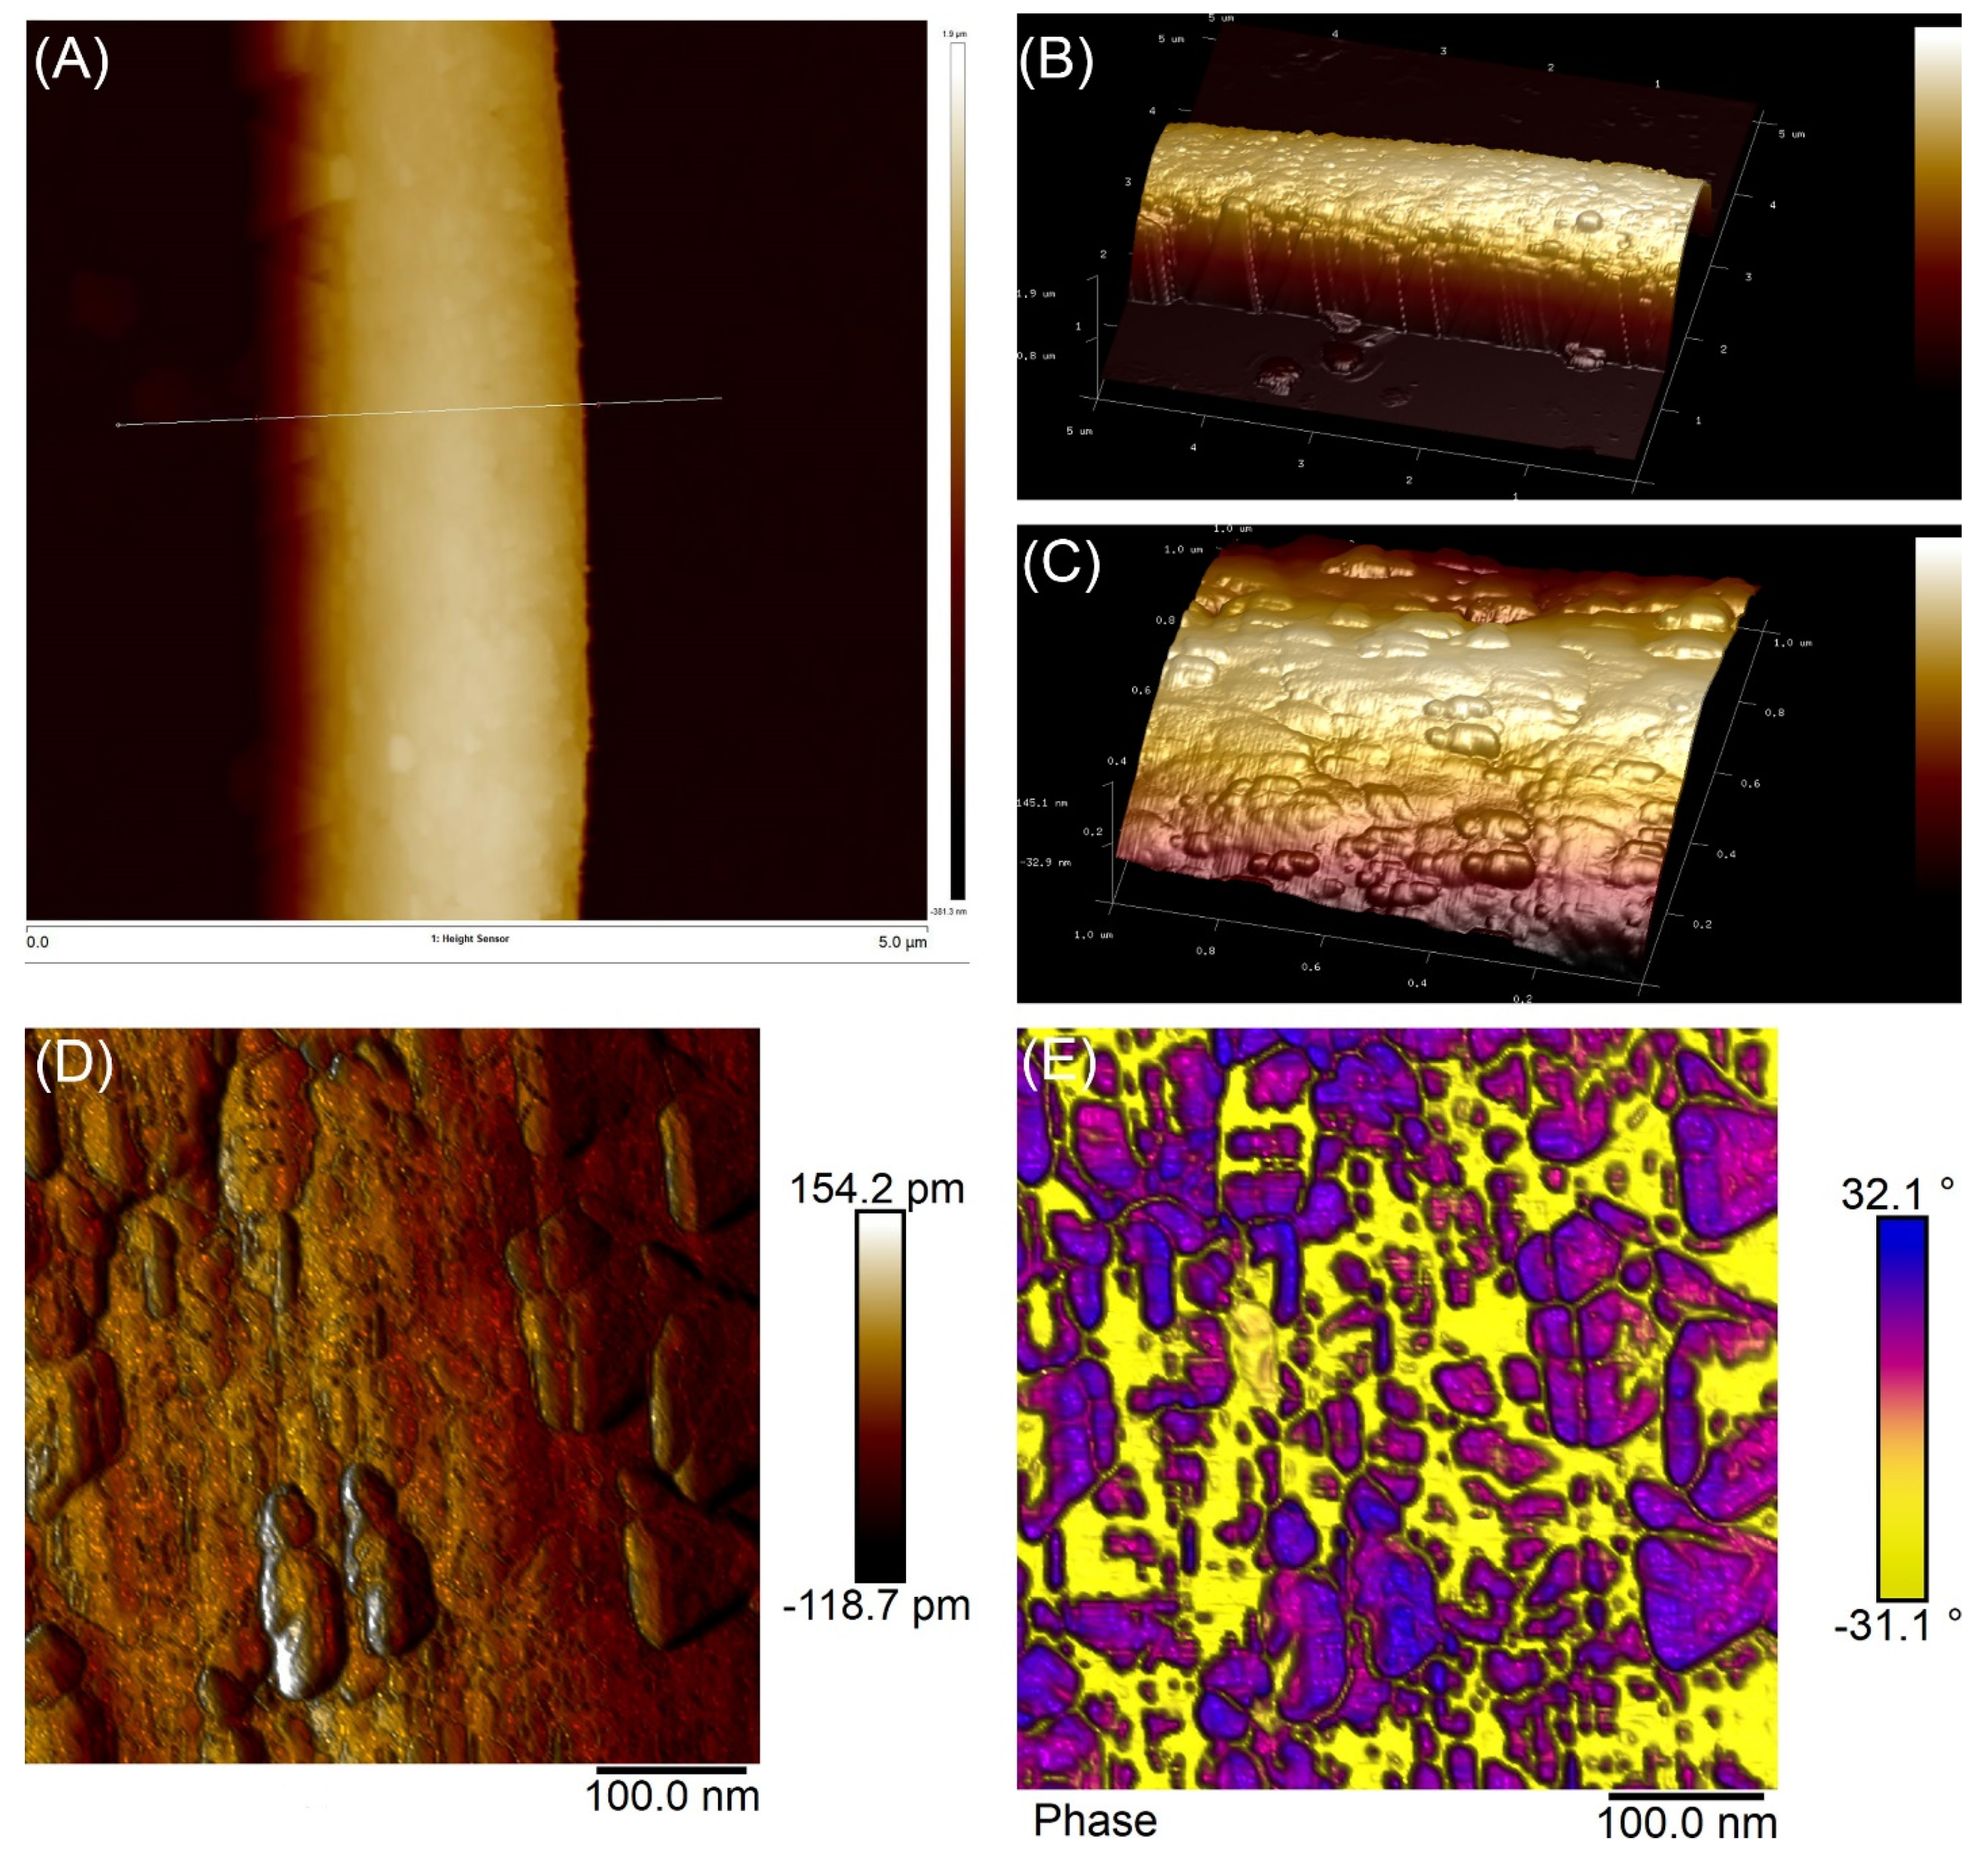
A closer examination of NiCo nanoparticles on the 1050 °C sample was conducted using AFM scans. These scans focused on a NiCo fiber of approximately 1.5 μm in diameter, as illustrated in Figure 9A. The reconstructed 3D images (Figure 9B,C) demonstrate a relatively even distribution of NiCo domains on the nanofiber surface. The NiCo nanoparticles, partially embedded in the carbon with exposed surface, showcase a strong interfacial interaction between the metal and carbon. This may contribute to improving the catalytic efficiency in CO2 hydrogenation. Moreover, the 2D images derived from the amplitude error (Figure 9D) and phase (Figure 9E) validate the presence of numerous small nanoparticles with sizes under 25 nm, reinforcing the SEM observations and XRD measurements.

3. Materials and Methods

Nickel(II) acetate tetrahydrate (ACS reagent, ≥98.0%, Ni(OCOCH3)2·4H2O), Cobalt(II) acetate tetrahydrate (ACS reagent, ≥98.0%, Co(CH3COO)2·4H2O), and polyacrylonitrile (PAN) with a weight average molecular weight (Mw) of 150,000 were obtained from Sigma-Aldrich, serving as precursors for Ni, Co, and carbon, respectively. Anhydrous N,N-dimethylformamide (≥99.9%, DMF, VWR) functioned as the solvent to dissolve the salts and polymer, facilitating the creation of electrospinning solutions. Nitric acid (67–70%, ARISTAR PLUS for trace metal analysis, HNO3) and hydrochloric acid (34–37%, ARISTAR PLUS for trace metal analysis, HCl), sourced from VWR, were employed as solvents to dissolve metals in catalysts for the quantification of Ni and Co content. The acquired chemicals underwent no further purification. Water employed in the experiments underwent purification through a Millipore Direct-Q 8 UV water purification system, yielding a resistivity of 18.2 MΩ·cm at 25 °C.

3.1. Synthesis of Mono- and Bimetallic Ni–Co Nanofiber Catalysts

Nanofiber catalysts containing Ni and/or Co were prepared by electrospinning of DMF solutions comprising PAN, Ni(OAc)2, and/or Co(OAc)2, succeeded by nitrogen-flow pyrolysis to transform PAN and salt precursors into nanofiber catalysts. In a representative procedure, the solution was placed into a 5 mL syringe equipped with a 22-gauge flat metal needle, approximately 2.5 cm long (BD Medical, Franklin Lakes, NJ, USA), and dispensed at 1 mL/h using a syringe pump (Legato 110, KD Scientific, Holliston, MA, USA) at 22 °C and 45% relative humidity. A 15 kV voltage from a DC power source (ES30P-5W, Gamma High Voltage Research, Ormond Beach, FL, USA) was applied to the vertically oriented needle. The charged jet transformed into fine fibers, collected on a conductive substrate positioned roughly 15 cm below the needle’s tip. The resulting nonwoven mat underwent pyrolysis at 450, 850, 1050, and 1250 °C in nitrogen flow for 1 h with a 10 °C/min ramp rate, converting PAN, Ni(OAc)2, and Co(OAc)2 into carbon, Ni, and Co, respectively. The monometallic Co and Ni nanofiber catalysts, as well as bimetallic NiCo nanofiber catalysts with varying Ni/Co molar ratios, were dried in a vacuum oven at room temperature for 24 h before subsequent characterizations.

3.2. Characterization

High-resolution field-emission scanning electron microscopy (SEM, Apreo, FEI) was utilized to investigate the morphology and structure of as-spun composite nanofibers and as-calcined nanofiber catalysts. To boost their electrical conductivity, all samples were sputter-coated with gold for 30–120 s, contingent upon the specific sample. Representative images were captured at an analytical working distance of 6 mm, using an accelerating voltage of 10 kV and a beam current of 0.40 nA. Nanofiber size measurements were conducted with ImageJ 1.53t software (NIH), based on representative SEM images, while fiber size distribution was statistically analyzed using OriginPro 2018 software (OriginLab).
AFM imaging of nanofiber catalysts was carried out with a Bruker Dimension XR scanning probe microscope system (Santa Barbara, CA, USA). A few drops of diluted nanofiber suspension in ethanol (~0.01%) were deposited onto freshly cleaved mica substrate (highest grade V1 mica discs, 12 mm, Electron Microscopy Sciences) and left to dry. Samples were scanned in air at ambient relative humidity and temperature in tapping mode using OTESPA-R3 standard silicon probes (tip radius < 10 nm, spring constant = 26 N/m, resonant frequency = 300 kHz) (Olympus Corp.) at a 1 Hz scan rate and 512 pixels × 512 pixels image resolution. Image processing, section analysis, and 3D simulation were conducted with NanoScope Analysis 3.00 software, and average heights were determined from AFM height images.
Nanofiber chemical composition was analyzed using a PerkinElmer Frontier infrared spectrometer with the attenuated total reflection (ATR) technique. Nanofiber absorbance spectra were recorded in the 4000–650 cm−1 range at 4 cm−1 resolution, averaging 128 scans.
X-ray fluorescence spectrometry (XRF) utilizing a Rigaku ZSX Primus II instrument was employed to determine the major elemental compositions present in the solid nanofiber catalysts. X-rays were produced by a rhodium anode operating at a voltage of 50 kV and a current of approximately 50 mA. In a standard experimental procedure, around 0.1 g of the catalysts were sandwiched between two Prolene thin films (Chemplex Industries, Palm City, FL, USA) on a tubular support. The samples were then placed in 40 mm diameter circular stainless-steel cups, equipped with polypropylene centering devices with a diameter of 10 mm. The measurements were conducted under vacuum conditions to ensure accuracy and reliability.
Ni and Co contents in nanofiber catalysts were ascertained via ICP-MS (Agilent 7900 ICP-MS). Samples first underwent acid extraction using concentrated HNO3 (67–70%) under intermittent sonication for 24 h, followed by filtration to eliminate carbon particles using a 0.45 μm syringe filter. The clear filtrate was then diluted to the estimated final concentrations in the 1–200 ppb range using 1% HNO3 aqueous solution. Eight standard solutions containing 0, 1, 5, 10, 30, 50, 100, and 200 ppb of Ni and Co were employed to create a standard calibration curve for calculating exact Ni and Co concentrations in sample solutions. ICP-grade HNO3 (metal contents < 1 ppb) and HPLC-grade water (18.2 MΩ·cm at 25 °C, filtered by a 0.22 μm membrane filter) were used to prepare sample and standard solutions.
A simultaneous TGA/DSC analyzer (TA SDT Q600) determined the thermal degradation profiles of as-spun composite nanofibers. In a typical measurement, approximately 10 mg of nanofibers were heated in an alumina pan from room temperature (~20 °C) to 1300 °C at a 10 °C/min ramp rate in dry nitrogen (purging rate: 100 mL/min).
Powder XRD patterns were collected using a Bruker D8 Discover diffractometer with Cu Kα radiation (40 kV and 40 mA), applying 0.02° per step and 0.5 s/step parameters, at a 2θ angle ranging from 5 to 90°.
Raman analysis was conducted using a Horiba LabRAM HR Evolution Raman spectrometer, utilizing a diode laser with λex = 532 nm as the excitation source. The experimental parameters were set as follows: the samples were placed on a glass microscope slide, a 50× objective was used, and spectra were acquired over a range of 200–4000 cm−1 with a laser power of 1.5 mW focused through a 50 μm slit (focus spot ~1 μm2). Each spectrum was obtained by accumulating data over an exposure time of 300 s twice. The homogeneity of the sample determined the number of sample spots analyzed, with approximately nine different spots sampled for the Raman spectra.

3.3. Catalyst Evaluation

The nanofiber catalysts were assessed using a quartz tube (4 mm i.d., 6.35 mm o.d.) flow-bed reactor at various temperatures and ambient pressure. For each catalyst test, approximately 100 mg of catalyst with a uniform mesh size of 40–60 was loaded into the quartz tube, with quartz wool pieces securing both sides of the catalyst. The catalyst was reduced in a 50% H2/N2 stream (40 mL/min in total) at 350 °C for 2 h and subsequently cooled to 275 °C before CO2 hydrogenation. Unless specifically addressing varying CO2/H2 volume ratios, the feed gas—CO2, H2, and N2—was introduced into the reactor at atmospheric pressure with a 1/3/1 ratio (40 mL/min in total). The catalyst temperature was then increased from 275 to 400 °C in 25–50 °C increments. The product stream was analyzed in real time using gas chromatography (GC Agilent 8890) with a flame ionization detector (FID) and a thermal conductive detector (TCD). An HP-PLOT Q capillary column was connected to FID for hydrocarbon separation and quantification. The Mol Sieve 5 Å PLOT capillary column was linked to TCD for detecting N2, H2, CO2, CO, and CH4. Sequence runs were organized in a queue to gather data at different temperatures. At each temperature, six GC data points were obtained. Reaction parameters, such as CO2 conversion (Equation (1)) and CO selectivity (Equation (2)), are defined as follows:
CO 2   conversion = n CO 2 ( in )   n CO 2 ( out ) n CO 2 ( in ) × 100
CO   selectivity = n co ( out ) n i ( out ) ×   carbon   number × 100
where nCO2(in) and nCO2(out) represent the number of moles of CO2 fed and not converted, respectively. nproduct i refers to the mole of product i, while the carbon number indicates the number of carbons present in product i. Σni(out) represents the total number of moles of carbon-containing products generated in the reaction.

4. Conclusions

In conclusion, this study systematically explored the thermal transformation of Ni/Co–PAN nanofibers, establishing a clear understanding of the role of heating temperature in the formation and conversion of PAN, Ni(OAc)2, and Co(OAc)2 to carbon structures and metallic nanoparticles. TGA–DSC, ATR, XRD, and Raman analyses elucidated the transition of PAN to carbon-based structures, graphitization process, and the formation of Ni and Co nanoparticles. Intriguingly, the bimetallic NiCo nanofiber catalysts exhibited enhanced CO2 conversion, particularly those with a Ni/Co ratio of 1/2 that were heated at 1050 °C. This performance is attributed to the formation of highly crystalline carbon domains, the effective NiCo nanoparticle dispersion, and the strong interfacial interaction between metal and carbon domains. Our findings also highlight the critical influence of heating temperature on nanoparticle size and distribution. Notably, the thermal treatment at 1050 °C promoted the formation of larger particles. However, despite particle growth, most NiCo particles remained below 25 nm, consistent with XRD measurements and SEM observations. Overall, our study provides valuable insights into the transformation process and catalytic behaviors of NiCo catalysts, paving the way for more effective design and fabrication of bimetallic nanofiber catalysts. Future work will focus on further optimizing the Ni/Co ratios and exploring different heating conditions to enhance the catalytic performance for CO2 hydrogenation.

Author Contributions

Conceptualization, P.L.; methodology, P.L.; software, P.L.; validation, P.L., C.Z. and L.Y.; formal analysis, J.S., A.G., K.A., D.W., M.W., W.W., K.X., and R.C.; investigation, J.S.; resources, P.L.; data curation, P.L, J.S., A.G., D.W., M.W., W.W., I.M., D.C.H., and W.C.; writing—original draft preparation, P.L.; writing—review and editing, P.L.; visualization, P.L.; supervision, P.L. and C.Z.; project administration, P.L.; funding acquisition, P.L., C.Z., and L.Y.. All authors have read and agreed to the published version of the manuscript.

Funding

This research was funded by the Startup Fund and the Catalyst Fund from Rowan University, the Research Grant (#PC 20-22) from the New Jersey Health Foundation, and the Grants (#2116353, 2018320, and 1955521) from the National Science Foundation.

Data Availability Statement

The data presented in this study are available on request from the corresponding authors (P.L. and C.Z.). The data are not publicly available due to privacy.

Conflicts of Interest

The authors declare no conflict of interest.

References

  1. Wang, Y.; Tian, Y.; Pan, S.-Y.; Snyder, S.W. Catalytic Processes to Accelerate Decarbonization in a Net-Zero Carbon World. ChemSusChem 2022, 15, e202201290. [Google Scholar] [CrossRef] [PubMed]
  2. Vogt, C.; Weckhuysen, B.M. The concept of active site in heterogeneous catalysis. Nat. Rev. Chem. 2022, 6, 89–111. [Google Scholar] [CrossRef] [PubMed]
  3. Friend, C.M.; Xu, B. Heterogeneous Catalysis: A Central Science for a Sustainable Future. Acc. Chem. Res. 2017, 50, 517–521. [Google Scholar] [CrossRef] [PubMed]
  4. Ra, E.C.; Kim, K.Y.; Kim, E.H.; Lee, H.; An, K.; Lee, J.S. Recycling Carbon Dioxide through Catalytic Hydrogenation: Recent Key Developments and Perspectives. ACS Catal. 2020, 10, 11318–11345. [Google Scholar] [CrossRef]
  5. Tawalbeh, M.; Javed, R.M.N.; Al-Othman, A.; Almomani, F. The novel contribution of non-noble metal catalysts for intensified carbon dioxide hydrogenation: Recent challenges and opportunities. Energy Convers. Manag. 2023, 279, 116755. [Google Scholar] [CrossRef]
  6. Yusuf, N.; Almomani, F.; Qiblawey, H. Catalytic CO2 conversion to C1 value-added products: Review on latest catalytic and process developments. Fuel 2023, 345, 128178. [Google Scholar] [CrossRef]
  7. Lv, C.; Bai, X.; Ning, S.; Song, C.; Guan, Q.; Liu, B.; Li, Y.; Ye, J. Nanostructured Materials for Photothermal Carbon Dioxide Hydrogenation: Regulating Solar Utilization and Catalytic Performance. ACS Nano 2023, 17, 1725–1738. [Google Scholar] [CrossRef]
  8. Qu, R.; Junge, K.; Beller, M. Hydrogenation of Carboxylic Acids, Esters, and Related Compounds over Heterogeneous Catalysts: A Step toward Sustainable and Carbon-Neutral Processes. Chem. Rev. 2023, 123, 1103–1165. [Google Scholar] [CrossRef]
  9. Siegel, R.E.; Pattanayak, S.; Berben, L.A. Reactive Capture of CO2: Opportunities and Challenges. ACS Catal. 2023, 13, 766–784. [Google Scholar] [CrossRef]
  10. Zhao, H.; Yu, R.; Ma, S.; Xu, K.; Chen, Y.; Jiang, K.; Fang, Y.; Zhu, C.; Liu, X.; Tang, Y.; et al. The role of Cu1–O3 species in single-atom Cu/ZrO2 catalyst for CO2 hydrogenation. Nat. Catal. 2022, 5, 818–831. [Google Scholar] [CrossRef]
  11. Mao, D.; Zhang, J.; Zhang, H.; Wu, D. A highly efficient Cu-ZnO/SBA-15 catalyst for CO2 hydrogenation to CO under atmospheric pressure. Catal. Today 2022, 402, 60–66. [Google Scholar] [CrossRef]
  12. Li, C.-F.; Guo, R.-T.; Zhang, Z.-R.; Wu, T.; Pan, W.-G. Converting CO2 into Value-Added Products by Cu2O-Based Catalysts: From Photocatalysis, Electrocatalysis to Photoelectrocatalysis. Small 2023, 19, 2207875. [Google Scholar] [CrossRef] [PubMed]
  13. Syal, B.; Kumar, P.; Gupta, P. Recent Advancements in the Preparation and Application of Copper Single-Atom Catalysts. ACS Appl. Nano Mater. 2023, 6, 4987–5041. [Google Scholar] [CrossRef]
  14. Spennati, E.; Riani, P.; Garbarino, G. A perspective of lanthanide promoted Ni-catalysts for CO2 hydrogenation to methane: Catalytic activity and open challenges. Catal. Today 2023, 418, 114131. [Google Scholar] [CrossRef]
  15. Chen, M.; Li, B.; Wang, F.; Fang, J.; Li, K.; Zhang, C. Enhanced CH4 Selectivity in CO2 Hydrogenation on Bimetallic Pt–Ni Catalysts with Pt Nanoparticles Modified by Isolated Ni Atoms. ACS Appl. Nano Mater. 2023, 6, 5826–5834. [Google Scholar] [CrossRef]
  16. Rommens, K.T.; Saeys, M. Molecular Views on Fischer–Tropsch Synthesis. Chem. Rev. 2023, 123, 5798–5858. [Google Scholar] [CrossRef]
  17. Lozano-Reis, P.; Prats, H.; Gamallo, P.; Illas, F.; Sayós, R. Multiscale Study of the Mechanism of Catalytic CO2 Hydrogenation: Role of the Ni(111) Facets. ACS Catal. 2020, 10, 8077–8089. [Google Scholar] [CrossRef]
  18. Szamosvölgyi, Á.; Rajkumar, T.; Sápi, A.; Szenti, I.; Ábel, M.; Gómez-Pérez, J.F.; Baán, K.; Fogarassy, Z.; Dodony, E.; Pécz, B.; et al. Interfacial Ni active sites strike solid solutional counterpart in CO2 hydrogenation. Environ. Technol. Innov. 2022, 27, 102747. [Google Scholar] [CrossRef]
  19. Galhardo, T.S.; Braga, A.H.; Arpini, B.H.; Szanyi, J.; Gonçalves, R.V.; Zornio, B.F.; Miranda, C.R.; Rossi, L.M. Optimizing Active Sites for High CO Selectivity during CO2 Hydrogenation over Supported Nickel Catalysts. J. Am. Chem. Soc. 2021, 143, 4268–4280. [Google Scholar] [CrossRef]
  20. Gandara-Loe, J.; Portillo, E.; Odriozola, J.A.; Reina, T.R.; Pastor-Pérez, L. K-Promoted Ni-Based Catalysts for Gas-Phase CO2 Conversion: Catalysts Design and Process Modelling Validation. Front. Chem. 2021, 9, 785571. [Google Scholar] [CrossRef]
  21. Li, Z.; He, D.; Yan, X.; Dai, S.; Younan, S.; Ke, Z.; Pan, X.; Xiao, X.; Wu, H.; Gu, J. Size-Dependent Nickel-Based Electrocatalysts for Selective CO2 Reduction. Angew. Chem. Int. Ed. 2020, 59, 18572–18577. [Google Scholar] [CrossRef] [PubMed]
  22. Liu, L.; Corma, A. Bimetallic Sites for Catalysis: From Binuclear Metal Sites to Bimetallic Nanoclusters and Nanoparticles. Chem. Rev. 2023, 123, 4855–4933. [Google Scholar] [CrossRef] [PubMed]
  23. Hong, X.; Zhu, H.; Du, D.; Zhang, Q.; Li, Y. Research Progress of Copper-Based Bimetallic Electrocatalytic Reduction of CO2. Catalysts 2023, 13, 376. [Google Scholar] [CrossRef]
  24. Vysakh, A.B.; Lazar, A.; Yadukiran, V.; Singh, A.P.; Vinod, C.P. Phenylacetylene hydrogenation on Au@Ni bimetallic core–shell nanoparticles synthesized under mild conditions. Catal. Sci. Technol. 2016, 6, 708–712. [Google Scholar] [CrossRef]
  25. Yao, F.; Liu, S.; Cui, H.; Lv, Y.; Zhang, Y.; Liu, P.; Hao, F.; Xiong, W.; Luo, H.A. Activated Carbon Supported Non-noble Bimetallic Ni-Based Catalysts for Nitrocyclohexane Hydrogenation to Cyclohexanone Oxime under Mild Conditions. ACS Sustain. Chem. Eng. 2021, 9, 3300–3315. [Google Scholar] [CrossRef]
  26. De, S.; Zhang, J.; Luque, R.; Yan, N. Ni-based bimetallic heterogeneous catalysts for energy and environmental applications. Energ. Environ. Sci. 2016, 9, 3314–3347. [Google Scholar] [CrossRef] [Green Version]
  27. Posada-Pérez, S.; Solà, M.; Poater, A. Carbon Dioxide Conversion on Supported Metal Nanoparticles: A Brief Review. Catalysts 2023, 13, 305. [Google Scholar] [CrossRef]
  28. Yamanaka, N.; Shimazu, S. Selective Hydrogenation Properties of Ni-Based Bimetallic Catalysts. Eng 2022, 3, 60–77. [Google Scholar] [CrossRef]
  29. Reddy, K.P.; Kim, D.; Hong, S.; Kim, K.-J.; Ryoo, R.; Park, J.Y. Tuning CO2 Hydrogenation Selectivity through Reaction-Driven Restructuring on Cu–Ni Bimetal Catalysts. Acs Appl. Mater. Inter. 2023, 15, 9373–9381. [Google Scholar] [CrossRef]
  30. Lu, P.; Ding, B. Applications of electrospun fibers. Recent Pat. Nanotechnol. 2008, 2, 169–182. [Google Scholar] [CrossRef] [PubMed]
  31. Lu, P.; Qiao, B.; Lu, N.; Hyun, D.C.; Wang, J.; Kim, M.J.; Liu, J.; Xia, Y. Photochemical Deposition of Highly Dispersed Pt Nanoparticles on Porous CeO2 Nanofibers for the Water-Gas Shift Reaction. Adv. Funct. Mater. 2015, 25, 4153–4162. [Google Scholar] [CrossRef]
  32. Lu, P.; Campbell, C.T.; Xia, Y. A sinter-resistant catalytic system fabricated by maneuvering the selectivity of SiO2 deposition onto the TiO2 surface versus the Pt nanoparticle surface. Nano Lett. 2013, 13, 4957–4962. [Google Scholar] [CrossRef] [PubMed]
  33. Yoon, K.; Yang, Y.; Lu, P.; Wan, D.; Peng, H.-C.; Stamm Masias, K.; Fanson, P.T.; Campbell, C.T.; Xia, Y. A Highly Reactive and Sinter-Resistant Catalytic System Based on Platinum Nanoparticles Embedded in the Inner Surfaces of CeO2 Hollow Fibers. Angew. Chem. Int. Ed. 2012, 51, 9543–9546. [Google Scholar] [CrossRef] [PubMed]
  34. Dai, Y.; Lu, P.; Cao, Z.; Campbell, C.T.; Xia, Y. The physical chemistry and materials science behind sinter-resistant catalysts. Chem. Soc. Rev. 2018, 47, 4314–4331. [Google Scholar] [CrossRef] [PubMed]
  35. Murray, S.; Wei, W.; Hart, R.; Fan, J.; Chen, W.; Lu, P. Solar Degradation of Toxic Colorants in Polluted Water by Thermally Tuned Ceria Nanocrystal-Based Nanofibers. ACS Appl. Nano Mater. 2020, 3, 11194–11202. [Google Scholar] [CrossRef]
  36. Lu, P.; Xia, Y. Novel nanostructures of rutile fabricated by templating against yarns of polystyrene nanofibrils and their catalytic applications. Acs Appl. Mater. Inter. 2013, 5, 6391–6399. [Google Scholar] [CrossRef] [Green Version]
  37. Bethune, D.S.; Kiang, C.H.; de Vries, M.S.; Gorman, G.; Savoy, R.; Vazquez, J.; Beyers, R. Cobalt-catalysed growth of carbon nanotubes with single-atomic-layer walls. Nature 1993, 363, 605–607. [Google Scholar] [CrossRef]
  38. Xue, T.J.; McKinney, M.A.; Wilkie, C.A. The thermal degradation of polyacrylonitrile. Polym. Degrad. Stab. 1997, 58, 193–202. [Google Scholar] [CrossRef]
  39. Jadhav, S.A.; Dhavale, S.B.; Patil, A.H.; Patil, P.S. Brief overview of electrospun polyacrylonitrile carbon nanofibers: Preparation process with applications and recent trends. Mater. Des. Process. Commun. 2019, 1, e83. [Google Scholar] [CrossRef] [Green Version]
  40. De Jesus, J.C.; González, I.; Quevedo, A.; Puerta, T. Thermal decomposition of nickel acetate tetrahydrate: An integrated study by TGA, QMS and XPS techniques. J. Mol. Catal. A Chem. 2005, 228, 283–291. [Google Scholar] [CrossRef]
  41. Grimes, R.W.; Fitch, A.N. Thermal decomposition of cobalt(II) acetate tetrahydrate studied with time-resolved neutron diffraction and thermogravimetric analysis. J. Mater. Chem. 1991, 1, 461. [Google Scholar] [CrossRef]
  42. Gutiérrez-Martín, D.; Varela, A.; González-Calbet, J.M.; Matesanz, E.; Parras, M. Revisiting the Decomposition Process of Tetrahydrate Co(II) Acetate: A Sample’s Journey through Temperature. Appl. Sci. 2022, 12, 6786. [Google Scholar] [CrossRef]
  43. Ruhland, K.; Frenzel, R.; Horny, R.; Nizamutdinova, A.; van Wüllen, L.; Moosburger-Will, J.; Horn, S. Investigation of the chemical changes during thermal treatment of polyacrylonitrile and 15N-labelled polyacrylonitrile by means of in-situ FTIR and 15N NMR spectroscopy. Polym. Degrad. Stab. 2017, 146, 298–316. [Google Scholar] [CrossRef]
  44. Andrade-Sanchez, M.E.; Hernandez-Perez, M.A.; García-Pacheco, G.; Ortega-Avilés, M. Temperature and pH effect on reaction mechanism and particle size of nanostructured Co3O4 thin films obtained by sol-gel/dip-coating. Mater. Res. Express 2021, 8, 025015. [Google Scholar] [CrossRef]
  45. Setnescu, R.; Jipa, S.; Setnescu, T.; Kappel, W.; Kobayashi, S.; Osawa, Z. IR and X-ray characterization of the ferromagnetic phase of pyrolysed polyacrylonitrile. Carbon 1999, 37, 1–6. [Google Scholar] [CrossRef]
  46. Sellitti, C.; Koenig, J.L.; Ishida, H. Surface characterization of graphitized carbon fibers by attenuated total reflection fourier transform infrared spectroscopy. Carbon 1990, 28, 221–228. [Google Scholar] [CrossRef]
  47. Lu, P.; Huang, Q.; Mukherjee, A.; Hsieh, Y.-L. SiCO-doped Carbon Fibers with Unique Dual Superhydrophilicity/Superoleophilicity and Ductile and Capacitance Properties. Acs Appl. Mater. Inter. 2010, 2, 3738–3744. [Google Scholar] [CrossRef]
  48. Weber, D.; Rui, N.; Zhang, F.; Zhang, H.; Vovchok, D.; Wildy, M.; Arizapana, K.; Saporita, A.; Zhang, J.Z.; Senanayake, S.D.; et al. Carbon Nanosphere-Encapsulated Fe Core–Shell Structures for Catalytic CO2 Hydrogenation. ACS Appl. Nano Mater. 2022, 5, 11605–11616. [Google Scholar] [CrossRef]
  49. Li, J.; Li, P.; Li, J.; Tian, Z.; Yu, F. Highly-Dispersed Ni-NiO Nanoparticles Anchored on an SiO2 Support for an Enhanced CO Methanation Performance. Catalysts 2019, 9, 506. [Google Scholar] [CrossRef] [Green Version]
  50. Garces, L.J.; Hincapie, B.; Zerger, R.; Suib, S.L. The Effect of Temperature and Support on the Reduction of Cobalt Oxide: An in Situ X-ray Diffraction Study. J. Phys. Chem. C 2015, 119, 5484–5490. [Google Scholar] [CrossRef]
  51. Saha, B.; Schatz, G.C. Carbonization in Polyacrylonitrile (PAN) Based Carbon Fibers Studied by ReaxFF Molecular Dynamics Simulations. J. Phys. Chem. B 2012, 116, 4684–4692. [Google Scholar] [CrossRef]
  52. Brubaker, Z.E.; Miskowiec, A.; Niedziela, J.L. Raman spectroscopy of thermally perturbed carbon fibers: Discriminating spectral responses of modulus classes and defect types. Phys. Rev. Mater. 2022, 6, 073603. [Google Scholar] [CrossRef]
  53. Li, Z.; Deng, L.; Kinloch, I.A.; Young, R.J. Raman spectroscopy of carbon materials and their composites: Graphene, nanotubes and fibres. Prog. Mater. Sci. 2023, 135, 101089. [Google Scholar] [CrossRef]
  54. Bokobza, L.; Bruneel, J.-L.; Couzi, M. Raman Spectra of Carbon-Based Materials (from Graphite to Carbon Black) and of Some Silicone Composites. C 2015, 1, 77–94. [Google Scholar] [CrossRef] [Green Version]
  55. Papas, B.N.; Schaefer, H.F., III. Homonuclear transition-metal trimers. J. Chem. Phys. 2005, 123, 074321. [Google Scholar] [CrossRef] [PubMed]
  56. Clérac, R.; Cotton, F.A.; Dunbar, K.R.; Lu, T.; Murillo, C.A.; Wang, X. New Linear Tricobalt Complex of Di(2-pyridyl)amide (dpa), [Co3(dpa)4(CH3CN)2][PF6]2. Inorg. Chem. 2000, 39, 3065–3070. [Google Scholar] [CrossRef]
  57. Yoon, H.; Xu, A.; Sterbinsky, G.E.; Arena, D.A.; Wang, Z.; Stephens, P.W.; Meng, Y.S.; Carroll, K.J. In situ non-aqueous nucleation and growth of next generation rare-earth-free permanent magnets. Phys. Chem. Chem. Phys. 2015, 17, 1070–1076. [Google Scholar] [CrossRef]
  58. Lei, T.; Mao, J.; Liu, X.; Pathak, A.D.; Shetty, S.; van Bavel, A.P.; Xie, L.; Gao, R.; Ren, P.; Luo, D.; et al. Carbon Deposition and Permeation on Nickel Surfaces in Operando Conditions: A Theoretical Study. J. Phys. Chem. C 2021, 125, 7166–7177. [Google Scholar] [CrossRef]
Figure 1. SEM images of composite nanofibers with different Ni/Co ratios before (the first column images) and after heating at 450 °C (the second column), 850 °C (the third column), and 1050 °C (the fourth column): (A) Ni only, (B) 1:0.5, (C) 1:1, (D) 1:2, and (E) Co only. The 1 µm scale bar in ((E), 1050 °C) applies to all images.
Catalysts 13 01017 g001
Figure 2. Fiber diameters of nanofiber catalysts with different Ni/Co ratios with no heating and heating at 450, 850, and 1050 °C.
Catalysts 13 01017 g002
Figure 3. Simultaneous TGA–DSC thermograms showing thermal degradation profiles of (A) pristine precursors and (B) nanofiber catalysts from ambient temperature to 1300 °C. TGA: solid line; DSC: dashed line.
Catalysts 13 01017 g003
Figure 4. Infrared spectra of nanofiber catalysts with different Ni/Co contents: (A) Ni only, (B) Co only, (C) Ni:Co = 1:0.5, (D) Ni:Co = 1:1, and (E) Ni:Co = 1:2.
Catalysts 13 01017 g004
Figure 5. XRD patterns of nanofiber catalysts with different Ni/Co ratios: (A) Ni only, (B) Co only, (C) Ni:Co = 1:0.5, (D) Ni:Co = 1:1, and (E) Ni:Co = 1:2.
Catalysts 13 01017 g005
Figure 6. Raman spectra of nanofiber catalysts with ½ Ni/Co ratio heated at (A) 450 °C, (B) 850 °C, and (C) 1050 °C, and Ni only heated at (D) 850 °C and (E) 1050 °C, and 1/1 Ni/Co at (F) 1050 °C.
Catalysts 13 01017 g006
Figure 7. Catalytic performance of Ni–Co nanofiber catalysts. (A) The effect of hydrogeneration reaction temperature on CO2 conversion. (B) The effect of calcination temperature used to prepare Ni–Co nanofiber catalysts on CO2 conversion. (C) The effect of Ni/Co ratio on CO2 conversion at 400 °C. (D) The effect of Ni/Co ratio on CO and CH4 selectivity at 400 °C. Testing conditions including temperature: 275–400 °C, GHSV: 24,000 mL·g−1·h−1, H2/CO2 = 3:1, and P: atmospheric pressure.
Catalysts 13 01017 g007
Figure 8. SEM images showing the nanoparticle growth on ½ Ni/Co nanofiber catalysts by increasing the heating temperature: (A) 450 °C, (B) 850 °C, (C) 1050 °C, and (D) 1250 °C. Red arrows: metal nanoparticles.
Catalysts 13 01017 g008
Figure 9. AFM images showing ½ Ni/Co nanofiber catalysts heated at 1050 °C: (A) Height sensor, (B) nanofiber 3D, (C) surface 3D, (D) amplitude error, and (D) phase.
Catalysts 13 01017 g009
Disclaimer/Publisher’s Note: The statements, opinions and data contained in all publications are solely those of the individual author(s) and contributor(s) and not of MDPI and/or the editor(s). MDPI and/or the editor(s) disclaim responsibility for any injury to people or property resulting from any ideas, methods, instructions or products referred to in the content.