Abstract
CO2 hydrogenation to methanol was conducted using a set of activated carbon-supported Cu/ZnO/Al2O3 catalysts (CCZA) prepared by an incipient wetness impregnation approach. The effect of the Cu/Al ratio on the physicochemical properties of the catalysts, as well as their catalytic performance, were investigated. As Cu/Al ratio increased, the metallic Cu surface area displayed a reducing trend from 6.88 to 4.18 m2∙gcat−1, while the CO2 adsorption capacity exhibited an increasing trend. Meanwhile, aluminum content will have an important effect on the catalysts’ reducibility and, thus, on their catalytic performance. The CCZA-2.7-de catalyst demonstrated the highest selectivity to methanol at 83.75% due to the excellent distribution and synergistic effect of copper and zinc. Although the CO2 conversion of CCZA-2.2-de and CCZA-3.5-de exceeded 10%, the CH3OH selectivity was less than 60%, which may be attributed to the larger particle sizes of ZnO and poor interactions in Cu–Zn. The present study offers a novel approach to increase the number of active sites, optimize the activated carbon-aided Cu/ZnO/Al2O3 catalyst’s composition, and finally elucidate the mechanism for CO2 hydrogenation to methanol.
1. Introduction
Recently, the catalytic conversion of carbon dioxide to effective chemicals (including formic acid and methanol) has aroused considerable interest as it facilitates CO2’s utilization and mitigation [1]. Methanol is a significant intermediate in the production of olefins and other organic chemicals, which can be produced from the hydrogenation of CO2 [2]. Among various CO2 hydrogenation catalysts, Cu/ZnO/Al2O3 (CZA), traditionally applied for synthesizing methanol from syngas, is also extensively examined to synthesize methanol from CO2 hydrogenation [3].
Over the past decades, attempts at improving the CZA-based catalysts have been reported in much of the literature [4,5,6,7,8]. Liang et al. [9] adopted porous Cu–Zn/Al-foams as the catalyst to obtain the optimal CO2-conversion and CH3OH-selectivity of 15.5% and 50.6% at 260 °C. However, decreasing the temperature resulted in lower CO2 conversion. Varying the pressure from 2 to 5 MPa had a positive effect in enhancing CO2 conversion from 12.1% to 19.7%. On the contrary, enhancing GHSV from 5000 h−1 to 20,000 h−1 drastically reduced the CO2 conversion from 15.1% to 9.1%, but the CH3OH yield linearly increased. These values were consistently in agreement with earlier documentation [10,11,12,13]. Recent publications have dealt with composites whose CH3OH selectivity reached 98.2% at CO2 conversions of 95.3% under high-pressure conditions [14]. Furthermore, Zhang et al. [11] proved a near-linear relationship between the CO2 conversion and the copper amount when the mass fraction of Cu–ZnO increased from 9.9% to 44.5% supported on Al2O3. CO2 conversion and methanol yield presented a gradual increase with the amount of copper and zinc increasing.
As the reaction is sensitive to structure, the catalytic activity for methanol production depends on many factors, including the metallic Cu grain size, the specific surface area of Cu [15], and the interaction between Cu and oxides [16]. It is proposed that the Cu/ZnO synergy can be used to create active sites for CO2 and H2 transformation by combining deficient Cu nanoparticles with a thin ZnO overlayer [17], creating a junction effect at the Cu–ZnO interface [18], or generating a specific Cu–Zn surface alloy [19]. In addition, it has been extensively demonstrated that great amounts of Cu+ species or a high Cu+/Cu0 proportion are conducive to methanol generation [7]. However, traditional Cu/ZnO/Al2O3 catalysts with a large Cu surface area for has often failed [20]. These catalysts are often deactivated for CO2 hydrogenation reactions due to water produced by reverse water-gas shift reaction, which promotes copper catalysts sintering [21].
Besides, the addition of Al (5–10 mol%) to Cu/ZnO catalysts can enhance their activity and steadiness [16,22]. Low content of Al (2–4%) can also facilitate the homogeneously mixed ZnO and CuO formation while acting as a dopant in ZnO to generate drawbacks exposed to Cu [23]. These effects of Al promotion can improve both the structural and electronic properties of Cu/ZnO catalysts.
Carbon-based materials such as graphene, carbon nanotubes (CNTs), and activated carbon (AC) are considered excellent supports for catalysts due to their unique structure, large surface area, and high thermal stability [24]. Additionally, the surface of these materials can be functionalized to enhance the anchoring of the active metals. Carbon-supported catalysts have been found to outperform traditional oxide-supported catalysts even in aqueous environments, as the hydrophobic nature of carbon provides excellent stability. Yu et al. reported that reduced graphene oxide (rGO) supporting copper-based catalysts could increase the surface area and control the metal surface’s exposure and the catalyst’s texture, thus influencing the adsorption performance [25]. A Cu/ZnO catalyst supported on activated carbon was successfully obtained for hydrogenation to methanol, characterized by ZnO and Cu dispersion, small particle size, and a low degree of particle agglomeration [26]. Thus, combining carbon-supported Al-doped Cu/ZnO catalyst is anticipated to produce a stable, efficient, and highly active catalyst for producing methanol.
In the current study, activated carbon was selected as the support to improve copper dispersion and facilitate CuO reduction. Activated carbon-supported Cu/ZnO/Al2O3 (CCZA) catalysts with various Cu/Al ratios were produced by an incipient wetness impregnation method and were utilized for CO2 hydrogenation reaction. In conjunction with the characterization results, the effects of the Cu/Al ratio on the physicochemical properties and catalytic performance of the catalysts were explored.
2. Results and Discussion
2.1. The Structural and Morphological Properties
Figure S1 shows the X-ray diffraction patterns of the catalyst precursors with various Cu/Al proportions ranging from 2.2 to 3.5. All the samples exhibited characteristic peaks corresponding to Cu2(OH)3NO3 and Zn3(OH)4(NO3)2: sharp and symmetrical reflections of (001), (002), (200) for Cu2(OH)3NO3 (PDF#15-0014), and (100), (200), (202), (123) for Zn3(OH)4(NO3)2 (PDF#70-1361). The samples’ crystallinity increased as the Cu/Al ratio increased, indicating an increase in the crystal grains of Cu2(OH)3NO3 and Zn3(OH)4(NO3)2 due to the reduction in Al3+ content. The peak at 26.3° was attributed to active carbon, while no other crystalline phases were discovered.
After calcination at 360 °C, the XRD patterns of all crystals showed no diffraction peaks of the precursors, indicating the complete decomposition of the precursor, as shown in Figure 1A. The diffraction peaks at 35.4 and 38.9° corresponded to lattice planes (002) and (200), confirming the monoclinic structure of CuO (PDF# 48-1548). The unique diffraction peak of ZnO (PDF# 80-0075) centered at 36.2° indexed to (101) was clearly observed. Interestingly, except for the typical diffraction peaks of CuO and ZnO, all catalysts exhibited (111), (200), and (220) peaks at 43.2 and 50.3, and 73.9°, which resulted from metallic Cu, an active component for methanol synthesis. The diffraction peaks at 36.4, 42.3, 61.4, and 73.6° were assigned to the (111), (200), (220), and (311) planes of Cu2O. The activated carbon can provide a reducing atmosphere under high-temperature conditions, leading to the reduction of CuO and the appearance of Cu and Cu2O phases. Increasing the Cu/Al ratio did not significantly change the XRD patterns of CCZA-2.2-de and CCZA-3.5-de catalysts. However, as the metal loading in CCZA-2.7-de decreased, the peak intensity of Cu was enhanced, while that of Cu2O decreased significantly, indicating that CCZA-2.7-de was more reductive. In addition, no characteristic Al2O3 diffraction peak was observed for all catalysts, suggesting that Al2O3 species were in an amorphous state [27]. Figure 1B displays the XRD pattern of the catalyst after reduction by 75% H2/N2. The distinctive peaks of (100), (002), and (110) assigned to the ZnO phase increased after the reduction at 300 °C, while the peaks of the CuO and Cu2O phases vanished. Peaks at 43.35, 50.50, and 74.23° were caused by metallic Cu, which was an active component in methanol synthesis. The peak strength of copper varied slightly with the Cu/Al molar ratio change. In addition, based on the XRD spectrum of the reduced catalysts, calculated by the Scherrer equation, the crystallite size of metallic Cu grew slightly from 8 to 9 nm as the Cu/Al ratio increased from 2.2 to 3.5. The results showed that the copper content did not significantly impact the copper grains’ size. However, reducing the aluminum content showed a more noticeable increase in copper grain size, implying that adding aluminum affects the growth of copper grains and could potentially influence catalyst activity.
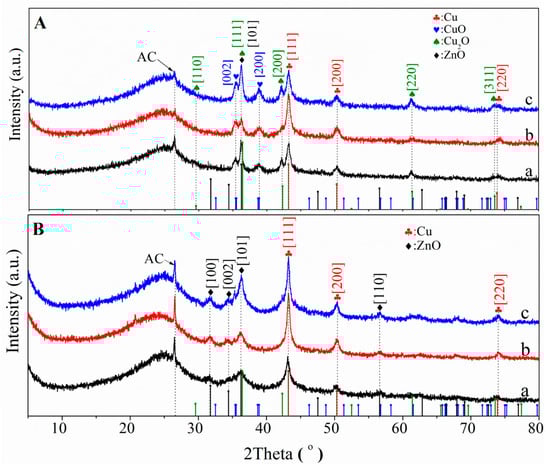
Figure 1.
XRD patterns of the catalysts (A) calcined and (B) pre-reduced with a Cu/Al ratio of (a) 2.2, (b) 2.7, and (c) 3.5.
Transmission electron microscopy (TEM) and scanning electron microscopy (SEM) was performed to investigate the morphology of the catalysts. Based on Figure 2, the CCZA-2.2-de catalyst produced particles with a uniform size of 15–20 nm, whereas the CCZA-3.5-de catalyst had large particles with a looser packing structure. The reduction in aluminum content resulted in a reduction of its inhibitory effect, thereby facilitating the aggregation and growth of copper and zinc oxide particles. The CCZA-2.7-de catalyst had a higher Cu/Al ratio compared to CCZA-2.2-de, but it had a relatively low copper loading, which could lead to significant changes in the catalyst’s morphology resulting in aggregation. After reduction with H2, a uniform Cu/ZnO/Al2O3 layer was formed on the surface of the AC support. However, larger particles were observed on the coating surface, and an increase in the Cu/Al ratio resulted in larger aggregated particle size. SEM-EDX mapping pictures (Figure S2) showed that CCZA-2.7-re had a more uniform layer, whereas CCZA-2.2-re and CCZA-3.5-re had cracks or particle accumulation on their surfaces.
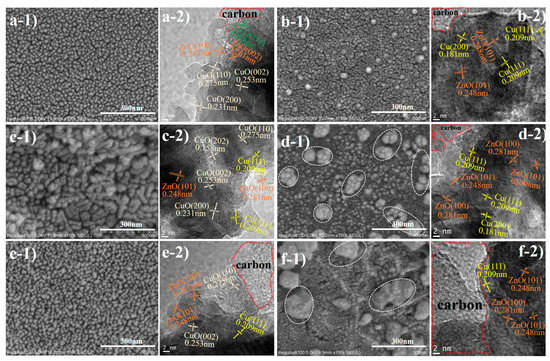
Figure 2.
SEM and TEM figures of the calcined catalysts with Cu/Al ratios of (a) 2.2, (c) 2.7, and (e) 3.5, and the reduced catalysts with Cu/Al ratios of (b) 2.2, (d) 2.7, and (f) 3.5, where x-1 and x-2 (x = a–f) refer to SEM and TEM images, respectively.
The TEM image of CCZA-2.2-de showed lattice fringes at 0.231 nm, 0.253 nm, and 0.275 nm ascribed to the characteristic (200), (002), and (110) planes of CuO, respectively. In addition, lattice fringes of 0.281 nm and 0.261 nm corresponding to ZnO (100) and (002) were also found. Due to the reducing effect of the activated carbon, Cu2O (111) lattice also appeared near the carbon. The CCZA-2.7-de catalyst also had prominent lattice stripes of CuO and ZnO, and a new lattice fringe assigned to ZnO (101) appeared with the disappearance of the (002) lattice plane. Meanwhile, the lattice spacing of 0.158 nm belonging to Cu (202) can also be observed. Additionally, the lattice fringes of Cu2O disappeared in the TEM of CCZA-2.7-de, conforming to the XRD results. Interestingly, the characteristic lattice fringes attributed to ZnO, CuO, and Cu were observed in the CCZA-3.5-de catalyst. However, no lattice fringe assigned to Cu2O was found in the TEM analysis of the CCZA-3.5-de catalyst (Figure 2(e-2)), which may be associated with the selected region.
The TEM images showed that the reduced catalysts only had ZnO and Cu lattice fringes and carbon regions, with a clear interface between the metal layer and activated carbon. This indicated that the active ingredient of the catalysts had a good binding force with carbon support. Upon exploring the mutual composition of ZnO and Cu components, it was found that CCZA-2.2-re and CCZA-2.7-re had more copper, with copper being more exposed in the outer layer. On the other hand, the outer layer of CCZA-3.5-re mainly comprised ZnO, with Cu being sandwiched between activated carbon and ZnO layers. Further analysis revealed that the ZnO particles in the CCZA-2.7-re catalyst were dispersed more uniformly and strongly interacted with metallic copper. In contrast, the ZnO and Cu particles in the CCZA-2.2-re were larger and interacted poorly. Moreover, the different Cu–ZnO interactions could significantly impact the catalytic activity.
2.2. Surface Composition and Reduction Behavior
With the purpose of investigating the CO2 adsorption/desorption characteristics of the catalysts, CO2-TPD experiments were conducted. As shown in Figure 3A, the desorption curves showed a wide peak with shoulders between 60–250 °C. To differentiate various basic sites on the surface of the three catalysts, the curves were deconvoluted into α, β, and γ peaks. Low temperature (α peak) was assigned to a weak basic site originating from surface hydroxyl [28]. In addition, the β and γ peaks were caused by moderately and strongly basic sites [29], which are the key active sites for methanol intermediates.
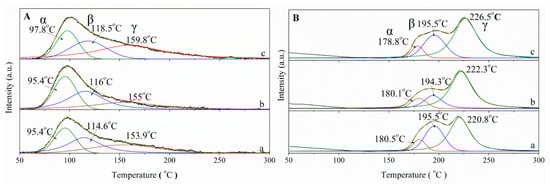
Figure 3.
(A) CO2-TPD and (B) H2-TPR profiles of CCZA catalysts with Cu/Al ratios of (a) 2.2, (b) 2.7, and (c) 3.5.
Table S2 quantitatively summarizes the content of CO2 from α, β, and γ peaks for the three catalysts. Obviously, it was observed that as the Cu/Al ratio increased, the content of weak and moderate bases gradually decreased. Nevertheless, the strong base content presented an increasing trend. However, the metallic copper loading on CCZA-2.7-de (8%) was significantly lower than that of CCZA-2.2-de (10%), resulting in the less strong base of CCZA-2.7-de than that of CCZA-2.2-de. Decreasing the weight percentage of Al2O3 can reduce the number of weak basic sites since Al2O3 only had weakly basic sites. From CCZA-2.2-de to CCZA-3.5-de catalysts, the peaks shifted to the high-temperature region, suggesting that the basic strength increased gradually and the interaction strength with CO2 improved. In any case, the basic sites only reflected the adsorption of CO2, and the basic site needs to act synergistically with the copper site to play an excellent catalytic role. As a result, analysis of the surface copper content and copper–zinc interactions are required.
Figure 3B illustrates the TPR profiles of the catalysts with various alumina contents. A prominent peak with a wide shoulder can be found in the reduction curves of all the samples in the range of 150–300 °C, indicating a complex reduction process for CuO species [30]. To analyze the TPR results, the curves were deconvoluted into three Gaussian peaks. The α peaks at 180 °C might have been caused by the reduction of dispersed CuOx species [31]. Comparatively, the peaks located at higher reduction temperatures (195 and 220 °C) were caused by the reduction of CuOx species, which can greatly interact with the ZnO/Al2O3 matrix [32]. Notably, the peaks at 220 °C might have been caused by the reduction of CuO species that greatly interacted with ZnO, driven by the generation of the ZnO overlayer [31]. The peak shifted to a higher temperature region with an increase in the Cu/Al ratio, suggesting that the decrease in alumina content could weaken the reducibility of the catalyst. Moreover, compared to that of the CCZA-2.2-de and CCZA-3.5-de catalysts, the H2 consumption of the CCZA-2.7-de catalyst decreased because more Cu2+ was directly reduced to Cu0 during the calcination process, which was consistent with the XRD result mentioned above. The shift in reduction temperature to high temperature also indicated that the copper oxides were highly dispersed in ZnO crystals.
As shown in Table S3, with a decrease in aluminum content, the total hydrogen consumptions for the catalysts were 709, 523, and 650 µmol∙gcat−1, respectively. Specifically, the hydrogen consumption associated with α sites demonstrated a gradual decline (67.85, 53.66, 49.86 µmol∙gcat−1), while the β and γ sites displayed an initial decrease followed by an increase. The XRD analysis showed that during the calcination of CCZA-2.7-de, CuO was more easily converted into metallic copper compared to the other two catalysts, which were mainly reduced to Cu2O. Consequently, the CCZA-2.7-de catalyst exhibited the lowest hydrogen consumption. The metallic copper loading (10.35%, 8.48%, and 9.46%) also affected the total hydrogen consumption. With the reduction of aluminum, the amount of highly dispersed copper on the surface gradually decreases, consistent with an increase in XRD analysis peak intensity. The decrease in loading leads to a larger metal-carbon contact surface and causes more copper reduction during the combustion process. The reducing effect of activated carbon during the roasting process reduced the consumption of hydrogen, so it is not possible to quantitatively determine the content of Cu2+ by the consumption of hydrogen.
Furthermore, the surface copper content of the catalysts was calculated by N2O passivation, as shown in Table 1. As the Cu/Al proportion increased, the surface copper content of the catalysts decreased gradually to 168, 134, and 102 µmol∙gcat−1 for CCZA-2.2-re, CCZA-2.7-re, and CCZA-3.5-re, corresponding to the surface copper surface area of 6.88, 5.49, and 4.18 m2∙gcat−1, respectively. A decrease in aluminum content resulted in the formation of larger copper particles and entered the zinc oxide interlayer, as evident from SEM and TEM images (Figure 2) and confirmed by H2-TPR analysis, where the γ peak gradually increased and shifted to a high temperature, causing a gradual decrease in surface copper content. Although the surface copper content is a crucial factor affecting the catalyst activity, it has been documented that the synergy between Cu and Zn is the key to the catalytic reaction for CO2 hydrogenation.

Table 1.
The results of the dissociative N2O chemisorption.
To further examine the impact of the Al content, the characteristics of the catalysts with various Cu/Al proportions were explored using X-ray photoelectron spectroscopy (XPS). The Zn 2p XPS spectra are presented in Figure S3, while Figure 4 shows the Cu 2p XPS and Cu LMM Auger spectra. As shown in Figure S3, for n(Cu)/n(Al) = 2.2, the binding energy of Zn 2p3/2 was 1022.4 eV, indicating that there were Zn species on the surface of the catalyst as well as ZnO in the fresh and reduced catalysts. With a decrease in the Al amount, Zn 2p3/2 showed no significant variations in binding energy.
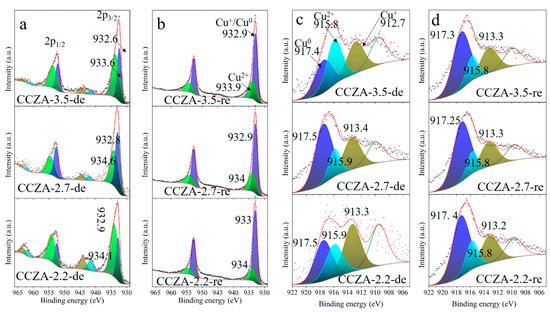
Figure 4.
Cu 2p XPS for calcination (a) and reduction (b), and Cu LMM Auger spectra of CCZA catalysts for calcination (c) and reduction (d).
The XPS spectra of Cu 2p3/2 in Figure 4a,b revealed two peaks at approximately 932.9 and 934 eV after peak isolation processing. The dominating peak in the fresh catalysts came from the low-valence Cu species, such as Cu0 and Cu+, while another peak came from Cu2+ in CuO [33]. Additionally, two additional satellite characteristic peaks at 942 and 944.2 eV indicated the presence of Cu2+ because of the charge transfer between the copper 3d orbital and oxygen 2p orbital [34]. With decreasing Al content, the proportion of reduced Cu0 and Cu+ increased, demonstrating that Cu2+ was easily reduced by activated carbon, which was consistent with the H2-TPR characterization. The CCZA-2.7-de catalyst showed the highest ratio of reduced Cu0 and Cu+. Additionally, the XPS results for the reduced catalysts were analyzed to explore the effect between ZnO and Cu at the interface. According to Figure 4b, the absence of “satellite” peaks in the Cu 2p spectra of the reduced catalysts indicated that the Cu2+ had been fully reduced into Cu0 and/or Cu+ by H2. The small amount of Cu2+ observed in the reduced catalyst mainly resulted from air oxidation on the catalyst surface during the test. The similar chemical change tendencies of the Cu 2p for the three catalysts showed that the electron density of metallic Cu (transfer charge from ZnO) increased due to an enhanced mutual Cu–ZnO effect and decreased mean nanoparticle size of metallic Cu, which was consistent with the XRD (Figure 1B) and H2-TPR (Figure 3B) results.
The Cu LMM Auger electron spectra (AES) were used to distinguish between Cu+ and Cu0 because the binding energy of Cu 2p3/2 is very close for both Cu+ and Cu0. The Cu LMM Auger spectra received peak after peak isolation procedures, and the peaks of Cu+ and Cu0 were obtained (Figure 4c,d). It was reported that the relaxation role of the two-hole final state of Cu influenced the kinetic energy for the Cu+ status in the Cu LMM Auger spectra due to the electron donation capacity of the nearby factors around Cu [35]. Significantly, the chemical shifts of the Cu+ kinetic energy to ~912 eV would be caused by the presence of Al. As a result, the Cu LMM Auger spectra discovered in this study varied from the normative Cu2O, CuO, or metallic Cu [36]. The applicable peak with a kinetic energy of ~913 eV was assigned to the Cu+ Auger LMM. The peak at ~917.5 eV was caused by the Cu0 Auger LMM, and the peaks at ~915.7 eV resulted from the Cu2+ Auger LMM [37]. Additionally, a peak at 909.4 eV was caused by the Zn component. Based on the AES results in Figure 4c, the Cu0/Cu+ atomic proportions of the CCZA-2.2-de, CCZA-2.7-de, and CCZA-3.5-de after calcination were 0.85, 1.84, and 1.03. After reduction (Figure 4d), the Cu0/Cu+ ratios of the three catalysts increased significantly (2.2, 2.41, and 2.23, respectively), indicating that stable Cu+ and Cu0 species still existed in the catalysts even under a hydrogen atmosphere. CCZA-2.7-de showed better reducibility, consistent with the XRD characterization data in Figure 1A. Both Cu0 and Cu+ play certain roles in enhancing the catalytic performance of the catalyst [38]. Therefore, activated carbon-supported Cu/ZnO/Al2O3 can realize better catalytic performance in the cases of an appropriate Cu+/Cu0 proportion, which can be conducive to H2 dissociation, promoting the hydrogenation of CO2 adsorbed at the basic site, as well as improving the product selectivity.
2.3. Catalytic Performance for Methanol Synthesis
To investigate the catalytic performance of our samples, the testing of the as-prepared CCZA-2.2-de, CCZA-2.7-de, and CCZA-3.5-de catalysts was performed for CO2 hydrogenation to methanol (T = 240 °C, P = 3 MPa, GHSV = 2800 mL·gcat−1·h−1, H2/CO2 = 4/1), as shown in Figure 5A. The CCZA-2.7-de exhibited the highest methanol selectivity (83.75%) but the lowest CO2 conversion (6.64%) compared to CCZA-2.2-de and CCZA-3.5-de catalysts (58.03% and 68.29% for methanol selectivity, and 11.56% and 9.56% for CO2 conversion), suggesting that a suitable ratio of Cu/Al results in higher catalytic performance. Different from the results reported previously [39], the performance of the catalysts did not show any apparent association with the number of copper or basic sites, and only the synergistic action of Cu, Zn, and aluminum exhibited the best performance. This is because the basic sites generated by ZnO/Al2O3 adsorb CO2 to form carbon-containing intermediates, which can then react with H atoms generated by Cu sites on the surface to produce methanol. Conversely, if there are too many carbon intermediates without enough hydrogen, or too many hydrogen intermediates without carbon intermediates, optimal CO2 transformation and methanol selectivity cannot be realized, further demonstrating that metal–support interactions (SMSI) exert a crucial effect on the hydrogenation process of CO2 to methanol. The catalytic properties of CCZA-2.2-de, CCZA-2.7-de, and CCZA-3.5-de catalysts were compared with those of previously reported catalysts, and the CO2 conversion and methanol selectivity were presented in Table S4. These data provide persuasive evidence that the methanol selectivity of the current catalysts is relatively excellent compared to that of highly efficient catalysts reported previously.
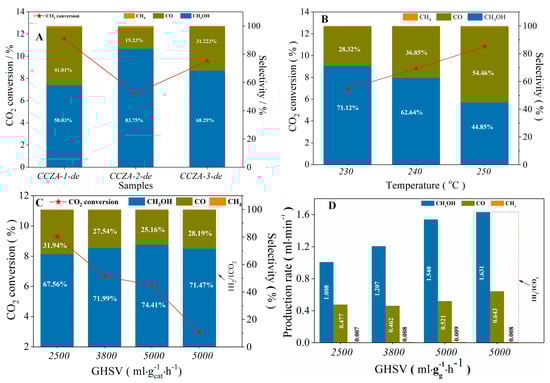
Figure 5.
Catalytic performance of (A) various catalysts (T = 240 °C; P = 3 MPa; GHSV = 2800 mL·gcat−1·h−1; H2/CO2 = 4/1), (B) the CCZA-3.5-de catalyst at various temperatures (P = 3 MPa; GHSV = 2200 mL gcat−1·h−1; H2/CO2 = 3/1), and (C) different GHSV (T = 240 °C; P = 3 MPa; H2/CO2 = 3/1), and (D) the rates of product formation at different GHSV.
Additionally, the influence of reaction conditions on the performance of CO2 hydrogenation, particularly the reaction temperature and gas hourly space velocity (GHSV), was investigated to understand their roles in CCZA-3.5-de catalysis. As displayed in Figure 5B, the CO2 conversion increased, but methanol selectivity declined with an increased reaction temperature (P = 3 MPa, GHSV = 2200 mL·gcat−1·h−1, H2/CO2 = 3/1; the temperature varied from 230 to 250 °C), which may be attributed to the methanol synthesis reaction being an exothermic reaction (ΔrH (298 K) = −49.5 kJ∙mol−1), in contrast to the RWGS reaction (ΔrH (298 K) = 41.2 kJ∙mol−1) [40]. It was found that the generation rate of all products increased with the rise in reaction temperature, but the endothermic reaction increased more obviously (Figure S4). Therefore, the lower reaction temperature could be alternated to strengthen methanol production. To study the impact of GHSV on the result of catalysts, the performance test of CCZA-3.5-de was tested at 2500–5000 mL∙gcat−1·h−1 (T = 240 °C, P = 3.0 MPa, H2/CO2 = 3/1). Figure 5C demonstrates that the CO2 transformation decreased significantly with an increase in space velocity, but the methanol selectivity tended to increase. As can be seen from the rate of product formation in Figure 5D, with the increase in space velocity, the methanol generation rate showed an increasing trend, while CO first decreased and then increased slightly, suggesting that increasing the gas space velocity could promote product desorption and thus improve the conversion efficiency of the catalytic sites. As a result, the selectivity of methanol showed an upward trend, while the CO2 conversion rate decreased due to the more significant increase in CO2 availability.
Additionally, the role of H2/CO2 proportion in the reaction result is also shown in Figure 5C. As the H2/CO2 ratio was reduced from 3.5 to 1 (T = 240 °C, P = 3.0 MPa; GHSV = 5000 mL∙gcat−1∙h−1), the CO2 conversion rate decreased from 6% to 3%, while the methanol selectivity decreased only slightly, from 74.41% to 71.47%. As can be seen from the equation of CO2 hydrogenation (CO2 + 3H2 = CH3OH + H2O), lowering the hydrogen content reduces the methanol selectivity. However, when the H2/CO2 ratio was reduced to 1 (Figure 5D), the methanol and CO generation rates increased. As the concentration of CO2 increased, the opportunity for CO2 to contact basic sites increased, ultimately leading to an improvement in the conversion efficiency of basic sites. However, due to the decrease in H2 concentration, the efficiency of the decomposition of H2 at the Cu site to produce an H atom was reduced so that some of the carbon-containing intermediates could not obtain enough hydrogen atoms to produce methanol, resulting in a more obvious increase in the CO generation rate, which is manifested as a decrease in methanol selectivity. As mentioned in the previous study, increasing the number of copper or the number of basic sites alone could not achieve the best reactivity.
The steadiness of the catalyst is an essential coefficient for methanol synthesis. As illustrated in Figure S5, the CO2 conversion and methanol selectivity of the CCZA catalyst were 7.5% and 78% in the 23–31 h range, respectively. After 55 h in different reaction conditions, the catalyst’s performance remained unchanged under the same conditions, suggesting that the CCZA catalyst had good stability. To further determine the stability of activated carbon-supported catalysts, the CCZA-2.7-de catalyst was continuously evaluated. As shown in Figure 6A, temperature and GHSV were 242 °C and 2800 mL∙g−1∙h−1 respectively, with slight fluctuation throughout the entire process. The catalytic activity was quite steady, almost maintaining stable CO2 conversion and CH3OH selectivity over 58 h (Figure 6B). Based on the above analysis, it can be observed that the use of an activated carbon-supported Cu/ZnO/Al2O3 catalyst is beneficial for preventing the sintering of active components, showing better stability.
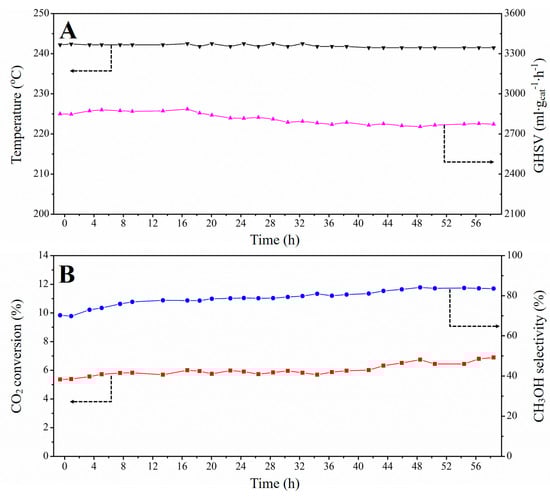
Figure 6.
Stability evaluation of CCZA-2.7-de catalyst: (A) the temperature and GHSV fluctuation curves and (B) the CO2 conversion and methanol selectivity (reaction conditions: H2/CO2 = 4.3, P = 3.0 MPa, T = 242 °C, GHSV = 2800 mL·gcat−1·h−1). The black, magenta, red and blue lines represent temperature, GHSV, CO2 conversion and CH3OH selectivity, respectively.
2.4. Mechanistic Study
For the Cu/ZnO catalyst, a bifunctional (dual place) mechanism of CO2 hydrogenation can currently be recognized, assuming that hydrogen is absorbed and dissociated in the Cu areas while CO2 adsorbs over the ZnO areas. The transportation of atomic hydrogen from the surface of Cu onto the surface of ZnO is achieved by spillover, followed by the hydrogenation of the adsorbed carbon-containing species to generate methanol [41]. Several scholars designed a further bifunctional mechanism for methanol synthesis from CO2 hydrogenation on a Cu/ZnO catalyst where formate (HCOO*) species were generated on ZnO and underwent stepwise hydrogenation to methoxide, formaldehyde, and methanol due to the atomic hydrogen made available by spillover from Cu [41,42].
A temporal-resolution in situ DRIFTS experiment was performed to identify the dynamic action of reaction intermediates on the CCZA-3.5-re catalyst under a CO2/H2 atmosphere. In accordance with the in situ DRIFTS spectra (Figure 7a and Figure S6), some combinational bands appeared at 3400–3800 cm−1. The assembled bands at 3735 and 3703 cm−1 were caused by the oscillation of υ1 (1386 cm−1, symmetric stretching vibration [υs (C=O)]) + υ3 (2349 cm−1, asymmetric stretching oscillation [υas (C=O)]). In addition, the other assembled bands at 3629 and 3595 cm−1 were caused by the oscillation of 2υ2 (667 cm−1, bending oscillation [β (C=O)]) + υ3 (2349 cm−1, asymmetric stretching oscillation [υas (C=O)]), of adsorbed CO2 species [43]. Figure 7b displays the collection of FT-IR spectra from the same survey at 2600–3000 cm−1. A doublet, centered at 2936 and 2836 cm−1, can be assigned to HCOO* adsorption, wherein the former was associated with the assembled bands of υas(OCO) + δ(CH), whereas the latter was associated with the vibration of υ(CH) [44], indicating the existence of adsorbed bidentate HCOO* species on the surface in the reaction. As shown in Figure 7b, the assignment of another doublet peak, centered at 2960 and 2859 cm−1, to υs(CH) and υas(CH) of methoxy (CH3O*) species can be performed [44]. Figure 7c displays the scope of 1200–2200 cm−1, the fingerprint region for carbonyl (CO*), a formate band. Two bands are discernible in the scope of 1800–2000 cm−1, indicating that there were two forms of CO* on the surface during the reaction. Therefore, the assignments of the bands discovered within 1800–2000 cm−1 became straightforward: 1932 and 1817 cm−1 corresponded to the di-coordinated bridging CO* species adsorbed in the lattice, and the triply bridging CO* species on “hollow” places in the lattice.
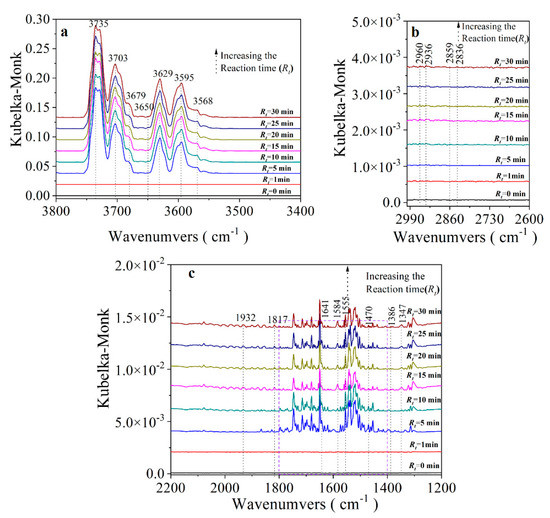
Figure 7.
Enlarged sections of the in situ DRIFT spectra for the CO2 hydrogenating reaction on the CCZA-3.5-re catalyst: (a) 3400−3800 cm−1, (b) 2600−3000 cm−1 and (c) 1200−2200 cm−1 for 0 to 30 min at 240 °C. Conditions of reaction: gas flow rate = 40 mL∙min−1; H2/CO2 = 3/1; P = 0.1 MPa.
The fingerprint region of HCOO* species (O-C-O oscillation) lies within 1300–1600 cm−1. In the spectrum for CO2 hydrogenation (Figure 7c), two absorption peaks appeared, concentrated on 1584 and 1347 cm−1, consistent with asymmetric (υas(OCO)) and symmetric (υ(OCO)s) oscillation of the O-C-O bonds [44,45]. The shoulder band, concentrated at 1386 cm−1, can be assigned to the distortion oscillation of the C-H bond (δ(CH)) of HCOO* species [46,47]. It was reported that υas(OCO) indicates that a certain proportion of HCOO* species was oriented at an angle to the normal direction of the metal surface [47], causing activation of C-H deformation vibration (ca. 1386 cm−1), as well as the strengthening of the assembled band at ca. 2936 cm−1. No peak appeared in the in situ infrared analysis before 1 min, suggesting that the subsequent infrared peaks came from the reactant and products of CO2 hydrogenation. Furthermore, the peak intensity of the CO phase increases gradually (from 5 min to 15 min) and reaches a stable state after 15 min, while the HCOO* peak intensity tends to stabilize faster (10 min), which is a basic intermediate for methanol synthesis. This demonstrates that the main reaction of CO2 hydrogenation occurred more easily, which is consistent with the above catalytic results. In addition, 1300–1700 cm−1 is the fingerprint area for bidentate bicarbonate (HCO3*) species, and the distinctive bands of HCO3* species for CO2 adsorption represented the asymmetric and symmetric oscillation of the O-C-O bond at 1641 and 1470 cm−1 [47,48]. Meanwhile, the symmetric oscillation of the O-C-O bond started to decrease from 5 min and tended to achieve a steady state for 15 min. Therefore, it was more likely that the HCO3* species were readily converted to other steadier species instantly, including HCOO* species, based on the evidence of the formate species in Figure 7b [48].
As shown in Figure 7a, three bands at 3650, 3679, and 3568 cm−1 corresponding to various kinds of hydroxyl groups (-OH) [49] are observed. The band at 3650 cm−1 was assigned to OH groups formed from the mutual effect between H and surface O atoms. There exists an association between other bands at 3679 and 3568 cm−1 and the surface-OH species, resulting from the partial dissociation of chemisorbed H2O molecules during hydrogenation [50]. Based on Figure 7c, water from the reverse gas–water shift (RWGS, CO2 + H2 → CO + H2O) reaction and methanol synthesis major reaction [51] caused the “teeth-like” bands within the range of 1600–1800 cm−1. In addition, the intensity of different bands over the CCZA-3.5-re catalyst was extremely weak, according to Figure 7 and Figure S6, indicating the extremely low generation rates for these intermediates over the CCZA-3.5-re catalyst.
The proposed mechanism for CO2 hydrogenation to methanol on activated carbon-supported Cu/ZnO/Al2O3 catalysts is shown in Figure 8. Based on the dual-site mechanism for methanol synthesis, H2 is adsorbed and activated over Cu areas while CO2 is absorbed over ZnO sites. The activated H atoms then migrate to ZnO sites, where H reacts with the adsorbed CO2. The high interfacial contact between copper and ZnO in the catalysts enables the facile movement of hydrogen to ZnO, thus improving the transformation of adsorbed CO2 on basic sites to bicarbonate intermediates. This results in an increased number of available hydrogen atoms for further reactions, leading to higher methanol yields. However, a lower interfacial contact between copper and ZnO provides disadvantages for catalytic efficiency in methanol generation. This can lead to a large amount of hydrogen and adsorbed CO2 desorbing from the catalyst surface, generating an increase in the proportion of byproducts.
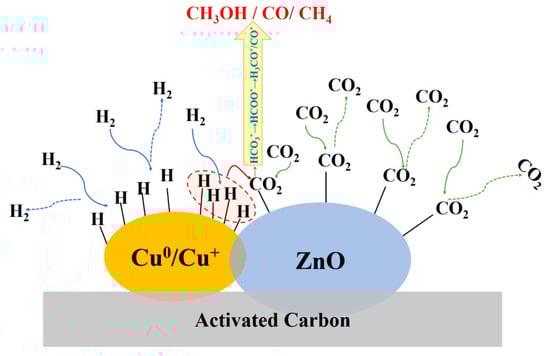
Figure 8.
Planned path for CO2 hydrogenation over activated carbon-supported Cu/ZnO/Al2O3 catalysts.
3. Materials and Methods
3.1. Catalyst Preparation
All chemicals of reagent grade were performed without in-depth purification. An initial wet impregnation approach was adopted to prepare three catalysts with various Cu/Al proportions. Firstly, activated carbon (Macklin, Shanghai, China, 8–16 mesh) was impregnated with an aqueous solution of copper nitrate (Macklin, 99%), aluminum nitrate (Xilong Scientific, Shantou, China, 99%), and zinc nitrate (Aladdin, Shanghai, China, 99%) (the proportions of Cu and Zn were 2.0 and 1.5 mL∙g−1 corresponding to the porous volume of AC), and immersed for 30 min at room temperature. Then, the mixture was dried for 8 h at 110 °C to evaporate the water, and the metal species were deposited on AC, denoted as CCZA-x-pre (x represents the Cu/Al ratio, x = 2.2, 2.7, 3.5. Table S1). After the precipitation, the precipitates were calcined at 360 °C for 4 h under N2, with a heating-up rate of 5 °C·min−1 in a muffle furnace. In addition, the as-obtained samples with different amounts of alumina were indicated as CCZA-x-de. The 1-h marking of reduced catalysts as CCZA-x-re was performed with a flow of 75% H2/N2 (100 mL∙min−1) at 300 °C.
3.2. Catalyst Characterization
X-ray diffraction (XRD, Rigaku D/MAX-2400, Tokyo, Japan) and X-ray photoelectron spectroscopy (XPS, Thermo Scientific K-Alpha, Waltham, MA, USA) were used to investigate their chemical ingredients, while inductively coupled plasma-atomic emission spectroscopy (ICP-OES; Agilent 5110, Palo Alto, CA, USA) was performed to analyze their bulk composition. Electron microscopy (SEM, Hitachi Regulus 8100, Tokyo, Japan) and high-resolution transmission electron microscopy (HRTEM, FEI Talos-F200S, Hillsboro, OR, USA) were used to examine the morphology and framework of the catalysts.
The temperature-programmed reduction (TPR, Bel Cata II, Osaka, Japan) of the catalysts was carried out. 50 mg of the calcined sample was heated at 300 °C under He with a gas flow of 30 mL·min−1. After cooling to room temperature under He, the gas was changed to 10% H2/Ar, and the sample was heated to 250 °C at a ramping rate of 10 °C·min−1. The content of H2 consumed was measured by mass spectrum (MS, Bel Mass, Osaka, Japan).
To determine the exposed Cu surface area (SCu) and the dispersion of copper (DCu), a N2O chemisorption experiment was conducted. The reduced catalyst was flushed with He until the temperature decreased to 60 °C, then exposed to a 10% N2O/He flow (30 mL∙min−1) for one hour. The sample was purified in flowing He (30 mL∙min−1) at room temperature, followed by another TPR conducted in the same manner as the first TPR. The amount of H2 consumed was indicated as X. The SCu and DCu of the catalysts were calculated using the following equations:
where NA refers to the Avogadro constant (6.02 × 10²³ atoms∙mol−1), nCu is the molar quantity of metallic Cu, SDCu indicates the number of copper atoms per square meter (1.47 × 10¹⁹ atoms∙m−2), mcat stands for the catalyst mass (g), MCu refers to relative atomic mass (63.546 g∙mol−1), W is the weight of the catalyst, and x represents the composition of Cu (wt.%) determined by ICP.
An FT-IR spectrometer (Bruker, INVENIO S, Karlsruhe, Germany) configured with a liquid N2 cooler MCT detector and a high-temperature reaction chamber (Praying Mantis, Harrick, Farmingdale, NY, USA) was adopted for performing in situ diffuse reflectance infrared Fourier transform spectroscopy (DRIFTS) experiments. The experiment was conducted at a pressure of 0.1 MPa. Before initiating the measurement, the catalyst was treated with 10% H2/He at 300 °C for 30 min, followed by purification with He at 300 °C and cooling down to 250 °C. The background spectrum was obtained at 250 °C over 30 scans. The sample was exposed to a mixture of H2/CO2, and the spectra were collected over time from 4000 to 400 cm−1 at a resolution of 4 cm−1.
3.3. Activity Test and Product Analysis
The activity tests were performed on a constant flow apparatus configured with a stainless-steel fixed-bed tubular reactor. The reactor had an inner diameter of 10 mm and three thermocouples to monitor the temperature of the catalyst bed. To maintain a plug flow profile, quartz powders (20–40 meshes) were packed at both ends of the catalyst bed. Prior to the reaction, the catalyst was activated for 1 h at 300 °C in a 75% H2/N2 atmosphere with a heating rate of 5 °C·min−1. The reaction was conducted at 3 MPa, 200~300 °C, V(H2)/V(CO2) = 75/25, and GHSV = 2000~5000 mL·gcat−1·h−1. The outlet gas from the reactor was kept at 150 °C and subsequently instantly moved to the injection valve of a gas chromatograph (Huifen GC-7820) configured with flame ionization detectors and thermal conductivity. The Porapak Q (1 m × 3 mm) and 5A molecular sieve-packed columns (1.5 m × 3 mm) were connected to the TCD detector to explore H2, CO2, CH4, and CO, while the FFAP capillary column (30 m × 0.32 mm × 0.5 um) was connected to the FID detector for the analysis of CH3OH.
The determination of CO2 transformation (), production selectivity (Sproduct), and yield (Yproduct) based on carbon indicated by carbon-containing results, including methane, methanol, and CO, was performed with an internal normalization approach based on the mass balance law. The definition is shown below:
where and represent the mole weight of CO2 in the inlet and outlet. nproduct indicates the mole weight of the product in the outlet.
4. Conclusions
Activated carbon-supported Cu/ZnO/Al2O3 catalysts were prepared by an incipient wetness impregnation approach for CO2 hydrogenation to methanol. In addition, the impact of Cu/Al proportion on the catalyst was also examined in this study. XRD analysis revealed that the introduction of activated carbon had a significant impact on the reduction performance of the catalyst, reducing the CuO to Cu2O during the calcination process, particularly to Cu in the CCZA-2.7 catalyst. The CCZA-2.7 catalyst exhibited the best methanol selectivity (83.75%) despite having the lowest CO2 adsorption (172 μmol·g−1) and medium Cu-specific surface area (5.489 m2·g−1) for CO2-TPD and N2O chemisorption. TEM analysis demonstrated that the distribution of copper and zinc in the CCZA-2.7 catalyst was more uniform, forming surface-enriched ZnO species, greatly dispersed copper nanoparticles, and a richer Cu–ZnO interface. The synergistic effect of copper and zinc was found to be crucial in promoting the CO2 hydrogenation reaction, with the metal surface area being one factor affecting catalyst activity. By examining the impact of the space velocity on the reaction performance, it was determined that increasing the space velocity would improve the rate of methanol and CO production, as well as being more conducive to improving the methanol selectivity. This facilitated the desorption of methanol from the catalytic site and improved the conversion efficiency at the activation temperature. Finally, the activated carbon-supported catalyst exhibited better stability, which played an important role in enhancing the practical application of the catalysts.
Supplementary Materials
The following supporting information can be downloaded at: https://www.mdpi.com/article/10.3390/catal13050800/s1. Table S1. The elemental content measured by ICP analysis; Figure S1. XRD patterns of the precursors of the catalysts with different Cu/Al ratio of (a) 2.2, (b) 2.7 and (c) 3.5; Figure S2. SEM-EDX mapping of the calcined catalysts with Cu/Al ratios of (a) 2.2, (c) 2.7, and (e) 3.5, and the reduced catalysts with Cu/Al ratios of (b) 2.2, (d) 2.7, and (f) 3.5; Table S2. The analyzed CO2-TPD results of the catalysts; Table S3. H2-TPR data for the catalysts; Figure S3. Zn 2p core level XPS spectra of (A) calcined and (B) pre-reduced catalysts with different Cu/Al ratios; Figure S4. The generation rates of the product catalyzed by CCZA-3.5-de at different temperatures (P = 3 MPa; GHSV = 2200 mL·gcat−1·h−1; H2/CO2 = 3/1); Figure S5. CO2 hydrogenation over CCZA-3.5-de catalyst under different conditions; Figure S6. The in-situ DRIFT spectra of hydrogenation of CO2 reaction on CCZA-3.5-re catalyst from 0–30 min at 240 °C. Reaction conditions: gas flow rate = 40 mL∙min−1, H2/CO2 = 3/1, P = 0.1 MPa; Table S4. Comparison of CO2 hydrogenation activity results on Cu/ZnO/Al2O3 catalysts. References [52,53,54,55,56,57] are cited in the Supplementary Materials.
Author Contributions
Conceptualization, Z.X. and S.M.; methodology, Z.X. and L.C.; software, J.H.; validation, L.C., X.Y. and J.L.; formal analysis, J.H.; investigation, Z.X.; resources, J.L.; data curation, X.Y.; writing—original draft preparation, Z.X.; writing—review and editing, S.M., J.L. and X.Y.; visualization, J.H.; supervision, S.M.; project administration, Z.X. and S.M.; funding acquisition, Z.X. and S.M. All authors have read and agreed to the published version of the manuscript.
Funding
This research was funded by the National Natural Science Foundation of China (NSFC, 52002142); The Foundation of Anhui Province for Distinguished Young Scholars (2022AH020038); the Scientific Research Project of Chaohu University (XLY-202005, hxkt20220010, hxkt20220049), the Start-Up Grant of Chaohu University (KYQD-202003), and the Innovation and Entrepreneurship Training Project for College Students (S202110380026).
Data Availability Statement
The data used to support the findings of this study are included within the article.
Conflicts of Interest
The authors declare that they have no known competing financial interest or personal relationship that could have appeared to influence the work reported in this paper.
References
- Jiang, X.; Nie, X.; Guo, X.; Song, C.; Chen, J.G. Recent advances in carbon dioxide hydrogenation to methanol via heterogeneous catalysis. Chem. Rev. 2020, 120, 7984–8034. [Google Scholar] [CrossRef] [PubMed]
- TNguyen, B.H.; Zondervan, E. Methanol production from captured CO2 using hydrogenation and reforming technologies environmental and economic evaluation. J. CO2 Util. 2019, 34, 1–11. [Google Scholar]
- Pontzen, F.; Liebner, W.; Gronemann, V.; Rothaemel, M.; Ahlers, B. CO2-based methanol and DME-Efficient technologies for industrial scale production. Catal. Today 2011, 171, 242–250. [Google Scholar] [CrossRef]
- Santana, C.S.; Rasteiro, L.F.; Marcos, F.C.F.; Assaf, E.M.; Gomes, J.F.; Assaf, J.M. Influence of Al, Cr, Ga, or Zr as promoters on the performance of Cu/ZnO catalyst for CO2 hydrogenation to methanol. Mol. Catal. 2022, 528, 112512. [Google Scholar] [CrossRef]
- Zhang, L.X.; Zhang, Y.C.; Chen, S.Y. Effect of promoter TiO2 on the performance of CuO-ZnO-Al2O3 catalyst for CO2 catalytic hydrogenation to methanol. J. Fuel Chem. Technol. 2011, 39, 912–917. [Google Scholar] [CrossRef]
- Zhang, L.X.; Zhang, Y.C.; Chen, S.Y. Effect of promoter SiO2, TiO2 or SiO2-TiO2 on the performance of CuO-ZnO-Al2O3 catalyst for methanol synthesis from CO2 hydrogenation. Appl. Catal. A-Gen. 2012, 415–416, 118–123. [Google Scholar] [CrossRef]
- Dasireddy, V.D.B.C.; Likozar, B. The role of copper oxidation state in Cu/ZnO/Al2O3 catalysts in CO2 hydrogenation and methanol productivity. Renew. Energy 2019, 140, 452–460. [Google Scholar] [CrossRef]
- Wang, L.T.; Etim, U.J.; Zhang, C.C.; Amirav, L.; Zhong, Z.Y. CO2 Activation and Hydrogenation on Cu-ZnO/Al2O3 Nanorod Catalysts: An In Situ FTIR Study. Nanomaterials 2022, 12, 2527. [Google Scholar] [CrossRef] [PubMed]
- Liang, Z.D.; Gao, P.; Tang, Z.Y.; Lv, M.; Sun, Y.H. Three dimensional porous Cu-Zn/Al foam monolithic catalyst for CO2 hydrogenation to methanol in microreactor. J. CO2 Util. 2017, 21, 191–199. [Google Scholar] [CrossRef]
- Dong, X.S.; Li, F.; Zhao, N.; Xiao, F.K.; Wang, J.W.; Tan, Y.S. CO2 hydrogenation to methanol over Cu/ZnO/ZrO2 catalysts prepared by precipitation-reduction method. Appl. Catal. B-Environ. 2016, 191, 8–17. [Google Scholar] [CrossRef]
- Zhang, C.; Yang, H.Y.; Gao, P.; Zhu, H.; Zhong, L.S.; Wang, H.; Wei, W.; Sun, Y.H. Preparation and CO2 hydrogenation catalytic properties of alumina microsphere supported Cu-based catalyst by deposition-precipitation method. J. CO2 Util. 2017, 17, 263–272. [Google Scholar] [CrossRef]
- Zhang, Y.P.; Fei, J.H.; Yu, Y.M.; Zheng, X.M. Methanol synthesis from CO2 hydrogenation over Cu based catalyst supported on zirconia modified γ-Al2O3. Energy Convers. Manag. 2006, 47, 3360–3367. [Google Scholar] [CrossRef]
- Zhang, Y.P.; Fei, J.H.; Yu, Y.M.; Zheng, X.M. Study of CO2 hydrogenation to methanol over Cu-V/γ-Al2O3 catalyst. J. Nat. Gas Chem. 2007, 16, 12–15. [Google Scholar] [CrossRef]
- Bansode, A.; Urakawa, A. Towards full one-pass conversion of carbon dioxide to methanol and methanol-derived products. J. Catal. 2014, 309, 66–70. [Google Scholar] [CrossRef]
- Natesakhawat, S.; Lekse, J.W.; Baltrus, J.P.; Ohodnicki, P.R.; Howard, B.H.; Deng, X.; Matranga, C. Active Sites and Structure-Activity Relationships of Copper-Based Catalysts for Carbon Dioxide Hydrogenation to Methanol. ACS Catal. 2012, 2, 1667–1676. [Google Scholar] [CrossRef]
- Behrens, M.; Studt, F.; Kasatkin, I.; Kuhl, S.; Havecker, M.; Abild-Pedersen, F.; Zander, S.; Girgsdies, F.; Kurr, P.; Kniep, B.L.; et al. The Active Site of Methanol Synthesis over Cu/ZnO/Al2O3 Industrial Catalysts. Science 2012, 336, 893–897. [Google Scholar] [CrossRef]
- Lunkenbein, T.; Schumann, J.; Behrens, M.; Schlogl, R.; Willinger, M.G. Formation of a ZnO overlayer in industrial Cu/ZnO/Al2O3 catalysts induced by strong metal-support interaction. Angew. Chem. Int. Ed. 2015, 54, 4544–4548. [Google Scholar] [CrossRef]
- Kattel, S.; Ramirez, P.J.; Chen, J.G.; Rodriguez, J.A.; Liu, P. Active sites for CO2 hydrogenation to methanol on Cu/ZnO catalysts. Science 2017, 357, 1296–1299. [Google Scholar] [CrossRef]
- Kuld, S.; Thorhauge, M.; Falsig, H.; Elkjar, C.F.; Helveg, S.; Chorkendorff, I.; Sehested, J. Quantifying the promotion of Cu catalysts by ZnO for methanol synthesis. Science 2016, 352, 969–974. [Google Scholar] [CrossRef]
- Schumann, J.; Tarasov, A.; Thomas, N.; Schlogl, R.; Behrens, M. Cu, Zn-based catalysts for methanol synthesis: On the effect of calcination conditions and the part of residual carbonates. Appl. Catal. A-Gen. 2016, 516, 117–126. [Google Scholar] [CrossRef]
- Tada, S.; Kayamori, S.; Honma, T.; Kamei, H.; Nariyuki, A.; Kon, K.; Toyao, T.; Shimizu, K.; Satokawa, S. Design of interfacial sites between Cu and amorphous ZrO2 dedicated to CO2-to-methanol hydrogenation. ACS Catal. 2018, 8, 7809–7819. [Google Scholar] [CrossRef]
- Wilmer, H.; Genger, T.; Hinrichsen, O. The interaction of hydrogen with alumina-supported copper catalysts: A temperature-programmed adsorption/temperature-programmed desorption/isotopic exchange reaction study. J. Catal. 2003, 215, 188–198. [Google Scholar] [CrossRef]
- Behrens, M.; Zander, S.; Kurr, P.; Jacobsen, N.; Senker, J.; Koch, G.; Ressler, T.; Fischer, R.V.; Schlogl, R. Performance Improvement of Nanocatalysts by Promoter-Induced Defects in the Support Material: Methanol Synthesis over Cu/ZnO: Al. J. Am. Chem. Soc. 2013, 135, 6061–6068. [Google Scholar] [CrossRef] [PubMed]
- Dai, H.; Qiu, Y.P.; Dai, H.B.; Wang, P. Ni-Pt/CeO2 Loaded On Granular Activated Carbon: An Efficient Monolithic Catalyst for Controlled Hydrogen Generation From Hydrous Hydrazine. ACS Sustain. Chem. Eng. 2018, 6, 9876–9882. [Google Scholar] [CrossRef]
- Fan, Y.J.; Wu, S.F. A graphene-supported copper-based catalyst for the hydrogenation of carbon dioxide to form methanol. J. CO2 Util. 2016, 16, 150–156. [Google Scholar] [CrossRef]
- Luo, Z.; Tian, S.S.; Wang, Z. Enhanced Activity of Cu/ZnO/C Catalysts Prepared by Cold Plasma for CO2 Hydrogenation to Methanol. Ind. Eng. Chem. Res. 2020, 59, 5657–5663. [Google Scholar] [CrossRef]
- Qi, T.Q.J.; Zhao, Y.M.; Chen, S.Y.; Li, W.Z.; Guo, X.W.; Zhang, Y.C.; Song, C.S. Bimetallic metal organic framework-templated synthesis of a Cu-ZnO/Al2O3 catalyst with superior methanol selectivity for CO2 hydrogenation. Mol. Catal. 2021, 514, 111870. [Google Scholar] [CrossRef]
- Gao, P.; Li, F.; Zhan, H.; Zhao, N.; Xiao, F.; Wei, W.; Zhong, L.; Wang, H.; Sun, Y. Influence of Zr on the performance of Cu/Zn/Al/Zr catalysts via hydrotalcite-like precursors for CO2 hydrogenation to methanol. J. Catal. 2013, 298, 51–60. [Google Scholar] [CrossRef]
- Zhang, Y.; Zhong, L.; Wang, H.; Gao, P.; Li, X.; Xiao, S.; Ding, G.; Wei, W.; Sun, Y. Catalytic performance of spray-dried Cu/ZnO/Al2O3/ZrO2 catalysts for slurry methanol synthesis from CO2 hydrogenation. J. CO2 Util. 2016, 15, 72–82. [Google Scholar] [CrossRef]
- Schumann, J.; Eichelbaum, M.; Lunkenbein, T.; Thomas, N.; Galvan, M.C.A.; Schlogl, R.; Behrens, M. Promoting strong metal support interaction: Doping ZnO for enhanced activity of Cu/ZnO:M (M=Al, Ga, Mg) catalysts. ACS Catal. 2015, 5, 3260–3270. [Google Scholar] [CrossRef]
- Gao, P.; Zhong, L.; Zhang, L.; Wang, H.; Zhao, N.; Wei, W.; Sun, Y. Yttrium oxide modified Cu/ZnO/Al2O3 catalysts via hydrotalcite-like precursors for CO2 hydrogenation to methanol. Catal. Sci. Technol. 2015, 5, 4365–4377. [Google Scholar] [CrossRef]
- Jiang, Y.; Yang, H.; Gao, P.; Li, X.; Zhang, J.; Liu, H.; Wang, H.; Wei, W.; Sun, Y. Slurry methanol synthesis from CO2 hydrogenation over micro-spherical SiO2 support Cu/ZnO catalysts. J. CO2 Util. 2018, 26, 642–651. [Google Scholar] [CrossRef]
- Zhao, Z.Q.; Che, X.K.; Wang, Z.M.; Li, F.; Xue, W.; Wang, Y.J. Effect of Zn on the Catalytic Performance of Cu-Zn-Al in the Hydrogenation of Methyl Acetate. Acta Pet. Sin. 2020, 36, 45–53. [Google Scholar]
- Koh, M.K.; Wong, Y.J.; Chai, S.P.; Mohamed, A.R. Carbon dioxide hydroge-nation to methanol over multi-functional catalyst: Effects of reactants adsorption and metal-oxide(s) interfacial area. J. Ind. Eng. Chem. 2018, 62, 156–165. [Google Scholar] [CrossRef]
- Yano, T.; Ebizuka, M.; Shibata, S.; Yamane, M. Anomalous Chemical Shifts of Cu 2p and Cu LMM Auger Spectra of Silicate Glasses. J. Electron. Spectroscop. Relat. Phenom. 2003, 131, 133–144. [Google Scholar] [CrossRef]
- Poulston, S.; Parlett, P.M.; Stone, P.; Bowker, M. Surface Oxidation and Reduction of CuO and Cu2O Studied Using XPS and XAES. Surf. Interface Anal. 1996, 24, 811–820. [Google Scholar] [CrossRef]
- Treglia, G.; Desjonqueres, M.C.; Ducastelle, F.; Spanjaard, D. Correlation effects on Auger spectra in unfilled d band metals. J. Phys. C Solid State Phys. 1981, 14, 4347–4355. [Google Scholar] [CrossRef]
- Wang, Y.; Shen, Y.L.; Wang, S.P.; Li, Z.H.; Ma, X.B. Insight into the Balancing Effect of Active Cu Species for Hydrogenation of Carbon-Oxygen Bonds. ACS Catal. 2015, 5, 6200–6208. [Google Scholar] [CrossRef]
- Jiang, X.; Wang, X.X.; Nie, X.W.; Koizumia, N.; Guo, X.W.; Song, C.S. CO2 hydrogenation to methanol on Pd-Cu bimetallic catalysts: H2/CO2 ratio dependence and surface species. Catal. Today 2018, 316, 62–70. [Google Scholar] [CrossRef]
- Cabilla, G.C.; Bonivardi, A.L.; Baltanas, M.A. Infrared study of the adsorption of formic acid on clean and Ca-promoted Pd/SiO2 catalysts. Appl. Catal. A-Gen. 2003, 255, 181–195. [Google Scholar] [CrossRef]
- Erdohelyi, A.; Pasztor, M.; Solymosi, F. Catalytic hydrogenation of CO2 over supported palladium. J. Catal. 1986, 98, 166–177. [Google Scholar] [CrossRef]
- Millar, G.J.; Rochester, C.H.; Waugh, K.C. Infrared study of the adsorption of formic acid on silica-supported copper and oxidized copper catalysts. J. Chem. Soc. Faraday Trans. 1991, 87, 1491–1496. [Google Scholar] [CrossRef]
- Collins, S.E.; Chiavassa, D.L.; Bonivardi, A.L.; Baltanas, M.A. Hydrogen Spillover in Ga2O3-Pd/SiO2 Catalysts for Methanol Synthesis from CO2/H2. Catal. Lett. 2005, 103, 83–88. [Google Scholar] [CrossRef]
- Bando, K.K.; Sayama, K.; Kusama, H.; Okabe, K.; Arakawa, H. In-situ FT-IR study on CO2 hydrogenation over Cu catalysts supported on SiO2, Al2O3, and TiO2. Appl. Catal. A-Gen. 1997, 165, 391–409. [Google Scholar] [CrossRef]
- Noei, H.; Qiu, H.S.; Wang, Y.M.; Loffler, E.; Woll, C.; Muhler, M. The identification of hydroxyl groups on ZnO nanoparticles by infrared spectroscopy. Phys. Chem. Chem. Phys. 2008, 10, 7092–7097. [Google Scholar] [CrossRef]
- Wang, Y.; Muhler, M.; Woll, C. Spectroscopic evidence for the partial dissociation of H2O on ZnO(1010). Phys. Chem. Chem. Phys. 2006, 8, 1521–1524. [Google Scholar] [CrossRef]
- Wang, Y.H.; Gao, W.G.; Li, K.Z.; Zheng, Y.N.; Xie, Z.H.; Na, W.; Chen, J.G.; Wang, H. Strong Evidence of the Role of H2O in Affecting Methanol Selectivity from CO2 Hydrogenation over Cu-ZnO-ZrO2. Chem 2020, 6, 419–430. [Google Scholar] [CrossRef]
- Guo, X.M.; Mao, D.S.; Lu, G.Z.; Wang, S.; Wu, G.S. The influence of La doping on the catalytic behavior of Cu/ZrO2 for methanol synthesis from CO2 hydrogenatio. J. Mol. Catal. A Chem. 2011, 345, 60–68. [Google Scholar] [CrossRef]
- Hong, Q.J.; Liu, Z.P. Mechanism of CO2 hydrogenation over Cu/ZrO2(2̅12) interface from first-principles kinetic Monte Carlo simulations. Surf. Sci. 2010, 604, 1869–1876. [Google Scholar] [CrossRef]
- Guo, X.M.; Mao, D.S.; Lu, G.Z.; Wang, S.; Wu, G.S. Glycine-nitrate combustion synthesis of CuO-ZnO-ZrO2 catalysts for methanol synthesis from CO2 hydrogenation. J. Catal. 2010, 271, 178–185. [Google Scholar] [CrossRef]
- Liu, T.K.; Hong, X.L.; Liu, G.L. In situ generation of the Cu@3D-ZrOx framework catalyst for selective methanol synthesis from CO2/H2. ACS Catal. 2020, 10, 93–102. [Google Scholar] [CrossRef]
- Gao, P.; Li, F.; Zhao, N.; Xiao, F.K.; Wei, W.; Zhong, L.S.; Sun, Y.H. Influence of modifier (Mn, La, Ce, Zr and Y) on the performance of Cu/Zn/Al catalysts via hydrotalcite-like precursors for CO2 hydrogenation to methanol. Appl. Catal. A-Gen. 2013, 468, 442–452. [Google Scholar] [CrossRef]
- Liao, F.L.; Huang, Y.Q.; Ge, J.W.; Zheng, W.R.; Tedsree, K.; Collier, P.; Hong, X.L.; Tsang, S.C. Morphology-Dependent Interactions of ZnO with Cu Nanoparticles at the Materials’ Interface in Selective Hydrogenation of CO2 to CH3OH. Angew. Chem. Int. Ed. 2011, 50, 2162–2165. [Google Scholar] [CrossRef]
- Li, H.J.; Wang, L.; Gao, X.H.; Xiao, F.S. Cu/ZnO/Al2O3 Catalyst Modulated by Zirconia with Enhanced Performance in CO2 Hydrogenation to Methanol. Ind. Eng. Chem. Res. 2022, 61, 10446–10454. [Google Scholar] [CrossRef]
- Mureddu, M.; Lai, S.; Atzori, L.; Rombi, E.; Ferrara, F.; Pettinau, A.; Cutrufello, M. Ex-LDH-Based Catalysts for CO2 Conversion to Methanol and Dimethyl Ether. Catalysts 2021, 11, 615. [Google Scholar] [CrossRef]
- Frusteri, L.; Cannilla, C.; Todaro, S.; Frusteri, F.; Bonura, G. Tailoring of Hydrotalcite-Derived Cu-Based Catalysts for CO2 Hydrogenation to Methanol. Catalysts 2019, 9, 1058. [Google Scholar] [CrossRef]
- Lei, H.; Hou, Z.; Xie, J. Hydrogenation of CO2 to CH3OH over CuO/ZnO/Al2O3 catalysts prepared via a solvent-free routine. Fuel 2016, 16, 191–198. [Google Scholar] [CrossRef]


Disclaimer/Publisher’s Note: The statements, opinions and data contained in all publications are solely those of the individual author(s) and contributor(s) and not of MDPI and/or the editor(s). MDPI and/or the editor(s) disclaim responsibility for any injury to people or property resulting from any ideas, methods, instructions or products referred to in the content. |
© 2023 by the authors. Licensee MDPI, Basel, Switzerland. This article is an open access article distributed under the terms and conditions of the Creative Commons Attribution (CC BY) license (https://creativecommons.org/licenses/by/4.0/).