Article

Adsorption and Photo-Degradation of Organophosphates on Sulfate-Terminated Anatase TiO2 Nanoparticles

by
Fredric G. Svensson
and
Lars Österlund
*
Department of Materials Science and Engineering, The Ångström Laboratory, Uppsala University, P.O. Box 35, SE-751 03 Uppsala, Sweden
*
Author to whom correspondence should be addressed.
Catalysts 2023, 13(3), 526; https://doi.org/10.3390/catal13030526
Submission received: 1 February 2023 / Revised: 26 February 2023 / Accepted: 27 February 2023 / Published: 4 March 2023

Abstract

:
The adsorption and photocatalytic degradation of trimethyl phosphate (TMP) and triethyl phosphate (TEP), two environmentally relevant model pollutants, have been studied on commercial anatase TiO2 and sulfate-terminated anatase TiO2 nanoparticles by means of operando diffuse reflectance infrared Fourier transform (DRIFT) spectroscopy and 2D correlation spectroscopy (2D COS). It is concluded that both TMP and TEP adsorb dissociatively on anatase TiO2, while on the sulfate-terminated anatase TiO2, TMP and TEP adsorb associatively. Upon UV illumination, TMP and TEP are completely oxidized on sulfate-terminated anatase TiO2, as evidenced by the evolution of the IR bands characteristic for water and carbon dioxide. In contrast, on anatase TiO2, UV illumination leads to the formation of stable surface-coordinated carboxylate products, which impedes complete oxidation. 2D COS analysis suggests that parallel reaction pathways occur during oxidation under UV illumination, viz. methoxide/ethoxide (ads) → carboxylates (ads) and methoxide/ethoxide (ads) → aldehydes (ads) → carboxylates (ads). A parallel reaction occurs on sulfated TiO2 that yields CO2 and H2O by direct radical reactions with the methoxide groups with little, or no, formation of surface-coordinated intermediates. Sulfated TiO2 favor the formation of aldehyde intermediates, with reaction rates 10 times and 30 times faster for TMP and TEM, respectively, compared with commercial anatase TiO2. About 37% (33%) and 32% (24%) of TMP (TEP) were degraded on sulfated-terminated TiO2 and pure TiO2, respectively, after the first 9 min of UV illumination. We show that the sulfate-functionalization of TiO2 has two main functions. First, it prevents the formation of strongly bonded bridging carboxylates, thereby alleviating deactivation. Second, it promotes full oxidation of the organic side-chains into carbon dioxide and water. Improved electron-hole separation by the electrophilic S(VI) in combination with the blocking of bridging reaction intermediates is proposed to contribute to the improved activity. The presented results give insights into how acidic surface modifications change adsorbate surface chemistries, which can be used to increase the sustained activity of low-temperature photocatalysts.

1. Introduction

Organophosphates (OP) can be considered as esters of phosphoric acid with the general formula O=P(OR)3, where R is an organic group. OPs modified with various organic side-chains have wide-spread applications and are, for instance, applied as pesticides, insecticides, flame retardants, plasticizers, and chemical warfare agents [1,2,3,4]. Because of their extensive applications, OPs have become increasingly abundant in the environment. A recent development is the replacement of polybrominated organics as flame retardants [2,5], which has caused further concerns regarding their chemical stability and potential toxicity to animals and plants.
Metal oxides have received a great deal of attention as catalysts for the degradation of OPs, both thermally and by means of photodegradation [6]. In particular, titania-based photocatalysts have gained particular interest for the remediation of contaminated waters and air [7,8]. The high affinity of phosphates and phosphonates for metal oxides is well-known, and adsorption and photo-degradation have been studied for a number of photocatalytic metal oxides, including iron oxides [9], ceria [10,11], zinc oxide [12,13], and titanium dioxide [14,15,16].
Titanium dioxide belongs to the “first-generation photocatalysts” and has been researched extensively [17]. Since TiO2 only absorbs UV light, much work has been devoted to synthesizing new materials that can absorb a larger part of the solar light spectrum and be applied in solar-powered devices. More recently, attention has been directed to the modification of the electronic properties of photocatalytic materials to judiciously increase the electron–hole pair generation rate and their separation at interfaces, as well as the details of adsorbate surface bonding [18]. New promising photocatalysts include, e.g., bimetallic heterojunctions [19,20], MXenes [21,22], and ferroelectric materials [23]. In spite of these advancements, photocatalysts for air purification with sustained activity have been lagging behind due to the well-known deactivation problems for low-temperature gas–solid catalytic reactions [24,25]. Thus, it is attractive to develop photocatalysts with prolonged lifetimes for the removal of gaseous pollutants. In this context, anatase TiO2, with modified surface properties, has recently emerged as a promising gas-phase photocatalyst. Previous works by us [26,27] and others [28] have demonstrated the advantage of surface-acidic titania (by sulfation) for slowing down the build-up of deactivating intermediates. The modification of titania with sulfate has also been shown to increase the concentration of Ti3+ centers, which promotes charge-separation [29].
Numerous studies have been reported on the decomposition of organophosphonates (e.g., dimethyl methyl phosphonate, DMMP) and, to a lesser extent, organophosphates [4,11,15,30,31]. The incoming OPs can either adsorb molecularly (i.e., via hydrogen bonding with surface hydroxyl groups) or coordinate to a Lewis acid site (i.e., a surface cation). The latter is usually accompanied by the dissociation of the phosphoryl O=P bonds and the P-O-C bonds via the interaction of neighboring hydroxyl groups and the formation of coordinated alkoxide groups [9,32]. Some authors have referred to this as a hydrolytic reaction with the breakage of the P−O(C) bond (hydrolysis). Others have indicated a breakage of the (P)O−C bond (dealkylation) using isotope H218O labeling [11,33]. Nevertheless, the P−O−C bond is transformed into a P-OH bond, and progressive hydrolysis/dealkylation eventually convert the OP into a surface-adsorbed phosphate group that is strongly bonded to the surface and may lead to site-blocking, thereby deactivating the catalyst. Organophosphonates adsorbed to titania surfaces tend to oxidize into surface-phosphates during decomposition [34,35]. The adsorbed organic side-chains (e.g., alkoxides) will, in turn, undergo a series of oxidation reactions, yielding ketones, aldehydes, (bi)carbonates, and carboxylic acids as potential intermediates, before reaching the oxidative end-point, i.e., water and carbon dioxide. These intermediates—in particular, carboxylates and (bi)carbonates—can form strong bridging bonds, accumulate on the catalyst surface, and block active sites.
In this paper, we report on the adsorption and decomposition of the organophosphates trimethyl phosphate (TMP) and triethyl phosphate (TEP) on sulfated titania and pure anatase-TiO2 nanoparticles using commercial Hombikat UV100. The degradation pathways of the organic side-chains of these molecules are studied using a combination of operando DRIFTS and 2D COS. Operando diffuse reflectance infrared Fourier transform spectroscopy (DRIFTS) is a powerful technique for following the adsorption and degradation of surface species as a function of time on a catalyst surface during a reaction. However, the 2D spectra thus acquired tend to be rather complex, and correlating bands and reaction sequences can be difficult to identify. Here, 2D correlation spectroscopy (2D COS) is a useful tool for identifying correlating absorption bands to establish reaction pathways [36,37]

2. Results

2.1. Materials Characterization

2.1.1. Powder X-ray Diffraction and Elemental Analysis

Powder X-ray diffractograms for pure anatase-TiO2 (UV100) and sulfate-terminated anatase-TiO2 (Ti-600) are presented in Figure 1. Both samples consist of phase-pure anatase TiO2. Using the Scherrer equation, the average crystallite sizes were calculated to 7.6 nm and 14.6 nm for UV100 and Ti-600, respectively. The Rietveld refinement of the XRD pattern for Ti-600 yielded cell parameters of a = b = 3.7853 Å, c = 9.5045 Å, and α = β = γ = 90° and a cell volume of 136.19 Å3 (Rwp = 8.92%), belonging to the tetragonal space group I41/amd, thus confirming the anatase crystal structure.
The Ti-600 sample annealed at 600 °C had an S concentration of about 0.9 at.%, as measured by XRF, which accumulates on the particle surfaces upon annealing treatment [27]. X-ray photoelectron spectrometry (XPS) analysis confirmed the previously reported sulfur content of about 1.4 at.% in the +6 oxidation state (S 2p1/2 and S 2p3/2 peak positions at 170.14 eV and 168.84 eV, respectively) [27]. Since XPS is a surface-sensitive technique (in contrast to XRF), the higher sulfur content confirms the sulfur accumulation on the particle surface. UV100 and Ti-600 have a reported BET surface area of ~330 m2/g [38,39] and 96 m2/g, respectively [27]. Note that the difference in the surface area will result in different absolute numbers of adsorbed molecules and reaction products. However, in DRIFTS, the relative change with respect to a background is recorded, which automatically normalizes the measured absorbance and makes inter-sample comparisons quantitively valid.

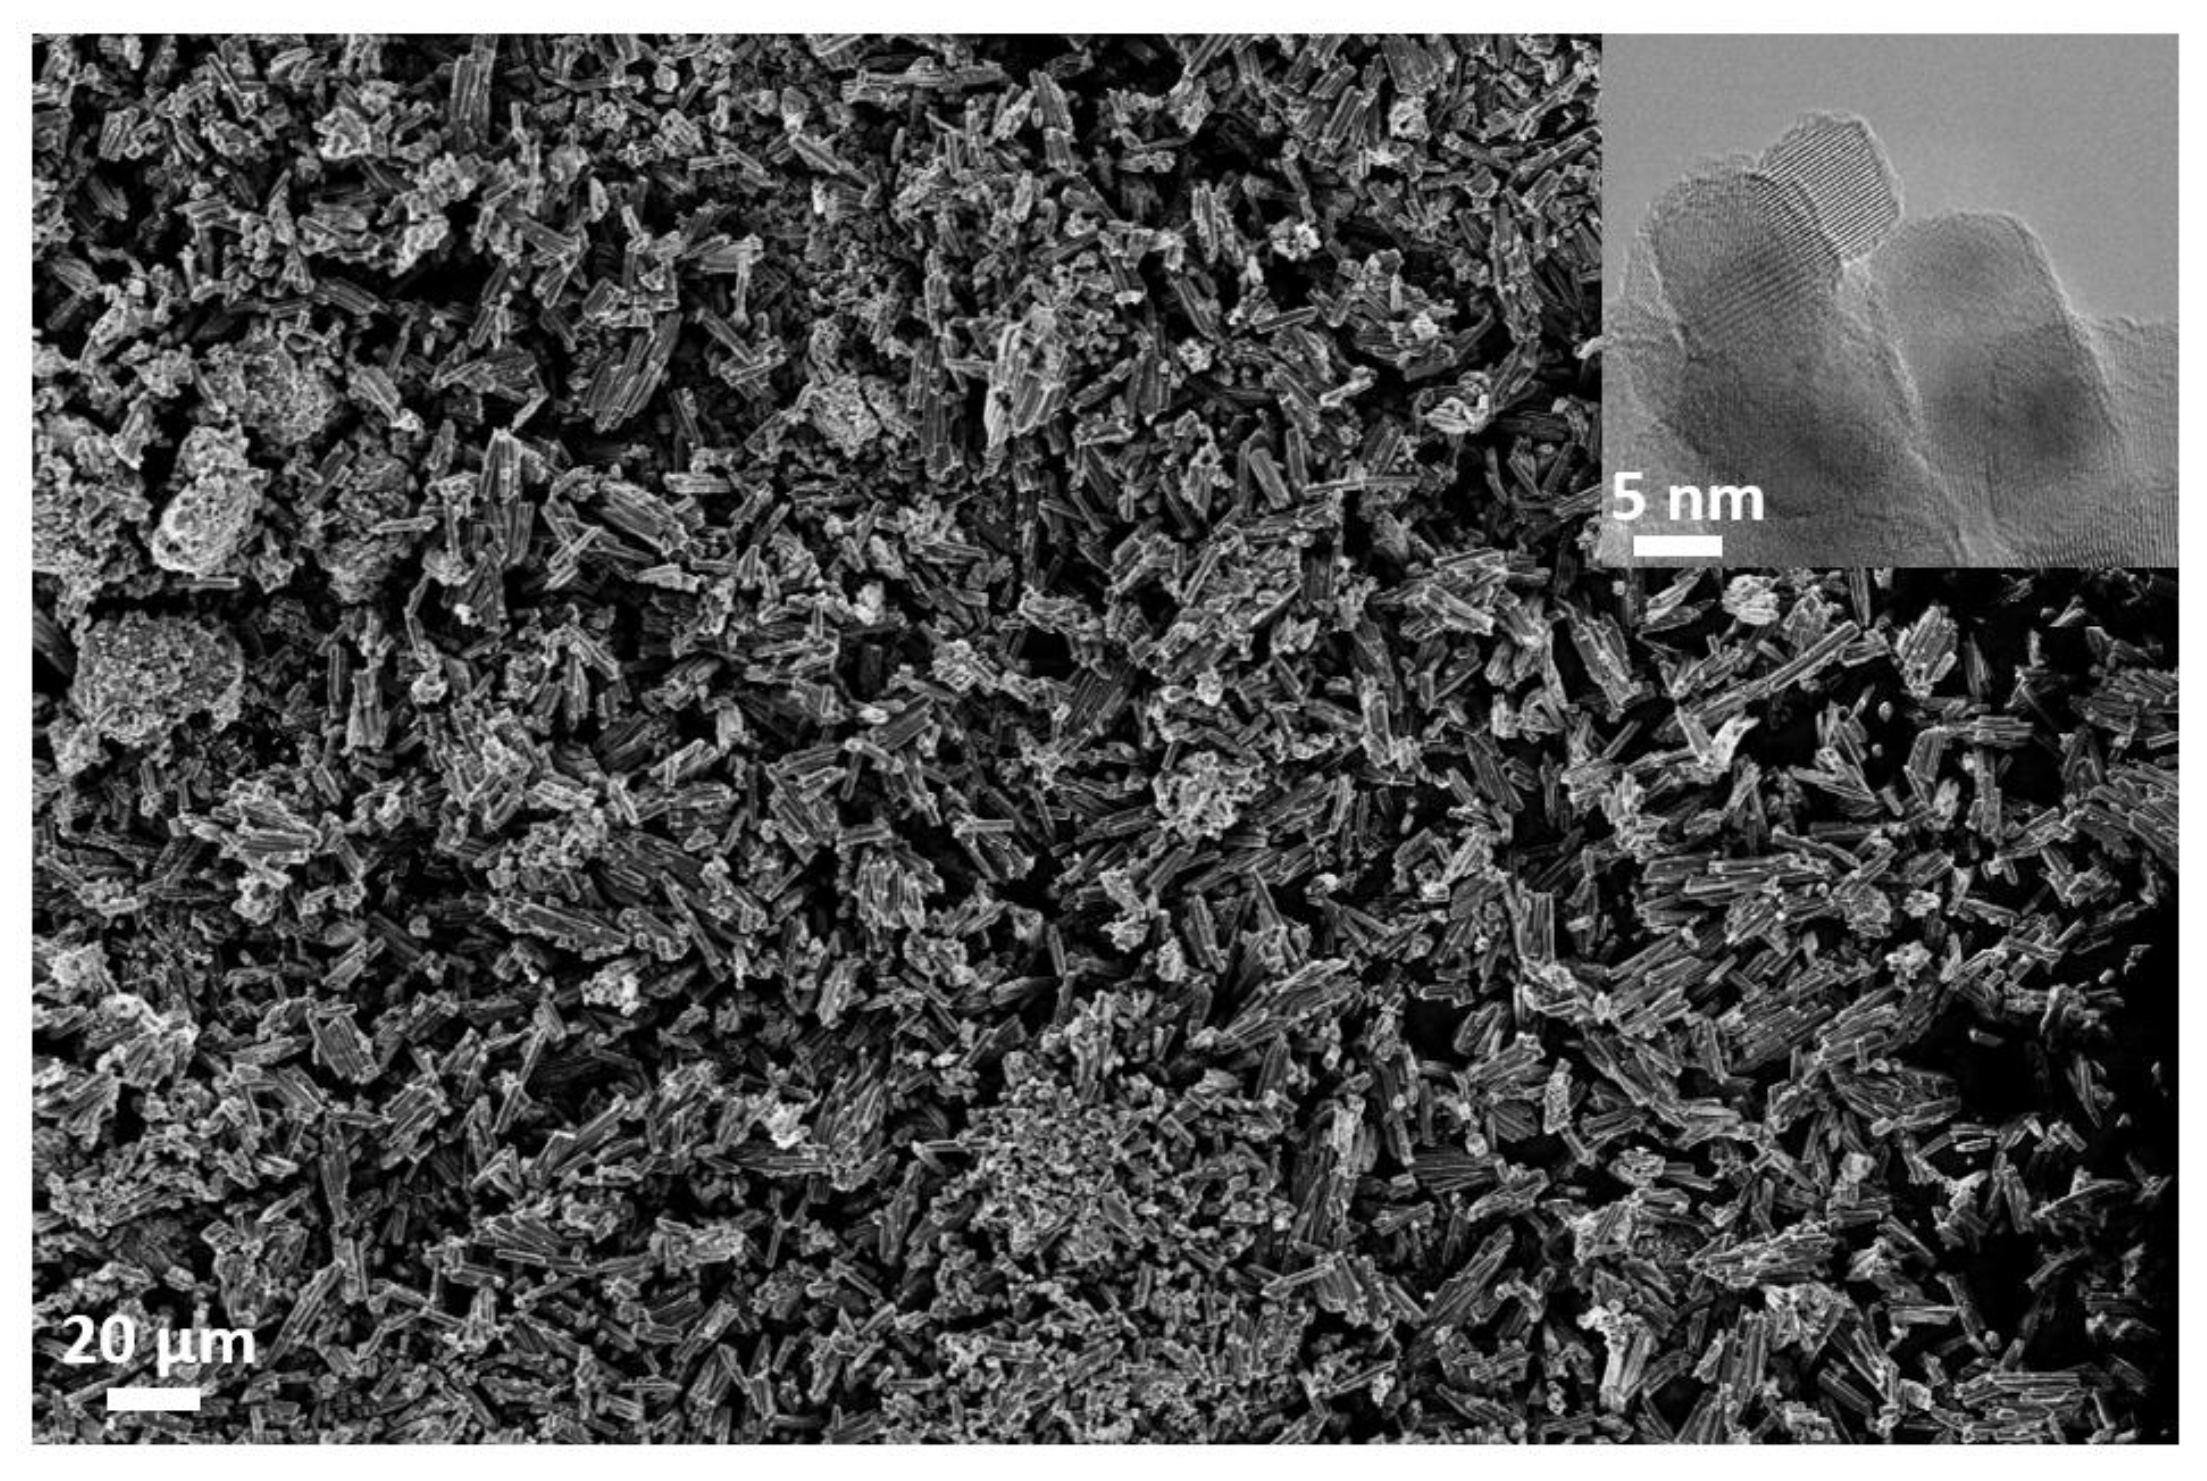
2.1.2. Electron Microscopy

Scanning electron microscopy (SEM) analysis of Ti-600 revealed quite uniform rod-like aggregates of ~10 μm in length (Figure 2). The same rod-like strucutre is present for the untreated titanyl sulfate precursor, thus indicating a topotactic transformation during the thermal decomposition. As visible in the transmission electron (TEM) micrographs, the rods consist of ~15 nm spherical crystallites, agreeing very well with the sizes calculated from the XRD data.

2.1.3. Bandgap Determination

Optical bandgaps for Ti-600 and UV100 were measured by spectrophotometry. Transmittance and reflectance spectra were measured from drop-casted films. Since the drop-casting of porous materials yields films with uneven thicknesses across the several mm-large optical beam, the calculation of the absorption coefficients was not performed, and Tauc analysis was therefore conducted using absorbance data, viz. A = 1 – R − T, and is shown (Figure 3). The estimated bandgaps for Ti-600 and UV100 are 3.18 eV and 3.06 eV, respectively. The results are in good agreement with our previous results on sulfated TiO2 thin films made by magnetron sputtering [40].

2.2. Adsorption of TMP and TEP

Vaporized TMP and TEP were adsorbed on pure TiO2 (UV100) and sulfate-terminated TiO2 (Ti-600) at calibrated concentrations of about 30 and 10 ppmv, respectively, in dry synthetic air using a home-built gas generator, as described elsewhere [41,42] (see also Section 3.3). Adsorption was performed under dry conditions, where the catalysts were heated to 400 °C in air for 20 min prior to adsorption to remove adventitious carbon contaminant species and adsorbed water from the samples. Saturation coverage was achieved for both Ops, as monitored by in situ DRIFTS. After the adsorption of the OPs, the catalyst surfaces were purged with air for 10 min before UV illumination was started. A detailed description of the experimental setup is given in Section 3.3.

2.2.1. Adsorption of Trimethyl Phosphate (TMP)

Figure 4a shows the time series of DRIFT spectra of TMP adsorbing on UV100. It is seen that TMP mainly adsorbs dissociatively, yielding several overlapping bands that evolve during the first few minutes of dosing. These bands are mainly associated with symmetric (1500 cm−1 to 1600 cm−1) and asymmetric (1320 cm−1 to 1380 cm−1) carboxylate stretching vibrations, respectively, and C−H bending modes assigned to the formate [15,43]. The absorption band about 1211 cm−1 is associated with the characteristic ν(P=O) vibration in TMP, and the broad band at ~1140 cm−1 is due to combinations of the ρ(PCH3) rocking vibration of DMMP [44] and the ρ(OCH3) mode of methoxy fragments of cleaved DMMP. The phosphoryl P=O bond that occurs at ~1250 cm−1 in liquids is down-shifted, indicating a weakening of the double bond due to the surface coordination to Ti atoms [15,42,44]. The phosphoryl band is quite weak, indicating the decomposition of TMP during adsorption. The dominant band at ~1655 cm−1 is ascribed to the formation of condensation products from reactions between dissociated (oxidized) methoxide groups [45]. It should be noted, however, that since methoxide/formaldehyde lack α-hydrogens, they will not undergo aldol condensation. Instead, other forms of (surface) condensation reactions are possible, e.g., Cannizzaro or Tishchenko reactions. Evidence for the Cannizzaro reaction, where two formaldehyde molecules can disproportion into one methoxy molecule and one formate molecule, was reported for P25-TiO2 [46]. In the case of Ti-600, the sulfate-functionalization yields a super acidic surface and would not be expected to promote base-catalyzed organic reactions. However, Seki and Onaka [47] studied the Tishchenko reaction over sulfated mesoporous alumina. While the introduction of sulfate groups generally increased surface acidity, they observed the formation of a small number of highly basic sites, presumably via the inductive effect of sulfate, active for the Tishchenko reaction. Thus, it is possible that sulfated-anatase possess a small number of active basic catalytic sites that could promote condensation via, e.g., the Cannizzaro or Tishchenko reactions. However, we provide no experimental evidence for this in the present work, and future studies are required to confirm this hypothesis. Table 1 lists the rate constants for the adsorption of TMP on Ti-600 and UV100. The band due the methoxy side group, −OCH3 at ~1470 cm−1, was used. The rate constant for the adsorption of TMP on Ti-600 is about 14 times larger than that for UV100, which is explained by the stabilization of OPs on Ti-600, favoring associative adsorption, and facile dissociation on UV100.
Detailed 2D COS analysis of the synchronous and asynchronous spectra (Figure S19) indicates that the 1655 cm−1 band arises from condensation products and not from water (found at ~1620 cm−1). In the early adsorption phase (~160 s in Figure 4a), bands at 1484 cm−1 and 1462 cm−1 appear but are later covered by the O-C-O-related vibrational bands. These bands presumably arise from the formation of surface-coordinated methoxy groups [10]. A schematic illustration of the adsorption of TMP to UV100 and Ti-600, respectively, is depicted in Scheme 1.
Figure 4b shows the corresponding spectra for Ti-600. It is evident that the intensity of the ν(P=O) vibration of TMP is much larger than that on the pure anatase UV100, and doublet bands around 1250 cm−1 and 1223 cm−1 appear. The latter is attributed to the same cation-coordinated Ti-O=P(-R) species as for UV100, while the former is similar to liquid-phase TMP and is associated with TMP coordinated to the surface sulfate, i.e., (Ti-O3)S-O-H—O=P(-R). This indicates that sulfate-coordinated TMP is stabilized on Ti-600 and that sulfate groups hinder dissociative TMP adsorption. The higher wavenumbers also indicate weaker interaction compared with UV100 (~1211 cm−1). The large negative band at ~1340 cm−1 is due to TMP coordination to the surface sulfate groups, which leads to the dissociation of the S=O bond in surface-coordinated SO4 groups [26,48,49,50] and, hence, its disappearance in the spectra.
While TMP appears more stable on Ti-600, decomposition still occurs, and the product profile is similar to that of UV100, with asymmetric carboxylate stretching at 1585 cm−1 and 1550 cm−1. We attribute this to TMP adsorption on Ti sites that are not covered by sulfate groups, and this indicates submonolayer coverage of sulfate surface groups. The symmetric stretches of the cleaved methoxy fragments are mostly masked by the intense negative band at 1340 cm−1, but a broad band at 1395 cm−1 can tentatively be assigned to δ(CH) or νs(OCO) of the formate [15,44]. In comparison to UV100, the intense band at 1138 cm−1 is narrower and is assigned to be mainly due to the ρ(OCH3) rocking vibration of TMP, with a smaller contribution from the ρ(OCH3) vibration of methoxy fragments, while the band at 1473 cm−1 is assigned to the δas(CH3O) due to surface-coordinated methoxy groups [44].

2.2.2. Adsorption of Triethyl Phosphate

The adsorption of TEP on UV100 results in DRIFT spectra that are similar to those of TMP (Figure 4c). The overlapping bands between 1320−1 and 1380 cm−1 are due to the δas(CH) and δ(CH) modes of TEP [51,52] and νs(OCO) and the δ(CH) modes of surface-coordinated ethoxy fragments. The sharp and intense band at 1470 cm−1 is due to the δas(CH) mode in TEP. The phosphoryl ν(P=O) band is similar to TMP and is significantly red-shifted to 1212 cm−1. The ρ (OCH3) rocking vibration at ~1140 cm−1 is more intense compared to the TMP spectra. An intense band arises for all samples at ~1650 cm−1; we assign this to condensation products forming during surface reactions [27,45]. Some tailing on the condensation–product band between 1700 cm−1 and 1800 cm−1 are expected to be, at least partly, caused by the formation of acetaldehyde—the first step in the oxidation of surface-bond ethoxide groups. The spectra contain fewer overlapping bands in the 1500–1600 cm−1 region compared with DMMP adsorption. Instead, one dominating band is found at 1590 cm−1, with a shoulder at ~1570 cm−1, which are assigned to surface-coordinated ionic carboxylate species, R-COO [15,44].
The TEP absorption spectrum for Ti-600 is qualitatively similar to that of UV100. Similar to TMP, an intense negative band at 1336 cm−1 indicates an interaction between TEP and the S=O moiety of the surface sulfate. Two phosphoryl bands occur at approximately the same wavenumbers, 1248 cm−1 and 1218 cm−1, as for TMP adsorption on Ti-600, suggesting the stabilization of TMP by bonding to surface sulfate groups and the blocking of Ti cation sites that suppress dissociative adsorption. The IR bands due to intermediates in the 1500 cm−1 to 1600 cm−1 region are much less intense compared to the condensation-product band at 1648 cm−1. Two overlapping bands at 1585 cm−1 and 1550 cm−1 appear in approximately the same ratio as for TMP adsorption on Ti-600. These are accompanied by a sharp, intense band at 1138 cm−1 due to the ρ(OCH3) rocking vibration. For TEP, both formate and acetate are possible intermediates, but acetate is not expected for TMP. Thus, some additional unidentified intermediates form. The region with asymmetric OCO-stretching extends down to and overlaps with the δas(CH) vibration at 1475 cm−1. This broader set of overlapping signals suggests, as expected, that more intermediate species form for TEP than for TMP. The adsorption of TEP on Ti-600 is about eight times faster than that on UV100. Similar to TMP, this is attributed to the stabilization of TMP on Ti-600, favoring associative adsorption. The rate constants for adsorption are shown in Table 1.

2.3. Photodegradation of TMP and TEP

2.3.1. Photodegradation of TMP

After TMP adsorption and subsequent purging in synthetic air for about 10 min, the catalysts were illuminated with UV light. Figure 5 shows the DRIFT spectra obtained at different times of UV illumination. To facilitate the identification of species formed and degraded, the UV spectra were background-subtracted by the last spectrum acquired immediately after the purge phase. Thus, the DRIFT spectra only contain absorption bands forming, or disappearing, during UV illumination. However, some intermediates may be volatile and do not adsorb on the surface and are therefore not detected by DRIFTS. For instance, the UV illumination of surface-adsorbed acetaldehyde can yield gaseous methyl radicals [53,54], and sulfated titania has been utilized for the gas-phase dehydration of ethanol to diethyl ether [55].
The UV illumination of UV100 (Figure 5a) leads to the rapid formation of a distinct carboxylate-related band at ~1565 cm−1, which is assigned to Vas(OCO) due to the surface-coordinated formate (Figure 5a). It is accompanied by several overlapping bands between 1300 cm−1 and 1400 cm−1, which contain the νs(OCO) and δ(CH) of the formate [15]. An intense, negative band at 1446 cm−1 is assigned to the νas(OCH3) wagging of TMP and indicated the decomposition of the adsorbed TMP. The negative band at ~1240 cm−1, due to ν(P=O), indicates the further decomposition of the adsorbed TMP molecule. The negative bands at 2970 cm−1, 2932 cm−1, and 2830 cm−1 result from the disappearance of C-H bonds. A carbonyl band, possibly consisting of several overlapping bands, representative of aldehydes, evolves at ~1723 cm−1. A shoulder on the carbonyl band at ~1690 cm−1 could be monodentate formic acid in monodentate coordination via the carbonyl oxygen [56] or possibly condensation products. While the sequence methoxide (ads) → formaldehyde (ads) → formate (ads) → (bi)carbonate (ads) might be expected, 2D COS analysis indicates that the formate band develops before the aldehyde band (Figure S1). Moreover, for both UV100 and Ti-600, the formate band at ~1530 cm−1 decrease synchronously with the TMP band at ~1450 cm−1 (Figures S1 and S2), but changes in the 1530 cm−1 band occur before changes in the 1450 cm−1 band (Figures S1 and S2). This can be explained as follows: First, the oxidation of condensation products, yielding carboxylates, can occur before the oxidation of methoxide/formaldehyde. Second, Murcia and co-workers [57] proposed that the direct photooxidation of alkoxides to carboxylates occurs by a reaction with an adsorbed dioxygen molecule.
The negative band at 1650 cm−1 is assigned to the decomposition of condensation products. This is based on the negative synchronous correlation between the 1650 cm−1 band and the water band at ~1620 cm−1 (Figure S3). The asynchronous spectrum further suggests the decomposition of the condensation products, with the subsequent formation of water (Figure S3).
Figure 5b shows the DRIFT spectra obtained after the UV illumination of Ti-600, following TMP adsorption. The spectra are qualitatively similar to those for UV100, but with higher intensities. An important difference compared with UV100 is the evolution of CO2 into gas-phase on Ti-600, as evidence by the typical IR bands at 2364 cm−1 and 2341 cm−1. As discussed in more detail below, detailed 2D COS analysis reveals that CO2 evolution is not the final reaction step and occurs as one of several parallel reactions. The major carboxylate band at 1581 cm−1 is assigned to the νas(OCO) of the formate, and the overlapping bands in the 1300 cm−1 to 1400 cm−1 range can be assigned to νs(OCO) and δ(CH). According to the 2D COS presented in Figure S2, the band at 1744 cm−1 develops before the 1581 cm−1 band, indicating that the former belongs to formaldehyde that oxidizes into formate. The two carboxylate bands are accompanied by an intense band at ~1166 cm−1 that develops synchronously and is assigned as the ρ(OCH3) rocking vibration. The negative band at 1451 cm−1 is due to the δas(CH) mode of TMP, which rapidly disappears upon UV illumination. Similarly, the negative bands at 2969 cm−1 and 2863 cm−1 are due to the disappearance of the δ(CH) vibrations in TMP and are possibly from condensation products. The carbonyl band is centered at ~1744 cm−1 and contains two shoulders at ~1780 cm−1 and ~1692 cm−1. The former could originate from some condensation product, while the latter is presumably assigned to monodentate formic acid [56]. While not apparent in the 1D spectrum due to overlaps, the synchronous 2D COS analysis finds a negative correlation between the 1650 cm−1 band and the water band at ~1620 cm−1 (Figure S4). Thus, as for UV100, this indicates the decomposition of condensation products with the formation of water.
Thus, for both UV100 and Ti-600, the DRIFT data suggest at least two parallel degradation routes: methoxide → formate and methoxide → formaldehyde → formate; these are illustrated in Scheme 2.

2.3.2. Photodegradation of TEP

Figure 5c shows DRIFT spectra obtained at different times of the UV illumination of UV100 following TEP adsorption, exactly in the same way as for TMP. The results are qualitatively similar to those for TMP photodegradation, but the formate band at 1560 cm−1 is much smaller relative to the aldehyde band at 1723 cm−1. A minor band arising at ~1690 cm−1 has previously been assigned to the monodentate coordination of acetic acid [56]. However, this band also appears, although weak, for the photodegradation of TMP for both UV100 and Ti-600, where acetic acid is not expected. However, the same authors also assigned monodentate formic acid at a close wavenumber (1691 cm−1). Thus, it is possible this band arises from coordinated formic acid, or possibly from some unidentified condensation product.
A notable difference compared with TEP on Ti-600 (Ti-600_TEP) is the larger loss of the water signal in the 3100 cm−1 to 3600 cm−1 range. The negative band at 1646 cm−1 is assigned to the loss of condensation products. The assignment is supported by a negative synchronous correlation with the water band at ~1620 cm−1 (Figure S5). Again, the intense negative band at ~1440 cm−1 can be assigned to the disappearance of the δas(CH) modes of TEP. As for TMP, the 2D COS spectra indicate the occurrence of parallel reaction pathways. Dissociated ethoxide groups can both oxidize to acetaldehyde (which is known to condense to crotonaldehyde on titania) and react with adsorbed dioxygen to directly oxidize to acetate/acetic acid. The TEP band (1440 cm−1) decreases as the aldehyde band (~1720 cm−1) increases. The change at 1440 cm−1 occurs first, indicating that TEP oxidizes into an aldehyde species. The two carboxylate bands at 1534 cm−1 and 1560 cm−1 change before 1440 cm−1 and ~1720 cm−1 (Figure S6), and these species are likely formed through different pathways.
Figure 5d shows the DRIFT spectra after the UV illumination of Ti-600 following TEP adsorption. The formation of CO2 is evident at 2364 cm−1, although to a lesser extent compared with the TMP photodegradation on Ti-600, which may suggest that the total oxidation reaction competes with several surface reactions and competes for accessible active sites. The major negative absorption bands at 1449 cm−1 and 1534 cm−1 suggest the rapid degradation of TEP and carboxylate fragments. This is accompanied by a minor loss of C-H bonds at 2893 cm−1 and 2940 cm−1. Notably, no formation of water is observed between 3100 cm−1 and 3600 cm−1, supporting the assignment of ~1650 cm−1 as predominantly belonging to condensation products, together with the negative synchronous 2D COS of 1650 cm−1 vs. 1620 cm−1 (Figure S7). There is one aldehyde band at 1724 cm−1, assigned to acetaldehyde. Murcia et al. (2013) [57] have previously reported that the photocatalytic oxidation of ethanol over sulfate-functionalized titania appears to favor the formation of acetaldehyde. Acetaldehyde is well-known to rapidly undergo aldol condensation to crotonaldehyde on titania [58,59]. However, the interaction between the carbonyl hydrogen and a sulfate oxygen atom has been suggested to stabilize the adsorbed acetaldehyde; thus, it is reasonably to have an accumulation of acetaldehyde [26]. A small shoulder that appears on the aldehyde band, at ~1690 cm−1, is likely to originate from small amounts of acetic acid that coordinate via the carbonyl group or possible aldol condensation products [56].
According to the synchronous and asynchronous 2D COS spectra in Figure S8, the two carbon dioxide bands at 2361 cm−1 and 2340 cm−1 grow as the 1449 cm−1 band gets increasingly negative, and the TEP degrades prior to the evolution of carbon dioxide. However, changes in the aldehyde and carboxylate bands (1723 cm−1 and 1535 cm−1, respectively) occur before the decomposition of TEP (1449 cm−1), again indicating parallel reaction pathways. In all four spectra in Figure 5, a negative band in the 1530 cm−1 region develops, which is due to the degradation of chelating and monodentate carboxylates. While the photooxidation of the carboxylates for Ti-600 appears to progress towards full oxidation, the partial transformation to strongly bonded bridging carboxylates and (bi)carbonates is evidenced by the evolution of a band at ~1500 cm−1 for UV100.
Scheme 3 depicts the proposed reaction mechanism of TMP (and TEP) adsorbed on Ti-600. The last step emphasizes the parallel reactions on sulfated TiO2 yielding CO2 and H2O by direct radical reactions with the methoxide groups, with little or no formation of surface-coordinated intermediates, in contrast to the case in which abundant Ti sites are available, as depicted in Scheme 2.

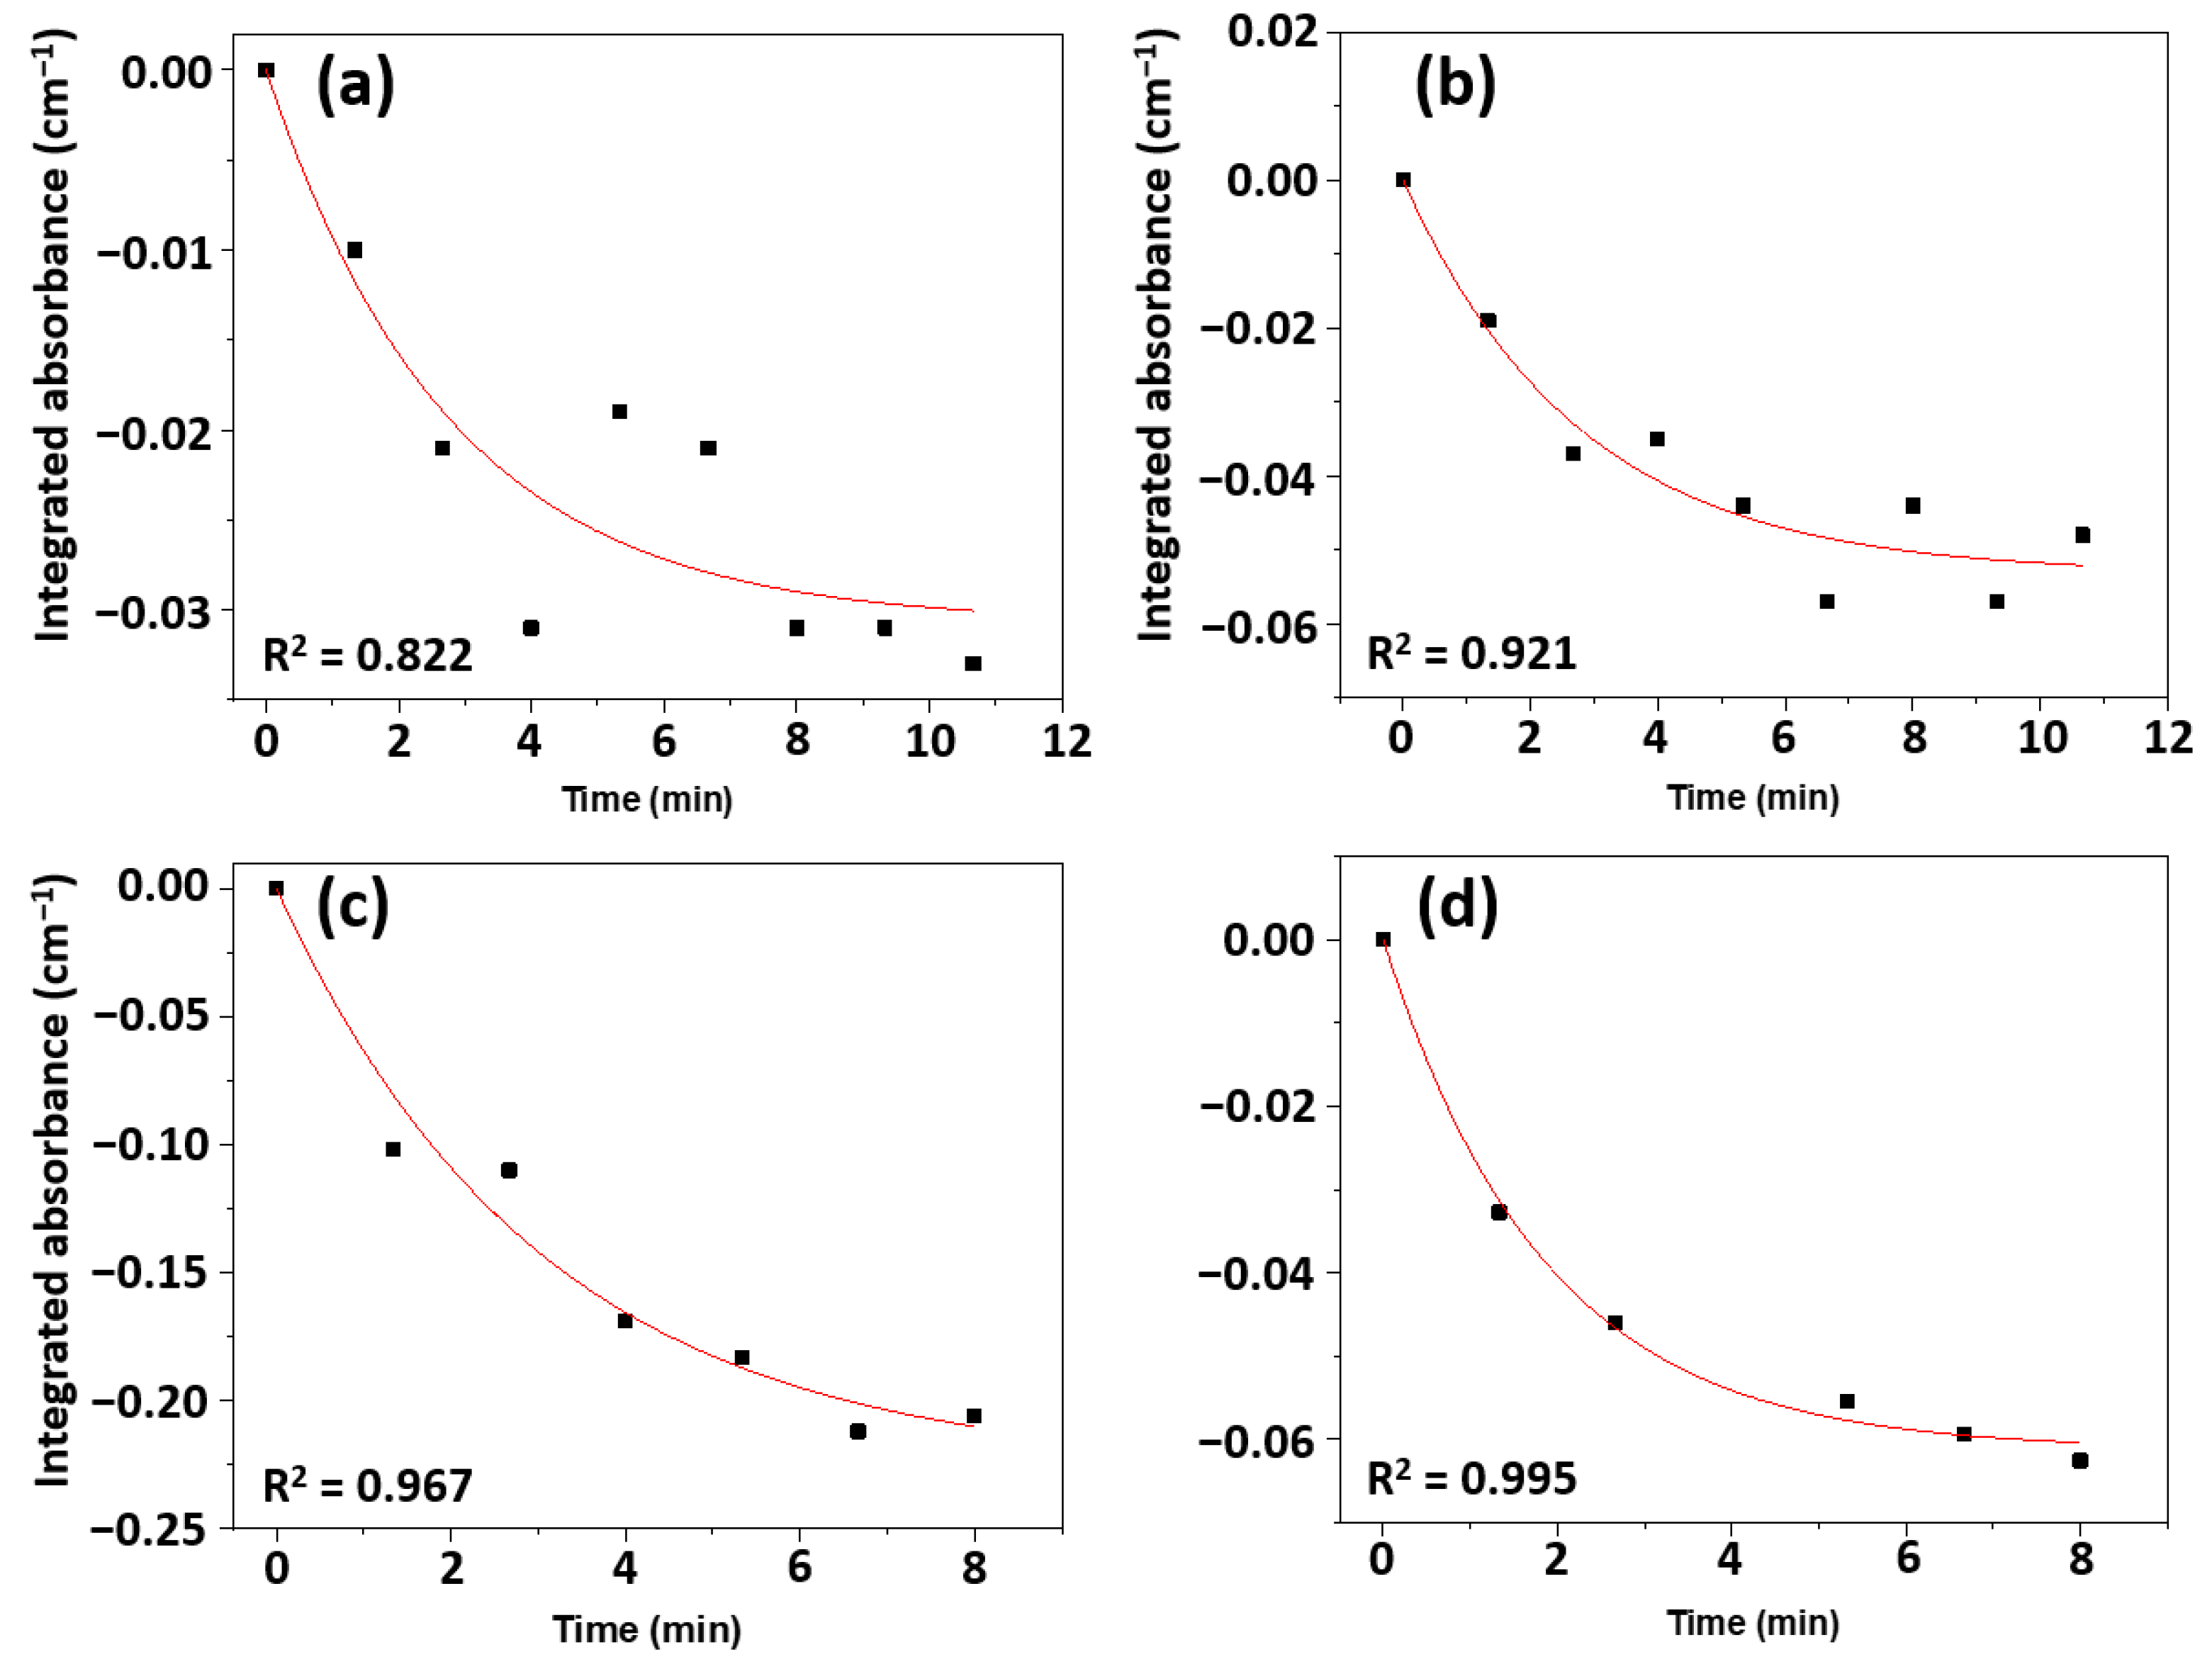
2.4. Reaction Kinetics

The reaction kinetics for the decomposition of OPs and the formation and decomposition of reaction intermediates were compared for pure TiO2 (UV100), and the surface sulfate-modified TiO2 (Ti-600) is now discussed.
The negative band at ~1445 cm−1 is due to the decomposition of the OPs and was used for the kinetic analysis of their degradation. The regions 1410 cm−1–1480 cm−1, 1410 cm−1–1480 cm−1, 1420 cm−1–1480 cm−1, and 1390 cm−1–1480 cm−1 were used for UV100_TMP, UV100_TEP, Ti-600_TMP, and Ti-600_TEP, respectively. These regions were integrated every 80 s for total of 8 min for Ti-600 and ~11 min for UV100 to quantify the initial reaction kinetics. Assuming first-order reaction kinetics, the integrated absorbance data were least-square-fitted to the function y = a(e(bt) − 1). The rate constants are shown in Table 2. All of the rate constants were normalized to the specific surface area for each sample. The results are presented in Figure 6 and Table 2. Photo-degradation is found to occur faster on Ti-600 compared with UV100, viz. 2.9 and 5 times faster, respectively, for TMP and TEP. This is presumably due the presence of a higher number of intact OPs on Ti-600 compared to UV100, as they adsorb dissociatively on the latter one and form stable bridge-bonded intermediate surface species, as depicted in Scheme 2.
During the UV illumination, the aldehyde bands in the 1780–1700 cm−1 region developed on all the samples, indicating (aldol) condensation products forming with associated carbonyl bands occurring between 1650 cm−1 and 1700 cm−1. Aldehydes (formaldehyde and acetaldehyde) are expected as degradation intermediates and were chosen in the kinetic analysis of the initial build-up of reaction intermediates. The regions 1700 cm−1–1835 cm−1, 1700 cm−1–1815 cm−1, 1700 cm−1–1850 cm−1, and 1700 cm−1–1820 cm−1 were used for UV100_TMP, UV100_TEP, Ti-600_TMP, and Ti-600_TEP, respectively. These regions were integrated every 80 s for total of 8 min for Ti-600 and ~11 min for UV100. The integrated absorbance (cm−1) was plotted against the illumination time and fitted with first-order reaction kinetics, viz. y = a(1 − e(−bx)), where a is the saturation absorbance, and b is the rate constant. The results are shown in Figure 7 and Table 2. It is apparent that aldehyde formation is favored on the sulfated titania, with rate constants about one order of magnitude larger than for UV100, which is in agreement with the observations of Murcia et al. [57].
From the spectra in Figure 6 a negative band at ~1530 cm−1 develops during UV illumination, which is due to the degradation of carboxylates. However, for UV100, the degradation appears to be coupled to the formation of a new band at ~1500 cm−1, assigned to strongly bonded bridge-bonded carboxylates/(bi)carbonates. This band is much less pronounced on Ti-600, where the carboxylic acids appear to decompose more efficiently, rather than forming new, strongly bonded intermediates. Thus, the main difference deduced from the operando DRIFT spectra is that there is a redistribution of carboxylic acid species to bridge-bonded carboxylates—in particular, formate and bicarbonates. The reason for this is that the surface sulfate species occupy surface Ti sites and hinder the formation of bridge-bonded species (see Scheme 2d). The decomposition of bridge-bonded formate is known to be slow and limits complete photo-oxidation [61]. Indeed, the degradation of carboxylates/bicarbonates at ~1530 cm−1 proceeds more efficiently on the Ti-600—about 3.1 and 5.1 times faster for TMP and TEP, respectively, compared with UV100. The results are presented in Figure 8 and Table 2.
Rate constants for the build-up of strongly bridging carboxylates and (bi)carbonates at ~1500 cm−1 were estimated and are presented in Table 2 and Figure 9. The amount of the analyzed catalyst sample is about the same in the DRIFTS cell for each catalyst sample, and the specific area normalized data can be used for intra-sample comparisons. The build-up of the ~1500 cm−1 band increases markedly on UV100 for both TMP and TEP, with rate constants of 1.77 × 10⁻⁴ cm−1 min−1 and 1.10 × 10⁻³ cm−1 min−1, respectively. For TMP on Ti-600, this band sees a rapid initial increase, explaining the higher rate constant, but reaches a plateau after about 3 min and remains stable. On the other hand, this band grows for both OPs on UV100 during the whole measured time period. In contrast, the integrated absorbance of the 1500 cm−1 band for TEP on Ti-600 remains almost constant throughout the measured period. Thus, it appears that the formation of bridging carboxylates/(bi)carbonates on Ti-600 is prevented to a high degree and instead proceeds towards full oxidation.
The percent of degraded TMP and TEP after the initial 9 min of UV illumination was calculated using the integrated absorbance (Table 3). It is seen that TMP is more efficiently degraded by both catalysts compared to TEP and that Ti-600 more efficiently degraded both OPs than UV100.

3. Materials and Methods

3.1. Photocatalysts Preparation

Anatase-TiO2 surface-functionalized with sulfate groups was synthesized according to our previously reported procedure [27]. Briefly, about 500 mg of titanyl sulfate hydrate (TiOSO4 · nH2O, Sigma-Aldrich, technical grade, ≥29% Ti as TiO2) was placed in a ceramic crucible and annealed at 600 °C for 2 h in air (9.5 °C/min heating ramp). The powder was then allowed to slowly cool down inside the furnace. This yielded sulfate-modified anatase TiO2 due to the surface segregation of sulfur from the bulk, and it is designated as “Ti-600”. Commercially available Hombikat UV100 anatase-TiO2 (Sachtleben Chemie GmbH, Duisburg, Germany, denoted as “UV100”) was used as the reference material. Trimethyl phosphate (TMP, Sigma-Aldrich, St. Louis, MO, USA, 97%) and triethyl phosphate (TEP, Sigma-Aldrich, 99%) were used as received.

3.2. Materials Characterization

Powder X-ray diffraction data were recorded using a Siemens D5000 diffractometer with CuαI,II radiation (λ = 1.5418 Å). Divergence and anti-scattering slits of 1° were used. Data were recorded for 2Theta 20° to 65° with a 0.02° step size. The average crystallite size was calculated using the Scherrer equation:
D = K λ β c   cos θ
where D is the average crystallite size, K is the shape factor (0.9 for spherical particles), βc is the full width at half maximum (FWHM) subtracted for instrumental broadening (employing the NIST 1976 Al2O3 standard), and θ is the Bragg angle in radians. The Bruker TOPAS software was employed for the Rietveld refinement.
A PANalytical X-ray fluorescence Epsilon 3XLE spectrometer was used for the elemental analysis. The standard program OmnianHeMylar under helium atmosphere was used.
For SEM imaging, a Zeiss LEO 1550 microscope with a field emission gun (operated at 5 keV) and an Oxford Aztec energy dispersive X-ray spectroscopy (EDS) system were used. The samples were mounted on carbon tapes. TEM micrographs were obtained using a field-emission transmission electron microscopy (FE-TEM, JEM-2100F, JEOL) operated at 200 kV. Reflectance and transmittance spectra were recorded on a PerkinElmer Lambda 900 UV–vis–NIR spectrophotometer. Aqueous suspensions of UV100 and Ti-600 were drop-casted on quartz glass to form thin coatings and dried under a desktop lamp.

3.3. DRIFTS

Operando diffuse reflectance infrared Fourier transform spectroscopy (DRIFTS) was employed to follow the adsorption and photodegradation of TMP and TEP. A vacuum-pumped Fourier transform infrared spectrometer (Vertex 80, Bruker Optics, Ettlingen, Germany) equipped with a custom modified HPHT reaction cell placed in a Praying Mantis DRIFTS accessory (Harrick Scientific Products, Inc., New York, NY, USA) and with a liquid nitrogen-cooled HgCdTe detector was used [62]. For the photocatalytic measurements, a 365 nm LED light source (Prizmatix Ltd., Holon, Israel) was used as the UV source, employing a photon irradiance of approximately 23 mW cm−2.
Catalyst powder was added the cylindrical sample cup in the DRIFT reaction cell. The catalyst surfaces were dried, and carbon species were removed by heating at 400 °C for 20 min under synthetic air flow (50 mL/min). TMP and TEP vapor were dosed over the catalyst surfaces by passing 50 mL/min synthetic air through a home-built gas generator [41,42], whereby OP is injected from a liquid reservoir held at a constant temperature (60 ± 0.2 °C) [62]. The calibrated concentration of the OPs in the flow is about 30 and 10 ppmv, respectively [42]. After the dosing phase, the catalyst surfaces were purged by synthetic air at 50 mL/min for ~10 min before being illuminated by UV light. The different treatments were labeled as UV100_TMP, UV100_TEP, Ti-600_TMP, and Ti-600_TEP.
The DRIFT spectra were recorded and processed using OPUS (version 7.5, Bruker Optics). The DRIFTS signal is acquired from the top sub-millimeter volume of the powder sample bed and is about the same for all samples. Rate constants were determined using integrated absorbance from baseline-corrected spectra in the Bruker Origin v.7.5 software. Exponential fitting (“BoxLucas1”, y = a(1 − e(−bx))). The % degraded OP was calculated using the formula
% D e g r a d e d   O P = C C 0 × 100 %
where C0 is the integrated absorbance at saturation coverage (last cycle of OP dosing) and C is the amount of OP degraded after 9 min of UV illumination. The integrated areas used for the calculations were: 1410 cm−1–1480 cm−1 for UV100_TMP, 1410 cm−1–1480 cm−1 for UV100_TEP, 1420 cm−1–1480 cm−1 for Ti-600_TMP, and 1390 cm−1–1480 cm−1 for Ti-600_TEP.

3.4. 2D Correlation Spectroscopy

The 2Dshige software was used for the 2D correlation spectroscopy (2D COS) analysis of the DRIFT spectra [63]. A brief explanation of how the 2D COS data are interpreted is given in the Supplementary Information. The 2D COS spectra are presented in Figures S1–S23.

4. Conclusions

In the present work, we have studied the adsorption and photodegradation of trimethyl phosphate and triethyl phosphate on sulfate-terminated anatase-TiO2 (Ti-600) and unmodified anatase-TiO2 (UV100). A pronounced dissociation of TMP and TEP was found on UV100, while on Ti-600, they were stabilized due to the interaction with surface-sulfate groups. 2D COS analysis suggests that parallel degradation pathways occur during UV illumination. On Ti-600, the organic compounds progress rapidly towards full oxidation, while on pure anatase TiO2 (UV100), redistribution to strongly bridging carboxylates and (bi)carbonates occurs. Moreover, it was found that the aldehyde intermediate build-up was considerably faster on the sulfate-modified titania; 10 times and 30 times faster for TMP and TEP, respectively, compared with pure TiO2. The decomposition rates of OPs were found to be higher on Ti-600: 2.9 and 5 times faster for TMP and TEP, respectively. Similarly, the decomposition rates of carboxylates were found to be higher on Ti-600: 3.1 times and 5.1 times faster for TMP and TEP, respectively. The higher reactivity on sulfated titania is attributed to several contributing factors: (1) the stabilization of adsorbed intermediates, (2) the blocking of Ti sites, (3) improved electron–hole separation, and (4) the proton-mediated cleavage of double bonds by the sulfate groups (facilitating a condensation reaction).

Supplementary Materials

The following supporting information can be downloaded at: https://www.mdpi.com/article/10.3390/catal13030526/s1. References [27,63,64] are cited in the Supplementary Materials.

Author Contributions

Investigation, analysis, writing—original draft preparation: F.G.S.; conceptualization, analysis, writing—review and editing, project administration, funding acquisition: L.Ö. All authors have read and agreed to the published version of the manuscript.

Funding

The authors would like to thank the EU and the Swedish Research Agency Formas for the funding, in the frame of the collaborative international consortium GreenWaterTech, financed under the ERA-NET AquaticPollutants Joint Transnational Call (GA no. 869178). This ERA-NET is an integral part of the activities developed by the Water, Oceans, and AMR Joint Programming Initiatives.

Acknowledgments

The authors gratefully acknowledge Seda Ulusoy, Uppsala University, for the Rietveld analysis and Yunju Choi at Busan Center, Korea Basic Science Institute, for the TEM measurements.

Conflicts of Interest

The authors declare no conflict of interest.

References

  1. Sidhu, G.K.; Singh, S.; Kumar, V.; Dhanjal, D.S.; Datta, S.; Singh, J. Toxicity, monitoring and biodegradation of organophosphate pesticides: A review. Crit. Rev. Environ. Sci. Technol. 2019, 49, 1135–1187. [Google Scholar] [CrossRef]
  2. Greaves, A.K.; Letcher, R.J. A Review of Organophosphate esters in the environment from biological effects to distribution and fate. Bull. Environ. Contam. Toxcol. 2017, 98, 2–7. [Google Scholar] [CrossRef] [PubMed]
  3. Carlsson, H.; Nilsson, U.; Becker, G.; Östman, C. Organophosphate ester flame retardants and plasticizers in the indoor environment: Analytical methodology and occurrence. Environ. Sci. Technol. 1997, 31, 2931–2936. [Google Scholar] [CrossRef]
  4. Mali, H.; Shah, C.D.; Raghunandan, B.H.; Prajapati, A.S.; Patel, D.H.; Trivedi, U.; Subramanian, R.B. Organophosphate pesticides an emerging environmental contaminant: Pollution, toxicity, bioremediation progress, and remaining challenges. J. Environ. Sci. 2023, 127, 234–250. [Google Scholar] [CrossRef]
  5. Salamova, A.; Ma, Y.N.; Venier, M.; Hites, R.A. High levels of organophosphate flame retardants in the Great Lakes atmosphere. Environ. Sci. Technol. Lett. 2014, 1, 8–14. [Google Scholar] [CrossRef]
  6. Gusain, R.; Gupta, K.; Joshi, P.; Khatri, O.P. Adsorptive removal and photocatalytic degradation of organic pollutants using metal oxides and their composites: A comprehensive review. Adv. Colloid Interface Sci. 2019, 272, 102009. [Google Scholar] [CrossRef] [PubMed]
  7. Sud, D.; Kaur, P. Heterogeneous Photocatalytic degradation of selected organophosphate pesticides: A review. Crit. Rev. Environ. Sci. Technol. 2012, 42, 2365–2407. [Google Scholar] [CrossRef]
  8. Paz, Y. Application of TiO2 photocatalysis for air treatment: Patents’ overview. Appl. Catal. B 2010, 99, 448–460. [Google Scholar] [CrossRef]
  9. Mäkie, P.; Persson, P.; Österlund, L. Solar light degradation of trimethyl phosphate and triethyl phosphate on dry and water-precovered hematite and goethite nanoparticles. J. Phys. Chem. C 2012, 116, 14917–14929. [Google Scholar] [CrossRef]
  10. Henych, J.; Janos, P.; Kormunda, M.; Tolasz, J.; Stengl, V. Reactive adsorption of toxic organophosphates parathion methyl and DMMP on nanostructured Ti/Ce oxides and their composites. Arab. J. Chem. 2019, 12, 4258–4269. [Google Scholar] [CrossRef] [Green Version]
  11. Chen, D.A.; Ratliff, J.S.; Hu, X.F.; Gordon, W.O.; Senanayake, S.D.; Mullins, D.R. Dimethyl methylphosphonate decomposition on fully oxidized and partially reduced ceria thin films. Surf. Sci. 2010, 604, 574–587. [Google Scholar] [CrossRef]
  12. Holdren, S.; Tsyshevsky, R.; Fears, K.; Owrutsky, J.; Wu, T.; Wang, X.Z.; Eichhorn, B.W.; Kuklja, M.M.; Zachariah, M.R. Adsorption and destruction of the g-series nerve agent simulant dimethyl methylphosphonate on zinc oxide. ACS Catal. 2019, 9, 902–911. [Google Scholar] [CrossRef]
  13. Korake, P.V.; Sridharkrishna, R.; Hankare, P.P.; Garadkar, K.M. Photocatalytic degradation of phosphamidon using Ag-doped ZnO nanorods. Toxicol. Environ. Chem. 2012, 94, 1075–1085. [Google Scholar] [CrossRef]
  14. Moss, J.A.; Szczepankiewicz, S.H.; Park, E.; Hoffmann, M.R. Adsorption and photodegradation of dimethyl methylphosphonate vapor at TiO2 surfaces. J. Phys. Chem. B 2005, 109, 19779–19785. [Google Scholar] [CrossRef] [PubMed]
  15. Rusu, C.N.; Yates, J.T. Photooxidation of dimethyl methylphosphonate on TiO2 powder. J. Phys. Chem. B 2000, 104, 12299–12305. [Google Scholar] [CrossRef]
  16. Bachinger, A.; Kickelbick, G. Photocatalytic stability of organic phosphonates and phosphates on TiO2 nanoparticles. Appl. Catal. A 2011, 409, 122–132. [Google Scholar] [CrossRef]
  17. Serpone, N.; Emeline, A.V. Semiconductor photocatalysis—Past, present, and future outlook. J. Phys. Chem. Lett. 2012, 3, 673–677. [Google Scholar] [CrossRef]
  18. Schneider, J.; Matsuoka, M.; Takeuchi, M.; Zhang, J.L.; Horiuchi, Y.; Anpo, M.; Bahnemann, D.W. Understanding TiO2 photocatalysis: Mechanisms and materials. Chem. Rev. 2014, 114, 9919–9986. [Google Scholar] [CrossRef]
  19. Low, J.X.; Yu, J.G.; Jaroniec, M.; Wageh, S.; Al-Ghamdi, A.A. Heterojunction photocatalysts. Adv. Mater. 2017, 29, 1601694. [Google Scholar] [CrossRef]
  20. Huang, Q.L.; Zhang, Q.T.; Yuan, S.S.; Zhang, Y.C.; Zhang, M. One-pot facile synthesis of branched Ag-ZnO heterojunction nanostructure as highly efficient photocatalytic catalyst. Appl. Surf. Sci. 2015, 353, 949–957. [Google Scholar] [CrossRef]
  21. Im, J.K.; Sohn, E.J.; Kim, S.; Jang, M.; Son, A.; Zoh, K.D.; Yoon, Y. Review of MXene-based nanocomposites for photocatalysis. Chemosphere 2021, 270, 129478. [Google Scholar] [CrossRef]
  22. Li, J.L.; Zhang, Q.; Zou, Y.Z.; Cao, Y.H.; Cui, W.; Dong, F.; Zhou, Y. Ti3C2 MXene modified g-C3N4 with enhanced visible-light photocatalytic performance for NO purification. J. Colloid. Interf. Sci. 2020, 575, 443–451. [Google Scholar] [CrossRef]
  23. Morris, M.R.; Pendlebury, S.R.; Hong, J.; Dunn, S.; Durrant, J.R. Effect of internal electric fields on charge carrier dynamics in a ferroelectric material for solar energy conversion. Adv. Mater. 2016, 28, 7123–7128. [Google Scholar] [CrossRef] [PubMed] [Green Version]
  24. He, F.; Jeon, W.; Choi, W. Photocatalytic air purification mimicking the self-cleaning process of the atmosphere. Nat. Commun. 2021, 12, 2528. [Google Scholar] [CrossRef]
  25. Mamaghani, A.H.; Haghighat, F.; Lee, C.S. Photocatalytic oxidation technology for indoor environment air purification: The state-of-the-art. Appl. Catal. B 2017, 203, 247–269. [Google Scholar] [CrossRef]
  26. Topalian, Z.; Stefanov, B.I.; Granqvist, C.G.; Österlund, L. Adsorption and photo-oxidation of acetaldehyde on TiO2 and sulfate-modified TiO2: Studies by in situ FTIR spectroscopy and micro-kinetic modeling. J. Catal. 2013, 307, 265–274. [Google Scholar] [CrossRef] [Green Version]
  27. Svensson, F.G.; Österlund, L. One-step synthesis of sulfate-modified titania nanoparticles with surface acidic and sustained photocatalytic properties via solid-state thermolysis of titanyl sulfate. Chemcatchem 2022, 14, e202200682. [Google Scholar] [CrossRef]
  28. Barraud, E.; Bosc, F.; Edwards, D.; Keller, N.; Keller, V. Gas phase photocatalytic removal of toluene effluents on sulfated titania. J. Catal. 2005, 235, 318–326. [Google Scholar] [CrossRef]
  29. Li, M.; Xing, Z.P.; Jiang, J.J.; Li, Z.Z.; Kuang, J.Y.; Yin, J.W.; Wan, N.; Zhu, Q.; Zhou, W. In-situ Ti3+/S doped high thermostable anatase TiO2 nanorods as efficient visible-light-driven photocatalysts. Mater. Chem. Phys. 2018, 219, 303–310. [Google Scholar] [CrossRef]
  30. Mattsson, A.; Lejon, C.; Stengl, V.; Bakardjieva, S.; Oplustil, F.; Andersson, P.O.; Österlund, L. Photodegradation of DMMP and CEES on zirconium doped titania nanoparticles. Appl. Catal. B 2009, 92, 401–410. [Google Scholar] [CrossRef]
  31. Kim, C.S.; Lad, R.J.; Tripp, C.P. Interaction of organophosphorous compounds with TiO2 and WO3 surfaces probed by vibrational spectroscopy. Sens. Actuator B 2001, 76, 442–448. [Google Scholar] [CrossRef]
  32. Stengl, V.; Henych, J.; Grygar, T.; Perez, R. Chemical degradation of trimethyl phosphate as surrogate for organo-phosporus pesticides on nanostructured metal oxides. Mater. Res. Bull. 2015, 61, 259–269. [Google Scholar] [CrossRef]
  33. Oh, Y.C.; Bao, Y.; Jenks, W.S. Isotope studies of photocatalysis TiO2-mediated degradation of dimethyl phenylphosphonate. J. Photochem. Photobiol. A 2003, 161, 69–77. [Google Scholar] [CrossRef]
  34. Mutin, P.H.; Guerrero, G.; Vioux, A. Hybrid materials from organophosphorous coupling molecules. J. Mater. Chem. 2005, 15, 3761–3768. [Google Scholar] [CrossRef]
  35. Krosley, K.W.; Collard, D.M.; Adamson, J.; Fox, M.A. Degradation of organophosphonic acids catalyzed by irradiated titanium-dioxide. J. Photochem. Photobiol. A 1993, 69, 357–360. [Google Scholar] [CrossRef]
  36. Noda, I. Determination of two-dimensional correlation spectra using the Hilbert transform. Appl. Spectrosc. 2000, 54, 994–999. [Google Scholar] [CrossRef]
  37. Noda, I. Graphical representation of two-dimensional correlation in vector space. Vib. Spectrosc. 2004, 36, 261–266. [Google Scholar] [CrossRef]
  38. Lebedev, V.A.; Kozlov, D.A.; Kolesnik, I.V.; Poluboyarinov, A.S.; Becerikli, A.E.; Grunert, W.; Garshev, A.V. The amorphous phase in titania and its influence on photocatalytic properties. Appl. Catal. B 2016, 195, 39–47. [Google Scholar] [CrossRef]
  39. Alonso-Tellez, A.; Masson, R.; Robert, D.; Keller, N.; Keller, V. Comparison of Hombikat UV100 and P25 TiO2 performance in gas-phase photocatalytic oxidation reactions. J. Photochem. Photobiol. A 2012, 250, 58–65. [Google Scholar] [CrossRef]
  40. Topalian, Z.; Niklasson, G.A.; Granqvist, C.G.; Österlund, L. Photo-fixation of SO2 in nanocrystalline TiO2 films prepared by reactive DC magnetron sputtering. Thin Solid Films 2009, 518, 1341–1344. [Google Scholar] [CrossRef]
  41. Österlund, L.; Stengl, V.; Mattsson, A.; Bakardjieva, S.; Andersson, P.O.; Oplustil, F. Effect of sample preparation and humidity on the photodegradation rate of CEES on pure and Zn doped anatase TiO2 nanoparticles prepared by homogeneous hydrolysis. Appl. Catal. B 2009, 88, 194–203. [Google Scholar] [CrossRef]
  42. Mäkie, P.; Persson, P.; Österlund, L. Adsorption of trimethyl phosphate and triethyl phosphoate on dry and water pre-covered hematite, maghemite, and goethite nanoparticles. J. Colloid Interface Sci. 2013, 392, 349–358. [Google Scholar] [CrossRef] [PubMed]
  43. Groff, R.P.; Manogue, W.H. An Infrared Study of Formate Formation and Reactivity on TiO2 Surfaces. J. Catal. 1983, 79, 462–465. [Google Scholar] [CrossRef]
  44. Kiselev, A.; Mattson, A.; Andersson, M.; Palmqvist, A.E.C.; Österlund, L. Adsorption and photocatalytic degradation of diisopropyl fluorophosphate and dimethyl methylphosphonate over dry and wet rutile TiO2. J. Photochem. Photobiol. A 2006, 184, 125–134. [Google Scholar] [CrossRef]
  45. Stefanov, B.I.; Topalian, Z.; Granqvist, C.G.; Österlund, L. Acetaldehyde adsorption and condensation on anatase TiO2: Influence of acetaldehyde dimerization. J. Mol. Catal. A 2014, 381, 77–88. [Google Scholar] [CrossRef] [Green Version]
  46. Busca, G.; Lamotte, J.; Lavalley, J.C.; Lorenzelli, V. Ft-Ir study of the adsorption and transformation of formaldehyde on oxide surfaces. J. Am. Chem. Soc. 1987, 109, 5197–5202. [Google Scholar] [CrossRef]
  47. Seki, T.; Onaka, M. Sulfated mesoporous alumina: A highly effective solid strong base catalyst for the Tishchenko reaction in supercritical carbon dioxide. J. Phys. Chem. B 2006, 110, 1240–1248. [Google Scholar] [CrossRef]
  48. Topalian, Z.; Niklasson, G.A.; Granqvist, C.G.; Österlund, L. Spectroscopic study of the photofixation of so2 on anatase TiO2 thin films and their oleophobic properties. ACS Appl. Mater. Interfaces 2012, 4, 672–679. [Google Scholar] [CrossRef]
  49. Lin, X.H.; Yin, X.J.; Liu, J.Y.; Li, S.F.Y. Elucidation of structures of surface sulfate species on sulfated titania and mechanism of improved activity. Appl. Catal. B 2017, 203, 731–739. [Google Scholar] [CrossRef]
  50. Langhammer, D.; Kullgren, J.; Österlund, L. Photoinduced adsorption and oxidation of SO2 on anatase TiO2(101). J. Am. Chem. Soc. 2020, 142, 21767–21774. [Google Scholar] [CrossRef]
  51. Daash, L.W.; Smith, D.C. Infrared spectra of phosphorous compounds. Anal. Chem. 1951, 23, 853–868. [Google Scholar] [CrossRef]
  52. Li, Y.X.; Schlup, J.R.; Klabunde, K.J. Fourier transform infrared photoacoustic spectroscopy study of the adsorption of organophosphorus compounds on heat-treated magnesium oxide. Langmuir 1991, 7, 1394–1399. [Google Scholar] [CrossRef]
  53. Zehr, R.T.; Henderson, M.A. Acetaldehyde photochemistry on TiO2(110). Surf. Sci. 2008, 602, 2238–2249. [Google Scholar] [CrossRef]
  54. Harrison, G.; Katsiev, K.; Alsalik, Y.; Thornton, G.; Idriss, H. Switch in photocatalytic reaction selectivity: The effect of oxygen partial pressure on carbon-carbon bond dissociation over hydroxylated TiO2(110) surfaces. J. Catal. 2018, 363, 117–127. [Google Scholar] [CrossRef]
  55. Wijaya, K.; Putri, A.R.; Sudiono, S.; Mulijani, S.; Patah, A.; Wibowo, A.C.; Saputri, W.D. Effectively synthesizing SO4/TiO2 catalyst and its performance for converting ethanol into diethyl ether (DEE). Catalysts 2021, 11, 1492. [Google Scholar] [CrossRef]
  56. Yu, Z.Q.; Chuang, S.S.C. In situ IR study of adsorbed species and photogenerated electrons during photocatalytic oxidation of ethanol on TiO2. J. Catal. 2007, 246, 118–126. [Google Scholar] [CrossRef]
  57. Murcia, J.J.; Hidalgo, M.C.; Navio, J.A.; Arana, J.; Dona-Rodriguez, J.M. In situ FT-IR study of the adsorption and photocatalytic oxidation of ethanol over sulfated and metallized TiO2. Appl. Catal. B 2013, 142, 205–213. [Google Scholar] [CrossRef]
  58. Idriss, H.; Barteau, M.A. Selectivity and mechanism shifts in the reactions of acetaldehyde on oxidized and reduced TiO2(001) surfaces. Catal. Lett. 1996, 40, 147–153. [Google Scholar] [CrossRef]
  59. Singh, M.; Zhou, N.; Paul, D.K.; Klabunde, K.J. IR spectral evidence of aldol condensation: Acetaldehyde adsorption over TiO2 surface. J. Catal. 2008, 260, 371–379. [Google Scholar] [CrossRef]
  60. Niu, Y.X.; Xing, M.Y.; Tian, B.Z.; Zhang, J.L. Improving the visible light photocatalytic activity of nano-sized titanium dioxide via the synergistic effects between sulfur doping and sulfation. Appl. Catal. B 2012, 115, 253–260. [Google Scholar] [CrossRef]
  61. van der Meulen, T.; Mattson, A.; Österlund, L. A comparative study of the photocatalytic oxidation of propane on anatase, rutile, and mixed-phase anatase-rutile TiO2 nanoparticles: Role of surface intermediates. J. Catal. 2007, 251, 131–144. [Google Scholar] [CrossRef]
  62. Mattsson, A.; Leideborg, M.; Larsson, K.; Westin, G.; Österlund, L. Adsorption and solar light decomposition of acetone on anatase TiO2 and niobium doped TiO2 thin films. J. Phys. Chem. B 2006, 110, 1210–1220. [Google Scholar] [CrossRef] [PubMed]
  63. Morita, S. 2Dshige; Kwansei-Gakuin University: Nishinomiya, Japan, 2004–2005. [Google Scholar]
  64. Yu, Y.; Ozaki, Y.; Noda, I.; Jung, Y. Molecular and Laser Spectroscopy: Advances and Applications; Gupta, V.G., Ed.; Elsevier: Amsterdam, The Netherlands, 2018; Volume 10. [Google Scholar]
Figure 1. Powder X-ray diffraction patterns of (a) Ti-600 and (b) UV100. The patterns are indexed according to JCPDS Card no. 00-021-1272 for anatase TiO2.
Catalysts 13 00526 g001
Figure 2. SEM micrograph of Ti-600 showing the rod-like structure of the TiO2 aggregates. Inset: high-resolution TEM micrograph of Ti-600, displaying highly crystalline nanoparticles.
Catalysts 13 00526 g002
Figure 3. Tauc plots for the estimation of optical bandgaps of (a) Ti-600 and (b) UV100.
Catalysts 13 00526 g003
Figure 4. DRIFT spectra for the adsorption of TMP on UV100 (a) and Ti-600 (b), TEP on UV100 (c) and Ti-600 (d) at different time intervals. Positions and assignments for major absorption bands are indicated.
Catalysts 13 00526 g004
Scheme 1. (ad) Coordination of TMP to a Ti center, with the subsequent cleavage of an OCH3 group and the formation of a surface methoxide.
Catalysts 13 00526 sch001
Figure 5. DRIFT spectra for UV illumination of TMP on (a) UV100 and (b) Ti-600 and of TEP on (c) UV100 and (d) Ti-600 at different time intervals. Positions and assignments for major absorption bands are indicated.
Catalysts 13 00526 g005
Scheme 2. Proposed photo-degradation pathways, exemplified by methoxide. (a) Surface-bonded methoxide reacts with an adsorbed O2 molecule and forms a bidentate formate and water. (b) Surface-coordinated methoxide reacts with an O2 molecule and forms a formaldehyde intermediate before oxidizing further to formate. (c) Decomposition of formate to carbonate. (d) Formic acid (formed from the oxidation of methoxide) coordinated in a monodentate adsorption configuration, which is stabilized by hydrogen bonding to sulfate groups, preferentially forms as the number of titanium sites are decreased due to sulfates occupying Ti surface sites. This prevents the formation of strongly bonded bidentate and bridging intermediates on sulfated titania.
Catalysts 13 00526 sch002
Scheme 3. Proposed stabilization and degradation mechanism of OP adsorbed on Ti-600. TMP adsorbs via hydrogen bonding to a surface-bonded sulfate group and is thereby stabilized and does not undergo dissociative adsorption. When TiO2 is illuminated with UV radiation, an electron–hole pair is formed, and the sulfate group acts as an electron trap, extending the life-time of the hole, which promotes the formation of reactive oxygen species (ROS), e.g., OH. The hydroxyl radical attacks the methoxide bond of the sulfate-associated TMP. Subsequent reactions with ROS degrade the methoxide group to CO2 and H2O, with little or no formation of surface-coordinated intermediates. Analogous reactions occur for TEP. The figure is in qualitative accordance with the mechanism proposed in Ref. [60].
Catalysts 13 00526 sch003
Figure 6. Integrated absorbance for the degradation of OPs during UV illumination for (a) UV100_TMP (1410 cm−1–1480 cm−1), (b) UV100_TEP (1410 cm−1–1480 cm−1), (c) Ti-600_TMP (1420 cm−1–1480 cm−1), and (d) Ti-600_TEP (1390 cm−1–1480 cm−1). Data points were taken every 80 s for a total of 8 min for Ti-600 and ~11 min for UV100. The red lines are first-order fitting y = a(e(bt) − 1), where b is the rate constant.
Catalysts 13 00526 g006
Figure 7. Integrated absorbance (black squares) for the build-up of aldehydes during UV illumination for (a) UV100_TMP (1700 cm−1–1835 cm−1), (b) UV100_TEP (1700 cm−1–1815 cm−1), (c) Ti-600_TMP (1700 cm−1–1850 cm−1), and (d) Ti-600_TEP (1700 cm−1–1820 cm−1). Data points were taken every 80 s for a total of 8 min for Ti-600 and ~ 11 min for UV100. The red lines are first-order fittings for y = a(1 − e(−bx)), where b is the rate constant.
Catalysts 13 00526 g007
Figure 8. Integrated absorbance for the degradation of carboxylates during UV illumination for (a) UV100_TMP (1545 cm−1–1515 cm−1), (b) UV100_TEP (1545 cm−1–1515 cm−1), (c) Ti-600_TMP (1505 cm−1–1550 cm−1), and (d) Ti-600_TEP (1500 cm−1–1580 cm−1). Data points were taken every 80 s for a total of 8 min for Ti-600 and ~11 min for UV100. The red lines are first-order fitting for y = a(e(bt) − 1), where b is the rate constant.
Catalysts 13 00526 g008
Figure 9. Integrated absorbance (black squares) for the build-up of chelating carboxylates/(bi)carbonates during UV illumination for (a) UV100_TMP (1520 cm−1–1475 cm−1), (b) UV100_TEP (1515 cm−1–1450 cm−1), and (c) Ti-600_TMP (1505 cm−1–1485 cm−1). Data points were taken every 80 s for a total of 8 min for Ti-600 and ~11 min for UV100. The red lines are first-order fittings for y = a(1 − e(−bx)), where b is the rate constant.
Catalysts 13 00526 g009
Table 1. Adsorption rates of TMP and TEP on sulfated TiO2 and pure TiO2. Rate constants for OP adsorption were calculated from the integrated absorbance for UV100_TMP (1530–1450 cm−1), UV100_TEP (1530–1450 cm−1), Ti-600_TMP (1520–1450 cm−1), and Ti-600_TEP (1525–1450 cm−1). Rate constants were calculated from first-order reaction kinetics, y = a(1 − e(−bx)), where b is the rate constant. R2 represent the quality of the fit. The adsorption rates are normalized to specify the measured surface area of the samples.
SampleRate Constant (×10−3) [min−1 cm−2 g]R2
UV100_TMP0.377 0.953
UV100_TEP0.608 0.926
Ti-600_TMP5.26 0.964
Ti-600_TEP5.05 0.997
Table 2. Rate constants (in units of min−1 cm−2 g) for aldehyde build-up (~1720/1740 cm−1), OP decomposition (~1445 cm−1 band), carboxylate/(bi)carbonate formation (~1500 cm−1 band), and carboxylate decomposition (~1530 cm−1 band) for UV100 and Ti-600 during UV illumination, normalized by the specific surface area for each sample.
Rate Constant (×10−3) [min−1 cm−2 g]Aldehyde
Build-Up
OP
Decomposition
Carboxylate/(bi)Carbonate Build-UpCarboxylate
Decomposition
UV100_TMP1.211.440.181.10
UV100_TEP0.440.571.101.10
Ti-600_TMP12.94.1015.93.42
Ti-600_TEP13.32.86n/a *5.61
* The integrated intensity for carboxylate/(bi)carbonate formation for Ti-600_TEP was low and remained almost constant for all time points.
Table 3. Degradation of OPs after 9 min of UV illumination.
TMPTEP
Ti-60037.0%33.0%
UV10032.3%23.6%
Disclaimer/Publisher’s Note: The statements, opinions and data contained in all publications are solely those of the individual author(s) and contributor(s) and not of MDPI and/or the editor(s). MDPI and/or the editor(s) disclaim responsibility for any injury to people or property resulting from any ideas, methods, instructions or products referred to in the content.

