Article

The Preparation of Photocatalytic Porous Magnesium Oxychloride Cement-Based Materials and Its De-NOx Performance

1
State Key Laboratory of Silicate Materials for Architectures, Wuhan University of Technology, Wuhan 430070, China
2
School of Materials Science and Engineering, Wuhan University of Technology, Wuhan 430070, China
3
Technical Supervision and Research Center of the Building Materials Industry, Beijing 100024, China
4
Institute of Technical Information for Building Materials Industry, Beijing 100024, China
*
Author to whom correspondence should be addressed.
Catalysts 2023, 13(2), 326; https://doi.org/10.3390/catal13020326
Submission received: 13 December 2022 / Revised: 23 January 2023 / Accepted: 30 January 2023 / Published: 1 February 2023

Abstract

:
Porous magnesium oxychloride cement (PMOC) has a high specific surface area formed by interlocking whiskers, which can be used as a promising photocatalyst substrate for the photocatalytic removal of atmospheric pollutants. In this paper, magnesium oxychloride cement (MOC) was used as matrix and TiO2 as catalyst to prepare MOC blocks. Plant-based protein was used as a foaming agent to form the layered porous structure suitable for supporting TiO2 particles, which effectively increased the surface area of light radiation and TiO2 adhesion area in photocatalytic porous magnesium oxychloride cement (PPMOC). It was found that the addition of the foaming agent can increase the adsorption capacity of MOC to TiO2. The vacuum-immersion loading method can effectively support TiO2 on the surface of PMOC. The photocatalytic performance of PPMOC can be improved by multiple loading, while higher porosity of PMOC would reduce the loading surface of matrix to TiO2 particles, which might decrease the photocatalytic efficiency. As can be observed in PPMOC specimens, when the porosity of PPMOC is less than 60%, increasing the porosity can improve the photocatalytic efficiency, while when the porosity is higher than 60%, increasing the porosity decreased the photocatalytic efficiency due to the reduction of the loading surface. The excellent nitrate selectivity of PPMOC also shows good application potential in the field of catalytic degradation of nitrogen oxides.

1. Introduction

Photocatalytic cement-based materials have attracted a lot of attention in recent years [1,2]. This type of material combined with the scale application feature of building materials and the purification function of photocatalysts (e.g., TiO2 photocatalyst) provide us a chance to eliminate the harmful gases in our living environment, including indoor and outdoor harmful gas, such as NOx, HCHO, and so on. Due to these advantages, many new materials, technologies, and methods are developed to promote the application of photocatalysts and photocatalytic cement-based materials and have obtained good results for research and application [3,4].
As a building material, magnesium oxychloride cement (MOC) has the advantages of high mechanical strength, fast setting, strong abrasive resistance, excellent fire resistance, and superb bonding power [5,6,7,8]. However, when magnesium oxychloride cement is in contact with water for a long time the mechanical properties are significantly reduced, which makes it difficult to expand its application in structural materials [9,10,11,12,13]. For the photocatalyst application potential, magnesium oxychloride cement has its own advantages. Magnesium oxychloride cement was used to replace wood and was widely used in decorative materials (imitation ivory, door handles, and stone carvings), floors, walls, grinding wheels, and even tombs. The hydrated product of MOC, the basic magnesium chloride whisker, is cross-linked to form a porous network structure that gives it a high specific surface area, which makes it suitable for use as a photocatalyst carrier for interior decoration materials. In the previous works, the basic magnesium chloride whisker loaded TiO2 photocatalyst illustrated a great photocatalytic performance with a 62% degradation ratio of gaseous toluene and the reaction rate of 25.3 × 10⁻⁷ mol/m2 min [14]. The cheapness and stability of the photocatalytic cycles make it a photocatalytic material for air purification in the building decorative field. Furthermore, for the thermal stability of this type of material, due to the limitations of cement-based matrices, the highest using temperature is probably less than 100 °C but still enough for the common use in the buildings.
On the other hand, increasing the surface area of photocatalytic cement-based materials by a foaming agent is a common modification method to improve the loading capacity of photocatalytic supporting materials, which is better to enhance the photocatalytic efficiency. After MOC foaming, the specific surface area is greatly increased due to the formation of a multi-layer pore structure. Foamed MOC becomes an excellent architectural decoration material. Additionally, foamed MOC presents good mechanical properties and the compressive strength of foamed MOC is higher than that of foamed ordinary Portland cement with a similar porosity. As reported by our previous work, the compressive strength can achieve up to ~5 MPa with about 75% porosity, meanwhile, the increase of pores is also conducive to TiO2 adhesion [15,16,17]. With its extremely high specific surface area and the special pore structure formed by the interlacing of whiskers, porous magnesium oxychloride cement (PMOC) provides an excellent condition for the loading of TiO2 or other photocatalysts and enhances their photocatalytic reaction process. Based on the above, in this work, the effects of PMOC with different porosity and TiO2 photocatalysts loading times on the NOx degradation performance were studied. The properties and photocatalytic performance of prepared samples were investigated by using X-ray diffraction (XRD), scanning electron microscope (SEM), stereo microscope, and NOx photocatalytic performance test. The nitrate selectivity and photon efficiency of NO, NOx, and NO2 was calculated and analyzed to evaluate its photocatalytic performance. We hope the research can provide a new method for the promotion of photocatalytic material applications.

2. Result and Discussion

2.1. Physicochemical Properties

Figure 1 shows the macroscopic structure of PPMOC taken by SEM. After loading, it can be seen that TiO2 photocatalyst particles attached on its surface. However, the smooth surface is difficult to attach a large amount of TiO2; Figure 1b shows the pore structures of PPMOC3 after loading. The pore structure has been filled with TiO2 particles, and the framework structure composed of short rods has been completely wrapped by TiO2 adhesion forming a dense layer of TiO2 particle clusters on the surface. The macroscopic stomatal structure can also be clearly observed and shows that TiO2 spreads over the entire pore structure. From Figure 1c, it can be found that more TiO2 particles have been loaded on the framework structure compared to that of Figure 1b. This indicates that decreasing the density of PMOC is beneficial to the loading of TiO2, while large amount of TiO2 particles can cause agglomerations and form the large clusters. According to our previous reports [15,16], the prepared matrix composition is mainly 5Mg(OH)2·MgCl2·8H2O (phase 5) and contains a certain amount of Mg(OH)2; the results also indicate the loaded TiO2(P25) is mainly composed of anatase TiO2 and is successfully loaded on the PMOC matrix.
The surface changes of the substance before and after TiO2 loading observed by the stereo microscope are shown in Figure 2. The surface of PPMOC1 in Figure 2a is relatively smooth without uniform pore-like structures. There is a small amount of white powder on the surface, which indicates a small number of TiO2 particles on the surface after loading. While an obvious TiO2 loading layer can be seen in PPMOC3 (Figure 2b), some of the smaller pores within the bigger pores also can be observed. On the surface of PPMOC5 (Figure 2c), there is a large amount of TiO2 in the pores. Some smaller pores within the larger pores are also covered with TiO2 particles. This suggests that the porous structure provides more attachment points for TiO2 particles, but too many TiO2 particles also could result in the decrease of light and gas transmission and diffusion. Accordingly, this process probably is useful to enhance the photocatalytic efficiency of materials. By forming the stack and interlaced network pores between TiO2 particles and MOC hydrates (phase 5, 5Mg(OH)2·MgCl2·8H2O), the loading of TiO2 particles is expected to increase the mesoporous structures and absorption volume of the matrix, which is helpful to the diffusion of light and gas and are quite vital to the photocatalytic reaction of system.

2.2. Photocatalytic Performance

2.2.1. Photocatalytic Performance of PPMOC and TiO2

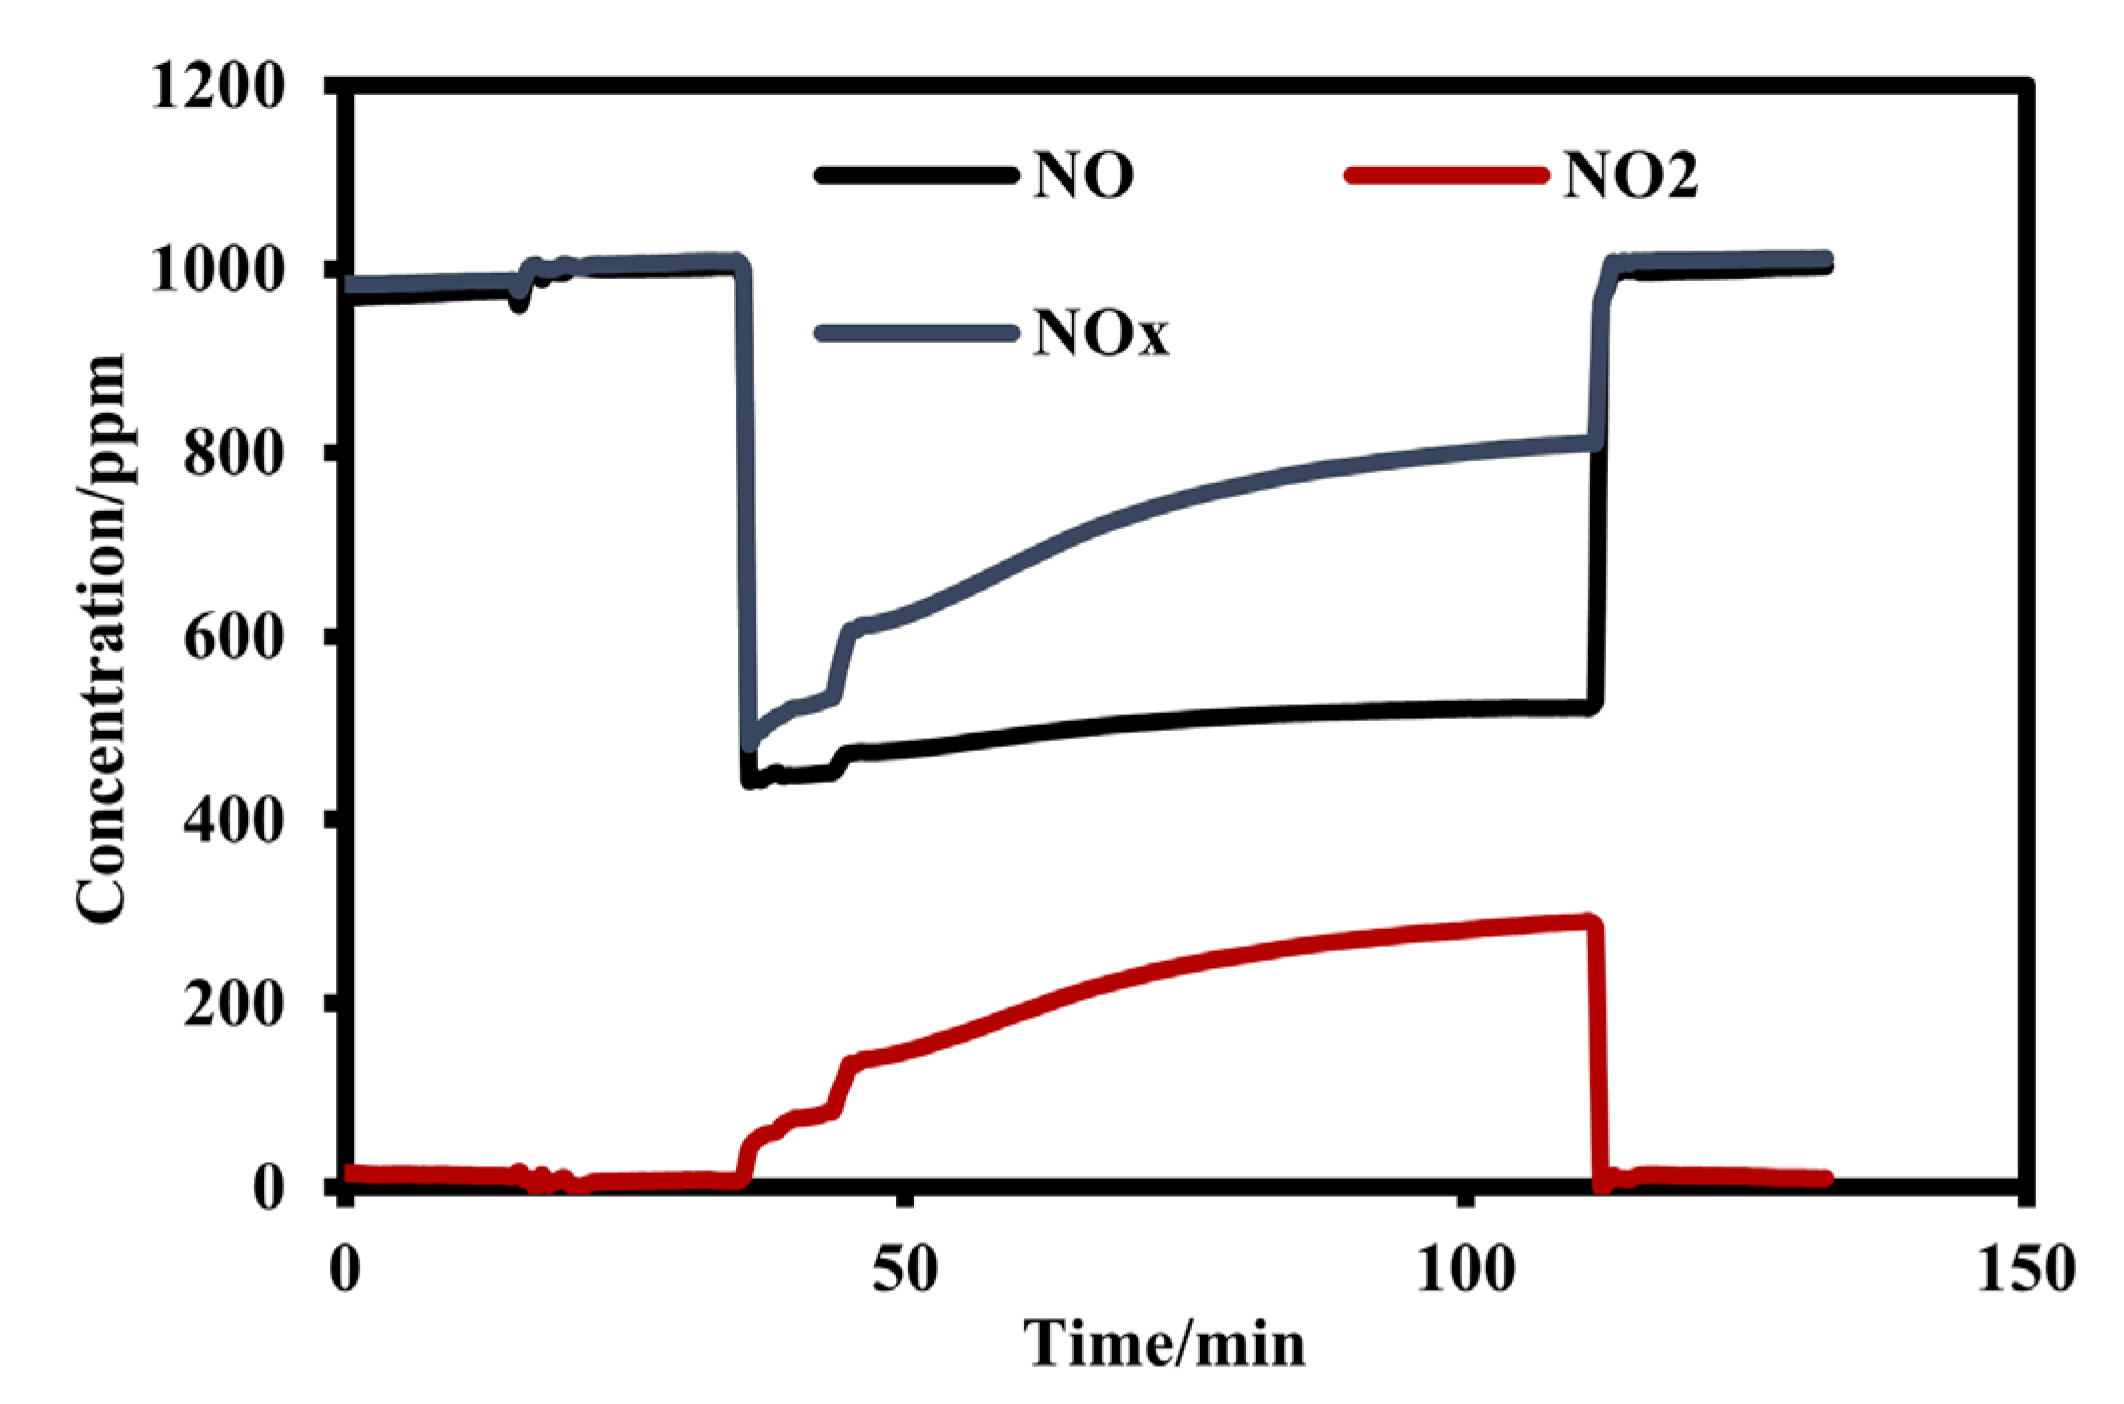
The curve of Figure 3 presents the concentration differences of NO, NO2, and NOx in the process of photocatalytic reaction of the sample. Generally, the NOx photocatalytic degradation and the evaluation of photocatalytic efficiency have three steps [18,19,20]: (1) before photocatalysis (dark reaction step), the sample should keep in the dark condition to let the gas concentration become stable; (2) photocatalytic reaction step, after the gas concentration becomes stable, start to irradiate the samples and the photocatalytic reaction happens; the NO and NOx concentration decreases and NO2 concentration increases due to the generation of NO2, while all of these concentrations would gradually get to the stable state; this process should remain for approximately 2 to 3 h; (3) after photocatalysis (re-dark reaction step), in this step, the light should be turned off, and the concentrations of NO, NO2, and NOx would go back to the initial state, similar to the first step. As an illustration, it can be seen from Figure 3 that the concentrations of NO, NO2, and NOx keep the stable level in the initial dark reaction, while NO and NOx concentrations decreased rapidly and NO2 gradually generation after being irradiated by the light means the photocatalytic reaction happened. It also can be seen that the NO, NO2, and NOx concentration gradually become relatively stable after 1 to 2 h of the photocatalytic reaction, indicating the photocatalytic reaction becomes stable. The degradation of NO and NOx and the generation of NO2 is obtained. After the light is turned off, the NO, NO2, and NOx concentrations return to the initial states to carry out the re-dark reaction. To obtain the stable data, the experiment was carried out by using a continuous photocatalytic reaction test method; each sample was repeated three times for at least 3 h. By using this method, the repeatability of photocatalytic ability can be further investigated.
According to the curve in Figure 3, the photonic efficiency and nitrate selectivity of photocatalytic samples to NOx degradation can be calculated as shown in Figure 4. It can be clearly seen that PPMOC has stronger photocatalytic power than that of pure P25 because PPMOC has a multilayer pore structure, which can provide a lot of loading points for TiO2 particles. The PPMOC3 has lower NO2 generation efficiency and higher photon degradation efficiency of NO and NOx, which means it has higher nitrate selectivity. The multilayer pore structure of PPMOC also can improve the specific surface area, light utilization ratio, and gas diffusion rate, which improves the photocatalytic efficiency.

2.2.2. Effect of Porosity and Loading Concentration on Photocatalytic Efficiency

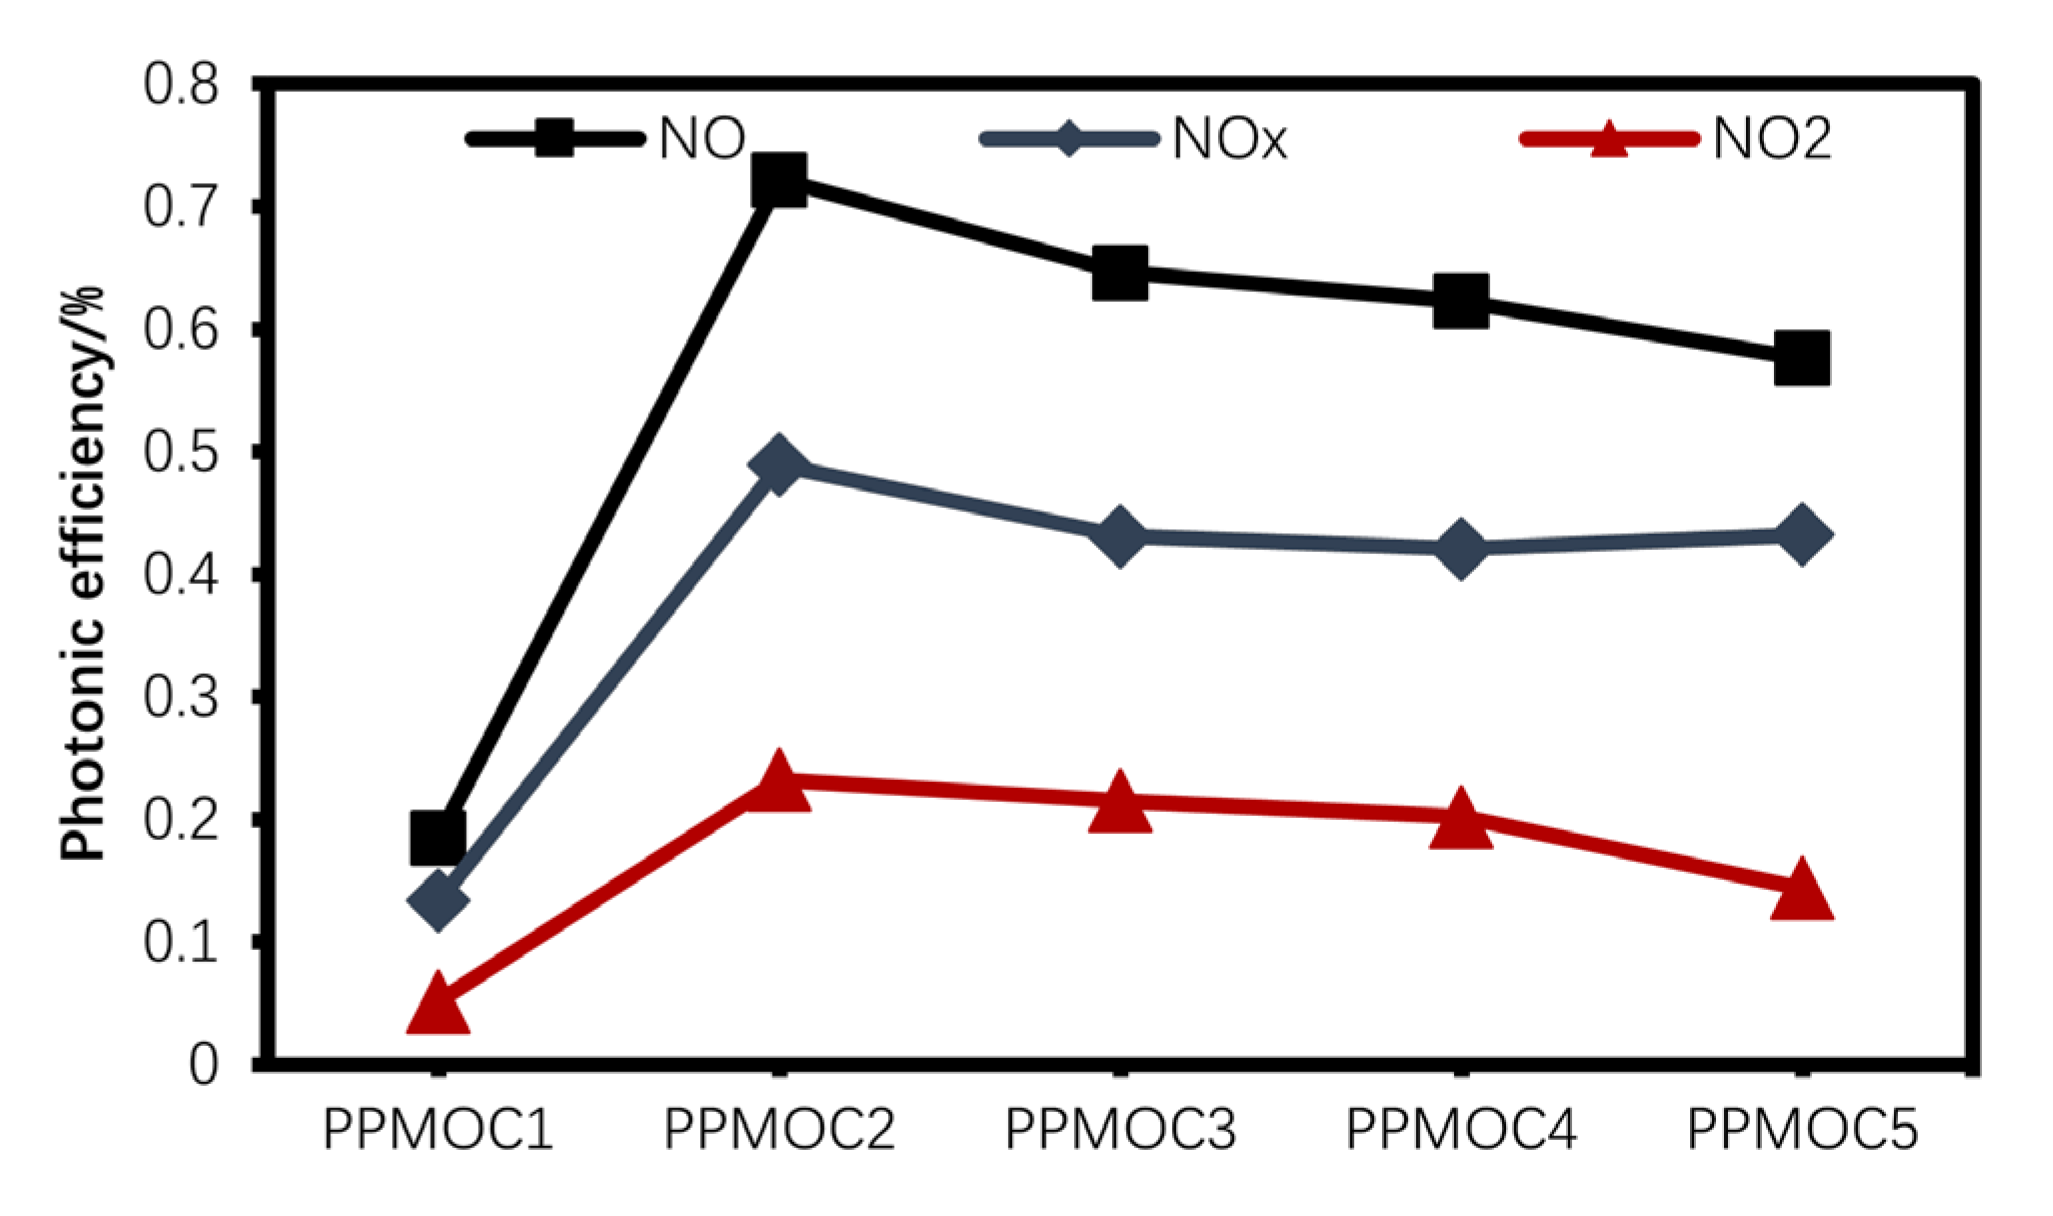
Figure 5 and Figure 6 show the photocatalytic removal efficiency of different porosity samples under loading once and loading twice in TiO2 solution. It is found that the NO and NOx conversion rate increases with increasing sample porosity but decreases in excessive high porosity. As can be calculated, the porosity increases from ca. 5% to ca.54% resulting in the NO photonic efficiency increase from 0.185% to 0.722%, while it decreases to 0.576% as porosity increases to ca. 66%. These results indicate that the adsorption capacity of TiO2 on the surface of the MOC matrix is gradually increasing with the increase in porosity. However, as the porosity continues to increase, the NO and NOx conversion efficiency decreases gradually. The photon efficiency of NO2 also decreased slightly when PPMOC2 reached its peak, from 0.232% to 0.144%. The maximum photon efficiency of NO2 is reached in PPMOC4 samples (0.263%). This is resultant from the fewer sites on the surface of MOC that can be used to adhere for TiO2 in the early stages. As the porosity increases, the increase in the number of perforated structures and the short rod-like structure provide more attachment points for TiO2 particles. Thus, improving the utilization rate of light energy and increasing the amount of catalyst leads to an increase in the photocatalytic efficiency. Nevertheless, the high porosity combined with the low TiO2 loading concentration would result in the reduction of photocatalytic efficiency because of the low loading surface and TiO2 loading amounts.
Figure 6 shows the NOx photonic efficiency for the PPMOC after loading twice. After loading twice, the NO and NOx photonic efficiency increases comprehensively compared to loading once. The highest photon efficiency of NO and NOx were found in the PPMOC3 sample, which was 1.00% and 0.717%, respectively. It is explained that the surface loading of PMOC matrix has not reached saturation after loading once and the pore structure is not fully filled. In this case, the twice loading can provide a large amount of TiO2 particles to the substrate at low porosity, thereby increasing the photonic efficiency. At the same time, the maximum conversion efficiency of the twice loading samples are higher than that of the maximum efficiency of the once loading samples. Therefore, it is concluded that higher porosity can adsorb more TiO2 and NOx molecules, and thus can improve the photocatalytic efficiency. However, excessive high porosity will result in a decrease in the effective surface area, which is harmful to photocatalytic efficiency. It is worth noting that the generation efficiency of NO2 is quite similar after the twice loading of TiO2 on PMOC. Generally, the NO2 generation efficiency is highly related to the NO degradation efficiency and nitrate selectivity of materials. In this case, the lower NO degradation efficiency would result in the relative NO2 generation efficiency, as shown in PPMOC1 in Figure 5, while, in Figure 6, it can be observed that the NO degradation efficiency is much higher in comparison to that of the first loading samples meaning the similar NO2 generation efficiency is caused by other reasons. In this experiment, the PMOC matrix was used as the substrate of TiO2 particles. Due to the alkaline environment, the hydrates of this matrix (phase 5 and Mg(OH)2) probably have high reactivity with NO2 and NO3, which could promote the photocatalytic reaction process of NO to NO2 and NO2 to NO3, thus balancing the generation efficiency of NO2, which is actually good for the nitrate selectivity.

2.2.3. Effect of Porosity on Nitrate Selectivity

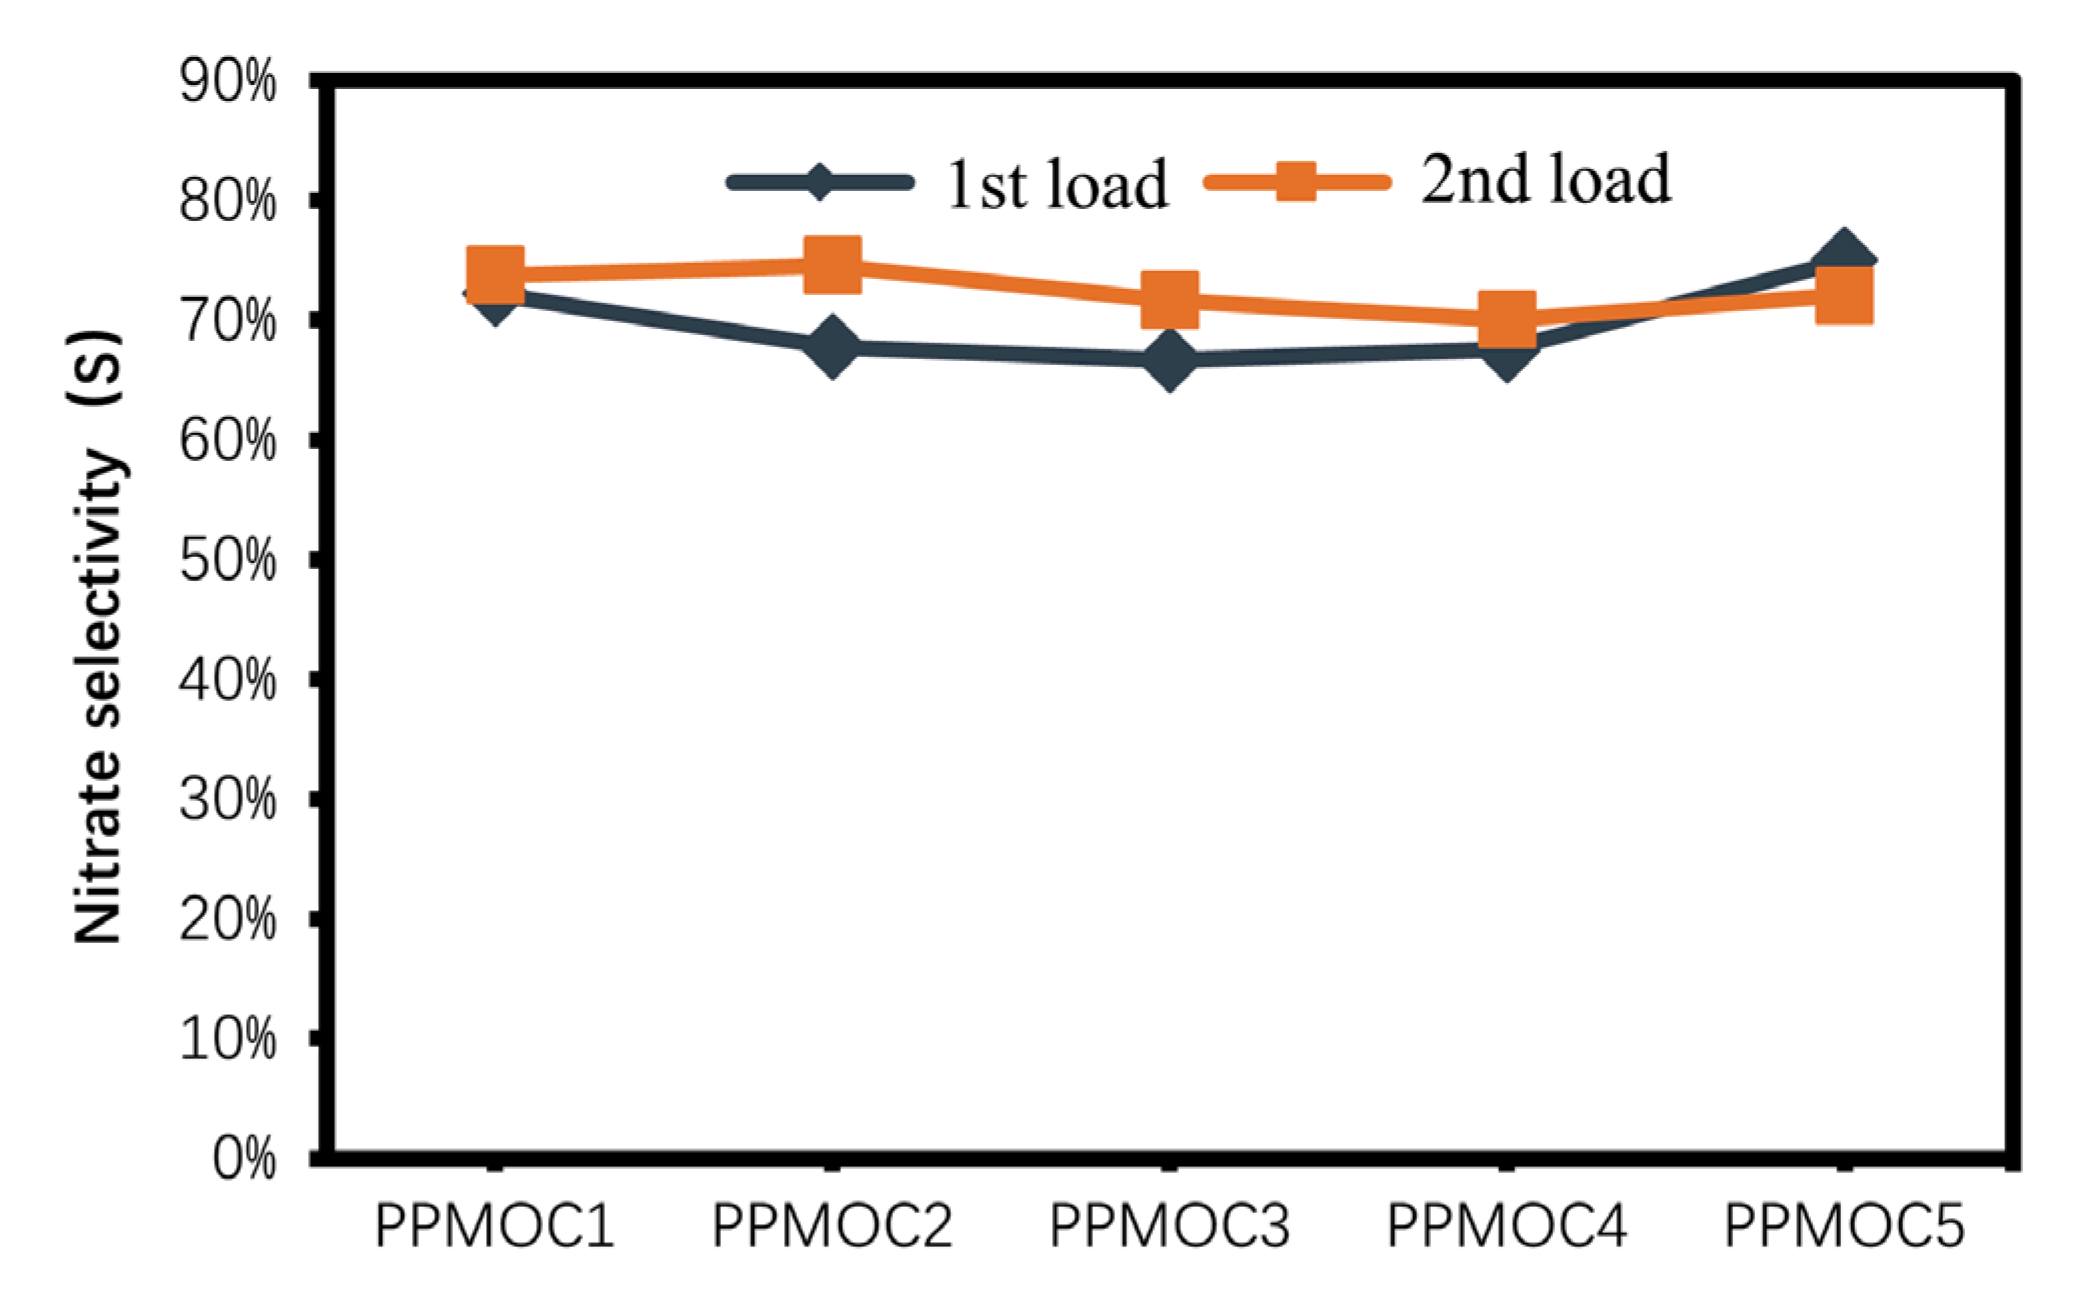
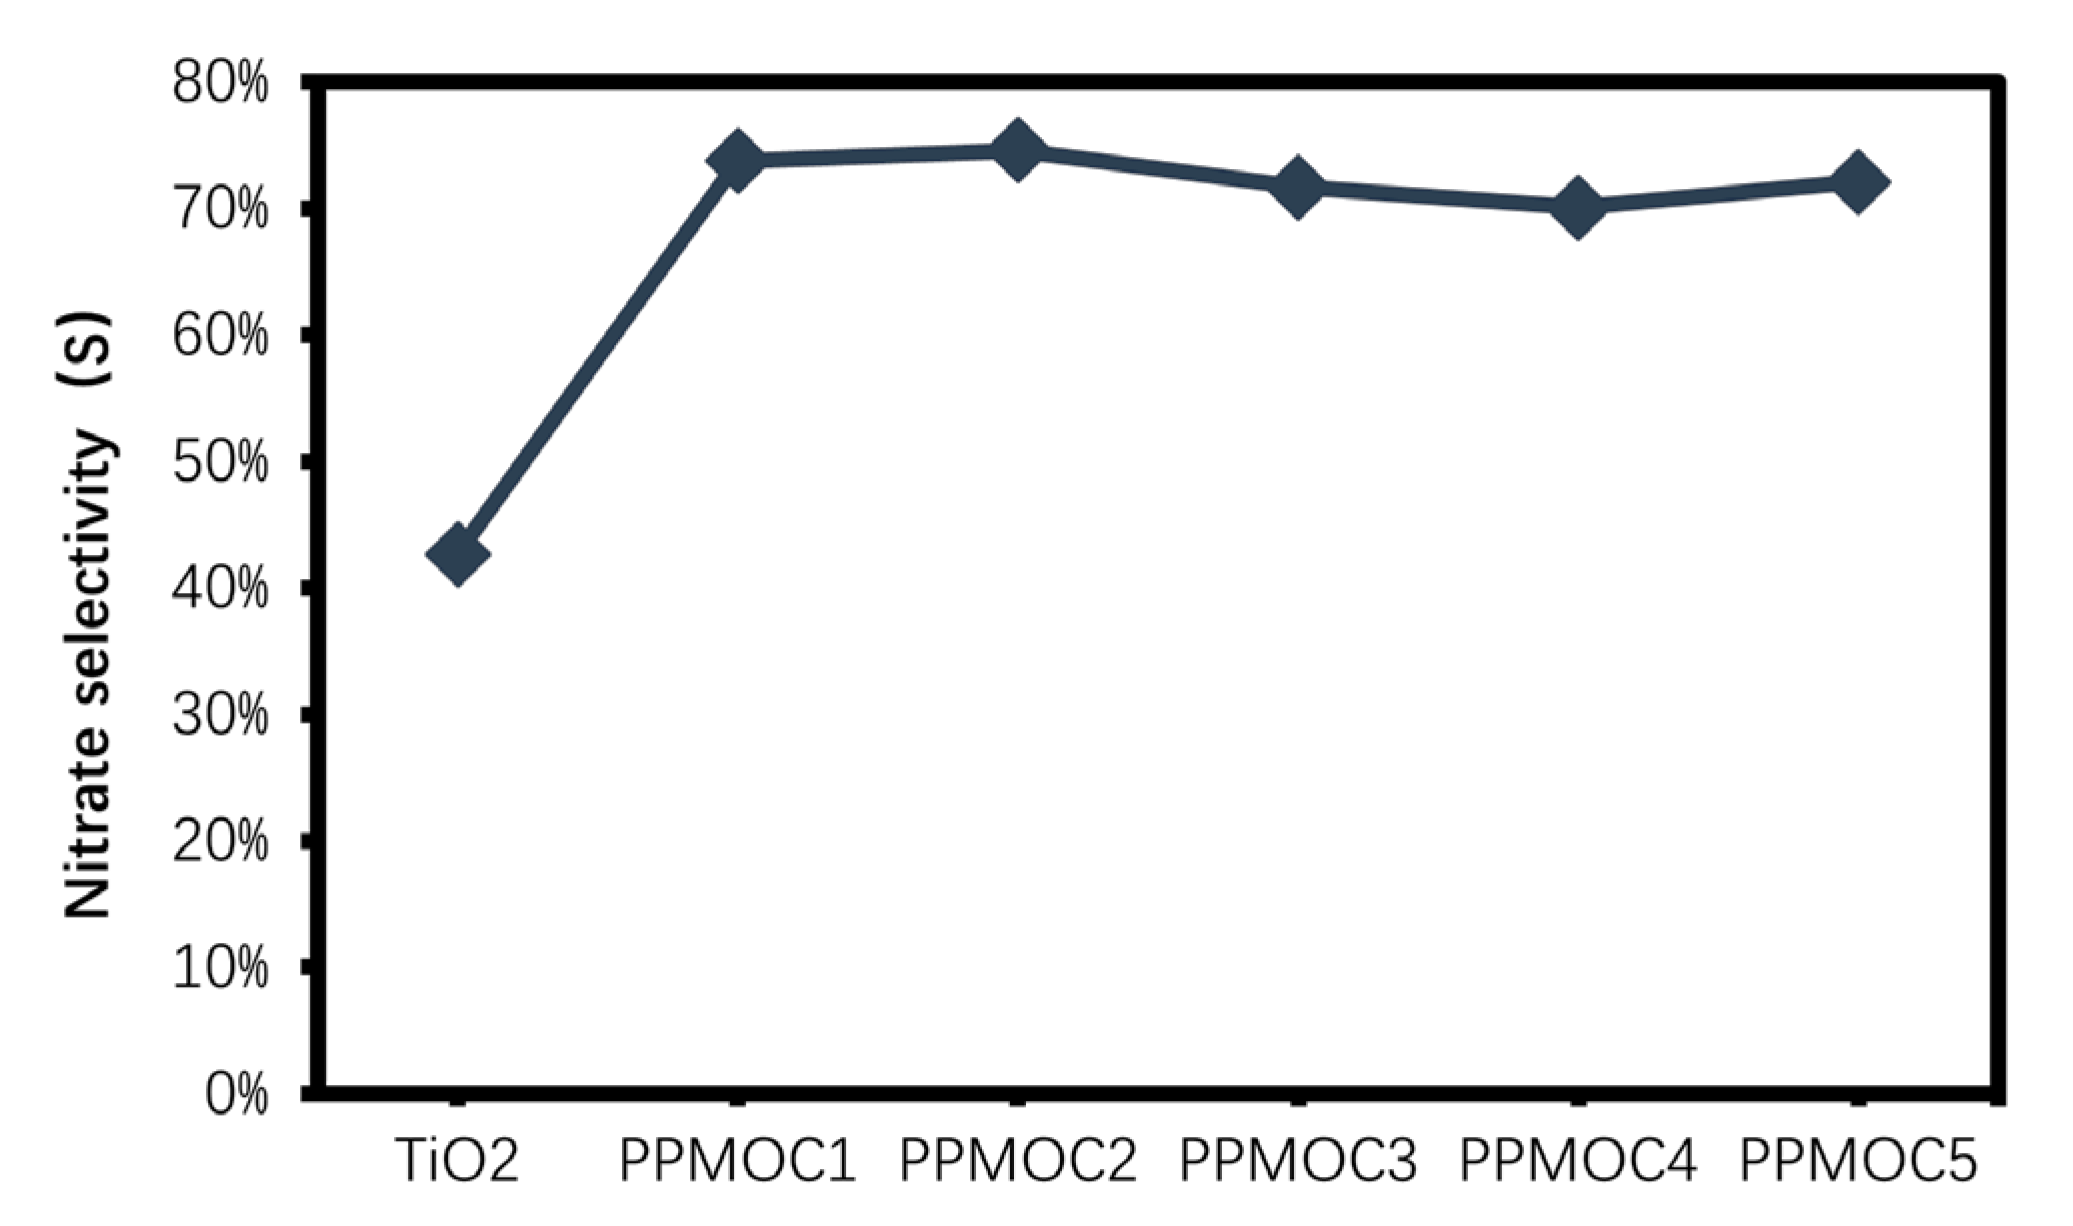
Figure 7 and Figure 8 show the nitrate selectivity of the prepared samples. It is clear that the porosity has no direct effects on nitrate selectivity, and the overall nitrate selectivity is slightly improved after loading twice. As shown in Figure 8, although the nitrate selectivity of P25 is about 40%, the overall nitrate selectivity has been greatly improved when P25 was loaded in PMOC. The nitrate selectivity exceeds 70% after twice TiO2 loading. Meanwhile, the adsorption capacity of nitrogen oxides has been enhanced as well. This probably can be explained by Equations (1)–(8) [21,22]. Adsorbed water molecules react with photogenerated charges to generate OHads and O2ads radicals, in which NOads would be oxidized to NO2ads and HNO3ads. In this case, the absorbing capacity is beneficial to the HNO3ads formation, thus high porosity samples present better nitrate selectivity. Furthermore, Mg(OH)2 in PPMOC also can be involved in the reaction; Mg(OH)2 can fix HNO3ads into NO3 in PPMOC, thereby reducing NO2 emissions and greatly improving nitrate selectivity as well. For pure P25 and low porosity PPMOC samples, the photocatalytic oxidation of NO would generate the NO2ads and HNO3ads. However, since there is no substance that can fix these species, the generated NO2ads would be released, while in high porosity PPMOC, the generated NO2ads and HNO3ads can react well with Mg(OH)2 to form NO3, thus improving the nitrate selectivity.
TiO2 + hv → TiO2 (h+ + e)
TiO2 (h+) + H2Oads → TiO2 + OHads + H+
TiO2 (e) + O2ads → TiO2 + O2ads
NOads + OHads → HNO2ads + OHads →NO2ads + H2O
NOads + O2ads + H+ → NO2ads + OH
NOads + O2ads + H+ → HNO3ads
NO2ads + Mg(OH)2 → Mg(NO3)2 + H2O
HNO3ads + Mg(OH)2 → Mg(NO3)2 + H2O
As shown in Figure 9, the photocatalytic reaction process for PPMOC to NO-NO2-NOx can be concluded. On one hand, the active radicals (OHads and O2ads), generated by the TiO2 photocatalyst participated in the photocatalytic reaction to transfer the NO to NO2 and NO3; on the other hand, the PMOC matrix also can participate in the degradation reaction due to its specialized hydrates, such as alkalized phase 5 (5Mg(OH)2·MgCl2·8H2O) and Mg(OH)2. These hydrates can transfer and solidify the generated NO2 and NO3 molecules, further promoting the degradation reaction of the system, thus presenting a high photocatalytic efficiency.

3. Experimental Section

3.1. Preparation of PMOC and PPMOC

In this study, MOC slurry was prepared by the physical foaming method with a molar ratio of MgO:MgCl2:H2O = 5:1:14 as reported in our previous work [15,16,23,24]. MgO and MgCl2 for the preparation of MOC were purchased from China National Pharmaceutical Group Corporation, which were all analytical reagent grade. Different amounts of plant-based protein foaming agent were added to produce different densities and surface pores of MOC. The preparation process is as follows: 49.18 g of MgO powder and 50.82 g of MgCl2 aqueous solution with a mass fraction of 27.4% were mixed to form the MOC slurry. The different amounts of foaming were added to the cement slurry and mixed forming the foamed PMOC slurry. The PMOC slurry was cast into the moulds (50 mm × 100 mm) and then cured at a temperature of 20 ± 1 °C and a relative humidity of 60 ± 5% for one day. Finally, the size, density, and porosity of the demould samples were measured. Table 1 shows the parameters of PMOC for different porosities. PMOC1 without the foaming agent had a porosity of 5.4% and a density of 1.702 g·cm−3. When increasing the foaming agent content, the density of PMOC decreases and the porosity increases gradually. The porosities of PMOC2, 3, 4, and 5 are 54.1%, 60.1%, 61.5%, and 66.0%, respectively. The highest porosity was observed in the PMOC5 samples. High porosity is beneficial to photocatalyst loading and increasing the specific surface area of the photocatalytic reaction. Meanwhile, the porous structure of PMOC is conducive to the adsorption of polluted gas to photocatalytic degradation.
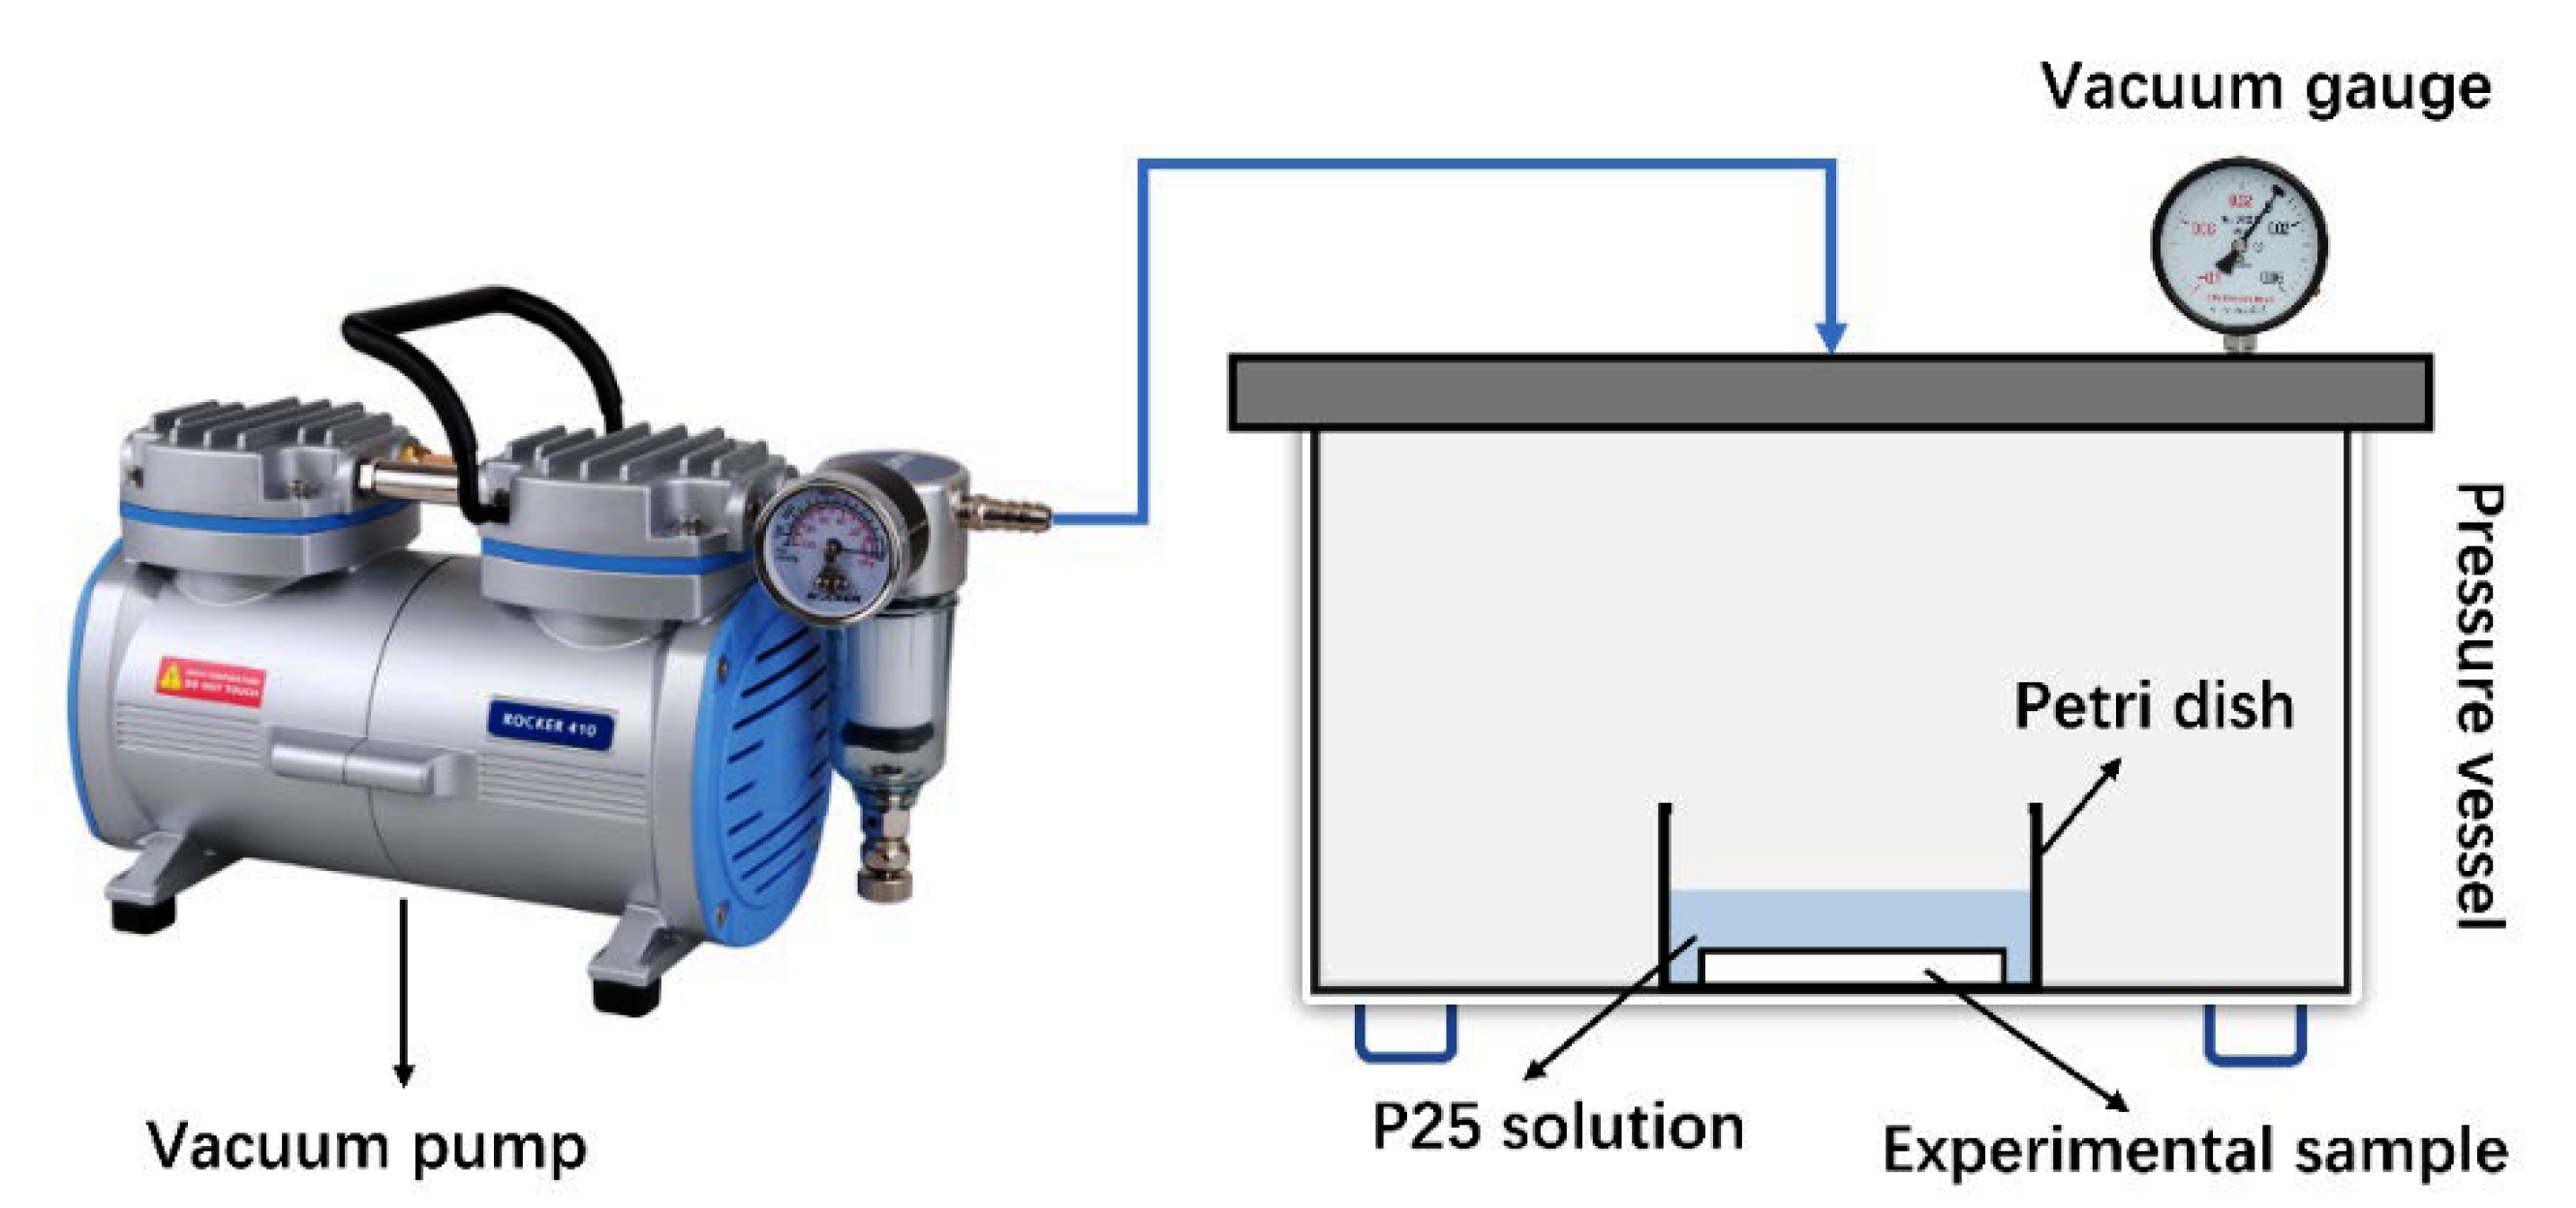
In order to load TiO2 uniformly on the surface of PMOC, a vacuum negative pressure immersion loading method was used to prepare PPMOC [25]. The schematic image of the preparation apparatus is shown in Figure 10. The preparation route was as follows [15,16]: firstly, the surface of the prepared sample was polished by 60, 240, and 800 sandpaper. Secondly, 5 g of TiO2 (P25) was dissolved in 500 mL of C2H5OH solution (A.R.) (P25 solution). Then, the TiO2 absolute solution was placed in an ultrasonic dispersion instrument for 20 min to produce a uniform TiO2 suspension, then the prepared MOC or PMOC sample was added for 5 min. After that, the MOC or PMOC sample soaked TiO2 suspension was placed in a 0.06–0.08 MPa vacuum chamber for 1 h, and finally the photocatalytic MOC or PMOC samples were obtained after drying the samples in a 40 °C oven for 1 h.

3.2. Characterization

3.2.1. SEM

The microscopic morphology of the sample was analyzed by QUANTA FEG 450 environmental field emission scanning electron microscope (SEM) at an accelerating voltage of 15 KV, which was produced by the FEI (Carl Zeiss Co., Ltd., Oberkochen, Germany).

3.2.2. Stereomicroscope

The macroscopic morphology and pore structures of the prepared MOC, PMOC, and PPMOC samples were also observed by stereo microscope (SZX16, Olympus, Jiayuan Xingye Technology Co., Ltd., Beijing, China).

3.2.3. Photocatalytic Performance Test

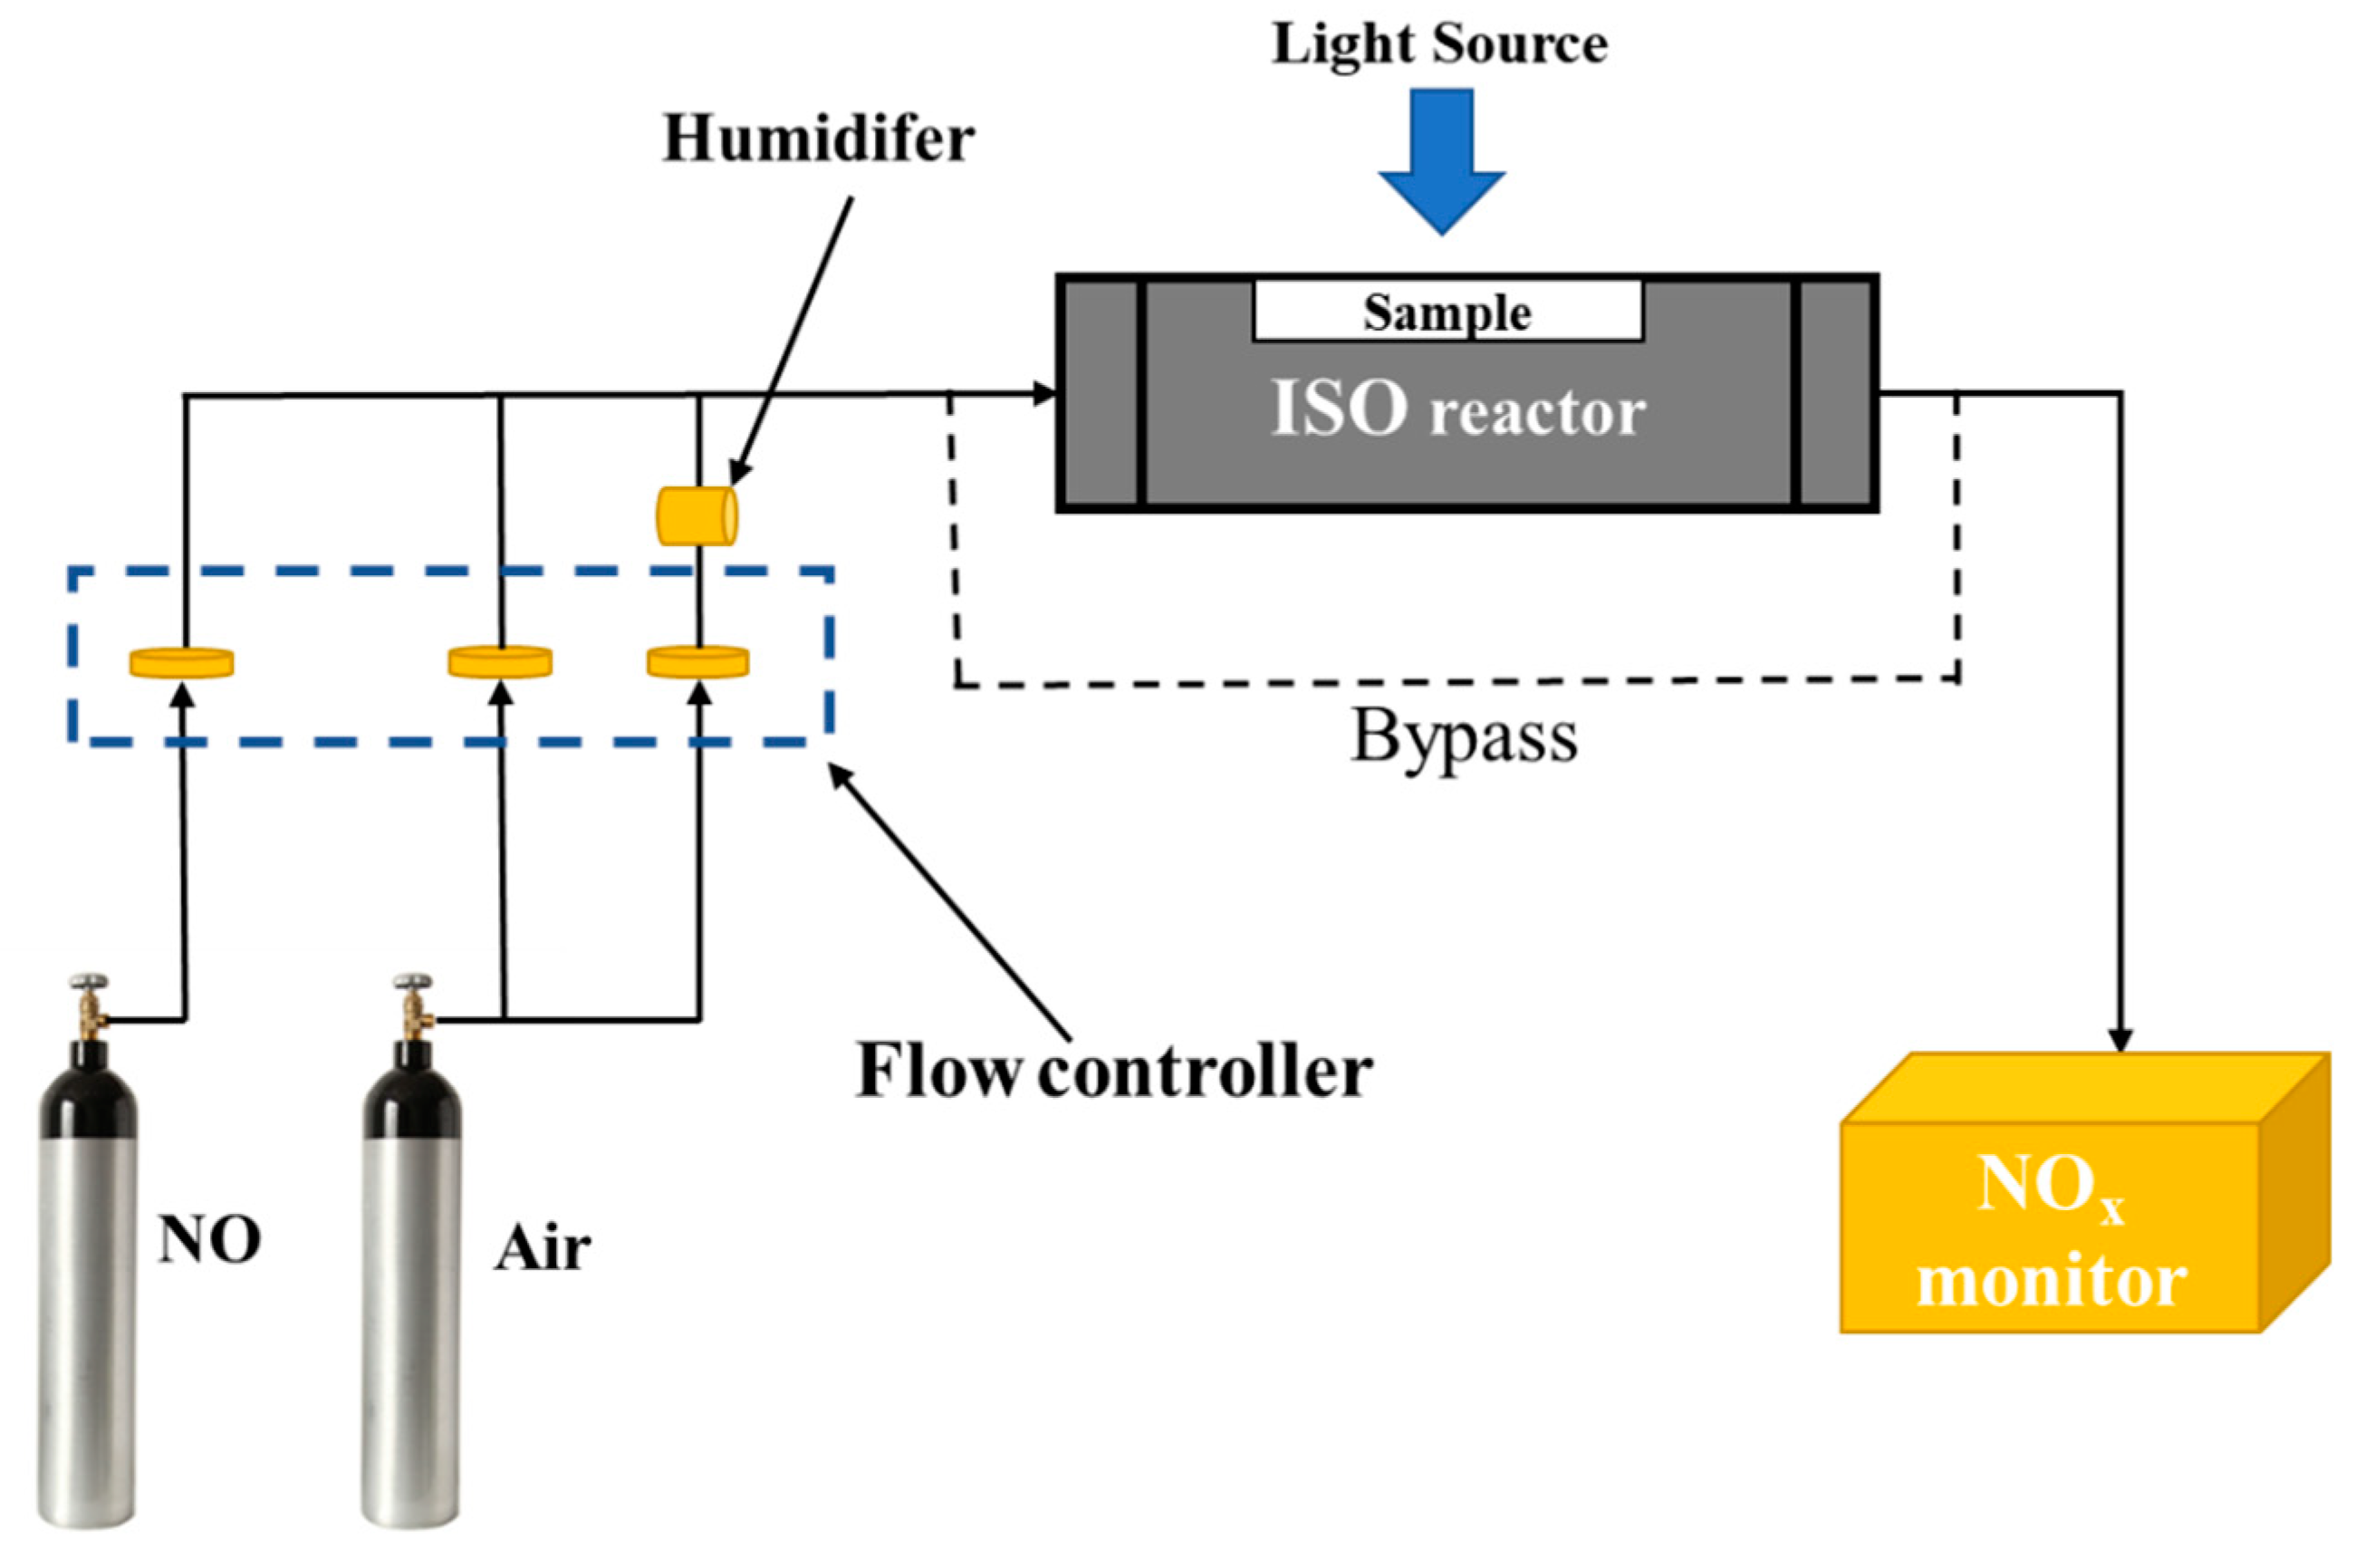
The photocatalytic performance of samples was tested by using NOx gases as model pollutants in a standard gas reactor (ISO 22197-1: 2007). The test procedure is shown in Figure 11. The illumination light source was a 300 W xenon lamp (provided by CEL-HXF300, CeauLight Co., Ltd., Beijing, China; λmax = 365 nm), and controlling the UV radiation intensity (main wavelength is 365 nm) on sample surface was 1 mW·cm−2 by the UV-vis intensity test instrument monitor. The gas concentration was 1 ppm ± 0.05 NO gas with the wet air of 50% relative humidity in a 3 L·min−1 flow rate, which was tested by the NOx monitor (HN-CK5001, Taiyuan Hainachenke Instrument Co., Ltd., Taiyuan, China). The NO, NO2, and NOx gas concentration during the photocatalytic reaction process was also tested by the above instrument. The other test procedures can be seen in our previous work [15].
The photonic efficiency (ξ) of the NO2 generation and the removal of NO and NOx and the nitrate selectivity (S%) are calculated by Equation (9) and (10), respectively [26,27]:
ξ = ( C d   -   C i ) VP Φ ART
S % = ξ NOx ξ NO × 100
Where, Cd is the gas concentration under dark conditions in ppb. Ci is the gas concentration under light conditions in ppb. V is the rate of gas flow in m3∙s−1. P is the atmospheric pressure in Pa. A is the sample area of reaction in m2. R is the gas constant in J∙mol−1∙K−1. T is the absolute temperature in K, and Φ is the photon flux in mol∙s−1∙m2.

4. Conclusions

In this study, the TiO2 loaded PMOC with porosity from ca. 5% to 66% was prepared by using the vacuum negative pressure immersion method. The physiochemical properties, NOx photocatalytic efficiencies, and nitrate selectivity were investigated in detail. The conclusions reached are as follows.
The porous structure of PMOC facilitated TiO2 loading on the matrix surface by the vacuum negative pressure immersion loading method. The framework structure between the internal air holes of PMOC provided an attachment point for TiO2 particles. Through a SEM and stereo microscope, it can be observed that a large amount of TiO2 is supported in the pores and frame structure of PMOC, and TiO2 clusters are also formed. The photocatalytic efficiency of PPMOC is much higher than that of pure P25 because its higher specific surface area improves light utilization and the gas diffusion rate. Meanwhile, the nitrate selectivity of PPMOC is higher than that of pure TiO2, which shows that PMOC is the great carrier for the photocatalyst.
The effective area of TiO2 in contact with light was greatly increased, thus increasing the photocatalytic efficiency. The photonic efficiency of NO is up to 0.722% after the once loading of TiO2 in PPMOC2. However, the photonic efficiency of NO decreases from 0.722% to 0.576% with increasing porosity. This is because that relative high porosity of PMOC would reduce the loading surface of the matrix to TiO2 particles, which might decrease the photocatalytic efficiency. After TiO2 loading twice, the photonic efficiencies of NO, NOx, and NO2 are significantly improved. However, the highest photonic efficiency of NO and NOx appeared in PPMOC3, which were 1.0% and 0.717%, respectively. Excessively high porosity will result in a decrease in the effective surface area, which is harmful to photocatalytic efficiency. This is resultant from the reduction of the effective surface area, which impairs the photocatalytic efficiency of NO and NOx.
The PMOC substrate can significantly enhance the photocatalytic nitrate selectivity of TiO2 to NOx gases, of which the nitrate selectivity can reach to 70%; this is due to the high absorb capacity and phase 5 Mg(OH)2 reactivity of PPMOC with generated NO2 and NO3, which can involve in the photocatalytic reaction process of NOx and highly reduces the release of generated NO2 harmful gas.
The excellent model of photocatalytic degradation of nitrogen oxides and high nitrate selectivity make PPMOC a promising material in the field of photocatalytic functional decorative materials, which also expands the application of MOC in functionalization.

Author Contributions

Conceptualization, L.Z., L.Y. (Liran Yuan) and L.Y. (Lu Yang); methodology, L.Z., L.Y. (Liran Yuan) and L.Y. (Lu Yang); software, X.X.; validation, J.C.; investigation, L.Z., L.Y. (Liran Yuan) and L.Y. (Lu Yang); writing—original draft preparation, L.Z., L.Y. (Liran Yuan), L.Y. (Lu Yang), X.X. and J.C.; supervision, L.Y. (Lu Yang). All authors have read and agreed to the published version of the manuscript.

Funding

This research was funded by the State key Laboratory of solid waste Resource Utilization and Energy Saving Building Materials Open Fund (SWR-2021-008) and the Fundamental Research Funds for the Central Universities (WUT2018IVA011, WUT2018III022, 2019IVB060, 2020-zy-015, 2020-zy-016).

Data Availability Statement

Not applicable.

Conflicts of Interest

The authors declare no conflict of interest.

References

  1. Xu, J.; Yang, H.; Yang, Z.; Huang, M.; Zhang, Y.; Yang, C. The effect of TiO2@CoAl-LDH nanosphere on early hydration of cement and its photocatalytic depollution performance under UV-visible light. Constr Build. Mater. 2022, 319, 126227. [Google Scholar] [CrossRef]
  2. Huang, M.; Yang, Z.; Lu, L.; Xu, J.; Wang, W.; Yang, C. The preparation of g-C3N4/CoAl-LDH nanocomposites and their depollution performance in cement mortars under UV-visible light. Catalysts 2022, 12, 443. [Google Scholar] [CrossRef]
  3. Cao, J.; Hasegawa, T.; Asakura, Y.; Sun, P.; Yang, S.; Li, B.; Cao, W.; Yin, S. Synthesis and color tuning of titanium oxide inorganic pigment by phase control and mixed-anion co-doping. Adv. Powder Technol. 2022, 33, 103576. [Google Scholar] [CrossRef]
  4. Yin, S.; Hasegawa, T. Morphology Control of Transition Metal Oxides by Liquid-Phase Process and Their Material Development. KONA Powder Part. J. 2022, 2023015. [Google Scholar] [CrossRef]
  5. Sorel, S. On a new magnesium cement. Comptes Rendus Acad. Sci. 1867, 65, 102–104. [Google Scholar]
  6. Montle, J.F.; Mayhan, K.G. Role of Magnesium Oxychloride Cements in Fire Loss Prevention. In Loss Prevention: A CEP Technical Manual; American Institute of Chemical Engineers: Washington, DC, USA, 1974; Volume 8, pp. 52–56. [Google Scholar]
  7. Montle, J.F.; Mayhan, K.G. Magnesium oxychloride as a fire retardant material. J. Fire Flammabl. Fire Retard. Chem. 1974, 1, 243–254. [Google Scholar]
  8. Li, Z.; Chau, C.K. Influence of molar ratios on properties of magnesium oxychloride cement. Cem. Concr. Res. 2007, 37, 866–870. [Google Scholar] [CrossRef]
  9. Bilinski, H.; Matković, B.; Mažuranić, C.; Žunić, T.B. The Formation of Magnesium Oxychloride Phases in the Systems MgO-MgCl2-H2O and NaOH-MgCl2-H2O. J. Am. Ceram. Soc. 1984, 67, 266–269. [Google Scholar] [CrossRef]
  10. Lu, H.P.; Wang, P.L.; Jiang, N.X. Design of additives for water-resistant magnesium oxychloride cement using pattern recognition. Mater. Lett. 1994, 20, 217–223. [Google Scholar]
  11. Zhang, C. The research on the water-resistance of MOC II. The loss of the strength of magnesium oxychloride cement stone in water. J. Hunan Univ. Nat. Sci. 1994, 21, 121. [Google Scholar]
  12. Chau, C.K.; Li, Z. Microstructures of magnesium oxychloride. Mater. Struct. 2008, 41, 853–862. [Google Scholar] [CrossRef]
  13. Li, Z.; Chau, C.K. Reactivity and function of magnesium oxide in sorel cement. J. Mater. Civ. Eng. 2008, 20, 239–244. [Google Scholar] [CrossRef]
  14. Xu, X.A.; Shu, C.; Yang, L.; Li, X.; Wang, F.Z. Basic Magnesium Chloride Whisker Photocatalytic Materials: Synthesis and Toluene Degradation Efficiency. Constr. Build. Mater. 2022, 343, 128115. [Google Scholar] [CrossRef]
  15. Wang, F.; Yang, L.; Sun, G.; Guan, L.; Hu, S. The hierarchical porous structure of substrate enhanced photocatalytic activity of TiO2/cementitious materials. Constr. Build. Mater. 2014, 64, 488–495. [Google Scholar] [CrossRef]
  16. Yang, L.; Wang, F.; Shu, C.; Liu, P.; Zhang, W.; Hu, S. An in-situ synthesis of Ag/AgCl/TiO2/hierarchical porous magnesian material and its photocatalytic performance. Sci. Rep. 2016, 6, 21617. [Google Scholar] [CrossRef]
  17. Feng, C.; Wang, F.; Liu, P.; Sun, G.; Yang, L.; Zhang, W.; Shu, C. Photocatalytie Activity of Porous Magnesium Oxychloride Cement Combined with AC/TiO2 Composites. J. Wuhan Univ. Technol. Sci. Ed. 2017, 32, 591–597. [Google Scholar] [CrossRef]
  18. Folli, A.; Pochard, I.; Nonat, A.; Jakobsen, U.H.; Shepherd, A.M.; Macphee, D.E. Engineering Photocatalytic Cements: Understanding TiO2 Surface Chemistry to Control and Modulate Photocatalytic Performances. J. Am. Ceram. Soc. 2010, 93, 3360–3369. [Google Scholar] [CrossRef]
  19. Folli, A.; Pade, C.; Hansen, T.B.; De Marco, T.; Macphee, D.E. TiO2 photocatalysis in cementitious systems: Insights into self-cleaning and depollution chemistry. Cem. Concr. Res. 2012, 42, 539–548. [Google Scholar] [CrossRef]
  20. Hakki, A.; Yang, L.; Wang, F.; Elhoweris, A.; Alhorr, Y.; Macphee, D.E. Photocatalytic Functionalized Aggregate: Enhanced Concrete Performance in Environmental Remediation. Buildings 2019, 9, 28. [Google Scholar] [CrossRef]
  21. Yang, L.; Hakki, A.; Wang, F.; Macphee, D.E. Different Roles of Water in Photocatalytic DeNOx Mechanisms on TiO2: Basis for Engineering Nitrate Selectivity? ACS Appl. Mater. Interfaces 2017, 9, 17034–17041. [Google Scholar] [CrossRef] [PubMed]
  22. Ballari, M.M.; Yu, Q.L.; Brouwers, H.J.H. Experimental study of the NO and NO2 degradation by photocatalytically active concrete. Catal. Today 2011, 161, 175–180. [Google Scholar] [CrossRef]
  23. Wang, F.; Yang, L.; Guan, L.; Hu, S. Microstructure and Properties of Cement Foams Prepared by Magnesium Oxychloride Cement. J. Wuhan Univ. Technol. Sci. Ed. 2015, 30, 331–337. [Google Scholar] [CrossRef]
  24. Wang, F.; Sun, G.; Zhang, W.; Yang, L.; Liu, P. Performance of photocatalytic cementitious material: Influence of substrate surface microstructure. Constr. Build. Mater. 2016, 110, 175–181. [Google Scholar] [CrossRef]
  25. Wang, F.; Yang, L.; Wang, H.; Yu, H. Facile preparation of photocatalytic exposed aggregate concrete with highly efficient and stable catalytic performance. J. Chem. Eng. 2015, 264, 577–586. [Google Scholar] [CrossRef]
  26. Yang, L.; Hakki, A.; Wang, F.; Macphee, D.E. Photocatalyst efficiencies in concrete technology: The effect of photocatalyst placement. Appl. Catal. B: Environ. 2018, 222, 200–208. [Google Scholar] [CrossRef]
  27. Yang, L.; Hakki, A.; Zheng, L.; Jones, M.R.; Wang, F.; Macphee, D.E. Photocatalytic concrete for NOx abatement: Supported TiO2 efficiencies and impacts. Cem. Concr. Res. 2019, 116, 57–64. [Google Scholar] [CrossRef] [Green Version]
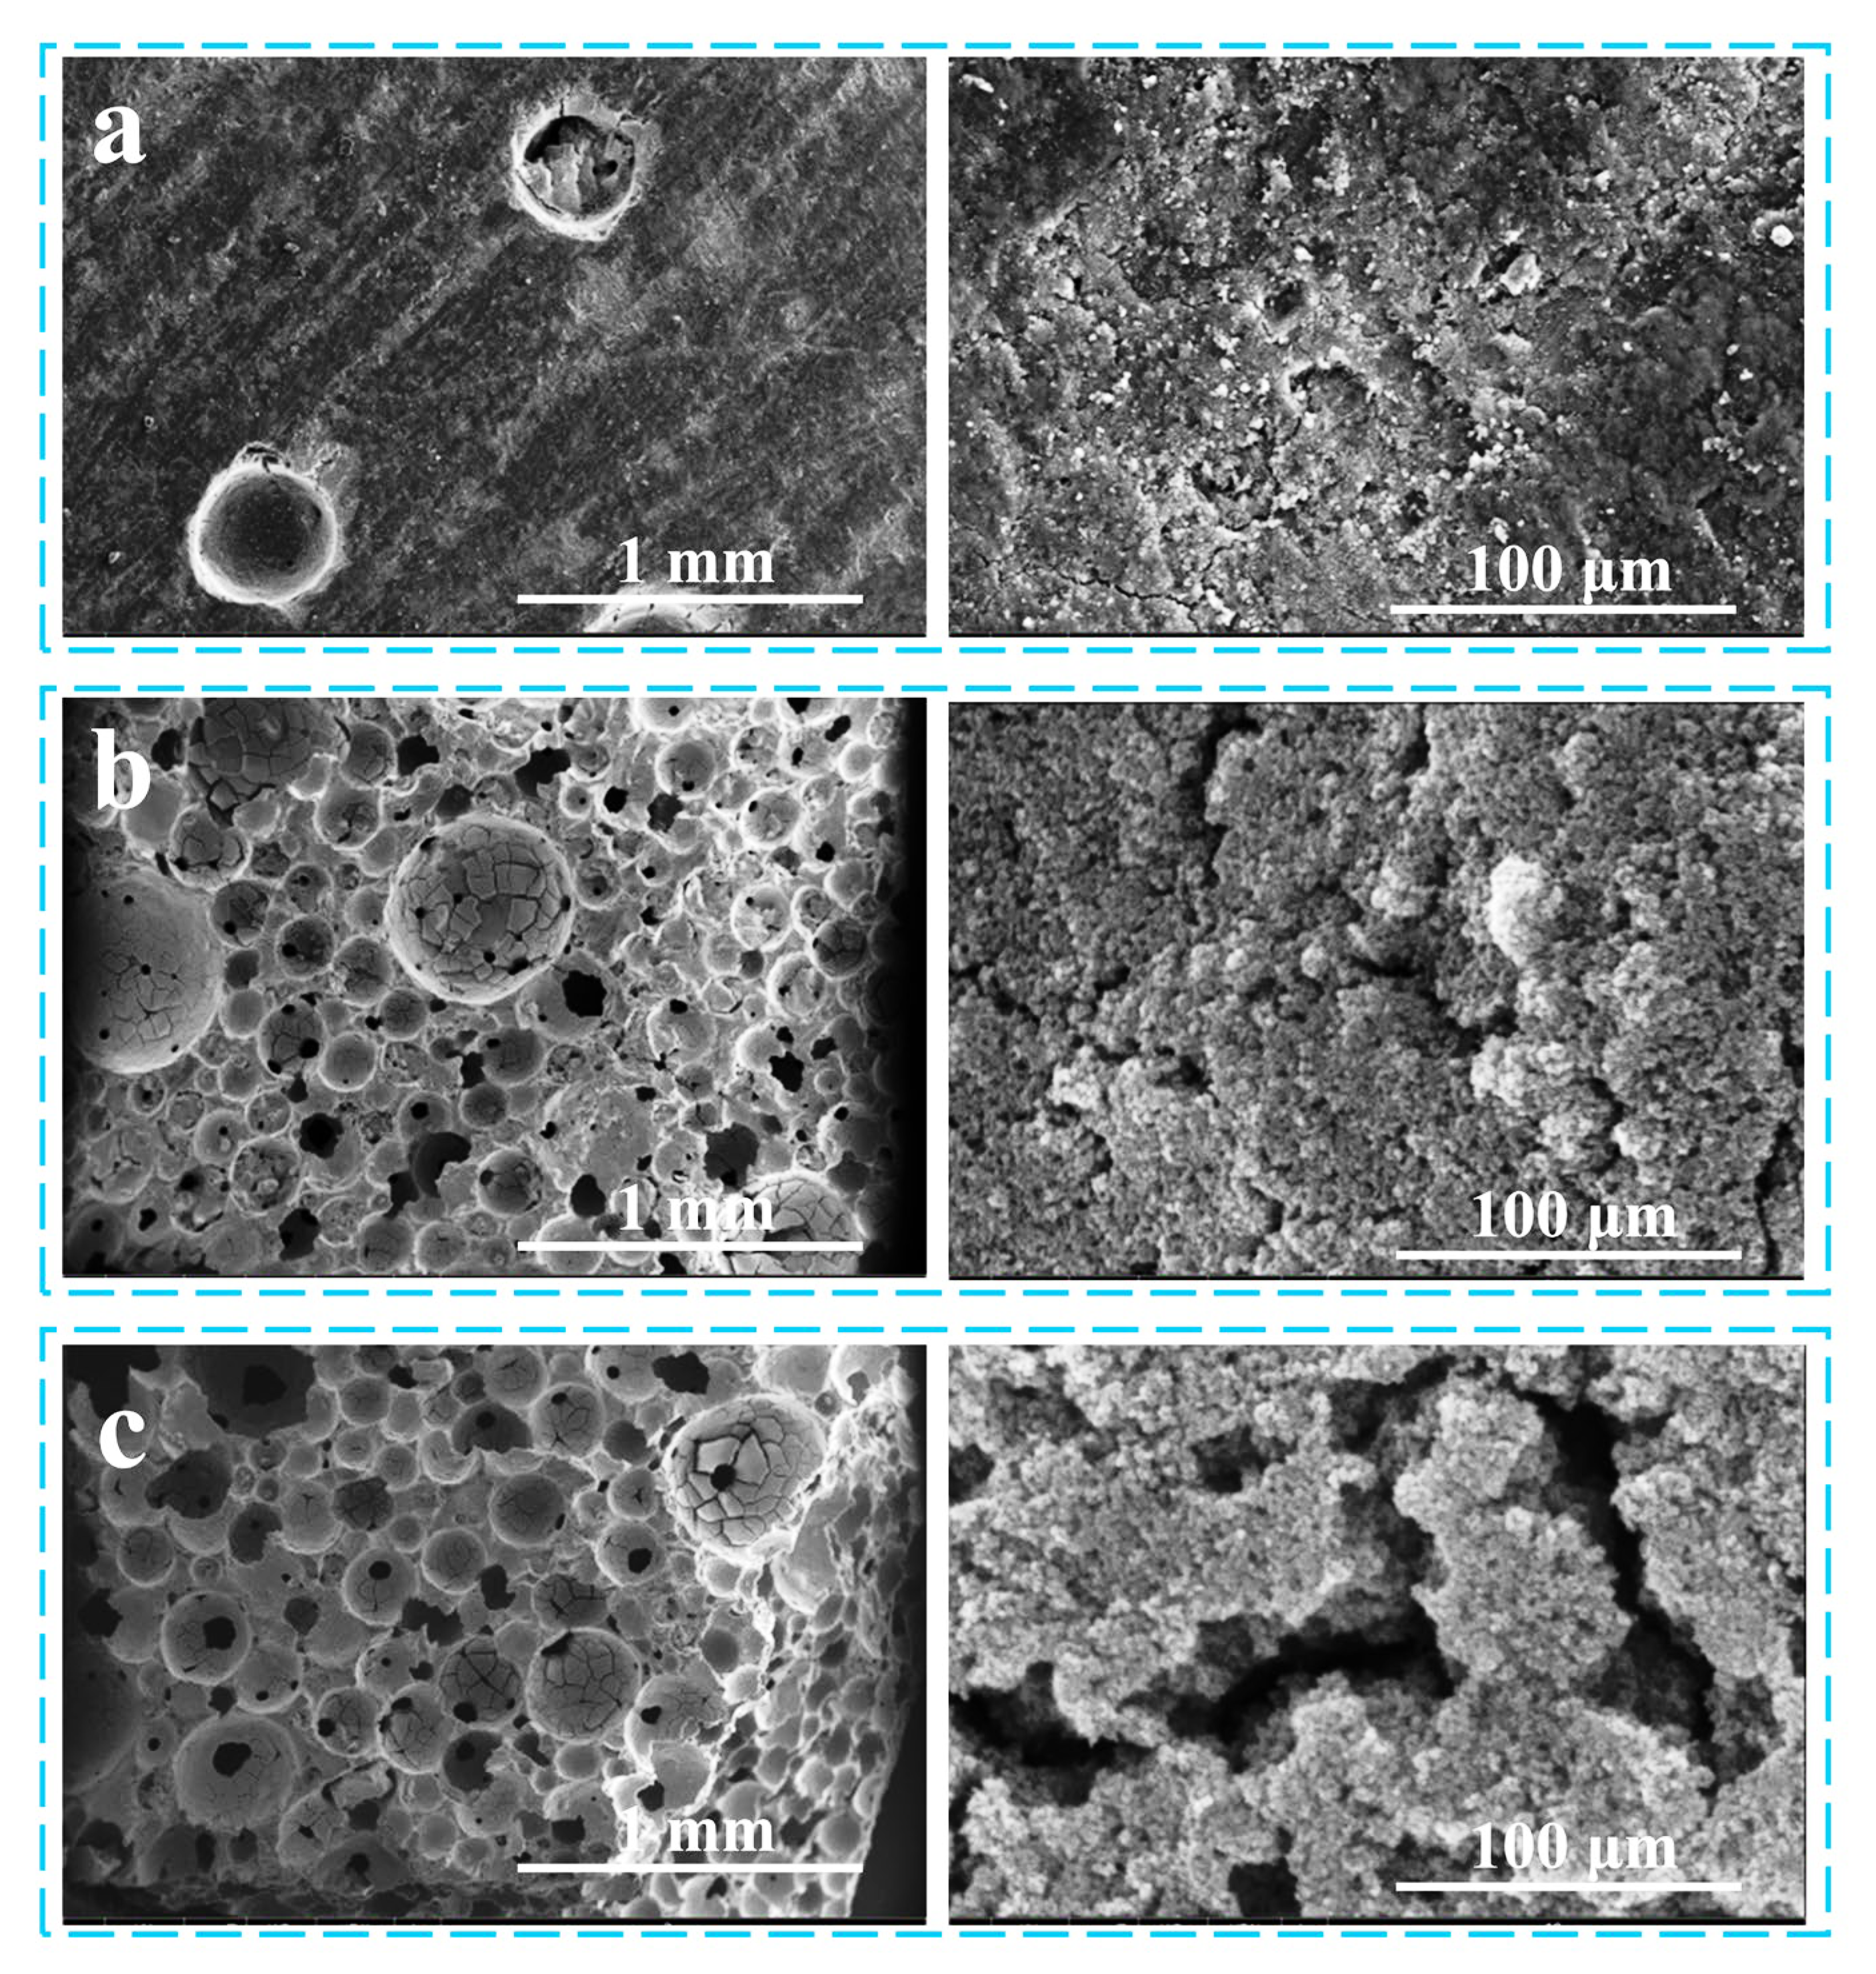
Figure 1. SEM images of PPMOC1 (a), PPMOC3 (b), and PPMOC5 (c). The PPMOC number means different porosity (shown in the experimental section).
Catalysts 13 00326 g001
Figure 2. Macroscopic morphology of PPMOC1 (a), PPMOC3 (b), and PPMOC5 (c). The PPMOC number means different porosity (shown in the experimental section).
Catalysts 13 00326 g002
Figure 3. The curve of NOx gas concentration in the process of photocatalysis.
Catalysts 13 00326 g003
Figure 4. Photonic efficiency (ξ) of the NO2 generation and the removal of NO and NOx for PMOC, P25, and PPMOC3. (PMOC—porous magnesium oxychloride cement; P25—TiO2 with an average particle size of 25 μm; PPMOC3—photocatalytic porous magnesium oxychloride cement with different porosity).
Catalysts 13 00326 g004
Figure 5. Photonic efficiency (ξ) of NO and NOx removal and intermediate product NO2 formation of loading PPMOC once. The PPMOC number in x axis means different porosity (shown in the experimental section).
Catalysts 13 00326 g005
Figure 6. Photonic efficiency (ξ) of NO and NOx removal and intermediate product NO2 formation of loading PPMOC twice. The PPMOC number in x axis means different porosity (shown in the experimental section).
Catalysts 13 00326 g006
Figure 7. Effect of PPMOC loading times on nitrate selectivity. The PPMOC number in x axis means different porosity (shown in the experimental section).
Catalysts 13 00326 g007
Figure 8. Nitrate selectivity of different porosity samples. The PPMOC number in x axis means different porosity (shown in the experimental section).
Catalysts 13 00326 g008
Figure 9. Schematic image of the photocatalytic reaction process for PPMOC to NO-NO2-NOx (CB—conduction band; VB—valence band; e—electron; h+—electron hole).
Catalysts 13 00326 g009
Figure 10. Device for TiO2 photocatalyst loading on prepared matrix (P25- TiO2 with an average particle size of 25 μm).
Catalysts 13 00326 g010
Figure 11. Schematic image for NO-NO2-NOx photocatalytic performance test and procedure.
Catalysts 13 00326 g011
Table 1. Parameters of PMOC for different porosities.
NameAmount of Foaming Agent Added
mL
Weight
g
Length
cm
Width
cm
Height
cm
Density
g·cm−3
Porosity
PMOC1045.201050.531.7025.4%
PMOC25021.471050.520.82654.1%
PMOC310022.071050.6150.71860.1%
PMOC415023.561050.680.69361.5%
PMOC520018.041050.590.61266.0%
PPMOC1, PPMOC2, PPMOC3, PPMOC4 and PPMOC5 is the photocatalytic porous magnesium oxychloride cement loaded with TiO2, respectively.
Disclaimer/Publisher’s Note: The statements, opinions and data contained in all publications are solely those of the individual author(s) and contributor(s) and not of MDPI and/or the editor(s). MDPI and/or the editor(s) disclaim responsibility for any injury to people or property resulting from any ideas, methods, instructions or products referred to in the content.