Abstract
A continuous electrocatalytic reactor offers a promising method for producing fuels and value-added chemicals via electrocatalytic hydrogenation of biomass-derived compounds. However, such processes require a better understanding of the impact of different types of active electrodes and reaction conditions on electrocatalytic biomass conversion and product selectivity. In this work, Ni1−xPdx (x = 0.25, 0.20, and 0.15) alloyed nanostructures were synthesized as heterogeneous catalysts for the electrocatalytic conversion of furfural. Various analytical tools, including XRD, SEM, EDS, and TEM, were used to characterize the Ni1−xPdx catalysts. The alloyed catalysts, with varying Ni to Pd ratios, showed a superior electrocatalytic activity of over 65% for furfural conversion after 4.5 h of reaction. In addition, various experimental parameters on the furfural conversion reactions, including electrolyte pH, furfural (FF) concentration, reaction time, and applied potential, were investigated to tune the hydrogenated products. The results indicated that the production of 2-methylfuran as a primary product (S = 29.78% after 1 h), using Ni0.85Pd0.15 electrocatalyst, was attributed to the incorporation of palladium and thus the promotion of water-assisted proton transfer processes. Results obtained from this study provide evidence that alloying a common catalyst, such as Ni with small amounts of Pd metal, can significantly enhance its electrocatalytic activity and selectivity.
1. Introduction
Optimized electrocatalytic conversion methods have attracted enormous interest in the sustainable bio-oil production field [1,2,3]. Various bio-wastes can be utilized, fed into an electrocatalytic system, and converted into high-value end products. Typically, a paired electrolyzer cell is used to assist simultaneous oxidation and reduction reactions of the fed organic material. Generally, the active hydrogen species necessary for the electrocatalytic hydrogenation reactions (ECH) are produced via water oxidation reactions in the anodic chamber [4]. A proton exchange membrane facilitates the selective transfer of the produced active hydrogen from the anodic to the cathodic chamber, thus continuously feeding the system with needed protons to allow electrocatalytic reactions to occur. In the following context, a dual-chamber electrolyzer-cell setup separated by a proton exchange membrane is assembled to enable furfural conversion into high-value-added chemicals. In an electrochemical chamber, anodic products are continuously fed to the cathodic chamber to drive ECH processes, thus minimizing energy consumption and maximizing efficiency [5]. In particular, the electrocatalytic conversion of bio-based compounds, such as furfural (FF), 5-hydroxymethylfurfural (5-HMF), and other phenolic compounds, have been investigated using various catalysts [6,7,8]. Generally, the electrocatalytic approach is very promising for the conversion of furanic compounds due to several reasons, such as (a) low operating conditions of temperature and pressure; (b) avoiding the need to use costly gases; (c) tunable applied potentials, which can enhance catalytic performance and products selectivity; (d) the ease of testing via cyclic and linear sweep voltammetry; and (e) simultaneous production of hydrogenated and oxidized compounds [9].
Furfural is one of the top 12 high-value biomass-derived chemicals, and it can be converted into over 100 different chemicals that are used for fuels, lubricants, and resins, as well as a platform compound for manufacturing a wide range of industrial chemicals, such as 2-furoic acid, furfuryl alcohol, methyltetrahydrofuran, methylfuran, furfurylamine, and tetrahydrofurfuryl alcohol. [10,11]. The annual furfural production is estimated to be around 300,000 tons. China is one of the main furfural producers, with about 70% of the total global production [12]. Furthermore, over 65% of produced furfural is converted to furfuryl alcohol, owing to its wide industrial usage in vital pharmaceuticals and polymers [13,14]. Likewise, 2-methylfuran is a beneficial additive to gasoline as it can act as an octane booster [15,16]. On the other hand, the uses of furoic acid are mainly related to the food industry as it can be used as a preservative and a flavoring agent.
Recent studies have emphasized the significant influence of electrode type on furfural conversion and product yield of electrocatalytic hydrogenation reactions [1,12,17]. Hence, the impact of the catalyst used in ECH reactions significance is not limited to enhancing product selectivity, yet it minimizes the occurrence of undesirable competing reactions, such as hydrogen evolution reactions (HER) [18,19]. Metallic catalysts have been widely investigated for the ECH of furfural, such as Cu, Ni, Pt, Fe, Pd, Rh, Ru, Al, Zn, Co, Cd, and Hg, owing to their high activity and product selectivity [20,21,22]. Different alloys and supported catalysts have also been tested for the ECH of FF [23]. Graphite and carbon supports were widely used, owing to their electrical conductivity [21,24]. Recent studies indicated that changing electrolyte pH can dramatically change the selectivity of ECH reactions. For instance, increased selectivity towards furfuryl alcohol and 2-methylfuran production was observed when the electrolyte pH was reduced upon using nickel catalyst for furfural hydrogenation [17]. As pH increases to 5, a significant drop in 2-MeF was observed, reaching a value of 2%, while FAL selectivity increased to 95% [18]. Carbon-supported Pd catalysts have shown a maximum faradic efficiency of 30% for the ECH of FF, yielding various products, such as THFAL, MTHF, FAL, and MeF [25].
Nickel catalysts are distinguished by their activity in hydrogenation reactions to mainly produce furfuryl alcohol. A high yield of THFAL is observed when using supported Ni-based catalysts due to the nickel’s ability to induce ring-opening reactions due to the strong interaction between nickel sites and furan rings. The catalytic performance of Raney Ni, amorphous nickel alloys, and supported bimetallic nickel, has been investigated [26]. Pure Raney-Ni-based catalysts showed low selectivity towards the production of FAL, due to their increased activity for the rearrangement of the furan ring and hydrogenation reactions [26]. Moreover, the modifications of Ni-based catalysts, such as alloying Ni with another metal, can significantly enhance their catalytic performance. For instance, incorporating a noble metal, such as palladium, is expected to enhance the catalytic performance of Ni catalysts and can reduce undesired side reactions, such as HER, thus enhancing the system’s efficiency.
Herein, we report the synthesis of various nickel–palladium nanoalloys via the wet-chemical method. The morphological and structural composition of the prepared alloys were investigated using XRD, SEM, EDS, and TEM. The synthesized nanoalloys were utilized for the fabrication of active electrodes for the electrocatalytic conversion of furfural into value-added chemicals and fuels under ambient conditions. Extensive electrochemical studies were performed through electrochemical impedance spectroscopy (EIS) and linear sweep voltammetry (LSV). Additionally, the impact of varying electrolyte pH, applied potential, and initial FF concentration was examined. Finally, a mechanism for electrochemical conversion was proposed based on the experimental results.
2. Results
2.1. Physicochemical Properties
The formation of Ni1−xPdx alloys was achieved through the precipitation method, as illustrated in Figure 1a. As a stabilizing agent, PVP was initially dispersed homogeneously in an ethylene glycol and water mixture, resulting in the formation of PVP micelles. Then, Ni2+ and Pd2+ ions were added to the PVP solution. As a strong reducing agent, NaBH4 was used to reduce Ni2+-Pd2+ into the metallic Ni0-Pd0, followed by nucleation and growth to form NiPd alloyed nanostructures.
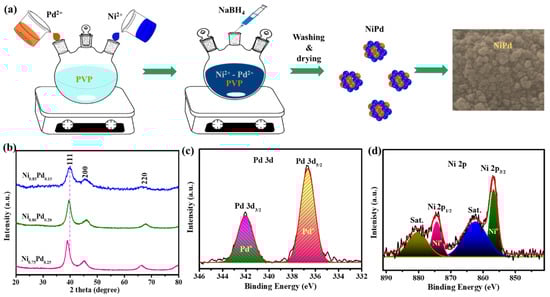
Figure 1.
(a) Schematic illustration of the formation of Ni(1−x)Pdx alloys, (b) XRD pattern for the three Ni(1−x)Pdx alloys, (c) XPS high-resolution deconvoluted spectrum of Pd 3d, and (d) XPS high-resolution deconvoluted spectrum of Ni 2p.
The structure of the synthesized Ni1−xPdx (x = 0.15, 0.20, and 0.25) nanoalloys was analyzed using XRD, as shown in Figure 1b. The different molar ratios of NiPd samples displayed three main diffraction peaks. For sample Ni0.85Pd0.15, peaks of (111), (200), and (220) were identified at 39.72°, 45.17°, and 67.85°, respectively. Similar peaks were observed at 39.37°, 46.15°, and 67.53° for sample Ni0.80Pd0.20, while the main peaks were identified at 38.95°, 45.01°, and 66.41° for the sample Ni0.75Pd0.25. The three Ni-Pd samples did not show significant changes in the diffraction patterns. The positions of the diffraction peaks of NiPd alloys were minorly shifted compared to the diffraction peaks of pure Pd (JCPD-6174) and pure Ni (JCPD-65-9444) [27,28]. The main peak of (111) was shifted to a lower diffraction angle in the diffraction patterns of NiPd alloys. The diffraction patterns indicate a high crystallinity of the prepared samples with face-centered cubic (fcc) structures in the (111), (200), and (220) planes. Moreover, the XRD patterns of the synthesized NiPd alloys indicate the absence of impurities, such as nickel or palladium oxides, which reveal the high purity of the prepared samples.
Scherrer’s equation was used to estimate the average crystallite size of NiPd nanoalloys:
where D is the average diameter in nm, k is the Scherrer constant (0.89), is the X-ray wavelength (1.5406 Å), β is the corresponding full width at half maximum of the diffraction peak, and is the Bragg diffraction angle. Among the three samples, Ni0.85Pd0.15 exhibited the largest average crystallite size of 8.0 nm. The average crystallite size of Ni0.80Pd0.20 and Ni0.75Pd0.25 is 6.5 and 5.0 nm, respectively.
XPS was used to investigate the oxidation state of the Ni0.75Pd0.25 sample. Figure 1c represents the deconvoluted XPS spectrum of Pd 3d, which shows two peaks of Pd 3d3/2 and Pd 3d5/2 [29]. The binding energies of 342.4 eV and 337.5 eV for Pd 3d3/2 and 3d5/2, respectively, indicate metallic Pd0. Figure 1d shows a high-resolution XPS spectrum of Ni 2p, which confirms the a metallic Ni0 state with the typical peaks at 874.7 and 855.5 eV that can be assigned to Ni 2p1/2 and Ni 2p3/2, as well as two satellite peaks at 861.9 and 880.5 eV [30]. The XPS results confirm that the sample is composed of Pd0 and Ni0, which confirm the successful formation of metallic alloyed nanostructures.
SEM and TEM were used to examine the morphological structures of the prepared samples. As shown in Figure 2, the SEM images were recorded at different magnifications. Ni0.85Pd0.15 exhibited a sphere-like morphology with the agglomeration of several nanoparticles, as shown in Figure 3a,b. Spherical nanoparticles were observed for the Ni0.80Pd0.20 sample, as shown in Figure 2c,d, while the Ni0.80Pd0.20 sample (Figure 2e,f) exhibited irregular morphology. The EDS mapping (Figure 2g–i) of the Ni0.75Pd0.15 sample indicates that both Ni and Pd particles were distributed homogeneously. In addition, the EDS data of Ni0.75Pd0.15 (Figure S1) indicates the absence of impurities in the sample.
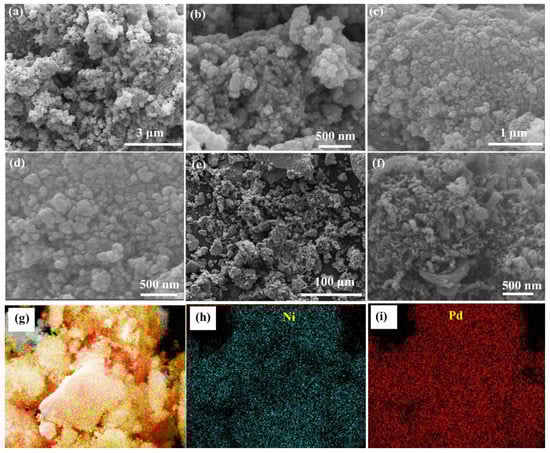
Figure 2.
Low and high magnification SEM images for (a,b) Ni0.85Pd0.15, (c,d) Ni0.80Pd0.20, (e,f) Ni0.75Pd0.25, and (g–i) EDS elemental mapping of Ni0.75Pd0.25 sample.
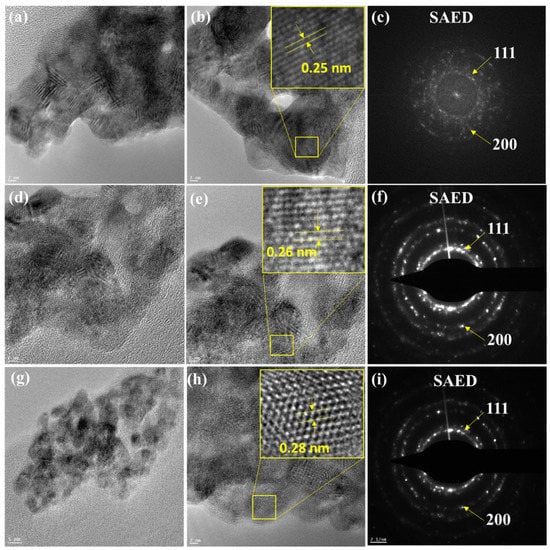
Figure 3.
TEM images with SAED pattern for (a–c) Ni0.85Pd0.15, (d–f) Ni0.80Pd0.20, and (g–i) Ni0.75Pd0.25 samples.
TEM measurements were used to determine the size and structure of different Ni-Pd alloys. Ni0.85Pd0.15 shows aggregated metallic nanoparticles with an average diameter of 8 nm and a d-spacing of 0.25 nm corresponding to the (111) plane of NiPd nanoalloys, as shown in Figure 3a,b [27,31]. The SAED pattern of Ni0.85Pd0.15 in Figure 3c exhibits the crystalline plan (111) and (200), corresponding to the fcc structure [27]. The TEM images of Ni0.80Pd0.20 samples show smaller alloyed nanoparticles, as presented in Figure 3d,e. Moreover, the d-spacing value is increased to 0.26 nm, corresponding to the (111) plane, compared to the d-spacing value of Ni0.85Pd0.15. The SAED pattern of Ni0.80Pd0.20 in Figure 3f confirmed the fcc crystalline structure with polycrystalline nature. The Ni0.75Pd0.25 sample exhibited smaller nanoparticles, as shown in Figure 3g,h. In addition, the d-spacing of 0.28 nm corresponds to the (111) plane of the fcc structure metallic alloy [27,28]. The SAED analysis of the Ni0.75Pd0.25 in Figure 3i agrees with the results of XRD and EDS. As a result of the TEM analyses, the composition of Ni(1−x)Pdx influenced the shape and size of the nanoalloys.
2.2. Electrochemical Properties
The electrochemical properties of the electrodes were obtained via various electrochemical studies, such as electrochemical impedance spectroscopy (EIS) and linear sweep voltammetry (LSV). Figure 4a,b illustrate the electrochemical activity via the LSV of NiPd electrodes over the potential range from 0 to −2.0 V vs. SCE. The current density is represented by each centimeter cube of the electrode. Herein, the maximum current density of Ni0.75Pd0.25 electrodes was −346 mA/cm2 in acidic electrolyte without furfural. After adding 10 mmol of furfural, an increase in current density was captured, reaching a maximum value of −395 mA/cm2, implying its high activity for furfural reduction. Similarly, an increase in current density to −830 mA/cm2 was observed in the LSV with Ni0.80Pd0.20 electrodes after the addition of furfural. The introduction of the organic material (FF) has caused a shift in the LSV curve along with an increase in current density, as illustrated in Figure 4b. The maximum current density recorded in the blank acidic electrolyte was −830 mA/cm2, while a higher current density was observed at −1058 mA/cm2 after the addition of furfural. The increased current density suggests the effectiveness of Ni0.85Pd0.25 electrodes for the reduction reactions of furfural. The highest current density in the acidic electrolyte recorded among the three electrodes was −1058 mA/cm2 for the Ni0.85Pd0.15 electrodes, which suggests a superior electrochemical activity for furfural reduction using the Ni0.85Pd0.15 electrodes. The maximum current density was found at −836 mA/cm2 for Ni0.80Pd0.20, while it was −395 mA/cm2 for the Ni0.75Pd0.25 electrodes. Accordingly, based on the LSV studies, increased electrochemical activity for furfural reduction among various Ni-Pd electrodes follows the sequence: Ni0.75Pd0.25 < Ni0.80Pd0.20 < Ni0.85Pd0.15.
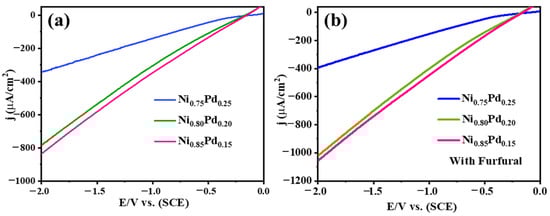
Figure 4.
Linear sweep voltammetry (LSV) for Ni(1−x)Pdx alloys with various molar ratios without furfural (a) and with furfural (b).
In addition, the electrochemical active surface area (ECSA) determines the electrocatalytic properties of electrocatalytic materials. The electrode materials with a higher ECSA exhibited a higher electrochemical activity towards the electro-hydrogenation of furfural [32]. The following equation was used to estimate the ECSA of the various electrodes.
where Cs is the specific capacitance for the graphite sheet (21 F/cm−2).
Among the prepared active electrodes, the Ni0.75Pd0.25 electrode possessed a maximum ECSA of 0.857 cm2, suggesting a high catalytic activity for furfural conversion and increased stability in the highly acidic electrolyte (pH of 1). Nonetheless, Ni0.80Pd0.20 active electrode ESCA was 0.223 cm2, and the lowest ECSA was found for Ni0.85Pd0.15 of 0.009 cm2, suggesting lower catalytic activity or stability can be attributed to metal leaching due to high solution acidity.
To further assess the electrochemical resistance of the electrode/solution interfaces, EIS measurements were conducted. The results are represented in Figure 5. Figure S2 displayed a simplified equivalent circuit used via EIS Spectrum Analyzer Software to fit the high and medium EIS frequency data and calculate charge transfer resistance (Rct) equivalent to R1 in the equivalent circuit, as well as solution resistance (Rs) (equivalent in R2) and double-layer capacitance (equivalent to CPE), to get insights into the electrode/electrolyte interfacial interactions. The Ni0.85Pd0.15 electrode exhibited 1.29 Ω cm−2 and 0.99 Ω cm−2 EIS without and after the addition of furfural, respectively. The reduced EIS value after the addition of furfural indicates the promotion of proton and electron transfer, thus boosting furfural conversion. Similar behavior was observed for the Ni0.75Pd0.25 and Ni0.80Pd0.20 electrodes, suggesting the electrochemical effectiveness of all electrodes for furfural reduction. After the addition of furfural, the EIS value for Ni0.75Pd0.25 electrode was reduced from 0.35 Ω cm−2 to 0.26 Ω cm−2, whereas it reduced by 0.34 Ω cm−2 for the Ni0.80Pd0.20. Herein, the EIS data confirm the high conductivity and low resistivity of the prepared electrodes. The EIS values ranging between 0.26 Ω cm−2 and 0.99 Ω cm−2 observed among all active electrodes suggest increased reactivity upon the addition of furfural [33,34]. The lower charge transfer resistance indicates more facile electron transfer between the interface of the active electrode and the electrolyte solution in the presence of furfural. Meanwhile, the highest double-layer capacitance of value 0.00050499 was obtained for the Ni0.75Pd0.25 electrodes, which proposes increased charge density around the electrode [35]. Therefore, a high catalytic activity for furfural hydrogenation reaction is expected using Ni0.75Pd0.25 and Ni0.80Pd0.20 electrodes.
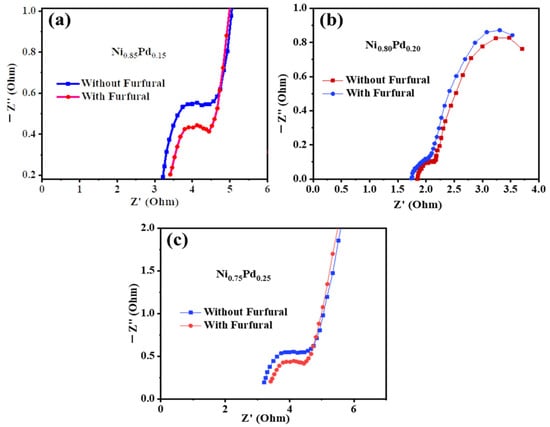
Figure 5.
EIS analysis of Ni0.85Pd0.15 (a), Ni0.80Pd0.20 (b), and Ni0.75Pd0.25 (c) with and without furfural.
2.3. ECH of Furfural
An H-cell setup was used for electrocatalytic conversion of furfural at ambient conditions. FF was reduced at a potential of –650 mV using NiPd alloys as active electrodes in a 3 M electrolyte solution. Over various active electrodes, the ECH of FF was expressed as FF conversion percentage (X), product selectivity (S), and yield (Y). It was observed that furfural conversion using the Ni0.85Pd0.15 electrode increased with the reaction time from 0 to 20.5 h. After 2.5 h of reaction, furfural conversion reached X = 7.2%, and after 3.5 h, furfural conversion increased to X = 17.4%, as shown in Figure 6a. The maximum furfural conversion was recorded at the end of the reaction after 20.5 h. The results indicate that furfural conversion is time-dependent; thus, extending the reaction duration will enhance furfural conversion. As shown in Figure 6a, furfural conversion reached 17.4% within the first 3.5 h of reaction. As reaction time increases, furfural conversion increases further, limited by the depletion of reactants as reaction time increases to 5.5 h, followed by 20.5 h. A longer reaction time results in more passing charges over time, which results in higher conversion rates of FF [33]. In addition, high selectivity towards the production of 2-methylfuran was observed after 2.5 h of reaction to reach S = 23.4%. As reported in the literature, the production of 2-methylfuran from furfural is facilitated by the consumption of 4 H+ ions and 4 e− [36]. The production of 2-methylfuran as a primary product for Ni0.85 Pd0.15 electrode is attributed to the promotion of water-assisted proton transfer. The water-assisted proton attacks the C-O bond of the aldehyde group to form water. A water-assisted protonation step is followed by two consecutive hydrogenation steps utilizing surface hydrogen to form 2-methylfuran. As the reaction proceeds, 2-methylfuran selectivity decreased to S = 6.7% after 3.5 h. Additionally, no 2-methylfuran was detected by the end of the reaction. A similar trend was observed for furfural alcohol selectivity; hence, selectivity has decreased by around 2.5 times over 18.5 h of reaction. The maximum furfural selectivity was achieved after 2.5 h of reaction, with a value of S = 5.5%. In addition to the production of furfural alcohol and 2-methylfuran, tetrahydrofurfuryl alcohol was also produced with S = 13.5% after 2.3 h of reaction. In addition, a reduction in tetrahydrofurfuryl alcohol selectivity was observed as the reaction time increased, reaching a minimum value of S = 1.7% after over 20 h. The maximum yield for 2-methylfuran production was also achieved after 2.5 h of reaction. After 3.5 h, 2-methylfuran yield decreased to Y = 1.17%.
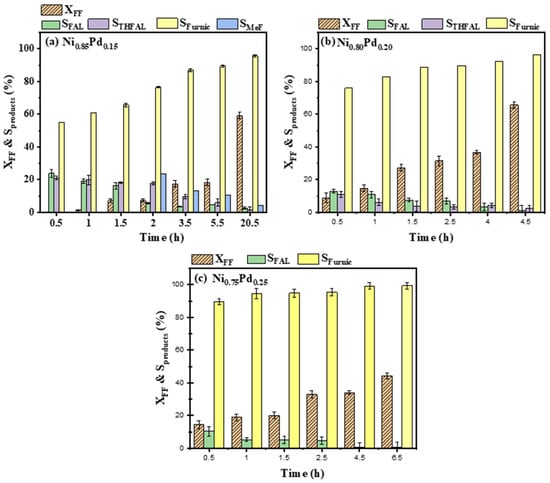
Figure 6.
Catalytic performance via furfural conversion (Xff) and products selectivity (Sproduct) of (a) Ni0.85Pd0.15, (b) Ni0.80Pd0.20, and (c) Ni0.75Pd0.25 for furfural hydrogenation.
The main advantage of FF ECH over catalytic hydrogenation (CH) is how the amniotic hydrogen is generated. In conventional hydrogenation processes, an external hydrogen gas supply is required to reduce FF, as shown in Equation (3). In comparison, the ECH of FF depends on the reduction of hydronium ions to produce atomic hydrogen using external electrons, as shown in Equation (4), where M represents the metal active site for hydrogen and (H)adsM is the adsorbed hydrogen. To achieve the conversion of FF, the adsorption of the unsaturated organic matter (FF) is followed by the hydrogenation of the adsorbed hydrogen and unsaturated organic compounds, as shown in Equation (5). Finally, hydrogenated products are desorbed and released into the electrolyte solution, as shown in Equations (6) and (7) [32], where Y = Z represents the unsaturated organic reactant, A is the adsorption site available for organic reactants to adsorb, (Y = Z)adsA stands for the adsorbed organic compound, and (YH−ZH)adsA represents the adsorbed hydrogenated compounds.
Furthermore, hydrogen (H2) is commonly produced during ECH reactions as a side product per the Tafel and Heyrovsky reactions, as shown in Equations (8) and (9). All previous reactions compete with the hydrogenation of FF and can significantly affect the system’s efficiency [33].
Similarly, the catalytic performance of the Ni0.80Pd0.20 electrodes was investigated over 4.5 h of reaction, as shown in Figure 6b. As the reaction time increased, furfural conversion increased as well. A furfural conversion of 27.2% was achieved after 1.5 h of reaction, and conversions of 36.8% and 65.7% were achieved after 4.0 and 4.5 h of reaction, respectively. A maximum selectivity of 5.8% was obtained after 4.5 h of reaction toward furfural alcohol production. The selectivity for furfural alcohol production was 1.3% and 3.2% after 1.5 and 4.0 h of reaction, respectively. At the same time, the selectivity for tetrahydrofurfuryl was 3.7% and 4.4% after 1.5 and 4.0 h, respectively.
Furthermore, the catalytic performance of the electrode with molar ratios of Ni0.75Pd0.25 was recorded over 7 h of reaction, as illustrated in Figure 6c. In a few minutes, furfural conversion of 19.1% was obtained and tetrahydrofurfuryl alcohol selectivity of 7.9% was observed. Likewise, catalytic performance increased as the reaction time increased, reaching a maximum value of 44.5% after 7 h. Although the maximum furfural conversion was recorded after 7 h of reaction, a significant drop in tetrahydrofurfuryl selectivity (from 7.9% to 0.7%) was observed.
After a prolonged electrolysis time, FFA gradually becomes the primary product, followed by small amounts of 2-methylfuran (2-MF), tetrahydrofurfuryl alcohol (THFFA), and 2-methyltetrahydrofuran (2-MTHF) [36]. A schematic representation of the reaction mechanism and formation of the products is shown in Figure 7. The increase in 2-methylfuran selectivity is significantly correlated with the decrease in furfural alcohol selectivity. In this case, 2-methylfuran is produced through the secondary reaction of furfural alcohol rather than directly from furfural [9]. In addition, alloyed nanoparticles contribute to higher catalytic activity. Their alloyed structures allow both active metals, Ni and Pd, to interact with FF.
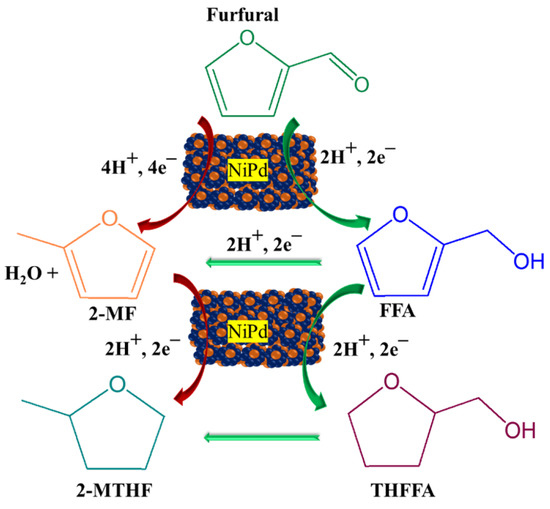
Figure 7.
Possible electrocatalytic hydrogenation pathway of furfural (FF) over NiPd electrocatalysts.
2.4. Varying Reaction Parameters
Electrolyte pH can significantly influence ECH reactions during furfural conversion and enhance selectivity towards certain furanic compounds, as shown in Figure 8a–c. The acidic electrolytes of pH 1 largely produce 2-methylfuran. Comparatively, only furfural alcohol and tetrahydrofurfuryl alcohol were detected when furfural conversions were conducted at pH 2 or 3. A reaction at pH 2 showed greater selectivity towards furfural alcohol after two hours (S = 82.1%). The increased selectivity for 2-methylfuran production at highly acidic conditions of pH of 1 indicates that e−/FF = 4 is the dominant process. As acidity is decreased, the e−/FF = 2 process dominates and results in an increased selectivity towards furfuryl alcohol, as depicted in Figure 7 [36,37]. Based on recent studies, the production of 2-methylfuran is limited to highly acidic conditions [38]. Similarly, upon investigating the impact of pH in this current work, 2-methylfuran was only observed at pH 1. As reported in the literature, increasing the electrolyte concentration causes an increase in the hydrogen ions concentration in the H-cell system, yet it can be detrimental to the ECH of furfural [39]. For electrocatalytic furfural conversion reactions, sufficient amounts of H and FF must be adsorbed on the active electrode surface. H and FF compete for electrode surface adsorption as the electrolyte pH changes. As the pH decreases, more H can adsorb on the electrode surface, resulting in fewer adsorption sites for FF [22]. HER is enhanced, as shown in Figure 8c, due to a reduction in furfural conversion. In addition, as the electrolyte pH is decreased, the abundance of Hads causes an over-hydrogenation of FF, shifting from e−/FF = 2 to e−/FF = 4, producing 2-MeF. The higher proton concentrations in lower electrolytes increase the selectivity of 2-MF during ECH.
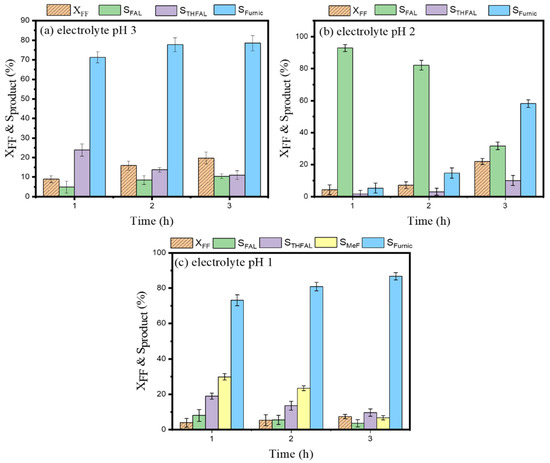
Figure 8.
Catalytic performance of Ni0.85Pd0.15 electrode with different pHs of (a) 3, (b) 2, and (c) 1.
The effects of varying applied potentials (−300, −650, and −800 mV) on furfural electrocatalytic hydrogenation were investigated using the Ni0.85Pd0.15 electrode. The maximum furfural conversion was observed at an applied potential of −300 mV over the first 3.5 h of the reaction. An FF conversion of 22.3% was achieved in 1 h and a conversion of 27.6% in 3 h. The lowest furfural conversion was obtained at an applied potential of −650 mV. However, after 3.5 h, the total furfural conversion was 7.3%. At a potential of –800 mV, a high furfural conversion of 26.5% was observed during the first 3 h of the reaction. Similarly, it was observed that varying applied potential affects product selectivity. Only tetrahydrofurfuryl alcohol was detected when the conversion was carried out for 3 h at an applied potential of −300 mV, where the maximum tetrahydrofurfuryl was X = 9.4%. Nonetheless, three different products were detected when the conversion was carried out for the first few hours of reaction at an applied potential of −650 mV. Both furfural alcohol and tetrahydrofurfuryl were detected with maximum selectivity of 5.5% and 13.5%, respectively. In addition, 2-methylfuran was detected at a potential of −650 mV. The selectivity for 2-methylfuran production was 23.4% after 2 h of reaction time. Therefore, the higher applied potential of −800 mV was required to produce furfuryl alcohol and tetrahydrofurfuryl alcohol with limited selectivity. The increase in FAL selectivity in the low potential range of −300 mV and −650 mV indicates that e−/FF = 2 is the dominant reaction, resulting in a high FAL yield [40]. However, an additional increase in applied potential (−800 mV) resulted in a reduction in furfural conversion, which is attributed to the HER competing reaction. Interestingly, the shift in selectivity at high potentials (−800 mV) suggests the formation of side products, such as hydrofluoric, thus reducing FAL and 2-MeF selectivity.
The effect of increasing furfural concentrations was investigated using electrochemical studies and conversion experiments in 3 M H2SO4 solution at a potential of −650 mV. Furfural conversion of 8.5% was achieved after 2 h of reaction using the Ni0.85Pd0.15 electrode. As the furfural concentration increased from 5 to 10 mmol, the furfural conversion increased from 9.97% to 17.44%. An increase in furfural conversion rate of 48.45% was observed when 20 mmol furfural was added. Further increases in FF concentration lead to the saturation of the conversion of FF due to limited electrocatalytic active sites. Hence, it is essential to have sufficient active sites to adsorb both reactants (H and FF) and to allow for FF hydrogenation reactions.
3. Materials and Methods
3.1. Synthesis of Ni-Pd Nanoalloys
The wet chemical method was followed to synthesize Ni-Pd alloy, as reported by Guo Y. [41] and as illustrated in Figure 1a. Ni0.75Pd0.25, Ni0.80Pd0.20, and Ni0.85Pd0.15 were prepared by dissolving predetermined amounts of palladium (II) nitrate hydrate (H2N2O7Pd, 99.99%), nickel (II) nitrate hexahydrates (Ni(NO3)2 6H2O, 99.99%), and 0.47 g of polyvinyl pyrrolidone (PVP) in 20 mL of deionized water and ethylene glycol. The mixture was stirred for 30 min, followed by gradual addition of a freshly prepared solution of sodium borohydride (0.08 g in 20 mL deionized water). Then, the mixture was centrifuged for 30 min and washed six times with ethanol. The nanoalloys were dried in a vacuum oven at 40 °C for 12 h.
3.2. Characterizations
The morphological and structural composition of the prepared alloys were analyzed using the scanning electron microscopy (SEM) model (JEOL JSM-7610F FEG-SEM) and transmission electron microscopy (TEM) model (Titan TEM 300 kV) with the SAED pattern. SEM with EDS to analyze the elemental composition of the samples. Crystallite size and the crystalline nature were analyzed by the X-ray diffractometer (XRD) using PANalytical Powder Diffractometer (Bruker D8 Focus, Model: PANalytical X’ pert PRO, PANalytical, Almelo, The Netherlands) with Cu-Kα radiation (λ = 1.5406, 40 kV, 40 mA). The peaks were observed in the 2θ range of 20–84°, with a step size of 0.02 degrees.
3.3. Electrohydrogenation of Furfural
Electrochemical studies were performed to determine the electrocatalytic behavior of the prepared alloys. Electrocatalytic studies were conducted using a three-electrode setup connected to a Biologic VMP-300 electrochemical station. Several electrodes were fabricated for Ni0.75Pd0.25, Ni0.80Pd0.20, and Ni0.85Pd0.15 samples via preparing an ink by mixing 1 mL of NMP as a solvent, 5% PVDF as the binder, 5% carbon black, and 90% of the active material. Ink layers were applied on conductive graphite sheets and dried in an oven. In the H-cell setup, platinum was used as a reference electrode, and SCE was used as the counter electrode. Linear sweep voltammetry (LSV) was run at a fixed scan rate of 20 mV/s with a potential range of 0 to −1.6 V using 10 mmol furfural in 3 M Na2SO4 solution with a mixture of 40% by volume of acetonitrile and 60% deionized water. Several CV runs were recorded using various furfural concentrations (4–20 mmol FF) to optimize the reaction conditions. Additionally, the relationship between reaction time and furfural conversion was examined by running conversion experiments over increased reaction durations. Moreover, the impact of varying electrolyte pH, applied potential, and initial furfural concentration on furfural conversion and product selectivity was also examined.
3.4. Paired Electrolysis Cell
The H-cell setup consisted of two chambers separated by a proton exchange membrane (Nafion membrane), the cathodic chamber containing 3 M H2SO4 solution, and the anodic chamber containing 3 M Na2SO4. A working electrode was used in both chambers to allow furfural to be oxidized and reduced simultaneously. The linear sweep voltammetry was performed with an electrolyte composition of 40% acetonitrile and 60% water at an applied potential of −650 mV under optimized conditions.
3.5. Product Identification and Quantification
Samples were collected every 20 min from reaction chambers to identify the products. The samples were filtered and diluted with acetonitrile before HPLC analysis using Aglient Technologies 1260 at 210 nm. The HPLC column (Phenomenex Inc., Gemini C18, 3 um 110 A, USA) was operated at 45 ℃ with a binary gradient method containing water and CH3CN at 0.6 mL/min. The CH3CN fraction was increased from an initial 15% (v/v) to 60% during 5 to 15 min and then was decreased to 15% from 17 to 24 min. The products were identified by comparing the analyses of standard samples of furfural, furfuryl alcohol, 2-methylfuran, and tetrahydrofurfuryl alcohol.
The electrocatalytic performance was evaluated by calculating the percent conversion of furfural, percentage yield of furfuryl alcohol, and 2-methylfuran for the electrocatalytic reaction using Equations (10)–(12):
4. Conclusions
Ni(1−x)Pdx (x = 0.15, 0.20, and 0.25) alloyed nanostructures were successfully prepared and used to convert furfural into value-added chemicals. In order to gain insight into their structure, composition, morphology, crystallinity, and purity, the synthesized nanoalloys were characterized using XRD, SEM, EDS, and TEM techniques. XRD and EDS results confirmed the formation of pure Ni(1−x)Pdx alloys without impurities. TEM and SEM analysis revealed that all samples contained spherical particles. Ni0.80Pd0.20 was the most effective electrocatalyst for the conversion of furfural. Furthermore, 2-methylfuran was produced under optimized conditions of −650 mV potential, pH 1, and 10 mmol furfural with a high selectivity of 23.4% using Ni0.85Pd0.15. The furfural electrocatalytic conversion process is highly dependent on numerous factors and reaction conditions, such as catalyst composition, initial furfural concentration, applied potential, electrolyte composition, electrolyte pH, and reaction time. Furthermore, furfural conversion efficiency and product selectivity were tuned by varying the applied potential and furfural concentration. This study demonstrated that Ni0.85Pd0.15 is a potential candidate for the selective production of 2-methylfuran and other biofuel compounds from furfural.
Supplementary Materials
The following supporting information can be downloaded at: https://www.mdpi.com/article/10.3390/catal13020260/s1, Figure S1: EDS spectra for synthesized sample of Ni0.75Pd0.25; Figure S2: (a) EIS fitted curve for Ni0.85Pd0.15 electrodes in acidic electrolyte with furfural (b) electrical equivalent circuit used to fit Ni0.85Pd0.15 electrode EIS curve; Figure S3: Linear sweep voltammetry for NiPd electrodes at 5 mVs−1 without furfural (a) and with furfural (b); Figure S4: (a) HPLC spectra for Ni0.85Pd0.15 collected after 0.5 hours of reaction. (b) HPLC spectra for Ni0.85Pd0.15 collected after 0.5 hours of reaction.
Author Contributions
Conceptualization, B.G. and F.B.; methodology, B.G.; software, A.A.; validation, M.A.S., B.G. and I.O.; formal analysis, A.A.; investigation, B.G.; resources, F.B.; data curation, A.A.; writing—original draft preparation, A.A. and B.G.; writing—review and editing, B.G., M.A.H. and F.B.; visualization, B.G.; supervision, M.A.H. and B.G.; project administration, F.B.; funding acquisition, F.B. All authors have read and agreed to the published version of the manuscript.
Funding
This study was financially supported by Khalifa University of Science and Technology, Abu Dhabi, through an internal grant CIRA-2018-27 and CIRA-2020-085.
Institutional Review Board Statement
Not applicable.
Informed Consent Statement
Not applicable.
Data Availability Statement
Data available on request.
Acknowledgments
We thank the support of Khalifa University, which provided research specialties and financial support through CIRA-200-085.
Conflicts of Interest
The authors declare no conflict of interest.
References
- Bababrik, R.; Santhanaraj, D.; Resasco, D.E.; Wang, B. A comparative study of thermal- and electrocatalytic conversion of furfural: Methylfuran as a primary and major product. J. Appl. Electrochem. 2021, 51, 19–26. [Google Scholar] [CrossRef]
- Yiyue, Z.; Mengke, C.; Jiahui, X.; Yamei, S.; Guangqin, L. Recent advances in the electrocatalytic synthesis of 2,5-furandicarboxylic acid from 5-(hydroxymethyl)furfural. J. Mater. Chem. A 2021, 9, 20164–20183. [Google Scholar]
- Jung, S.; Biddinger, E.J. Controlling Competitive Side Reactions in the Electrochemical Upgrading of Furfural to Biofuel. Energy Technol. 2018, 6, 1370–1379. (In English) [Google Scholar] [CrossRef]
- Frontana-Uribe, B.A.; Little, R.D.; Ibanez, J.G.; Vasquez-Medrano, R.; Palma, A. Organic electrosynthesis: A promising green methodology in organic chemistry. Green Chem. 2010, 12, 2099–2119. (In English) [Google Scholar] [CrossRef]
- Biddinger, E.J.; Gutierrez, O.Y.; Holladay, J. Electrochemical routes for biomass conversion. J. Appl. Electrochem. 2021, 51, 1–3. [Google Scholar] [CrossRef]
- Luthra, R.; Datta, S.; Roy, A.; Ghotekar, S.; Bilal, M. Application of Nanotechnology in Production of Biofuel (Clean Energy Production Technologies.); Springer Nature Singapore: Singapore, 2022; pp. 269–285. [Google Scholar]
- Nikul’shin, P.A.; Ershov, M.A.; Grigor’yeva, E.V.; Tarazanov, S.V.; Kuznetsova, S.N.; Repina, O.V. Furfural Derivatives as Fuel Components. Chem. Technol. Fuels Oils 2020, 55, 720–725. [Google Scholar] [CrossRef]
- Mariscal, R.; Maireles-Torres, P.; Ojeda, M.; Sadaba, I.; Granados, M.L. Furfural: A renewable and versatile platform molecule for the synthesis of chemicals and fuels. Energy Environ. Sci. 2016, 9, 1144–1189. [Google Scholar] [CrossRef]
- Delima, R.S.; Stankovic, M.D.; MacLeod, B.P.; Fink, A.G.; Rooney, M.B.; Huang, A.; Jansonius, R.P.; Dvorak, D.J.; Berlinguette, C.P. Selective hydrogenation of furfural using a membrane reactor. Energy Environ. Sci. 2022, 15, 215–224. [Google Scholar] [CrossRef]
- RNtimbani, N.; Farzad, S.; Görgens, J.F. Techno-economics of one-stage and two-stage furfural production integrated with ethanol co-production from sugarcane lignocelluloses. Biofuels Bioprod. Biorefin. 2021, 15, 1900–1911. [Google Scholar] [CrossRef]
- Kapanji, K.K.; Haigh, K.F.; Görgens, J.F. Techno-economics of lignocellulose biorefineries at South African sugar mills using the biofine process to co-produce levulinic acid, furfural and electricity along with gamma valeractone. Biomass Bioenergy 2021, 146, 106008. [Google Scholar] [CrossRef]
- Slak, J.; Pomeroy, B.; Kostyniuk, A.; Grilc, M.; Likozar, B. A review of bio-refining process intensification in catalytic conversion reactions, separations and purifications of hydroxymethylfurfural (HMF) and furfural. Chem. Eng. J. 2022, 429, 132325. [Google Scholar] [CrossRef]
- Wang, Y.; Gao, T.; Lu, Y.; Wang, Y.; Cao, Q.; Fang, W. Efficient hydrogenation of furfural to furfuryl alcohol by magnetically recoverable RuCo bimetallic catalyst. Green Energy Environ. 2022, 7, 275–287. [Google Scholar] [CrossRef]
- Gao, G.; Remón, J.; Jiang, Z.; Yao, L.; Hu, C. Selective hydrogenation of furfural to furfuryl alcohol in water under mild conditions over a hydrotalcite-derived Pt-based catalyst. Appl. Catal. B Environ. 2022, 309, 121260. [Google Scholar] [CrossRef]
- Ouyang, W.; Yepez, A.; Romero, A.A.; Luque, R. Towards industrial furfural conversion: Selectivity and stability of palladium and platinum catalysts under continuous flow regime. Catal. Today 2018, 308, 32–37. [Google Scholar] [CrossRef]
- Nan, X.; Jing, G.; Zuohua, H. Review on the production methods and fundamental combustion characteristics of furan derivatives. Renew. Sustain. Energy Rev. 2016, 54, 1189–1211. [Google Scholar]
- Jung, S.; Biddinger, E.J. Electrocatalytic Hydrogenation and Hydrogenolysis of Furfural and the Impact of Homogeneous Side Reactions of Furanic Compounds in Acidic Electrolytes. ACS Sustain. Chem. Eng. 2016, 4, 6500–6508. (In English) [Google Scholar] [CrossRef]
- Li, Z.; Kelkar, S.; Lam, C.H.; Luczek, K.; Jackson, J.; Miller, D.J.; Saffron, C.M. Aqueous electrocatalytic hydrogenation of furfural using a sacrificial anode. Electrochim. Acta 2012, 64, 87–93. [Google Scholar] [CrossRef]
- Bharath, G.; Hai, A.; Rambabu, K.; Banat, F.; Jayaraman, R.; Taher, H.; Bastidas-Oyanedel, J.-R.; Ashraf, M.T.; Schmidt, J.E. Systematic production and characterization of pyrolysis-oil from date tree wastes for bio-fuel applications. Biomass Bioenergy 2020, 135, 105523. [Google Scholar] [CrossRef]
- Lopez-Ruiz, J.A.; Andrews, E.M.; Akhade, S.A.; Lee, M.-S.; Koh, K.; Sanyal, U.; Yuk, S.F.; Karkamkar, A.J.; Derewinski, M.A.; Holladay, J.; et al. Understanding the Role of Metal and Molecular Structure on the Electrocatalytic Hydrogenation of Oxygenated Organic Compounds. ACS Catal. 2019, 9, 9964–9972. [Google Scholar] [CrossRef]
- Zhang, X.; Han, M.; Liu, G.; Wang, G.; Zhang, Y.; Zhang, H.; Zhao, H. Simultaneously high-rate furfural hydrogenation and oxidation upgrading on nanostructured transition metal phosphides through electrocatalytic conversion at ambient conditions. Appl. Catal. B Environ. 2019, 244, 899–908. [Google Scholar] [CrossRef]
- Bharath, G.; Rambabu, K.; Hai, A.; Banat, F.; Rajendran, S.; Dionysiou, D.D.; Show, P.L. High-performance and stable Ru-Pd nanosphere catalyst supported on two-dimensional boron nitride nanosheets for the hydrogenation of furfural via water-mediated protonation. Fuel 2021, 290, 312–324. [Google Scholar] [CrossRef]
- Parupudi, A.; Mulagapati, S.H.R.; Subramony, J.A. Chapter 1—Nanoparticle technologies: Recent state of the art and emerging opportunities. In Nanoparticle Therapeutics; Kesharwani, P., Singh, K.K., Eds.; Academic Press: Cambridge, MA, USA, 2022; pp. 3–46. [Google Scholar]
- Jung, S.; Karaiskakis, A.N.; Biddinger, E.J. Enhanced activity for electrochemical hydrogenation and hydrogenolysis of furfural to biofuel using electrodeposited Cu catalysts. Catal. Today 2019, 323, 26–34. [Google Scholar] [CrossRef]
- Zhao, B.; Chen, M.; Guo, Q.; Fu, Y. Electrocatalytic hydrogenation of furfural to furfuryl alcohol using platinum supported on activated carbon fibers. Electrochim. Acta 2014, 135, 139–146. [Google Scholar] [CrossRef]
- Barnard, N.C.; Brown, S.G.R.; Devred, F.; Bakker, J.W.; Nieuwenhuys, B.E.; Adkins, N.J. A quantitative investigation of the structure of Raney-Ni catalyst material using both computer simulation and experimental measurements. J. Catal. 2011, 281, 300–308. (In English) [Google Scholar] [CrossRef]
- Pisarek, M.; Łukaszewski, M.; Kedzierzawski, P.; Janik-Czachor, M.; Winiarek, P. Influence of Cr addition to Raney Ni catalyst on hydrogenation of isophorone. Catal. Commun. 2008, 10, 213–216. (In English) [Google Scholar] [CrossRef]
- Shan, S.; Petkov, V.; Yang, L.; Luo, J.; Joseph, P.; Mayzel, D.; Prasai, B.; Wang, L.; Engelhard, M.; Zhong, C.-J. Atomic-structural synergy for catalytic CO oxidation over palladium–nickel nanoalloys. J. Am. Chem. Soc. 2014, 136, 7140–7151. [Google Scholar] [CrossRef]
- Govindan, B.; Madhu, R.; Haija, M.A.; Kusmartsev, F.V.; Banat, F. Pd-Decorated 2D MXene (2D Ti3C2Tix) as a High-Performance Electrocatalyst for Reduction of Carbon Dioxide into Fuels toward Climate Change Mitigation. Catalysts 2022, 12, 1180. [Google Scholar] [CrossRef]
- Huang, H.; Zhao, Y.; Bai, Y.; Li, F.; Zhang, Y.; Chen, Y. Conductive metal–organic frameworks with extra metallic sites as an efficient electrocatalyst for the hydrogen evolution reaction. Adv. Sci. 2020, 7, 2000012. [Google Scholar] [CrossRef]
- Lee, K.; Kang, S.W.; Lee, S.-U.; Park, K.-H.; Lee, Y.W.; Han, S.W. One-pot synthesis of monodisperse 5 nm Pd–Ni nanoalloys for electrocatalytic ethanol oxidation. ACS Appl. Mater. Interfaces 2012, 4, 4208–4214. [Google Scholar] [CrossRef]
- Sabri, M.A.; Bharath, G.; Hai, A.; Haija, M.A.; Nogueira, R.P.; Banat, F. Synthesis of molybdenum-cobalt nanoparticles decorated on date seed-derived activated carbon for the simultaneous electrochemical hydrogenation and oxidation of furfural into fuels. Fuel Process. Technol. 2022, 238, 107525. [Google Scholar] [CrossRef]
- Pham, H.Q.; Huynh, T.T. Facile room-temperature fabrication of a silver–platinum nanocoral catalyst towards hydrogen evolution and methanol electro-oxidation. Mater. Adv. 2022, 3, 1609–1616. [Google Scholar] [CrossRef]
- de Levie, R. On porous electrodes in electrolyte solutions: I. Capacitance effects. Electrochim. Acta 1963, 8, 751–780. [Google Scholar] [CrossRef]
- Reséndiz-Ramírez, R.; Rodríguez-López, A.; Díaz-Real, J.A.; Delgado-Arenas, H.F.; Osornio-Villa, A.; Hernández-Leos, R.; Vivier, V.; Antaño-López, R. Reaction Mechanisms of the Electrosynthesis of Magnetite Nanoparticles Studied by Electrochemical Impedance Spectroscopy. ACS Omega 2021, 7, 761–772. [Google Scholar] [CrossRef]
- Bharath, G.; Banat, F. High-Grade Biofuel Synthesis from Paired Electrohydrogenation and Electrooxidation of Furfural Using Symmetric Ru/Reduced Graphene Oxide Electrodes. ACS Appl. Mater. Interfaces 2021, 13, 24643–24653. [Google Scholar] [CrossRef]
- Wang, B.; Li, C.; He, B.; Qi, J.; Liang, C. Highly stable and selective Ru/NiFe2O4 catalysts for transfer hydrogenation of biomass-derived furfural to 2-methylfuran. J. Energy Chem. 2017, 26, 799–807. [Google Scholar] [CrossRef]
- May, A.S.; Biddinger, E.J. Strategies to Control Electrochemical Hydrogenation and Hydrogenolysis of Furfural and Minimize Undesired Side Reactions. ACS Catal. 2020, 10, 3212–3221. (In English) [Google Scholar] [CrossRef]
- Andrews, E.; Lopez-Ruiz, J.A.; Egbert, J.D.; Koh, K.; Sanyal, U.; Song, M.; Li, D.; Karkamkar, A.J.; Derewinski, M.A.; E Holladay, J.; et al. Performance of Base and Noble Metals for Electrocatalytic Hydrogenation of Bio-Oil-Derived Oxygenated Compounds. ACS Sustain. Chem. Eng. 2020, 8, 4407–4418. [Google Scholar] [CrossRef]
- Zhang, P.; Sheng, X.; Chen, X.; Fang, Z.; Jiang, J.; Wang, M.; Li, F.; Fan, L.; Ren, Y.; Zhang, B.; et al. Paired Electrocatalytic Oxygenation and Hydrogenation of Organic Substrates with Water as the Oxygen and Hydrogen Source. Angew. Chem. Int. Ed. 2019, 58, 9155–9159. [Google Scholar] [CrossRef]
- Guo, Y.; Chen, Z.; Rioux, R.M.; Savage, P.E. Hydrothermal reaction of tryptophan over Ni-based bimetallic catalysts. J. Supercrit. Fluids 2019, 143, 336–345. [Google Scholar] [CrossRef]


Disclaimer/Publisher’s Note: The statements, opinions and data contained in all publications are solely those of the individual author(s) and contributor(s) and not of MDPI and/or the editor(s). MDPI and/or the editor(s) disclaim responsibility for any injury to people or property resulting from any ideas, methods, instructions or products referred to in the content. |
© 2023 by the authors. Licensee MDPI, Basel, Switzerland. This article is an open access article distributed under the terms and conditions of the Creative Commons Attribution (CC BY) license (https://creativecommons.org/licenses/by/4.0/).