Article

Green Synthesis of CuO-TiO2 Nanoparticles for the Degradation of Organic Pollutants: Physical, Optical and Electrochemical Properties

by
Dineo A. Bopape
1,
Sarah Mathobela
1,
Nolubabalo Matinise
2,
David E. Motaung
3 and
Nomso C. Hintsho-Mbita
1,*
1
Department of Chemistry, University of Limpopo, Mankweng 0727, South Africa
2
Uneso-Unisa Africa Chair in Nanoscience and Nanotechnology, College of Graduate Studies Department, University of South Africa, Pretoria 0002, South Africa
3
Department of Physics, University of Limpopo, Mankweng 0727, South Africa
*
Author to whom correspondence should be addressed.
Catalysts 2023, 13(1), 163; https://doi.org/10.3390/catal13010163
Submission received: 3 November 2022 / Revised: 12 December 2022 / Accepted: 17 December 2022 / Published: 10 January 2023
(This article belongs to the Special Issue Structured Semiconductors in Photocatalysis)

Abstract

:
CuO-TiO2 nanocomposites were successfully synthesized using the C. benghalensis plant extracts. The effect of the composition of CuO to TiO2 on the morphological, optical, electrochemical, and photodegradation efficiency in the composites was studied. SEM, XRD, UV-vis, FTIR, TGA, BET, and CV were used to characterize these materials. The XRD data reported the tenorite structure of the CuO and the anatase phase of the TiO2. SEM showed the spherical morphologies for all the CuO-TiO2 NPs, and these were also mesoporous in nature, as depicted by BET. The voltammogram of the CuO-TiO2 30/70 electrode showed a higher response current density compared to the other two samples, suggesting a higher specific capacitance. Upon testing the photocatalytic efficiencies of the CuO-TiO2 nanocomposites against methylene blue (MB), ciprofloxacin (CIP), and sulfisoxazole (SSX), the highest degradation of 94% was recorded for SSX using the CuO-TiO2 30/70 nanocomposites. Hydroxyl radicals were the primary species responsible for the photodegradation of SSX, and the material could be reused once. The most active species in the photodegradation of SSX has been identified as OH•. From this study, it can be noted that the CuO-TiO2 nanocomposites were more selective toward the degradation of antibiotics (sulfisoxazole and ciproflaxin) as compared to dyes (methylene blue).

1. Introduction

Water pollution is one of South Africa’s most serious environmental problems, adding to the water scarcity the country is facing [1,2,3]. Despite this, contaminants such as dyes and antibiotics are being detected in natural water sources, and the number of contaminants detected has increased in recent years as new emerging pollutants are reported each year [4,5]. The textile sector contributes significantly to water pollution in the environment by dumping dye-bearing waste effluents [6,7,8,9]. Even at low concentrations, the presence of these dyes (which can be anionic, cationic, or non-ionic) in water is highly apparent and undesired [10]. Humans can be exposed to these toxic dyes through direct or indirect consumption of polluted water via the food chain [11]. The after effect has been reported to be mutagenic to human health and damaging to the aquatic ecology [12].
Methylene blue (MB) is a cationic dye that has been classified as a toxic colorant [11]. This pollutant is non-biodegradable due to its complex aromatic composition, and it damages septic tanks during wastewater treatment [13].
Sulfisoxazole (SSX) is an endothelin receptor antagonist that protects retinal neurons against ischemia/reperfusion and lipopolysaccharide damage [14]. On the other hand, excessive usage of SSX may leave traces of the medicine in animal products [15]. However, wastewater treatment plants that treat pharmaceutical wastes transfer the SSX into freshwater environments [14]. SSX residues in the aquatic environment may cause allergic responses, drug resistance, and endocrine problems [16].
Ciprofloxacin (CIP) is the most commonly prescribed fluoroquinolone antibiotic [17,18]. CIP is effective against a wide range of Gram-negative and Gram-positive bacteria and is one of the emerging pharmaceutical contaminants found in water [17,18,19]. It is often found in the environment and has been demonstrated to be genotoxic and it is a primary metabolite of enrofloxacin, a popular fluoroquinolone used in veterinary medicine [18]. CIP is also difficult to completely remove using conventional treatment methods [18,19]. Thus, some of the CIP has remained in the water following treatment in concentrations measured in parts per million (g/mL) or even parts per billion (ng/mL), its unpredictable toxicological effects have sparked growing concern [20]. As a result, there is a strong need to develop materials that can remove various pollutants such as MB, SSX, and CIP from effluents before they are discharged into freshwater systems [13,14,15,16,17,18,19].
Several methods such as adsorption, electrocoagulation, and membrane filtration have been used for the elimination of these pollutants in wastewater streams [11,14,18]. Most of these approaches have drawbacks such as excessive sludge generation, formation of by-products, high operational costs, and poor selectivity, thus researchers are moving toward Advanced Oxidation Processes in particular the photocatalysis process as its been shown to be an efficient method for the degradation of multiple pollutants. However, in the treatment of organic MB, SSX, and CIP, these approaches fall short of the dye wastewater discharge criteria. Given the current environmental issues, finding a cost-effective and environmentally friendly technique to breaking down organic contaminants is critical [21,22,23].
Metal oxide semiconductor catalysts have received much press in recent years because of their capacity to convert solar energy and clean up pollution [24]. The process of photocatalytic degradation using metal oxides is frequently utilized in water treatment due to its efficacy in removing pollutants and has no secondary pollution [24,25]. Researchers are currently focusing on metal oxide nanostructured composites due to their unique features, such as a high surface to volume ratio and quantum confinement effects [22]. Various metal oxides such as ZnO, CuO, NiO, TiO2, etc., are highly explored but nanosized transition metal oxides, such as copper oxide (CuO) and titanium oxide (TiO2), have attracted scientific interest due to their potential applications in medicine, sensing, catalysis, etc. [22,24,26]. CuO has gained much attention among transition metal oxides because of its intriguing photochemical and photomagnetic capabilities [26]. It is a photoconductive p-type semiconductor with a narrow bandgap (1.2 eV) and has been used in a variety of applications in gas sensing, catalysis, super capacitors, and field emission, to name a few [24,27]. CuO has a monoclinic structure and is employed in a variety of device fabrication units depending on its properties [22]. It is one of the most important catalysts used to remove industrial effluents from the environment [21].
On the other hand, TiO2 is an n-type semiconductor with a large band gap that ranges from 3.2 to 3.6 eV and it is widely used in cosmetics, coatings for paper and medical devices, as well as gas sensors [24]. Although TiO2 is a promising material for photocatalytic applications, its wide bandgap energy of 3.2 eV limits its absorption to UV light at גmax = 365–387 nm [23,25,28]. It was recorded that TiO2 can only utilize 5–8% of the UV light and for the vis light it was recorded to be relatively low [6,25,29]. One significant benefit is that when TiO2 reacts with another metal oxide, it forms heterojunctions [22,24,29]. However, metal doping of TiO2 has a low thermal stability and is prone to photo corrosion [25]. CuO has been frequently employed to enhance the photocatalytic properties of TiO2 [25,26,27]. This is because it can reduce the photogenerated electrons and holes from recombining while simultaneously lowering the energy of the band gap [24,25,26,27,28]. The disadvantage with the synthesis of such CuO-TiO2 nanocomposite, is the use of harmful chemicals. Thus, it is critical to synthesize CuO-TiO2 nanocomposites using a simple, eco-friendly, and cost-effective method that does not require the use of hazardous reagents. In recent years, the synthesis of CuO-TiO2 using biological methods such as plant extracts has sparked considerable interest in the field of nanotechnology [30]. Some of the required properties in these materials have been reported to have been added from bimetal oxides synthesized from plant extracts, microorganisms, and enzymes. Plant-mediated nanocomposites for example, can be used to degrade a wider range of pollutants, such as pharmaceutical and dyes strains, due to the phytochemicals they contain.
Various studies have been conducted on the photodegradation of organic pollutants using the green-derived CuO/TiO2 nanocomposites. Lu et al. [29] prepared the CuO/TiO2 nanocomposite. In their study, UV light was irradiated and 100% of phenol was degraded after 80 min. Approximately, 98 and 88% of MB and MO, respectively, was degraded by CuO/TiO2 nanocomposite after 150 min irradiation by Khodadadi et al. [30]. Based on the previous studies discussed, the photocatalytic efficiency of TiO2 were improved by coupling the material with CuO. Hence there is a need to prepare the CuO-TiO2 nanocomposites as photocatalyst semiconductors.
In this study various ratios of CuO-TiO2 nanocomposites were synthesized using the Commelina benghalensis (C. benghalensis) plant extracts for the first time. The plant is rich in phytochemicals that can act as trapping and capping agents during bimetallic synthesis [25]. The physical, optical, surface, and electrochemical properties were investigated. The effect of the different compositions of the photocatalysts were also explored for the degradation of various pollutants, methylene blue, ciprofloxacin, and sulfisoxazole.

2. Results and Discussions

2.1. FTIR Characterization

Figure 1a,b shows the IR spectrum of the C. benghalensis plant extract, CuO, TiO2-NPs, and CuO-TiO2 nanocomposites. An intense band at 1641 cm−1 for C. benghalensis extracts was noted. This corresponds to the amide band, which is caused by a carbonyl stretch and N-H deformation vibrations in the amide linkage of C. benghalensis proteins [31]. These could be from alkaloids and tannins, which were identified from this plant, both of which are known to be stabilizing and reducing agents [32,33]. For the CuO-NPs, a Cu-O bond vibration at around 516, 832, and 1052 cm−1, which shows the formation of the CuO metal oxide, was noted [29,34]. The hydroxyl groups (–OH) from the C. benghalensis plant extract were responsible for the absorption bands at 1663 cm−1 (bending mode) and 3388 cm−1 (stretching mode), whereas the Cu-O stretching vibration mode was responsible for the formation of the absorption bands at 510, 832, and 1052 cm−1 [35,36]. Peaks associated with the bending and stretching vibrations of hydroxyl groups (OH) were seen in CuO-TiO2 samples at ~1651 and 3356 cm−1, respectively, and the Ti-O and Ti-O-Ti bands were also detected vibrating at 400–900 cm−1 [32]. In addition, when identifying the stretches of the composites (Figure 1b), a peak at 1376 cm−1 representing the stretching vibrations of Cu-O-Ti groups confirmed the presence of CuO structures on the surface of TiO2 nanoparticles [37,38]. This verifies the development of a chemical link at the CuO-TiO2 interface. The CuO-TiO2 nanocomposite at the 50/50 composition had more intense peaks, which corresponded to the C. benghalensis, CuO, and TiO2 peaks. The intensity of the peaks increased in the order CuO-TiO2 30–70 < CuO-TiO2 70–30 < CuO-TiO2 50–50. Table 1 shows the detailed peak formations of the compounds.

2.2. Optical Properties of CuO-TiO2 Nanocomposites

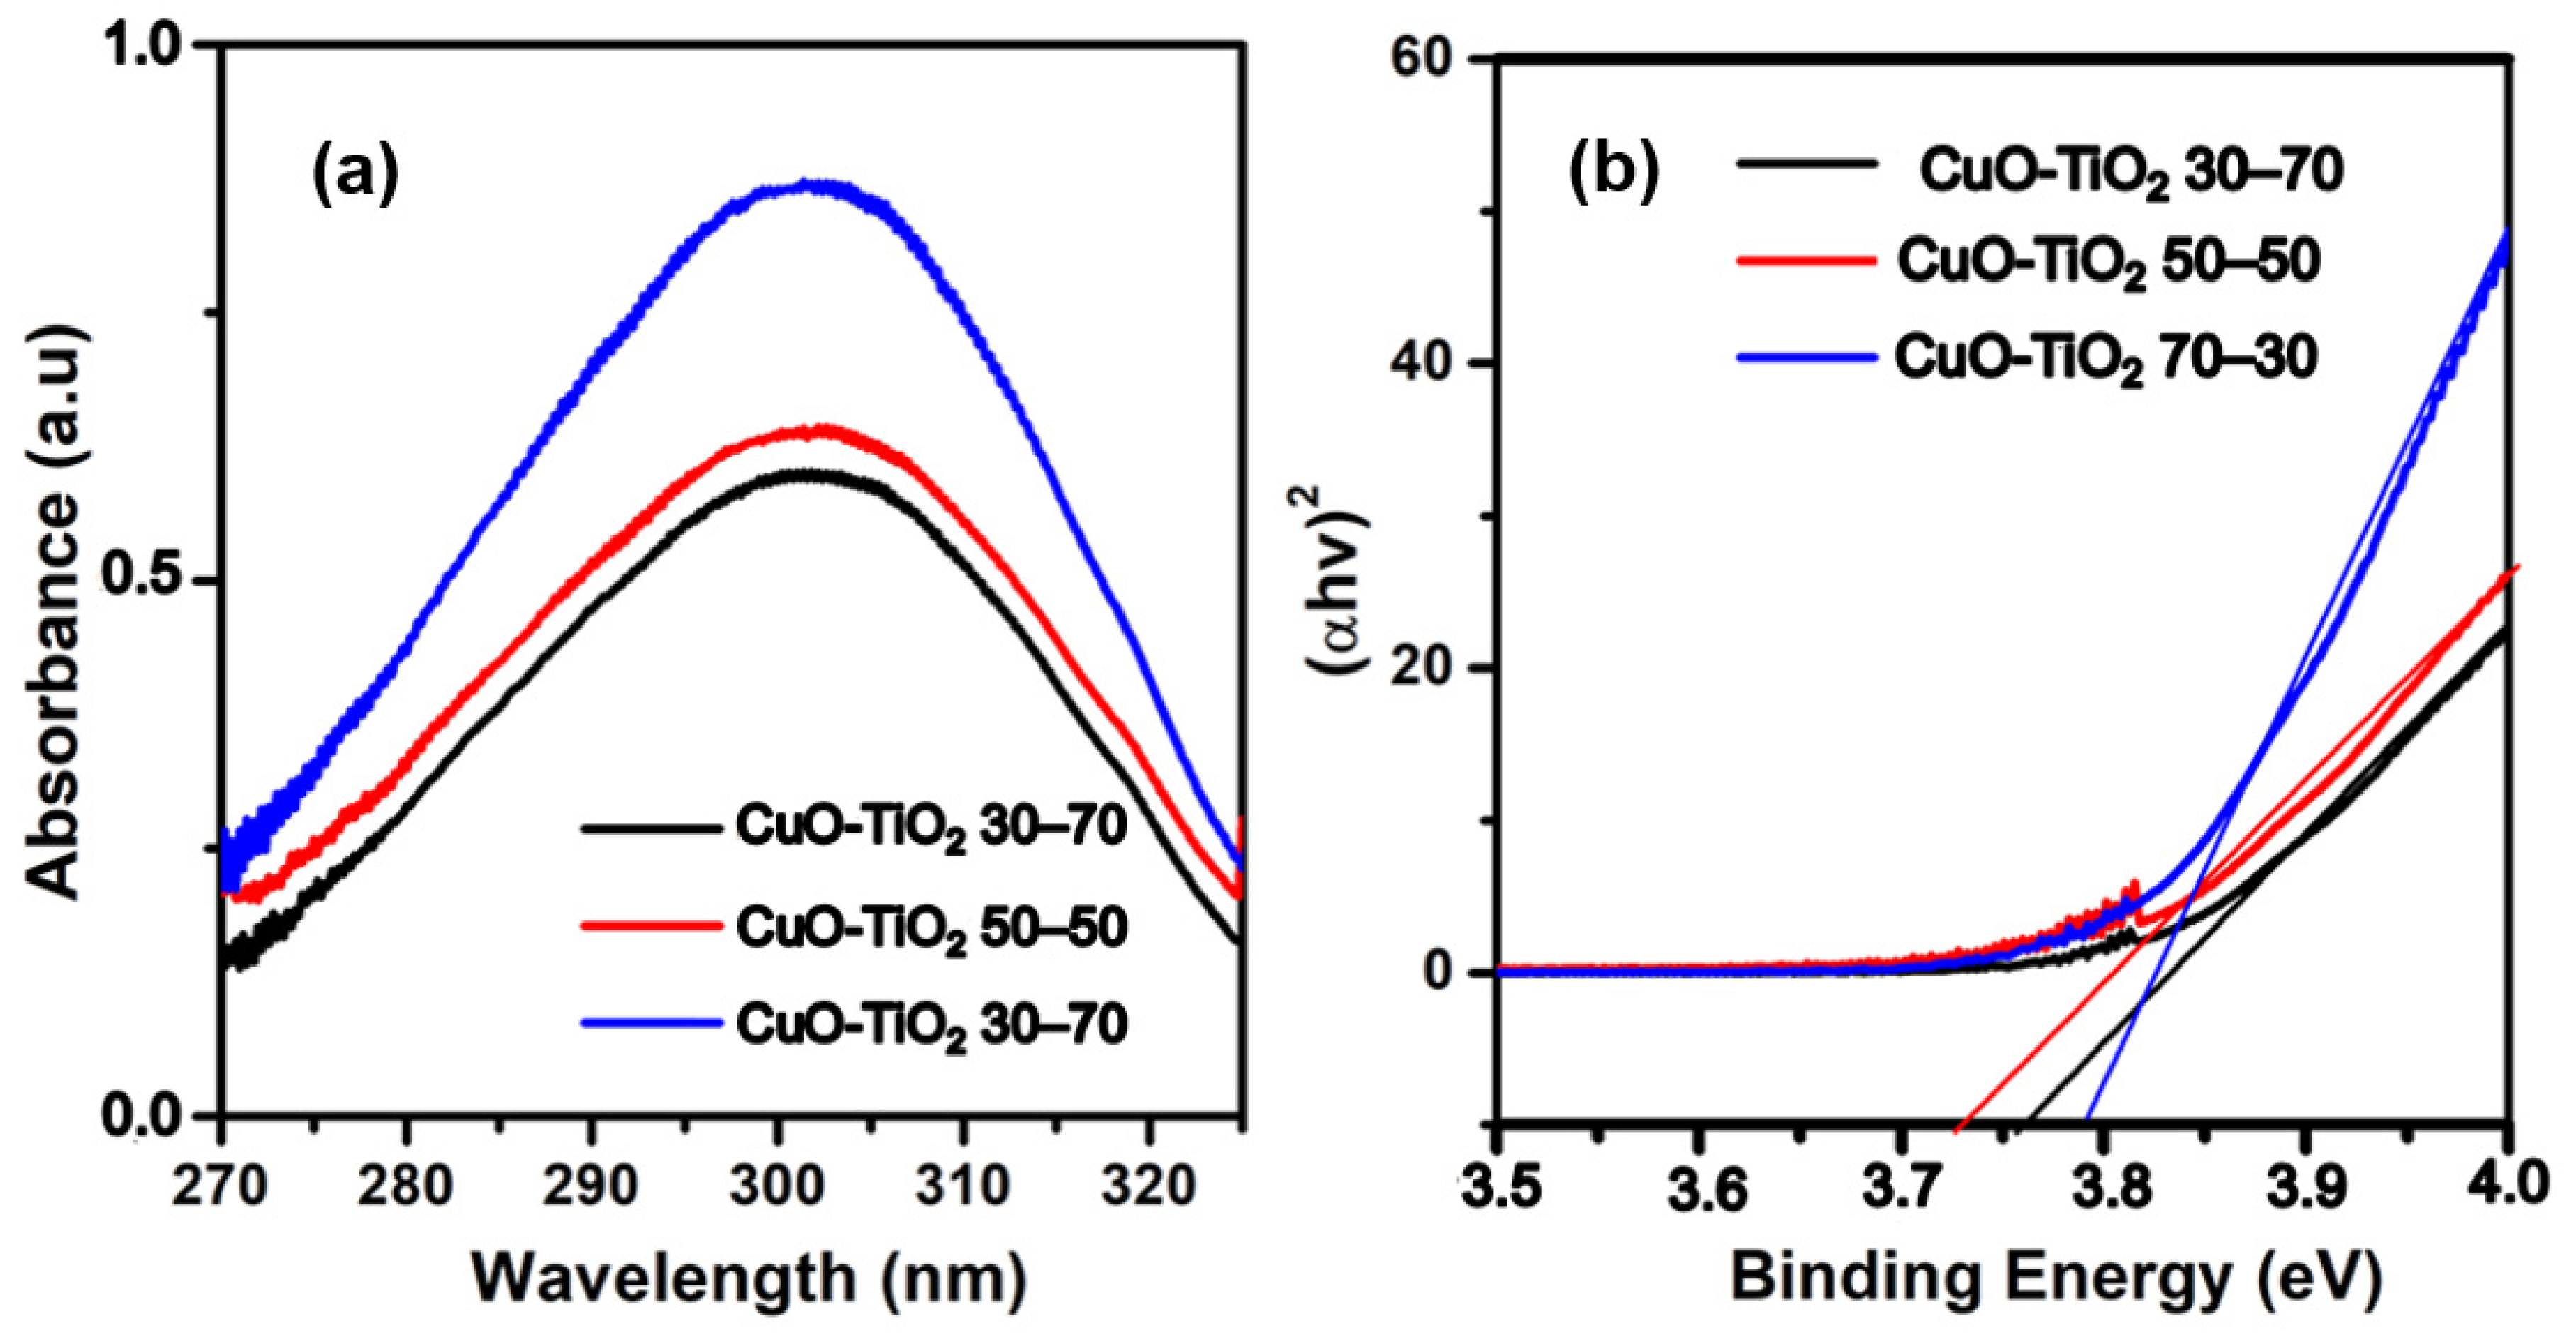
The UV-vis absorption spectra of CuO-TiO2 30/70, CuO-TiO2 50/50, and CuO-TiO2 70/30 were explored in Figure 2a to determine the properties of the material in the 200–800 nm spectrum. For all the CuO-TiO2 nanocomposites, the absorption band was found to be 301 nm. The intensity of the absorption peak increased with the composition of CuO on the TiO2 material. The adsorption edge of all the prepared samples was the same, indicating that CuO was deposited on the surface of TiO2 rather than doped into the TiO2 crystalline [39,40]. This absorbance band makes the CuO-TiO2 materials better photocatalysts in the visible light region. Zhang et al. [39] obtained an absorption band at 380 nm, whereas Shi et al. [40] obtained it at 385 nm, and Yu et al. [41] at 388 nm. When compared to the literature, it shows that the absorbance peaks of all green-synthesized CuO-TiO2 in this study were redshifted. This could be due to the difference in the synthetic process of the CuO-TiO2 nanocomposites. In this study, a plant extract of C. benghalensis was utilized as a reducing agent, as opposed to the NaOH, NaBH4, and C2H6O2 that was used by Zhang et al. [39], Shi et al. [40], and Yu et al. [41], respectively. The band gap energies (Eg) of materials were determined by extrapolating and intersecting the linear portion of absorbance to the energy axis [28]. The Eg values for the CuO-TiO2 30/70, CuO-TiO2 50/50, and CuO-TiO2 70–30 were found to be 3.76, 3.72, and 3.79 eV, respectively. The optical band gap energy (Eg) for all the CuO-TiO2 nanocomposites was calculated based on the absorption spectrum of the samples according to the equation of Eg = 1240/wavelength [23]. From the literature, Gnanasekaran et al. [35] obtained a band gap of 2.98 eV, Muzakki et al. [36] recorded 3.01 eV, and Chowdhury et al. [27] obtained 3.17 eV. These studies used NaOH and urea as reducing agents. Therefore, in this study, maybe due to the phytochemicals present in the C. benghalensis plant extract, which was used as a reducing and capping agent, may have led to the higher band gap values of the CuO-TiO2 nanocomposites.

2.3. Structural and Phase Composition Analysis

To obtain the structural properties, crystallite size, and phase composition of the nanocomposites, XRD analysis (Figure 3) was conducted. The XRD data of pure CuO were assigned with 2θ diffraction peaks at 35.6° (002), 38.9° (200), 48.65° (−202), 58.23° (202), 61.53° (−113), and 66.2° (−311) agreed to the JCPDS card no. 48-1548, which identified the tenorite structure of CuO [42,43,44]. The TiO2 was identified by the characteristic diffraction peaks at 25.3° (101), 36.9° (103), 37.8° (004), 48.05° (200), 53.9° (105), 62.12° (213), 68.7° (116), 70.311° (220), 75.03° (215), and 76.02° (301) corresponding to the anatase phase of TiO2 (according to the JCPD 21-1272) [44]. The relative broad peaks at 35.3°, 38.9°, and 48.37° were indexed to the diffraction of the TiO2 planes (103), (004), and (200), and CuO planes (−103), (200) and (−202) demonstrating that TiO2 and CuO coexist in the CuO-TiO2 heterojunction [45]. This is reasonable given that the anatase TiO2 lattice constants are identical to those of CuO. The intensity of the peaks of CuO and TiO2 decreased in the CuO-TiO2 bimetallic. It is interesting to note that the visibility of CuO peaks (plane −111 and 200) was more visible in the CuO-TiO2 (70/30) than the (30/70) and the TiO2 peaks (plane 101 and 200) were more intense in the CuO-TiO2 (30/70), vice versa. This showed the difference in the composition of the two metal oxides. Then on the TiO2-CuO (50/50), the peaks from both CuO and TiO2 were more intense and visible as compared to those of CuO-TiO2 (70/30) and CuO-TiO2 (30/70). These data corroborate with the FTIR data because the presence of Ti-O, Cu-O, and C-H. N-H peaks were also intense on the FTIR data for the 50/50 composition. The Scherrer Equation (2) was used to calculate the crystalline sizes of materials, and the sizes were found to be 17.03, 17.13, 39.72, 47.2, and 39.14 nm for the TiO2, CuO, and CuO-TiO2 30/70, 50/50, and 70/30, respectively. This demonstrates that the formation of the heterojunctions led to an increased crystallite sizes [41].
D = Kλ/β cos θ
where: K = Scherrer constant (i.e., 0.94),
  • λ = X-ray wavelength (0.154060 nm)
  • β = Full width at half-maximum of the (101) XRD peak
  • θ = The Bragg diffraction angle (degree).
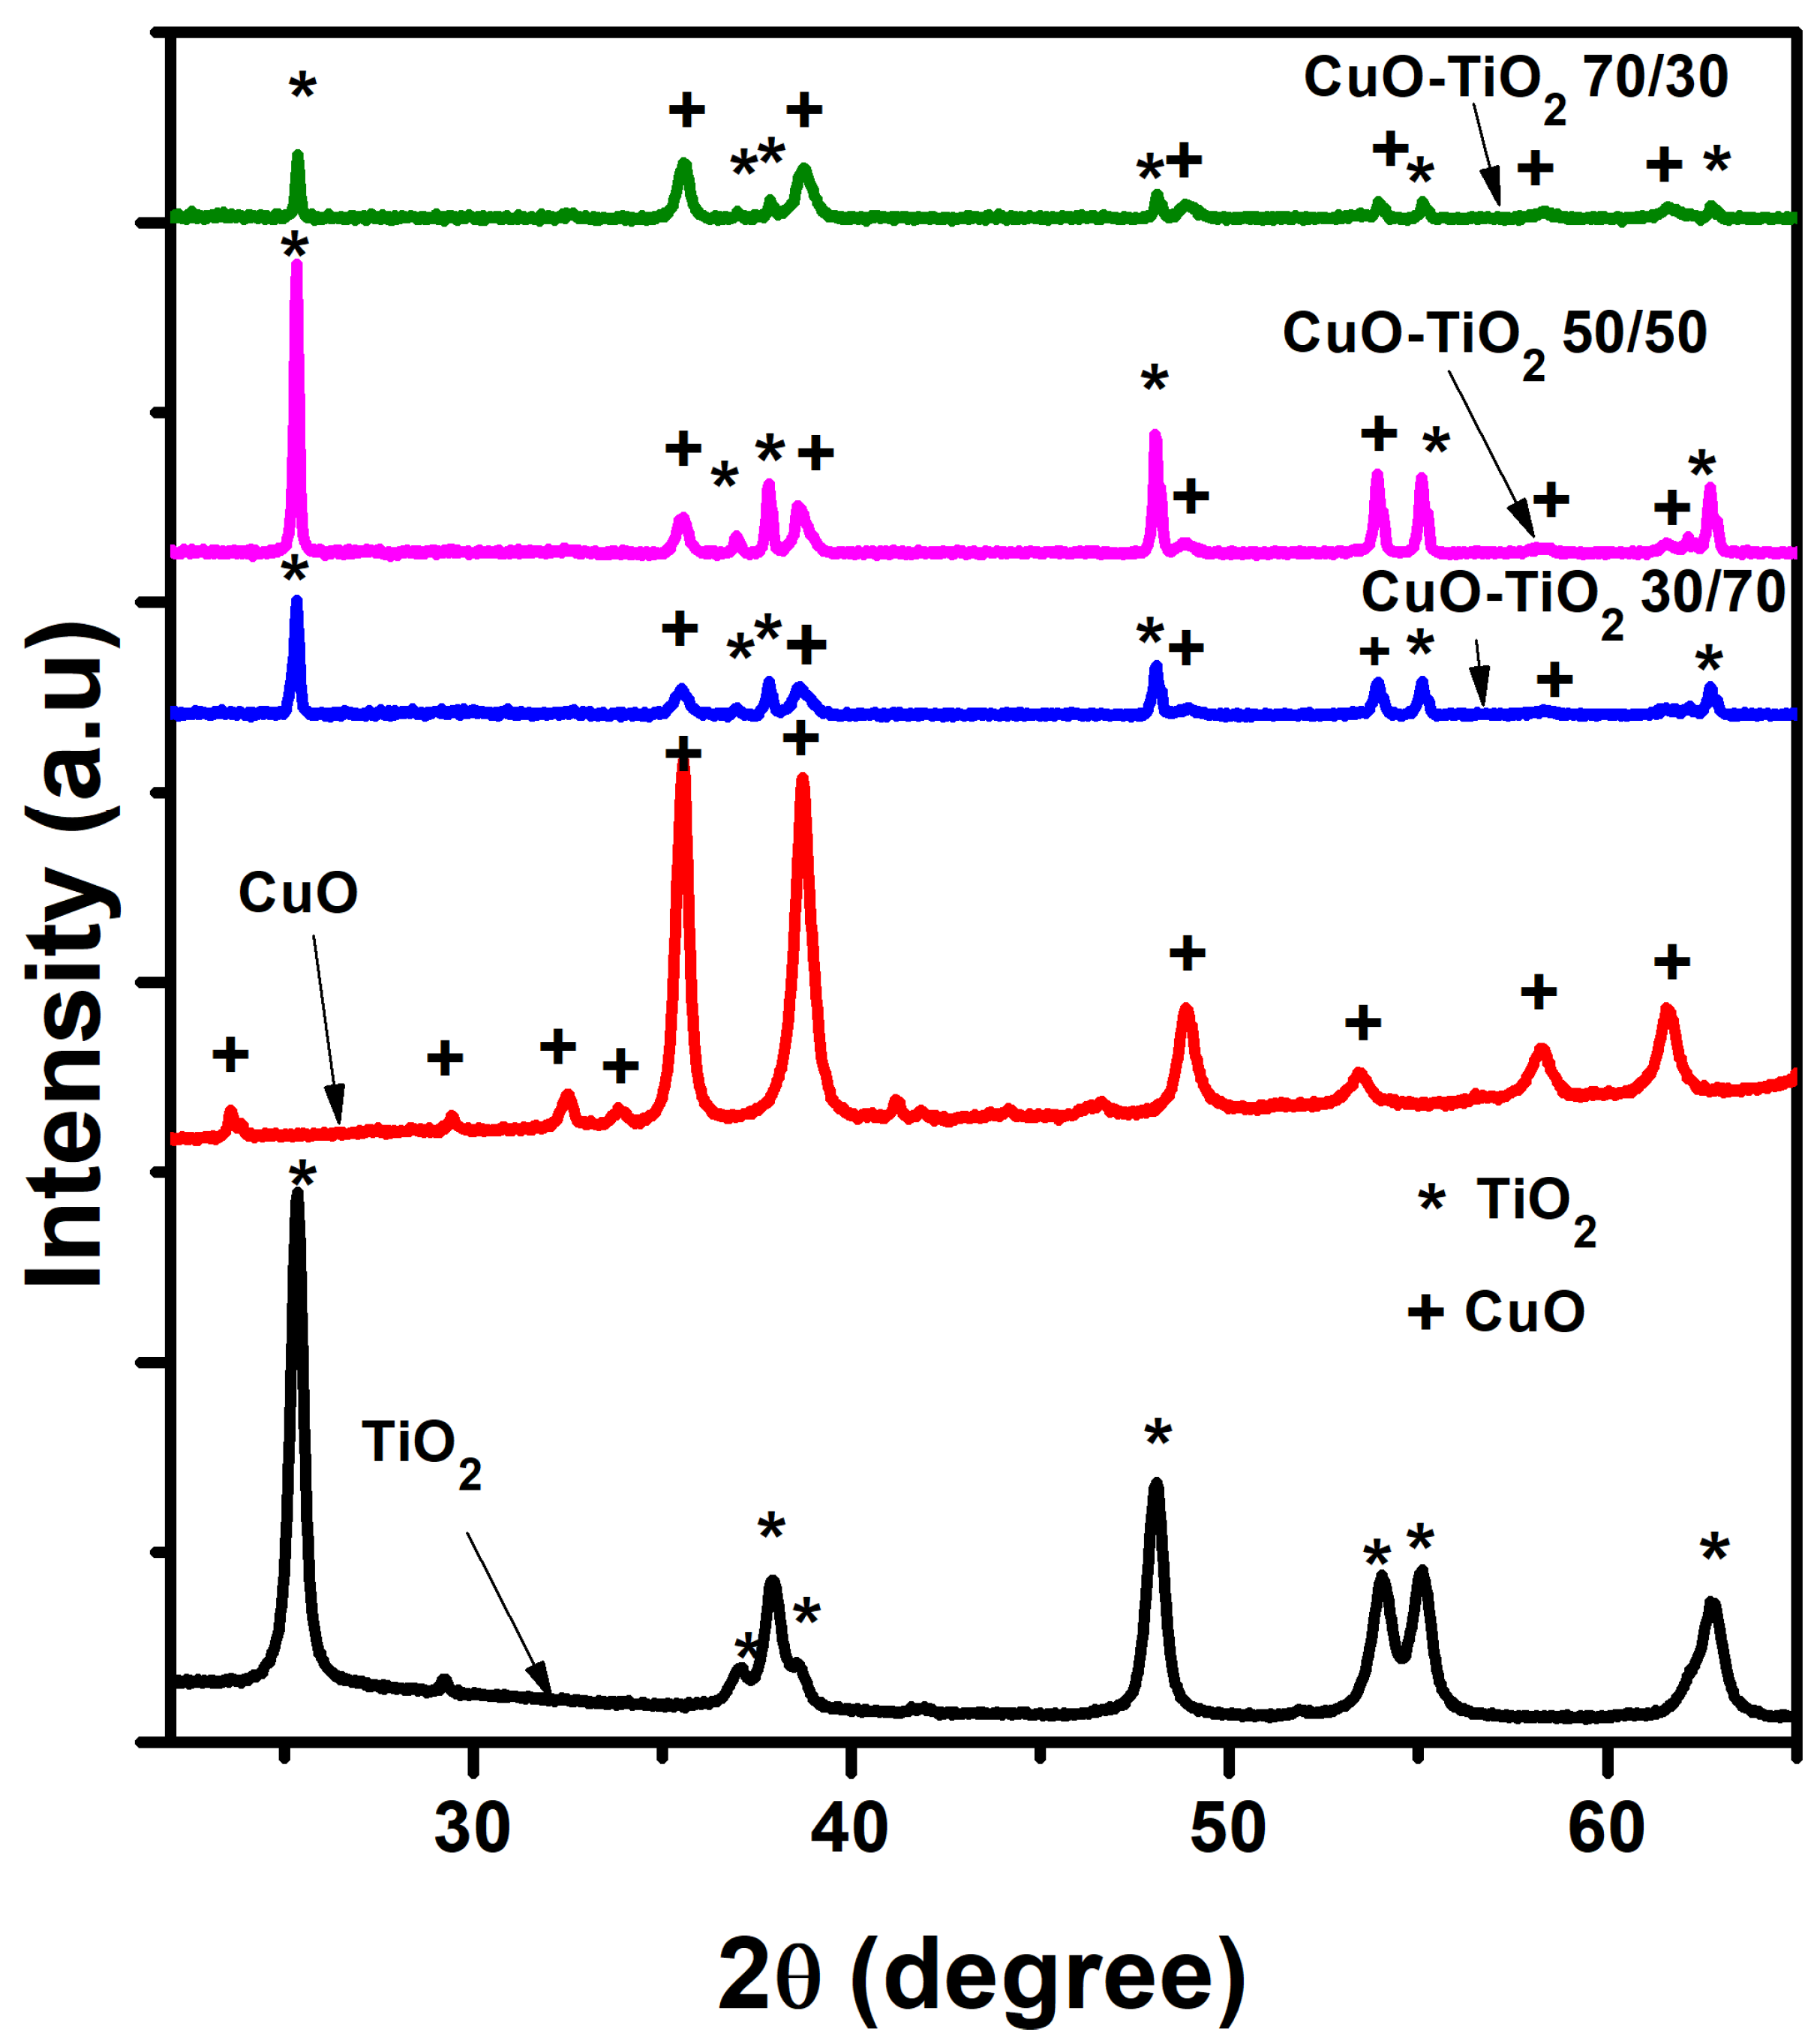
Figure 3. TiO2, CuO, and CuO-TiO2 (30/70, 50/50 and 70/30) XRD patterns.
Catalysts 13 00163 g003

2.4. Morphological Analysis of the Various Materials

Figure 4a,b shows the SEM images of the biosynthesized CuO nanoparticles. The materials are shown to be thick tubes in shape, as shown in the literature previously, with some aggregation, and have a particle size distribution of 50–250 nm, with dominant particle sizes being between 100 and 200 nm (Figure 4k) [24]. For the TiO2, the SEM images in Figure 4c,d showed spherically shaped nanoparticles with a particle size distribution of (Figure 4l) 50–400 nm with dominating particles ranging in size from 100 to 300 nm. The lesser agglomeration that was observed on the TiO2 may be due to the optimum concentration of the plant extract that was utilized [37]. Upon analyzing the three bimetallic materials, the more we increased the composition of CuO on TiO2, the less spherical the composites became, which is evidence that Cu, Ti, and O species are strongly demonstrated to be homogeneously distributed throughout the entire selected area, and the formation of the p-n heterojunction between CuO and TiO2 is revealed [40]. The particle sizes of the spherical nanocomposites increased as we increased the composition of CuO. The particle size distribution of CuO-TiO2 30–70, 50–50, and 70–30 was 100–200 nm, 125–250, and 105–250, respectively. The larger particle sizes may be due to the agglomeration that is observed from CuO-TiO2 30–70 to 70–30. To further confirm the formation of these materials, EDS analysis was conducted as reported in Figure S1a–e.

2.5. TGA and DTA Analysis

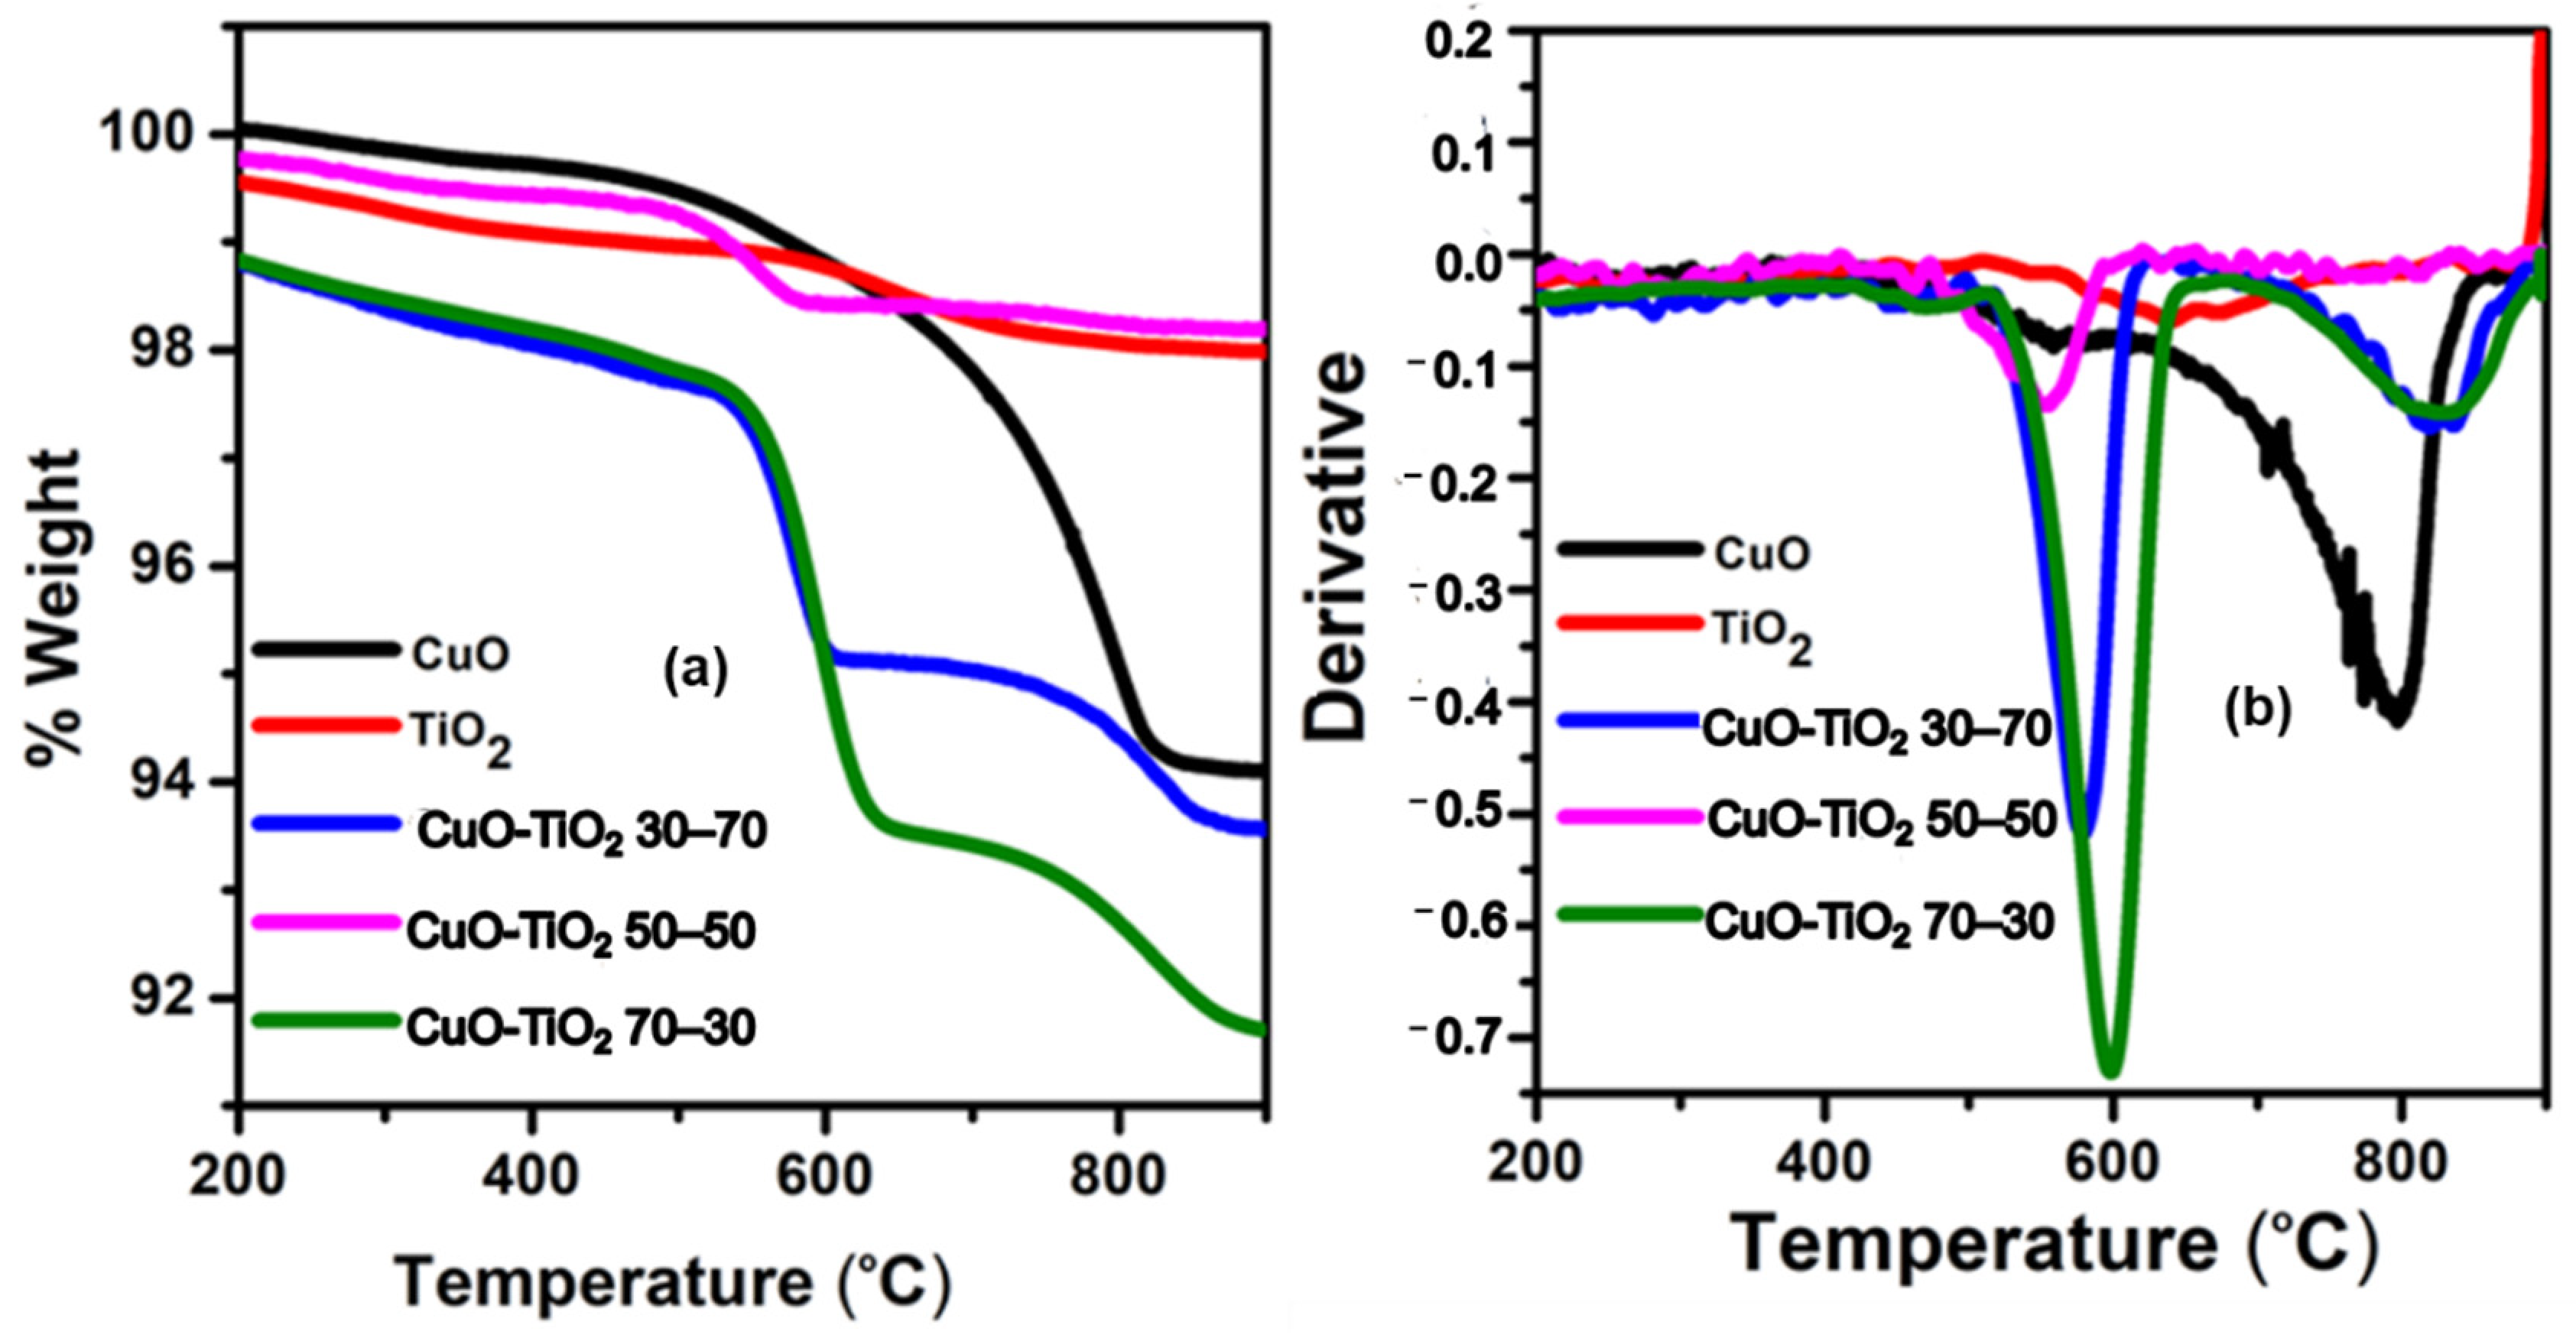
For thermal analysis studies on the CuO-TiO2 nanocomposites (Figure 5a), two mass losses were observed arising from the elimination of water. All mass losses were linked to the endothermal transformation, according to the DTA curves (Figure 5b). At the molar ratios CuO-TiO2 = 30:70, 50:50, and 70:30, total mass losses of the nanocomposites were 6.5%, 1.8%, and 8.3%, respectively. When compared to the TiO2 reference sample, a 50% increase in copper (II) oxide content enhanced the thermal stability in the temperature range of 20–1000 °C. All of the materials studied had suitable thermal stability up to 1000 °C, which is in line with previous studies by Ashok et al. [42] where weight loss percentages were 9.0, 4.5, 3.0, and 2.5 for CT-5, CT-6, and CT-7, respectively. The 50/50 CuO-TiO2 nanocomposite was the most thermally stable composite of all the materials

2.6. N2 Adsorption-Desorption Studies, BJH Pore Volume, and BET Surface Area

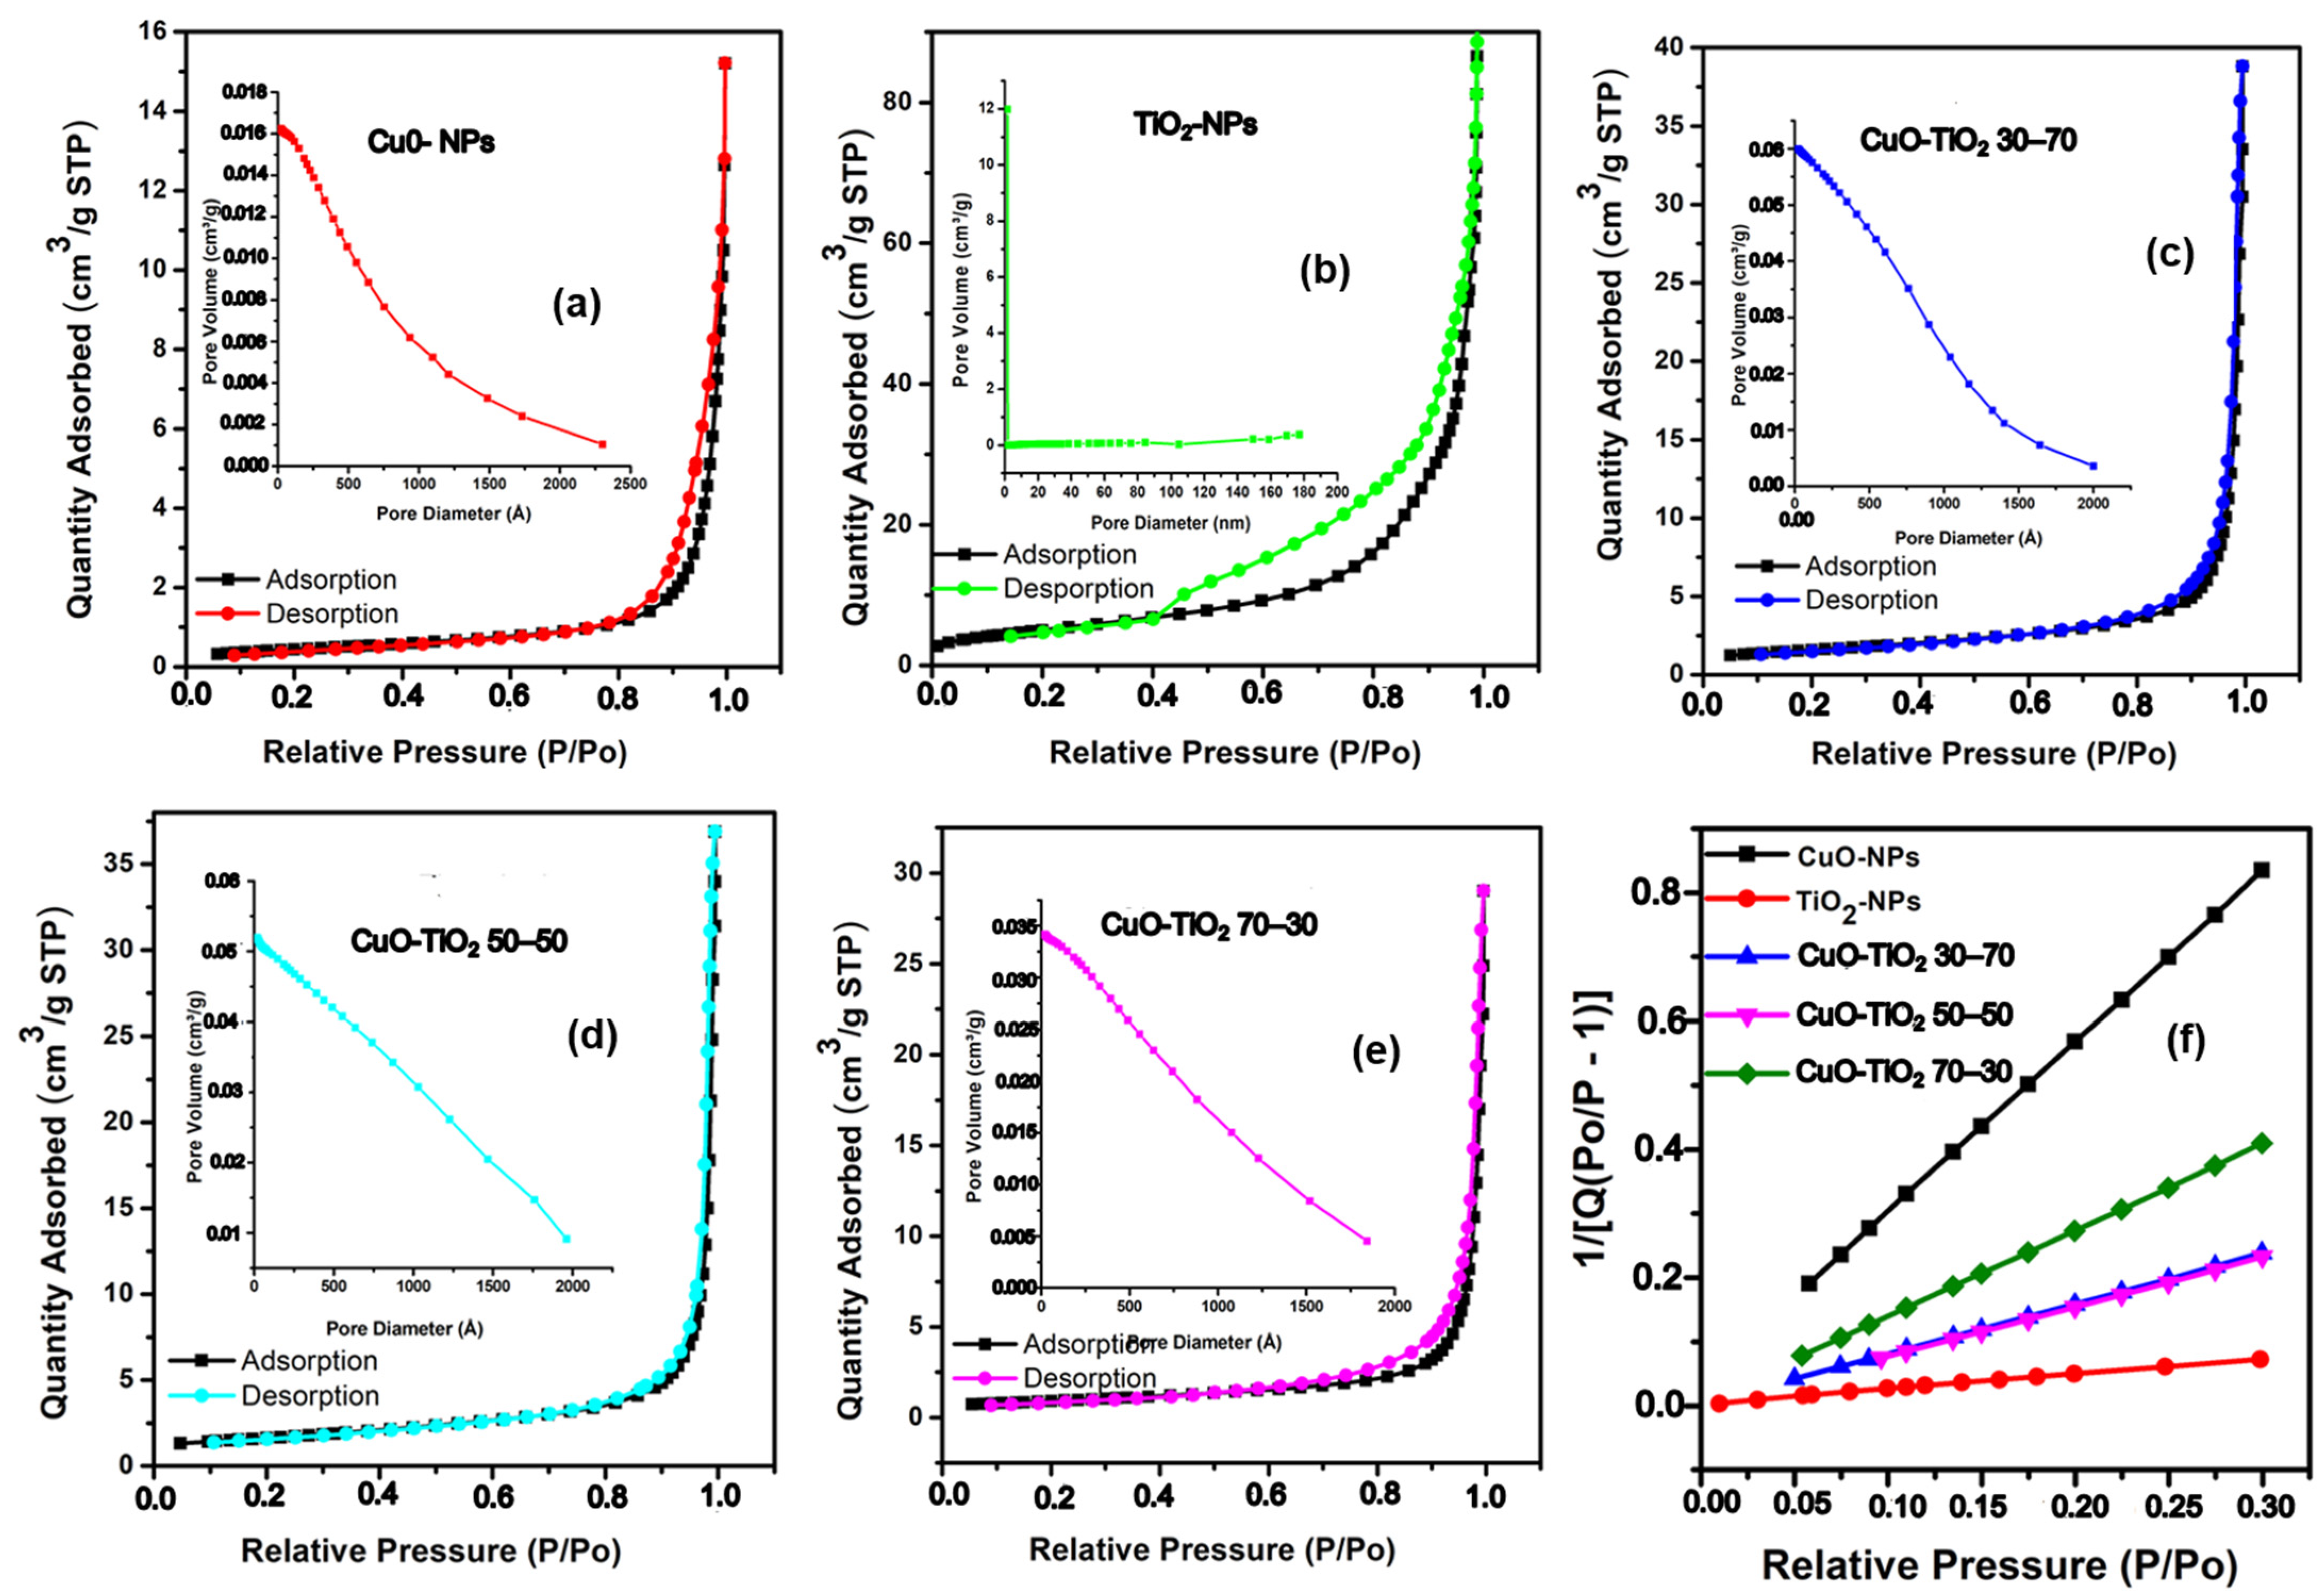
The surface area, pore diameter, and pore volume analysis through N2 adsorption/desorption isotherms for all the CuO-TiO2 nanocomposites are demonstrated in Figure 6a–e. All the samples exhibited a type III hysteresis loop except for the TiO2 material, which had an H1 hysteresis loop [43]. The BET surface areas of the photocatalysts generally decreased as the CuO loading increased. The BET surface area of the materials formed at the molar ratios CuO-TiO2 30/70, 50/50, and 70/30 was 5.58, 5.74, and 3.22 m2/g, respectively. On the other hand, the surface area of TiO2 and CuO was 13.18 m2/g and 1.613 m2/g, respectively. All the materials, excluding TiO2, were mesoporous in nature [44]. The mesoporous nature of these materials could have been influenced by the manner of the pore diameter distribution of copper (II) oxide [45].

2.7. Electrochemical Characterization of the Composites
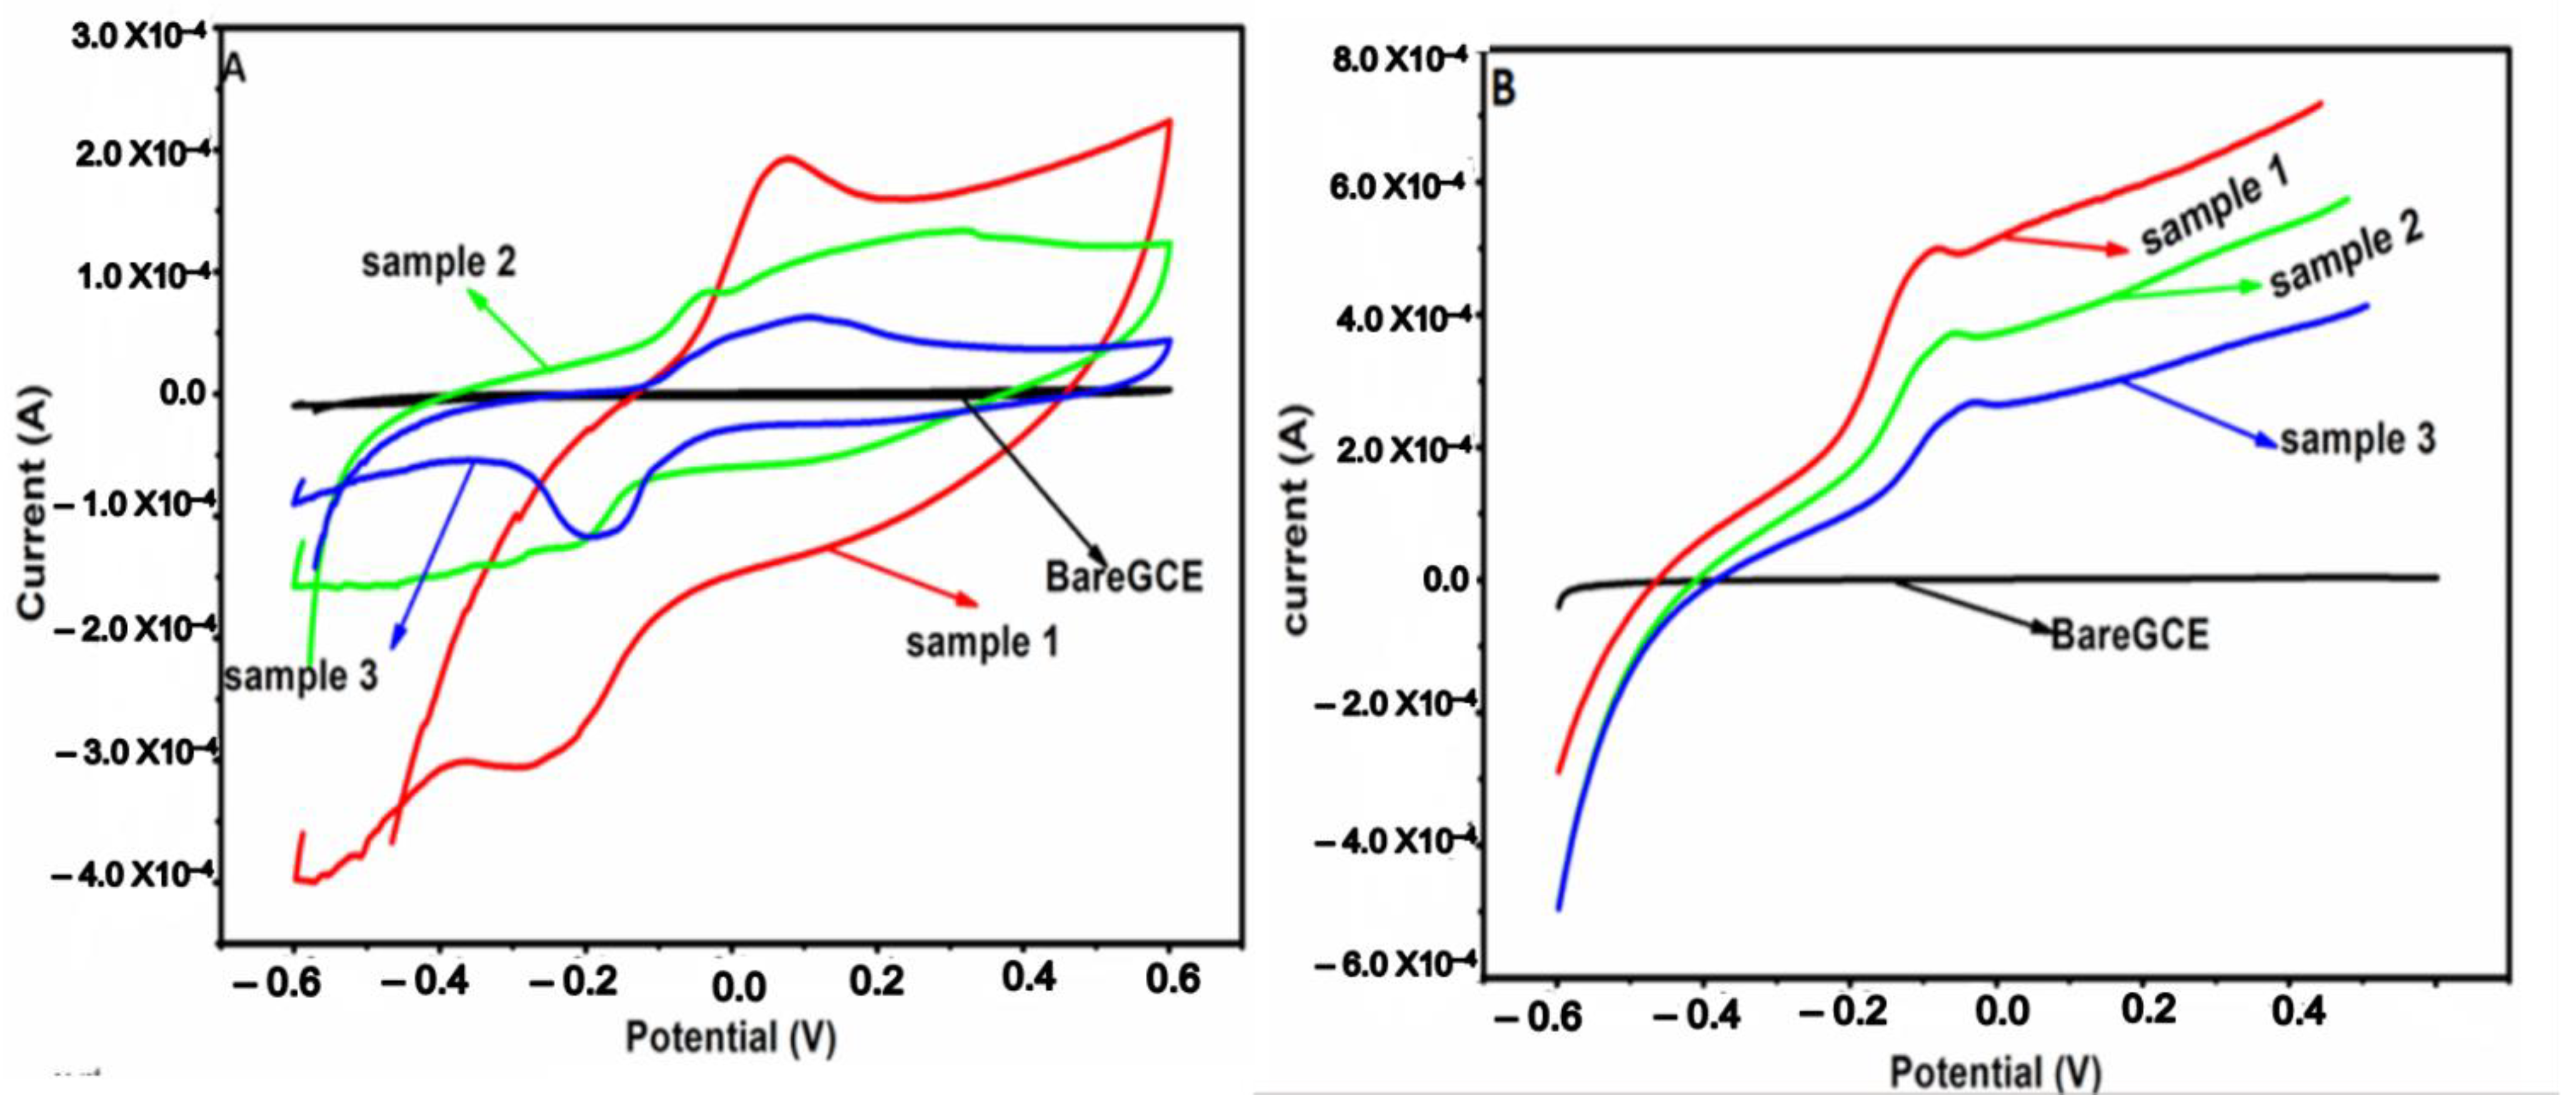
Cyclic and linear swept voltammetry were used to test the electrochemical properties to quickly determine information about the thermodynamics of redox processes and the electron transfer between an electrolyte and a modified working electrode. CV and linear curves of bare (unmodified) glassy carbon electrodes modified with different samples (S1–S3) at the scanning rate of 2 mV/s are displayed in Figure 7A,B. According to the graph observed, there was no electrochemical performance revealed by the bare GCE electrode. An electrochemical reaction was revealed after the modification of GCE with the three different samples noted due to the peak potential and high current density. All the CV curves for the modified electrode displayed a similar shape, a redox peak, but the different positions of the redox peaks were dependent on the type of sample. A couple of redox peaks and an increase in the current density can be seen clearly in the voltammogram of each sample. Voltammogram curves generally reveal redox peaks and high current density, indicating a pseudo-capacitance behavior [11,12]. An anodic peak appeared to the positive sweep around 0 to 0.2 V due to the oxidation of CuO, and cathodic peaks appeared to the negative ongoing from −0.2 to −0.3 due to the reduction of Cu2+/Cu1+. Noticeably, the voltammogram of the CuO-TiO2 30/70 (S1) electrode showed a higher response current density compared to the other two samples, suggesting a higher specific capacitance, and it could be due to more titanium dioxide, as there is a synergistic effect that increases the electrochemical properties of copper oxide. In addition, this may be attributed to the high conductivity of the electrode due to the p-n junction between CuO and TiO2 nanoparticles, which enhances the electrochemical activities. This implies that more TiO2 nanoparticles added to the CuO, which is an n-type semiconductor, play an important role in increasing the electrochemical activity of the electrode to show the best response in terms of voltammetry. The electrochemical results can make the electrode to be the best candidate for electrochemical applications due to their best voltammetric response and possible photocatalytic applications. The specific capacitance was calculated from the area under the curve of cyclic voltammetry using Equation (3) and was found to be 164, 134, and 113 for samples 1, 2, and 3, respectively.
C p = A 2 km Δ V
A—area under I-V curve, k—scan rate, m—active mass, ΔV—potential window.
Figure 7. Cyclic (A) and linear (B) voltammetry curves of bare GCE and modified A: GCE/ CuO-TiO2 30/70 (S1) B: GCE/ CuO-TiO2 50/50 (S2): GCE/ CuO-TiO2 70/30 (S3) in 0.5 M H2SO4 as an electrolyte.
Catalysts 13 00163 g007
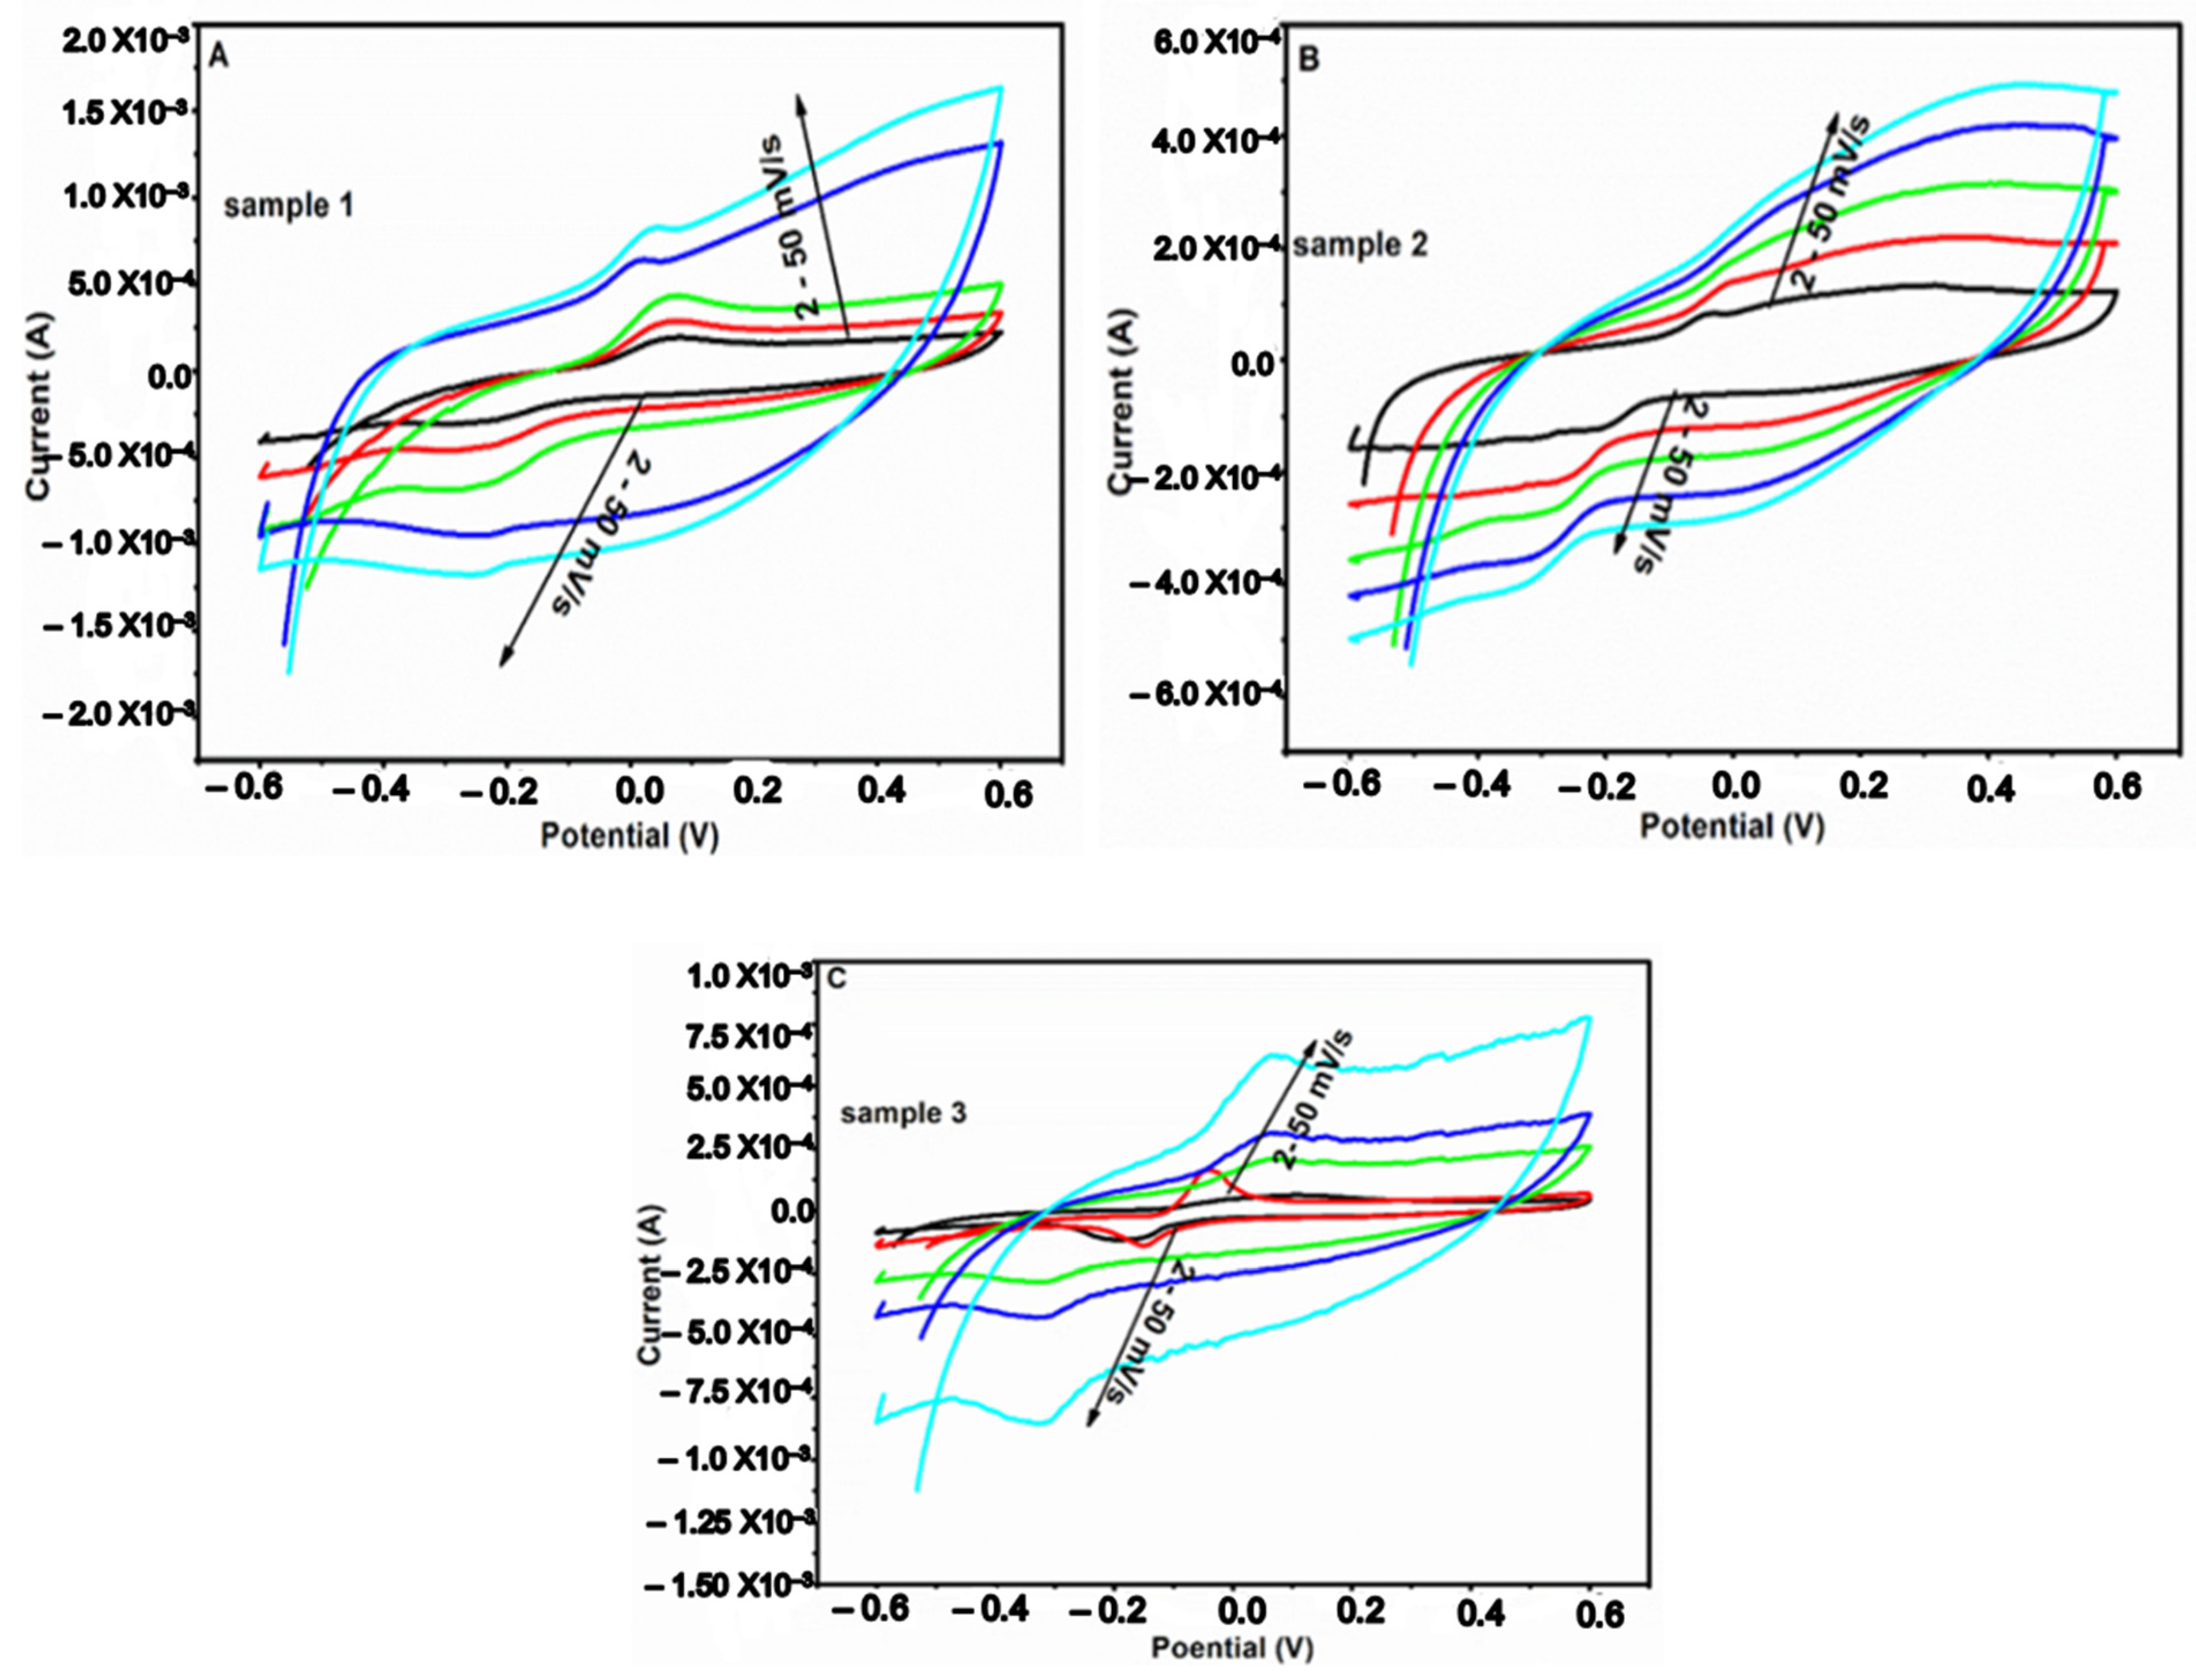
Figure 8 reveals CV at different scan rates of 5–50 mV/s for three different samples. The cyclic voltammogram curves showed that the current density increased with increasing the scan rates; thus, the voltammetric current is directly proportional to the scan rate and gives an indication of the excellent rate capability of the modified electrode. There was a slight shift of redox peaks (oxidation and reduction) toward a more positive and negative potential, illustrating that the electrochemical kinetics are controlled by the diffusion process and displaying a rapid charge transfer [38].
The EIS was also used to study the electrochemical impedance properties of the samples (S1–S3). It is a prevailing tool to investigate the capacitive behavior of the samples. It is used to study the charge transfer resistance and diffusion process from the solution to the modified electrode surface and to the resistance of the electrolyte [14,45,46,47]. In Figure 9, the Nyquist plots of CuO-TiO2 30/70 (S1), CuO-TiO2 50/50 (S2), and CuO-TiO2 70/30 (S3) that were modified in the glassy carbon electrode are shown. As seen from the graph, the results show that all samples revealed a semi-circle in the high-frequency range, which is related to the charge transfer resistance caused by faradic reactions. The intersection of the curve signifies solution resistance, which is an indication of the resistance of the electrolyte and modified electrode [48,49]. A straight line in the low-frequency resistance, which corresponds to Warburg impedance, indicates an ion diffusion process on the modified electrode and electrolyte [15,16]. The EIS data suggest that the CuO-TiO2 electrode material showed faster charge transport ability, leading to suitable electrochemical properties. Therefore, the electrochemical results showed that the modified CuO-TiO2 electrode (30:70) is an outstanding electrode material for electrochemical application due to its great voltammetric response, suitable electrochemical properties, and best charge transfer resistance.

2.8. Photodegradation of MB Dye Using the CuO-TiO2 Nanocomposite

2.8.1. Photodegradation of MB UV Light

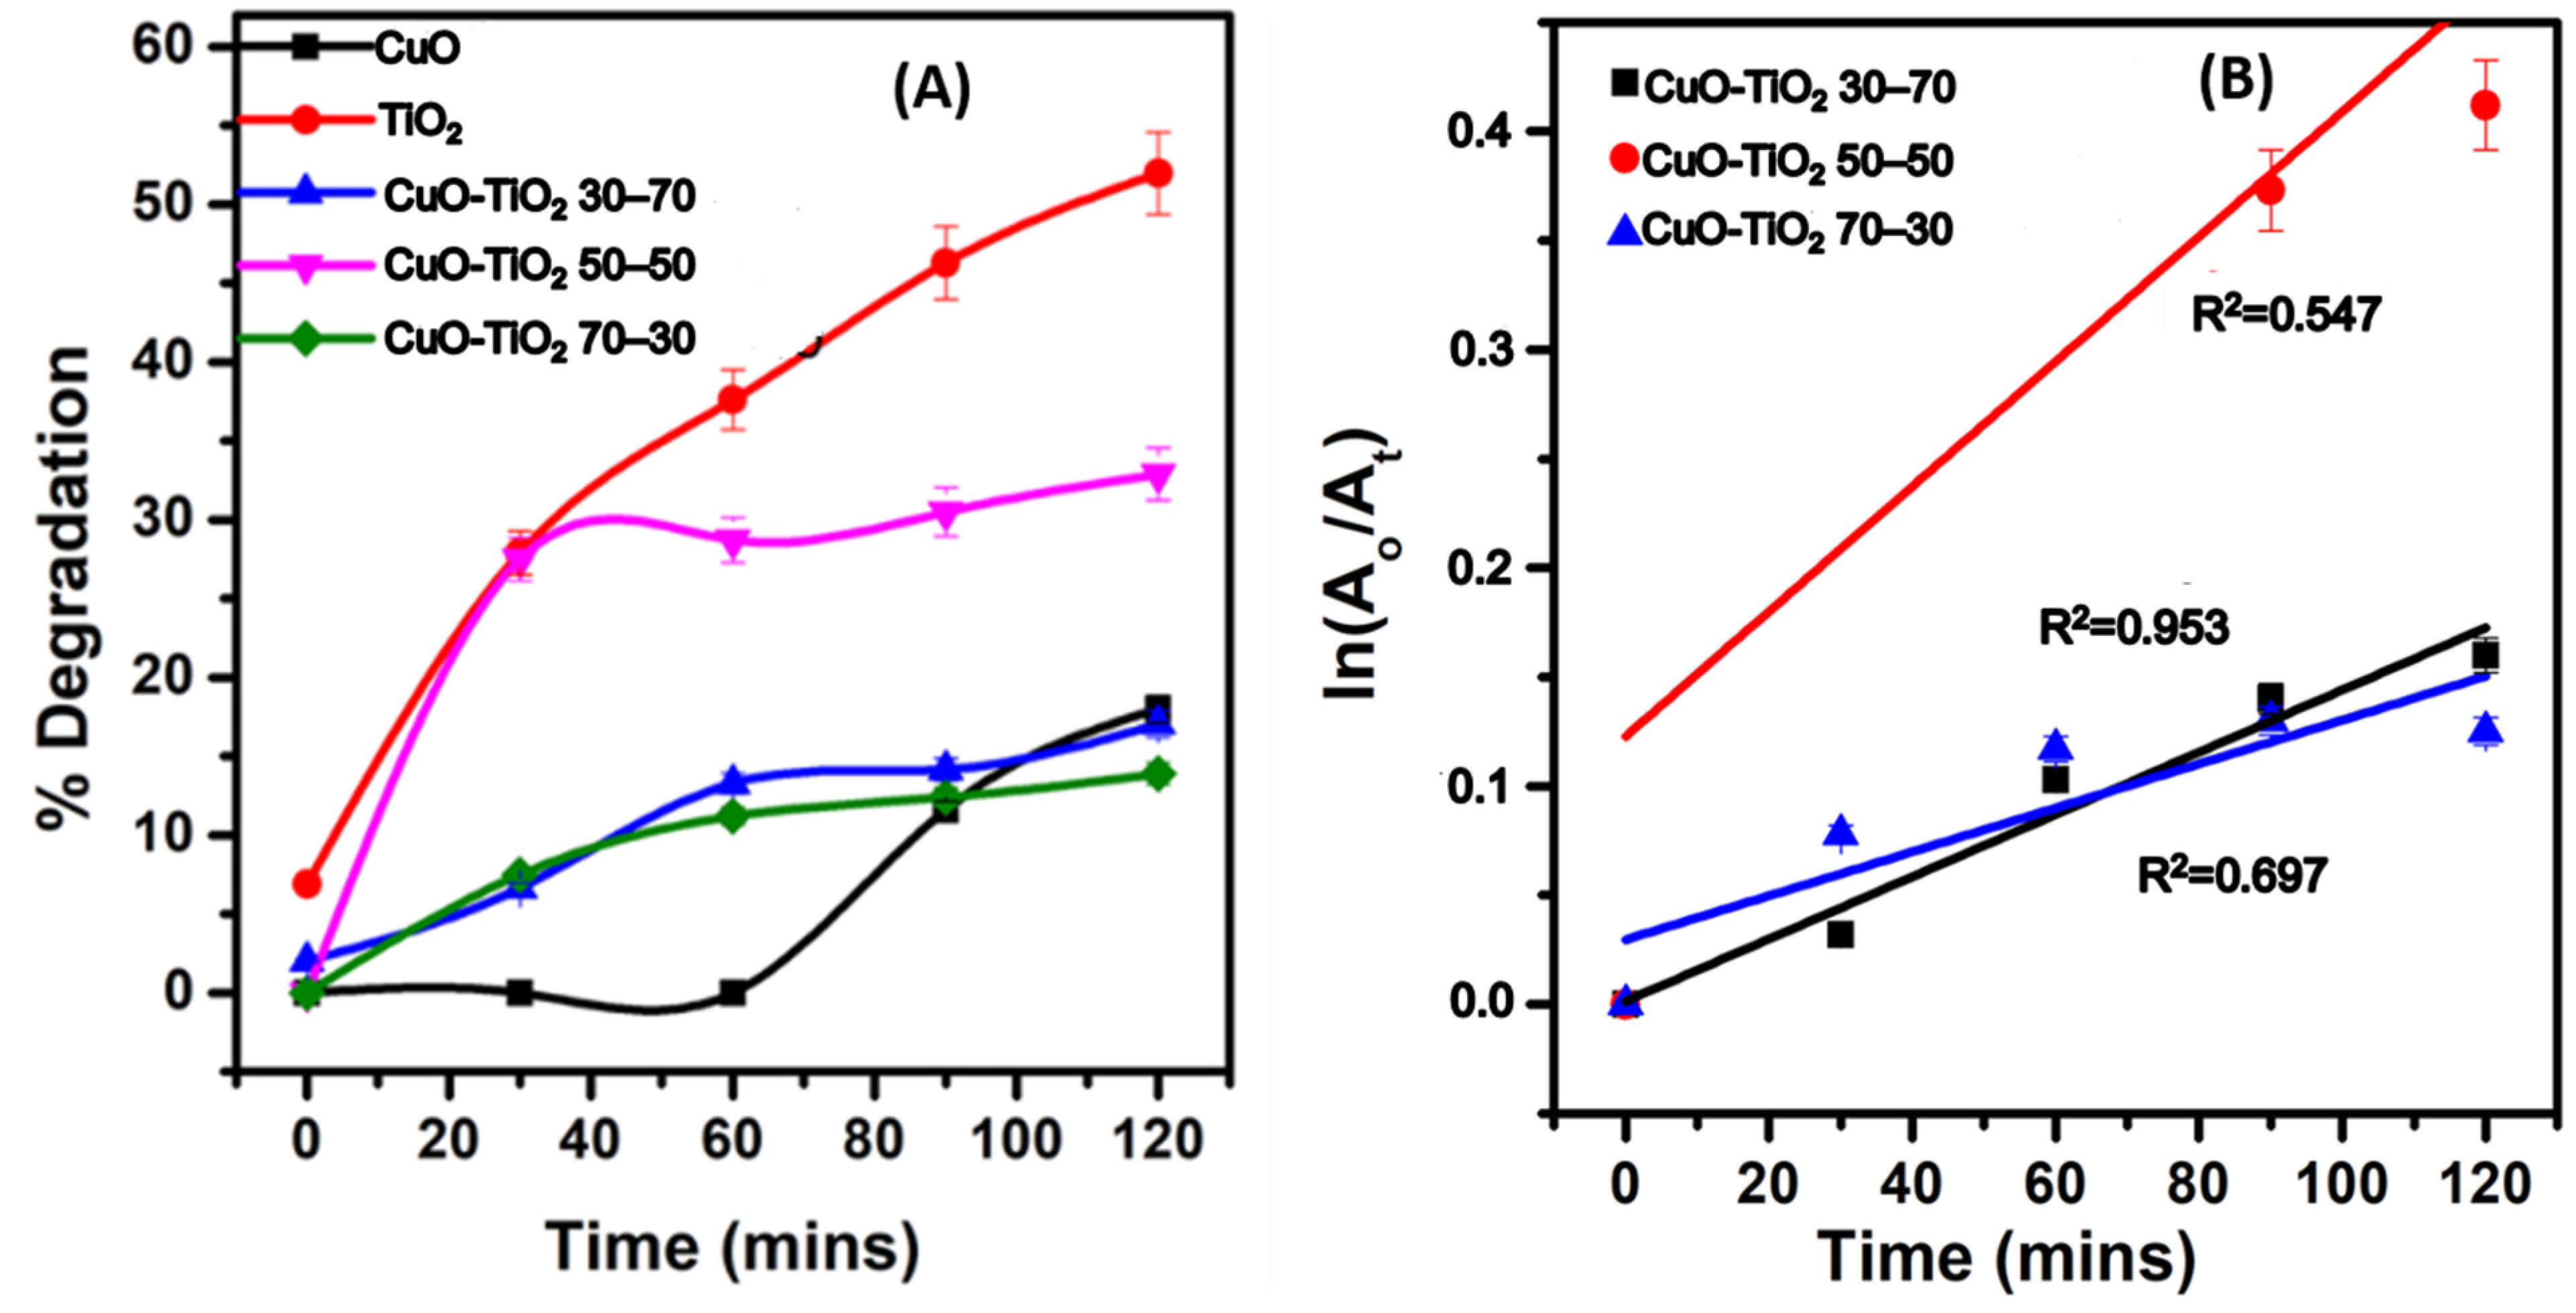
The green-synthesized CuO, TiO2, CuO-TiO2 30/70, 50/50, and 70/30 photocatalysts were used for the degradation of MB dye (Figure 10A). From the analysis, 18%, 65%, 17%, 33%, and 14% of the MB pollutant was degraded. It can be noted that there was a drastic drop in the degradation efficiencies of these materials, in particular with the 30/70 CuO-TiO2 and the 70:30 CuO-TiO2, which recorded 17% and 14% degradation. Sankar et al. [46], using the CuO photocatalyst, were able to degrade 50% of Coomassie brilliant blue R-250 after 240 min exposure to sunlight. Lingaraju et al. [50] utilized a green-synthesized CuO photocatalyst to degrade ~100% of trypan blue dye after 140 min irradiation under UV light. The green-synthesized CuO/TiO2 prepared by Lu et al. [29] degraded 100% of phenol after 160 min exposure to UV light. Khodadadi et al. [30] synthesized CuO/TiO2 nanocomposite, which was able to degrade 100% of MB and methyl orange (MO) after 10 min irradiation with UV light. It can be noted that for the green-derived CuO and TiO2 NPs, for their improved degradation to occur, extended time periods (360 min) were noted even though in one study, the degradation was still only 50% using CuO. In addition, the choice of the pollutant could play another major role. Using CuO/TiO2, for all the pollutants there was a complete degradation for all the mentioned pollutants, and thus it is the complete opposite of what has been obtained in our study, with a maximum degradation of 33% for MB, considering that optimum conditions from other similar studies were used. Thus, it is suspected that the phytochemicals from the various plant extracts used for the synthesis of these materials also play a major in their optical properties. In addition, their activity could be pollutant dependent; thus, it was important that we also investigate other pollutants, such as sulfisoxazole and ciprofloxacin, which are pharmaceutical pollutants. From the kinetics study (Figure 10B), it was noted that the CuO-TiO2 30/70 nanocomposite had a better fitting than the first-order kinetics as the other two materials did not fit completely. The rates of reactions were 0.014, 0.0029, and 0.001 min−1 for the CuO-TiO2 30/70, 50/50, and 70/30, respectively.

2.8.2. Photodegradation of CIP and SSX Using UV light

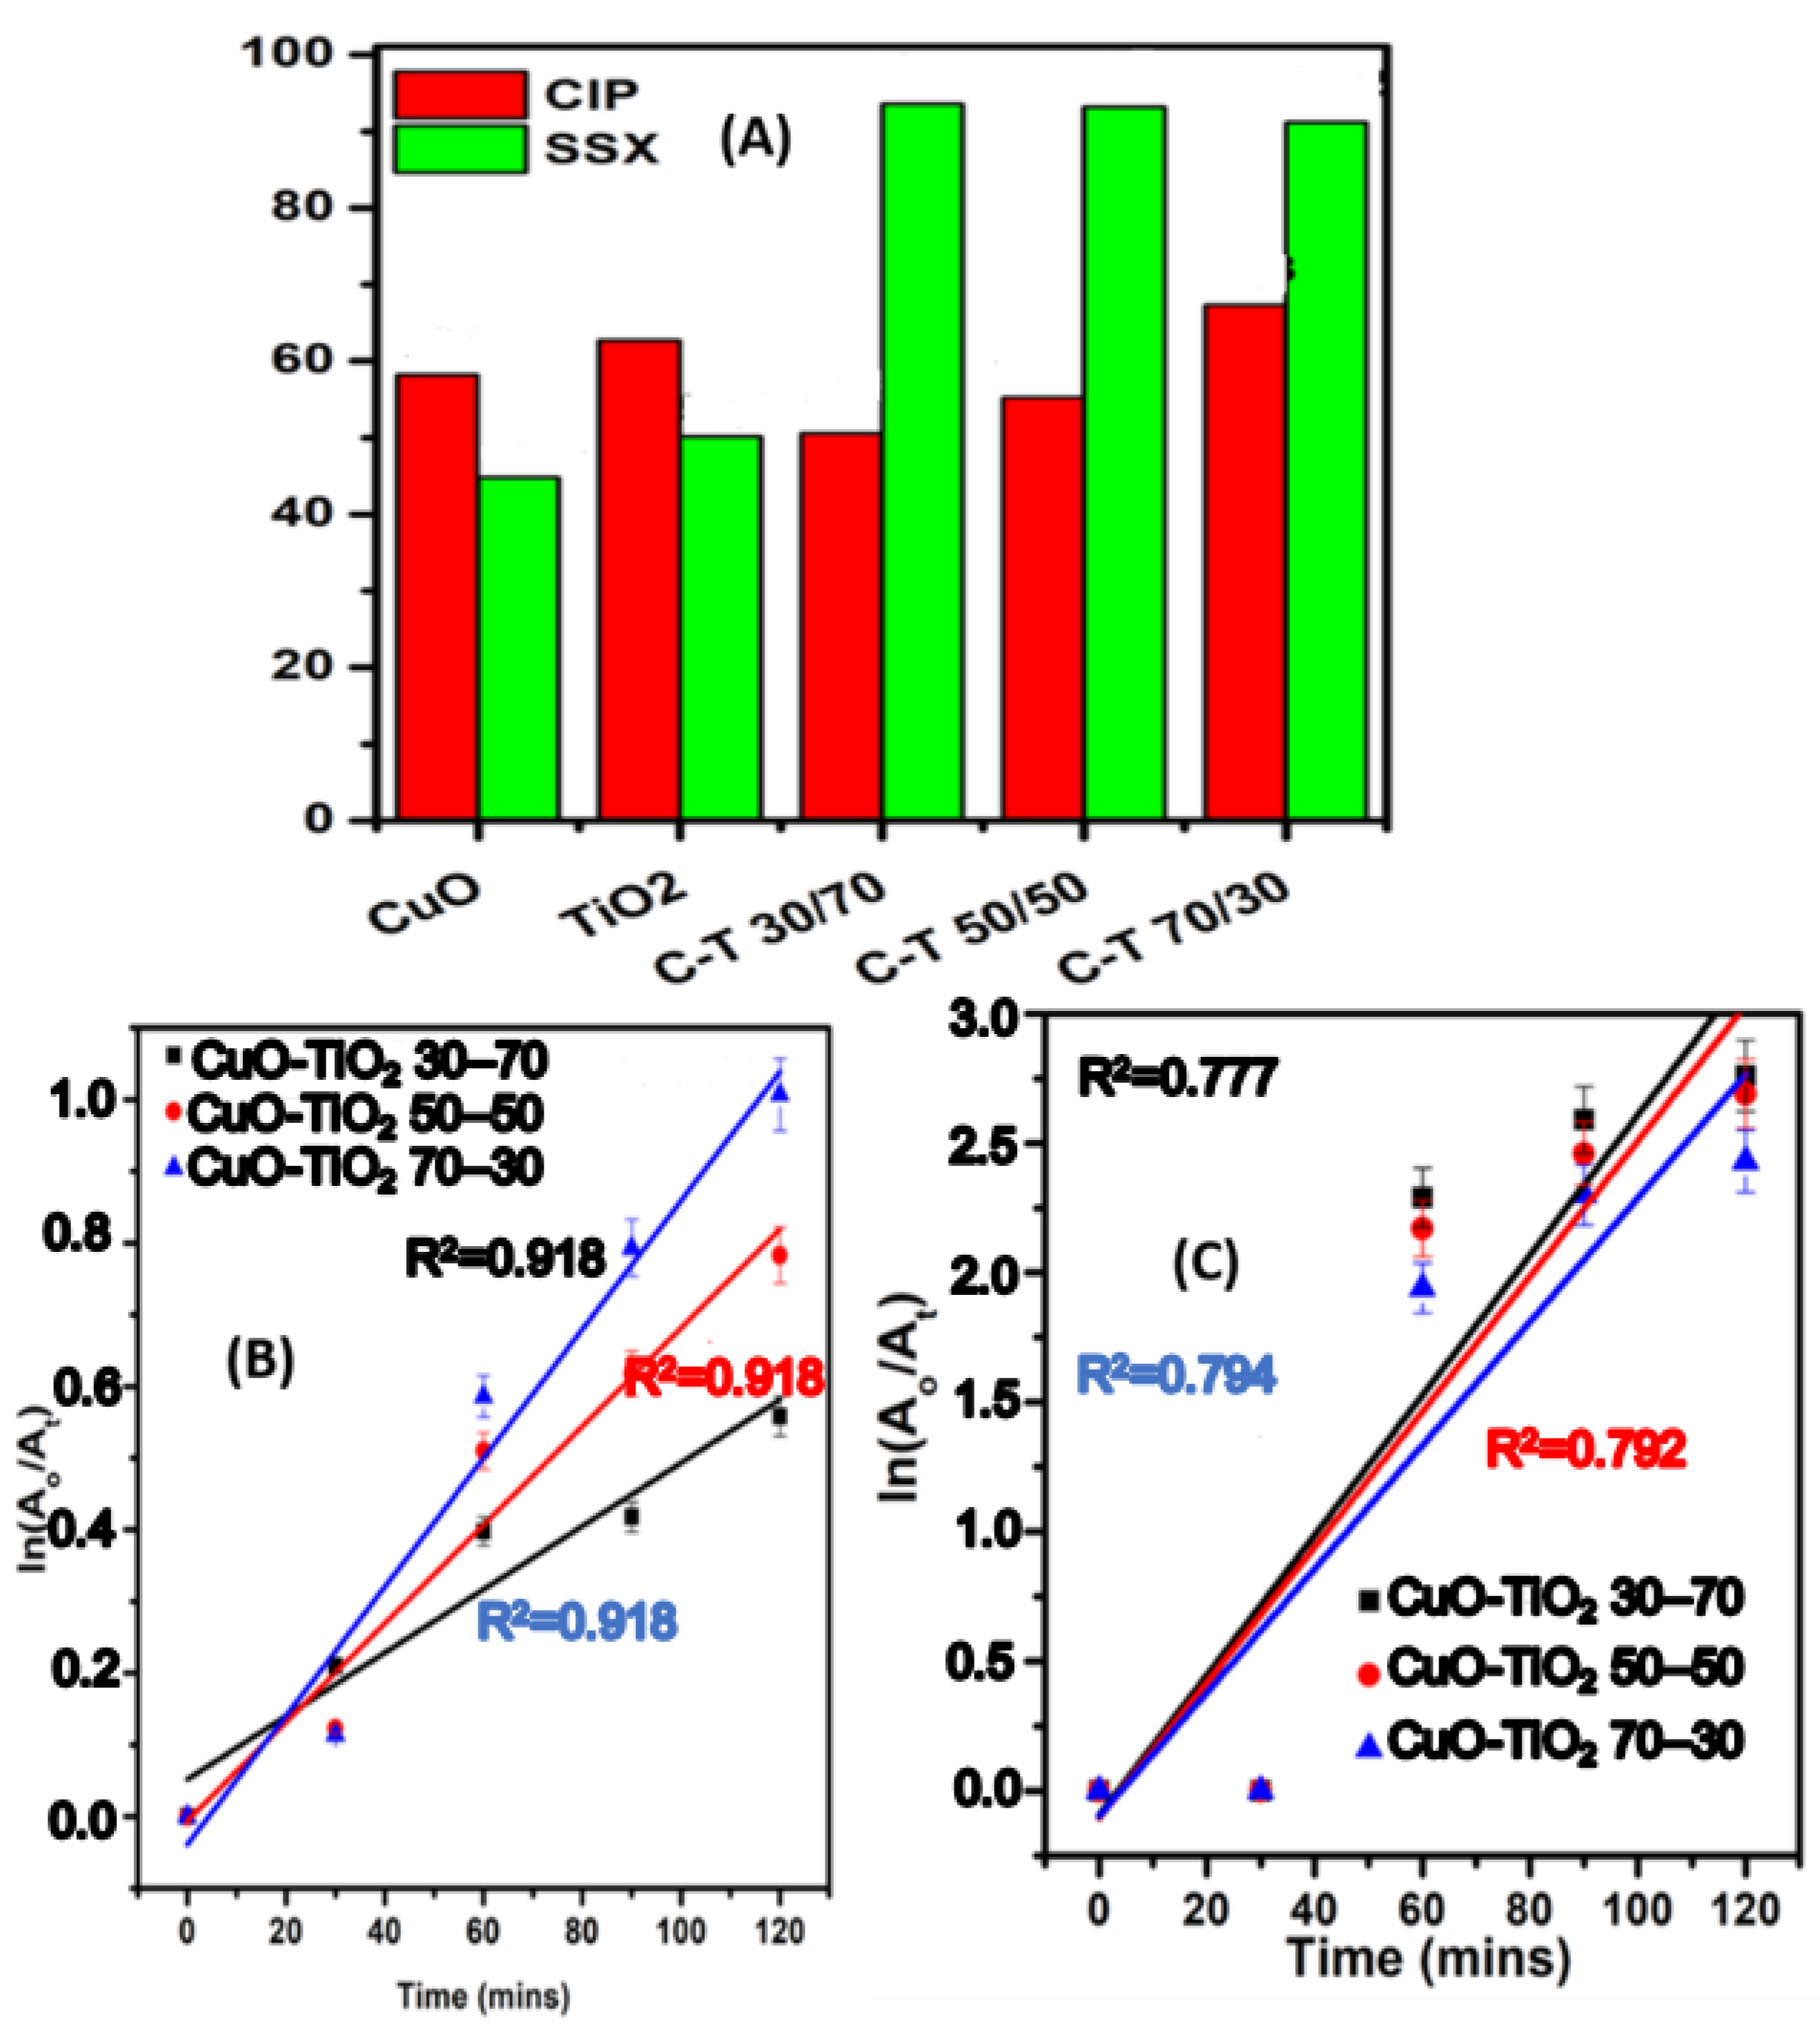
For the degradation of antibiotics (CIP and SSX), similar conditions as with MB, but the concentration of SSX and CIP was 10 mg/L (Figures S2 and S3), and from Figure 11A, all the CuO-TiO2 nanocomposite showed a high degradation efficiency against SSX than for CIP. The CuO-TiO2 photocatalyst degraded 51% (30/70), 55% (50/50), and 67% (70/30) of CIP, while CuO and TiO2 only degraded 58.2 and 62.7%, respectively. From the kinetics diagram (Figure 11B), the rates of reactions were 0.044, 0.0069, and 0.009 min−1 for the CuO-TiO2 30/70, 50/50, and 70/30, respectively, meaning the rate of the reaction for CuO-TiO2 was faster compared to the other two materials. On the other hand, the percentage degradation of SSX by CuO-TiO2 30/70, 50/50, and 70/30 was recorded to be 93.6%, 93.2%, and 91.2%, which is the highest for these composites compared to MB and CIP, respectively. While the degradation of CuO and TiO2 was 44.8% and 50.2%, respectively. Comparing the results with previous studies, Mofokeng et al. [48] prepared a CuO/TiO2@GCN, which was able to degrade 94% of 10 mg/mL ketoprofen (KP) after 30 min irradiation of visible light. Using UV light, Castaneda et al. [49] degraded 90% of caffeine within 3 h using 100 mg of CuO-TiO2-F photocatalyst. Hajipour et al. [50] utilized 5 mg of TiO2/CuO photocatalyst to degrade 80% of amoxicillin. The CuO-TiO2-GO prepared by Cosma et al. [51] degraded 95% and 98% of amoxicillin and ciprofloxacin, respectively. The photodegradation process was conducted over 120 min. Li et al. [52] used green-synthesized TP-TiO2 to degrade 90% of CIP in 60 min under the UV-vis light source. These nanocomposites are suitable photocatalysts for the degradation of pharmaceutical drugs.

2.8.3. Effect of Trapping and Mechanism of Degradation

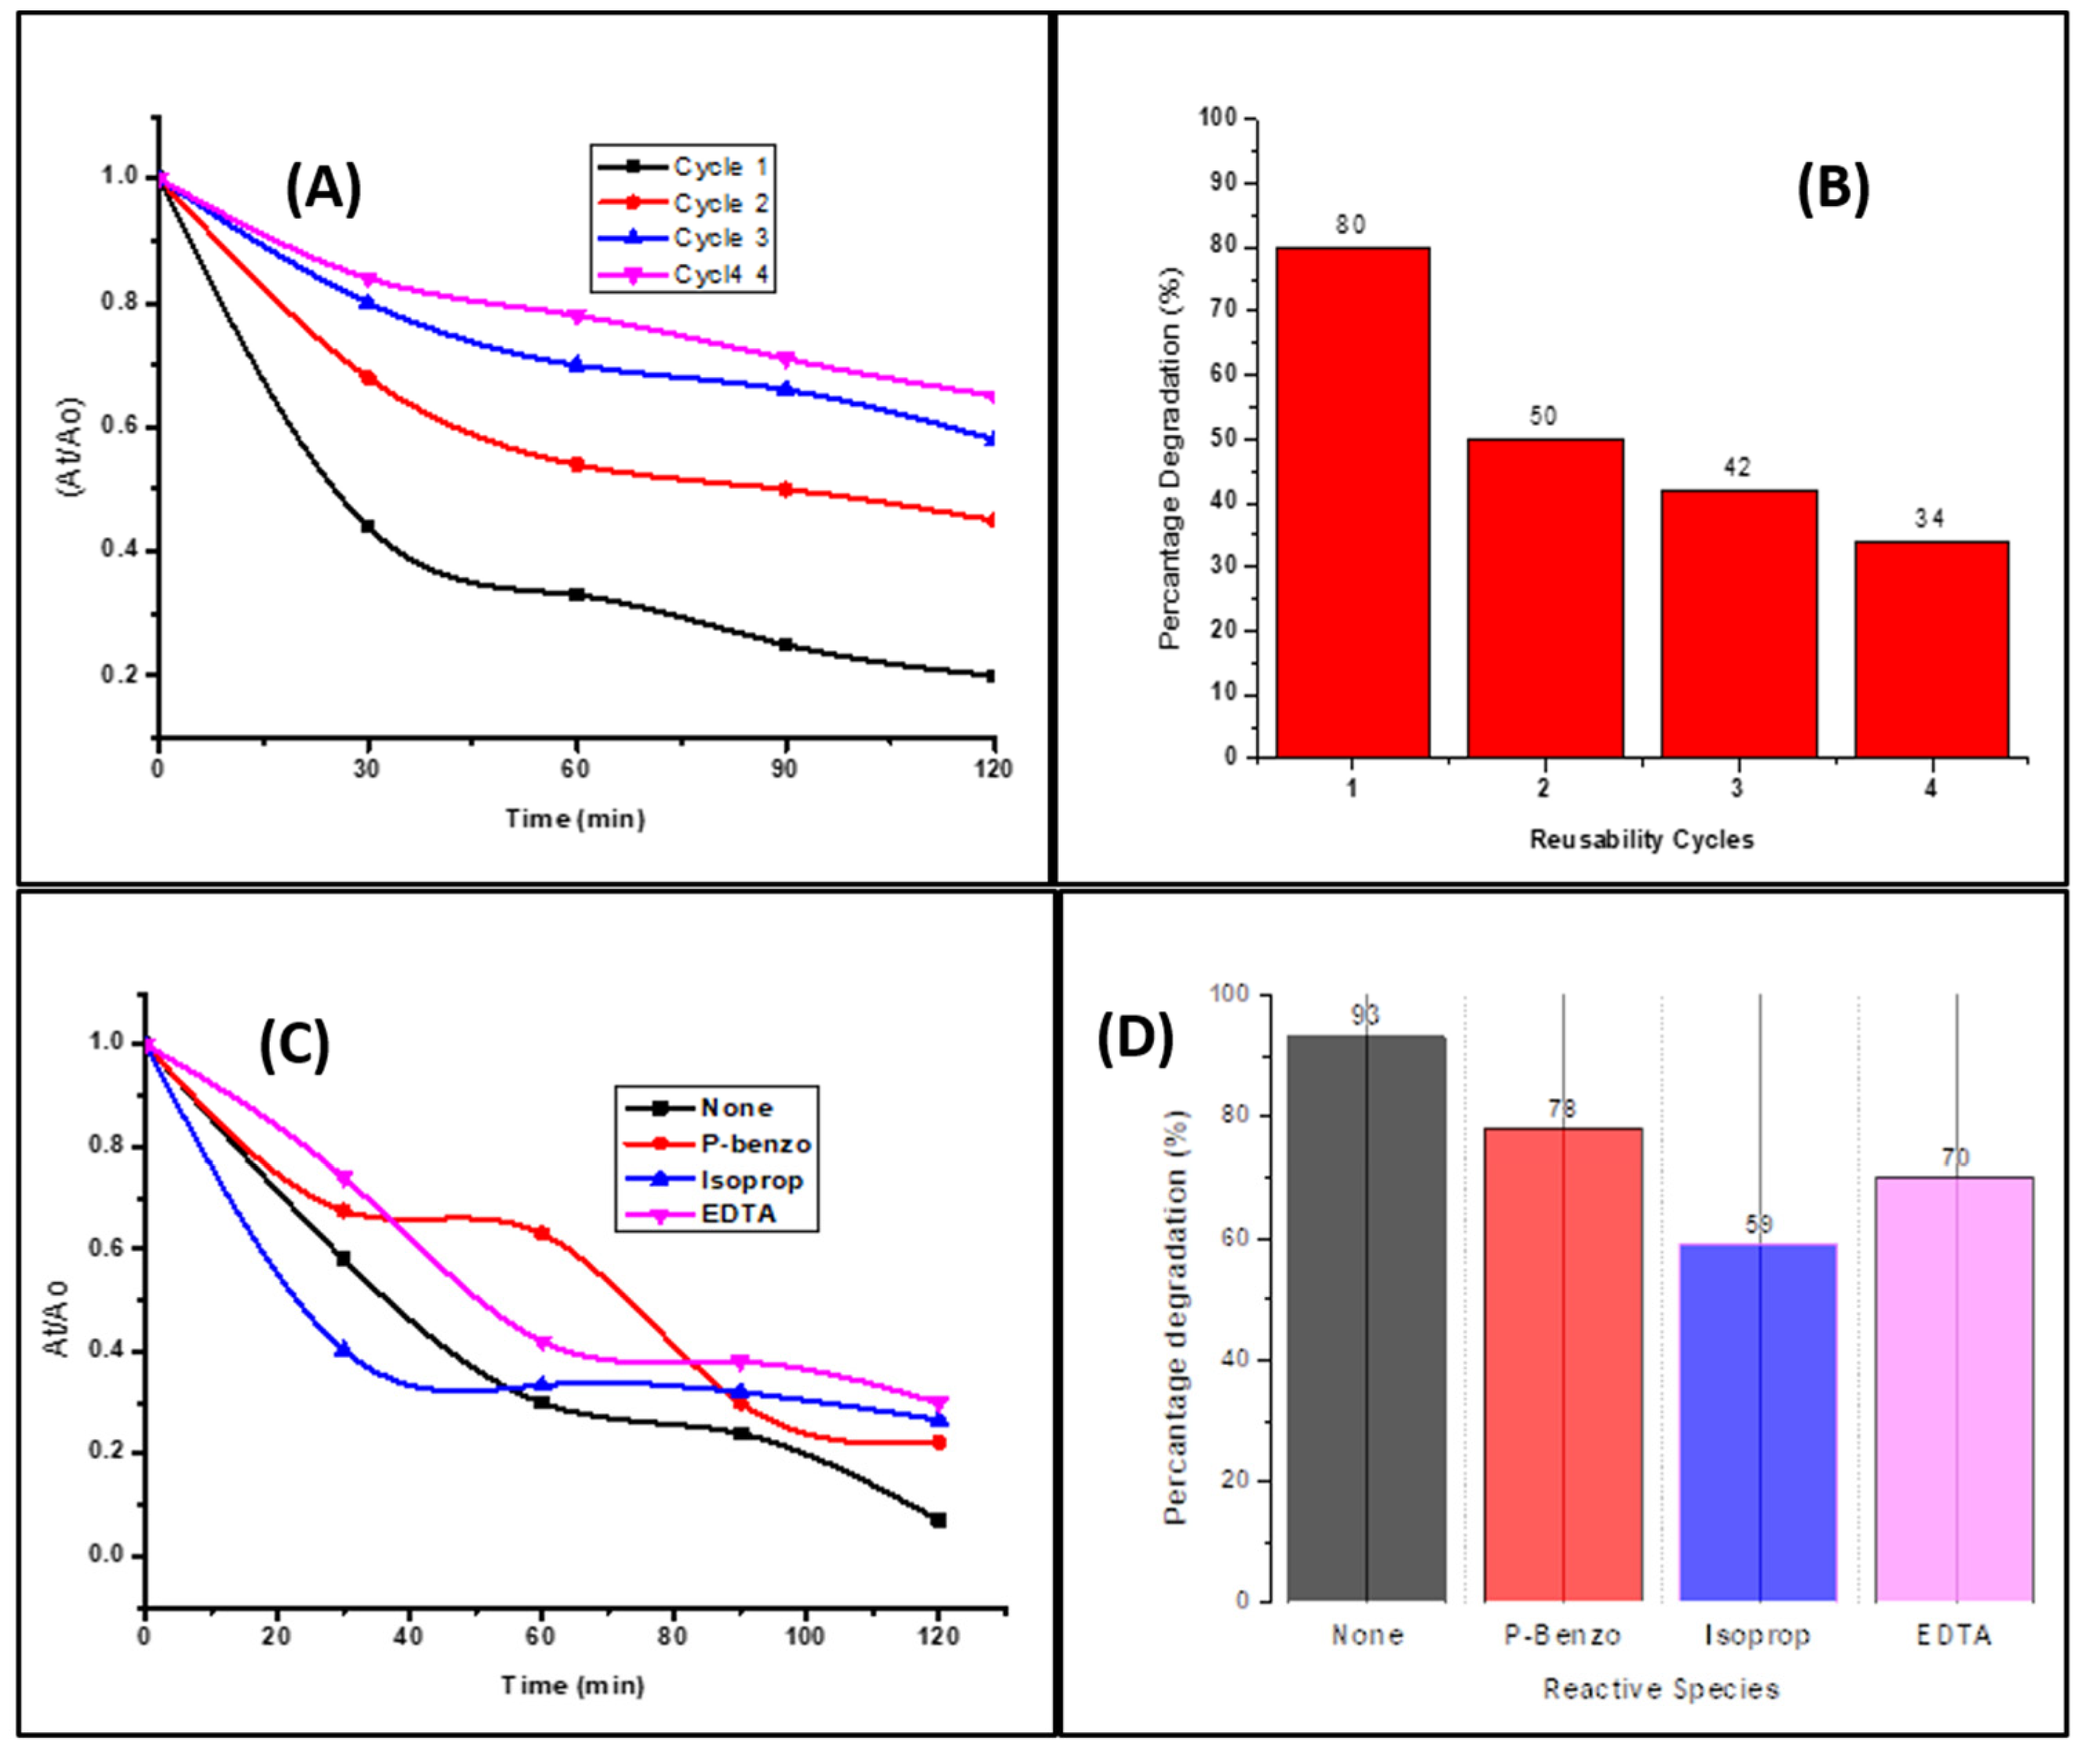
In an effort to test the cost-effectiveness of a material, reusability studies were conducted using the 30/70 CuO-TiO2 NPs for the degradation of SSX. It is important for synthesized materials to not only have a high degradation efficiency but to ensure their material are cost-effective should they be upscaled. In this study, the 30/70 CuO-TiO2 material was tested for its efficiency at least four times. As it can be noted (Figure 12B), the material was not reusable as the efficiency significantly dropped. Upon testing the species responsible for the degradation, it can be noted that the •OH species were the main active species for the degradation of SSX as the degradation dropped to 59% as these species were trapped during the photodegradation process. Other studies have also shown the •OH radicals to be the species responsible for their degradation.
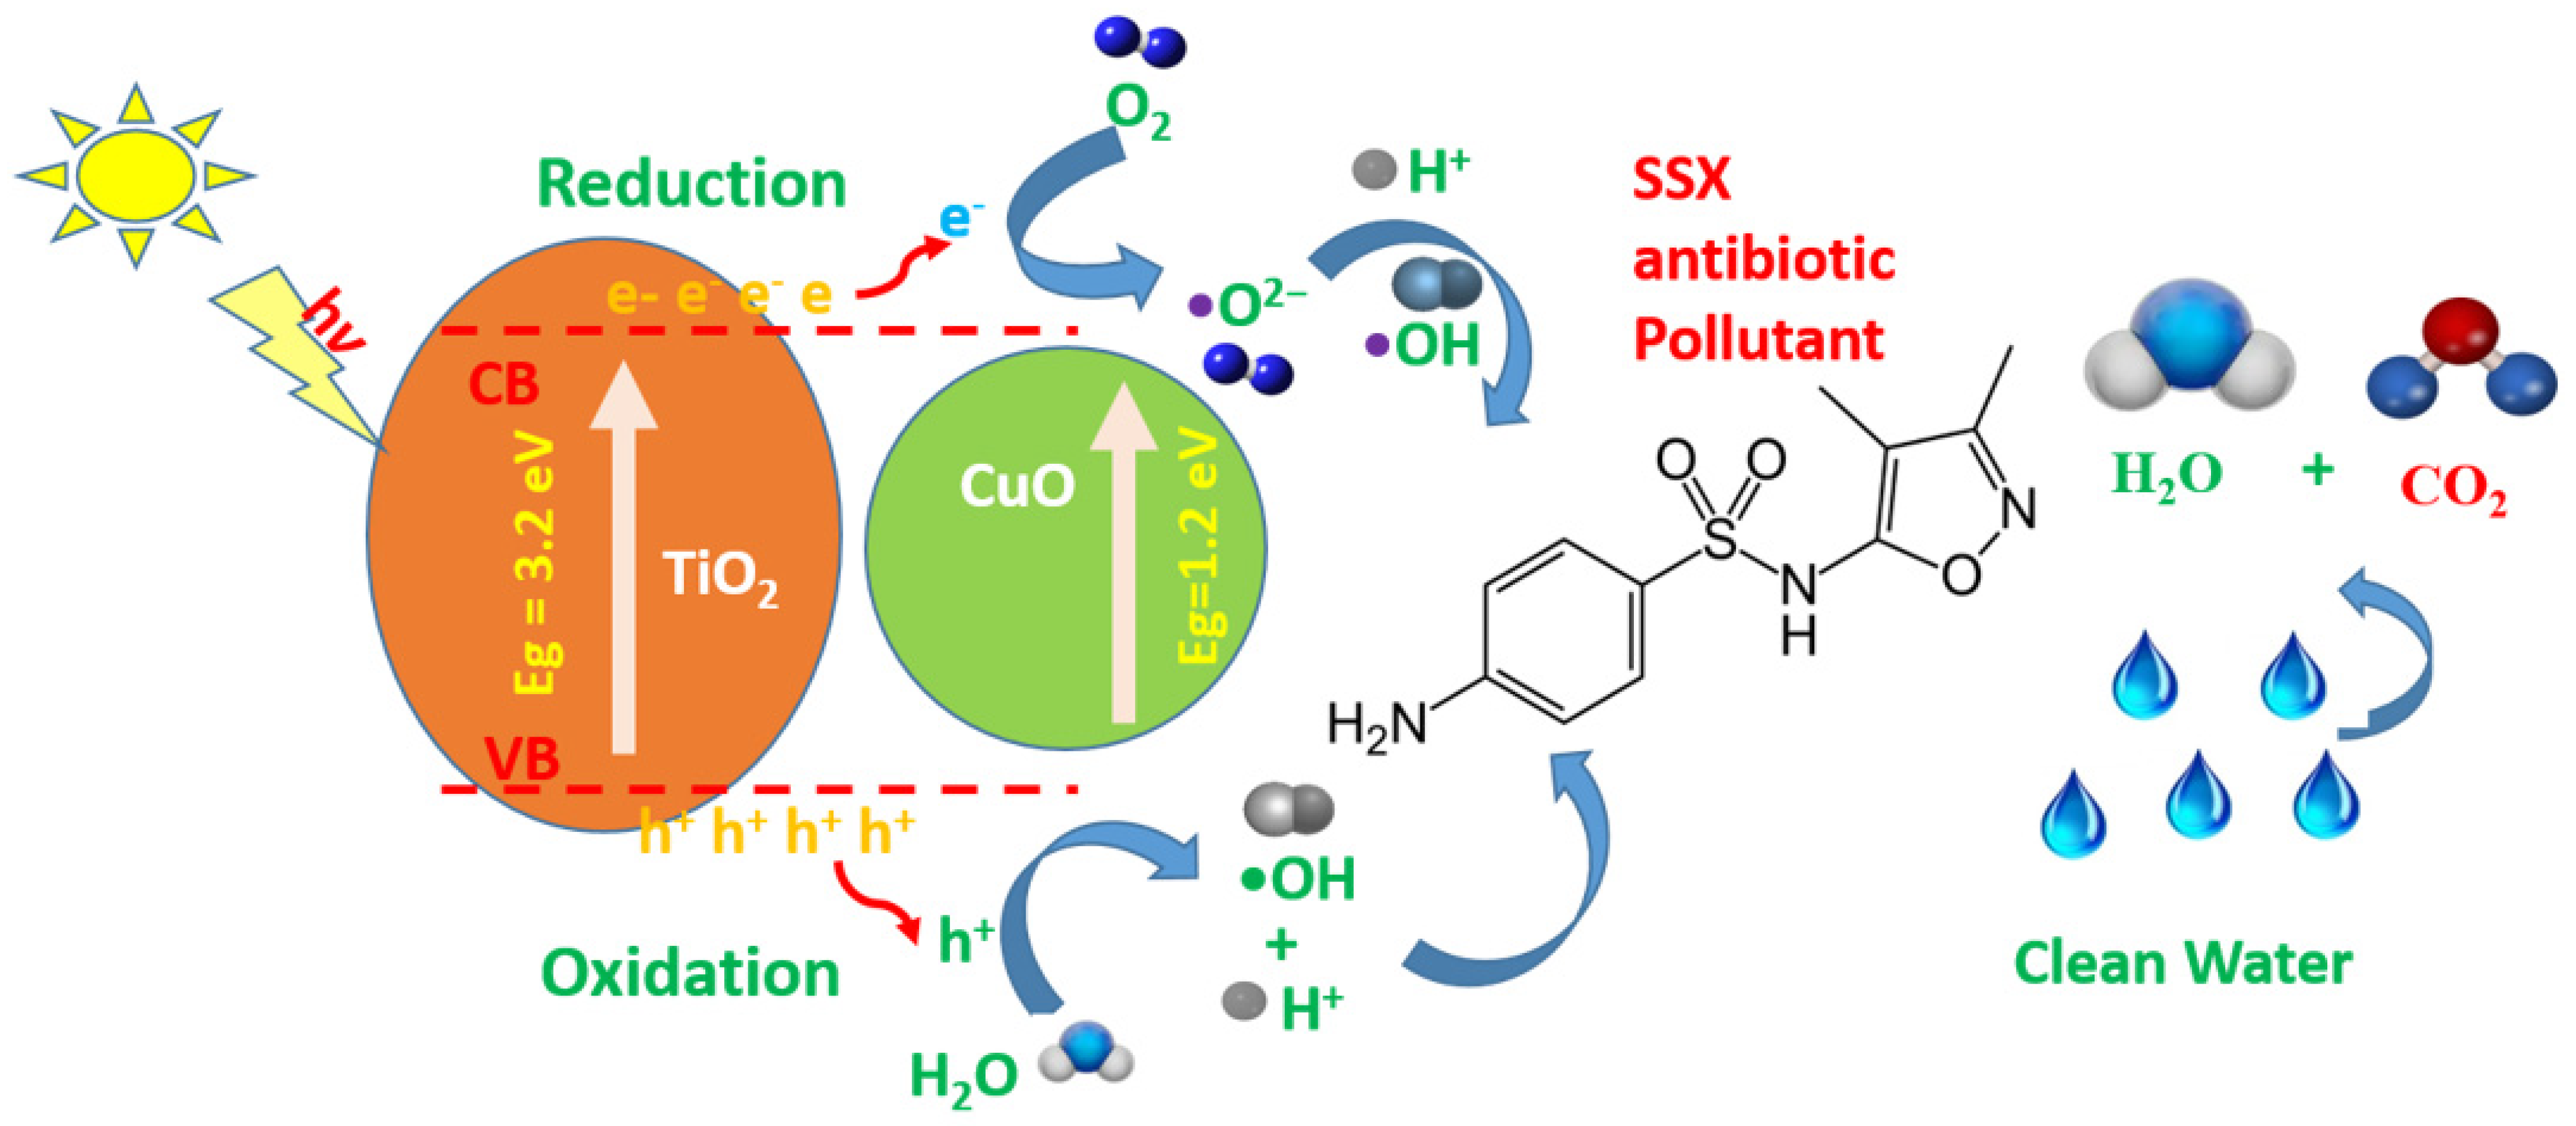
On the basis of the observed photocatalytic activities and the characterizations shown above, a probable mechanism for the photooxidation of SSX is illustrated in Scheme 1. TiO2 is a wide band gap semiconductor; thus, due to its limited access to the wider spectrum, low bandgap materials such as CuO are coupled with it to reduce the recombination rate and fast generation of radicals. Upon irradiating enough light on the photocatalysts, the electrons were excited and moved up to the conduction band of TiO2. These photoexcited electrons reacted with the O2 species that were adsorbed on the TiO2 surface, thus forming the O2 radical anion and the OH radical through the protonation process [43]. Therefore, the CuO, which is a low bandgap material (1.2 eV), assisted in the reduction of the holes and electron recombining. Furthermore, environmentally friendly materials are potentially formed.

3. Experimental Procedure

3.1. Chemicals and Materials

Analytical grade chemicals such as Cu(NO3)2∙3H2O, propan-2-ol (C3H8O), ethylenediaminetetraacetic acid (EDTA), p-benzoquinone (C6H4O2) and ciprofloxacin (CIP), methylene blue (MB), Titanium Fluoride (TiF4) were purchased from Sigma Aldrich, Germany. The pharmaceutical antibiotic sulfisoxazole (SSX) was obtained from the organic group at the University of Limpopo’s Department of Chemistry. Methylene blue dye was purchased from Merck chemicals, Germany. The C. benghalensis plant was harvested, dried, and ground at the University of Limpopo. No further purifications were performed in all the chemicals used.

3.2. Preparation of the Plant Extracts

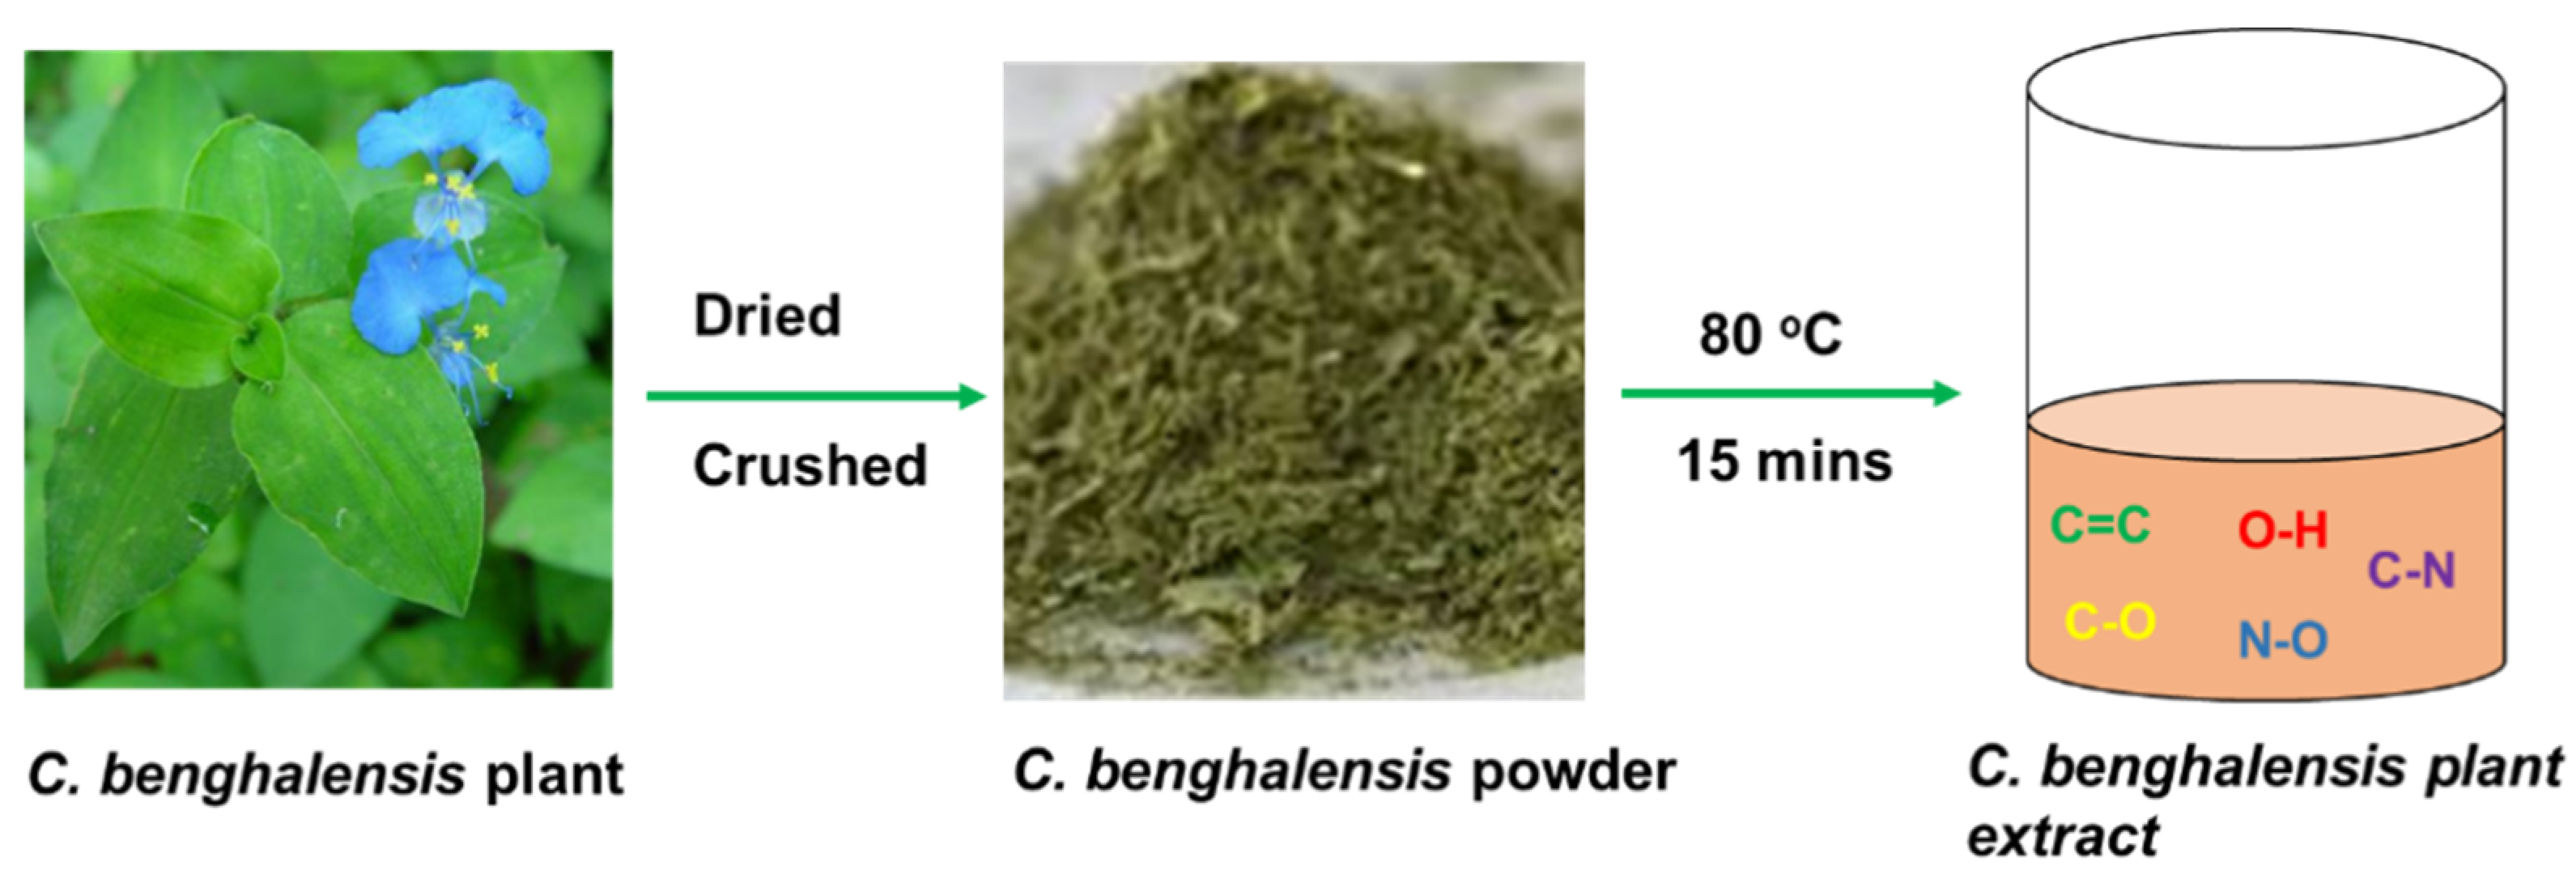
The C. benghalensis plants were collected in the fields of University of Limpopo between September–November (yearly basis). The plant was washed with tap water, then the leaves and flowers were removed in order to work with only the roots and stem. The plant was dried (indoors) for 6–8 weeks. The dry plant was then crushed (using a blender) and stored in an airtight container. The plant extracts of C. benghalensis (See Scheme 2) were prepared in a 500 mL flask containing 250 mL of hot water. A total of 10 g C. benghalensis powder was added and further heated at 80 °C for 15 min. The resulting green-brownish extract was cooled (at room temperature) and then collected by vacuum filtration. The extracts were reserved in a refrigerator for further use.

3.3. Preparation of C. benghalensis-Mediated TiO2 Nanoparticle Synthesis

Green-medisted TiO2-NPs were prepared by mixing 50 mL of 0.5 M TiF4 with an aliquot of 50 mL of 10 g C. benghalensis extract, respectively. The mixture was then heated for two hours at 90 °C until it turned brownish-yellowish color. The mixture was allowed to cool at room temperature before being centrifuged for 30 min at 4000 rpm. It was then washed and centrifuged in distilled water for another 15 min at 4000 rpm. After that, the solid precipitate was transferred to the crucible and calcined for 2 h in a 400 °C furnace before cooling. The product was gathered, crushed, and stored for later.

3.4. Preparation of C. benghalensis-Mediated CuO-NPs

An aliquot of 50 mL of C. benghalensis extract was added to 5 g of cupric nitrate (Cu(NO3)2·3H2O) and then boiled at 80 °C for 1 h until a brown-colored paste was observed. The paste was collected in a ceramic crucible and heated in an air furnace at 400 °C for 2 h. A black powder was obtained, and the product was carefully collected and packed for characterization.

3.5. Synthesis of CuO-TiO2 Nanocomposite

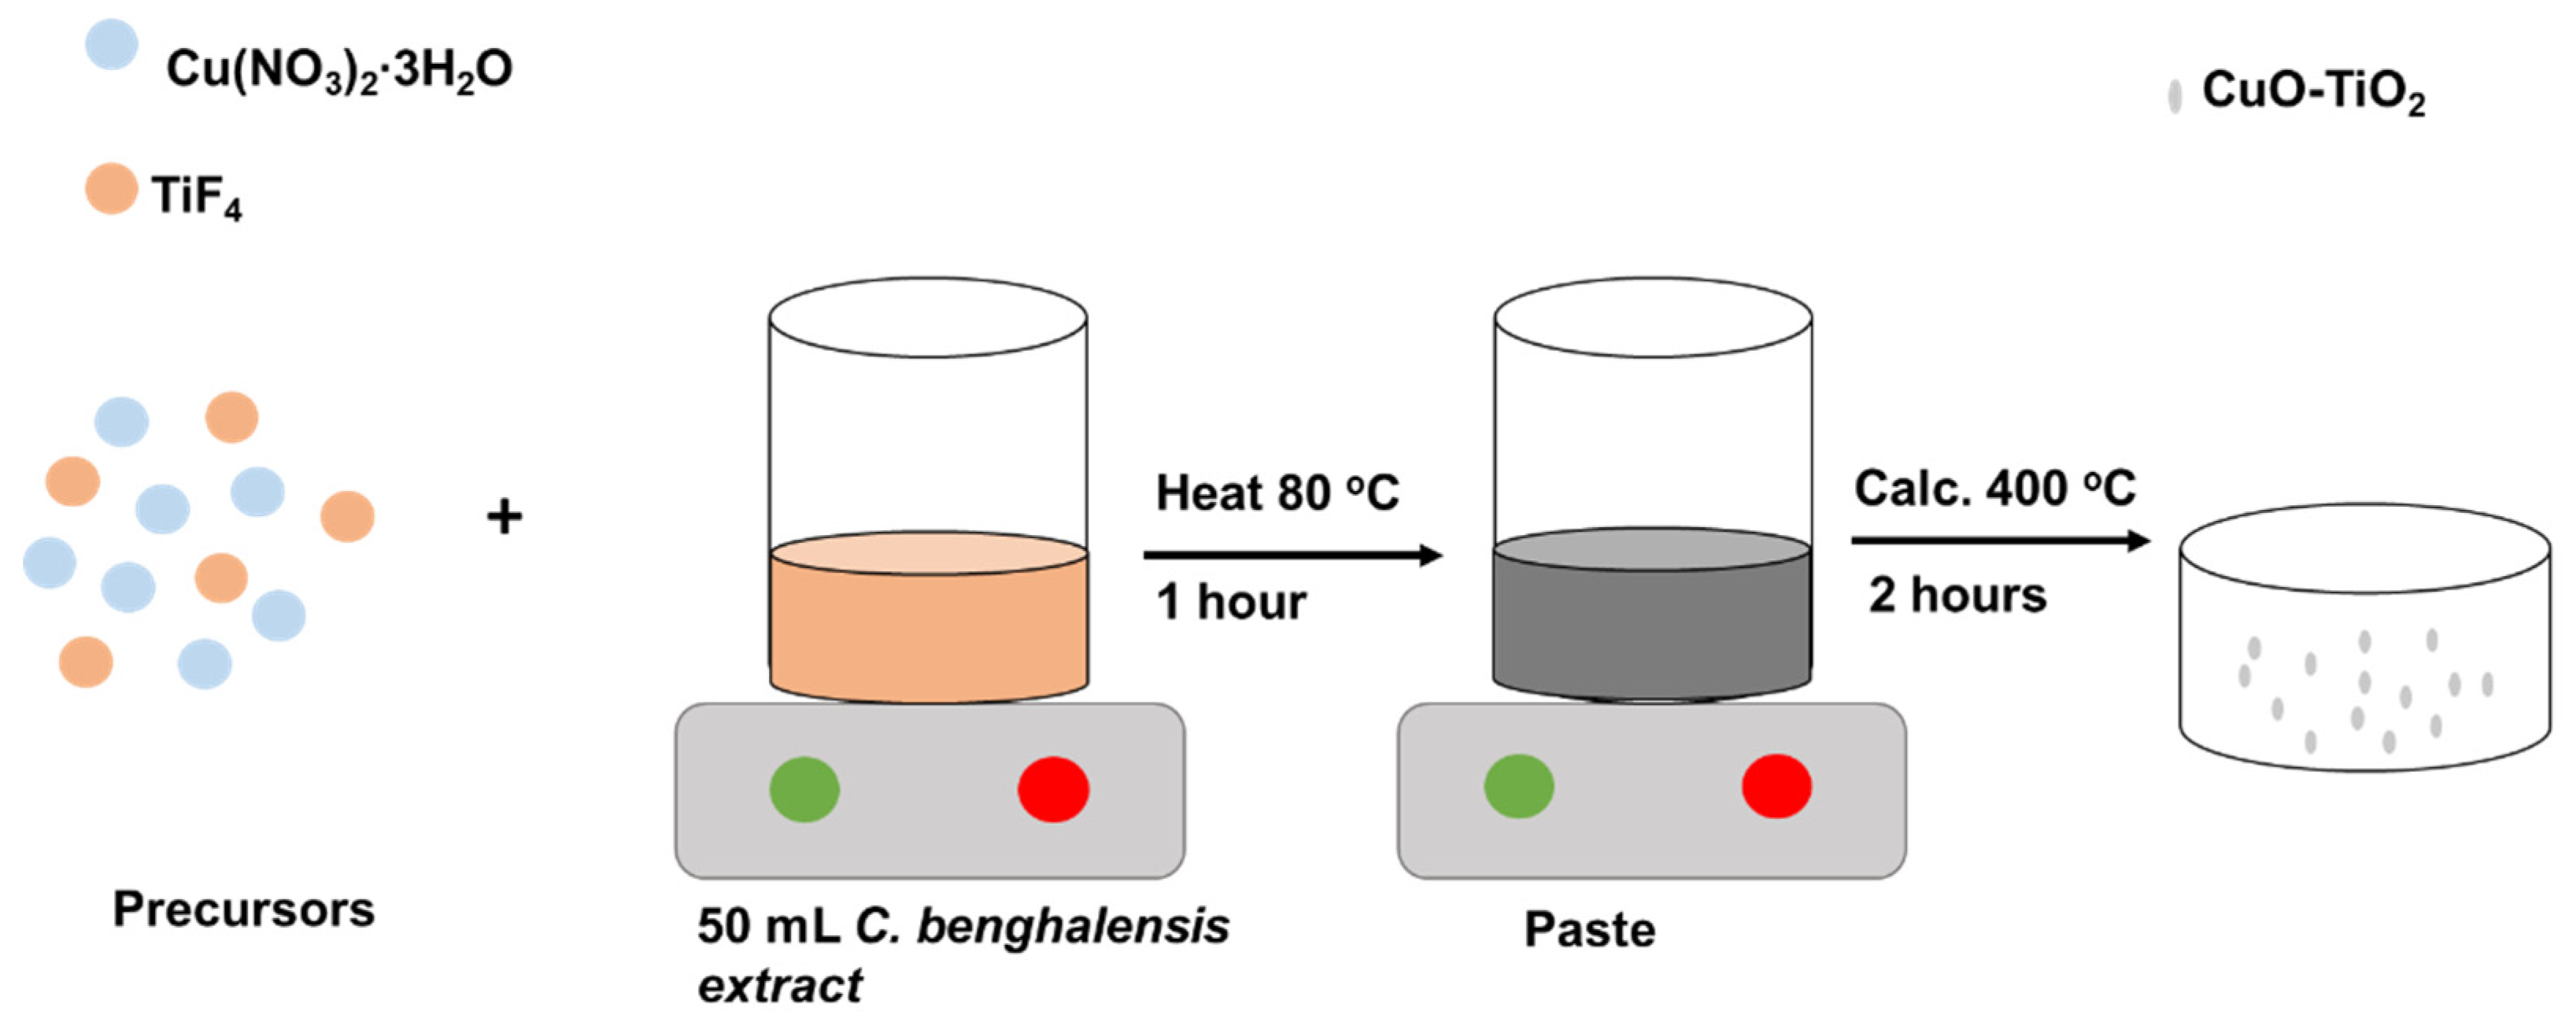
The CuO-TiO2 nanocomposites were synthesized (Scheme 3) by adding an aliquot of 50 mL of the C. benghalensis to the Cu(NO3)23H2O and TiF4 at ratios of 70:30, 50:50, and 30:70, separately. The mixture was heated at 80 °C for an hour to produce a paste. The paste was then transferred into a crucible and calcined in a furnace for 2 h. The products were collected and crushed for further characterization and applications.

3.6. Characterization of CuO-TiO2 Materials

FTIR, over a range of 4000–500 cm−1, was used to study the stretching bond frequencies of the synthesized CuO-TiO2 nanocomposites, phytochemical identification, and nanoparticle synthesis. The optical parameters of the generated materials, as well as the concentration of the dye and pharmaceutical component, were determined using a PerkinElmer Spectrum SP-UV 500VDB spectrophotometer. The bandgap energy (Eg) of CuO-TiO2 nanocomposites was calculated using Tauc’s plot. The crystallinity and phase composition of the materials were determined by scanning for 15 min in the range of 20–90 2θ degrees on a Bruker AXS D8 Advance X-ray Diffractometer (XRD) (Germany). Scanning electron microscopy (SEM), coupled with Image J, was used to determine the particle size distribution and morphology of the samples. The electron-dispersive X-ray (EDX) analysis was used for elemental identification and chemical composition of the nanocomposites. Pore sizes, specific surface area, and pore volume were measured at 196 °C using the Bruner–Emmet–Teller (BET) surface analyzer, with which the sample was heated to 150 °C for 2 h using N2 gas flow. A Perkin Elmer Pyris Thermogravimetric Analyzer (TGA) was used to test the thermal stability, with a thermal analyzer, SDT Q600, heating 10 mg of the sample to 900 °C at a rate of 10 °C/min.

3.7. Electrochemical Experiment

Cyclic voltammetry (CV), linear swept voltammetry (LSV), and electrochemical impedance spectroscopy (EIS) techniques were evaluated to characterize the electrochemical properties of the samples, using an Autolab electrochemical workstation with three electrodes electrochemical cell, namely the modified glassy carbon electrode as a working electrode, Ag/AgCl as a reference and platinum wire as a counter electrode in 0.5 M H2SO4 as an electrolyte. Glassy carbon was modified with 3 different samples, namely CuO-TiO2 (30/70), CuO-TiO2 (50/50) CuO-TiO2 (70/30). The samples were renamed as CuO-TiO2 (30/70): sample 1 (S1), CuO-TiO2 (50/50) sample 2, and (S2) CuO-TiO2 (70/30): sample 3 (S3). The voltametric tests were recorded in the potential range of −0.6 V to 0.6 V at a different scan rate from 2 to 50 mV/s. Before the modification of the glassy carbon electrode, the electrode was polished with 1, 0.5, and 0.03 µm polishing powder and then rinsed with ethanol and distilled water after each polish.

3.8. Preparation of the Modified Electrode

An amount of 3 mg of different powders (S1–S3) was dissolved in 1000 µL of ethanol, and 3 µL of 5% Nafion solution was added; thereafter, the mixtures were ultra-sonicated to make a slurry. Then 3 µL of the solution was drop-coated on the surface area of the glassy carbon electrode and allowed to dry using an oven at 35 °C for 15 min. The electrochemical impedance spectroscopy was recorded over the frequency range of 0.1–100 kHz. Before each electrochemical measurement, the solution was purged using Ar gas for deoxygenation.

3.9. Photocatalytic Degradation of Dyes and Antibiotics

The 30 mg of CuO-TiO2 powder was added in 300 mL of 20 ppm methylene blue (MB), then stirred in a photochemical reactor in the absence of light for 30 min to reach the adsorption-desorption equilibrium. Then, the mixture was exposed to UV light (450 W) for 2 h. Upon exposure to the light, at 30 min intervals, 3 mL of the samples were collected for analysis using the UV-vis spectrophotometer. The גmax of 668 nm for MB was used to monitor the degradation over time. The efficiency of the degradation was calculated by the following equation:
%   Degradation   =   ( Ao Af Ao )   ×   100 %
where:
  • Ao = is the initial absorbance at 0 min (adsorption-desorption).
  • Af = is the final absorbance of 30, 60, 90, and 120 min of photodegradation
Similar steps were followed for the degradation of the antibiotic CIP and SSX, except upon analysis, גmax values of 275 and 290 were used, and the concentration was 10 ppm.

3.10. Recyclability Studies of SSX

To determine both the stability and recyclability of the CuO-TiO2 nanocomposites, then 4 cycle experiments were conducted following similar conditions for normal photocatalytic degradation experiments. After every cycle, the photocatalyst was thoroughly washed with distilled water and recovered by membrane filtration. Then, it was dried at 60 °C to obtain a powder-like material for the next cycle.

3.11. Effect of Scavengers on the Degradation of SSX

To determine the effect of scavengers on the degradation of the SSX, holes (h+), hydroxyl radicals (OH∙), and superoxide (O2) were investigated during the photodegradation process. A measure of 2 mL (5 mmol) of EDTA, isopropyl alcohol, and p-benzoquinone was added, respectively, for each individual experiment. The photodegradation of similar conditions for normal photocatalytic degradation experiments was followed.

4. Conclusions

CuO-TiO2 p-n heterostructured photocatalysts were prepared in this study and tested for the degradation of MB, CIP, and SSX pollutants under UV light irradiations. This research was motivated by the need for highly efficient photocatalysts for the degradation of pollutants in wastewater. The materials were found to be spherical in shape with varied particle sizes, thermally stable, and electrochemically active, which could potentially assist in the photodegradation of the organic pollutants. These materials also displayed high degradation potential against antibiotics CIP and SSX when exposed to UV light. The degradation efficiency of CIP and SSX were recorded to be 67.3% and 93.64%, respectively. Furthermore, it was shown that the heterostructured photocatalysts could not be reused. Additionally, the species that is most active in the photodegradation of SSX was identified as OH•. These heterojunctions were shown to be selective toward antibiotic degradation as compared to dyes.

Supplementary Materials

The following supporting information can be downloaded at: https://www.mdpi.com/article/10.3390/catal13010163/s1, Figure S1. (a) EDS of C. Benhghanlensis TiO2; (b) EDS of C. Benhghanlensis CuO NPs; (c) EDS of C. Benhghanlensis CuOTiO2(30/70); (d) EDS of C. Benhghanlensis CuOTiO2(50/50); € EDS of C. Benhghanlensis CuOTiO2(70/30); Figure S2: SSX photodegradation curves by (a) 30/70 CuO-TiO2 (b) 50/50 CuO-TiO2 (c) 70/30 CuO-TiO2 (d) TiO2 and (e) CuO nanomaterials; Figure S3: CIP photodegradation curves by (a) 30/70 CuO-TiO2 (b) 50/50 CuO-TiO2 (c) 70/30 CuO-TiO2 (d) TiO2 and (e) CuO nanomaterials.

Author Contributions

Conceptualization, N.H-M. and D.E.M.; methodology, D.A.B., S.M., N.M.; formal analysis, D.A.B., S.M., N.M.; investigation, D.A.B., N.M.; resources, N.C.H.-M. and D.E.M.; writing—original draft preparation, D.A.B., N.M.; writing—review and editing N.C.H.-M.; supervision, N.C.H.-M. and D.E.M.; funding acquisition, N.C.H.-M. and D.E.M. All authors have read and agreed to the published version of the manuscript.

Funding

The National Research Foundation and the DSI NRF Centre of Excellence in Strong Materials (grant no. R808-CoE Mbita) provided funding for this work and are greatly acknowledged.

Data Availability Statement

The data can be made available upon request from the authors.

Conflicts of Interest

The authors affirm that they have no known financial or interpersonal conflicts that would have appeared to have an impact on the research presented in this study.

References

  1. Khoshbin, S.; Seyyedi, K. Removal of acid red 1 dye pollutant from contaminated waters by electrocoagulation method using a recirculating tubular reactor. Lat. Am. Appl. Res. 2017, 47, 101–105. [Google Scholar] [CrossRef]
  2. Santhy, K.; Selvapathy, P. Removal of reactive dyes from wastewater by adsorption on coir pith activated carbon. Bioresour. Technol. 2006, 97, 1329–1336. [Google Scholar] [CrossRef] [PubMed]
  3. Gómez, M.J.; Gómez-Ramos, M.M.; Agüera, A.; Mezcua, M.; Herrera, S.; Fernández-Alba, A.R. A new gas chromatography/mass spectrometry method for the simultaneous analysis of target and non-target organic contaminants in waters. J. Chromatogr. A 2009, 1216, 4071–4082. [Google Scholar] [CrossRef] [PubMed]
  4. Aigbe, U.O.; Ukhurebor, K.E.; Onyancha, R.B.; Okundaye, B.; Pal, K.; Osibote, O.A.; Esiekpe, E.L.; Kusuma, H.S.; Darmokoesoemo, H. A facile review on the sorption of heavy metals and dyes using bionanocomposites. Adsorpt. Sci. Technol. 2022, 2022, 8030175. [Google Scholar] [CrossRef]
  5. Arismendi, D.; Becerra-Herrera, M.; Cerrato, I.; Richter, P. Simultaneous determination of multiresidue and multiclass emerging contaminants in waters by rotating-disk sorptive extraction–derivatization-gas chromatography/mass spectrometry. Talanta 2019, 201, 480–489. [Google Scholar] [CrossRef] [PubMed]
  6. Vishnu, D.; Dhandapani, B.; Authilingam, S.; Sivakumar, S.V. A comprehensive review of effective adsorbents used for the removal of dyes from wastewater. Curr. Anal. Chem. 2022, 18, 255–268. [Google Scholar] [CrossRef]
  7. Sridhar, A.; Ponnuchamy, M.; Kapoor, A.; Prabhakar, S. Valorization of food waste as adsorbents for toxic dye removal from contaminated waters: A review. J. Hazard. Mater. 2022, 424, 127432. [Google Scholar] [CrossRef]
  8. Aftab, S.; Shabir, T.; Shah, A.; Nisar, J.; Shah, I.; Muhammad, H.; Shah, N.S. Highly efficient visible light active doped ZnO photocatalysts for the treatment of wastewater contaminated with dyes and pathogens of emerging concern. Nanomaterials 2022, 12, 486. [Google Scholar] [CrossRef]
  9. Zhao, X.; Baharinikoo, L.; Farahani, M.D.; Mahdizadeh, B.; Farizhandi, A.A.K. Experimental modelling studies on the removal of dyes and heavy metal ions using ZnFe2O4 nanoparticles. Sci. Rep. 2022, 12, 5987. [Google Scholar] [CrossRef]
  10. Ariaeenejad, S.; Motamedi, E.; Salekdeh, G.H. Highly efficient removal of dyes from wastewater using nanocellulose from quinoa husk as a carrier for immobilization of laccase. Bioresour. Technol. 2022, 349, 126833. [Google Scholar] [CrossRef]
  11. Kang, S.; Zhao, Y.; Wang, W.; Zhang, T.; Chen, T.; Yi, H.; Rao, F.; Song, S. Removal of methylene blue from water with montmorillonite nanosheets/chitosan hydrogels as adsorbent. Appl. Surf. Sci. 2018, 448, 203–211. [Google Scholar] [CrossRef]
  12. Siddiqui, S.I.; Manzoor, O.; Mohsin, M.; Chaudhry, S.A. Nigella sativa seed based nanocomposite-MnO2/BC: An antibacterial material for photocatalytic degradation, and adsorptive removal of Methylene blue from water. Environ. Res. 2019, 171, 328–340. [Google Scholar] [CrossRef] [PubMed]
  13. Duan, J.; Jian, H.; Dou, Q.; Shi, X.; Su, R. Indirect photodegradation of sulfisoxazole: Effects of environmental factors (CDOM, pH, salinity, HCO3−, metal ions, halogen ions and NO3−). Mar. Pollut. Bull. 2022, 174, 113320. [Google Scholar] [CrossRef] [PubMed]
  14. Orachorn, N.; Bunkoed, O. Nanohybrid magnetic composite optosensing probes for the enrichment and ultra-trace detection of mafenide and sulfisoxazole. Talanta 2021, 228, 122237. [Google Scholar] [CrossRef] [PubMed]
  15. Uhlemann, T.; Seidel, S.; Müller, C.W. Site-specific binding of a water molecule to the sulfa drugs sulfamethoxazole and sulfisoxazole: A laser-desorption isomer-specific UV and IR study. Phys. Chem. Chem. Phys. 2018, 20, 6891–6904. [Google Scholar] [CrossRef]
  16. Girardi, C.; Greve, J.; Lamshöft, M.; Fetzer, I.; Miltner, A.; Schäffer, A.; Kästner, M. Biodegradation of ciprofloxacin in water and soil and its effects on the microbial communities. J. Hazard. Mater. 2011, 198, 22–30. [Google Scholar] [CrossRef]
  17. Igwegbe, C.A.; Oba, S.N.; Aniagor, C.O.; Adeniyi, A.G.; Ighalo, J.O. Adsorption of ciprofloxacin from water: A comprehensive review. J. Ind. Eng. Chem. 2021, 93, 57–77. [Google Scholar] [CrossRef]
  18. Ojo, B.O.; Arotiba, O.A.; Mabuba, N. Sonoelectrochemical degradation of ciprofloxacin in water on a Ti/BaTiO3 electrode. J. Environ. Chem. Eng. 2022, 10, 107224. [Google Scholar] [CrossRef]
  19. Xing, X.; Du, Z.; Zhuang, J.; Wang, D. Removal of ciprofloxacin from water by nitrogen doped TiO2 immobilized on glass spheres: Rapid screening of degradation products. J. Photochem. Photobiol. A Chem. 2018, 359, 23–32. [Google Scholar] [CrossRef]
  20. Soto-Robles, C.A.; Luque, P.A.; Gómez-Gutiérrez, C.M.; Nava, O.; Vilchis-Nestor, A.R.; Lugo-Medina, E.; Ranjithkumar, R.; Castro-Beltrán, A. Study on the effect of the concentration of Hibiscus sabdariffa extract on the green synthesis of ZnO nanoparticles. Results Phys. 2019, 15, 102807. [Google Scholar] [CrossRef]
  21. Ngoepe, N.M.; Mathipa, M.M.; Hintsho-Mbita, N.C. Biosynthesis of titanium dioxide for the degradation of methylene blue and removal of bacteria. Optik 2020, 224, 165728. [Google Scholar] [CrossRef]
  22. Jang, Y.J.; Simer, C.; Ohm, T. Comparison of zinc oxide nanoparticles and its nano-crystalline particles on the photocatalytic degradation of methylene blue. Mater. Res. Bull. 2006, 41, 67–77. [Google Scholar] [CrossRef]
  23. Munyai, S.; Hintsho-Mbita, N.C. Green derived metal suphides as photocatalysts for wastewater treatment. A review. Curr. Res. Green Sustain. Chem. 2021, 4, 100163. [Google Scholar] [CrossRef]
  24. Lv, Y.; Liu, J.; Zhang, Z.; Zhang, W.; Wang, A.; Tian, F.; Zhao, W.; Yan, J. Green synthesis of CuO nanoparticles-loaded ZnO nanowires arrays with enhanced photocatalytic activity. Mater. Chem. Phys. 2021, 267, 124703. [Google Scholar] [CrossRef]
  25. Bopape, D.A.; Motaung, D.E.; Hintsho-Mbita, N.C. Green synthesis of ZnO: Effect of plant concentration on the morphology, optical properties and photodegradation of dyes and antibiotics in wastewater. Optik 2022, 251, 168459. [Google Scholar] [CrossRef]
  26. Prabu, H.J.; Varghese, R.; Johnson, I.; Sundaram, S.J.; Raj, A.D.; Rajakrishnan, R.; Kuppusamy, P.; Sathya, R.; Kaviyarasu, K. Laser induced plant leaf extract mediated synthesis of CuO nanoparticles and its photocatalytic activity. Environ. Res. 2022, 212, 113295. [Google Scholar] [CrossRef]
  27. Chowdhury, I.H.; Ghosh, S.; Basak, S.; Naskar, M.K. Mesoporous CuO-TiO2 microspheres for efficient catalytic oxidation of CO and photodegradation of methylene blue. J. Phys. Chem. Solids 2017, 104, 103–110. [Google Scholar] [CrossRef]
  28. Patil, B.N.; Taranath, T.C. Limonia acidissima L. leaf mediated synthesis of silver and zinc oxide nanoparticles and their antibacterial activities. Microb. Pathog. 2018, 115, 227–232. [Google Scholar] [CrossRef]
  29. Lu, D.; Zelekew, O.A.; Abay, A.K.; Huang, Q.; Chen, X.; Zheng, Y. Synthesis and photocatalytic activities of a CuO/TiO2 composite catalyst using aquatic plants with accumulated copper as a template. RSC Adv. 2019, 9, 2018–2025. [Google Scholar] [CrossRef] [Green Version]
  30. Khodadadi, B.; Yeganeh Faal, A.; Shahvarughi, A. Tilia platyphyllos extract assisted green synthesis of CuO/TiO2 nanocomposite: Application as a reusable catalyst for the reduction of organic dyes in water. J. Appl. Chem. Res. 2019, 13, 51–65. [Google Scholar]
  31. Ibrahim, J.; Ajaegbu, V.C.; Egharevba, H.O. Pharmacognostic and phytochemical analysis of Commelina benghalensis L. Ethnobot. Leafl. 2010, 2010, 7. [Google Scholar]
  32. Johnson, I.; Prabu, H.J. Green synthesis and characterization of silver nanoparticles by leaf extracts of Cycas circinalis, Ficus amplissima, Commelina benghalensis and Lippia nodiflora. Int. Nano Lett. 2015, 5, 43–51. [Google Scholar] [CrossRef]
  33. Feng, Y.; Yan, X.; Liu, C.; Hong, Y.; Zhu, L.; Zhou, M.; Shi, W. Hydrothermal synthesis of CdS/Bi2MoO6 heterojunction photocatalysts with excellent visible-light-driven photocatalytic performance. Appl. Surf. Sci. 2015, 353, 87–94. [Google Scholar] [CrossRef]
  34. Karim, K.M.R.; Jebi, M.A.P.; Ong, H.R.; Abdullah, H.; Tarek, M.; Cheng, C.K.; Khan, M.M.R. CuO-TiO2 as a visible light responsive photocatalyst for the photoelectroreduction of CO2 to methanol. Natl. Conf. Postgrad. Res. 2018, 103–111. [Google Scholar]
  35. Gnanasekaran, L.; Pachaiappan, R.; Kumar, P.S.; Hoang, T.K.; Rajendran, S.; Durgalakshmi, D.; Soto-Moscoso, M.; Cornejo-Ponce, L.; Gracia, F. Visible light driven exotic p (CuO)-n (TiO2) heterojunction for the photodegradation of 4-chlorophenol and antibacterial activity. Environ. Pollut. 2021, 287, 117304. [Google Scholar] [CrossRef] [PubMed]
  36. Muzakki, A.; Shabrany, H.; Saleh, R. Synthesis of ZnO/CuO and TiO2/CuO nanocomposites for light and ultrasound assisted degradation of a textile dye in aqueous solution. AIP Conf. Proc. 2016, 1725, 020051. [Google Scholar]
  37. Kubiak, A.; Bielan, Z.; Kubacka, M.; Gabała, E.; Zgoła-Grześkowiak, A.; Janczarek, M.; Zalas, M.; Zielińska-Jurek, A.; Siwińska-Ciesielczyk, K.; Jesionowski, T. Microwave-assisted synthesis of a TiO2-CuO heterojunction with enhanced photocatalytic activity against tetracycline. Appl. Surf. Sci. 2020, 520, 146344. [Google Scholar] [CrossRef]
  38. Zangeneh, H.; Farhadian, M.; Zinatizadeh, A.A. N (Urea) and CN (L-Asparagine) doped TiO2-CuO nanocomposites: Fabrication, characterization and photodegradation of direct red 16. J. Environ. Chem. Eng. 2020, 8, 103639. [Google Scholar] [CrossRef]
  39. Zhang, S.; Gong, X.; Shi, Q.; Ping, G.; Xu, H.; Waleed, A.; Li, G. CuO nanoparticle-decorated TiO2-nanotube heterojunctions for direct synthesis of methyl formate via photo-oxidation of methanol. ACS Omega 2020, 5, 15942–15948. [Google Scholar] [CrossRef]
  40. Shi, Q.; Qin, Z.; Yu, C.; Waheed, A.; Xu, H.; Gao, Y.; Abroshan, H.; Li, G. Experimental and mechanistic understanding of photo-oxidation of methanol catalyzed by CuO/TiO2-spindle nanocomposite: Oxygen vacancy engineering. Nano Res. 2020, 13, 939–946. [Google Scholar] [CrossRef]
  41. Yu, Y.H.; Chen, Y.P.; Cheng, Z. Microwave-assisted synthesis of rod-like CuO/TiO2 for high-efficiency photocatalytic hydrogen evolution. Int. J. Hydrogen Energy 2015, 40, 15994–16000. [Google Scholar] [CrossRef]
  42. Ashok, C.H.; Venkateswara Rao, K. Microwave-assisted synthesis of CuO/TiO2 nanocomposite for humidity sensor application. J. Mater. Sci. Mater. Electron. 2016, 27, 8816–8825. [Google Scholar] [CrossRef]
  43. Fouda, A.; Salem, S.S.; Wassel, A.R.; Hamza, M.F.; Shaheen, T.I. Optimization of green biosynthesized visible light active CuO/ZnO nano-photocatalysts for the degradation of organic methylene blue dye. Heliyon 2020, 6, e04896. [Google Scholar] [CrossRef] [PubMed]
  44. Gou, X.; Guo, Z. Hybrid Hydrophilic–Hydrophobic CuO@ TiO2-Coated Copper Mesh for Efficient Water Harvesting. Langmuir 2019, 36, 64–73. [Google Scholar] [CrossRef]
  45. Tayeb, A.M.; Hussein, D.S. Synthesis of TiO2 nanoparticles and their photocatalytic activity for methylene blue. Am. J. Nanomater. 2015, 3, 57–63. [Google Scholar]
  46. Sankar, R.; Manikandan, P.; Malarvizhi, V.; Fathima, T.; Shivashangari, K.S.; Ravikumar, V. Green synthesis of colloidal copper oxide nanoparticles using Carica papaya and its application in photocatalytic dye degradation. Spectrochim. Acta Part A Mol. Biomol. Spectrosc. 2014, 121, 746–750. [Google Scholar] [CrossRef]
  47. Lingaraju, K.; Naika, H.R.; Manjunath, K.; Nagaraju, G.; Suresh, D.; Nagabhushana, H. Rauvolfia serpentina-mediated green synthesis of CuO nanoparticles and its multidisciplinary studies. Acta Metall. Sin. (Engl. Lett.) 2015, 28, 1134–1140. [Google Scholar] [CrossRef]
  48. Mofokeng, L.E.; Hlekelele, L.; Moma, J.; Tetana, Z.N.; Chauke, V.P. Energy-efficient CuO/TiO2@ GCN cellulose acetate-based membrane for concurrent filtration and photodegradation of ketoprofen in drinking and groundwater. Appl. Sci. 2022, 12, 1649. [Google Scholar] [CrossRef]
  49. Castañeda, C.; Martínez, J.J.; Santos, L.; Rojas, H.; Osman, S.M.; Gómez, R.; Luque, R. Caffeine photocatalytic degradation using composites of NiO/TiO2–F and CuO/TiO2–F under UV irradiation. Chemosphere 2022, 288, 132506. [Google Scholar] [CrossRef]
  50. Hajipour, P.; Eslami, A.; Bahrami, A.; Hosseini-Abari, A.; Saber, F.Y.; Mohammadi, R.; Mehr, M.Y. Surface modification of TiO2 nanoparticles with CuO for visible-light antibacterial applications and photocatalytic degradation of antibiotics. Ceram. Int. 2021, 47, 33875–33885. [Google Scholar] [CrossRef]
  51. Cosma, D.; Urda, A.; Radu, T.; Rosu, M.C.; Mihet, M.; Socaci, C. Evaluation of the Photocatalytic Properties of Copper Oxides/Graphene/TiO2 Nanoparticles Composites. Molecules 2022, 27, 5803. [Google Scholar] [CrossRef]
  52. Li, Y.; Fu, Y.; Zhu, M. Green synthesis of 3D tripyramid TiO2 architectures with assistance of aloe extracts for highly efficient photocatalytic degradation of antibiotic ciprofloxacin. Appl. Catal. B Environ. 2020, 260, 118149. [Google Scholar] [CrossRef]
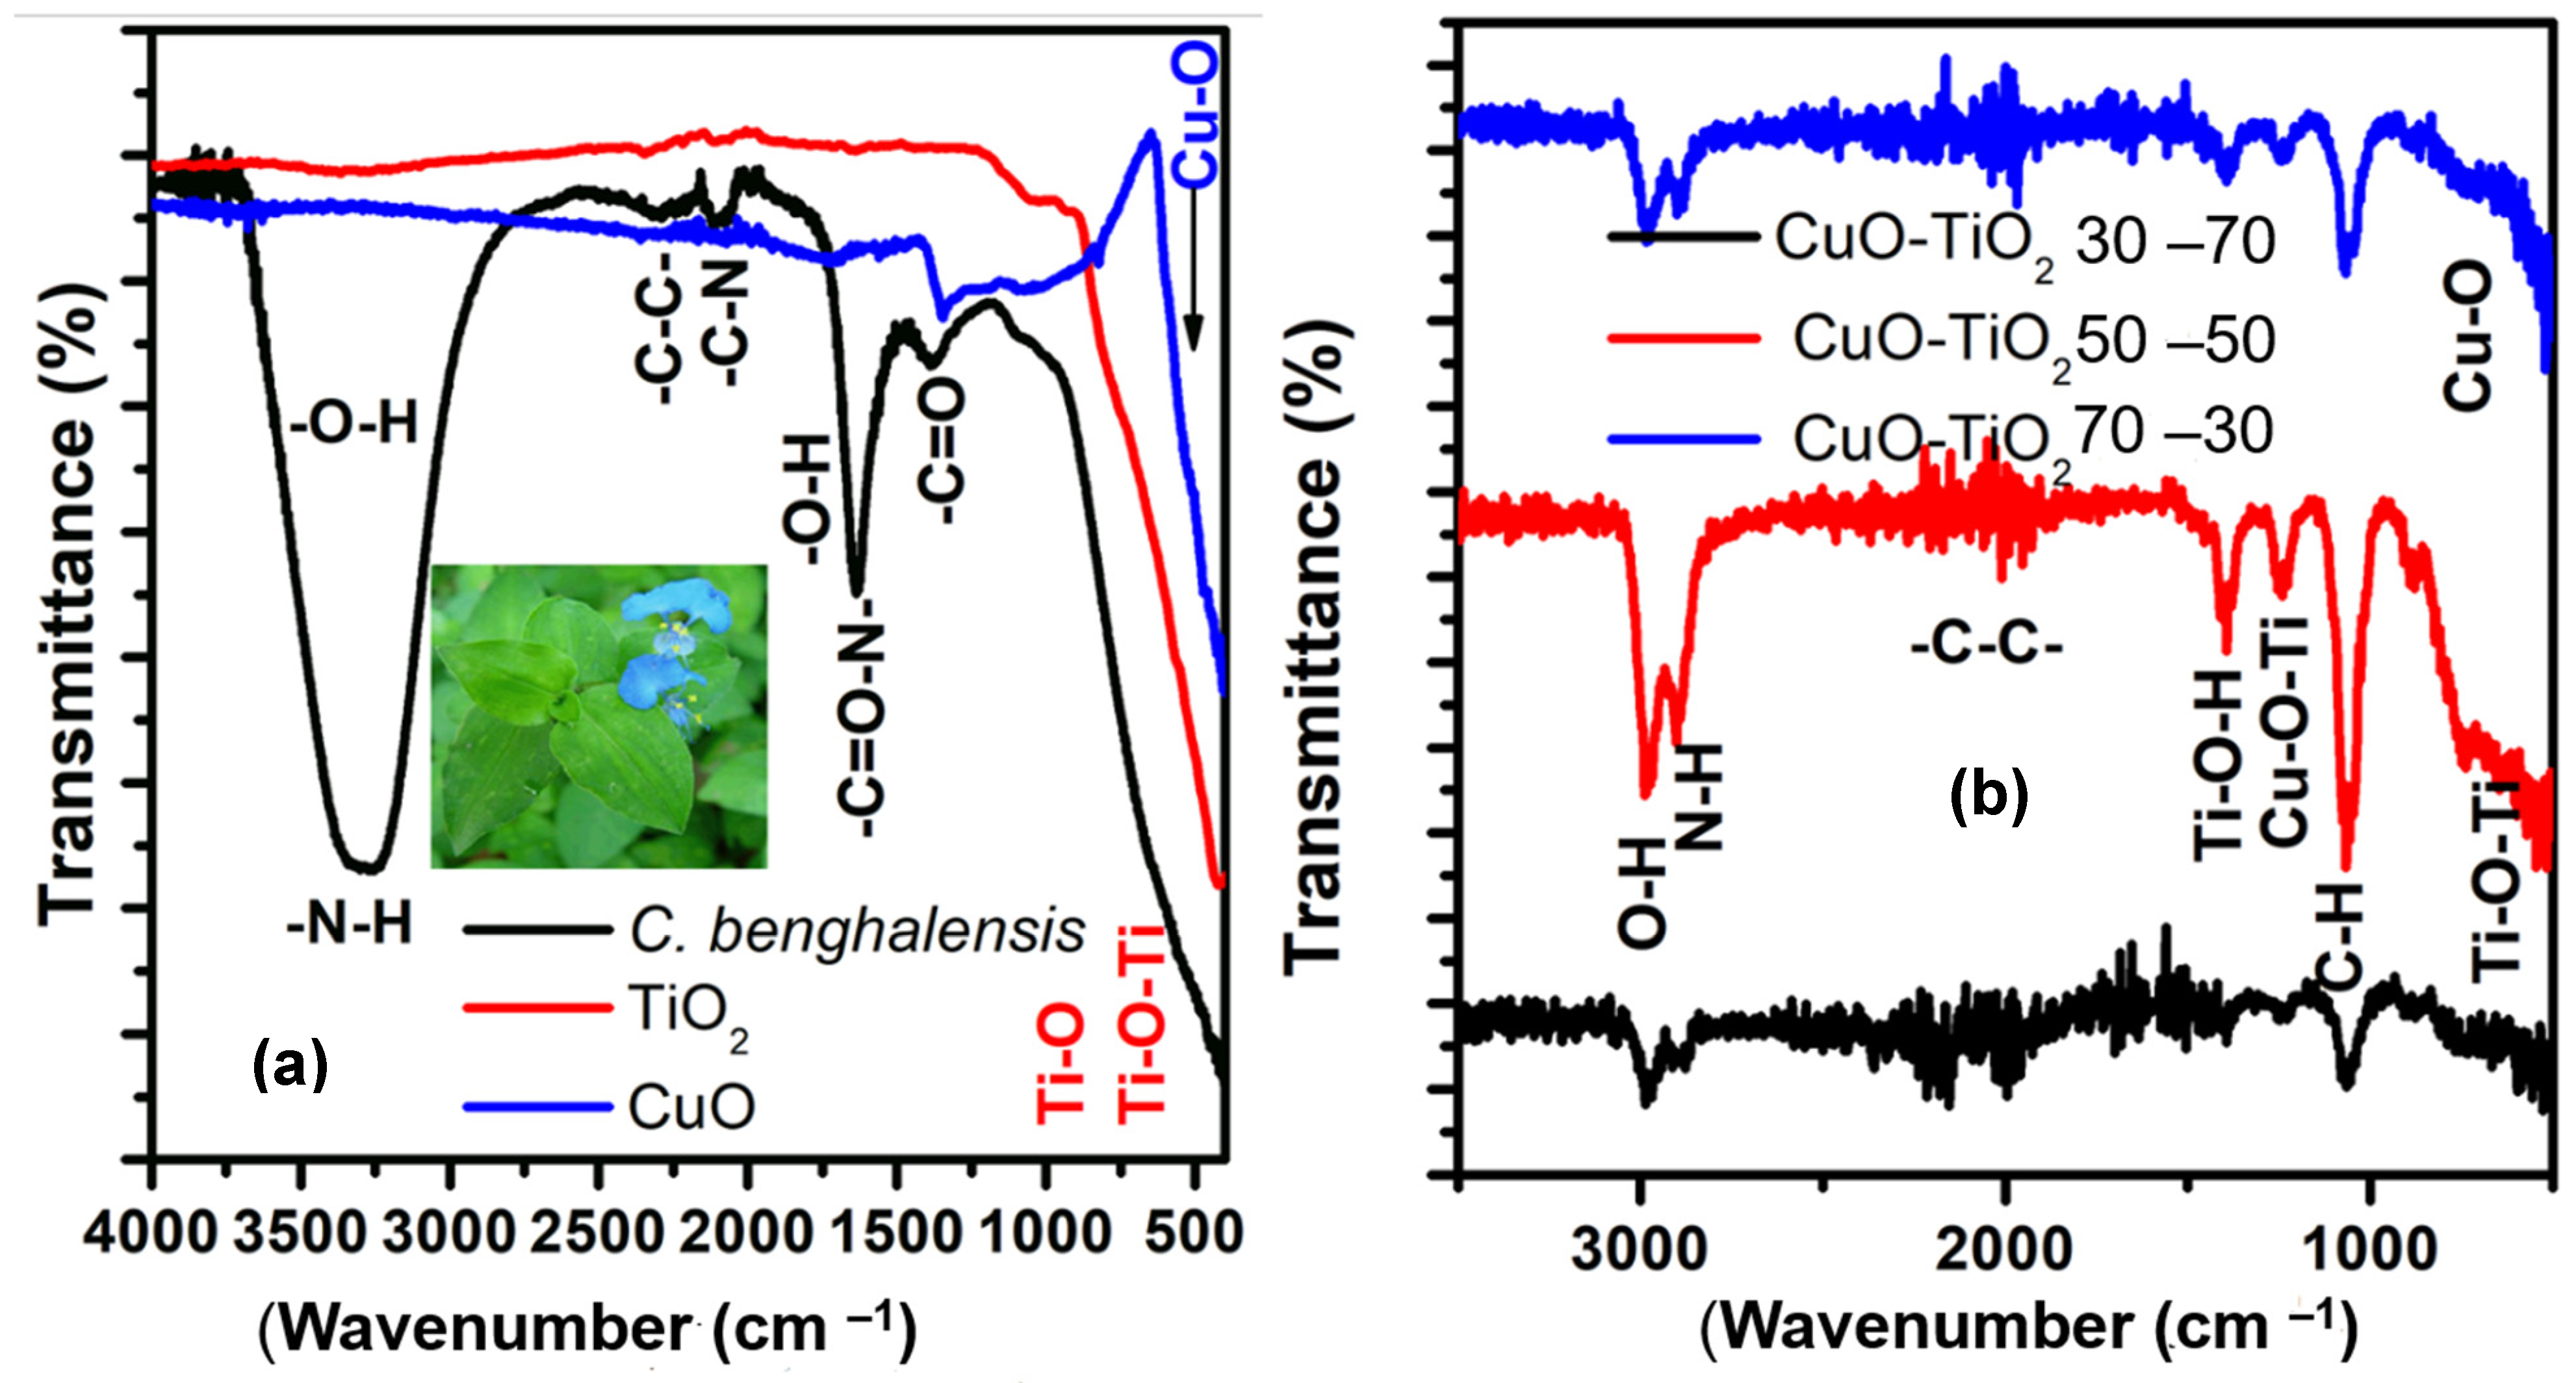
Figure 1. (a) FTIR diagram for the C. benghalensis extract, TiO2, and CuO and the (b) CuO-TiO2 nanocomposites with different compositions.
Catalysts 13 00163 g001
Figure 2. (a) UV-vis curves for CuO-TiO2 (30/70, 50/50, and 70/30) and the corresponding (b) Tauc’s plot.
Catalysts 13 00163 g002
Figure 4. (aj) SEM images for TiO2, CuO, and CuO-TiO2 (30/70, 50/50, and 70/30) and their (ko) particle size distributions.
Catalysts 13 00163 g004
Figure 5. (a) TGA diagrams and (b) the derivatives diagrams of TiO2, CuO, and CuO-TiO2 (30/70, 50/50, and 70/30).
Catalysts 13 00163 g005
Figure 6. The adsorption-desorption isotherms (ae) with the pore volume distribution curve (inset) and (f) the surface area diagrams for TiO2, CuO, and CuO-TiO2 (30/70, 50/50, and 70/30).
Catalysts 13 00163 g006
Figure 8. Cyclic voltammetric at different scan rates (2–50 mV/s). (A): GCE/ CuO-TiO2 30/70 (S1) (B): GCE/ CuO-TiO2 50/50 (S2) and (C) GCE/ CuO-TiO2 70/30 (S3) in 0.5 M H2SO4 as an electrolyte.
Catalysts 13 00163 g008
Figure 9. Nyquist plot of GCE/ CuO-TiO2 30/70 (S1) GCE/ CuO-TiO2 50/50 (S2): GCE/ CuO-TiO2 70/30 (S3) in 0.5 M H2SO4 as an electrolyte.
Catalysts 13 00163 g009
Figure 10. (A) Photodegradation of MB by CuO, TiO2, and various ratios of CuO-TiO2 and (B) kinetics study of the CuO-TiO2.
Catalysts 13 00163 g010
Figure 11. (A) Photocatalytic degradation of various materials against SSX and CIP, (B) kinetics of CIP, and (C) kinetics of SSX.
Catalysts 13 00163 g011
Figure 12. (A,B) Reusability studies, (C,D) effect of reactive.
Catalysts 13 00163 g012
Scheme 1. For the mechanism of degradation.
Catalysts 13 00163 sch001
Scheme 2. C. benghalensis plant extract preparation.
Catalysts 13 00163 sch002
Scheme 3. Green synthesis of CuO-TiO2 nanocomposite.
Catalysts 13 00163 sch003
Table 1. The IR peaks depicted for C. benghalensis plant extract, C. benghalensis-mediated CuO, and TiO2 nanoparticles.
WavenumberCompoundCorrespondenceFunctional GroupRefs.
3345 cm−1
3356 cm−1
3335 cm−1
30/70 CuO-TiO2
50/50 CuO-TiO2
70/30 CuO-TiO2
O-H (stretch)
H- (bonded)
Phenols[31,32,33,34]
3335 cm−1C. benghalensisN-H (vibrations) Amide proteins[31,34]
2210
2335
TiO2C-H (stretch)Alkanes[35]
1925
2094
TiO2
CuO
-C-C-Stretch[35]
1641 cm−1CuO
TiO2
C. benghalensis
(NH)C=OII amines[31,32,33,34]
1557 cm−1CuON-H (bending)I amines[35]
1361 cm−1CuO-TiO2Cu-O-Ti (stretch)Metal oxides[37,38]
1010 cm−1TiO2O-H (bending)Alkyl halides[35]
411 cm−1
916 cm−1
1010 cm−1
TiO2Ti-O (bending)
Ti-O-Ti (bending)
Alkyl halides[36,37,38]
516 cm−1
832 cm−1
1052 cm−1
CuOCu-O (stretch)Metal oxide[35]
Disclaimer/Publisher’s Note: The statements, opinions and data contained in all publications are solely those of the individual author(s) and contributor(s) and not of MDPI and/or the editor(s). MDPI and/or the editor(s) disclaim responsibility for any injury to people or property resulting from any ideas, methods, instructions or products referred to in the content.