Article

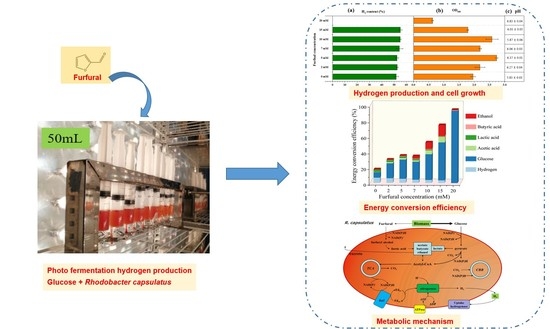
Furfural Influences Hydrogen Evolution and Energy Conversion in Photo-Fermentation by Rhodobacter capsulatus

State Key Laboratory of Multiphase Flow in Power Engineering, Xi’an Jiaotong University, Xi’an 710049, China
*
Author to whom correspondence should be addressed.
Catalysts 2022, 12(9), 979; https://doi.org/10.3390/catal12090979
Submission received: 3 August 2022 / Revised: 26 August 2022 / Accepted: 27 August 2022 / Published: 31 August 2022
(This article belongs to the Special Issue Photocatalysis for Energy Transformation Reactions)

Abstract

:
Furfural, as a typical byproduct produced during the hydrolysis of lignocellulose biomass, is harmful to the photo fermentation hydrogen production. In this work, the effects of furfural on the photo fermentation hydrogen production by Rhodobacter capsulatus using glucose as substrate were investigated. The characteristics of cell growth, hydrogen production, and fermentation end-products with the addition of different concentrations of furfural (0–20 mM) were studied. The results showed that furfural negatively affected the maximum hydrogen production rate and total hydrogen yield. The maximum hydrogen yield of 2.59 ± 0.13 mol-H2/mol-glucose was obtained without furfural. However, 5 mM furfural showed a 40% increase in cell concentration. Furfural in high concentrations can favor the overproduction and accumulation of inhibitive end-products. Further analysis of energy conversion efficiency showed that most of the energy in the substrate was underused and unconverted when the furfural concentration was high. The maximum glucose consumption (93%) was achieved without furfural, while it dramatically declined to 7% with 20 mM furfural addition. The index of half-maximal inhibitory concentration was calculated as 13.40 mM. Moreover, the possible metabolic pathway of furfural and glucose was discussed.

Graphical Abstract

1. Introduction

With the rapid consumption of traditional fossil fuels and the drastic climate change, it is urgent to explore environmentally friendly and high-quality renewable energy. There is no denying that biomass energy is an integral part of developing new energy since it merges the advantages of low-cost, renewability, no pollution, and easy availability. As an essential cell factory in utilizing biomass energy, microbes convert low-value wastes generated in production activities into high-value compounds through mild metabolic reactions in vivo and production processes in vitro, which are of ongoing concern to researchers.
Purple non-sulfur bacteria are experts in flexible respiration, robust photosynthesis, and nitrogen fixation. In particular, their abundant metabolic mechanism sharply broadens our appreciation of their ability to handle complex substrates. In the photoheterotrophic process, they obtain reducing power through substrate carbon assimilation, and the proton motive force received through photosynthesis is used to synthesize ATP. When cells are over-reduced, and the nitrogenase is available, they direct excess electrons [1] and protons to the nitrogenase, where the Fe protein cycle and partial Lowe-Thorneley cycle implement hydrogen evolution [2,3]. Due to the characteristics of nitrogenase and its strong metabolic ability, purple non-sulfur bacteria are widely used in biological hydrogen production [4,5,6]. On the other hand, light-harvesting semiconductor nanomaterials such as CdS have also been utilized for photocatalytic hydrogen production [7,8], often performed in vitro. It is worth noting that when Co3C or Fe3C is used as a cocatalyst, the photocatalytic performance of CdS is significantly improved, which suggests that the ternary system of Co3C (Fe3C)/CdS/MoFe protein can be constructed to achieve efficient in vitro photocatalytic hydrogen production [9,10].
As well-known plant biomass, lignocellulose is primarily derived from agricultural waste (wheat straw, straw, rice husk, corn straw, peanut shell, bagasse, algae, etc.), forest residue (sawdust, wood stem, leave, etc.), industrial waste (papermaking waste, etc.) and municipal solid waste [11], and its output up to 1.3 billion tons per year, which shows high production potential [12]. Lignocellulose is mainly made of cellulose, hemicellulose, and lignin, in which the components are bonded stably by non-covalent and covalent crosslinking [13,14]. To date, research efforts have focused on the pretreatment stage of lignocellulose since it is a crucial step in improving digestibility and utilization of cellulose and hemicellulose, removing part of the lignin [15], and relieving the enzyme pressure of microbial degradation. Current pretreatment methods can be grouped into mechanical, physicochemical (thermal), chemical, and biological pretreatment. In particular, chemical pretreatment of lignocellulose degradation is the most commonly used method. It can usually achieve the best rate of pretreatment, the realization of cellulose crystallinity decreases significantly, and parts of the hemicellulose are completely dissolved [16,17].
In acid-dependent chemical pretreatment, hydrogen hydrates from acid catalysts cause the glycosidic bonds between lignocellulosic and hemicellulose to break down to form sugar monomers [12]. Nevertheless, this treatment inevitably leads to large amounts of chemical residue, some exhibiting toxic inhibition, posing challenges for subsequent biological fermentation processes. For instance, the representative inhibitors, furfural and 5-hydroxymethylfurfural (HMF), are formed by hydrolysis of pentose and hexose with dilute acids (e.g.; sulfuric acid) at a concentration of 10% or less, at high temperature and pressure. Cytotoxicity of the inhibitors is proposed to be related to inducing the production of reactive oxygen species [18], damaging cell walls and membranes, inhibiting cell growth, down-regulating enzyme activity, breaking down DNA, and inhibiting downstream synthesis [19]. In summary, furfural and HMF, which cannot be eliminated in the pretreatment process, are thought to cause multilevel damage to cells and hamper the bioavailability of lignocellulose.
At the same time, more and more events about the detoxification of cells are observed under the influence of low concentrations of furfural and HMF. Generally speaking, intracellular redox levels and the unique function of redox enzymes are considered critical for detoxifying furfural. In Saccharomyces cerevisiae, Furfural and HMF induce the yeast to express some genes vital to the pentose phosphate pathway and converted to 2-furfuryl alcohol and 2,5-furan-2,5-dimethanol by NAD(P)H-dependent reductase activity of various enzymes and reducing power in cells and further degraded into small molecular acids [20,21]. Aldehyde/ketone reductase and short-chain dehydrogenase/reductase from Clostridium beijerinckii are involved in NADPH coupling reduction of furfural to furfuryl alcohol [22]. Structural and biochemical evidence suggests that YugJ from Bacillus subtilis is an atypical NADPH-dependent group III AAOR, which can reduce furan aldehyde in the presence of Ni2+ cofactors [23].
To realize the application of lignocellulosic in hydrogen production by biological fermentation, the effect of furfural on hydrogen production by biological fermentation should not be ignored. The addition of furan derivatives inhibited H2 production, resulting in a sharp decrease in H2 production, and only 0.45 mol hydrogen was produced per mole of xylose (1 g/L furfural) [24]. Slight furfural (0.2 g/L and 0.4 g/L) can increase the content of nitrogenase and increase the hydrogen production of HAU-M1 by 19% and 14%, respectively [25]. In addition, previous work suggests that Rhodobacter sphaeroides can decompose furfural and 5-hydroxymethylfurfural under light conditions, suggesting this bacteria is an ideal biocatalyst for value-added utilization of industrial and agricultural wastes [26]. However, different microbes respond differently to furfural, and more research is needed to assess the impact of furfural on specific microorganisms during hydrogen fermentation. Rhodobacter capsulatus, another model organism for purple non-sulfur bacteria, is able to thrive under very different growth conditions through numerous transcriptional changes [27], which greatly reduces the cost as well as the operational complexity of biological hydrogen production. Indeed, the mechanism underlying the furfural tolerance of R. capsulatus is still poorly understood, which poses a challenge to biological hydrogen production under the influence of furfural.
The purpose of this study is to study the effect of furfural on hydrogen production by photo fermentation of R. capsulatus. The impacts of furfural on hydrogen evolution, fermentation end-products, and cell growth in hydrogen production using glucose and furfural as substrates were studied. The energy conversion efficiency and hydrogen production kinetics were also studied. Moreover, the possible metabolic mechanism of furfural and glucose at low concentrations was discussed.

2. Results and Discussion

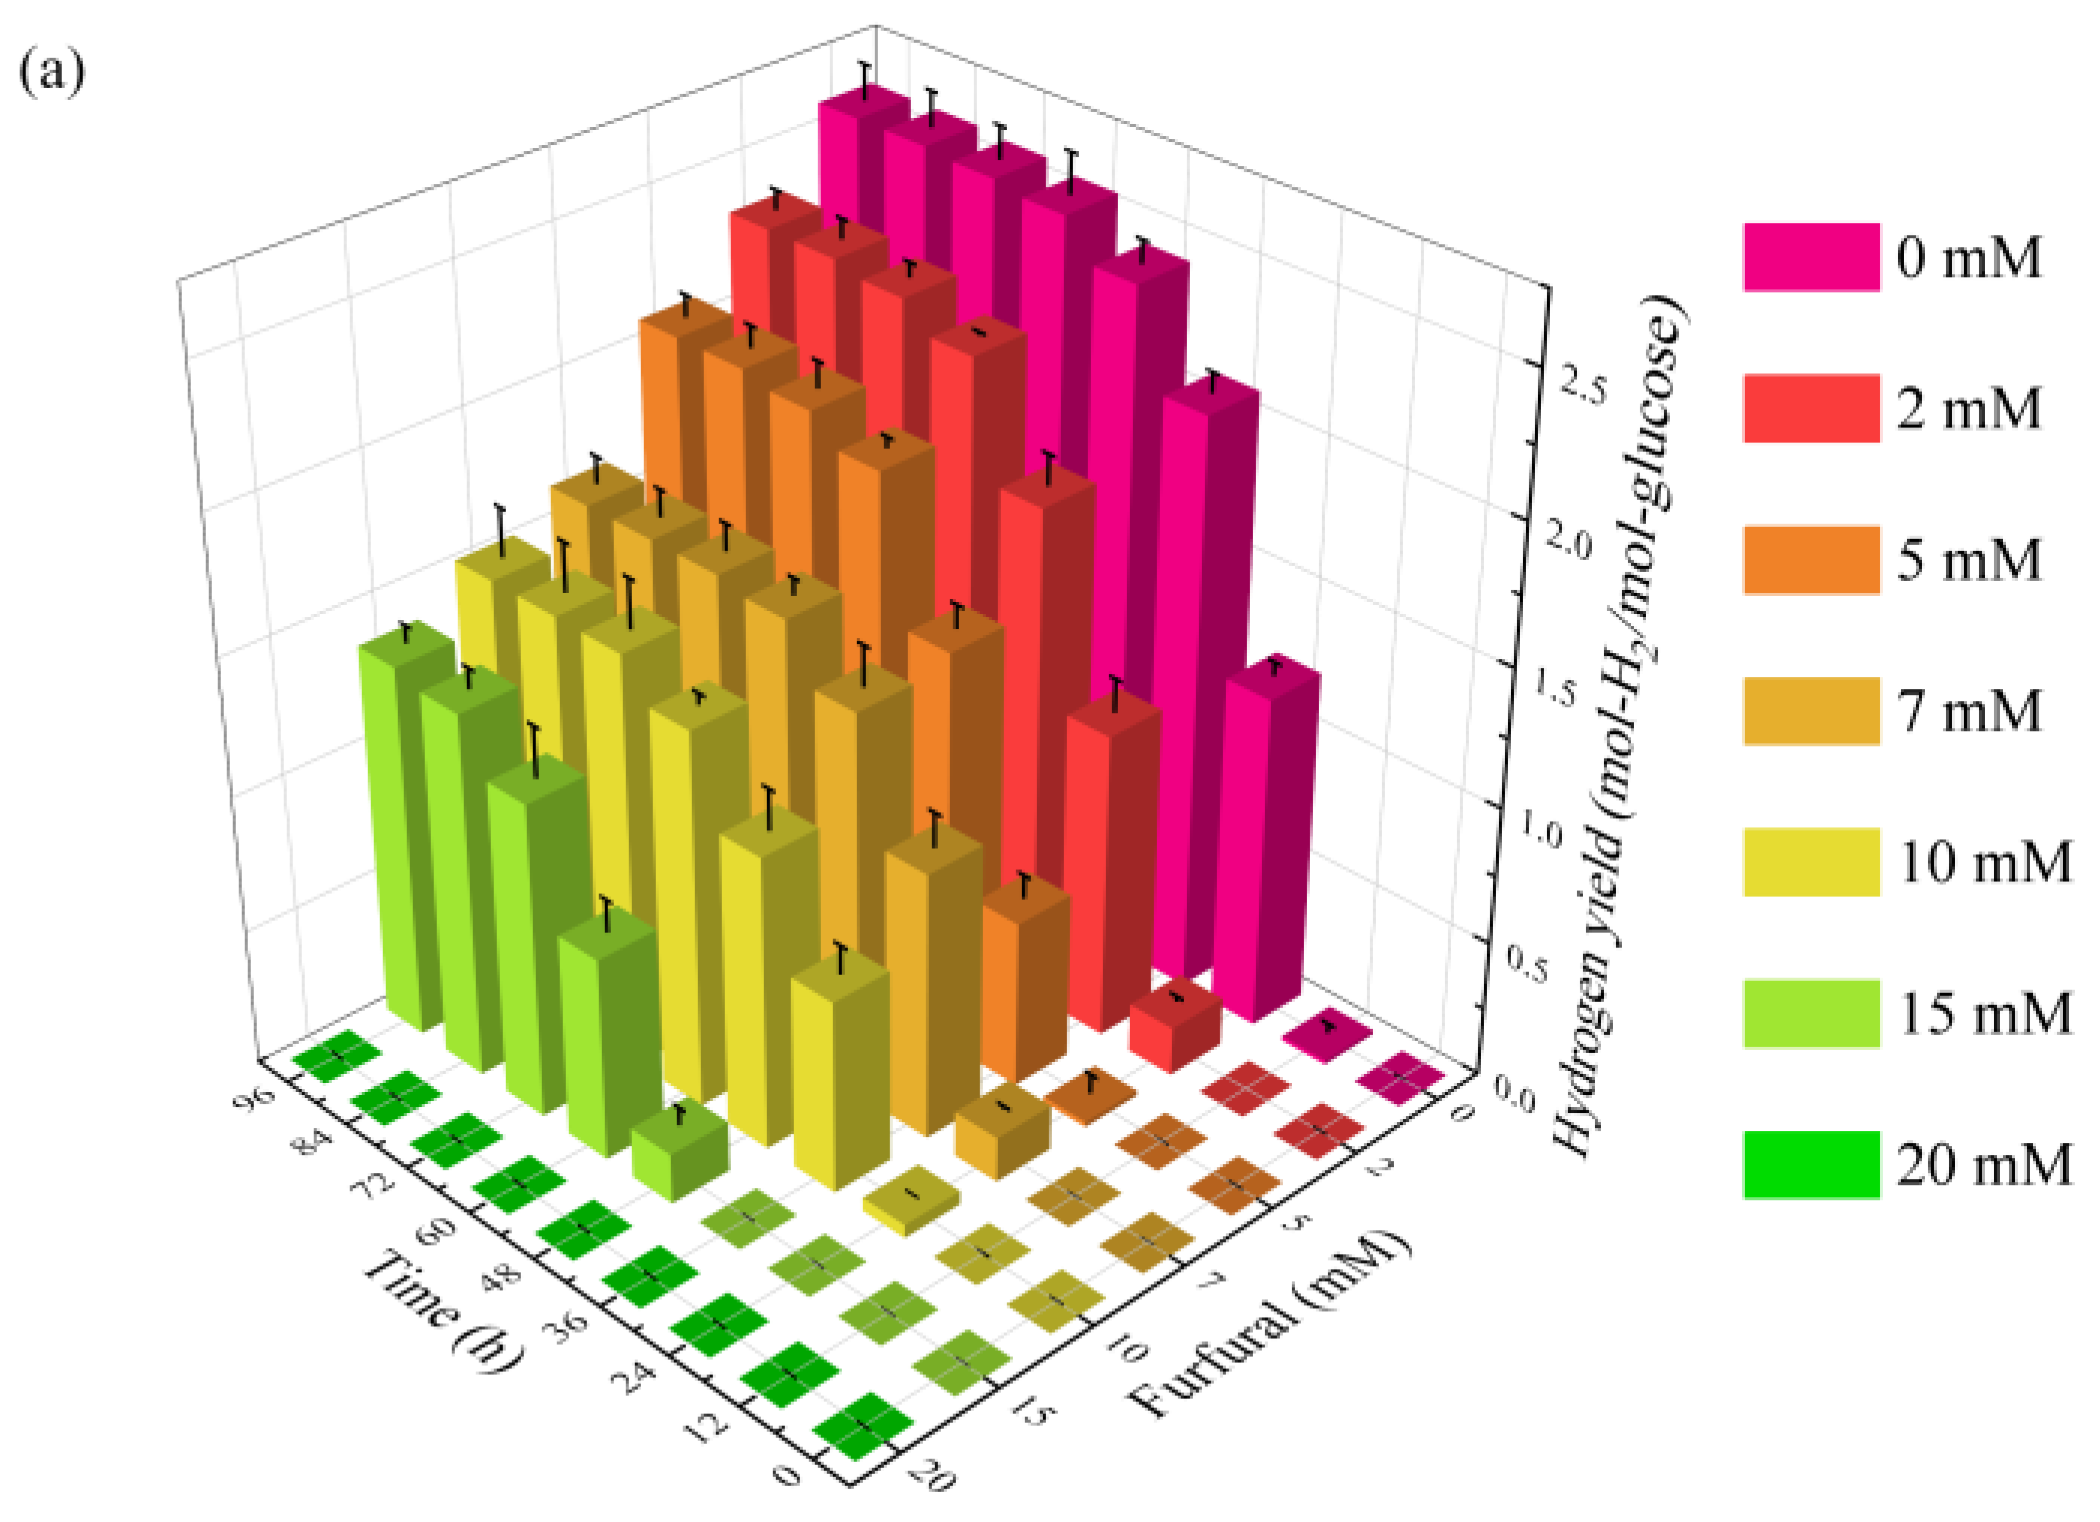
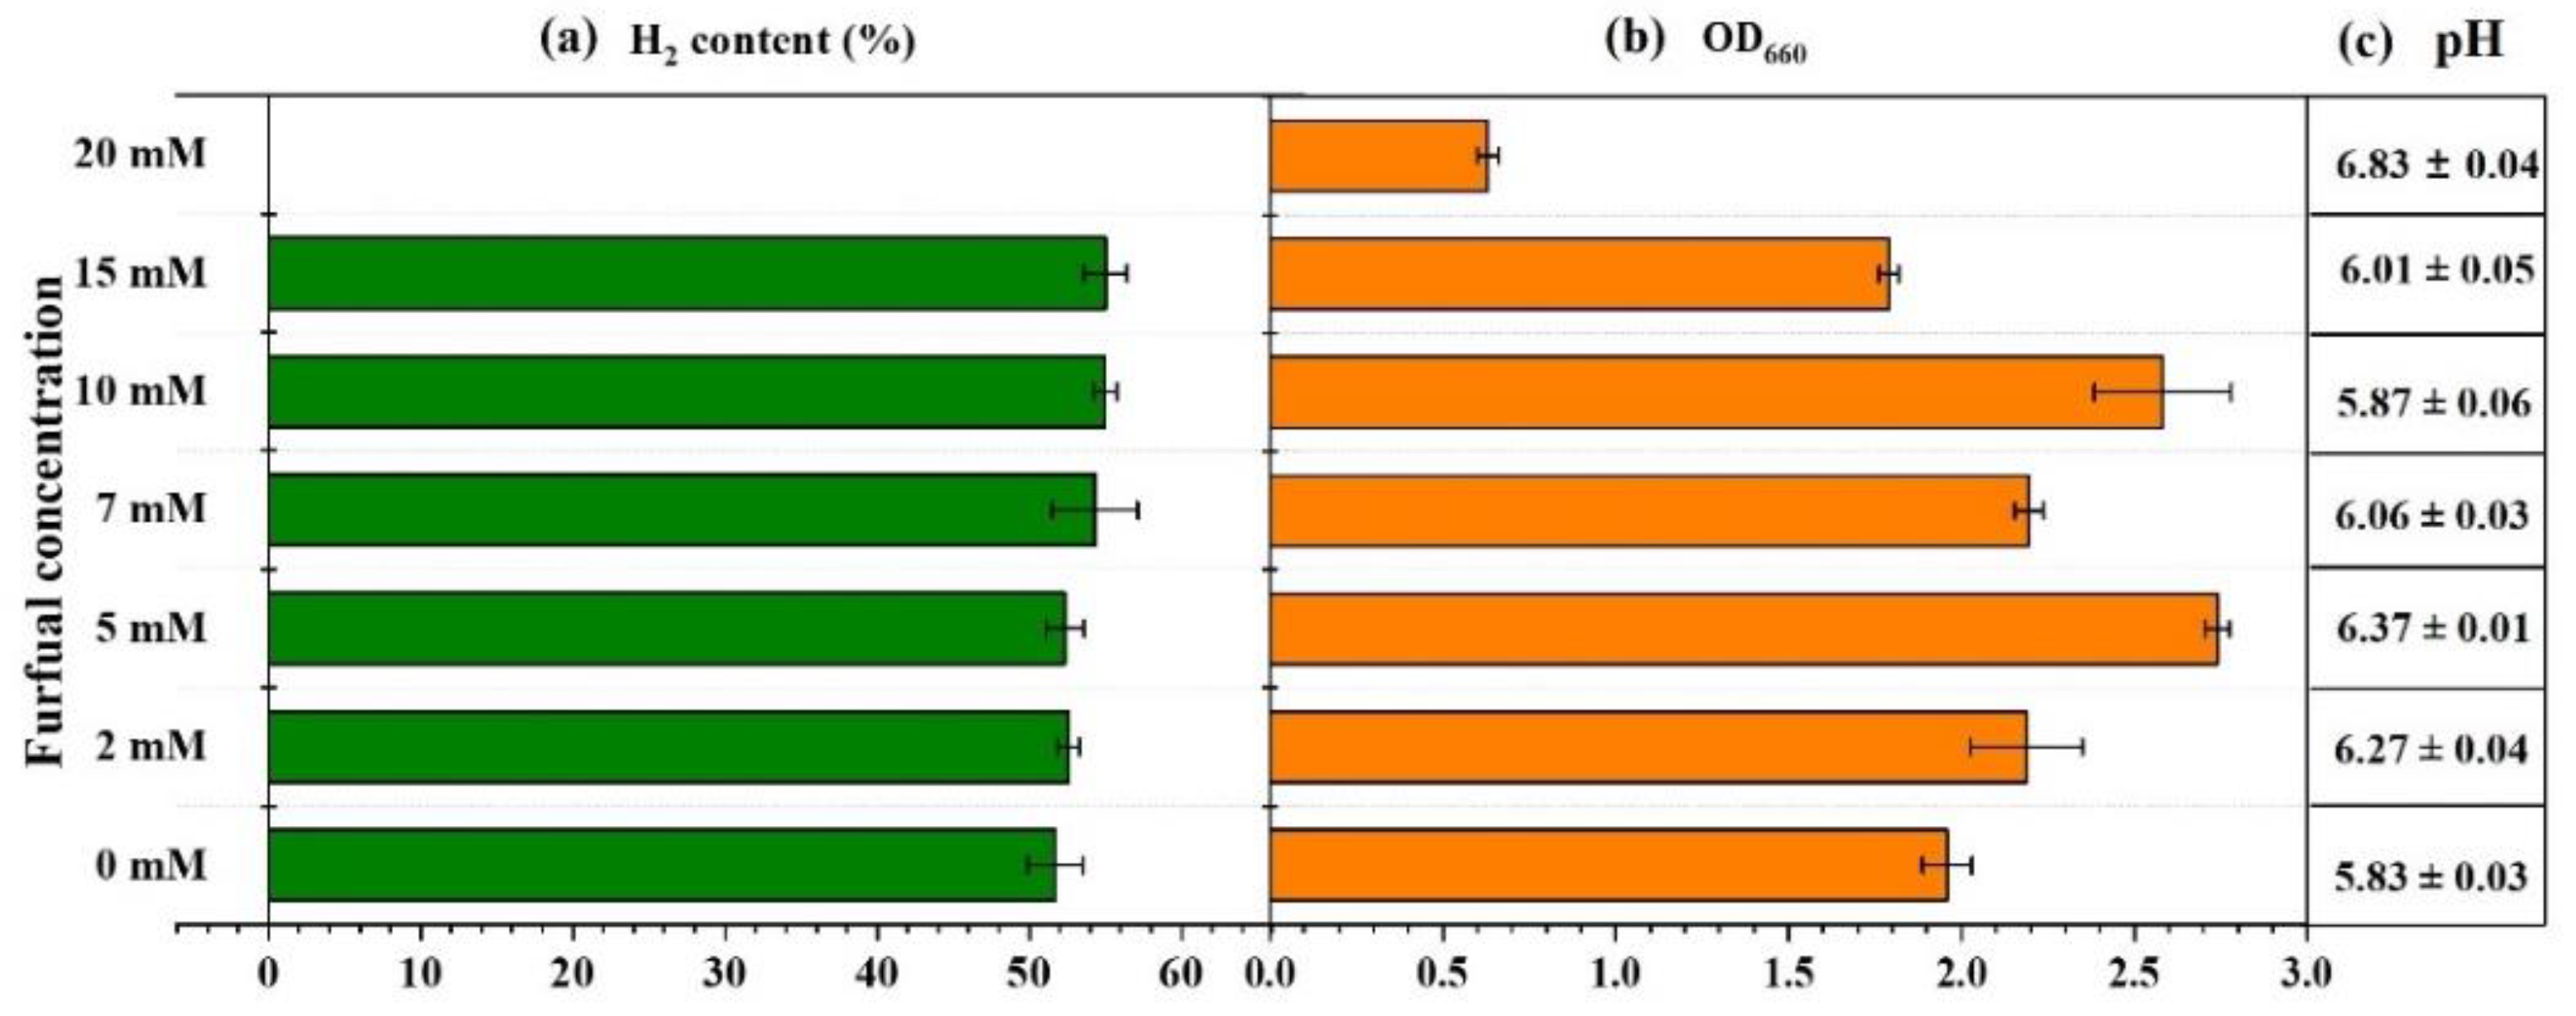
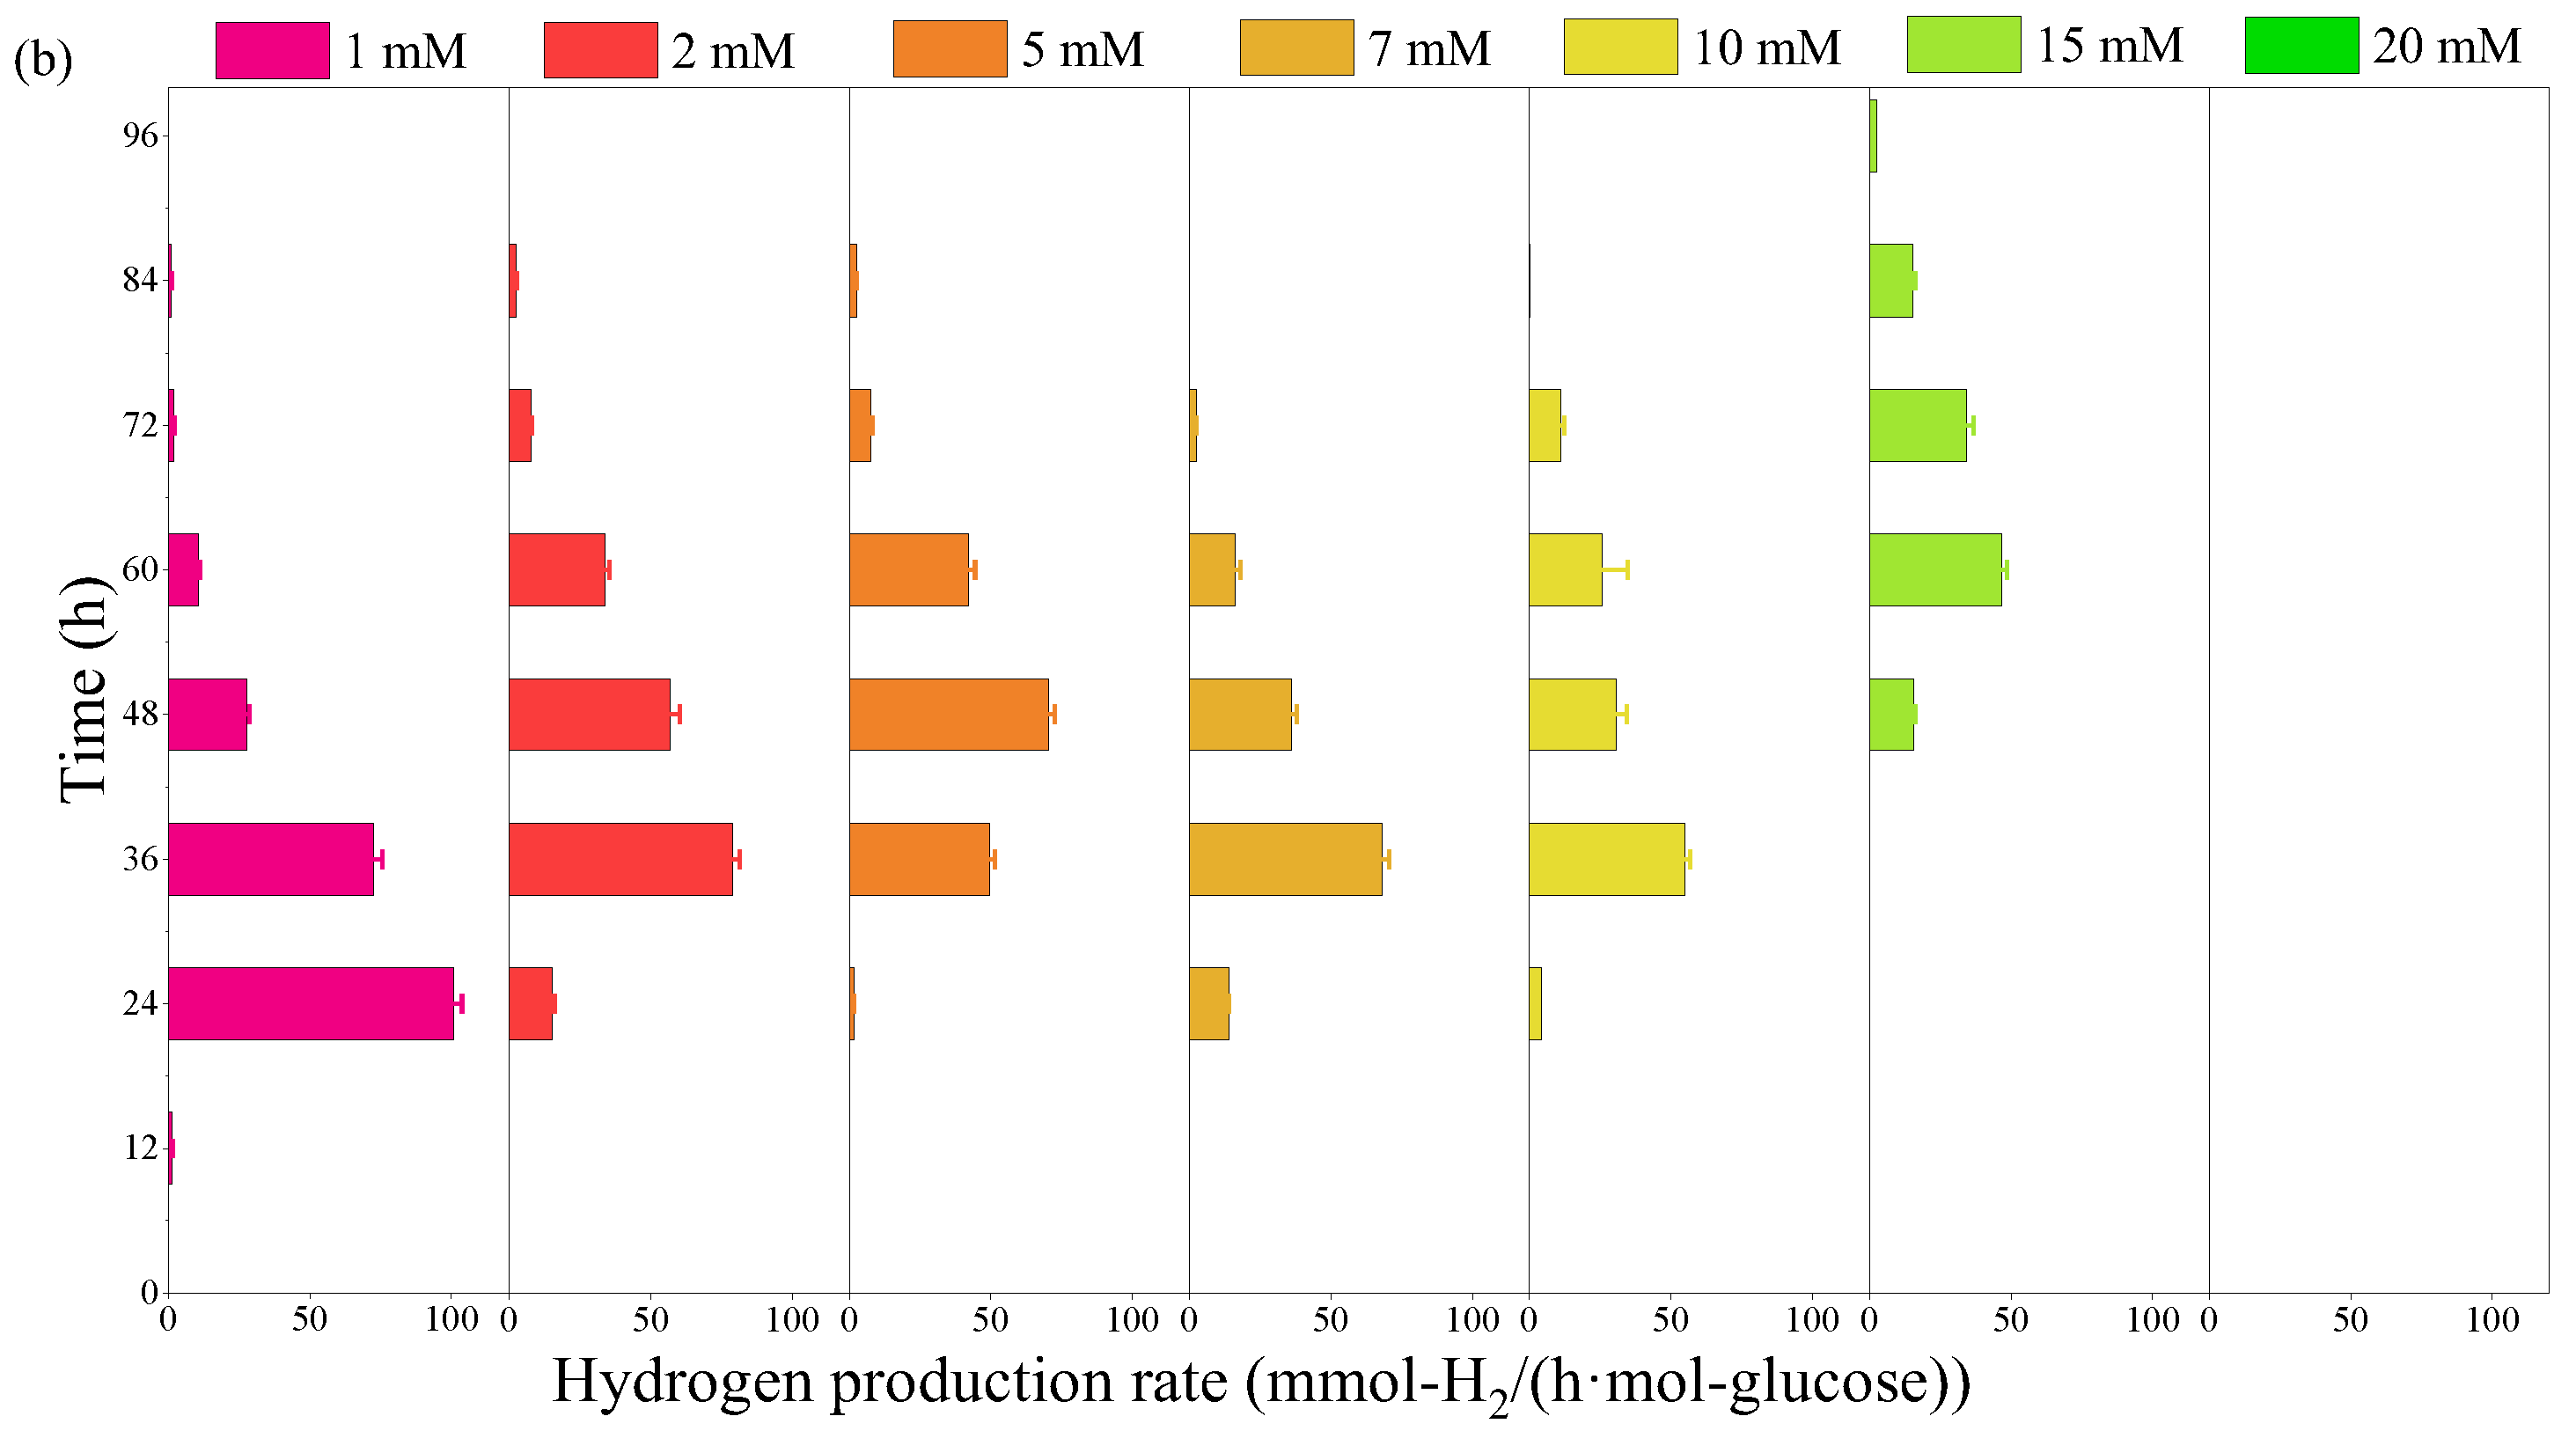
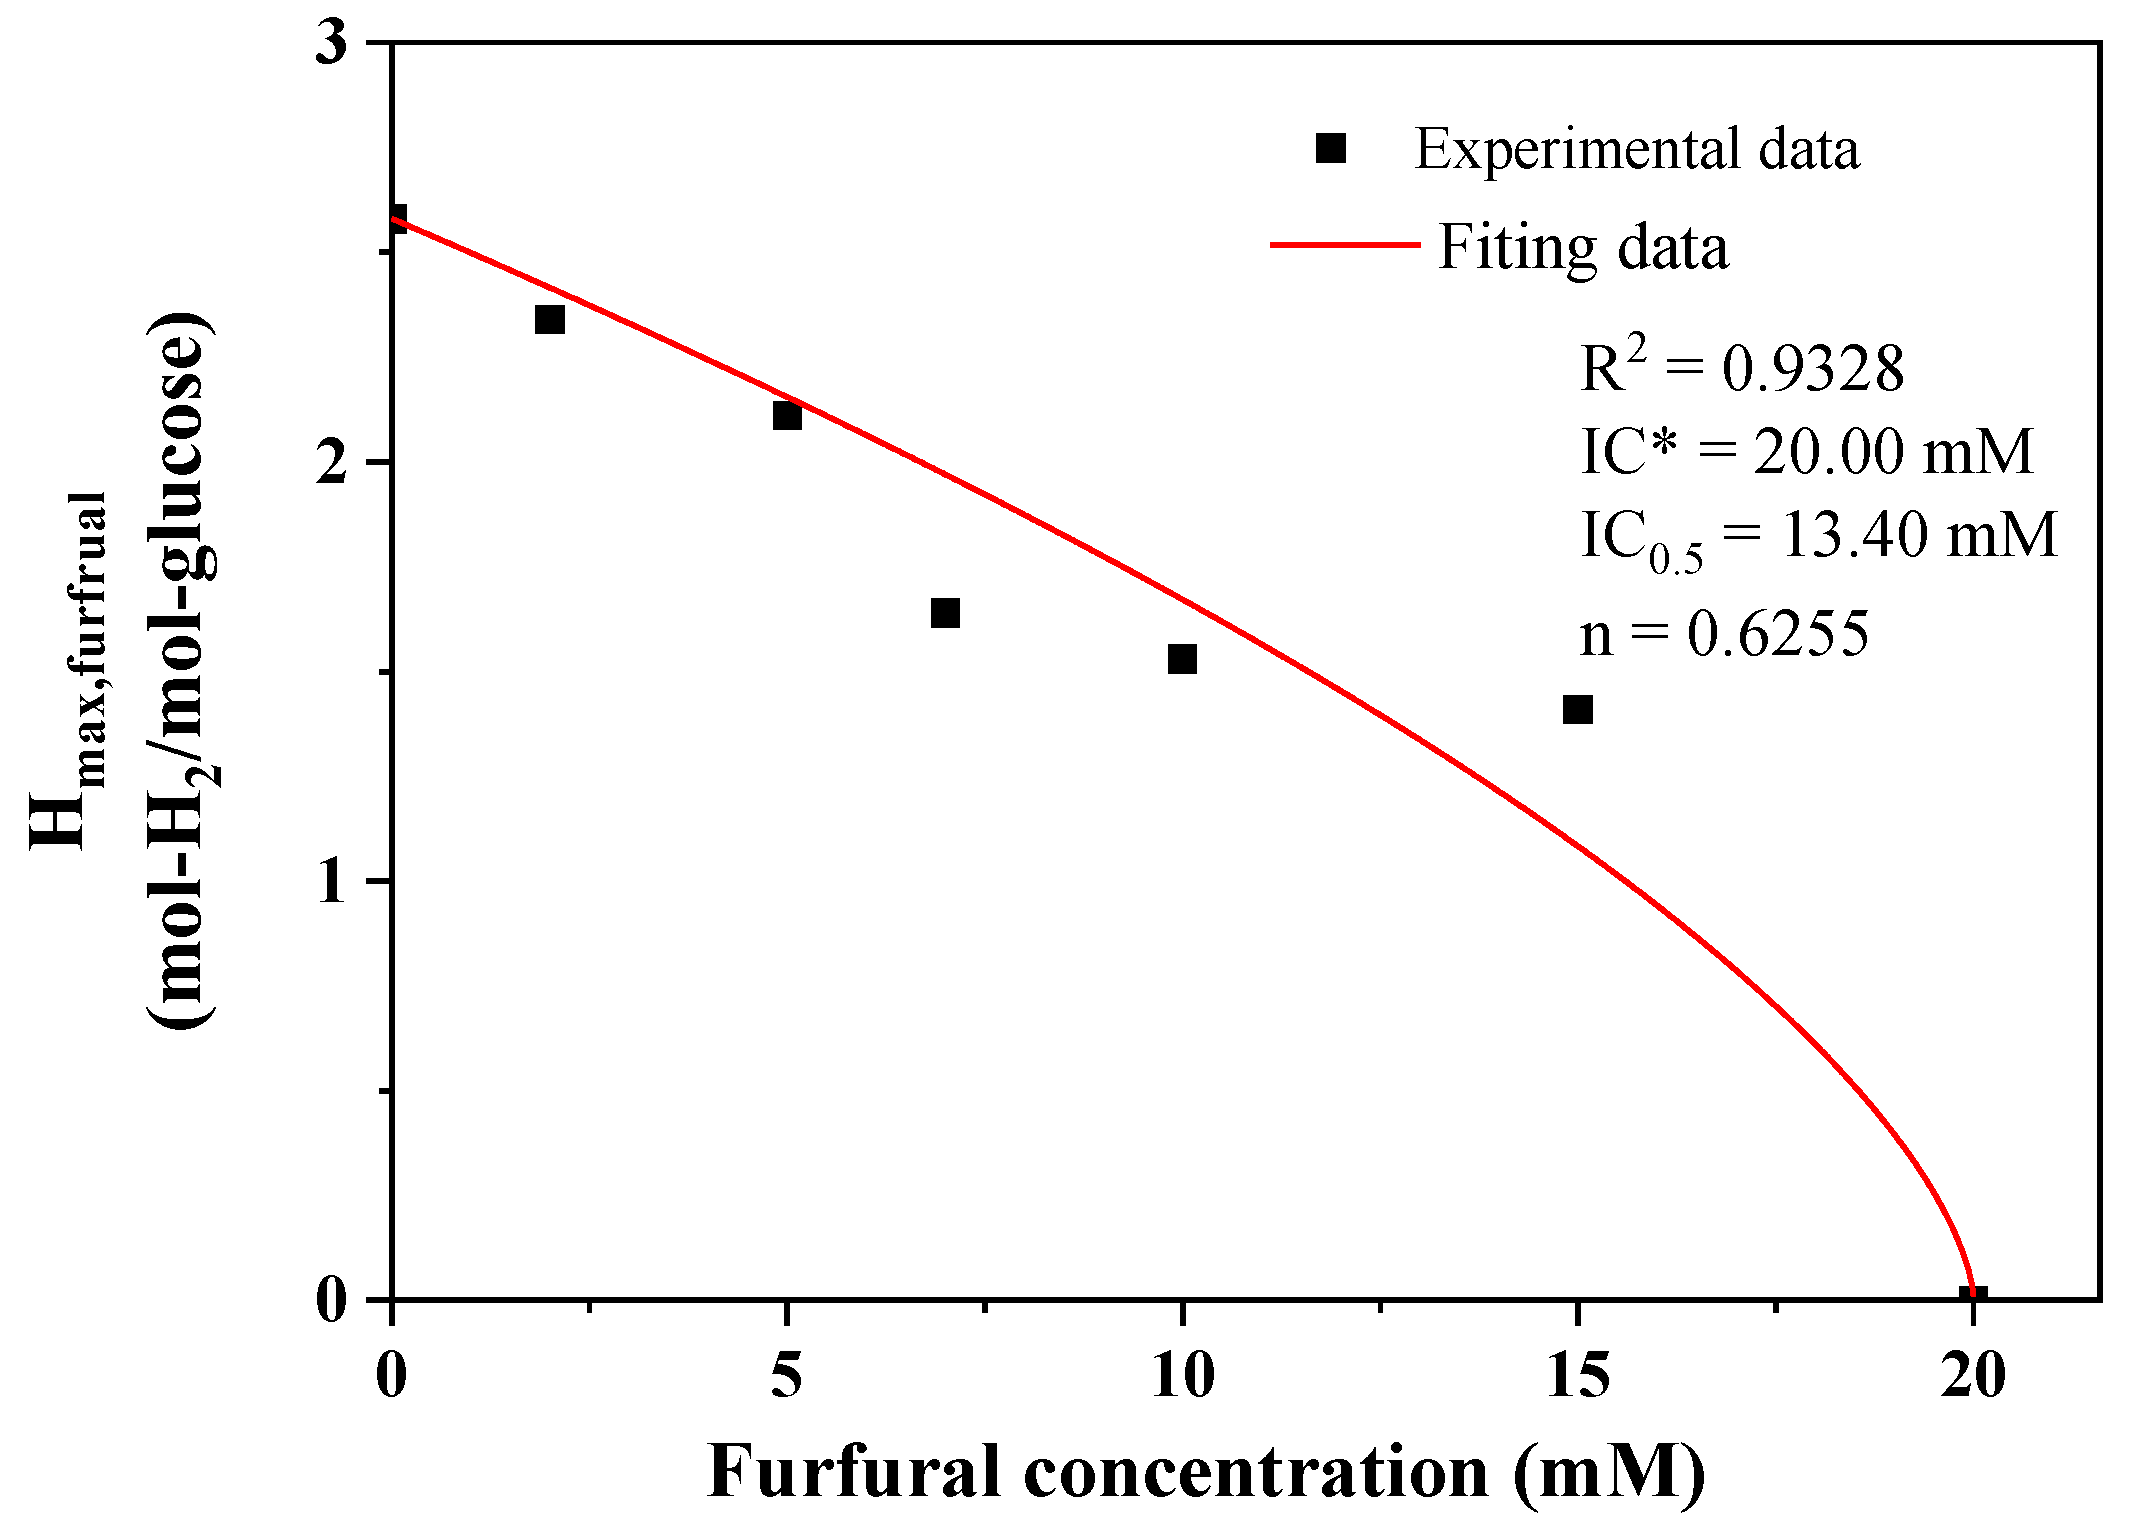
2.1. Effect of Furfural on Photo-Fermentative Hydrogen Production from Glucose

Figure 1 demonstrated the temporal variation of the accumulative hydrogen yield and the corresponding production rate in the presence of furfural from 0 to 20 mM. The maximum hydrogen yield of 2.59 ± 0.13 mol-H2/mol-glucose and the corresponding maximum production rate of 100.64 ± 3.12 mmol-H2/(h·mol-glucose) were obtained in the absence of furfural, and an evident inhibition was recorded in the presence of furfural. The increase in furfural concentration from 0 mM to 15 mM leads to a dramatical decrease in hydrogen yield and the maximum hydrogen production rate to 1.37 ± 0.07 mol-H2/mol-glucose, 46.72 ± 1.82 mmol-H2/(h·mol-glucose), which is decreased by 47% and 54%, respectively. Further increase in furfural concentration to 20 mM inhibited the hydrogen production potential, and no hydrogen was produced. These results are consistent with the previous studies that furfural acted as an inhibitor in other biofuel fermentation processes [28]. Cytotoxicity of the inhibitors, including furfural, is proposed to be related to inducing the production of reactive oxygen species, damaging cell walls and membranes, inhibiting cell growth, down-regulating enzyme activity, breaking down DNA, and inhibiting the downstream synthesis [21,29]. Moreover, furfural inhibits nitrogenase activity, which cannot be eliminated in the pretreatment process. According to the results, the hydrogen yield and maximum hydrogen production rate were inverse to the furfural concentration.
Considering the kinetic parameters in Table 1, the hydrogen production potential (Hmax) showed a decreasing trend with increased furfural concentration from 0 to 15 mM. A similar effect was found in the maximum hydrogen production rate (Vmax), which declined by 55% at 15 mM furfural concentration compared to that in the furfural absence. Furthermore, the shortest lag time of 13.64 ± 0.77 h was achieved in the absence of furfural, whereas that was prolonged with the increase in furfural concentration. The change in the lag time indicated that strains were getting more sensitive to the environment, and the culture was in an adaptation or lag stage thanks to the cumulative furfural concentration. These results confirmed that furfural played a negative role in photo-fermentative hydrogen production. Hmax and Vmax were inverses, whereas the lag phase was proportional to furfural concentration, as expected.
Figure 2 represents the influence of furfural on H2 production potential derived from the extended Monod model. The R2 closed on 0.93, showing the reliability of the fitting. Parameters including IC0.5, IC*, and n were fitted based on the data in Table 1 according to Equations (2) and (3). In this study, the lethal inhibitor concentration IC* and half-maximal inhibitory concentration IC0.5 were 20.00 mM and 13.40 mM, respectively. Furfural at 20 mM severely inhibited bacterial fermentation, as shown by no hydrogen production, and might be related to the result in the inactivity or even death of the bacteria. Several studies on the effect of furfural on biohydrogen production showcase that the half-maximal inhibitory concentration IC0.5 varied widely, from 1.4 mM to 42.6 mM, depending on sensitivity to the culture condition, substrate, and microorganism employed [30,31,32].
As apparent from Figure 3, the addition of furfural had no negative, even a slight favorable effect on hydrogen content, which has not been reported to the best of our knowledge. Hydrogen content increased from 51.70% to 55.01% when furfural concentration increased from 0 mM to 15 mM, which seems attractive in terms of enhancing hydrogen content. It was noteworthy that the final cell concentration was significantly affected by furfural concentration. Photo-fermentative experiments at 5 mM furfural did not show any decline but rather a 40% increase in cell concentration from the control, possibly due to more energy and electron reduction force utilized by bacterial growth rather than hydrogen production to cope with the extreme environment. One of the most important factors to be considered in hydrogen production is pH, as it affects chemiosmotic gradients directly, which is highly correlated with the activity of ion pump, channel protein, and membrane binding protein [33,34], pH alters the distribution of end products by regulating the physiological behavior of cells and may affect the length of lag [35,36,37,38]. The initial pH was adjusted to 7.0 but not controlled in real-time, and the pH drops were observed in all culture conditions. Photosynthetic bacteria would produce hydrogen while breaking down glucose into acids preferentially, resulting in the accumulation of volatile fatty acids (VFAs), which were subsequently converted into hydrogen. As a result, the decrease in pH was due to the difference in the rates of VFAs production and consumption during photo-fermentation.
In order to verify the credibility of the present results, the hydrogen yield in this study was compared to the reported work in Table 2. The details of each study such as strains, substrate, furfural concentration, and hydrogen yield were listed. Yang et al. [25] reported that 0.2 g/L furfural improved hydrogen production by 19% compared to no addition, and the hydrogen yield was 2.99 mol/mol. R. Lin et al. [39] found that furfural at a low concentration contributes to hydrogen production, a higher concentration of furfural significantly decreased hydrogen yield, and the hydrogen yield was 1.56 mol/mol with the addition of 5 mM furfural. Hu et al. [26] reported that furfural has a downward tendency in H2 yield with the concentration increasing. The comparison with other reported work showed that the results in this study including the effect of furfural on photo fermentative hydrogen production and the hydrogen yield were reasonable.

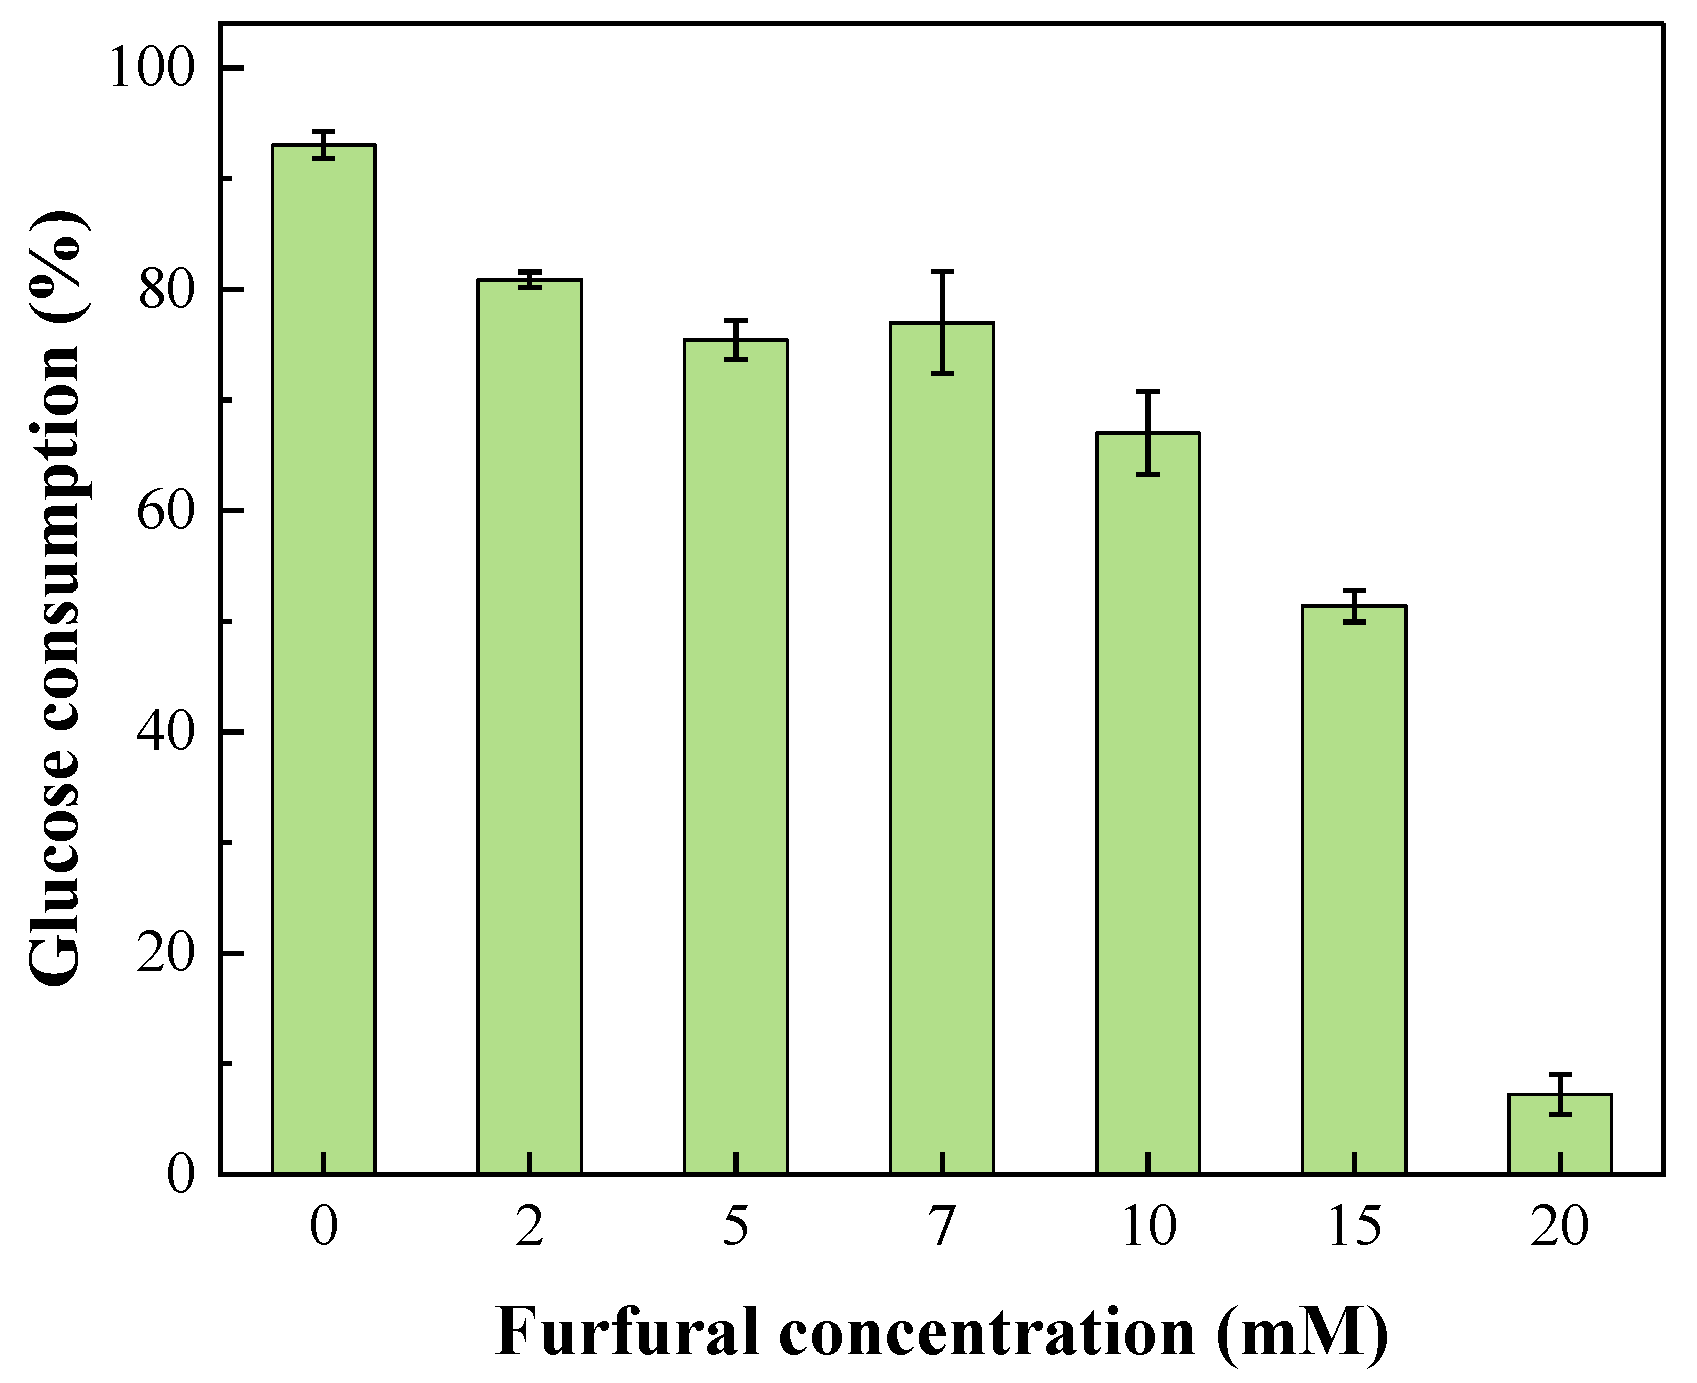
2.2. Glucose Consumption during Photo-Fermentation

At the end of fermentation, portions of substrate remained unconsumed. According to Figure 4, glucose consumption ranged from 7% to 93% among different furfural concentrations. The glucose consumption level roughly decreased as the furfural concentration increased from 0 to 20 mM. The maximum glucose consumption (93%) was achieved without furfural, while it dramatically declined to 7% with 20 mM furfural addition. These results are consistent with the literature, where furfural negatively affected the bioconversion of glucose [42]. Furfural adversely affects cell activity by repressing glycolytic enzyme activities, damaging cell membranes, and accumulating reactive oxygen species [26]. This result explains the low glucose consumption at higher furfural concentrations.

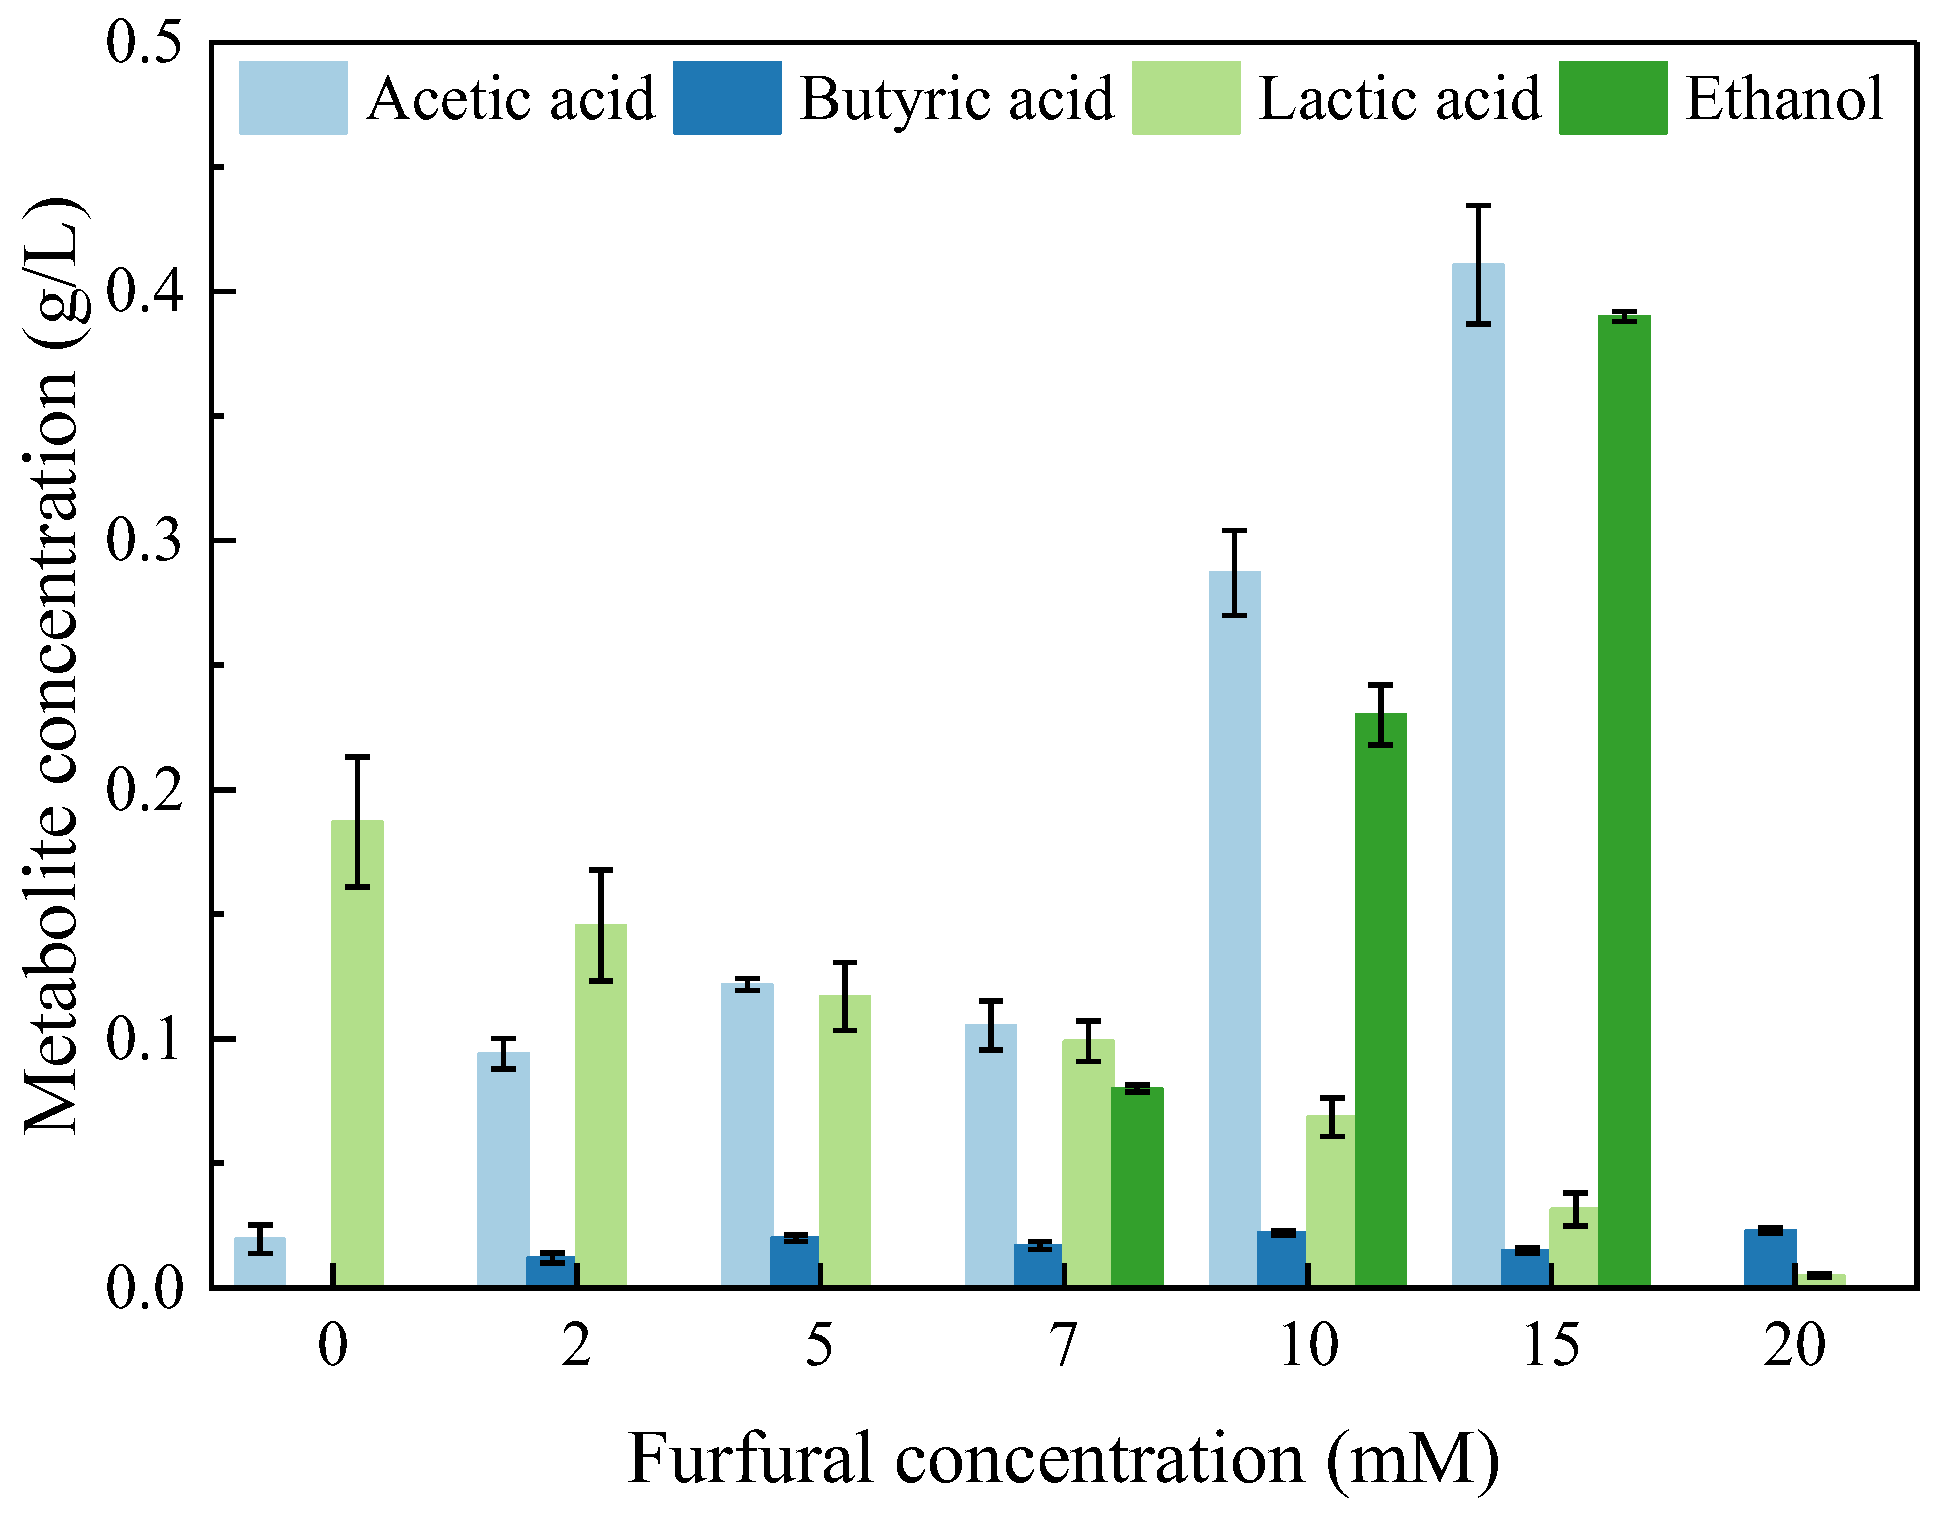
2.3. Soluble Metabolic Residues Formed during Photo-Fermentation

How much of the carbon source is assimilated by the cell depends on the redox state of carbon and the precursor metabolic pathway [43]. Cells release hydrogen and volatile fatty acids (VFAs) when glucose is available as a carbon source through metabolism and redox balance. Consequently, hydrogen production always occurs with VFAs formation. Figure 5 presents the metabolites (VFAs) concentrations at the end of the experiments. As shown in Figure 5, acetic acid concentrations increased with increasing furfural concentration except for 20 mM.
Furfural can be decomposed into acetic acid in mixed anaerobic cultures, which may account for the increase in acetic acid [32]. Negligible butyric acid concentrations have been found at all furfural concentrations, including the control, and it is known that butyric acid is the substrate for hydrogen production. The above results suggested that butyric acid was formed by glucose degradation, which is reasonable, as few butyric acids were detected in the residual medium. Lactate was also found in all test conditions but showed the highest concentration at 0 mM furfural and the least at 20 mM furfural. In addition, ethanol concentration was up to 0.39 g/L with 15 mM furfural addition. High furfural concentration can lead to the overproduction and accumulation of inhibitory end-products like ethanol, resulting in obstruction or even elimination of the hydrogen production ability of bacteria [44].
Indeed, lactate production decreased with increasing furfural concentration, which two possible reasons could explain: (1) metabolism of furfural inhibited the activity of lactate dehydrogenase, which could catalyze pyruvate to lactate in reverse reaction with the consumption of NADH; (2) the decrease in glucose utilization (Figure 4) led to a decrease in lactate produced during glucose metabolism. In future work, enzyme analysis of lactate dehydrogenase is necessary. In addition, in the range of 0–15 mM, the contents of acetate and ethanol increased with the increase of furfural. Still, they were not detected at 20 mM, indicating that the photodecomposition of furfural [26] does not produce ethanol and acetic acid. Considering the decrease of glucose utilization rate and the increase of OD660 in low furfural concentration, bacteria can decompose furfural into acetic acid and ethanol, and achieve partial carbon assimilation.

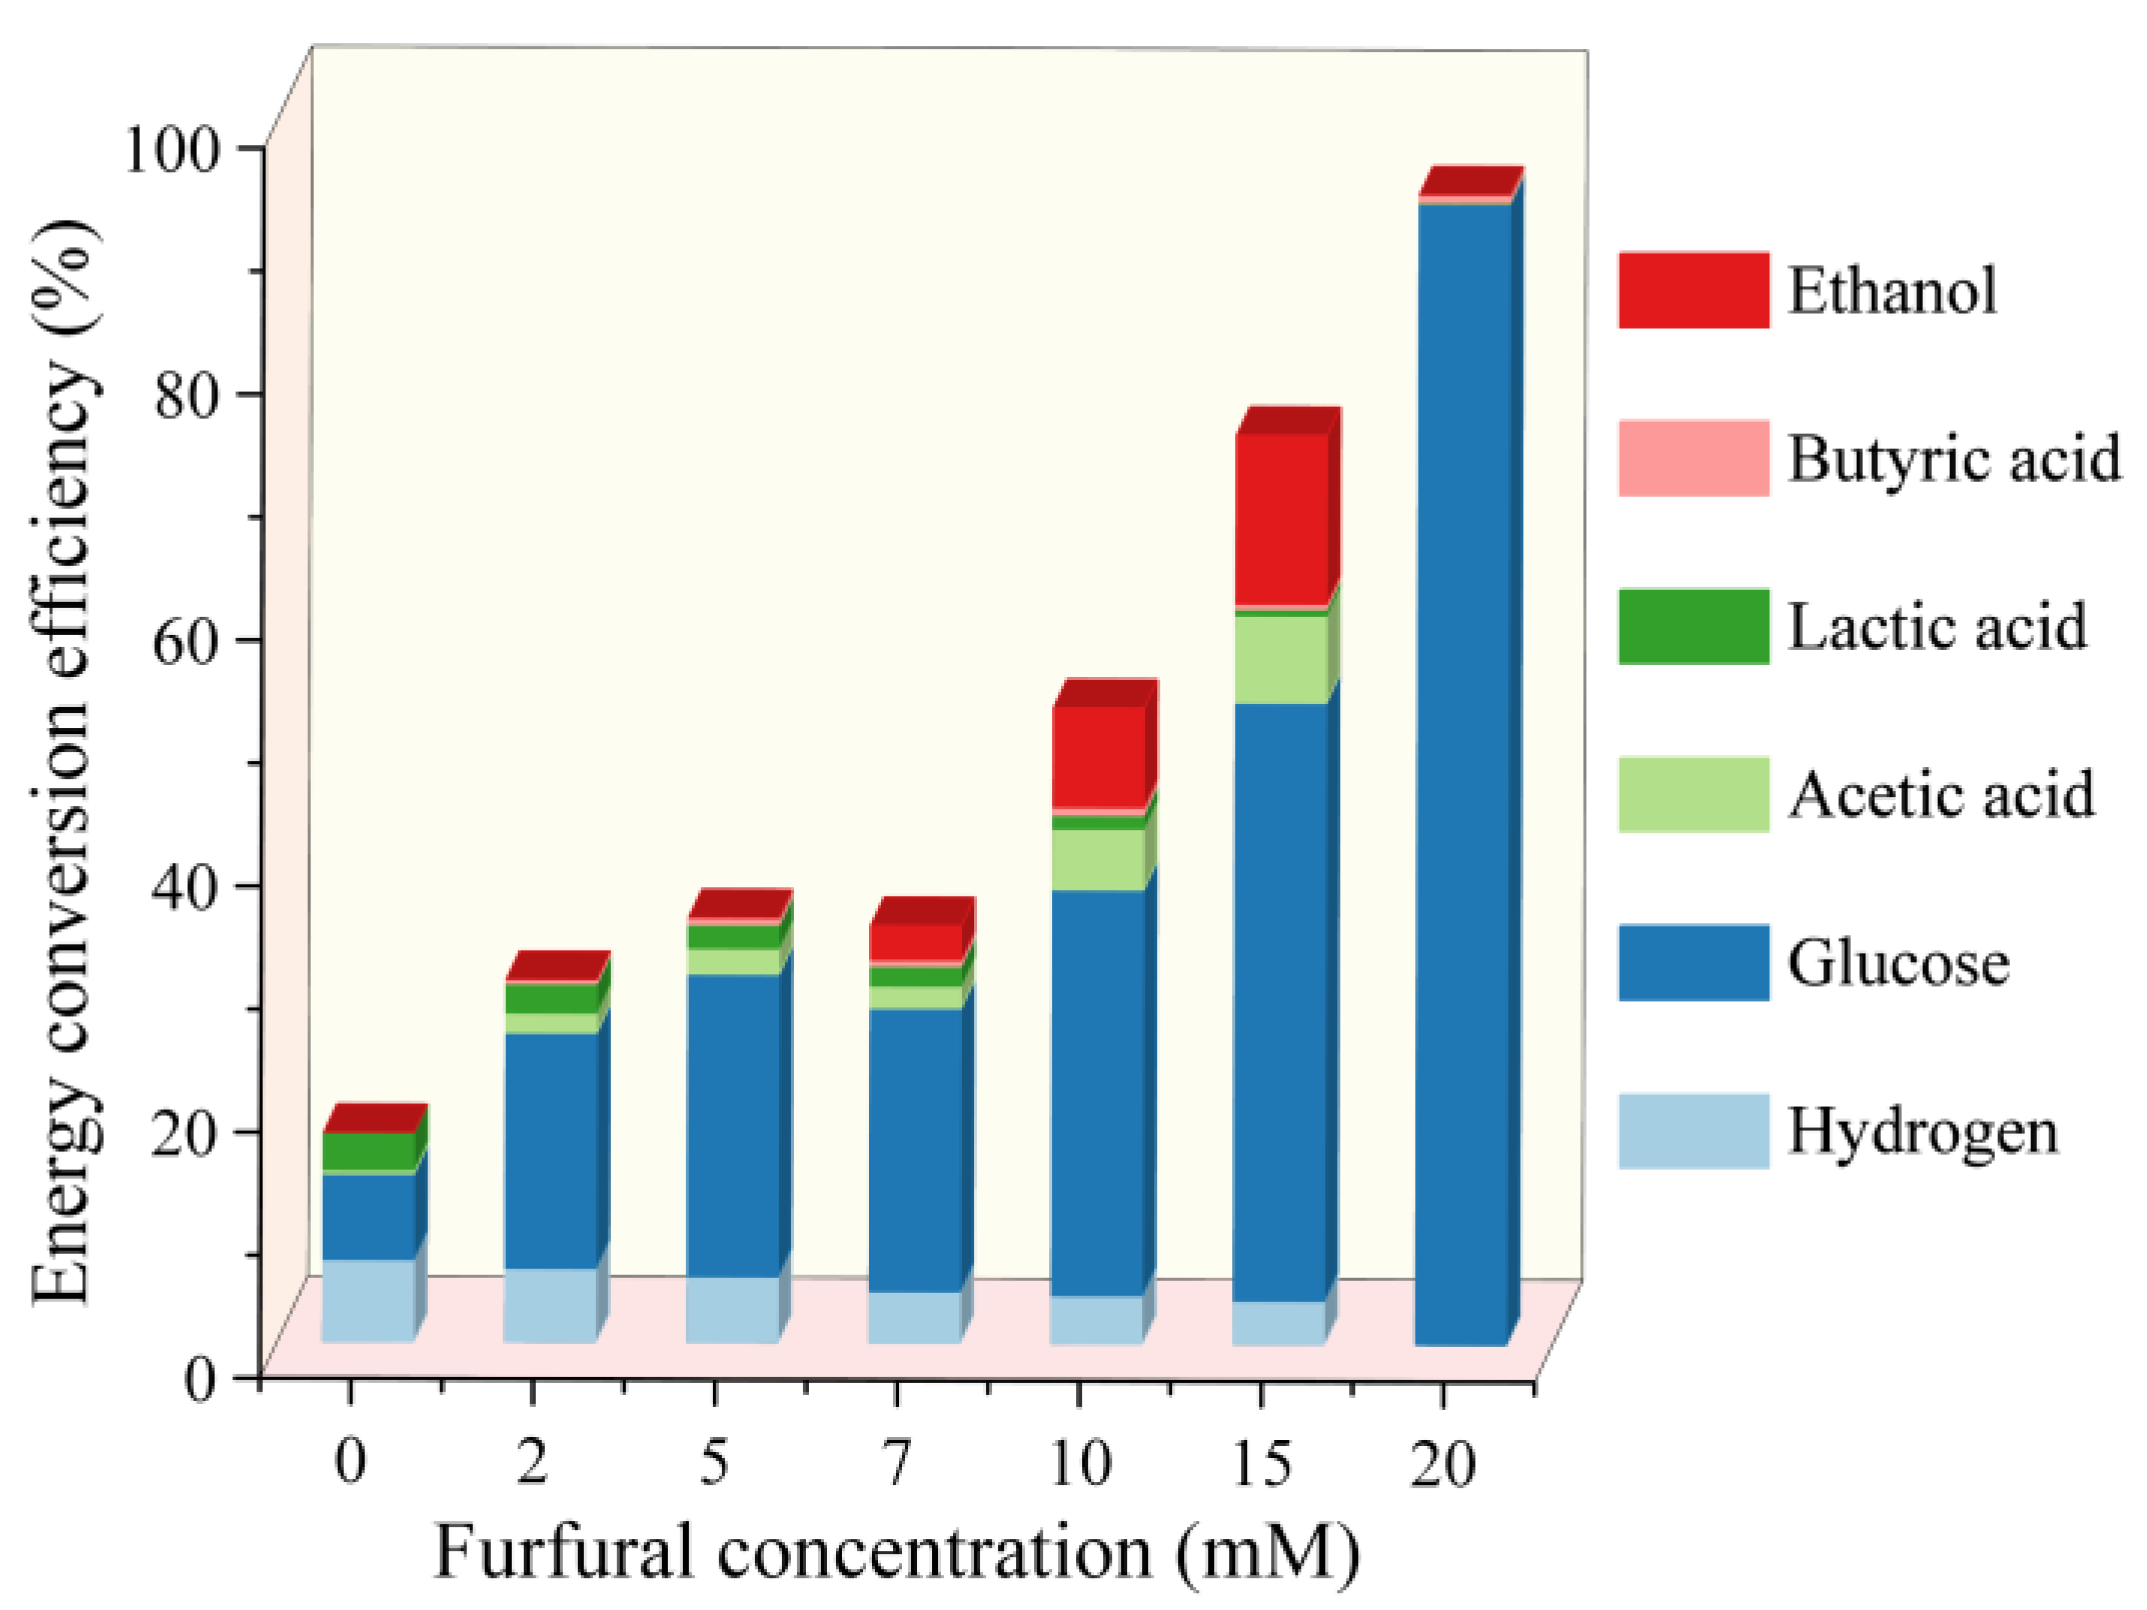
2.4. Energy Conversion Efficiency Analysis

The energy conversion efficiency analysis in this section was based on the following assumption: the heating values of other input chemicals in the culture medium like L-aspartic acid were ignored, as well as the input light energy. Figure 6 showcases the energy conversion efficiency during fermentation under different furfural concentrations. The energy conversion efficiencies of hydrogen with 0–20 mM furfural were 6.67%, 6.00%, 5.37%, 4.22%, 3.92%, 3.57%, and 0, respectively, suggesting that merely a tiny part of the energy being converted and stored in hydrogen. Notably, residual glucose accounts for 6.96%, 19.15%, 24.59%, 23.02%, 33.00%, 48.63%, and 92.78%, respectively, of the total input energy in glucose, demonstrating that most of the energy in the raw substrate was underused and unconverted. In addition, metabolite products also play a much more significant role in energy losses, especially ethanol, which came in at 13.74% at 15 mM furfural.

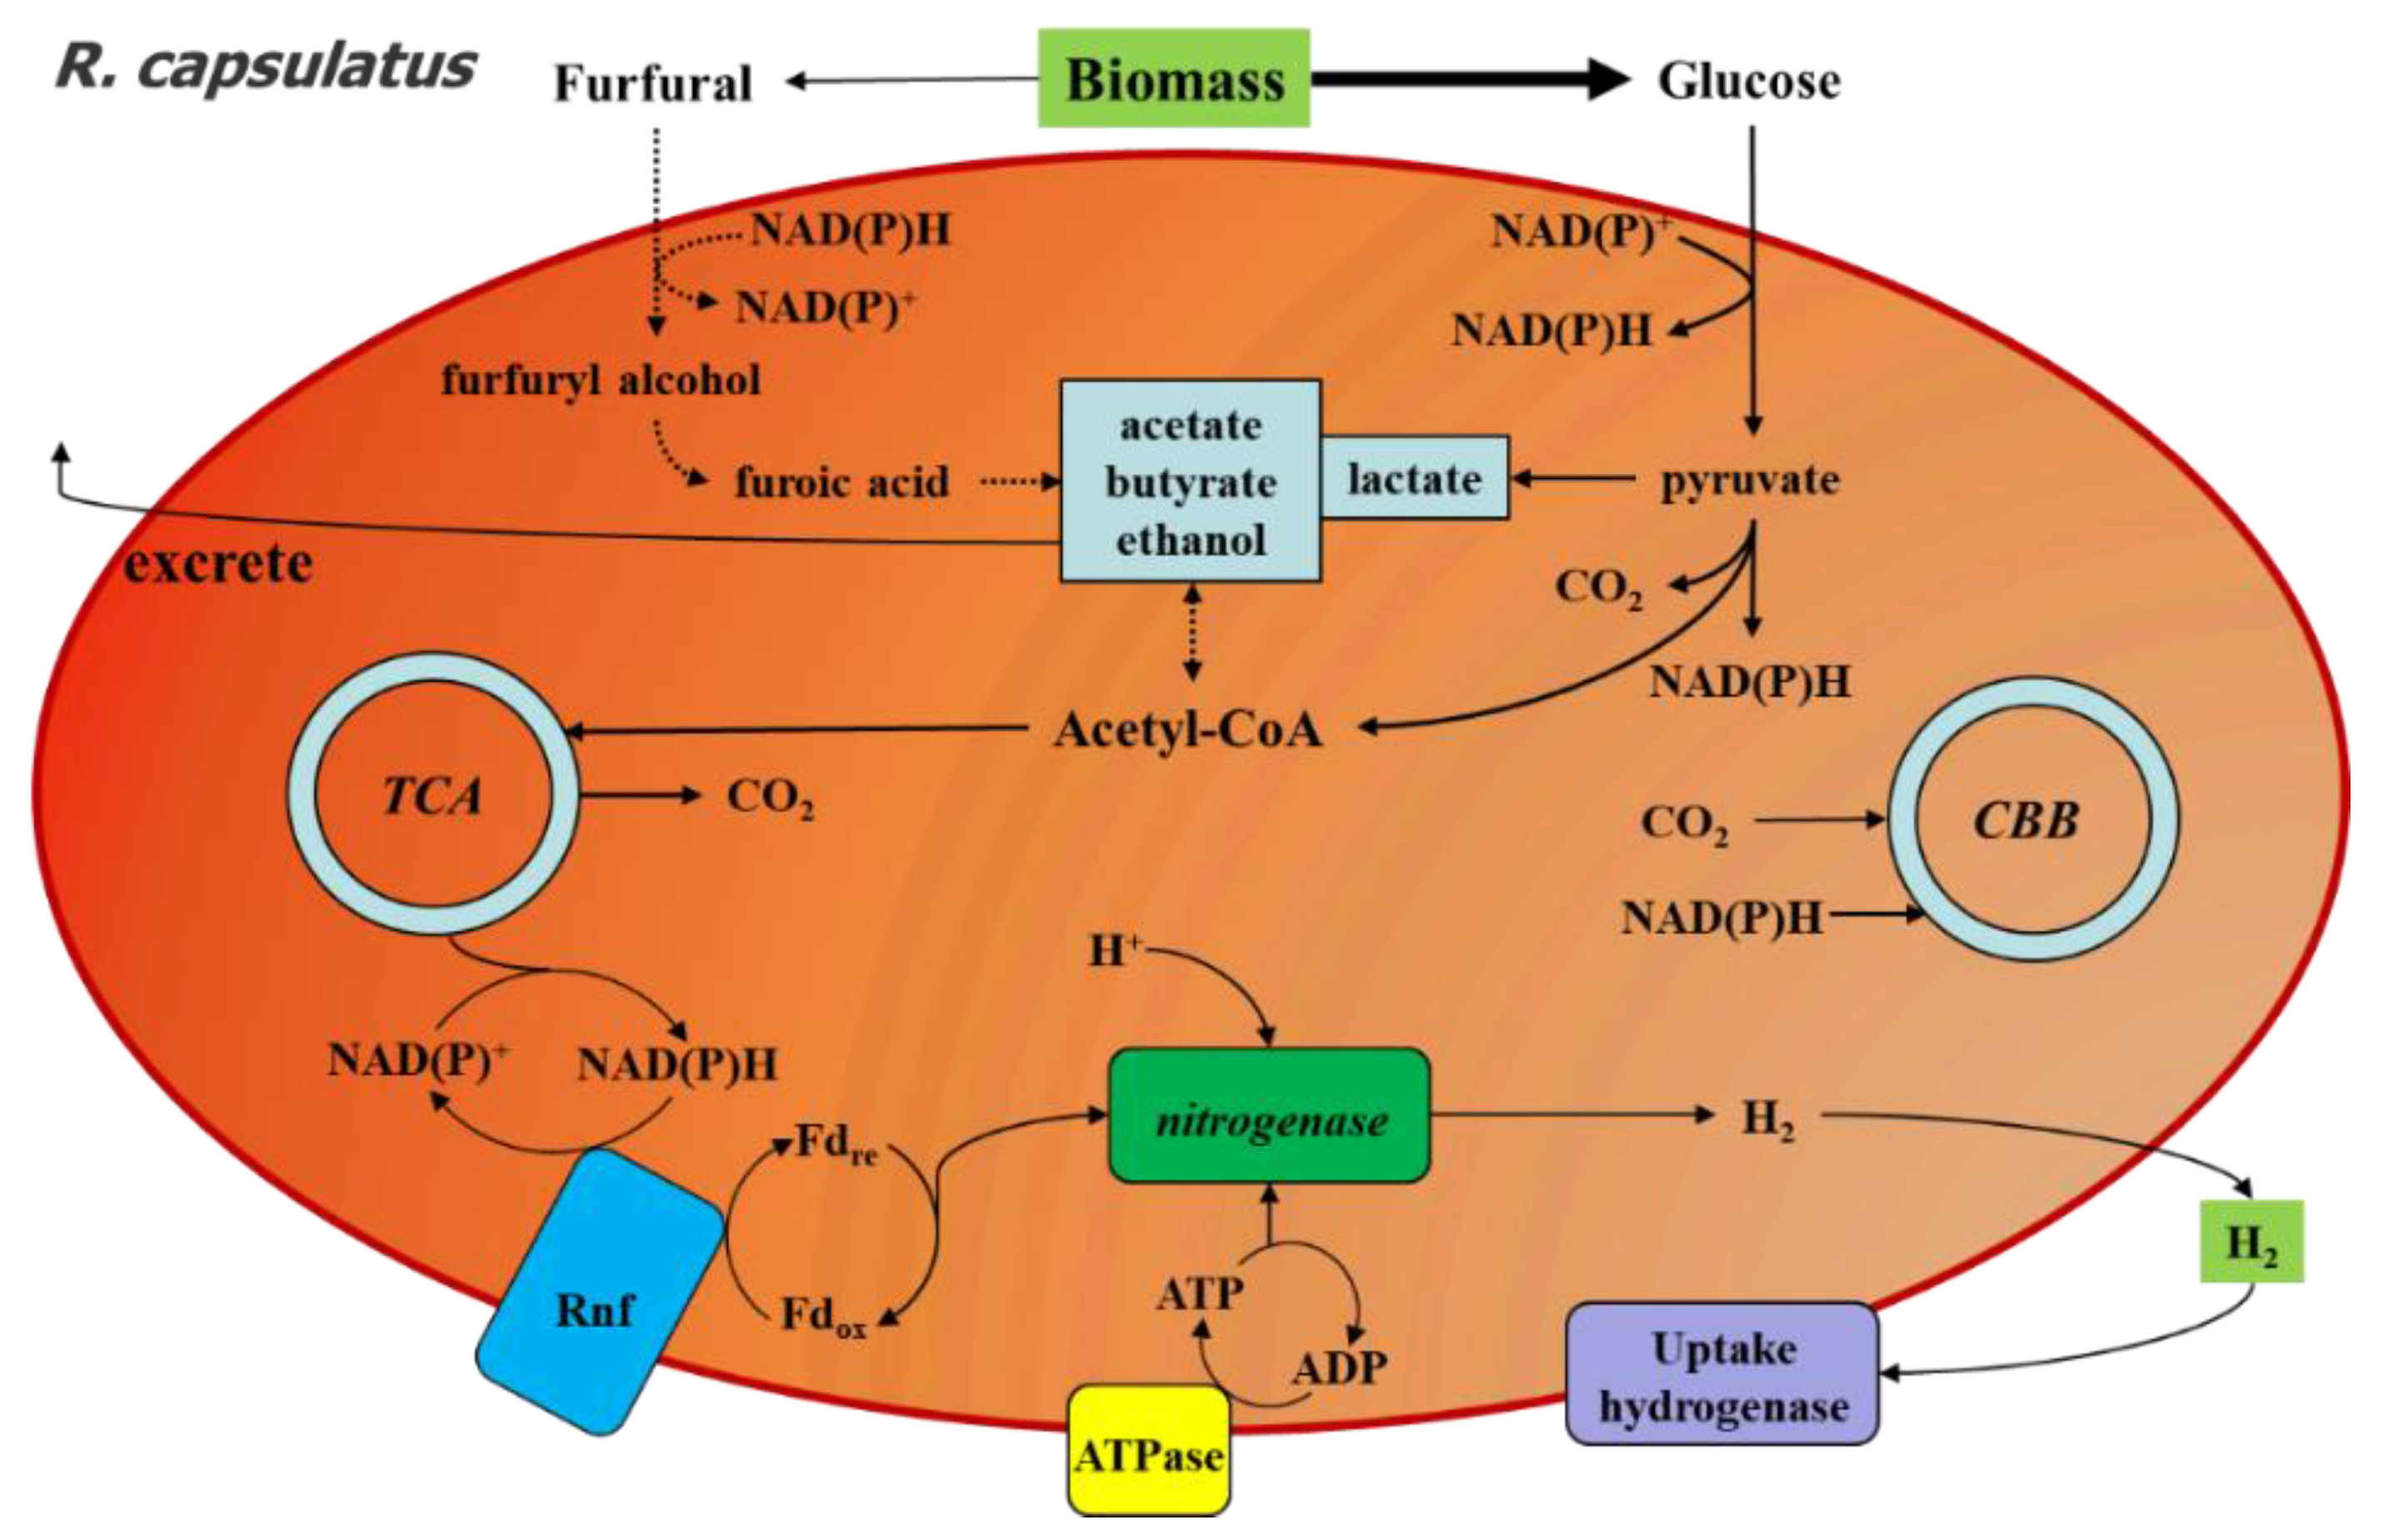
2.5. Proposed Response Mechanism of R. capsulatus to Furfural during Photo-Fermentation

Although reducing sugars in straw biomass hydrolysis can be used to produce hydrogen by photo fermentation, furfural is usually by-produced during hydrolysis, which harms microbial hydrogen production. Thirty mM furfural would significantly damage the membrane system of Enterobacter aerogenes and then inhibit its fermentation [39]. In the presence of 20 mM furfural, the hydrogen production was decreased by 95% by Rhodobacter sphaeroides HY01 [26]. A similar phenomenon also occurred in the photo fermentation hydrogen production by Rhodobacter capsulatus SB1003 studied in this paper, that 20 mM furfural in the reaction system based on glucose substrate would completely inhibit hydrogen production. However, in the present study, hydrogen content increased slightly when furfural concentration ranged from 0 mM to 15 mM.
Figure 7 provides the putative metabolic approach of Rhodobacter capsulatus SB1003 to furfural in photo-fermentative hydrogen production. In our reaction system, substrate glucose would be first converted to pyruvate during assimilation. Pyruvate can be further decomposed into acetyl-CoA and CO2, with the release of NADH [45]. Acetyl-CoA would be participated in the TCA cycle to generate more NADH. The NADH/NAD+ is contributed to hydrogen production [46]. Wang et al. reported that the ratio of NADH/NAD+ in yeast Candida tropicalis decreased significantly with furfural addition, implying that the reduction of furfural in bacterial detoxification consumed NADH and adversely affected the redox poise [46]. When the furfural was added to fermentation, it could be converted to furfuryl alcohol and a small amount of furoic acid with NADH consumption and side effects on redox poise [47]. As a result, in the early stage of cell growth, cells devote more reductive power of assimilation to cell detoxification and cell growth, and hydrogen production is inhibited, which is consistent with the result of hydrogen production kinetics.

3. Materials and Methods

3.1. Bacterial Strains and Pre-Culture

Rhodobacter capsulatus SB1003 [48] was applied for biohydrogen production and pre-cultured in the modified MedA medium [49] at 35 °C in an incubator for about 48 h. The composition of the modified MedA plate had been described in detail in early studies [50]. A single colony of R. capsulatus SB1003 was streaked and then incubated in 10 mL liquid culture at 35 °C for 2 days aerobically, shaking at 150 rpm in shakers.

3.2. Batch Photo-Fermentative Hydrogen Production Process

Harvested cells were diluted to OD660 = 1.0 with fresh MedA liquid medium for the subsequent photo-fermentative hydrogen production process. One M Sodium hydroxide (NaOH, 96%, Hushi, Shanghai, China) was used to adjust the initial pH of the medium to 7.0. Furfural (C5H4O2, 99%, Hushi, Shanghai, China) was added to the culture system with 30 mM glucose (C6H12O6, 99%, Hushi, Shanghai, China) as a carbon source and 6 mM L-glutamate (C5H9NO4, 98.5%, Hushi, Shanghai, China) as nitrogen source. Sixty mL bioreactors with 30 mL working volume were applied and kept at a constant temperature of 30 °C under the illumination of 3000 lux (equal to 4.39 W/m2 according to [51]) provided by halogen lamps. All samples were tested in triplicate, and the results obtained were shown as average ± deviation.

3.3. Analytical Methods

The hydrogen concentration in biogas was measured by a gas chromatograph (GC-7820A, Agilent, Santa Clara, CA, USA) equipped with a thermal conductivity detector (TCD). Metabolism product concentrations were analyzed by high-performance liquid chromatography (HPLC) (2695, Milford, MA, Waters, USA) with a refractive index detector (2414, Milford, MA, Waters, USA) as described previously [26]. The strain’s concentration was monitored by measuring culture at 660 nm using a spectrophotometer (DR 6000, HACH, Loveland, CO, USA). The pH variations of the medium during the fermentation process were detected by a pH meter.

3.4. Calculations

Herein, the energy conversion efficiency was defined as the ratio of heating value (kJ) in sugars, soluble metabolic products and hydrogen to glucose heating value (kJ). The accumulative hydrogen production data was simulated based on the modified Gompertz Equation as follows [52]:
H = H max · exp { exp [ e · V max H max ( L t ) + 1 ] }
where H is the accumulative hydrogen yield (mol-H2/mol-glucose), Vmax is the maximum hydrogen production rate (mol-H2/(h·mol-glucose)), Hmax represents the hydrogen production potential (mol-H2/mol-glucose), L is the lag time (h), e = 2.71828183.
Subsequently, the results were then fitted to the extended Monod kinetics for inhibition according to Equation (2) [53]:
H max , f u r f u r a l = H max , c o n t r o l · ( 1 I C I C * ) n
where, Hmax,furfural represents the hydrogen production potential with different concentrations of furfural derived from the modified Gompertz model, while Hmax,control is the value obtained without furfural. IC is inhibitor (namely furfural in this study) concentration (mM), IC* is the lethal inhibitor concentration above which hydrogen cannot be produced (mM), and n is a constant. The half-maximal inhibitory concentration, IC0.5, is determined by Equation (3) [39].
I C 0.5 = ( 1 0.5 1 n ) · I C

4. Conclusions

This work found that the addition of furfural had a negative effect on the hydrogen yield and the maximum hydrogen production rate. The maximum hydrogen yield of 2.59 ± 0.13 mol-H2/mol-glucose and the corresponding maximum production rate of 100.64 ± 3.12 mmol-H2/(h·mol-glucose) were obtained in the absence of furfural. The hydrogen production was inhibited with the addition of 20 mM furfural. Low concentrations (2 mM-10 mM) of furfural could favor the cell growth, and the indicator of half-maximal inhibitory concentration was calculated as 13.40 mM. Glucose consumption declined to 7% with 20 mM furfural addition, and most of the energy in the raw substrate was underutilized and unconverted. Metabolite products also play a much more significant role in energy losses, especially ethanol, which came in at 13.74% at 15 mM furfural. Furfural in high density can favor the overproduction and accumulation of inhibitive end-products such as ethanol, and the ethanol concentration was up to 0.39 g/L with 15 mM furfural addition. The reduction of furfural in fermentation consumed NADH disrupts the redox poise and had adverse effects, resulting in a negative effect on the photo fermentation. This study advanced the understanding of furfural’s effect on the photo fermentation hydrogen production process and could guide the optimization of lignocellulose biomass pretreatment.

Author Contributions

Conceptualization, W.C. and X.W.; methodology, W.C.; validation, X.W., Y.J. and J.F.; formal analysis, Z.G.; investigation, C.T.; resources, W.C.; data curation, X.W.; writing—original draft preparation, W.C.; writing—review and editing, X.W. and Y.J.; supervision, W.C.; project administration, W.C.; funding acquisition, W.C. All authors have read and agreed to the published version of the manuscript.

Funding

This work is supported by the Basic Science Center Program for Ordered Energy Conversion of the National Natural Science Foundation of China (No. 51888103), the Fundamental Research Funds for the Central Universities (No. xpt022022007), National Natural Science Foundation of China (No. 52100193), and Weifang Science and technology development Project (No. 2021ZJ1106).

Data Availability Statement

The data used to support the study are included in the article.

Conflicts of Interest

The authors declare no conflict of interest.

References

  1. Fixen, K.R.; Chowdhury, N.P.; Martinez-Perez, M.; Poudel, S.; Boyd, E.S.; Harwood, C.S. The path of electron transfer to nitrogenase in a phototrophic alpha-proteobacterium. Environ. Microbiol. 2018, 20, 2500–2508. [Google Scholar] [CrossRef]
  2. Seefeldt, L.C.; Peters, J.W.; Beratan, D.N.; Bothner, B.; Minteer, S.D.; Raugei, S.; Hoffman, B.M. Control of electron transfer in nitrogenase. Curr. Opin. Chem. Biol. 2018, 47, 54–59. [Google Scholar] [CrossRef]
  3. Rutledge, H.L.; Tezcan, F.A. Electron Transfer in Nitrogenase. Chem. Rev. 2020, 120, 5158–5193. [Google Scholar] [CrossRef]
  4. Ghosh, S.; Dairkee, U.K.; Chowdhury, R.; Bhattacharya, P. Hydrogen from food processing wastes via photofermentation using Purple Non-sulfur Bacteria (PNSB)–A review. Energy Convers. Manag. 2017, 141, 299–314. [Google Scholar] [CrossRef]
  5. Akroum-Amrouche, D.; Akroum, H.; Lounici, H. Green hydrogen production by Rhodobacter sphaeroides. Energy Sources Part A Recovery Util. Environ. Eff. 2019, 1–19. [Google Scholar] [CrossRef]
  6. Tiang, M.F.; Hanipa, M.A.F.; Abdul, P.M.; Jahim, J.M.; Mahmod, S.; Takriff, M.S.; Lay, C.-H.; Reungsang, A.; Wu, S.-Y. Recent advanced biotechnological strategies to enhance photo-fermentative biohydrogen production by purple non-sulphur bacteria: An overview. Int. J. Hydrogen Energy 2020, 45, 13211–13230. [Google Scholar] [CrossRef]
  7. Chica, B.; Ruzicka, J.; Kallas, H.; Mulder, D.W.; Brown, K.A.; Peters, J.W.; Seefeldt, L.C.; Dukovic, G.; King, P.W. Defining Intermediates of Nitrogenase MoFe Protein during N2 Reduction under Photochemical Electron Delivery from CdS Quantum Dots. J. Am. Chem. Soc. 2020, 142, 14324–14330. [Google Scholar] [CrossRef]
  8. Mao, L.; Lu, B.; Shi, J.; Zhang, Y.; Kang, X.; Chen, Y.; Jin, H.; Guo, L. Rapid high-temperature hydrothermal post treatment on graphitic carbon nitride for enhanced photocatalytic H2 evolution. Catal. Today 2022. [Google Scholar] [CrossRef]
  9. Irfan, R.M.; Tahir, M.H.; Nadeem, M.; Maqsood, M.; Bashir, T.; Iqbal, S.; Zhao, J.; Gao, L. Fe3C/CdS as noble-metal-free composite photocatalyst for highly enhanced photocatalytic H2 production under visible light. Appl. Catal. A Gen. 2020, 603, 117768. [Google Scholar] [CrossRef]
  10. Irfan, R.M.; Tahir, M.H.; Iqbal, S.; Nadeem, M.; Bashir, T.; Maqsood, M.; Zhao, J.; Gao, L. Co3C as a promising cocatalyst for superior photocatalytic H2 production based on swift electron transfer processes. J. Mater. Chem. C 2021, 9, 3145–3154. [Google Scholar] [CrossRef]
  11. Divya, D.; Gopinath, L.; Christy, P.M. A review on current aspects and diverse prospects for enhancing biogas production in sustainable means. Renew. Sustain. Energy Rev. 2015, 42, 690–699. [Google Scholar] [CrossRef]
  12. Baruah, J.; Nath, B.K.; Sharma, R.; Kumar, S.; Deka, R.C.; Baruah, D.C.; Kalita, E. Recent Trends in the Pretreatment of Lignocellulosic Biomass for Value-Added Products. Front. Energy Res. 2018, 6, 141. [Google Scholar] [CrossRef]
  13. Sun, S.; Sun, S.; Cao, X.; Sun, R. The role of pretreatment in improving the enzymatic hydrolysis of lignocellulosic materials. Bioresour. Technol. 2016, 199, 49–58. [Google Scholar] [CrossRef]
  14. Akhtar, N.; Gupta, K.; Goyal, D.; Goyal, A. Recent advances in pretreatment technologies for efficient hydrolysis of lignocellulosic biomass. Environ. Prog. Sustain. Energy 2015, 35, 489–511. [Google Scholar] [CrossRef]
  15. Kumari, D.; Singh, R. Pretreatment of lignocellulosic wastes for biofuel production: A critical review. Renew. Sustain. Energy Rev. 2018, 90, 877–891. [Google Scholar] [CrossRef]
  16. Chen, H.; Liu, J.; Chang, X.; Chen, D.; Xue, Y.; Liu, P.; Lin, H.; Han, S. A review on the pretreatment of lignocellulose for high-value chemicals. Fuel Process. Technol. 2017, 160, 196–206. [Google Scholar] [CrossRef]
  17. Hosseini Koupaie, E.; Dahadha, S.; Bazyar Lakeh, A.A.; Azizi, A.; Elbeshbishy, E. Enzymatic pretreatment of lignocellulosic biomass for enhanced biomethane production-A review. J. Environ. Manag. 2019, 233, 774–784. [Google Scholar] [CrossRef]
  18. Jilani, S.B.; Prasad, R.; Yazdani, S.S. Overexpression of Oxidoreductase YghA Confers Tolerance of Furfural in Ethanologenic Escherichia coli Strain SSK42. Appl. Environ. Microbiol. 2021, 87, e01855-21. [Google Scholar] [CrossRef]
  19. Tan, Z.; Li, X.; Yang, C.; Liu, H.; Cheng, J.J. Inhibition and disinhibition of 5-hydroxymethylfurfural in anaerobic fermentation: A review. Chem. Eng. J. 2021, 424, 130560. [Google Scholar] [CrossRef]
  20. Liu, Z.L.; Ma, M.; Song, M. Evolutionarily engineered ethanologenic yeast detoxifies lignocellulosic biomass conversion inhibitors by reprogrammed pathways. Mol. Genet. Genom. 2009, 282, 233–244. [Google Scholar] [CrossRef] [Green Version]
  21. Allen, S.A.; Clark, W.; McCaffery, J.M.; Cai, Z.; Lanctot, A.; Slininger, P.J.; Liu, Z.L.; Gorsich, S.W. Furfural induces reactive oxygen species accumulation and cellular damage in Saccharomyces cerevisiae. Biotechnol. Biofuels 2010, 3, 2. [Google Scholar] [CrossRef]
  22. Zhang, Y.; Ujor, V.; Wick, M.; Ezeji, T.C. Identification, purification and characterization of furfural transforming enzymes from Clostridium beijerinckii NCIMB 8052. Anaerobe 2015, 33, 124–131. [Google Scholar] [CrossRef]
  23. Cho, H.Y.; Nam, M.S.; Hong, H.J.; Song, W.S.; Yoon, S.-I. Structural and Biochemical Analysis of the Furan Aldehyde Reductase YugJ from Bacillus subtilis. Int. J. Mol. Sci. 2022, 23, 1882. [Google Scholar] [CrossRef]
  24. Quemeneur, M.; Hamelin, J.; Barakat, A.; Steyer, J.-P.; Carrere, H.; Trably, E. Inhibition of fermentative hydrogen production by lignocellulose-derived compounds in mixed cultures. Int. J. Hydrogen Energy 2012, 37, 3150–3159. [Google Scholar] [CrossRef]
  25. Yang, J.; Jiang, D.; Shui, X.; Lei, T.; Zhang, H.; Zhang, Z.; Zhang, X.; Zhu, S.; Zhang, Q. Effect of 5-HMF and furfural additives on bio-hydrogen production by photo-fermentation from giant reed. Bioresour. Technol. 2022, 347, 126743. [Google Scholar] [CrossRef]
  26. Hu, J.; Wei, W.; Li, Q.; Cao, W.; Zhang, A.; Wang, X.; Ni, Y.; Guo, L. Metabolically versatile Rhodobacter sphaeroides as a robust biocatalyst for H2 production from lignocellulose-derived mix substrates. Fuel 2021, 302, 121108. [Google Scholar] [CrossRef]
  27. Kumka, J.E.; Schindel, H.; Fang, M.; Zappa, S.; Bauer, C.E. Transcriptomic analysis of aerobic respiratory and anaerobic photosynthetic states in Rhodobacter capsulatus and their modulation by global redox regulators RegA, FnrL and CrtJ. Microb. Genom. 2017, 3, e000125. [Google Scholar] [CrossRef]
  28. Monlau, F.; Sambusiti, C.; Barakat, A.; Quéméneur, M.; Trably, E.; Steyer, J.-P.; Carrère, H. Do furanic and phenolic compounds of lignocellulosic and algae biomass hydrolyzate inhibit anaerobic mixed cultures? A comprehensive review. Biotechnol. Adv. 2014, 32, 934–951. [Google Scholar] [CrossRef]
  29. Khan, Q.A.; Hadi, S.M. Inactivation and repair of bacteriophage lambda by furfural. Biochem. Mol. Biol. Int. 1994, 32, 379–385. [Google Scholar]
  30. De Vrije, T.; Bakker, R.R.; Budde, M.A.; Lai, M.H.; Mars, A.E.; Claassen, P.A. Efficient hydrogen production from the lignocellulosic energy crop Miscanthus by the extreme thermophilic bacteria Caldicellulosiruptor saccharolyticus and Thermotoga neapolitana. Biotechnol. Biofuels 2009, 2, 12–15. [Google Scholar] [CrossRef]
  31. Siqueira, M.R.; Reginatto, V. Inhibition of fermentative H2 production by hydrolysis byproducts of lignocellulosic substrates. Renew. Energy 2015, 80, 109–116. [Google Scholar] [CrossRef]
  32. Akobi, C.; Hafez, H.; Nakhla, G. Impact of furfural on biological hydrogen production kinetics from synthetic lignocellulosic hydrolysate using mesophilic and thermophilic mixed cultures. Int. J. Hydrogen Energy 2017, 42, 12159–12172. [Google Scholar] [CrossRef]
  33. Lane, N.; Martin, W.F. The Origin of Membrane Bioenergetics. Cell 2012, 151, 1406–1416. [Google Scholar] [CrossRef]
  34. Calisto, F.; Sousa, F.M.; Sena, F.V.; Refojo, P.N.; Pereira, M.M. Mechanisms of Energy Transduction by Charge Translocating Membrane Proteins. Chem. Rev. 2021, 121, 1804–1844. [Google Scholar] [CrossRef]
  35. Bartacek, J.; Zabranska, J.; Lens, P.N.L. Developments and constraints in fermentative hydrogen production. Biofuels Bioprod. Biorefin. 2007, 1, 201–214. [Google Scholar] [CrossRef]
  36. Davila-Vazquez, G.; Alatriste-Mondragón, F.; De León-Rodríguez, A.; Razo-Flores, E. Fermentative hydrogen production in batch experiments using lactose, cheese whey and glucose: Influence of initial substrate concentration and pH. Int. J. Hydrogen Energy 2008, 33, 4989–4997. [Google Scholar] [CrossRef]
  37. Hallenbeck, P.C.; Ghosh, D. Advances in fermentative biohydrogen production: The way forward? Trends Biotechnol. 2009, 27, 287–297. [Google Scholar] [CrossRef]
  38. Saraphirom, P.; Reungsang, A. Optimization of biohydrogen production from sweet sorghum syrup using statistical methods. Int. J. Hydrogen Energy 2010, 35, 13435–13444. [Google Scholar] [CrossRef]
  39. Lin, R.; Deng, C.; Cheng, J.; Murphy, J.D. Low concentrations of furfural facilitate biohydrogen production in dark fermentation using Enterobacter aerogenes. Renew. Energy 2019, 150, 23–30. [Google Scholar] [CrossRef]
  40. Sun, C.; Liao, Q.; Xia, A.; Fu, Q.; Huang, Y.; Zhu, X.; Zhu, X.; Wang, Z. Degradation and transformation of furfural derivatives from hydrothermal pre-treated algae and lignocellulosic biomass during hydrogen fermentation. Renew. Sustain. Energy Rev. 2020, 131, 109983. [Google Scholar] [CrossRef]
  41. Hu, B.-B.; Wang, J.-L.; Wang, Y.-T.; Zhu, M.-J. Specify the individual and synergistic effects of lignocellulose-derived inhibitors on biohydrogen production and inhibitory mechanism research. Renew. Energy 2019, 140, 397–406. [Google Scholar] [CrossRef]
  42. Lin, R.; Cheng, J.; Ding, L.; Song, W.; Zhou, J.; Cen, K. Inhibitory effects of furan derivatives and phenolic compounds on dark hydrogen fermentation. Bioresour. Technol. 2015, 196, 250–255. [Google Scholar] [CrossRef]
  43. Carlson, S.J.; Fleig, A.; Baron, M.K.; Berg, I.A.; Alber, B.E. Barriers to 3-Hydroxypropionate-Dependent Growth of Rhodobacter sphaeroides by Distinct Disruptions of the Ethylmalonyl Coenzyme A Pathway. J. Bacteriol. 2019, 201, e00556-18. [Google Scholar] [CrossRef]
  44. Lu, C.; Zhang, Z.; Zhou, X.; Hu, J.; Ge, X.; Xia, C.; Zhao, J.; Wang, Y.; Jing, Y.; Li, Y.; et al. Effect of substrate concentration on hydrogen production by photo-fermentation in the pilot-scale baffled bioreactor. Bioresour. Technol. 2017, 247, 1173–1176. [Google Scholar] [CrossRef]
  45. Xia, A.; Cheng, J.; Song, W.; Su, H.; Ding, L.; Lin, R.; Lu, H.; Liu, J.; Zhou, J.; Cen, K. Fermentative hydrogen production using algal biomass as feedstock. Renew. Sustain. Energy Rev. 2015, 51, 209–230. [Google Scholar] [CrossRef]
  46. Wang, S.; He, Z.; Yuan, Q. Xylose enhances furfural tolerance in Candida tropicalis by improving NADH recycle. Chem. Eng. Sci. 2017, 158, 37–40. [Google Scholar] [CrossRef]
  47. Behera, S.; Arora, R.; Nandhagopal, N.; Kumar, S. Importance of chemical pretreatment for bioconversion of lignocellulosic biomass. Renew. Sustain. Energy Rev. 2014, 36, 91–106. [Google Scholar] [CrossRef]
  48. Yen, H.C.; Marrs, B. Map of genes for carotenoid and bacteriochlorophyll biosynthesis in Rhodopseudomonas capsulata. J. Bacteriol. 1976, 126, 619–629. [Google Scholar] [CrossRef]
  49. Yang, H.; Wang, X.; Zhang, L.; Guo, L. Enhanced hydrogen production performance of Rubrivivax gelatinosus M002 using mixed carbon sources. Int. J. Hydrogen Energy 2012, 37, 13296–13303. [Google Scholar] [CrossRef]
  50. Wei, X.; Feng, J.; Cao, W.; Guo, L. Enhanced biohydrogen production by an ammonium-tolerant Rhodobacter capsulatus from sugarcane bagasse. Fuel 2021, 300, 121009. [Google Scholar] [CrossRef]
  51. Oh, Y.-K.; Seol, E.-H.; Kim, M.-S.; Park, S. Photoproduction of hydrogen from acetate by a chemoheterotrophic bacterium Rhodopseudomonas palustris P4. Int. J. Hydrogen Energy 2004, 29, 1115–1121. [Google Scholar] [CrossRef]
  52. Feng, J.; Li, Q.; Zhang, Y.; Yang, H.; Guo, L. High NH3N tolerance of a cheR2-deletion Rhodobacter capsulatus mutant for photo-fermentative hydrogen production using cornstalk. Int. J. Hydrogen Energy 2018, 44, 15833–15841. [Google Scholar] [CrossRef]
  53. Han, K.; Levenspiel, O. Extended monod kinetics for substrate, product, and cell inhibition. Biotechnol. Bioeng. 1988, 32, 430–447. [Google Scholar] [CrossRef]
Figure 1. Hydrogen production from glucose in the presence of furfural: (a) accumulative hydrogen yield, and (b) hydrogen production rate.
Catalysts 12 00979 g001aCatalysts 12 00979 g001b
Figure 2. Hydrogen production potential in response to different concentrations of furfural derived from the extended Monod model.
Catalysts 12 00979 g002
Figure 3. Overall H2 content (a), final cell concentration (OD660) (b), and final pH values (c) for photo-fermentations with glucose in the presence of furfural.
Catalysts 12 00979 g003
Figure 4. Glucose consumption for photo-fermentations from glucose in the absence of furfural. Glucose consumption (%) was determined as the ratio of consumed glucose (g/L) to the total input glucose (g/L).
Catalysts 12 00979 g004
Figure 5. Effects of furfural concentration (0–20 mM) on the distribution of soluble metabolic products.
Catalysts 12 00979 g005
Figure 6. Energy conversion efficiencies (%) of photo-fermentation from glucose. The calculations were based on heating values of hydrogen (286 kJ/mol), glucose (2803 kJ/mol), butyric acid (2184 kJ/mol), acetic acid (874 kJ/mol), lactic acid (1235 kJ/mol), and ethanol (1367 kJ/mol).
Catalysts 12 00979 g006
Figure 7. Proposed metabolic responses of Rhodobacter capsulatus to furfural in hydrogen production. Putative metabolism of furfural into cells is represented by dotted lines, the diagram of photosynthesis is omitted.
Catalysts 12 00979 g007
Table 1. Effects of various furfural concentrations (0–20 mM) on hydrogen production potential, maximum hydrogen production rate, lag phase.
Furfural Conc. (mM)Hmax (mol-H2/mol-glucose)Vmax (mmol-H2/(h·mol-glucose))L (h)R2
02.58 ± 0.02113.69 ± 7.0213.64 ± 0.770.9983
22.34 ± 0.0284.34 ± 2.9422.99 ± 0.510.9993
52.11 ± 0.0283.16 ± 3.3228.78 ± 0.510.9993
71.64 ± 0.0172.19 ± 2.1822.35 ± 0.370.9995
101.53 ± 0.0351.39 ± 4.8323.56 ± 1.460.9949
151.41 ± 0.0150.78 ± 0.8345.09 ± 0.230.9998
20001.0000
Table 2. Comparison of furfural inhibition on hydrogen fermentation.
StrainsSubstrateFurfuralHydrogen YieldReferences
Photosynthetic consortiumgiant reed0.2 g/L2.99 mol/mol[25]
E. aerogenes ATCC13408glucose5 mM1.56 mol/mol[39]
Rhodobacter sphaeroides HY01glucose and xylose5 mM1.79 mol/mol[26]
Hydrogen producing bacteriaglucose1 g/L2 mol/mol[40]
T. thermosaccharolyticum MJ1cellobiose2 g/L2.69 mol/mol[41]
Rhodobacter capsulatus SB1003glucose2 mM2.34 mol/molThis study
Publisher’s Note: MDPI stays neutral with regard to jurisdictional claims in published maps and institutional affiliations.

