Article

Ozone as a Catalyst of Surplus Activated Sludge Hydrolysis for the Biogas Production Enhancement

by
Katarzyna Paździor
1,*,
Marlena Domińska
1 and
Magdalena Olak-Kucharczyk
2
1
Department of Bioprocess Engineering, Lodz University of Technology, Wólczańska 213, 93-005 Lódź, Poland
2
Łukasiewicz Research Network—Lodz Institute of Technology, Maria Skłodowska-Curie 19/27, 90-570 Łódź, Poland
*
Author to whom correspondence should be addressed.
Catalysts 2022, 12(9), 1060; https://doi.org/10.3390/catal12091060
Submission received: 5 August 2022 / Revised: 8 September 2022 / Accepted: 13 September 2022 / Published: 17 September 2022
(This article belongs to the Special Issue Catalysis for Environmental and Renewable Energy Applications)

Abstract

:
The biogas produced in the methane fermentation is valuable due to its use as a renewable energy source. A promising method of biogas production intensification is sludge flocs disintegration via ozonation. The aim of this study was to check the impact of the ozonation on the efficiency and kinetics of biogas production from surplus activated sludge (SAS). Processes were carried out batchwise at 37 °C. The following analyses were performed: pH, alkalinity, dry matter, dry organic matter, chemical oxygen demand, total organic carbon, total nitrogen, elemental analysis (CHNS), the biochemical potential of methane by NIR spectroscopy, and the amount and composition of biogas. The results showed that the ozonation process had no effect on the elemental composition and chemical structure of SAS. The chemical formula of SAS (C2.97H4.68O1.20N0.3) and a simplified equation describing the methane fermentation process were determined. Ozonation caused the hydrolysis of some organic compounds from sludge flocs and increased the efficiency of biogas production. The methane content in biogas was higher by about 2.5%, while the amount of produced biogas rose by up to 21% for the ozonized sludge. The kinetic constants of first-order reaction were between 0.219 and 0.323 d−1, with an upward trend due to ozonation.

1. Introduction

Each wastewater treatment plant (WWTP) generates sludges that must be utilized. One of the most common methods of sludge utilization is anaerobic digestion, followed by agriculture application [1]. Although this process is widely used in industrial practice, optimization is still necessary. This is because there are a number of requirements imposed by the Council Directive 86/278/EEC [2] regarding sewage sludge that can be used in agriculture. Sewage sludge can only be used in agriculture if it has been previously stabilized by biological, chemical, thermal or other methods. These processes should reduce the susceptibility of sediments to rot. The sediment should also present as little odor nuisance as possible, especially if it is used in the summer and near human habitats and tourist centers. In addition, the introduction of sewage sludge to the soil may not exceed the standards set out in the Council Directive 86/278/EEC on the method of assessing soil contamination. This mainly concerns the limit values for heavy metals (Cr, Pb, Cd, Hg, Ni, Zn, and Cu) [2]. Among the sludges produced at WWTPs, surplus activated sludges (SAS) are the least susceptible to biodegradation at anaerobic conditions. As they consist mainly of microorganisms forming activated sludge [3], it is necessary to disintegrate microbial cells in order to degrade their content: organic matter (biopolymers).
There are many methods of sludge disintegration [4]:
  • Thermal;
  • Mechanical;
  • Chemical.
A very promising chemical method is the use of ozone to disintegrate the sludge and as a catalyst for the hydrolysis of surplus activated sludge. The main advantage of this method is that no byproducts are produced. The production of biogas and level of fermentation increase, and pathogenic organisms are destroyed. During ozonation, the sludge disintegrates first, then the cell membranes of microorganisms are destroyed. Finally, organic substances are oxidized [4,5,6].
There were several investigations performed on sewage sludge ozonation and its influence on the methane fermentation process [6,7,8,9]. Among other aspects, the influence of the ozone dose used was examined. Silvestre and coworkers [7] report that a dose of 0.063 gO3·gTS−1. had the best effect on the amount of produced biogas. Doses higher than this showed a negative effect on the efficiency of biogas production. In another study [8], the highest biogas yield was attained at a dose of 0.06. For lower (0.03 gO3·gTS−1) and higher (0.09 gO3·gTS−1) doses, the biogas production was lower than for non-ozonized sludge. The success of the ozonation in increasing biogas production depends on determining the optimal ozone dose. Too low a dose may not significantly affect the amount of biogas produced. Too high a dose may worsen methane fermentation [7]. In one study [10], an increase in biogas production of up to 30% compared to non-ozonized sludge was observed when using ozone as a sludge pretreatment method. In [11], acceleration of biogas production was observed at doses of 0.1–0.16 gO3·gTS−1. In the case of non-ozonized sludge, 300 ml of biogas per gram of COD added was obtained within 24 days. With the sediments ozonated with the abovementioned doses, the same amount was obtained after 15–18 days, which means production accelerated by up to 36%.
Methane fermentation is a biochemical process that takes place in anaerobic conditions. During the process, biogas is produced, which consists mainly of methane and carbon dioxide, as well as slight admixtures of nitrogen, hydrogen sulfide, hydrogen, water vapor, and other gases. Methane fermentation is carried out in psychrophilic conditions (ambient temperature for 70–80 days), mesophilic conditions (temperature 30–40 °C for about 30 days), or in thermophilic conditions (temperature above 40 °C for 15–20 days). In addition to the right temperature, an important factor influencing the stability of the process is pH in the range of 6.5–7.5 [12,13]. Another important factor influencing the process stability is the C/N ratio. According to the literature, it should be between 20 and 30. According to another study [14], even values from 9 to 50 have a positive effect. Anaerobic digestion is divided into four stages: hydrolysis, acidogenesis, acetogenesis, and methanogenesis [13]. Several simplified kinetic models were used to determine the yield potential of biogas: first-order rate, Monod type, modified Gompertz, Chen and Hashimoto, and a combination of two first-rate models [15].
The elemental composition of a substrate also influences the rate of the methane fermentation process [16]. SAS consists mainly of biomass and microorganisms, and additionally contains inorganic and organic compounds from sewage treatment plants. The percentage of inorganic compounds contained in the excess sludge is determined by its incineration. For microbial biomass, it is assumed that carbon, nitrogen, oxygen, hydrogen, and sulfur constitute about 95% of their dry mass [16]. On the basis of the elemental composition, the chemical formula of SAS—as well as stoichiometric constants of the equation describing the fermentation process—may be estimated [17,18].
The aim of this work was to analyze the effect of SAS ozonation on the amount and composition of biogas produced in the SAS anaerobic digestion. For the first time, the influence of ozonation on SAS chemical composition, as well as on the kinetics of SAS methane fermentation process, was investigated.

2. Results and Discussion

As the main goal of this paper is to maximize the biogas production from surplus activated sludge, the results/discussion mostly emphasize the methane fermentation process.

2.1. The Influence of the Inoculum to Substrate Ratio

When we consider investigation of the methane fermentation process, the most common method is biochemical methane potential (BMP) estimation in a bottle test [19]. This is not a standardized test, but the most common practices include:
  • Inoculum—anaerobic sludge from a municipal wastewater treatment plant;
  • Strictly anaerobic conditions;
  • Constant temperature in the mesophilic range;
  • Volumetric biogas quantity measurements;
  • Automatic stirring devices;
  • Bottles capacity between 100 and 500 ml;
  • Duration of the test between 13 and 87 d;
  • pH in the range from 7 to 7.8;
  • Alkalinity at a minimum of 2500 mgCaCO3·L−1;
  • Inoculum to substrate ratio (ISR) on the basis of volatile solids between 1 and 2 [20].
Some authors conclude that ISR has no significant influence of the total biogas yield in the BMP tests [19]. Within this study, the first experiment was devoted to checking how important ISR is in the case of the SAS fermentation process. As we can see in Figure 1, the mean values of the biogas production were higher in the case of ISR equal to 1, but the difference was no larger than that produced by measurement errors. The mean values of biogas yield differed by 23 mlCH4·gVS−1, while standard deviation reached values up to 55 mlCH4·gVS−1 (Figure 1). Although the ISR in the range between 1 and 2 had no significant influence on the biogas production from SAS, further experiments were conducted using an ISR close to one, as a smaller ISR ratio means more efficient usage of bioreactor volume (in practice).

2.2. The Influence of Ozonation on the Biogas Yield and Composition

During this investigation, ozonation was performed on the SAS that was only thickened by gravity at WWTP. Total solids of this sludge varied between 4 and 6 gTS·L−1. The ozonation led to the disintegration and hydrolysis of organic compounds present in the sludge flocs. As a result, a significant increase in soluble COD was observed—up to 3.75 times—with an ozone dose equal to 0.38 gO3·gTS−1 (Figure 2).
Commonly, the methane fermentation process at WWTP is conducted on sludge concentrated by centrifugation or press filtration to at least 20 gTS·L−1. In order to reach the common value of suspended solids in a substrate, ozonated and non-ozonated sludges were centrifugated and concentrated to desired total solids concentration prior to the anaerobic digestion. However, such sludge treatment may lead to a loss of organic compounds that were hydrolyzed during the ozonation. Therefore, two series of experiments were conducted—one on the concentrated sludge and another one on the non-concentrated sludge. Independently from the pretreatment, the mixtures of the substrates and inoculum had pH values in the optimal range for the methanogenic archaea, varying between 7.28 and 7.55 at the start of the bottle tests and between 7.43 and 7.59 at the end of the experiments.
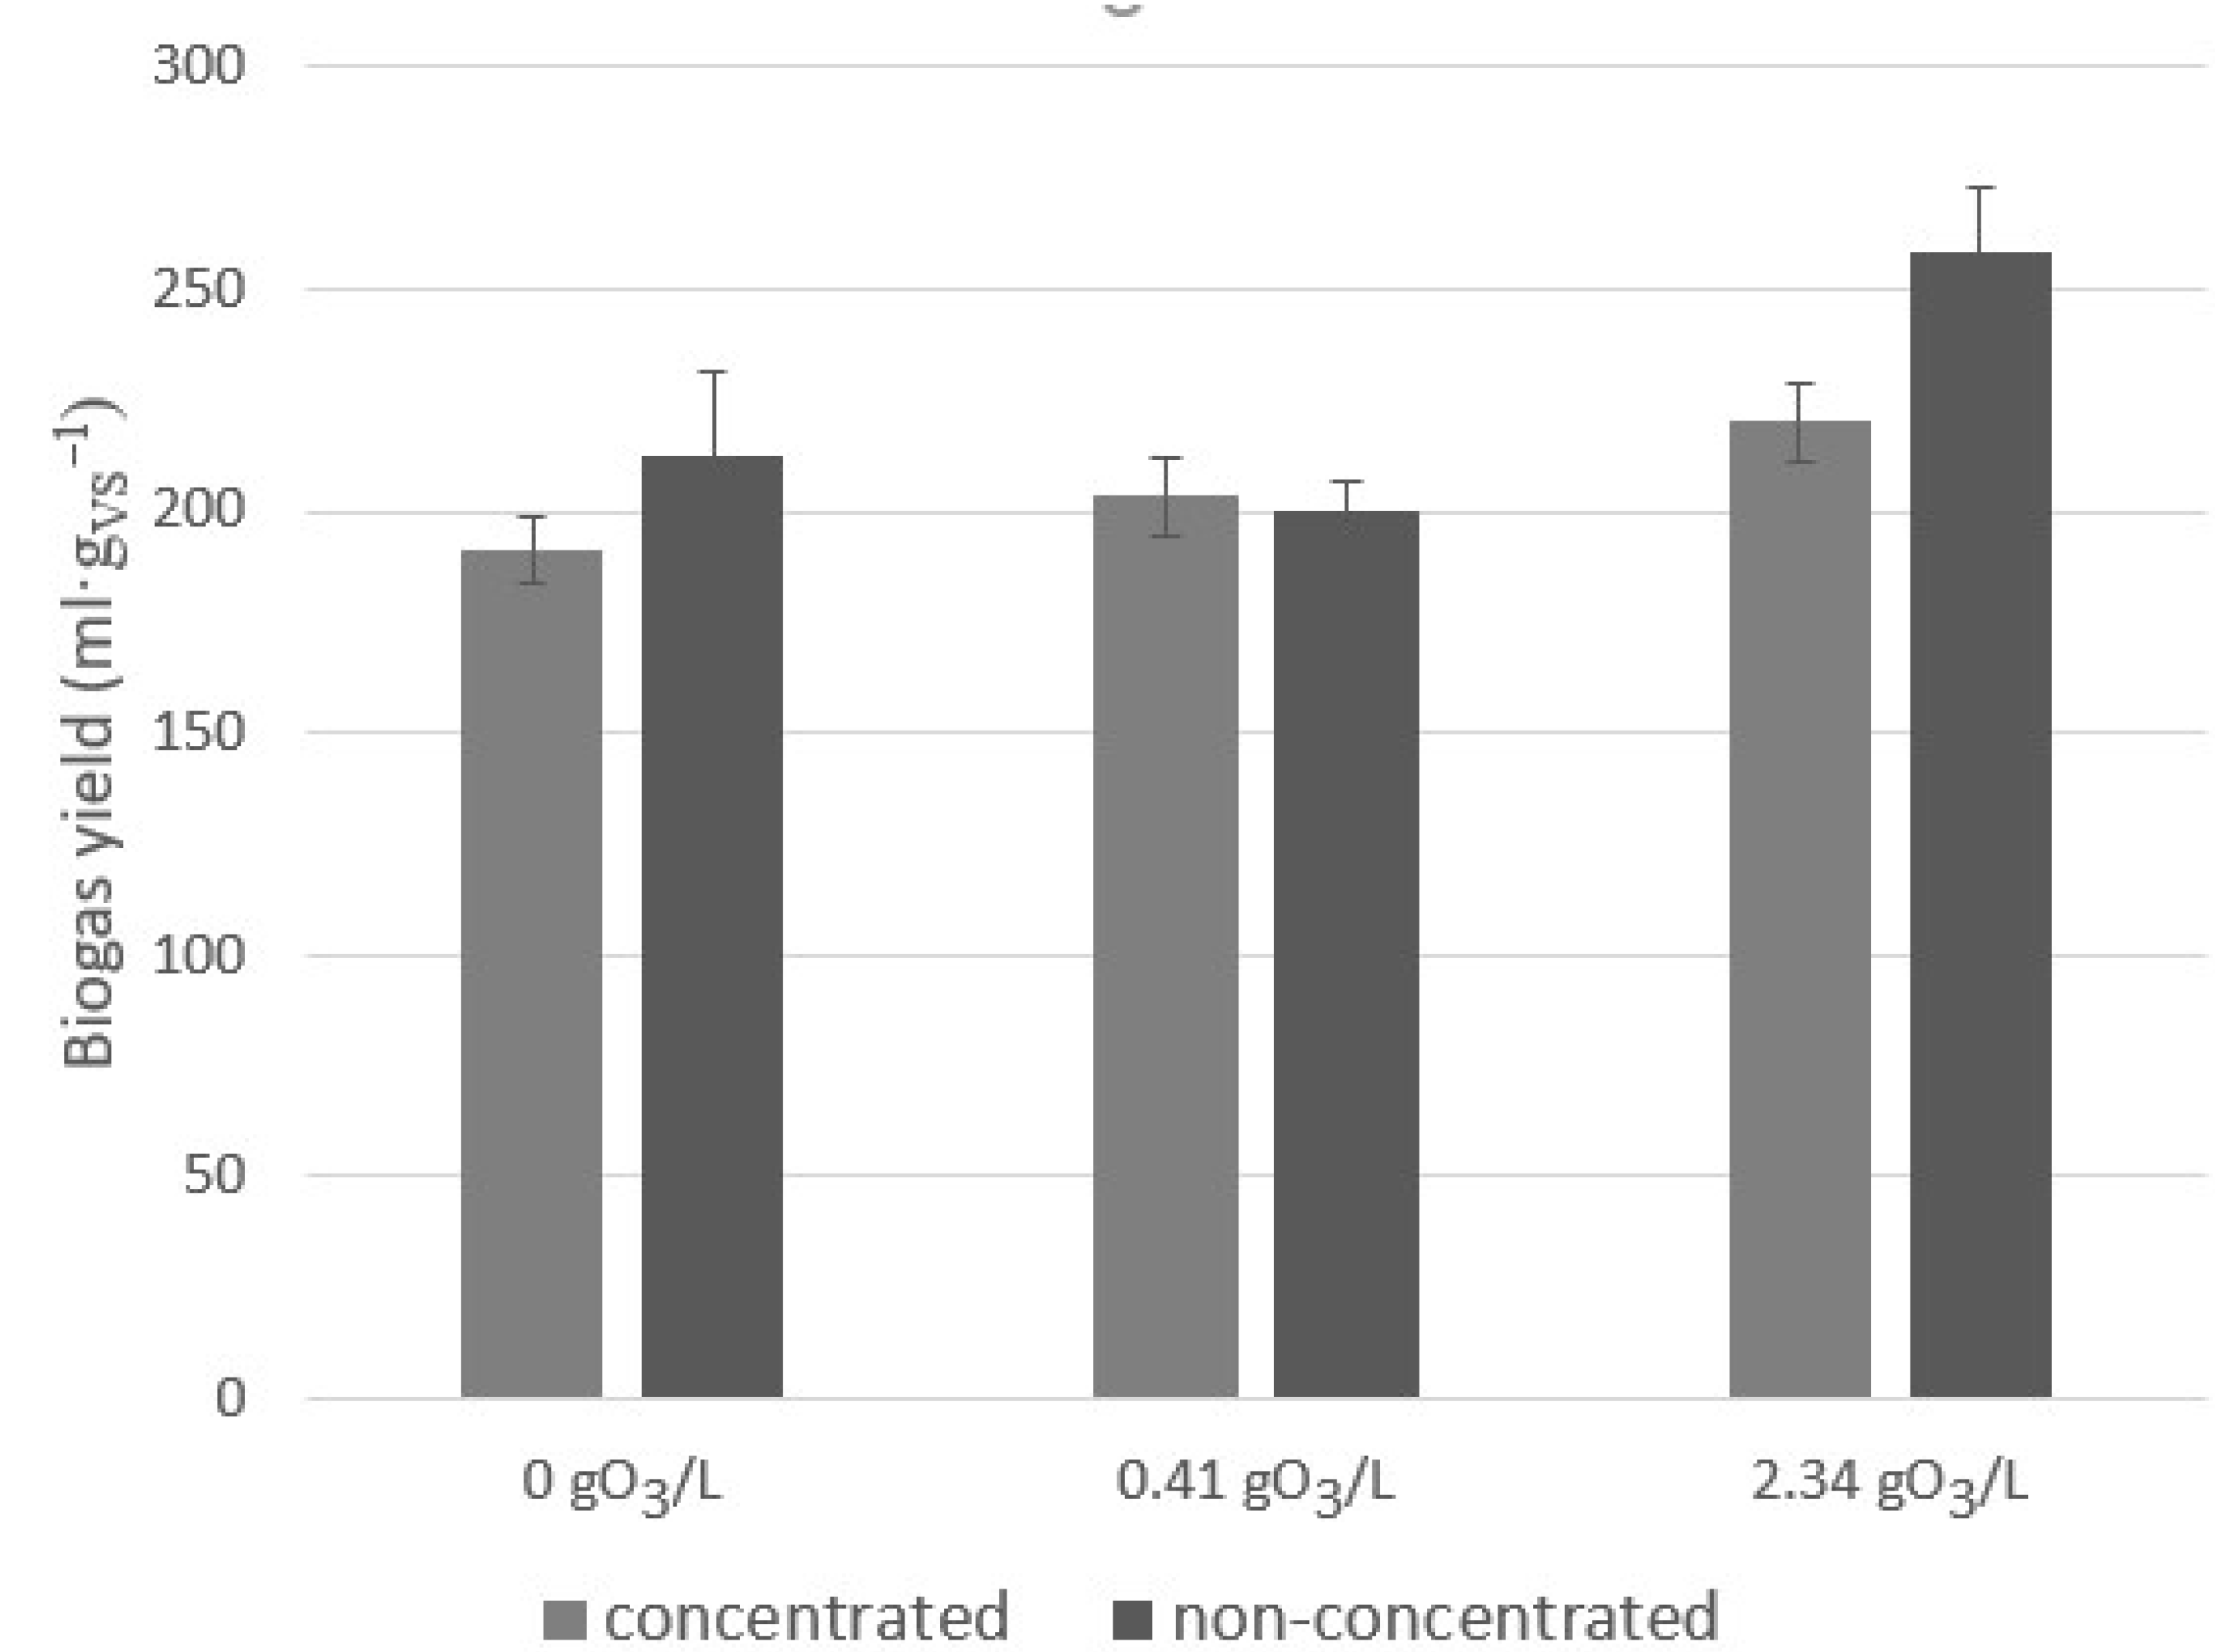
In the case of concentrated sludge, an increase in the total biogas production due to the ozonation pretreatment was observed (Figure 3): 6.3% (from 191 ± 24 to 203 ± 18 ml·gVS−1) via a smaller ozone dose (0.41 gO3 per L of sludge or 0.095 gO3·gTS−1) and 15.1% (to 220 ± 18 ml·gVS−1) via a bigger ozone dose (2.34 gO3 per L of sludge or 0.54 gO3·gTS−1). The results of the experiment with non-concentrated sludge varied (Figure 3). Ozonation with the smaller ozone dose (0.41 gO3 per L of sludge or 0.066 gO3·gTS−1) led to a decrease in the biogas production—5.8% (from 212 ± 38 to 200 ± 14 ml·gVS−1)—while the ozonation with the bigger ozone dose (2.34 gO3 per L of sludge or 0.38 gO3·gTS−1) caused an increase of about 22% (from 212 ± 38 to 258 ± 29 ml·gVS−1). The results obtained within this study differ significantly from those published by Silvestre and coworkers [7] in a similar investigations. They observed that an ozone dose equal to 0.063 gO3·gTS−1 (1.7 gO3 per L of sludge) led to an increase in biogas production, while higher ozone doses led to a decrease. However, they also observed a 21% increase in biogas potential at the optimal ozone dose. Moreover, the total biogas production maintained by Silvestre and coworkers was significantly higher—319 ml·gVS−1 for untreated SAS and 388 ml·gVS−1 with the optimal ozone dose—while Filer and coworkers [19] obtained 219 ml·gVS−1 for untreated SAS.
The biogas composition obtained within this study was typical for the methane fermentation of SAS (except for nitrogen). The biggest volumetric fraction was the methane—from 58 to 65% v/v—then carbon dioxide—between 21 and 26% v/v (Figure 4). The volumetric fraction of nitrogen (even exceeding 10%) was due to residual nitrogen from flushing the cylinder volume at the start of the test. Approximately 5% higher methane fractions were observed for concentrated sludge. in comparison to non-concentrated sludge. The ozonation led to a slight increase in the methane fraction—up to 4% higher than for the non-ozonated sludge (Figure 4). Silvestre and coworkers [7] obtained similar results.

2.3. SAS Chemical Composition

The results of the elemental analysis can be used to propose the summary formula of the substrate for the methane fermentation process. The SAS consists mainly of microbial biomass. Additionally, it contains organic and inorganic compounds from treated wastewater. The percentage of inorganic compounds contained in the tested material was determined by its combustion (during the analysis of volatile solids). For microbial biomass, it is assumed that carbon, nitrogen, oxygen, hydrogen, and sulfur constitute about 95% of their dry mass. Having determined percentages of carbon, nitrogen, hydrogen, sulfur (Table 1) and ash, the percentages of oxygen were calculated. The ozonation had no influence on the chemical composition of sludge (Table 1).
Using the molar masses of individual elements, the stoichiometric coefficients were calculated to the simplified formula of the substrate:
CaHbOcNdSe
Due to the very similar results of the elemental analysis of SAS before and after ozonation (Table 2), we can describe them using one formula:
C2.97H4.68O1.20N0.3
In comparison to data from the literature, the SAS analyzed within this study contained less nitrogen. Mass ratios of carbon, hydrogen, oxygen, and nitrogen (C:H:O:N) were as follows:
  • 53:7:31:9 [17];
  • 54:9:31:9 [18];
  • 76:10:41:9 (this study).
The methane fermentation process may be described by Equation (3) published by Simon and Buswell, and modified by Boyle [18]:
CaHbOcNd + (a − b/4 − c/2+3d/4)H2O → (a/2 − b/8+c/4+3d/8)CO2 + (a/2+b/8 − c/4 − 3d/8)CH4 + dNH3
Based on the results obtained (collected in Table 2), the following equation was proposed:
C2.97H4.68O1.20N0.3+ 1.43H2O → 1.31CO2 + 1.66CH4 + 0.3NH3
The theoretical Biochemical Methane Potential may be calculated based on the substrate chemical formula [20] using Equation (5):
BMPth = (a/2 + b/8 − c/4 − 3d/8 − e/4) × 22400/(12a + b + 16c + 14d + 32e)
Calculated values of theoretical Biochemical Methane Potential were collected in Table 3.

2.4. The Influence of Ozonation on BMP

BMP values obtained by means of NIR spectroscopy constituted from 34 to 40% of theoretical BMP independently from ozonation (Table 3). Ozonation had no significant influence on the chemical composition of SAS. As a result, differences in the theoretical BMP due to the ozonation are below 5% (Table 3). Similarly, BMP measured by means of NIR spectroscopy vary insignificantly, with differences below 7% (Table 3).
Ozonation with the bigger ozone dose (2.34 gO3·L−1) led to significant increase in BMP estimated in bottles (the most common method of BMP test). For the concentrated SAS, an improvement of 17.8% was observed, while for the non-concentrated SAS, an improvement of 22.5% was observed. Additionally, the increase in BMP in bottles to BMP theoretical ratio was observed—from 20 to 25% for concentrated SAS and from 21 to 28% for the non-concentrated SAS (Table 3).

2.5. The Influence of Ozonation on Methane Fermentation Kinetics

The simplest kinetic model—first-order reaction for the methane production (estimated by means of bottles test)—was used (Equation (6))
CH4 = CH4max·[1 − exp(−k·t)]
where:
  • CH4—volume of methane produced in time t (mlCH4);
  • CH4max—volume of methane at the end of the process (mlCH4);
  • K—kinetic constant (d−1).
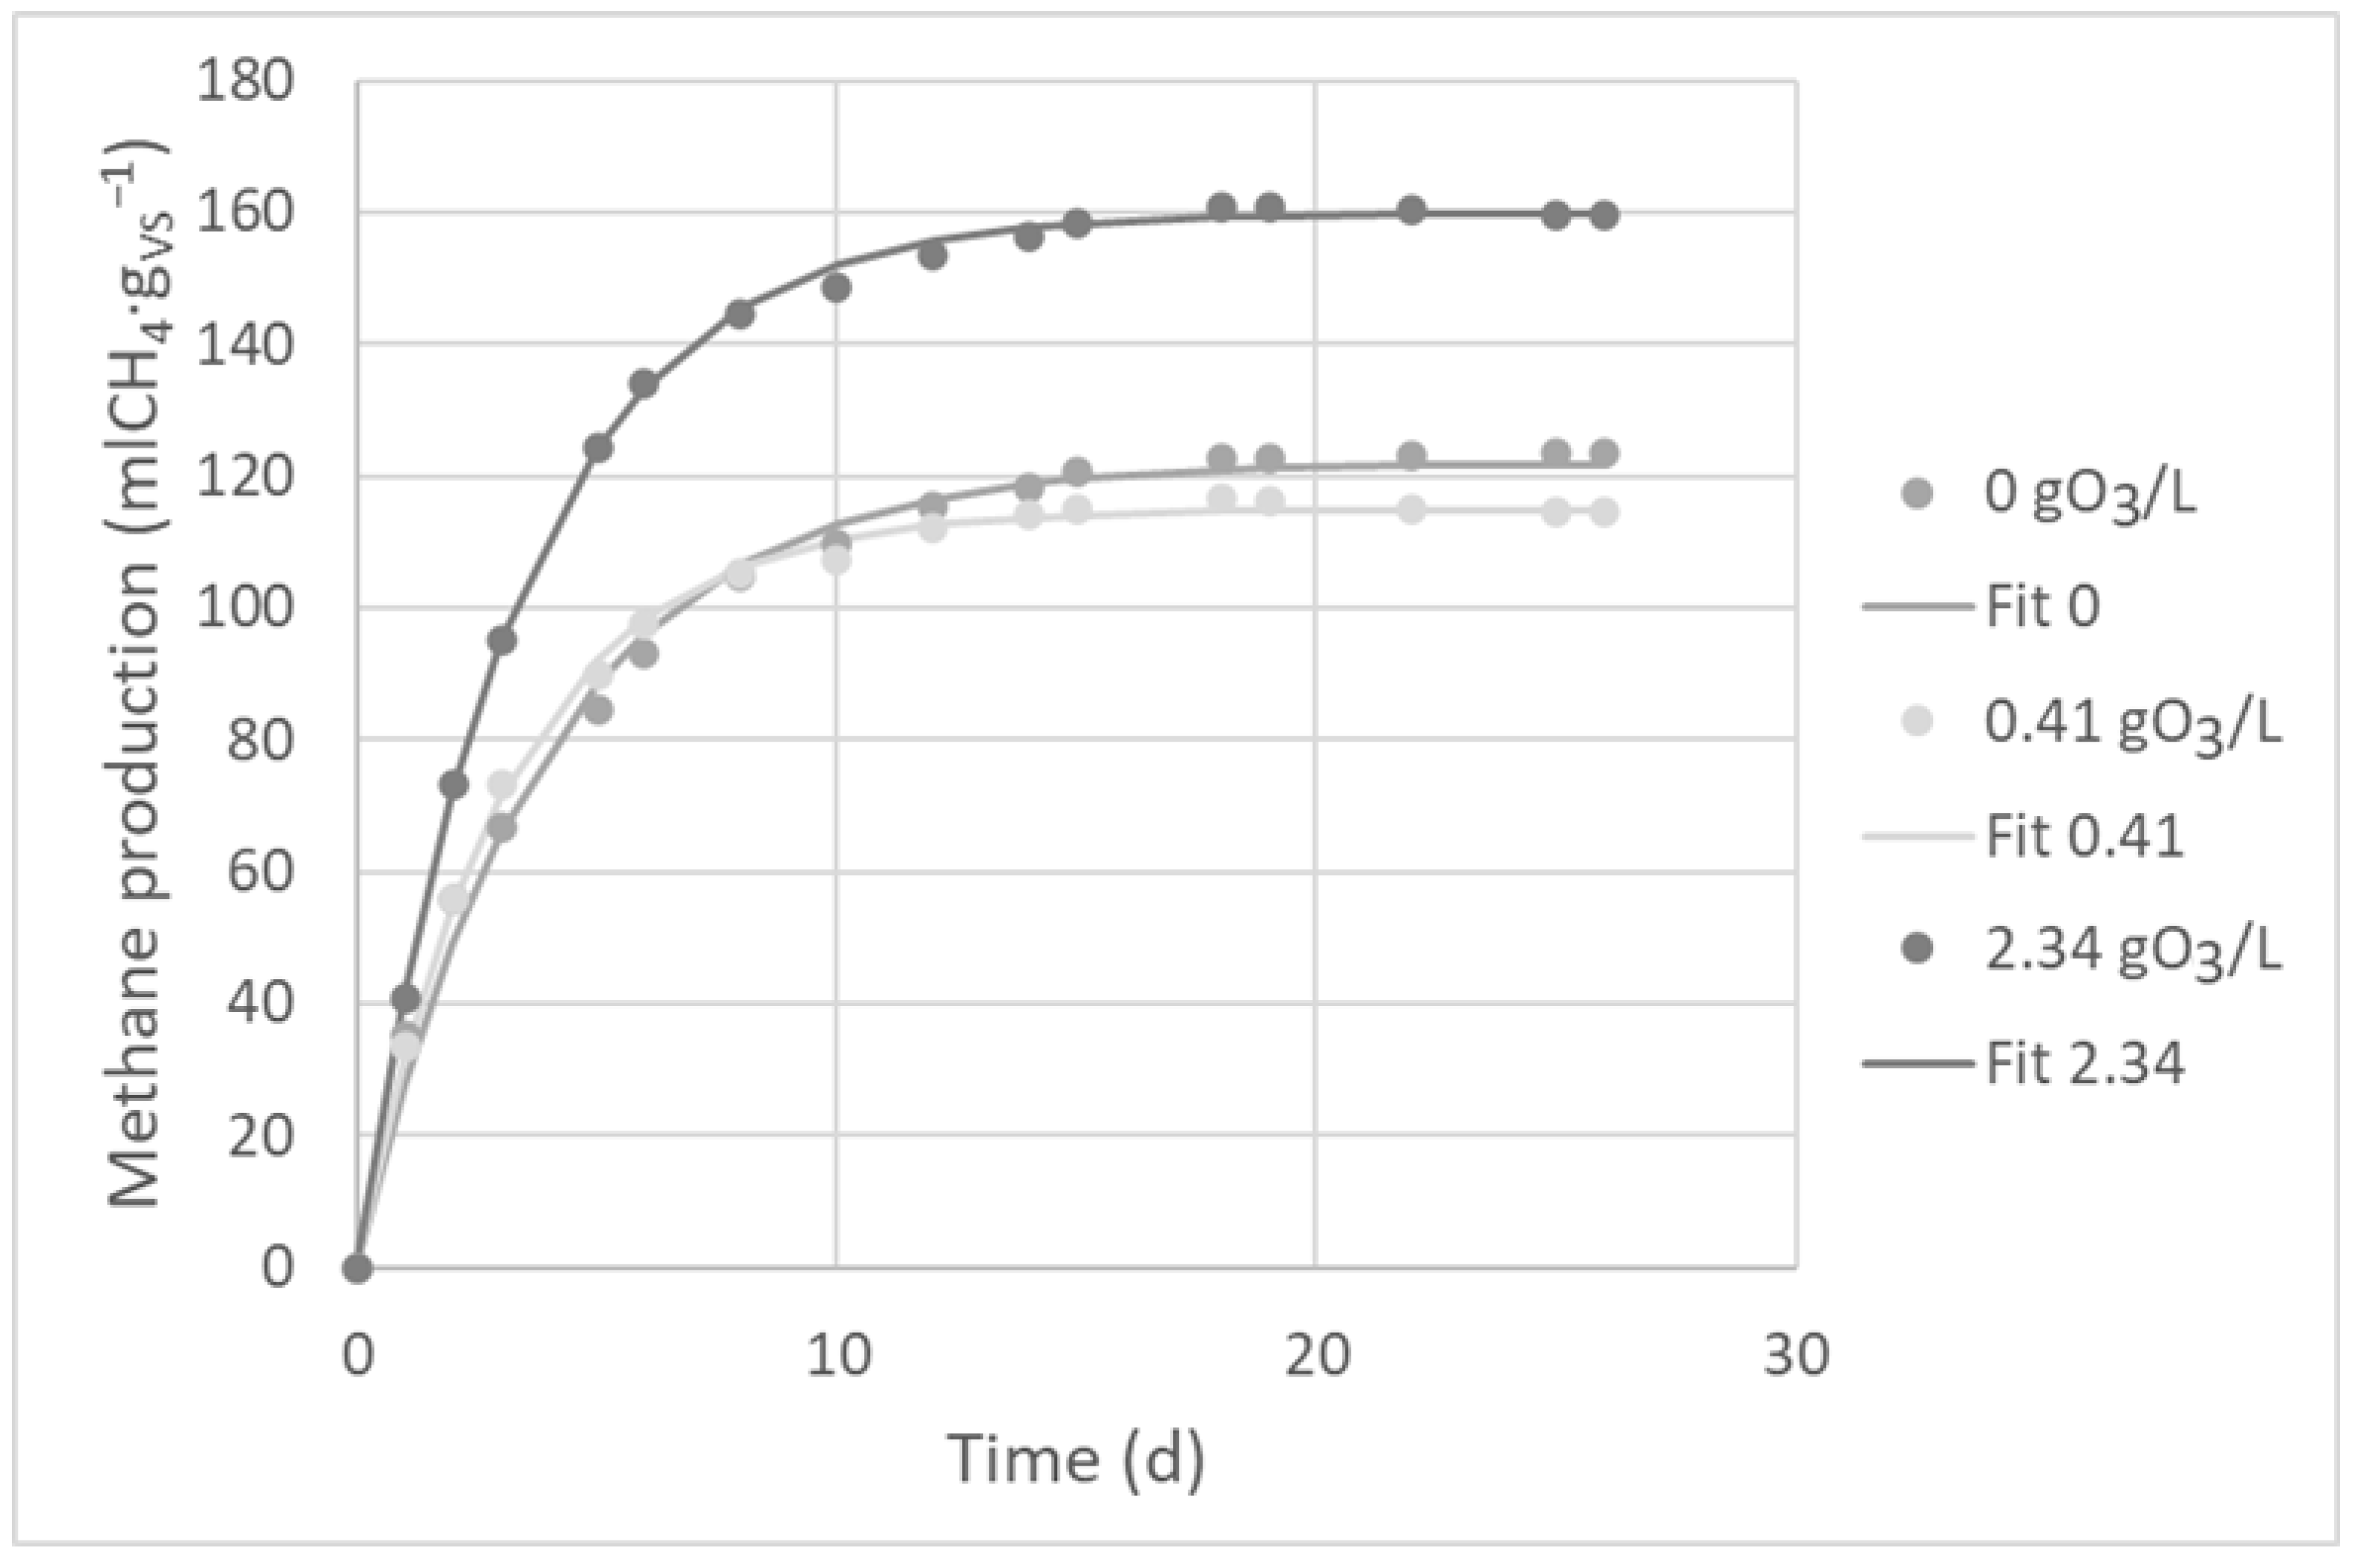
Despite the use of a very simplified model, a good fit to the experimental data was obtained (Figure 5): R2 values between 0.992 and 0.999 (Table 4). The ozonation led to the increase in the kinetic constant (Table 4). However, the differences between two SAS samples (0.219 and 0.259 d−1) were bigger than for the ozonation (0.219 to 0.231 d−1, 0.259 to 0.323 d−1). Kinetic constant values were in the range for organic substrates (starch: 0.24 d−1; cellulose: 0.21 d−1; gelatin: 0.34 d−1; mung bean: 0.21 d−1) presented by Raposo and coworkers [20], but higher than value obtained by Filer and coworkers [19] for SAS (0.1406 d−1).

3. Conclusions

The resented results showed that the ozonation process had no significant influence on the chemical composition of the SAS. The BMP (both theoretical and estimated by means of NIR spectroscopy) was unaffected by the ozonation. On the contrary, the influence of ozonation was visible in the results of the bottle test. The use of ozone led to the partial release of the organic matter from sludge flocs to supernatant (the increase in the soluble COD after the ozonation was significant—up to three times higher). As a result, the rise in biogas production (about 20%) and first-order kinetic constant of the fermentation process (between 5 and 15%) for the SAS ozonized by an ozone dose between 0.4–0.5 gO3·gTS−1 were observed. This paper shows the results of preliminary investigations on ozonation influence on the anaerobic digestion of the secondary active sludge at a small, laboratory scale. Further research, on a pilot scale, might provide an answer to the question of whether this pretreatment method is both economically and environmentally viable.

4. Materials and Methods

4.1. Substrate and Inoculum

Substrate samples of SAS were taken from the thickener tank at the municipal WWTP in Zgierz (Poland). As an inoculum, anaerobic sludge from an anaerobic digester at the municipal WWTP in Lodz was used. Table 5 presents the main characteristics of used materials. Figure 6 shows the scheme of the performed experiment.

4.2. Experimental Set-Up and Procedure

The methane fermentation process was carried out in batch mode in 1 L glass bottles placed in a thermostated shaker (New Brunswick Scientific, EXCELLA E24R, St Albans, UK) at 37 °C and with a shaking speed of 140 rpm. ISR on an organic matter (VS) basis was set at 1 and 2 during the first run of experiments, and at 1 during the others. During the two series of experiments, SASs were concentrated by means of MPW-250 centrifuge (MPW Med-Instruments) in order to obtain a total solids concentration of 20 ± 1 gTS·L−1 in SAS. Blank bottles were set by adding inoculum only. Tests were run in duplicate. Biogas production was measured using a displacement method. “Bioreactor” bottle was connected (via gas tight tubes) to a graduated (accuracy 100 ml) 1 L Duran glass bottle filled with brine, and further with a non-graduated glass bottle. The level of biogas was read every 24 h. The reactors ran until the daily gas production was less than 1% of cumulative gas production. At the beginning and end of batch fermentation, the contents of the bottles were analyzed for pH, total solids, volatile solids, and total and soluble COD.
Ozonation of sludge was carried out in the glass 1 L reactor equipped with a porous plate to deliver gas mixture into the reaction solution. The sludge volume applied in all ozonation experiments was 1 L. The volumetric flow rate of gas mixture was equal to 300 ml·min−1. Ozone was generated from oxygen in the BMT 802 N ozonator. Ozone concentration in the gas stream in the inlet of the reactor was measured using an ozone analyzer BMT 964BT (BMT Messtechnik, Berlin, Germany). Ozone concentration in the gas stream in the inlet was 23 and 130 g Nm−3, respectively. The ozone dose supplied to the sludge was 0.41 and 2.34 g L−1, respectively. The ozonation processes were conducted at ambient temperature (20 ± 1 °C) for 60 min. After the ozone was completely consumed, sludge was used in the methane fermentation process.

4.3. Analytical Methods

pH, total solids, and volatile solids were determined according to Standard Methods [21]. Prior soluble component analysis samples were centrifugated and filtered via paper filter (Munktell type 389). Total COD was measured after homogenization (homogenizer T 25B IKA). COD was determined using a standard dichromate method with usage of thermostat HT200S, spectrophotometer DR 5000 and cuvettes LCK514, Hach. The elemental composition of the solid fraction (C, H, N, and S content) was measured using an elemental analyzer NA 2500 (CE Instruments, The Old Barn, UK).
Biogas composition was determined via gas chromatography using a SRI 8610C gas chromatograph (SRI Instruments, Torrance, CA, USA) equipped with TCD detector and two chromatographic columns: a column packed with Silica Gel No. 8 and 5A molecular sieve mesh 80/100.
Prior to the NIR analysis, samples were dried at 105 °C and grounded by a ball mill (Fritsch, Pulverisette 23 Idar-Oberstein, Germany). The NIR spectra were acquired through a Buchi NIRFlex N-500 solids (Buchi, Flawil, Switzerland), equipped with a vials accessory, using a diffuse reflection mode. The reflectance was measured over 4000–10,000 cm−1 with a resolution of 4 cm−1. The BMP (ml·CH4·gVS−1) was estimated using FlashBMP® calibration developed by Ondalys (Chemo-metrics–Data Analytics) and commercialized by Buchi (Switzerland).
Data fitting to the model was performed using Origin software by Levenberg-Marquardt algorithm, with own user function defined according to Equation (6).

Author Contributions

Conceptualization and methodology: K.P. and M.O.-K.; investigation: K.P., M.D. and M.O.-K.; writing—original draft preparation: K.P., M.D. and M.O.-K.; writing—review and editing: M.O-K. All authors have read and agreed to the published version of the manuscript.

Funding

This research was supported by the Polish Ministry of Science and Higher Education within statutory research work carried out at The Lukasiewicz Research Network—Lodz Institute of Technology, Lodz, Poland.

Data Availability Statement

Not applicable.

Conflicts of Interest

The authors declare no conflict of interest.

References

  1. Tarpani, R.R.Z.; Alfonsín, C.; Hospido, A.; Azapagic, A. Life Cycle Environmental Impacts of Sewage Sludge Treatment Methods for Resource Recovery Considering Ecotoxicity of Heavy Metals and Pharmaceutical and Personal Care Products. J. Environ. Manag. 2020, 260, 109643. [Google Scholar] [CrossRef] [PubMed]
  2. EU. Council Directive of 12 June 1986 on the Protection of the Environment, and in Particular of the Soil, When Sewage Sludge Is Used in Agriculture (86/278/EEC); EU: Brussels, Belgium, 1986. [Google Scholar]
  3. Tansel, B. Morphology, Composition and Aggregation Mechanisms of Soft Bioflocs in Marine Snow and Activated Sludge: A Comparative Review. J. Environ. Manag. 2018, 205, 231–243. [Google Scholar] [CrossRef] [PubMed]
  4. Tyagi, V.K.; Lo, S.L. Application of Physico-Chemical Pretreatment Methods to Enhance the Sludge Disintegration and Subsequent Anaerobic Digestion: An up to Date Review. Rev. Environ. Sci. Biotechnol. 2011, 10, 215–242. [Google Scholar] [CrossRef]
  5. Foladori, P.; Andreottola, G.; Ziglio, G. Sludge Reduction Technologies in Wastewater Treatment Plants; IWA Publishing: London, UK, 2010; ISBN 9781780401706. [Google Scholar]
  6. Salsabil, M.R.; Laurent, J.; Casellas, M.; Dagot, C. Techno-Economic Evaluation of Thermal Treatment, Ozonation and Sonication for the Reduction of Wastewater Biomass Volume before Aerobic or Anaerobic Digestion. J. Hazard. Mater. 2010, 174, 323–333. [Google Scholar] [CrossRef] [PubMed]
  7. Silvestre, G.; Ruiz, B.; Fiter, M.; Ferrer, C.; Berlanga, J.G.; Alonso, S.; Canut, A. Ozonation as a Pre-Treatment for Anaerobic Digestion of Waste-Activated Sludge: Effect of the Ozone Doses. Ozone Sci. Eng. 2015, 37, 316–322. [Google Scholar] [CrossRef]
  8. Tuncay, S.; Akcakaya, M.; Icgen, B. Ozonation of Sewage Sludge Prior to Anaerobic Digestion Led to Methanosaeta Dominated Biomethanation. Fuel 2022, 313, 122690. [Google Scholar] [CrossRef]
  9. Cheng, C.J.; Hong, P.K.A. Anaerobic Digestion of Activated Sludge after Pressure-Assisted Ozonation. Bioresour. Technol. 2013, 142, 69–76. [Google Scholar] [CrossRef] [PubMed]
  10. Goel, R.; Tokutomi, T.; Yasui, H.; Noike, T. Optimal Process Configuration for Anaerobic Digestion with Ozonation. Water Sci. Technol. 2003, 48, 85–96. [Google Scholar] [CrossRef] [PubMed]
  11. Bougrier, C.; Albasi, C.; Delgenès, J.P.; Carrère, H. Effect of Ultrasonic, Thermal and Ozone Pre-Treatments on Waste Activated Sludge Solubilisation and Anaerobic Biodegradability. Chem. Eng. Process. Process Intensif. 2006, 45, 711–718. [Google Scholar] [CrossRef]
  12. Dumontet, S.; Dinel, H.; Baloda, S. Pathogen Reduction in Sewage Sludge by Composting and Other Biological Treatments: A Review. Biol. Agric. Hortic. 1999, 16, 409–430. [Google Scholar] [CrossRef]
  13. Michalska, K.; Pazera, A.; Bizukojć, M. CBI Proakademia; Łódź: Łódź, Poland, 2014; pp. 32–54. [Google Scholar]
  14. Guarino, G.; Carotenuto, C.; Di Cristofaro, F.; Papa, S.; Morrone, B.; Minale, M. Does the C/N Ratio Really Affect the Bio-Methane Yield? A Three Years Investigation of Buffalo Manure Digestion. Chem. Eng. Trans. 2016, 49, 463–468. [Google Scholar] [CrossRef]
  15. Zhu, B.; Gikas, P.; Zhang, R.; Lord, J.; Jenkins, B.; Li, X. Characteristics and Biogas Production Potential of Municipal Solid Wastes Pretreated with a Rotary Drum Reactor. Bioresour. Technol. 2009, 100, 1122–1129. [Google Scholar] [CrossRef] [PubMed]
  16. Stelmach, E.; Stelmach, J.; Krzystek, L.; Ledakowicz, S. Wpływ Zawartości Węgla i Azotu Na Szybkość Produkcji Biogazu Organicznej Frakcji Stałych Odpadów Komunalnych. Inż. Ap. Chem. 2010, 49, 107–108. [Google Scholar]
  17. Barber, W.P.F. Influence of Wastewater Treatment on Sludge Production and Processing. Water Environ. J. 2014, 28, 1–10. [Google Scholar] [CrossRef]
  18. Lafratta, M.; Thorpe, R.B.; Ouki, S.K.; Shana, A.; Germain, E.; Willcocks, M.; Lee, J. Development and Validation of a Dynamic First Order Kinetics Model of a Periodically Operated Well-Mixed Vessel for Anaerobic Digestion. Chem. Eng. J. 2021, 426, 131732. [Google Scholar] [CrossRef]
  19. Filer, J.; Ding, H.H.; Chang, S. Biochemical Methane Potential (BMP) Assay Method for Anaerobic Digestion Research. Water 2019, 11, 921. [Google Scholar] [CrossRef]
  20. Raposo, F.; Fernández-Cegrí, V.; de la Rubia, M.A.; Borja, R.; Béline, F.; Cavinato, C.; Demirer, G.; Fernández, B.; Fernández-Polanco, M.; Frigon, J.C.; et al. Biochemical Methane Potential (BMP) of Solid Organic Substrates: Evaluation of Anaerobic Biodegradability Using Data from an International Interlaboratory Study. J. Chem. Technol. Biotechnol. 2011, 86, 1088–1098. [Google Scholar] [CrossRef]
  21. Eaton, A.D. Standard Methods for the Examination of Water and Wastewater, 21st ed.; APHA-AWWA-WEF: Washington, DC, USA, 2005. [Google Scholar]
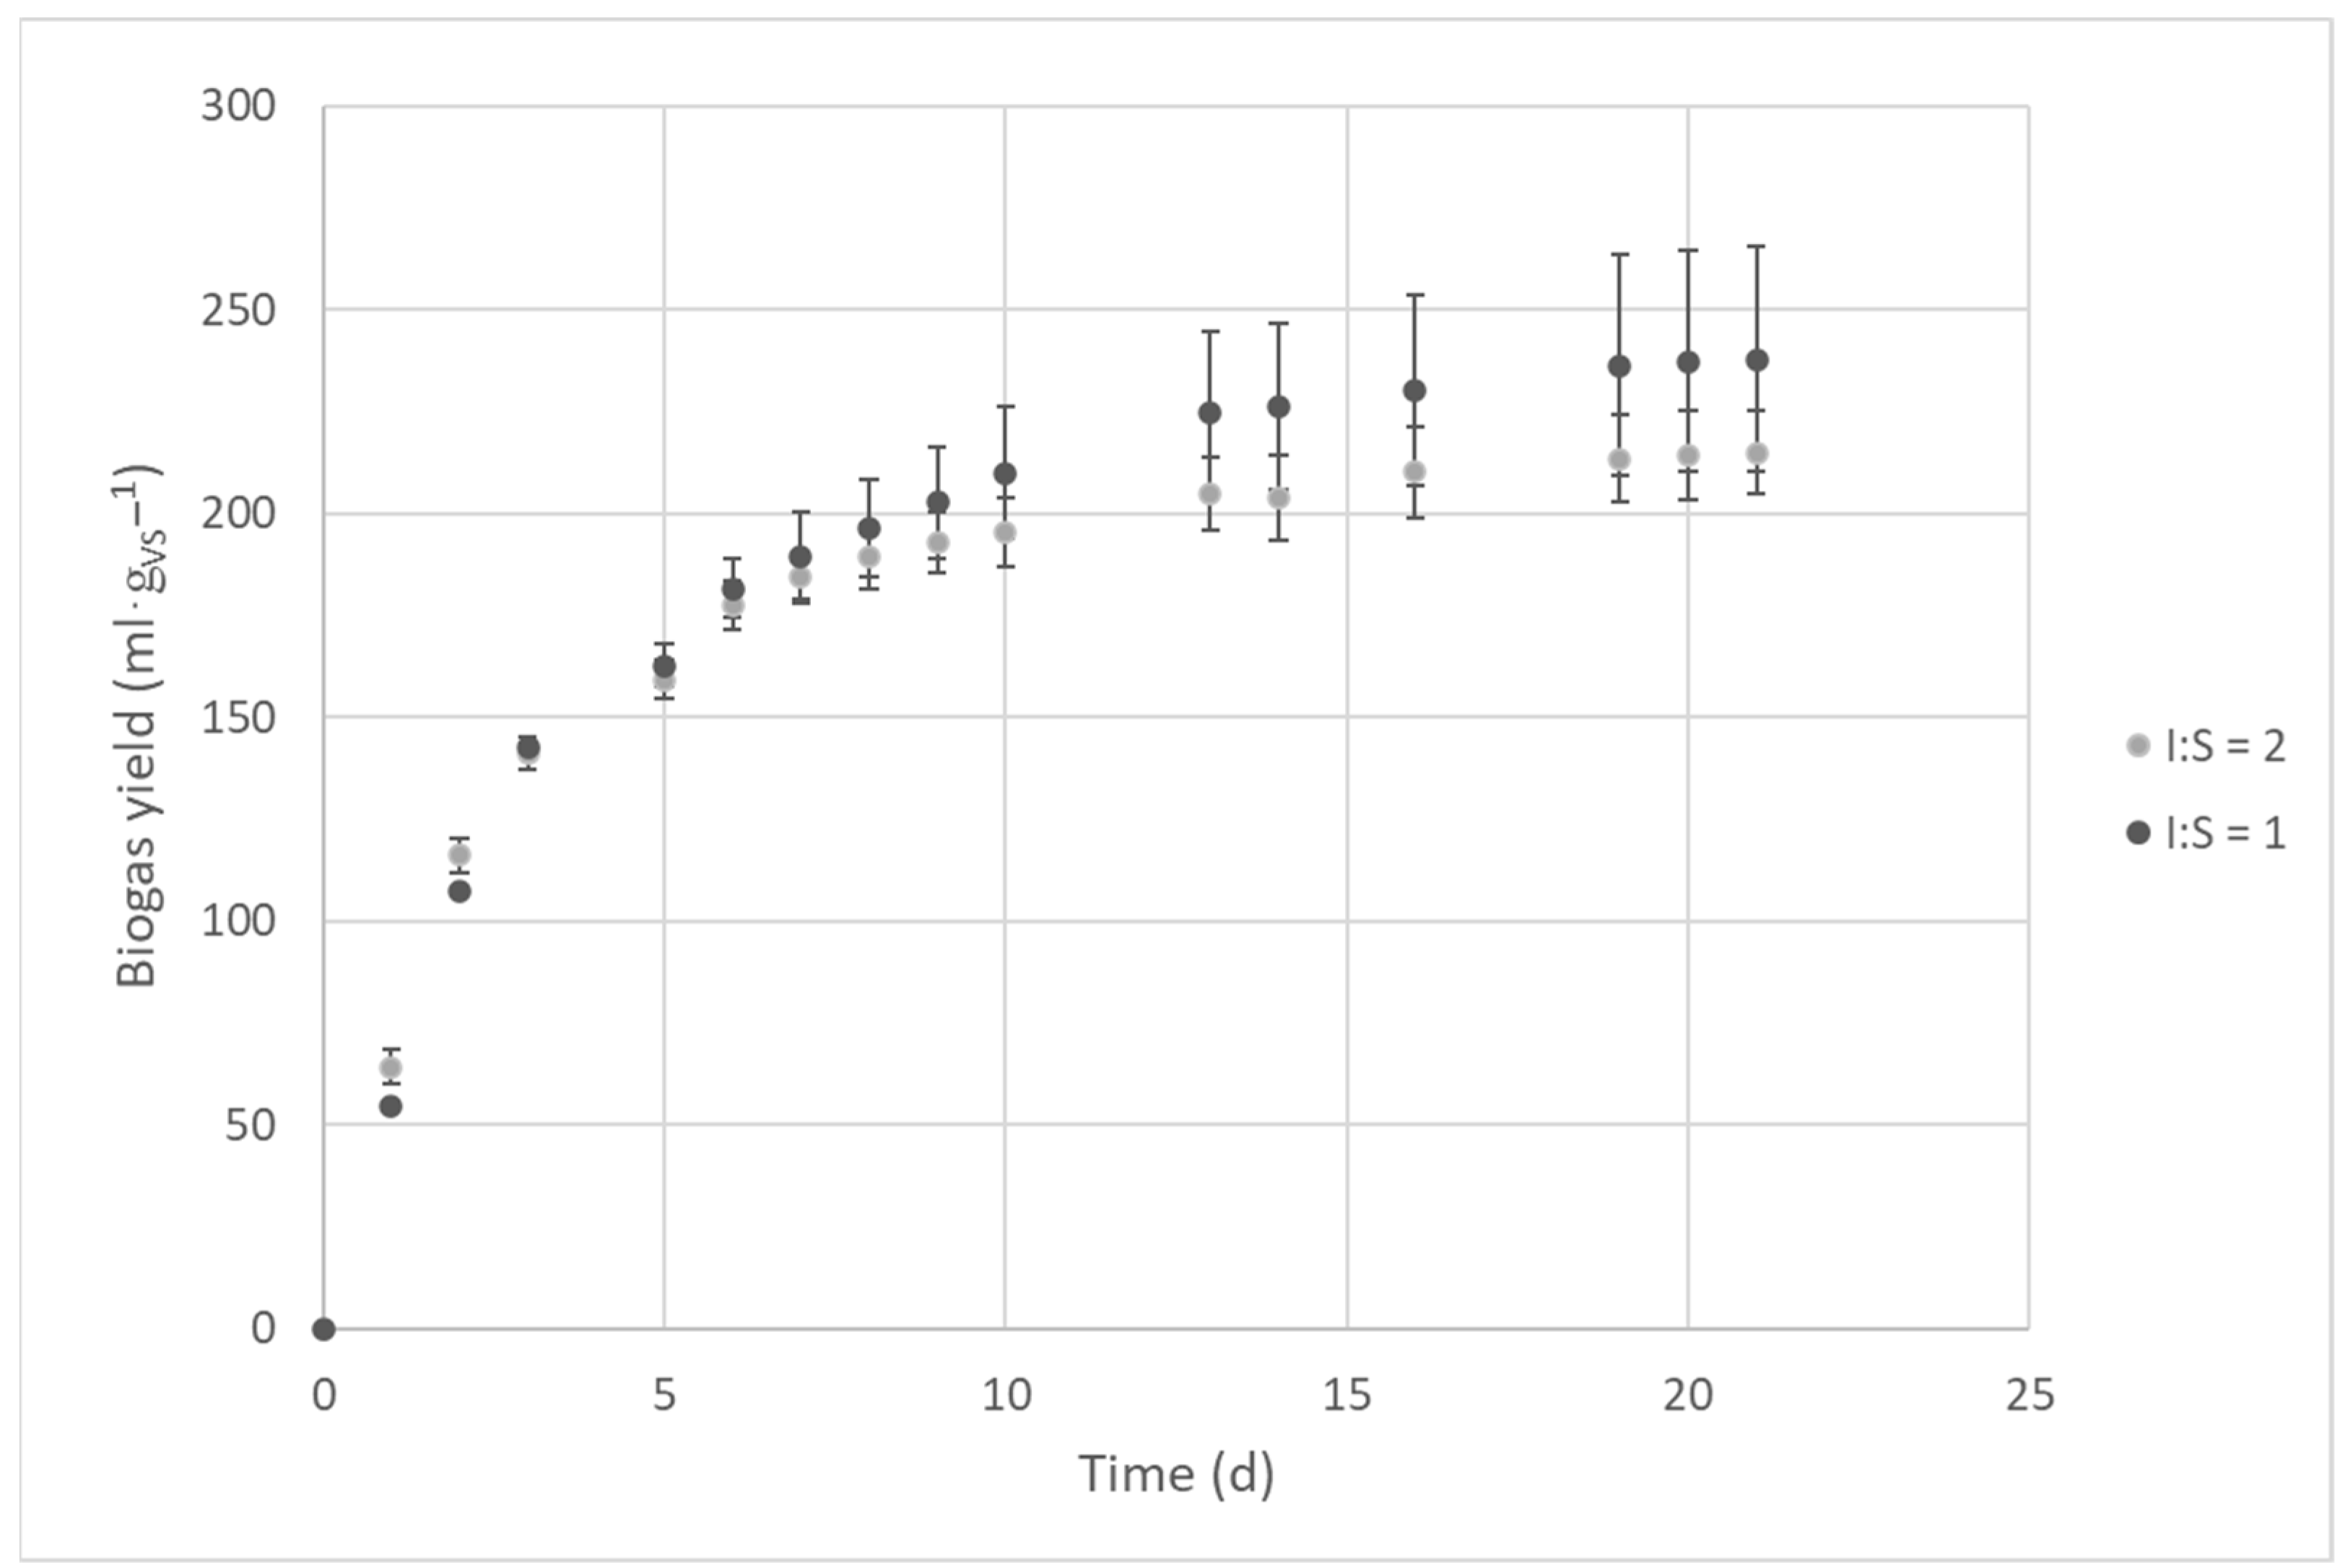
Figure 1. Biogas production during the process, with different inoculum to sludge ratios.
Catalysts 12 01060 g001
Figure 2. Soluble COD changes after the application of different ozone doses.
Catalysts 12 01060 g002
Figure 3. Biogas yield differences due to the SAS ozonation.
Catalysts 12 01060 g003
Figure 4. Biogas composition obtained within fermentation processes: (a) concentrated SAS; (b) non-concentrated SAS.
Catalysts 12 01060 g004
Figure 5. Methane production during the process with non-concentrated SAS—fitting to the first order model.
Catalysts 12 01060 g005
Figure 6. The scheme of the experiment.
Catalysts 12 01060 g006
Table 1. Results of elemental analysis.
SampleNitrogen(%TS)Carbon(%TS)Hydrogen(%TS)Sulfur(%TS)
Process with concentrated SAS
SAS4.40 ± 0.0136.17 ± 0.054.73 ± 0.010.00
SAS ozonated 0.41 gO3·L−14.20 ± 0.0135.48 ± 0.084.66 ± 0.000.00
SAS ozonated 2.34 gO3·L−14.28 ± 0.0036.45 ± 0.154.76 ± 0.010.00
Process with non-concentrated SAS
SAS3.91 ± 0.0136.10 ± 0.084.65 ± 0.000.00
SAS ozonated 0.41 gO3·L−13.78 ± 0.0435.01 ± 0.194.53 ± 0.020.00
SAS ozonated 2.34 gO3·L−13.94 ± 0.0235.11 ± 0.034.70 ± 0.050.00
Mean values for all samples
4.16 ± 0.2935.67 ± 0.554.68 ± 0.080.00
Table 2. Stoichiometric coefficients for Equations (1) and (3) calculated based on elemental and dry solids analysis.
SampleAbcdf 1g 2h 3
Process with concentrated SAS
SAS3.01 ± 0.004.73 ± 0.011.12 ± 0.020.32 ± 0.001.50 ± 0.011.31 ± 0.001.70 ± 0.01
SAS ozonated 0.41 gO3·L−12.95 ± 0.014.66 ± 0.001.16 ± 0.000.30 ± 0.001.44 ± 0.011.30 ± 0.001.66 ± 0.00
SAS ozonated 2.34 gO3·L−13.04 ± 0.014.76 ± 0.011.18 ± 0.080.31 ± 0.001.49 ± 0.031.33 ± 0.021.71 ± 0.01
Process with non-concentrated SAS
SAS3.01 ± 0.014.65 ± 0.001.22 ± 0.060.28 ± 0.001.44 ± 0.031.33 ± 0.021.67 ± 0.01
SAS ozonated 0.41 gO3·L−12.92 ± 0.024.53 ± 0.021.31 ± 0.040.27 ± 0.001.33 ± 0.001.32 ± 0.021.60 ± 0.01
SAS ozonated 2.34 gO3·L−12.93 ± 0.004.70 ± 0.051.24 ± 0.020.28 ± 0.001.34 ± 0.021.29 ± 0.001.64 ± 0.00
Mean values for all samples
2.97 ± 0.054.68 ± 0.081.20 ± 0.070.30 ± 0.021.43 ± 0.071.31 ± 0.021.66 ± 0.04
1 f = a − b/4 − c/2 + 3d/4. 2 g = a/2 − b/8 + c/4 + 3d/8. 3 h = a/2 + b/8 − c/4 − 3d/8.
Table 3. Biochemical methane potential.
SampleBMP—Theor.
(mlCH4·gVS−1)
BMP—NIR
(mlCH4·gVS−1)
BMP—Bottles
(mlCH4·gVS−1)
Bottles/Theor.
(%)
Process with concentrated SAS
SAS602 ± 4213 ± 11120 ± 1520
SAS ozonated 0.41 gO3·L−1592 ± 1204 ± 9126 ± 721
SAS ozonated 2.34 gO3·L−1594 ± 17220 ± 5146 ± 1225
Process with non-concentrated SAS
SAS584 ± 14228 ± 20124 ± 2221
SAS ozonated 0.41 gO3·L−1556 ± 9213 ± 5121 ± 1022
SAS ozonated 2.34 gO3·L−1576 ± 3229 ± 20160 ± 2028
Table 4. Kinetic parameters obtained for methane production.
SampleCH4max
(mlCH4·gVS−1)
k
(d−1)
R2
(–)
Process with concentrated SAS
SAS121 ± 1.590.219 ± 0.0080.997
SAS ozonated 0.41 gO3·L−1126 ± 2.530.228 ± 0.0130.992
SAS ozonated 2.34 gO3·L−1149 ± 2.700.231 ± 0.0120.993
Process with non-concentrated SAS
SAS122 ± 1.290.259 ± 0.0110.993
SAS ozonated 0.41 gO3·L−1115 ± 0.540.323 ± 0.0070.998
SAS ozonated 2.34 gO3·L−1160 ± 0.460.300 ± 0.0040.999
Table 5. Main characteristic of the substrate and inoculum.
ParametersSAS SubstrateAnaerobic Sludge Inoculum
pH (−)7.24 ± 0.167.38 ± 0.10
Total solids (g·L−1)5.34 ± 1.0334.22 ± 0.85
Volatile solids (g·L−1)3.88 ± 1.1820.70 ± 0.57
Total COD (g·L−1)12.92 ± 0.5629.43 ± 3.59
Soluble COD (g·L−1)0.36 ± 0.012.83 ± 0.30
Publisher’s Note: MDPI stays neutral with regard to jurisdictional claims in published maps and institutional affiliations.