
3D-Structured Au(NiMo)/Ti Catalysts for the Electrooxidation of Glucose


 ,
,
Abstract
1. Introduction
2. Results and Discussion
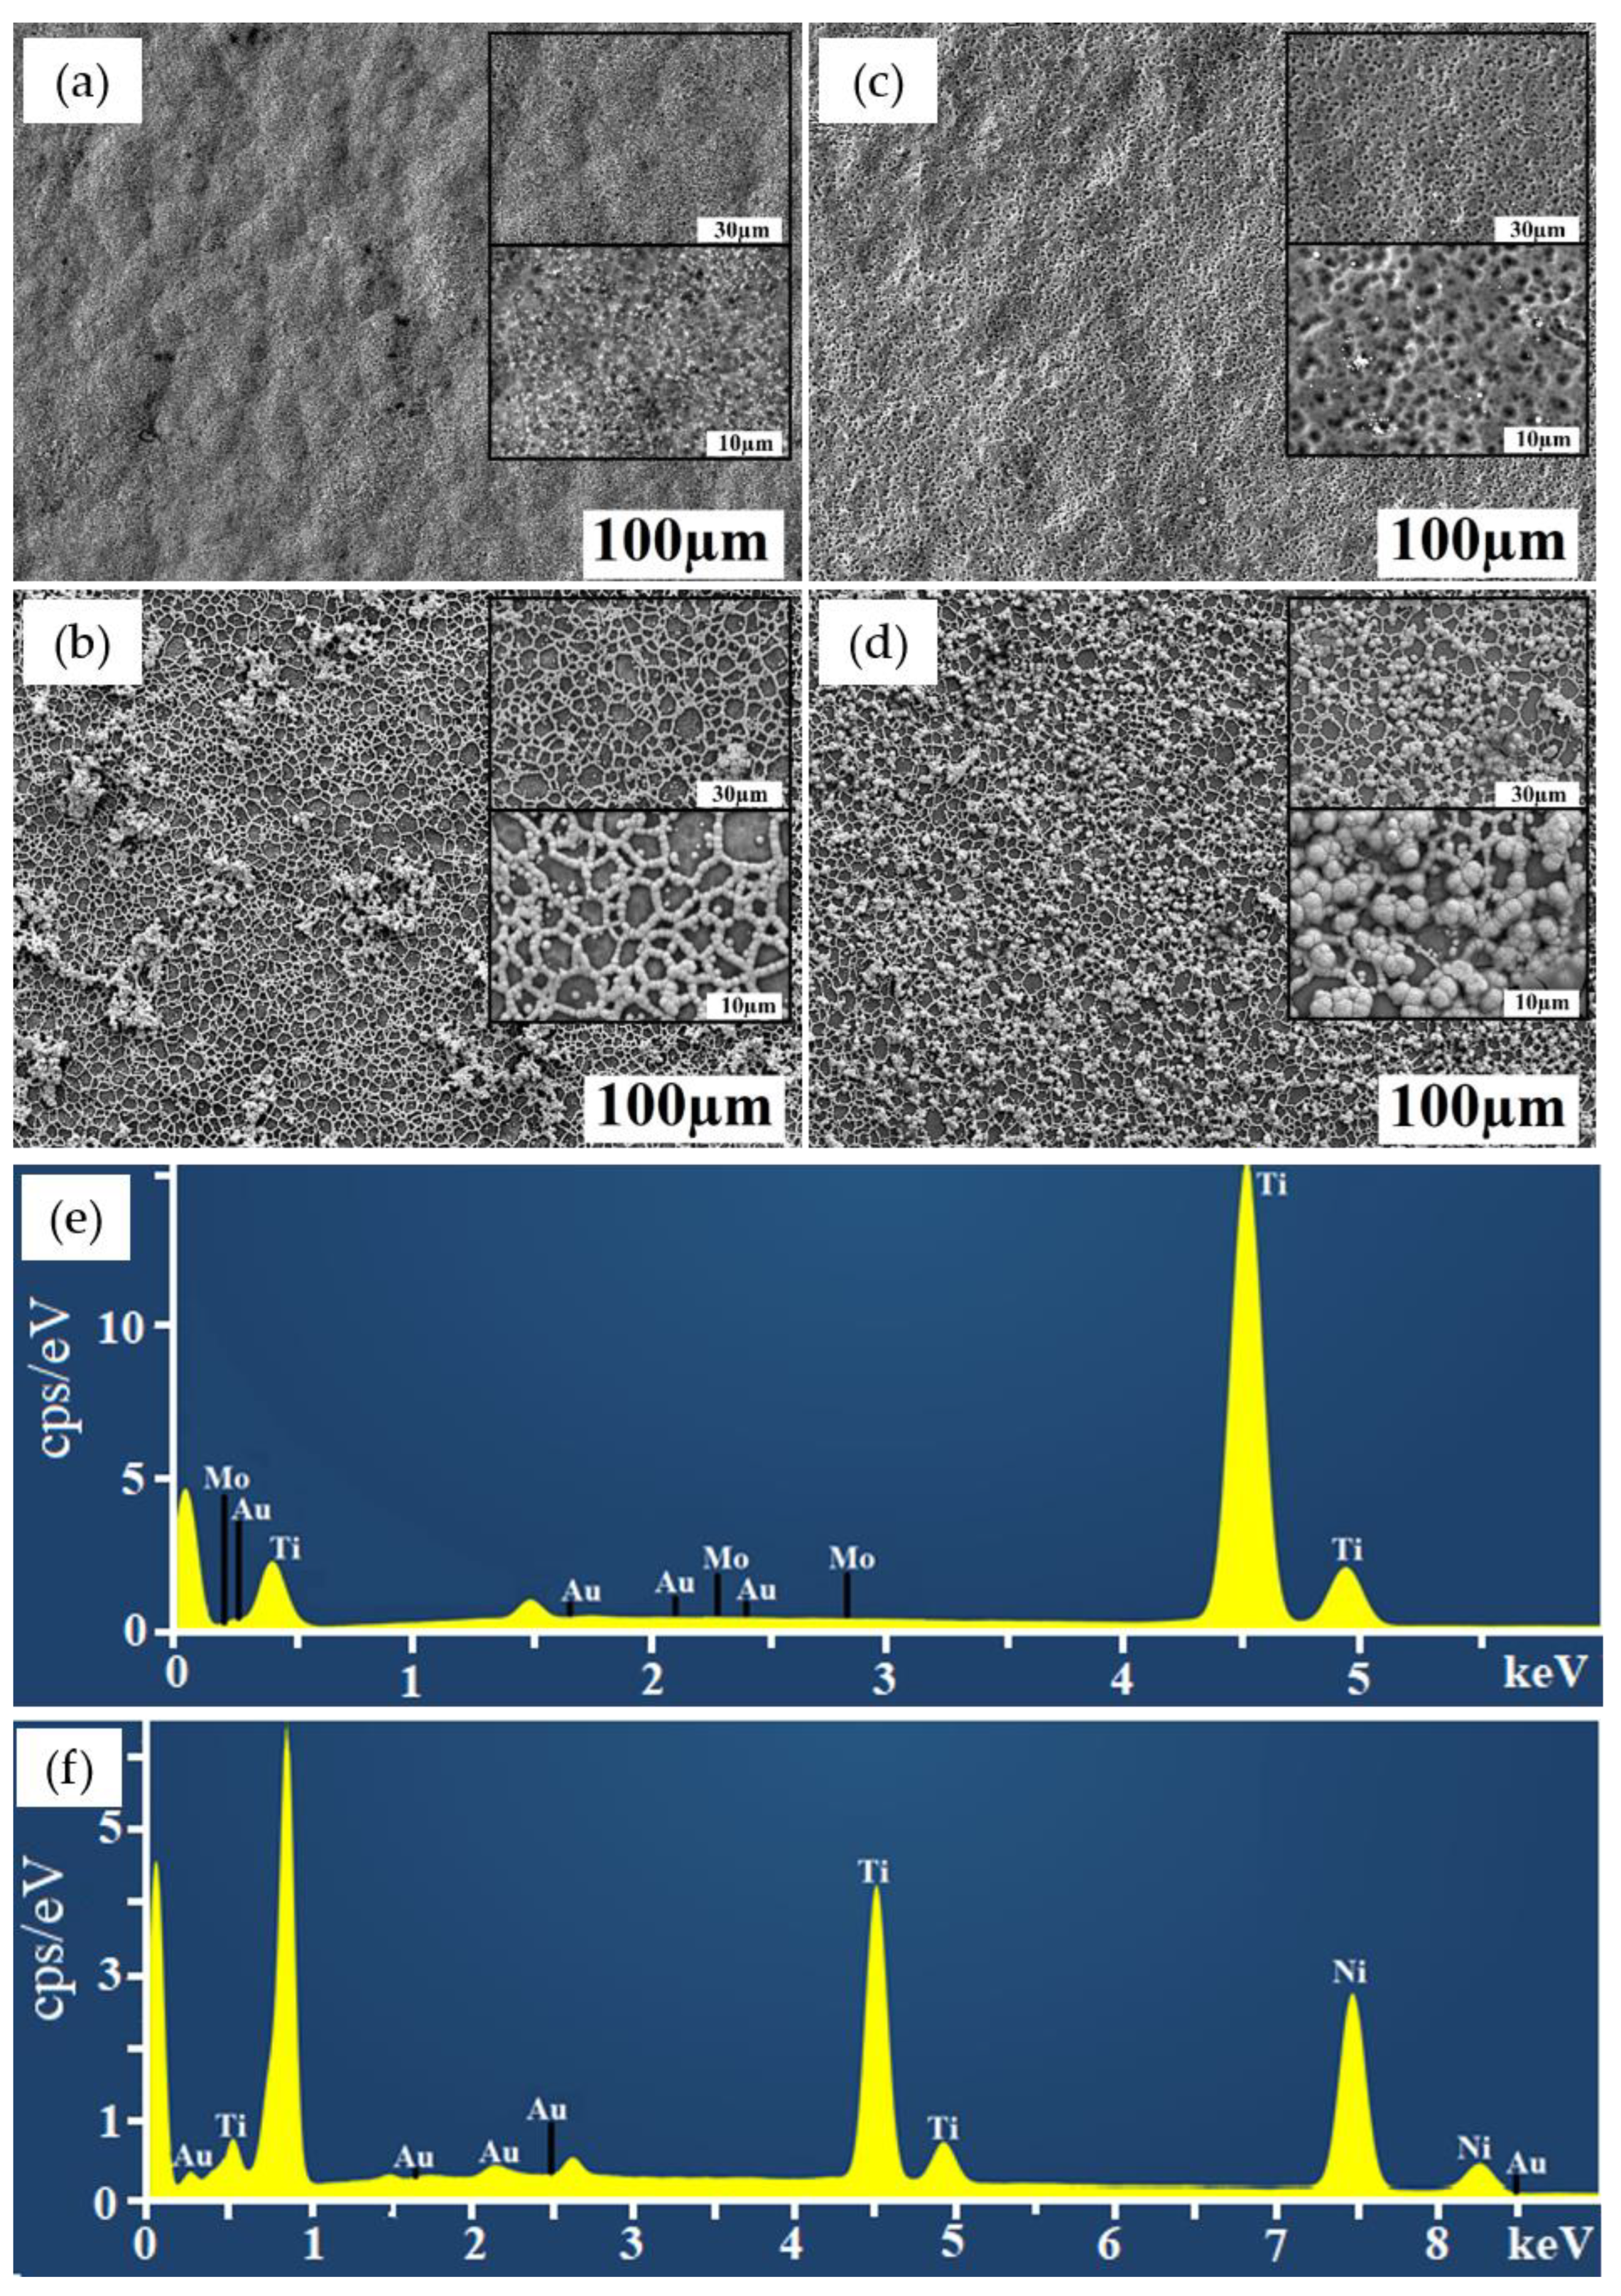
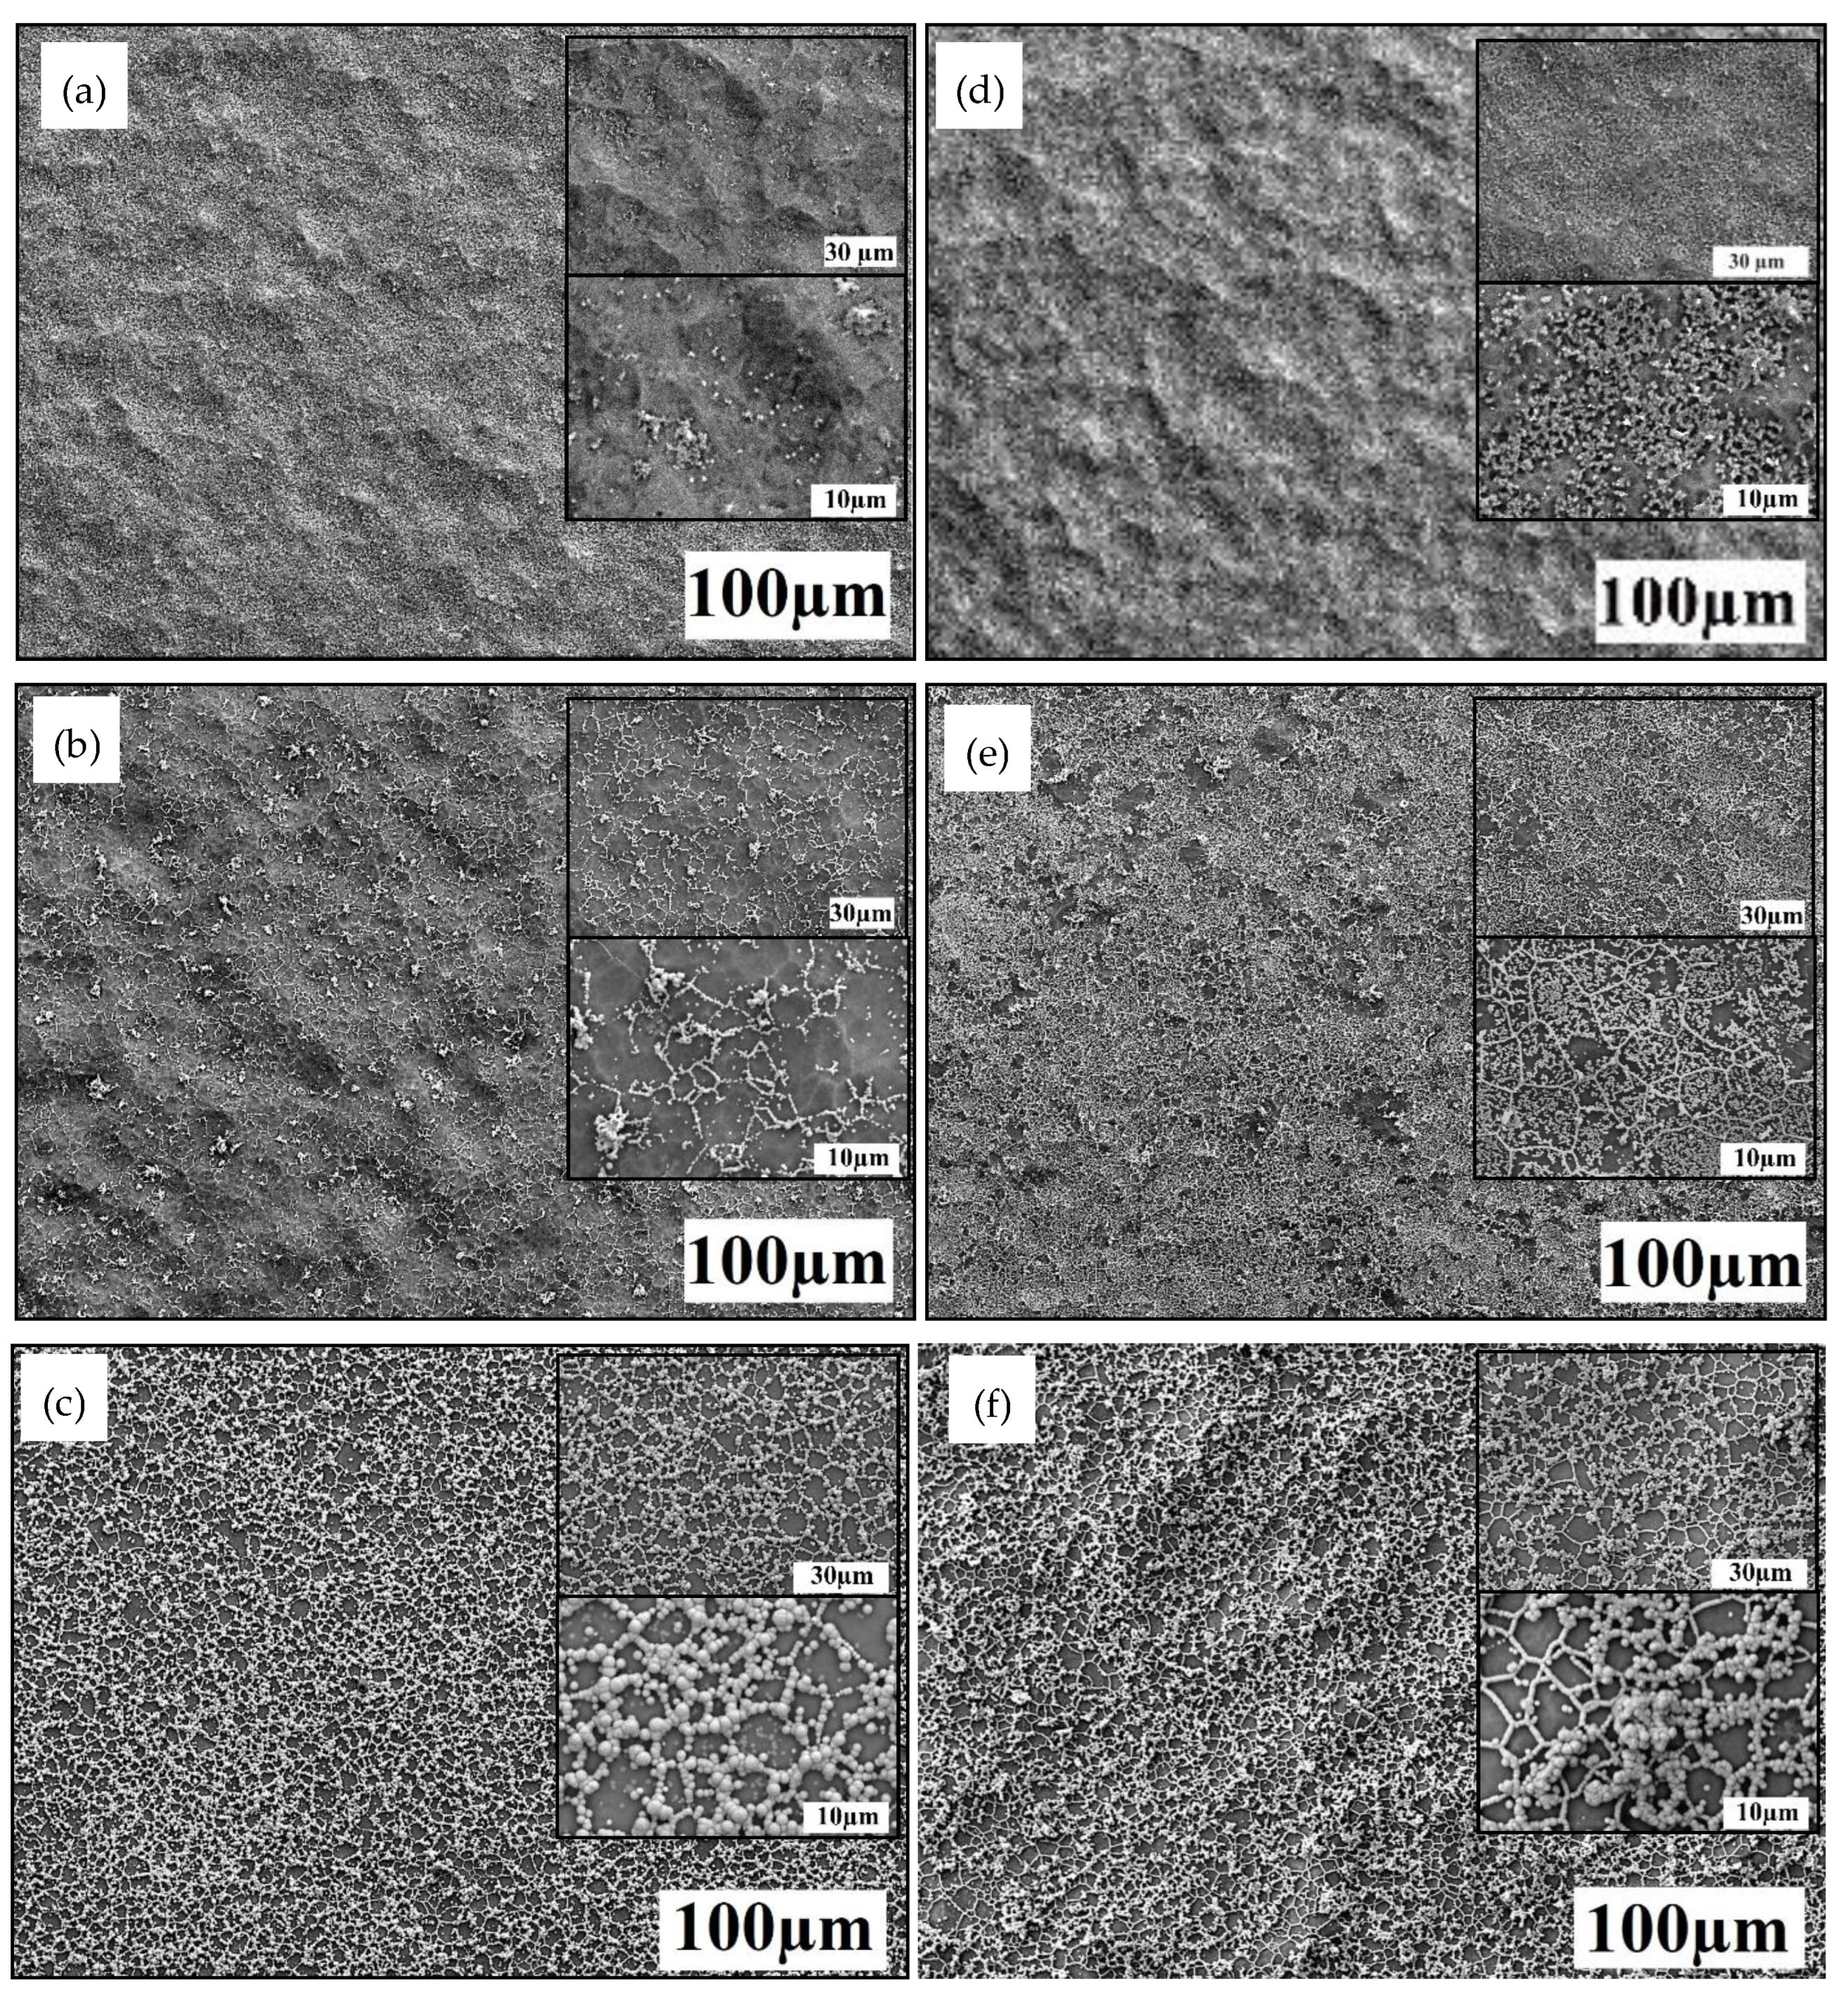
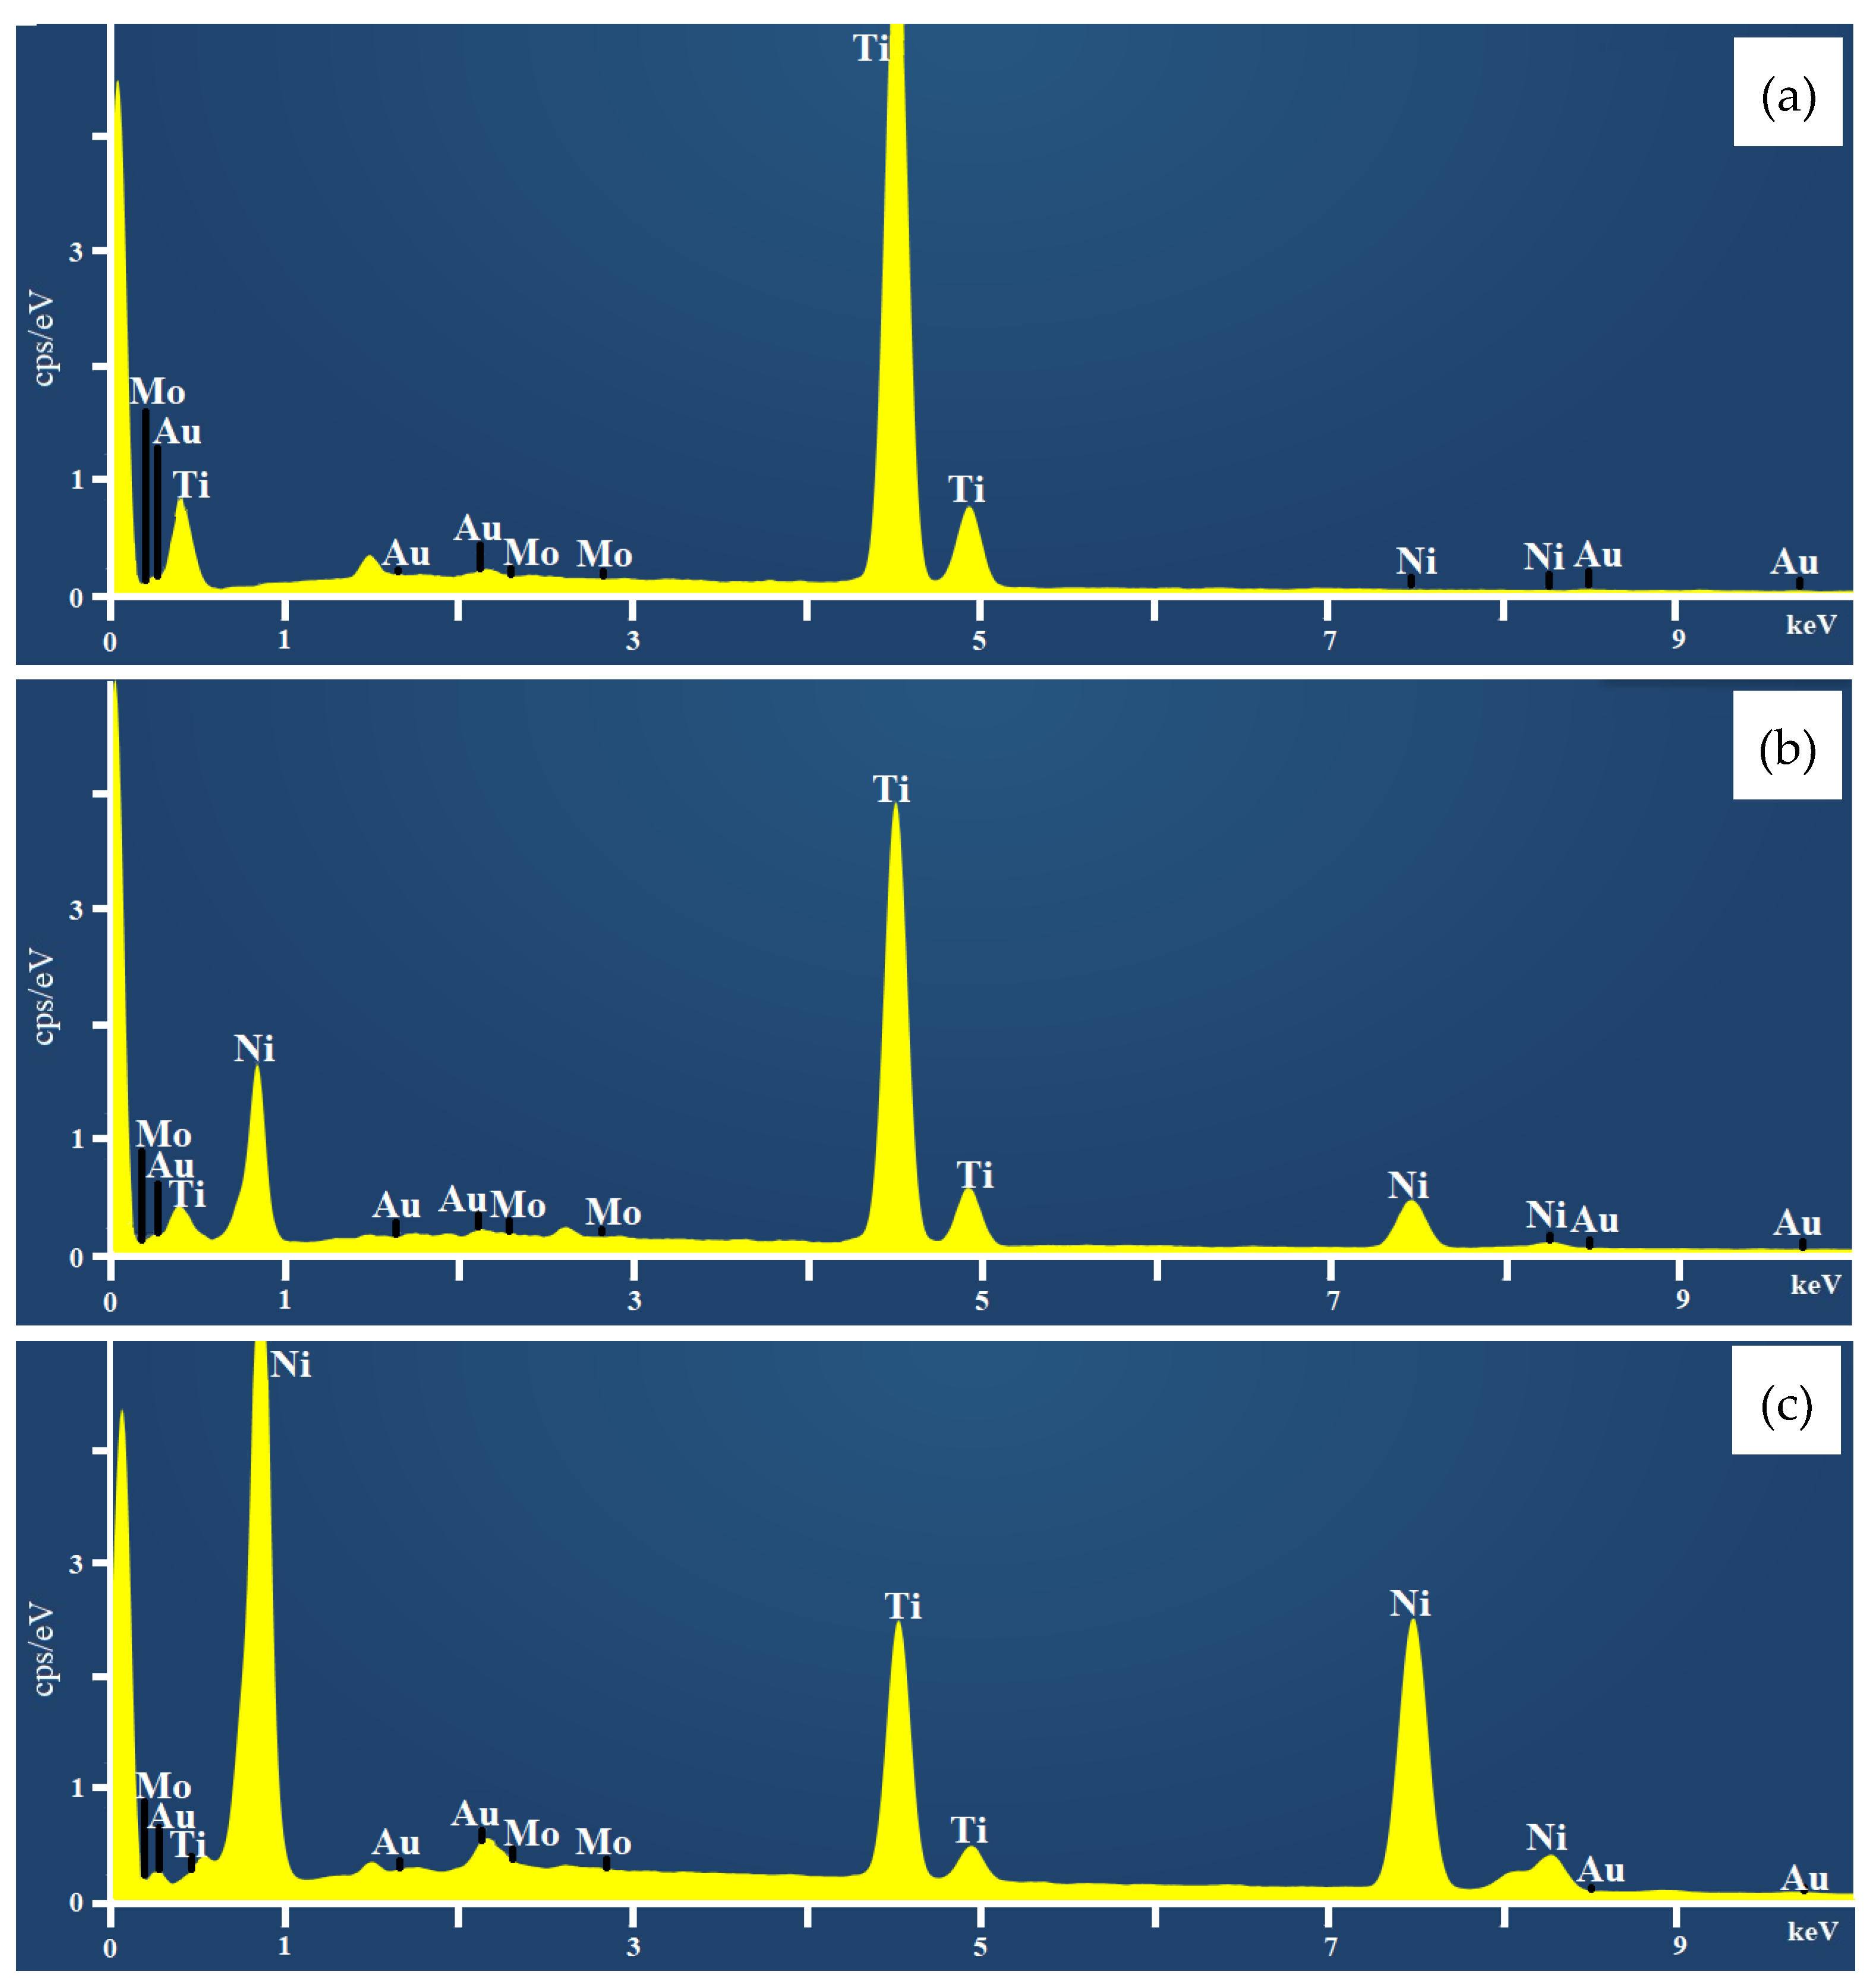
2.1. Characterization of Coatings
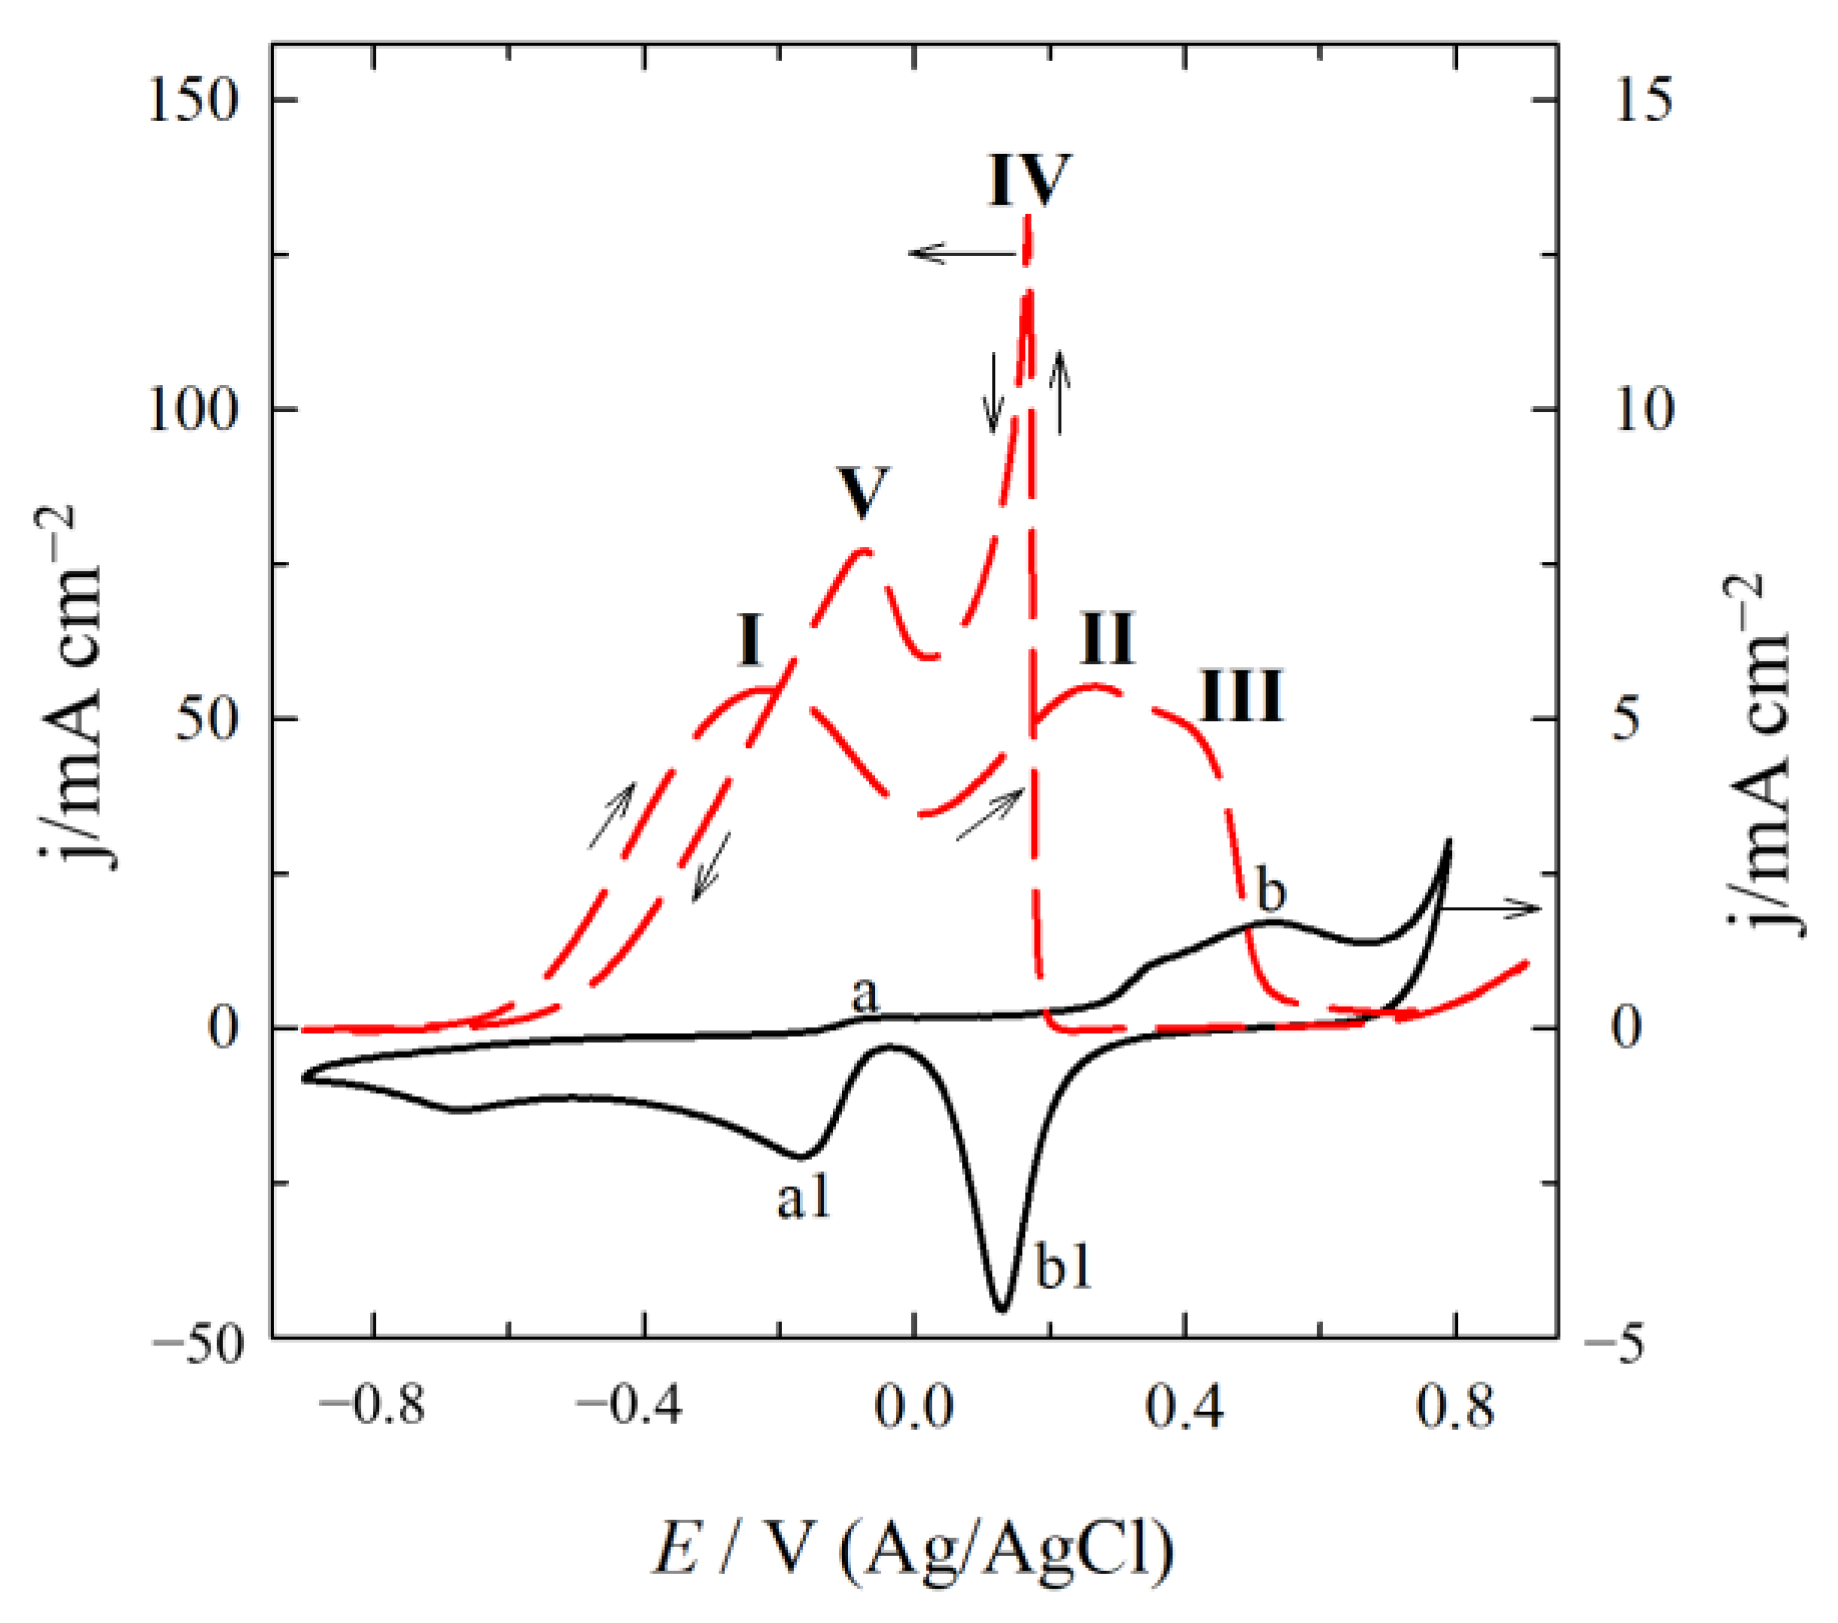
2.2. Electrocatalytic Activity of Catalysts for GOR
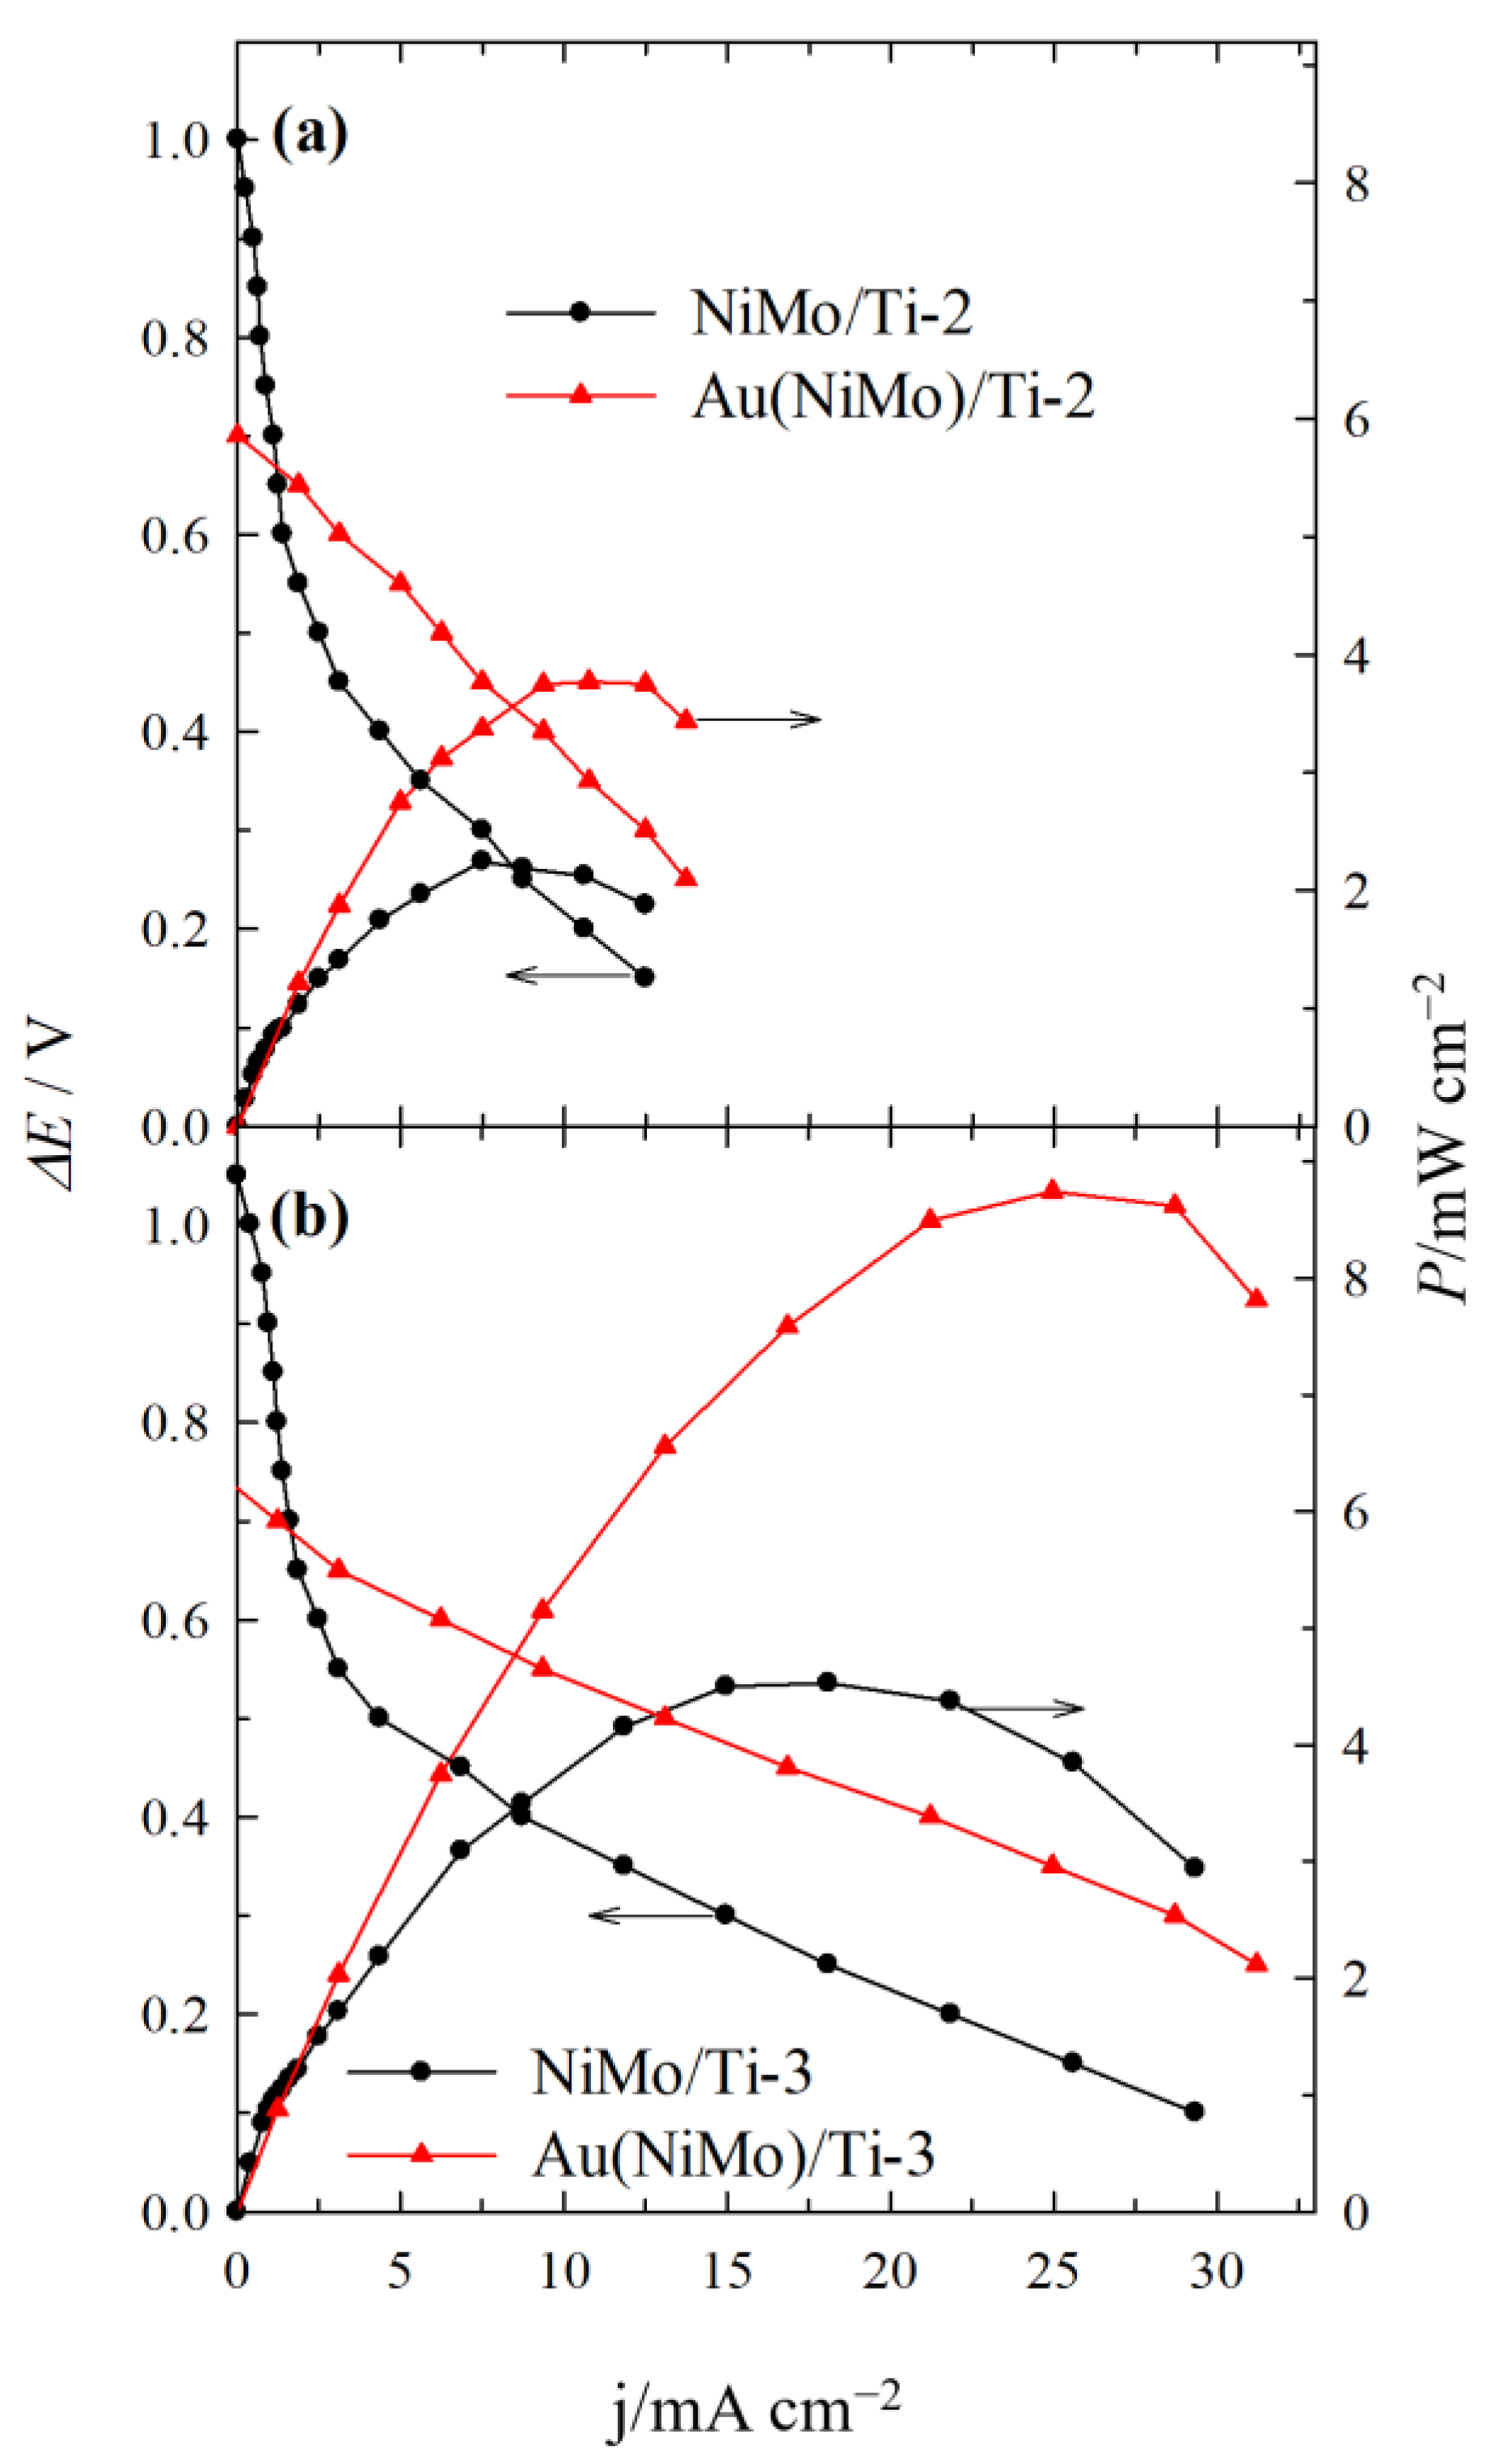
2.3. Direct Alkaline C6H12O6-H2O2 Single Fuel Cell Tests
3. Materials and Methods
3.1. Chemicals
3.2. Fabrication of Catalysts
3.3. Chаrаcterizаtion of Cаtаlysts
3.4. Fuel Cell Test Experiments
4. Conclusions
Author Contributions
Funding
Data Availability Statement
Conflicts of Interest
References
- Kerzenmacher, S.; Ducrée, J.; Zengerle, R.; Stetten, F. Energy harvesting by implantable abiotically catalyzed glucose fuel cells. J. Power Sources 2008, 182, 1–17. [Google Scholar] [CrossRef]
- Singh, R.; Kaur, N.; Singh, M. Bio-compatible bio-fuel cells for medical devices. Mater. Today Proc. 2021, 44, 242–249. [Google Scholar] [CrossRef]
- Xu, Q.; Zhang, F.; Xu, L.; Leung, P.; Yang, C.; Li, H. The applications and prospect of fuel cells in medical field: A review. Renew. Sustain. Energy Rev. 2017, 67, 574–580. [Google Scholar] [CrossRef]
- Ahmed, S.F.; Mofijur, M.; Islam, N.; Parisa, T.A.; Rafa, N.; Bokhari, A.; Klemeš, J.J.; Meurah, T.; Mahlia, I. Insights into the development of microbial fuel cells for generating biohydrogen, bioelectricity, and treating wastewater. Energy 2022, 254, 124163. [Google Scholar] [CrossRef]
- Tung, S.-P.; Huang, T.-K.; Lee, C.-Y.; Chiu, H.-T. Electrochemical growth of gold nanostructures on carbon paper for alkaline direct glucose fuel cell. RSC Advances 2012, 2, 1068–1073. [Google Scholar] [CrossRef]
- Basu, D.; Basu, S. Performance studies of Pd-Pt and Pt-Pd-Au catalyst for electrooxidation of glucose in direct glucose fuel cell. Int. J. Hydrogen Energy 2012, 37, 4678–4684. [Google Scholar] [CrossRef]
- Chen, C.; Lin, C.; Chen, L. Functionalized carbon nanomaterial supported palladium nano-catalysts for electrocatalytic glucose oxidation reaction. Electrochim. Acta 2015, 152, 408–416. [Google Scholar] [CrossRef]
- Yan, L.; Brouzgou, A.; Meng, Y.; Xiao, M.; Tsiakaras, P.; Song, S. Efficient and poison-tolerant PdxAuy/C binary electrocatalysts for glucose electrooxidation in alkaline medium. Appl. Catal. B Environ. 2014, 150–151, 268–274. [Google Scholar] [CrossRef]
- Li, X.; Du, X. Molybdenum disulfide nanosheets supported Au-Pd bimetallic nanoparticles for non-enzymatic electrochemical sensing of hydrogen peroxide and glucose. Sens. Actuators B Chem. 2017, 239, 536–543. [Google Scholar] [CrossRef]
- Gumilar, G.; Kaneti, Y.V.; Henzie, J.; Chatterjee, S.; Na, J.; Yuliarto, B.; Nugraha, N.; Patah, A.; Bhaumik, A.; Yamauchi, Y. General synthesis of hierarchical sheet/plate-like M-BDC (M = Cu, Mn, Ni, and Zr) metal–organic frameworks for electrochemical non-enzymatic glucose sensing. Chem. Sci. 2020, 11, 3644–3655. [Google Scholar] [CrossRef]
- Tang, X.; Zhang, B.; Xiao, C.; Zhou, H.; Wang, X.; He, D. Carbon nanotube template synthesis of hierarchical NiCoO2 composite for non-enzyme glucose detection. Sens. Actuators B Chem. 2016, 222, 232–239. [Google Scholar] [CrossRef]
- Jafarian, M.; Forouzandeh, F.; Danaee, I.; Gobal, F.; Mahjani, M.G. Electrocatalytic oxidation of glucose on Ni and NiCu alloy. J. Solid State Electrochem. 2009, 13, 1171–1179. [Google Scholar] [CrossRef]
- Kung, C.; Cheng, Y.; Ho, K. Single layer of nickel hydroxide nanoparticles covered on a porous Ni foam and its application for highly sensitive non-enzymatic glucose sensor. Sens. Actuators B Chem. 2014, 204, 159–166. [Google Scholar] [CrossRef]
- Zhao, Y.; Liu, X.; Wang, X.; Zhang, P.; Shi, J. Peony petal-like 3D graphene-nickel oxide nanocomposite decorated nickel foam as high-performance electrocatalyst for direct glucose alkaline fuel cell. Int. J. Hydrogen Energy 2017, 42, 29863–29873. [Google Scholar] [CrossRef]
- Geng, D.; Bo, X.; Guo, L. Ni-doped molybdenum disulfide nanoparticles anchored on reduced graphene oxide as novel electroactive material for a non-enzymatic glucose sensor. Sens. Actuators B 2017, 244, 131–141. [Google Scholar] [CrossRef]
- Shu, Y.; Li, B.; Chen, J.; Xu, Q.; Pang, H.; Hu, X. Facile synthesis of ultrathin nickel−cobalt phosphate 2D nanosheets with enhanced electrocatalytic activity for glucose. ACS Appl. Mater. Interfaces 2018, 10, 2360–2367. [Google Scholar] [CrossRef] [PubMed]
- Gao, X.; Feng, W.; Xu, Y.; Jiang, Y.; Huang, C.; Yi, Y.; Guo, A.; Qiu, X.; Chen, W. Nickel catalysts supported on acetylene black for high-efficient electrochemical oxidation and sensitive detection of glucose. Nanoscale Res. Lett. 2020, 17, 23. [Google Scholar] [CrossRef] [PubMed]
- Jeevanandham, G.; Jerome, R.; Murugan, N.; Preethika, M.; Vediappan, K.; Sundramoorthy, A.K. Nickel oxide decorated MoS2 nanosheet-based non-enzymatic sensor for the selective detection of glucose. RSC Adv. 2020, 10, 643–650. [Google Scholar] [CrossRef]
- Gao, M.; Liu, X.; Irfan, M.; Shi, J.; Wang, X.; Zhang, P. Nickel-cobalt composite catalyst-modified activated carbon anode for direct glucose alkaline fuel cell. Int. J. Hydrogen Energy 2018, 43, 1805–1815. [Google Scholar] [CrossRef]
- Irfan, M.; Liu, X.; Li, S.; Khan, I.U.; Li, Y.; Wang, J.; Wang, X.; Du, X.; Wang, G.; Zhang, P. High-performance glucose fuel cell with bimetallic Ni–Co composite anchored on reduced graphene oxide as anode catalyst. Renew. Energy 2020, 155, 1118–1126. [Google Scholar] [CrossRef]
- Jeevanandham, G.; Vediappan, K.; ALOthman, Z.A.; Altalhi, T.; Sundramoorthy, A.K. Fabrication of 2D-MoSe2 incorporated NiO Nanorods modified electrode for selective detection of glucose in serum samples. Sci. Rep. 2021, 11, 13266. [Google Scholar] [CrossRef] [PubMed]
- Wang, F.; Feng, Y.; He, S.; Wang, L.; Guo, M.; Cao, Y.; Wang, Y.; Yu, Y. Nickel nanoparticles-loaded three-dimensional porous magnetic graphene-like material for non-enzymatic glucose sensing. Microchem. J. 2020, 155, 104748. [Google Scholar] [CrossRef]
- Karimi-Maleh, H.; Cellat, K.; Arıkan, K.; Savk, A.; Karimi, F.; Şen, F. Palladium–Nickel nanoparticles decorated on Functionalized-MWCNT for high precision non-enzymatic glucose sensing. Mater. Chem. Phys. 2020, 250, 123042. [Google Scholar] [CrossRef]
- Kirali, A.A.; Sreekantan, S.; Marimuthu, B. Fabrication of mesoporous carbon supported Ni–Mo catalysts for the enhanced conversion of glucose to ethylene glycol. New J. Chem. 2020, 44, 15958. [Google Scholar] [CrossRef]
- Xu, F.; Wu, M.; Ma, G.; Xu, H.; Shang, W. Copper-molybdenum sulfide/reduced graphene oxide hybrid with three-dimensional wrinkles and pores for enhanced amperometric detection of glucose. Microchem. J. 2020, 159, 105432. [Google Scholar] [CrossRef]
- Li, K.; Fan, G.; Yang, L.; Li, F. Novel ultrasensitive non-enzymatic glucose sensors based on controlled flower-like CuO hierarchical films. Sens. Actuators B Chem. 2014, 199, 175–182. [Google Scholar] [CrossRef]
- Ci, S.; Wen, Z.; Mao, S.; Hou, Y.; Cui, S.; He, Z. Junhong Chen. One-pot synthesis of high-performance Co/graphene electrocatalysts for glucose fuel cells free of enzymes and precious metals. Chem. Commun. 2015, 51, 9354–9357. [Google Scholar] [CrossRef] [PubMed]
- Yang, Z.; You, J. Synthesis of a three-dimensional porous Co3O4 network interconnected by MWCNTs and decorated with Au nanoparticles for enhanced nonenzymatic glucose sensing. Colloids Surf. A Physicochem. Eng. Asp. 2021, 612, 126064. [Google Scholar] [CrossRef]
- Ye, Z.; Miao, R.; Miao, F.; Tao, B.; Paul, Y.Z.; Chu, K. 3D nanoporous core-shell ZnO@Co3O4 electrode materials for high-performance supercapacitors and nonenzymatic glucose sensors. J. Electroanal. Chem. 2021, 903, 115766. [Google Scholar] [CrossRef]
- Khazraei, A.; Tarlani, A.; Eslami-Moghadam, M.; Muzart, J. New Bi2MoO6 nano-shapes toward ultrasensitive enzymeless glucose tracing: Synergetic effect of the Bi-Mo association. Talanta 2021, 221, 121560. [Google Scholar] [CrossRef]
- Veerakumar, P.; Sangili, A.; Manavalan, S.; Thanasekaran, P.; Lin, K.-C. Research progress on porous carbon supported metal/metal oxide nanomaterials for supercapacitor electrode applications. Ind. Eng. Chem. Res. 2020, 59, 6347–6374. [Google Scholar] [CrossRef]
- Hui, Y.; Wang, H.; Zuo, W.; Ma, X. Spider nest shaped multi-scale three-dimensional enzymatic electrodes for glucose/oxygen biofuel cells. Int. J. Hydrogen Energy 2022, 47, 6187–6199. [Google Scholar] [CrossRef]
- Qiao, Z.; Yan, Y.; Bi, S. Three-dimensional DNA structures in situ decorated with metal nanoclusters for dual-mode biosensing of glucose. Sens. Actuators B Chem. 2022, 352, 131073. [Google Scholar] [CrossRef]
- Yao, X.; Li, J.; Zhu, Y.; Li, L.; Zhang, W. Designed synthesis of three-dimensional callistemon-like networks structural multifunctional electrocatalyst: Graphitic-carbon-encapsulated Co nanoparticles/N-doped carbon nanotubes@carbon nanofibers for Zn-air batteries application. Compos. Part B Eng. 2020, 193, 108058. [Google Scholar] [CrossRef]
- Yun, Q.; Lu, Q.; Zhang, X.; Tan, C.; Zhang, H. Three-dimensional architectures constructed from transition-metal dichalcogenide nanomaterials for electrochemical energy storage and conversion. Angew. Chem. 2018, 57, 626–646. [Google Scholar] [CrossRef] [PubMed]
- Rong, S.; He, T.; Zhang, P. Self-assembly of MnO2 nanostructures into high purity three-dimensional framework for high efficiency formaldehyde mineralization. Appl. Catal. B Environ. 2020, 267, 118375. [Google Scholar] [CrossRef]
- Xiong, S.; Lin, M.; Wang, L.; Liu, S.; Weng, S.; Jiang, S.; Xu, Y.; Jiao, Y.; Chen, J. Defects-type three-dimensional Co3O4 nanomaterials for energy conversion and low temperature energy storage. Appl. Surf. Sci. 2021, 546, 149064. [Google Scholar] [CrossRef]
- Snyder, J.; Asanithi, P.; Dalton, A.B.; Erlebacher, J. Stabilized nanoporous metals by dealloying ternary alloy precursors. Adv. Mater. 2008, 20, 4883–4886. [Google Scholar] [CrossRef]
- Mott, D.; Luo, J.; Njoki, P.N.; Lin, Y.; Wang, L.; Zhong, C.J. Synergistic activity of gold-platinum alloy nanoparticle catalysts. Catal. Today 2007, 122, 378–385. [Google Scholar] [CrossRef]
- Vega, A.A.; Newman, R.C. Nanoporous metals fabricated through electrochemical dealloying of Ag-Au-Pt with a systematic variation of Au to Pt ratio. J. Electrochem. Soc. 2014, 161, C1. [Google Scholar] [CrossRef]
- Ruban, A.V.; Skriver, H.L.; Nørskov, J.K. Surface segregation energies in transition metal alloys. Phys. Rev. B. 1999, 59, 15990–115600. [Google Scholar] [CrossRef]
- Vitos, L.; Ruban, A.V.; Skriver, H.L.; Kollar, J. The surface energy of metals. Surf. Sci. 1998, 411, 186–202. [Google Scholar] [CrossRef]
- Nam, S.; Jo, H.; Choe, H.; Ahn, D.; Choi, H. Development of nanoporous copper foams by chemical dealloying of mechanically alloyed AlCu compounds. Mater. Trans. 2014, 55, 1414–1418. [Google Scholar] [CrossRef]
- He, F.; Qiao, Z.; Qin, X.; Chao, L.; Tan, Y.; Xie, Q.; Yao, S. Dynamic gas bubble template electrodeposition mechanisms and amperometric glucose sensing performance of three kinds of three dimensional honeycomb-like porous nano-golds. Sens. Actuators B. Chem. 2019, 296, 126679. [Google Scholar] [CrossRef]
- Li, Y.; Song, Y.Y.; Yang, C.; Xia, X.H. Hydrogen bubble dynamic template synthesis of porous gold for nonenzymatic electrochemical detection of glucose. Electrochem. Commun. 2007, 9, 981–988. [Google Scholar] [CrossRef]
- Marozzi, C.A.; Chialvo, A.C. Development of electrode morphologies of interest in electrocatalysis: Part 2: Hydrogen evolution reaction on macroporous nickel electrodes. Electrochim. Acta 2001, 46, 861–866. [Google Scholar] [CrossRef]
- Najdovski, I.; Selvakannan, P.R.; Bhargava, S.K.; O’Mullane, A.P. Formation of nanostructured porous Cu-Au surfaces: The influence of cationic sites on (electro)-catalysis. Nanoscale 2012, 4, 6298–6306. [Google Scholar] [CrossRef]
- Reda, Y.; Abdel-Karim, R.; Zohdy, K.M.; El-Raghy, S. Electrochemical behavior of Ni–Cu foams fabricated by dynamic hydrogen bubble template electrodeposition used for energy applications. Ain Shams Eng. J. 2022, 13, 101532. [Google Scholar] [CrossRef]
- Zeng, Y.; Ji, B.; Lv, Z.; Zheng, X.; Yang, X.; Cui, P.; Dong, Y.; Zhang, X.; Jiang, J. Rapid synthesis of porous Pt-Ni-Cu coatings with a wide composition range, tunable structures and enhanced electrocatalytic properties. J. Alloys Compd. 2020, 835, 155402. [Google Scholar] [CrossRef]
- Eugénio, S.; Silva, T.M.; Carmezim, M.J.; Duarte, R.G.; Montemor, M.F. Electrodeposition and characterization of nickel-copper metallic foams for application as electrodes for supercapacitors. J. Appl. Electrochem. 2014, 44, 455–465. [Google Scholar] [CrossRef]
- Shahryari, Z.; Gheisari, K.; Yeganeh, M.; Ramezanzadeh, B. Corrosion mitigation ability of differently synthesized polypyrrole (PPy-FeCl3 & PPy-APS) conductive polymers modified with Na2MoO4 on mild steel in 3.5% NaCl solution: Comparative study and optimization. Corrosion Sci. 2021, 193, 109894. [Google Scholar]
- Ferreira, G.C.A.; Napporn, T.W.; Kokoh, K.B.; Varela, H. Complex oscillatory kinetics in the electro-oxidation of glucose on gold. J. Electrochem. Soc. 2017, 164, H603. [Google Scholar] [CrossRef]
- Upskuvienė, D.; Sukackienė, Z.; Balčiūnaitė, A.; Kepenienė, V.; Šimkūnaitė, D.; Šimkūnaitė-Stanynienė, B.; Vaitkus, R.; Tamašauskaitė-Tamašiūnaitė, L.; Norkus, E. Investigation of glucose electrooxidation on Co and CoB alloy coatings modified with Au nanoparticles. Chemija 2019, 30, 23–32. [Google Scholar] [CrossRef][Green Version]
- Vassilyev, Y.B.; Khazova, O.A.; Nikolaeva, N.N. Kinetics and mechanism of glucose electrooxidation on different electrode-catalysts: Part II. Effect of the nature of the electrode and the electrooxidation mechanism. J. Electroanal. Chem. Interfacial Electrochem. 1985, 196, 127–144. [Google Scholar] [CrossRef]
- Arjona, N.; Trejo, G.; Ledesma-García, J.; Arriaga, L.G.; Guerra-Balcázar, M. An electrokinetic-combined electrochemical study of the glucose electro-oxidation reaction: Effect of gold surface energy. RSC Adv. 2016, 6, 15630–15638. [Google Scholar] [CrossRef]
- Pasta, M.; La Mantia, F.; Cui, Y. Mechanism of glucose electrochemical oxidation on gold surface. Electrochim. Acta 2010, 55, 5561–5568. [Google Scholar] [CrossRef]
- Tominaga, M.; Shimazoe, T.; Nagashima, M.; Tani- Guchi, I. Electrocatalytic oxidation of glucose at gold nanoparticle-modified carbon electrodes in alkaline and neutral solutions. Electrochem. Commun. 2005, 7, 189–193. [Google Scholar] [CrossRef]
- Jusys, Z.; Behm, R.J. The effect of anions and pH on the activity and selectivity of an annealed polycrystalline Au film electrode in the oxygen reduction reaction—Revisited. ChemPhysChem 2019, 20, 3276–3288. [Google Scholar] [CrossRef]
- Brouzgou, A.; Tsiakaras, P. Electrocatalysts for Glucose Electrooxidation Reaction: A Review. Top. Catal. 2015, 58, 1311–1327. [Google Scholar] [CrossRef]
- Arjona, N.; Guerra-Balcázar, M.; Trejo, G.; Ledesma-García, J.; Arriaga, L.G. Electrochemical growth of Au architectures on glassy carbon and their evaluation toward glucose oxidation reaction. New J. Chem. 2012, 36, 2555–2561. [Google Scholar] [CrossRef]
- Escalona-Villalpando, R.A.; Gurrola, M.P.; Trejo, G.; Guerra-Balcázar, M.; Ledesma-García, J.; Arriaga, L.G. Electrodeposition of gold on oxidized and reduced graphite surfaces and its influence on glucose oxidation. J. Electroanal. Chem. 2018, 816, 92–98. [Google Scholar] [CrossRef]
- Pourbaix, M. Atlas of Electrochemical Equilibria in Aqueous Solutions, 2nd ed.; NACE International: Houston, TX, USA, 1974. [Google Scholar]
- Hull, M.N. The anodic oxidation of molybdenum in hydroxide ion solutions. J. Electroanal. Chem. 1971, 30, 1–3. [Google Scholar] [CrossRef]
- Hull, M.N. On the anodic dissolution of molybdenum in acidic and alkaline electrolytes. J. Electroanal. Chem. 1972, 38, 143–157. [Google Scholar] [CrossRef]
- Armstrong, R.D.; Bell, M.F.; Metcalfe, A.A. The anodic dissolution of molybdenum in alkaline solutions, electrochemical measurements. J. Electroanal. Chem. 1977, 84, 61–72. [Google Scholar] [CrossRef]
- Badawy, W.A.; Al-Kharafi, F.M. Corrosion and passivation behaviors of molybdenum in aqueous solutions of different pH. Electrochim. Acta 1998, 44, 693–702. [Google Scholar] [CrossRef]
- Badawy, W.A.; Feky, H.E.; Helal, N.H.; Mohammed, H.H. Cathodic hydrogen evolution on molybdenum in NaOH solutions. Int. J. Hydrogen Energy 2013, 38, 9625–9632. [Google Scholar] [CrossRef]
- Rauscher, T.; Müller, C.I.; Schmidt, A.; Kieback, B.; Röntzsch, L. Ni-Mo-B alloys as cathode material for alkaline water electrolysis. Int. J. Hydrogen Energy 2016, 41, 2165–2176. [Google Scholar] [CrossRef]
- Saji, V.S.; Lee, C.W. Molybdenum, Molybdenum Oxides, and their Electrochemistry. ChemSusChem 2012, 5, 1146–1161. [Google Scholar] [CrossRef] [PubMed]
- Danial, A.S.; Saleh, M.M.; Salih, S.A.; Awad, M.I. On the synthesis of nickel oxide nanoparticles by sol-gel technique and its electrocatalytic oxidation of glucose. J. Power Sources 2015, 293, 101–108. [Google Scholar] [CrossRef]
- Seghiouer, A.; Chevalet, J.; Barhoun, A.; Lantelme, F. Electrochemical oxidation of nickel in alkaline solutions: A voltammetric study and modelling. J. Electroanal. Chem. 1998, 442, 113–123. [Google Scholar] [CrossRef]
- Lakhdari, D.; Guittoum, A.; Benbrahim, N.; Belgherbi, O.; Berkani, M.; Seid, L.; Khtar, S.A.; Saeed, M.A.; Lakhdari, N. Elaboration and characterization of Ni (NPs)-PANI hybrid material by electrodeposition for non-enzymatic glucose sensing. J. Electron. Mater. 2021, 50, 5250–5258. [Google Scholar] [CrossRef]
- Chelaghmia, M.L.; Nacef, M.; Affoune, A.M.; Pontié, M.; Derabla, T. Facile synthesis of Ni(OH)2 modified disposable pencil graphite electrode and its application for highly sensitive non-enzymatic glucose sensor. Electroanalysis 2018, 30, 1117–1124. [Google Scholar] [CrossRef]
- Zhang, L.; Ding, Y.; Li, R.; Ye, C.; Zhao, G.; Wang, Y. Ni-Based metal–organic framework derived Ni@C nanosheets on a Ni foam substrate as a supersensitive non-enzymatic glucose sensor. J. Mater. Chem. B 2017, 5, 5549–5555. [Google Scholar] [CrossRef]
- Qin, L.; He, L.; Zhao, J.; Zhao, B.; Yin, Y.; Yang, Y. Synthesis of Ni/Au multilayer nanowire arrays for ultrasensitive non-enzymatic sensing of glucose. Sens. Actuators B 2017, 240, 779–784. [Google Scholar] [CrossRef]


| Catalyst | Ni, Loadings µgNi cm−2 | Mo, Loadings µgMo cm−2 | Au, Loadings µgAu cm−2 | Total Metal Loading (µg cm−2) |
|---|---|---|---|---|
| Ni/Ti | 96.5 | - | - | 96.5 |
| Mo/Ti | - | 6.5 | - | 6.5 |
| NiMo/Ti-1 | 13.5 | 2.1 | - | 15.6 |
| NiMo/Ti-2 | 35.7 | 4.3 | - | 40.0 |
| NiMo/Ti-3 | 39.3 | 5.7 | - | 45.0 |
| Au(Ni)/Ti | 59.9 | - | 4.1 | 64.0 |
| Au(Mo)/Ti | - | 4.1 | 1.2 | 5.3 |
| Au(NiMo)/Ti-1 | 11.7 | 1.9 | 1.8 | 15.4 |
| Au(NiMo)/Ti-2 | 32.9 | 3.8 | 2.3 | 39.0 |
| Au(NiMo)/Ti-3 | 34.1 | 4.5 | 3.9 | 42.5 |
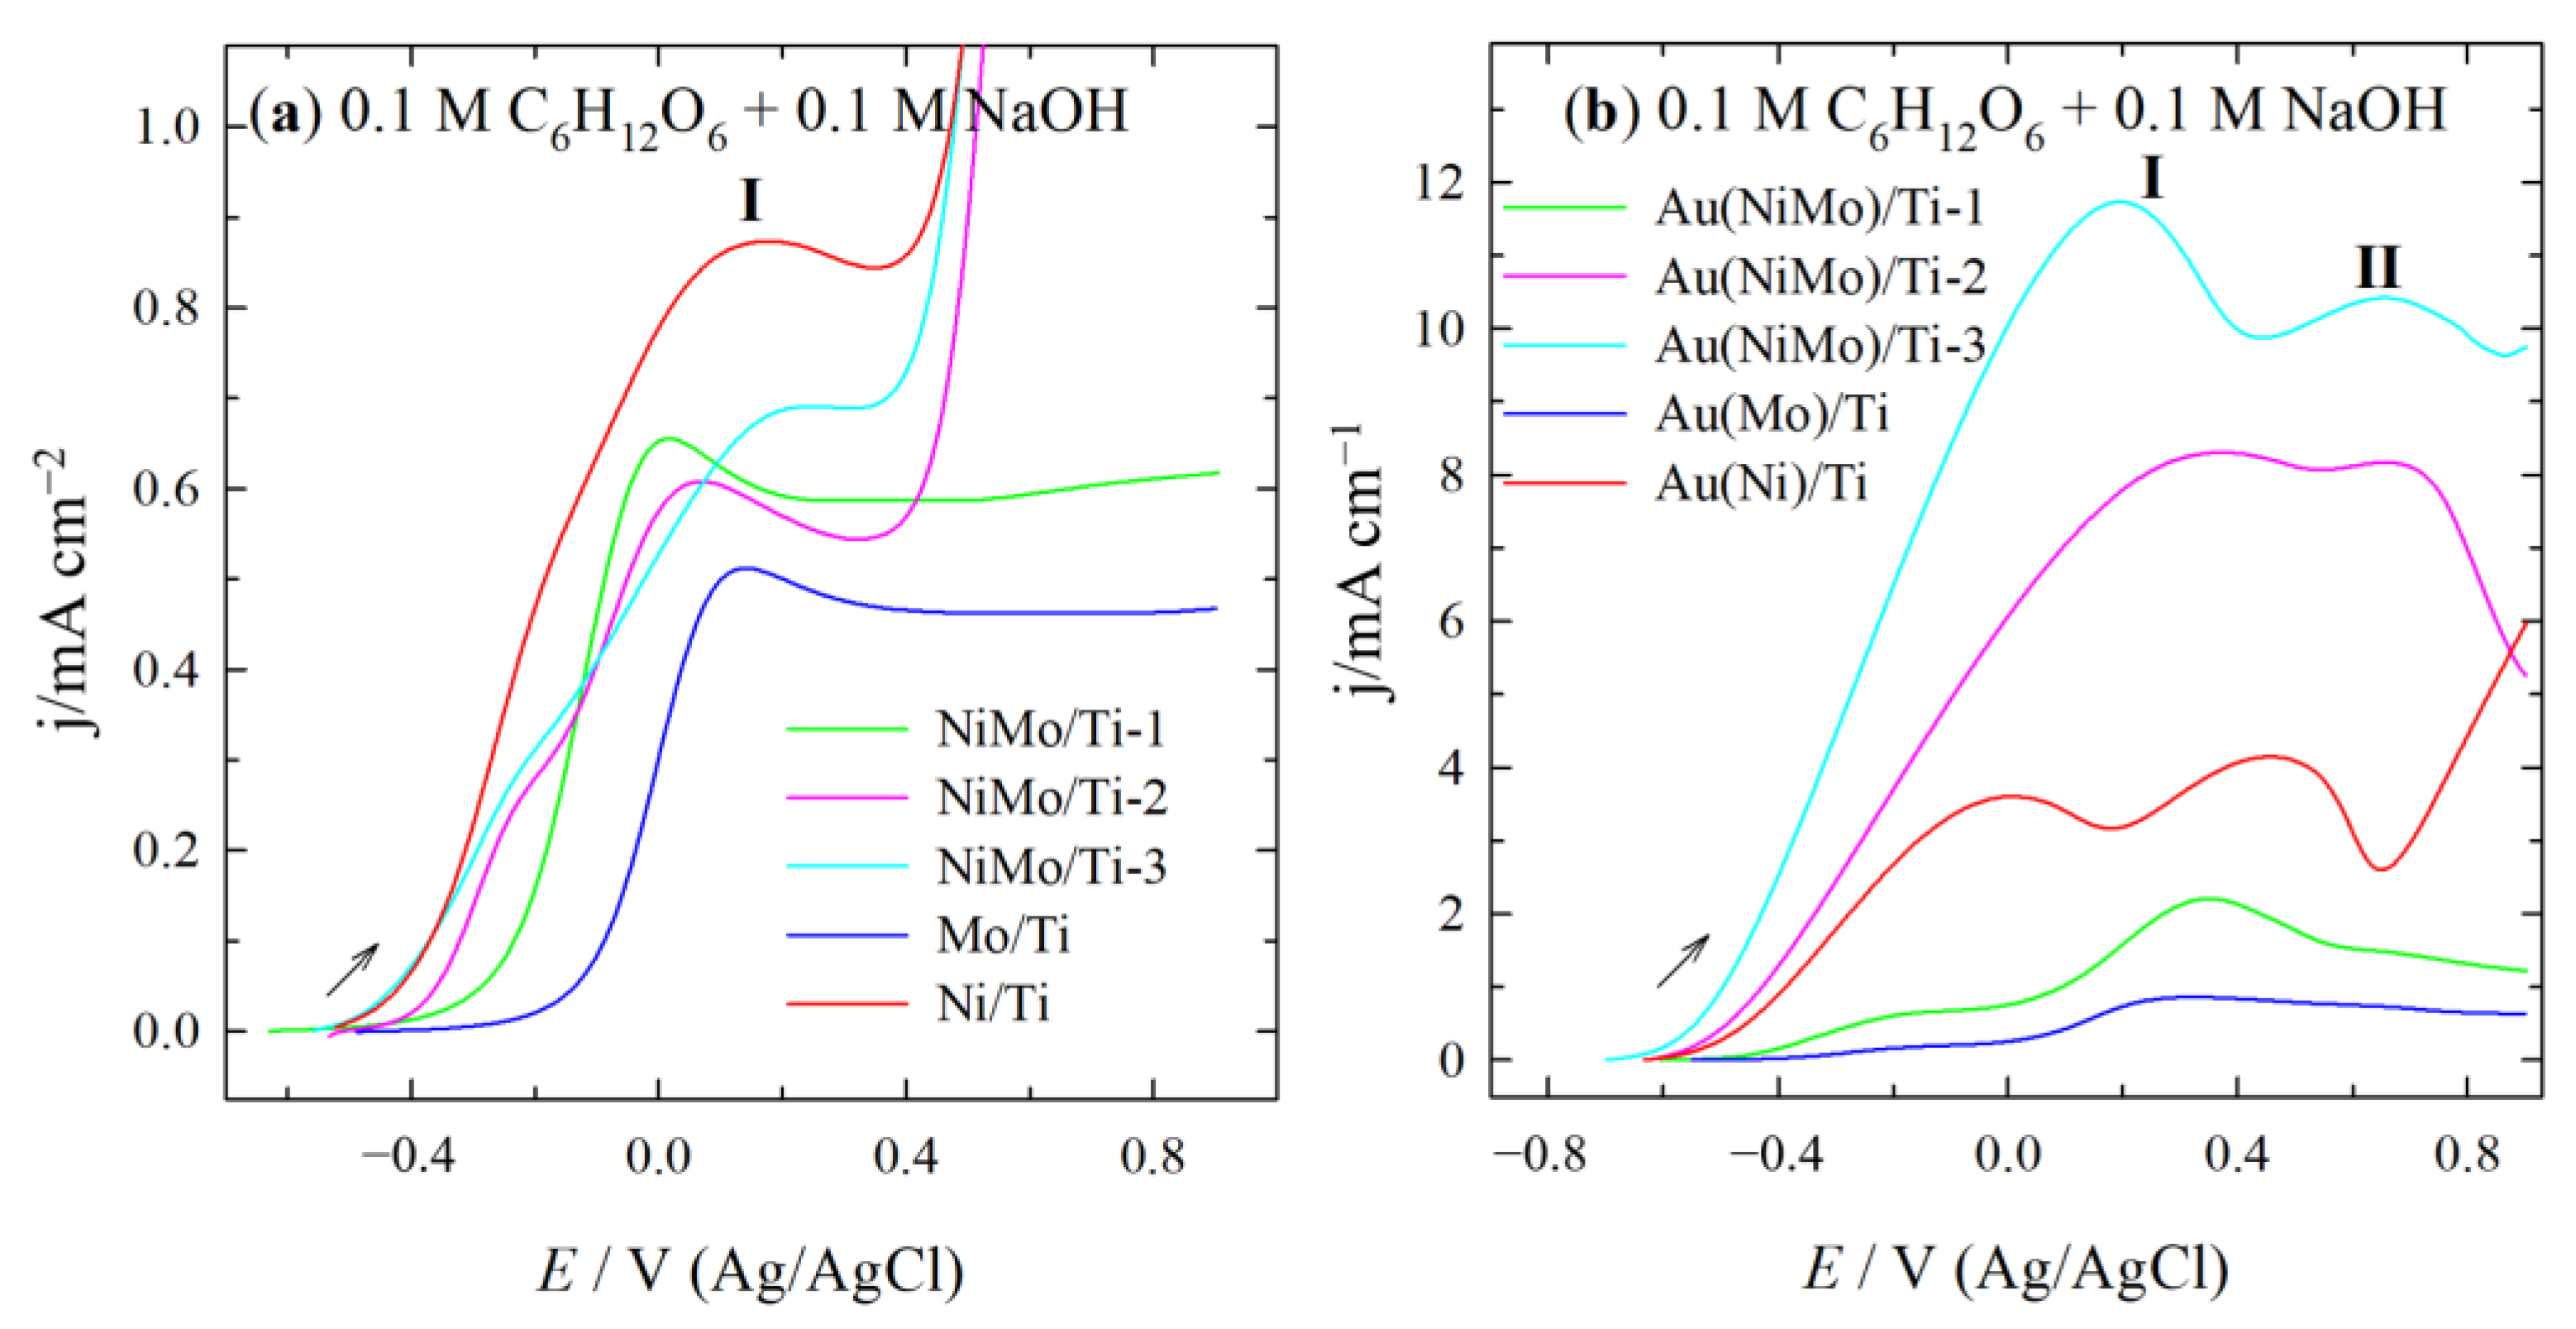
| Catalyst | Eonset/V | Peak I | Peak II | Peak Ratio (I/II) | ||
|---|---|---|---|---|---|---|
| E/V | j/mA cm−2 | E/V | j/mA cm−2 | |||
| Au(MoTi)/Ti-1 | −0.537 | −0.099 | 0.68 | 0.349 | 2.21 | 0.31 |
| Au(MoTi)/Ti-2 | −0.619 | 0.362 | 8.30 | 0.660 | 8.17 | 1.02 |
| Au(MoTi)/Ti-3 | −0.684 | 0.197 | 11.73 | 0.650 | 10.42 | 1.13 |
| AuNi/Ti | −0.430 | 0.001 | 3.60 | 0.474 | 4.14 | 0.87 |
| AuMo/Ti | −0.688 | −0.171 | 0.18 | 0.322 | 0.86 | 0.21 |
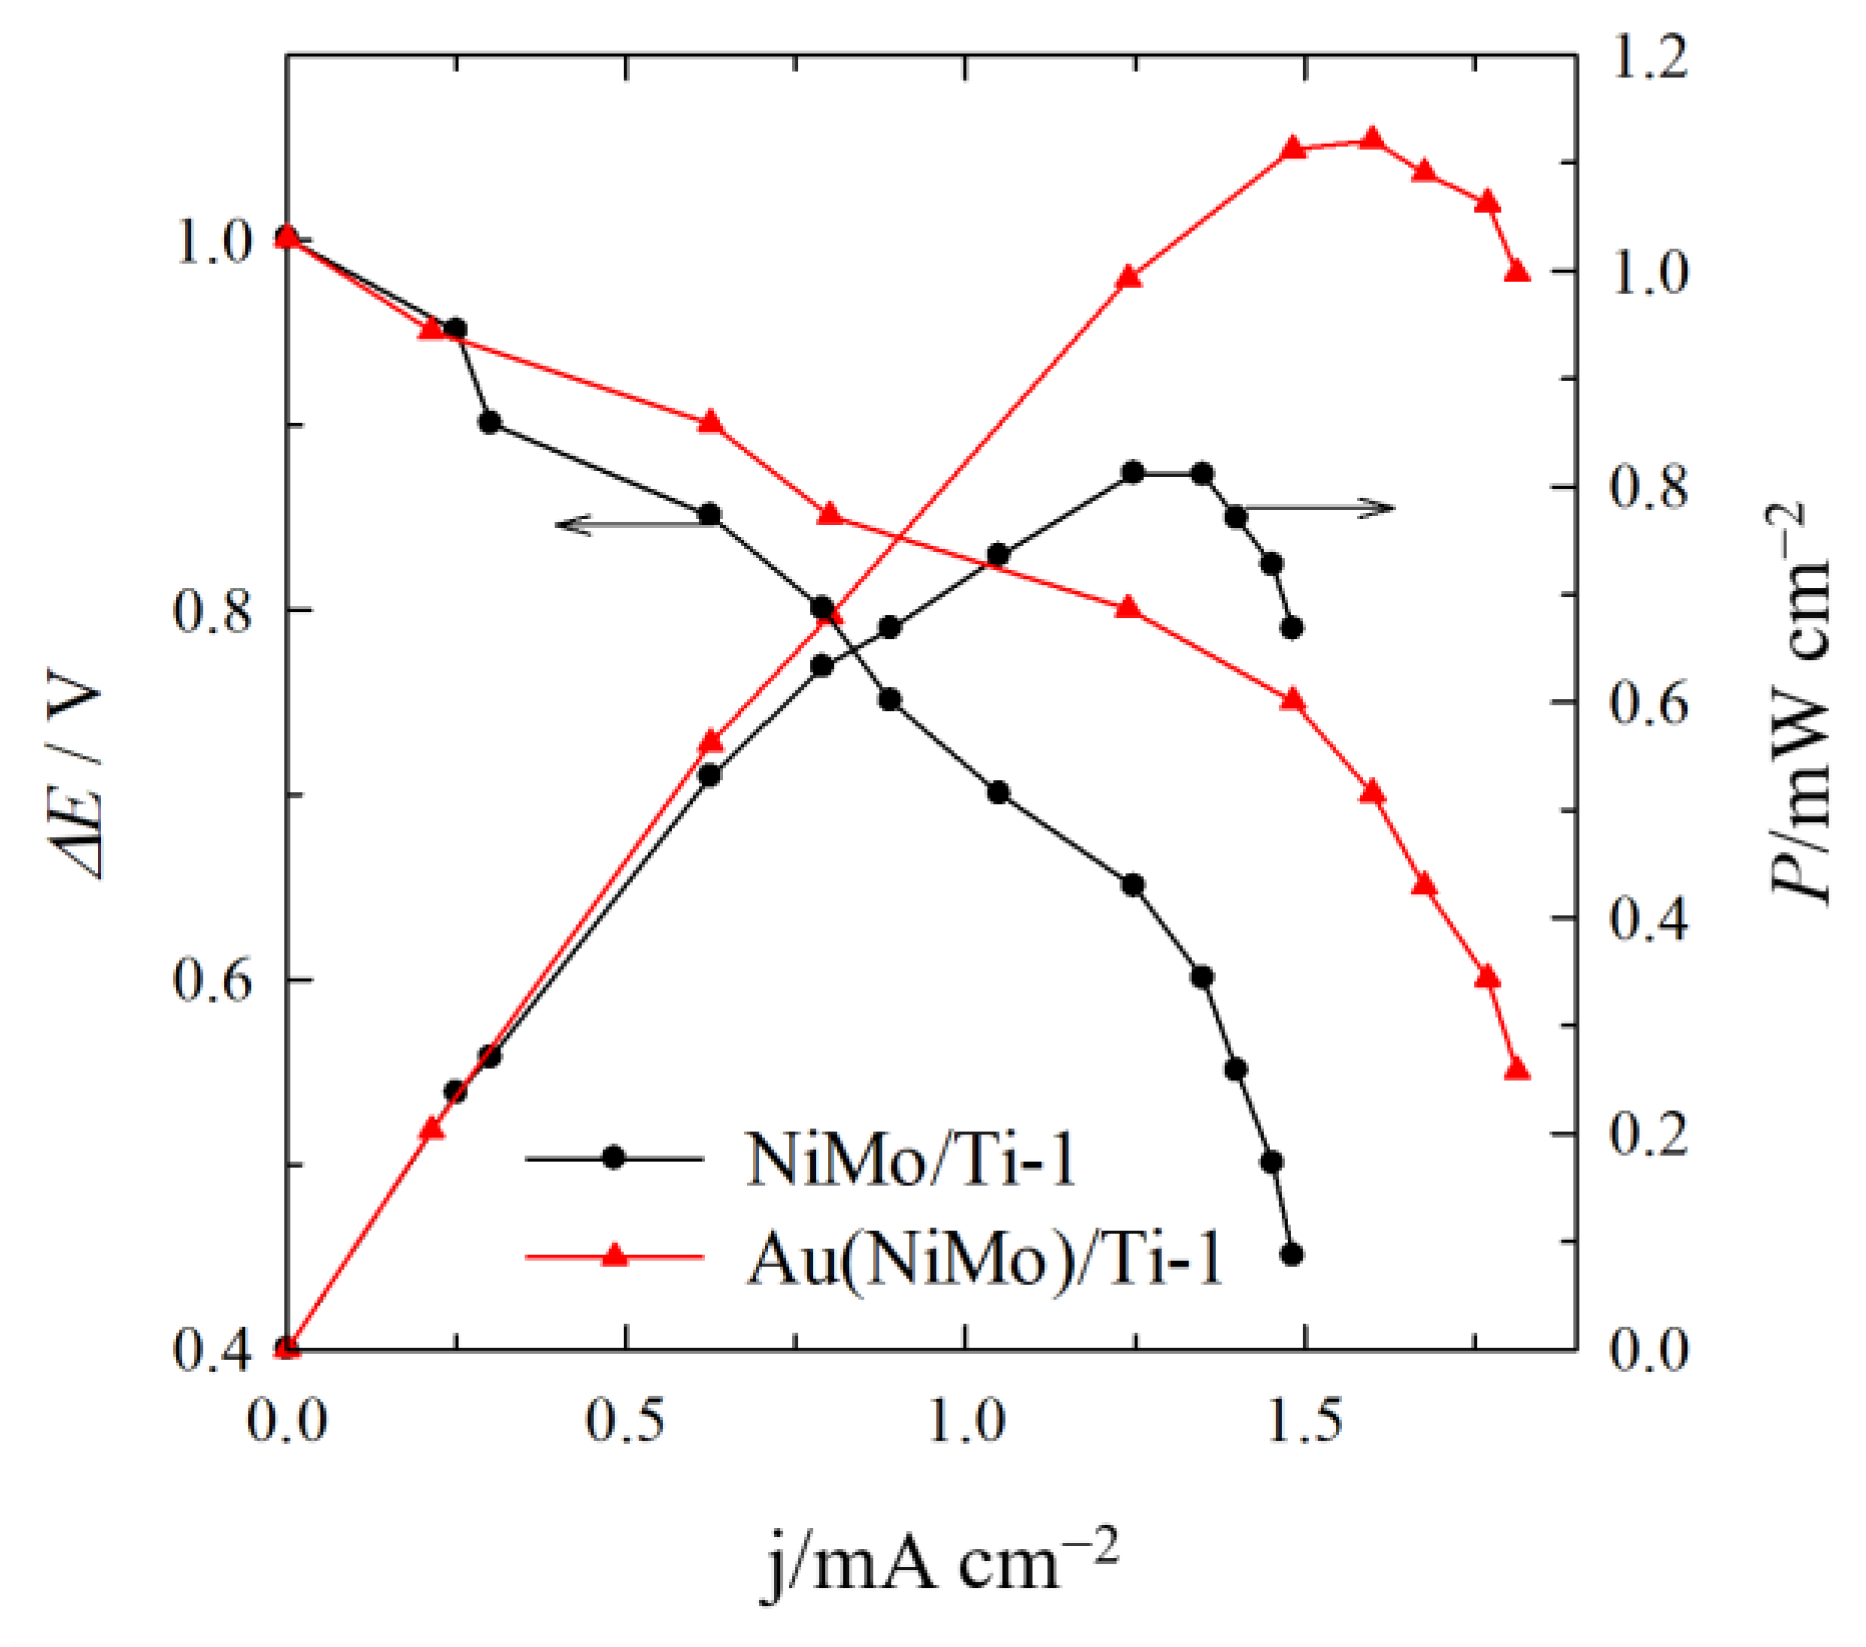
| Catalyst | E at Peak Power Density (V) | j at Peak Power Density (mA cm−2) | Peak Power Density (mW cm−2) | Specific Peak Power Density (mW µgAu−1) |
|---|---|---|---|---|
| NiMo/Ti-1 | 0.65 | 1.25 | 0.81 | - |
| Au(NiMo)/Ti-1 | 0.70 | 1.60 | 1.12 | 0.62 |
| NiMo/Ti-2 | 0.30 | 7.49 | 2.25 | - |
| Au(NiMo)/Ti-2 | 0.35 | 10.76 | 3.77 | 1.64 |
| NiMo/Ti-3 | 0.25 | 18.10 | 4.53 | - |
| Au(NiMo)/Ti-3 | 0.35 | 24.97 | 8.75 | 2.24 |
| Catalyst | Plating Bath Composition | Plating Parameters | |||||||
|---|---|---|---|---|---|---|---|---|---|
| NiSO4, M | Na2MoO4, M | H2SO4, M | HCl, M | I1, A | t1, min | I2, A | t2, min | T, °C | |
| Ni/Ti | 0.5 | - | 1.5 | 1.0 | 0.1 | 3 | 1.0 | 3 | 25 |
| Mo/Ti | - | 0.01 | |||||||
| NiMo/Ti-1 | 0.01 | 0.01 | |||||||
| NiMo/Ti-2 | 0.1 | 0.01 | |||||||
| NiMo/Ti-3 | 0.5 | 0.01 | |||||||
Publisher’s Note: MDPI stays neutral with regard to jurisdictional claims in published maps and institutional affiliations. |
© 2022 by the authors. Licensee MDPI, Basel, Switzerland. This article is an open access article distributed under the terms and conditions of the Creative Commons Attribution (CC BY) license (https://creativecommons.org/licenses/by/4.0/).
Share and Cite
Balčiūnaitė, A.; Upskuvienė, D.; Antanaitis, A.; Šimkūnaitė, D.; Tamašauskaitė-Tamašiūnaitė, L.; Vaičiūnienė, J.; Norkus, E. 3D-Structured Au(NiMo)/Ti Catalysts for the Electrooxidation of Glucose. Catalysts 2022, 12, 892. https://doi.org/10.3390/catal12080892
Balčiūnaitė A, Upskuvienė D, Antanaitis A, Šimkūnaitė D, Tamašauskaitė-Tamašiūnaitė L, Vaičiūnienė J, Norkus E. 3D-Structured Au(NiMo)/Ti Catalysts for the Electrooxidation of Glucose. Catalysts. 2022; 12(8):892. https://doi.org/10.3390/catal12080892
Chicago/Turabian StyleBalčiūnaitė, Aldona, Daina Upskuvienė, Augustas Antanaitis, Dijana Šimkūnaitė, Loreta Tamašauskaitė-Tamašiūnaitė, Jūratė Vaičiūnienė, and Eugenijus Norkus. 2022. "3D-Structured Au(NiMo)/Ti Catalysts for the Electrooxidation of Glucose" Catalysts 12, no. 8: 892. https://doi.org/10.3390/catal12080892
APA StyleBalčiūnaitė, A., Upskuvienė, D., Antanaitis, A., Šimkūnaitė, D., Tamašauskaitė-Tamašiūnaitė, L., Vaičiūnienė, J., & Norkus, E. (2022). 3D-Structured Au(NiMo)/Ti Catalysts for the Electrooxidation of Glucose. Catalysts, 12(8), 892. https://doi.org/10.3390/catal12080892