Article

Quantification of Internal Resistance Contributions of Sediment Microbial Fuel Cells Using Petroleum-Contaminated Sediment Enriched with Kerosene

by
Luisa Alvarez-Benítez
1,
Susana Silva-Martínez
2,
Alfredo Hernandez-Perez
2,
Sathish K. Kamaraj
3,
Syed Zaghum Abbas
4 and
Alberto Alvarez-Gallegos
2,*
1
Instituto Tecnológico de Zacatepec, Calzada Tecnológico No 27, Col. Centro, Zacatepec 62780, Mexico
2
Centro de Investigación en Ingeniería y Ciencias Aplicadas, Universidad Autónoma del Estado de Morelos, Av. Universidad 1001, Cuernavaca 62209, Mexico
3
Conacyt—Centro de Investigaciones en Óptica A.C. Prol. Constitución 607, Fracc. Reserva Loma Bonita, Ags Aguascalientes 20200, Mexico
4
Biofuels Institute, School of Environment and Safety Engineering, Jiangsu University, 301 Xuefu Road, Zhenjiang 212013, China
*
Author to whom correspondence should be addressed.
Catalysts 2022, 12(8), 871; https://doi.org/10.3390/catal12080871
Submission received: 19 July 2022 / Revised: 4 August 2022 / Accepted: 4 August 2022 / Published: 7 August 2022

Abstract

:
Anaerobic biodegradation of petroleum-contaminated sediments can be accomplished by a sediment microbial fuel cell (SMFC), but the recovered energy is very low (~4 mW m−2). This is due to a high internal resistance (Ri) that develops in the SMFC. The evaluation of the main experimental parameters that contribute to Ri is essential for developing a feasible SMFC design and this task is normally performed by electrochemical impedance spectroscopy (EIS). A faster and easier alternative procedure to EIS is to fit the SMFC polarization curve to an electrochemical model. From there, the main resistance contributions to Ri are partitioned. This enables the development of a useful procedure for attaining a low SMFC Ri while improving its power output. In this study, the carbon-anode surface was increased, the biodegradation activity of the indigenous populations was improved (by the biostimulation method, i.e., the addition of kerosene), the oxygen reduction reaction was catalyzed, and a 0.8 M Na2SO4 solution was used as a catholyte at pH 2. As a result, the initial SMFC Ri was minimized 20 times, and its power output was boosted 47 times. For a given microbial fuel cell (MFC), the main resistance contributions to Ri, evaluated by the electrochemical model, were compared with their corresponding experimental results obtained by the EIS technique. Such a validation is also discussed herein.

1. Introduction

Petroleum-contaminated sediments (PCS) are linked to the development of the oil industry and present a growing social concern [1,2]. A feasible biodegradation technique for PCS can be performed using the bio-electrochemical system (BES) approach [3]. Although several BES configurations are available, from the academic point of view, the most attractive designs are the MFC and SMFC configurations [4]. This technology can be applied to extract and convert the chemical energy content in organic pollutants into useful tasks, including bioremediation [5] and energy recovery [6], among others. Unfortunately, SMFC-based power generation from unmodified anodic PCS is very low (~10 mW m−2) [7]. This is due to several biological and electrochemical limitations. In the first case, the following constraints can be mentioned: the rate of the anaerobic biodegradation of PCS is low or negligible [8,9], and the poor composition and diversity of the indigenous microbial flora [10] are linked to the quantity and quality of the organic matter contained in the initial PCS [1,11,12]. Additionally, the ability of some bacteria groups to transfer electrons to the anode can increase/decrease the PCS biodegradation rate [13,14]. In the second case, the main constraints are the SMFC design [6,15]; the cathode material, including its involvement in the oxygen reduction reaction (ORR) [16,17,18]; the catholyte properties [19]; the anode materials [20]; and the separators [21]. The maximum observable voltage in an SMFC is the open circuit voltage (OCV). Thereafter, due to the emergence of various irreversible losses in the SMFC, the observed voltage systematically decreases as current is withdrawn from the cell. The main losses can be described as overpotentials subtracted from the OCV [22] or as the sum of various internal resistance fractions expressed as a total Ri of the SMFC [23]. Therefore, the SMFC Ri is formed by several elements linked to the biological and electrochemical factors just mentioned. The SMFC’s power output is low when compared to that of proton exchange membrane fuel cells (FC) because the Ri in the first type of cells is much higher than that developed in the second [23]. Consequently, the abatement of the whole Ri is one of the main objectives in developing a feasible SMFC design. The current produced by the electrochemical reactions develops a complex internal resistance (impedance) at the electrode–electrolyte interface and forms the polarization curve. Said curve is divided into three different regions, each of them defined by specific impedance contributions that describe the electrochemical performance of the SMFC [22,24]. However, as in the case of an FC, the polarization curve alone does not enable the separation of the main impedance contributions to Ri, such as the activation resistance (Ract), polarization resistance (Rp), double layer capacitor (Cd), Warburg impedance (W), electrolyte solution resistance (Rohmic), and concentration resistance (Rconc). Therefore, additional tests are required to evaluate them, such as EIS and the current interrupt technique [25,26,27,28,29]. In general, the transport of electrons from organic matter through bacteria, biofilms, and finally to an anodic surface occurs in several complex steps [14]. The impedance developed at the electrode–electrolyte interface implies the presence of some capacitors. Therefore, different measurement methods may produce different Ri values [23]. Alternatively, in BES (including MFC/SMFC) the main impedance contributions to Ri can be numerically evaluated from experimental data [30,31,32]. Indeed, the polarization and power density curves from MFC/SMFC can be numerically fitted to the theoretical equations that represent such curves. As a result, a set of empirical constants (representing the main losses in MFC/SMFC) can be determined [30,33]. The main objective of this proposed study focuses on increasing the SMFC power output by minimizing the main components of the SMFC Ri. In the anolyte, the biodegradation activity of the indigenous populations will be improved by the biostimulation method (adding kerosene). Whereas in the catholyte, its conductivity will be increased, and the cathodic oxygen reduction involving 4e [19] will be catalyzed. As an alternative to the EIS technique an electrochemical model will be used to evaluate the main components of the SMFC Ri. The theoretical equation describing the polarization curve will fit the experimental polarization curve. From there, the main components of the SMFC Ri will be evaluated and then systematically reduced to increase (47 times) the power output of the SMFC. A validation of the electrochemical model against EIS is also included.

2. Results and Discussion

2.1. Validation of the Electrochemical Model

The MFC experimental data published elsewhere [27] were adapted for the validation of the electrochemical model. The polarization curve, reported in terms of volumetric current, was converted to the polarization curve in terms of cell current. Then, it was fitted to Equation (7), and a set of constants (a, b, c, Rohmic) were found. The predicted MFC polarization curve and their resistances (Ract, Rohmic, Rconc) were compared with their corresponding experimental results obtained by the EIS technique. In the cited paper, EIS was applied at an open circuit voltage (using a two-electrode configuration) to the named UMFC1, and its Ri was found to be 17.13 ohms. Furthermore, the main component contributions in each of the three regions of the polarization curve were also evaluated, obtaining Ract (7.05 homs), Rohmic (8.62 ohms), and Rconc (1.46 ohms), whereby their sum yields Ri. The EIS technique reports the values of Ri and its main component contributions as constant values along the three regions of the polarization curve. However, the Ri parameters (except Rohmic) are not constant, they are current-dependent parameters in the three regions of the polarization curve [33,34,35]. From Equation (7), the UMFC1 polarization curve and the main parameters (Ri, Ract, Rohmic, and Rconc) were simulated as a function of the cell current as depicted in Figure 1. This figure shows the experimental data points [27] of the polarization curve (ο). In addition, it shows the Ri (•) as a function of current, evaluated Equation (9), along with predictions of the current-dependent parameters such as the polarization curve (dashed line, Equation (7)), Ract (solid blue line, combination of Equation (4) and Ohm’s law), and Rconc (solid red line, combination of Equation (6) and Ohm’s law). Finally, the current-independent parameter Rohmic (solid green line, combination of Equation (6) and Ohm’s law) and the Ri (solid black line, sum of internal resistance fractions) were also included.
As expected, in the first region of the polarization curve (<2 mA, low current) the contribution of Ract to Ri is important. In the second region (from 2 mA to 35 mA, medium to high current), the Rohmic is the most dominant contribution to the Ri. In the entire current window (0–35 mA), the Rconc is the lowest contribution to the Ri. The Ract (7.05 ohms) evaluated from EIS technique falls in the low current region (<2 mA) as a constant value. The predicted value of the Rohmic is overestimated (20 ohms) with respect to the Rohmic (8.62 ohms) evaluated by EIS. However, in both cases, Rohmic is the major contributor to the Ri, suggesting that the cell design could be improved, a conclusion that was also withdrawn by the authors of the cited paper [27]. In the last region, the predicted value of the Rconc (~0.3 ohms) is underestimated with respect to the Rconc (1.46 ohms) evaluated by EIS. However, from the medium to high current, the predicted value of Ri is 25% higher than that evaluated by EIS. The evaluation of the MFC’s Ri (including its components) by means of the EIS technique presents several challenges because this technique is focused to linear systems (such as FC); however, MFCs are not linear systems [36]. Among the main EIS shortcomings are the following: (a) its misinterpretation of the main process (mass transfer, bioelectrochemical reactions, biofilm, and bacterial growth) occurring at the MFC [36], (b) at a low frequency EIS’s responses are inaccurate and unstable [30], (c) the separation and quantification of both resistances Ract and Rconc is a challenging task [24], and (d) the position of the electrodes in the MFC can alter the value of Ri and its components including the bacterial activity on the anode [37]. The observed faradaic current (produced from redox reactions) is always linked with no faradaic current associated to the capacitive component, one of the main impedance contributions to Ri [38]. Hence, the Ri evaluated by different experimental methods may result in different Ri values [23].

2.2. Evaluation of SMFC Ri from Initial PCS

The SMFC anolyte was loaded with the initial PCS. Both electrodes were made from one piece of unmodified CF each; however, for the anode, the CF was cut into four pizza-like segments. The catholyte was tap water (pH 8). When the maximum OCV (0.66 ± 0.06 V) was reached, the polarization curve was obtained (not shown in this work). In the first region of the polarization curve (low current, <3.4 × 10⁻² mA), the Ri increased exponentially, from 350 ohms to 7800 ohms. Therefore, the VSMFC dropped rapidly to 0.40 V due to the activation of overpotentials. In the second region (from 3.4 × 10⁻² mA to 0.15 mA), both current-dependent parameters (VSMFC and Ri) slowly decreased due to ohmic losses, reaching ~0.24 V and ~3145 ohms, respectively. In the third region (>0.15 mA), the VSMFC and Ri reached 0.17 V and 3000 ohms, respectively. Under this SMFC configuration, the maximum power output was ~4 mW m−2. When unamended PCS are used as a source of organic matter in the SMFC anolyte and its electrodes are an unmodified carbon material, very low energy can be recovered [7]. The rate of chemical energy conversion to electrical energy by means of an SMFC is low due to the high internal resistances that contribute (Ract, Rohmic, and Rconc) to the Ri.

2.3. Lowering SMFC Ri

Considering the main results obtained in Section 2.2 and following the main guidelines to minimize Ri [22,24,34], the following strategic procedure was developed. To attain a low Ract in the SMFC, the following steps were taken. In the cathodic side, the ORR was catalyzed on a birnessite/CF-electrode to promote the 4-electron pathway [19,39]. Furthermore, the ORR on birnessite/CF-cathode was investigated at different catholyte pH values. In the anodic side, two segmented CF pieces were employed as an anode. Such modifications were focused on minimizing the kinetic limitations of the cathodic and anodic electrochemical reactions. To attain a low Rohmic, the tap water catholyte was replaced by 0.8 M Na2SO4 at different pH values. To attain a low Rconc, in the cathodic side, the air-saturated catholyte was secured. In the anodic side, the initial PCS was enriched with 3 g of kerosene. Kerosene is not considered to be inhibitory to microbial activity; therefore, it is considered biodegradable [40,41]. In the presence of extra organic matter, it was expected that indigenous bacteria (contained in the initial PCS) would improve their biodegradation activity rate while minimizing both Rohmic and kinetic limitations. A faster anaerobic biodegradation of kerosene in the anolyte would allow faster H+ production, ensuring efficient cation transfer across the 0.04 m sediment gap to the catholyte. Therefore, the minimization of Rohmic would be expected.
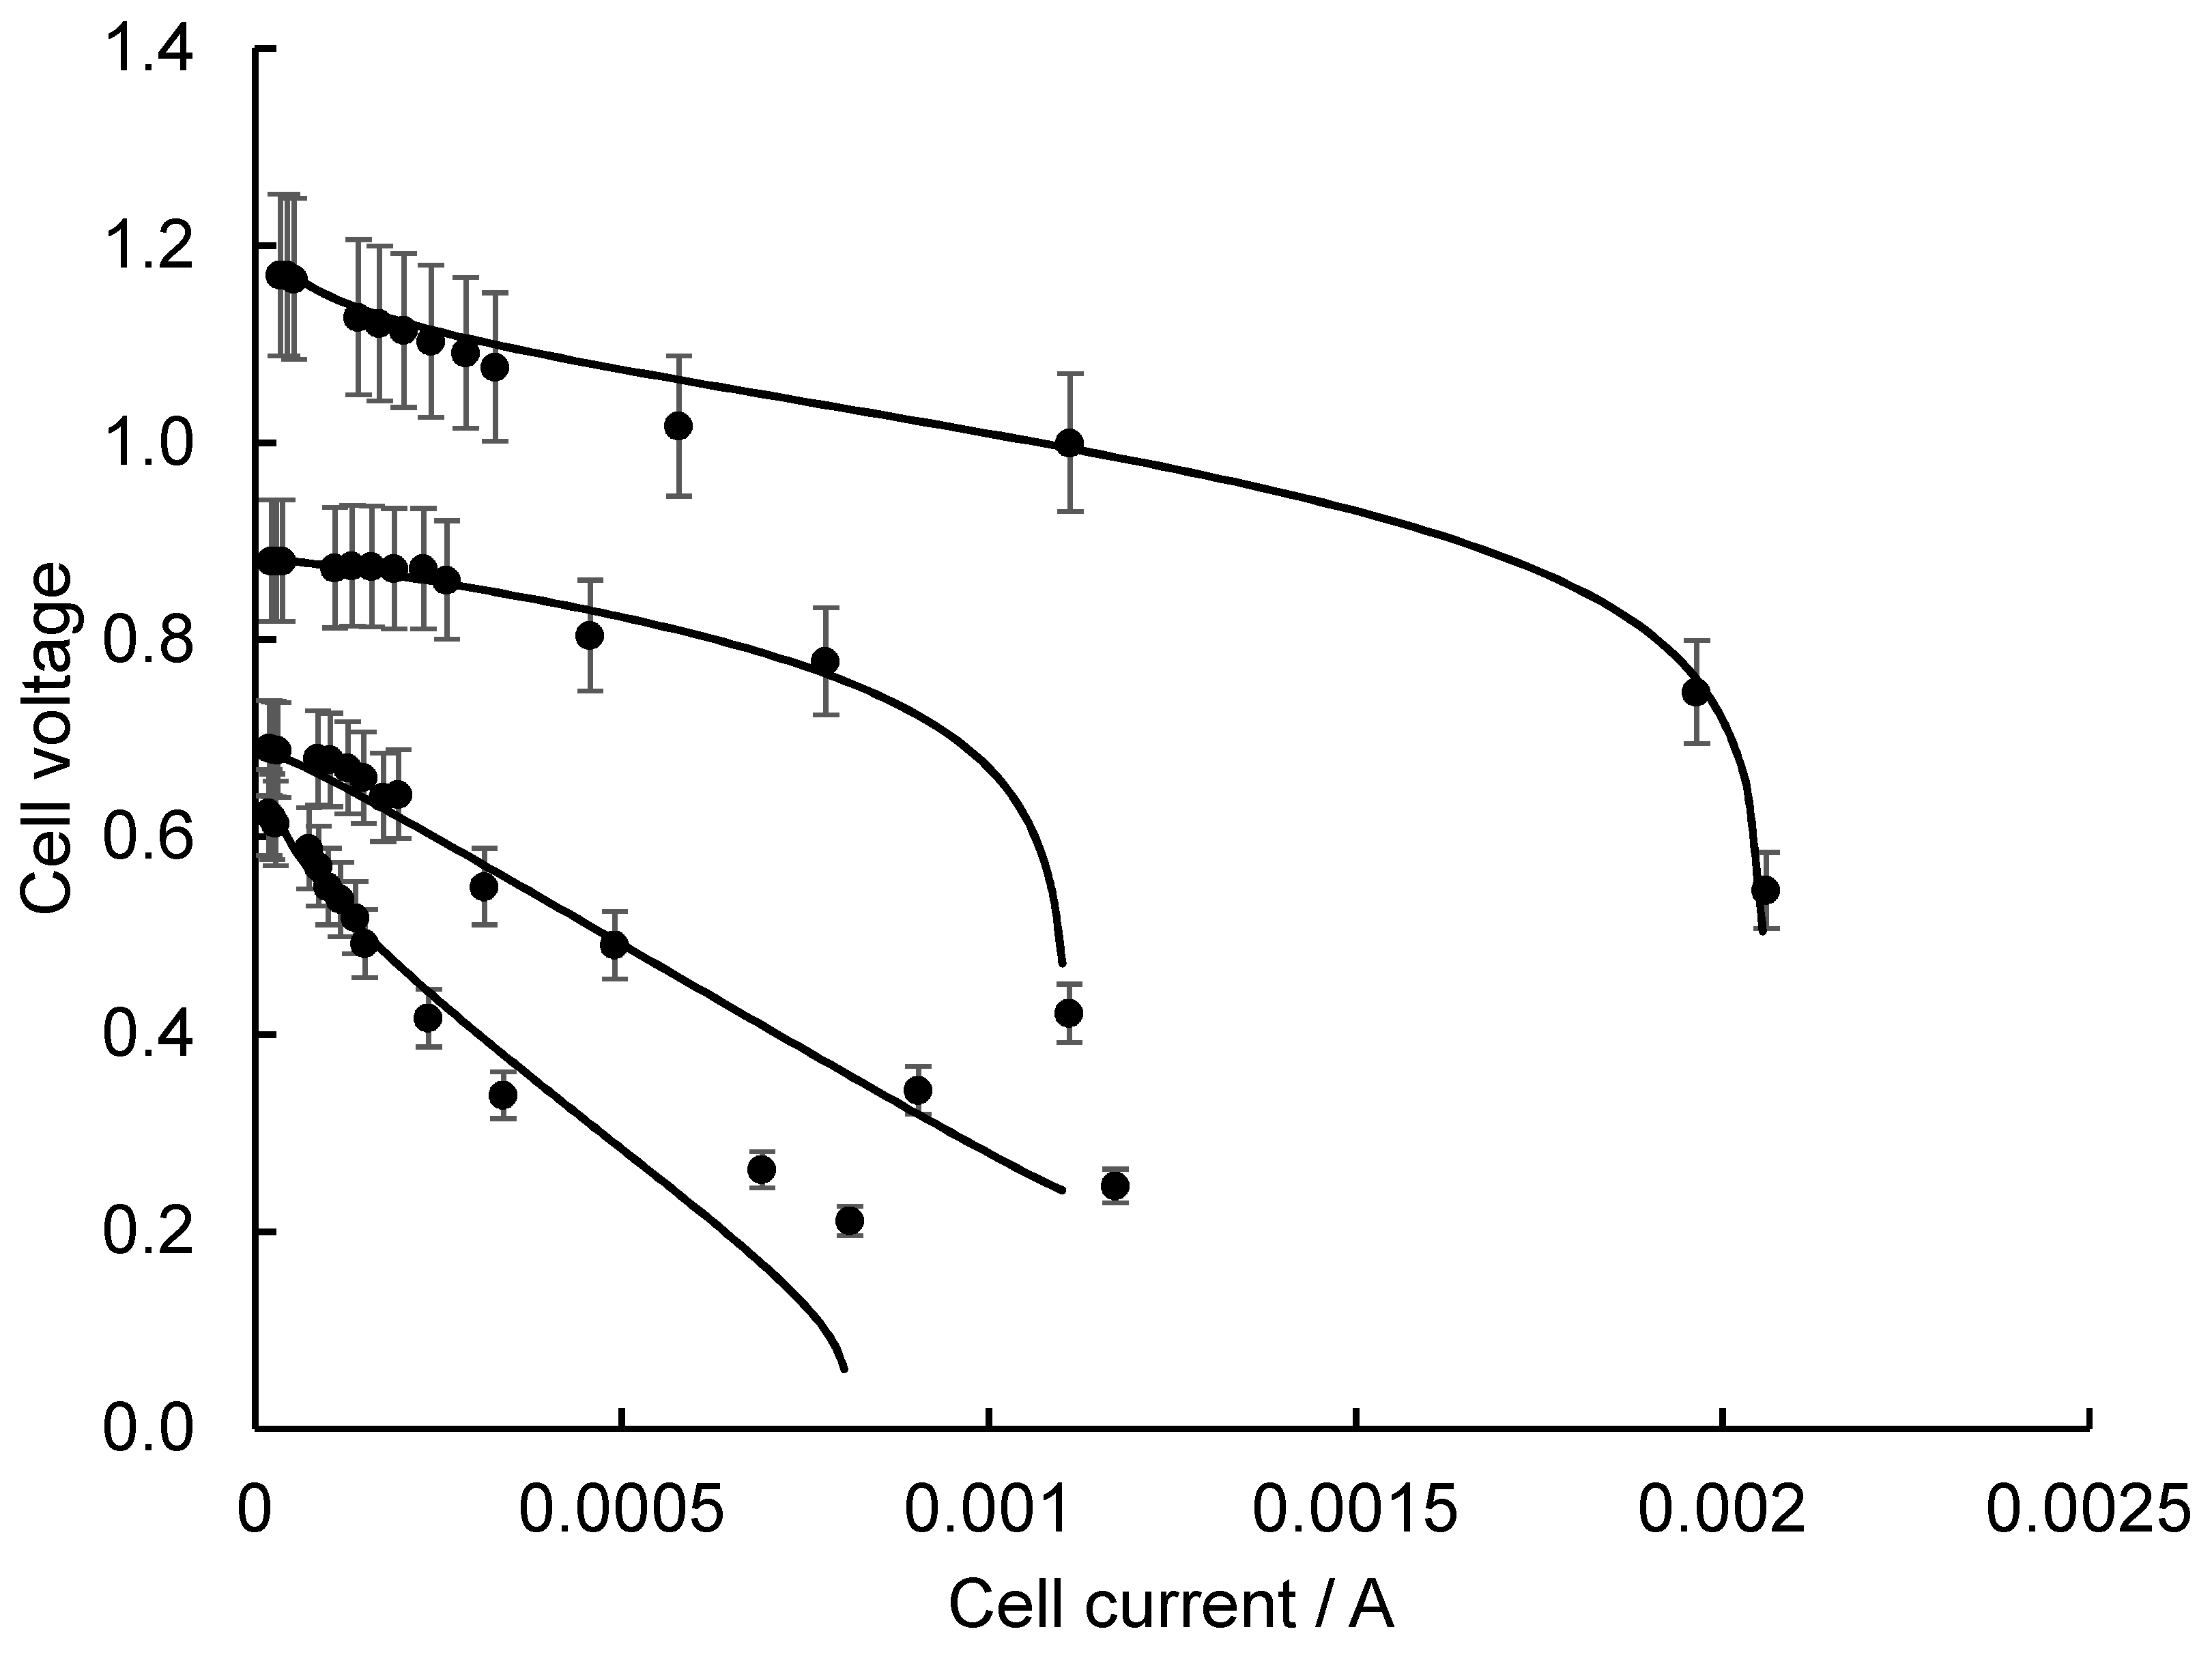
Figure 2 shows four polarization curves (•) at different pH values, from top to bottom: pH 2, pH 4, pH 6, and pH 8. When the four polarization curves were fitted to Equation (7), a set of constants (a, b, c, and Rohmic) were found for each polarization curve. In the same Figure 2, for each pH value, the four polarization curves were predicted from Equation (7) (solid black line). At zero current, the OCV development faces the polarization resistance (or charge transfer resistance), Rp. Said resistance depends on several factors linked to both electrodes. On the anolyte side, the most important are the quantity and quality of the available organic matter, a consortium of bacteria adapted (acclimation period) to degrade the substrate and transfer electrons through bacterial redox pairs to the anode. On the catholyte side, the most important factors are conductivity and ORR.
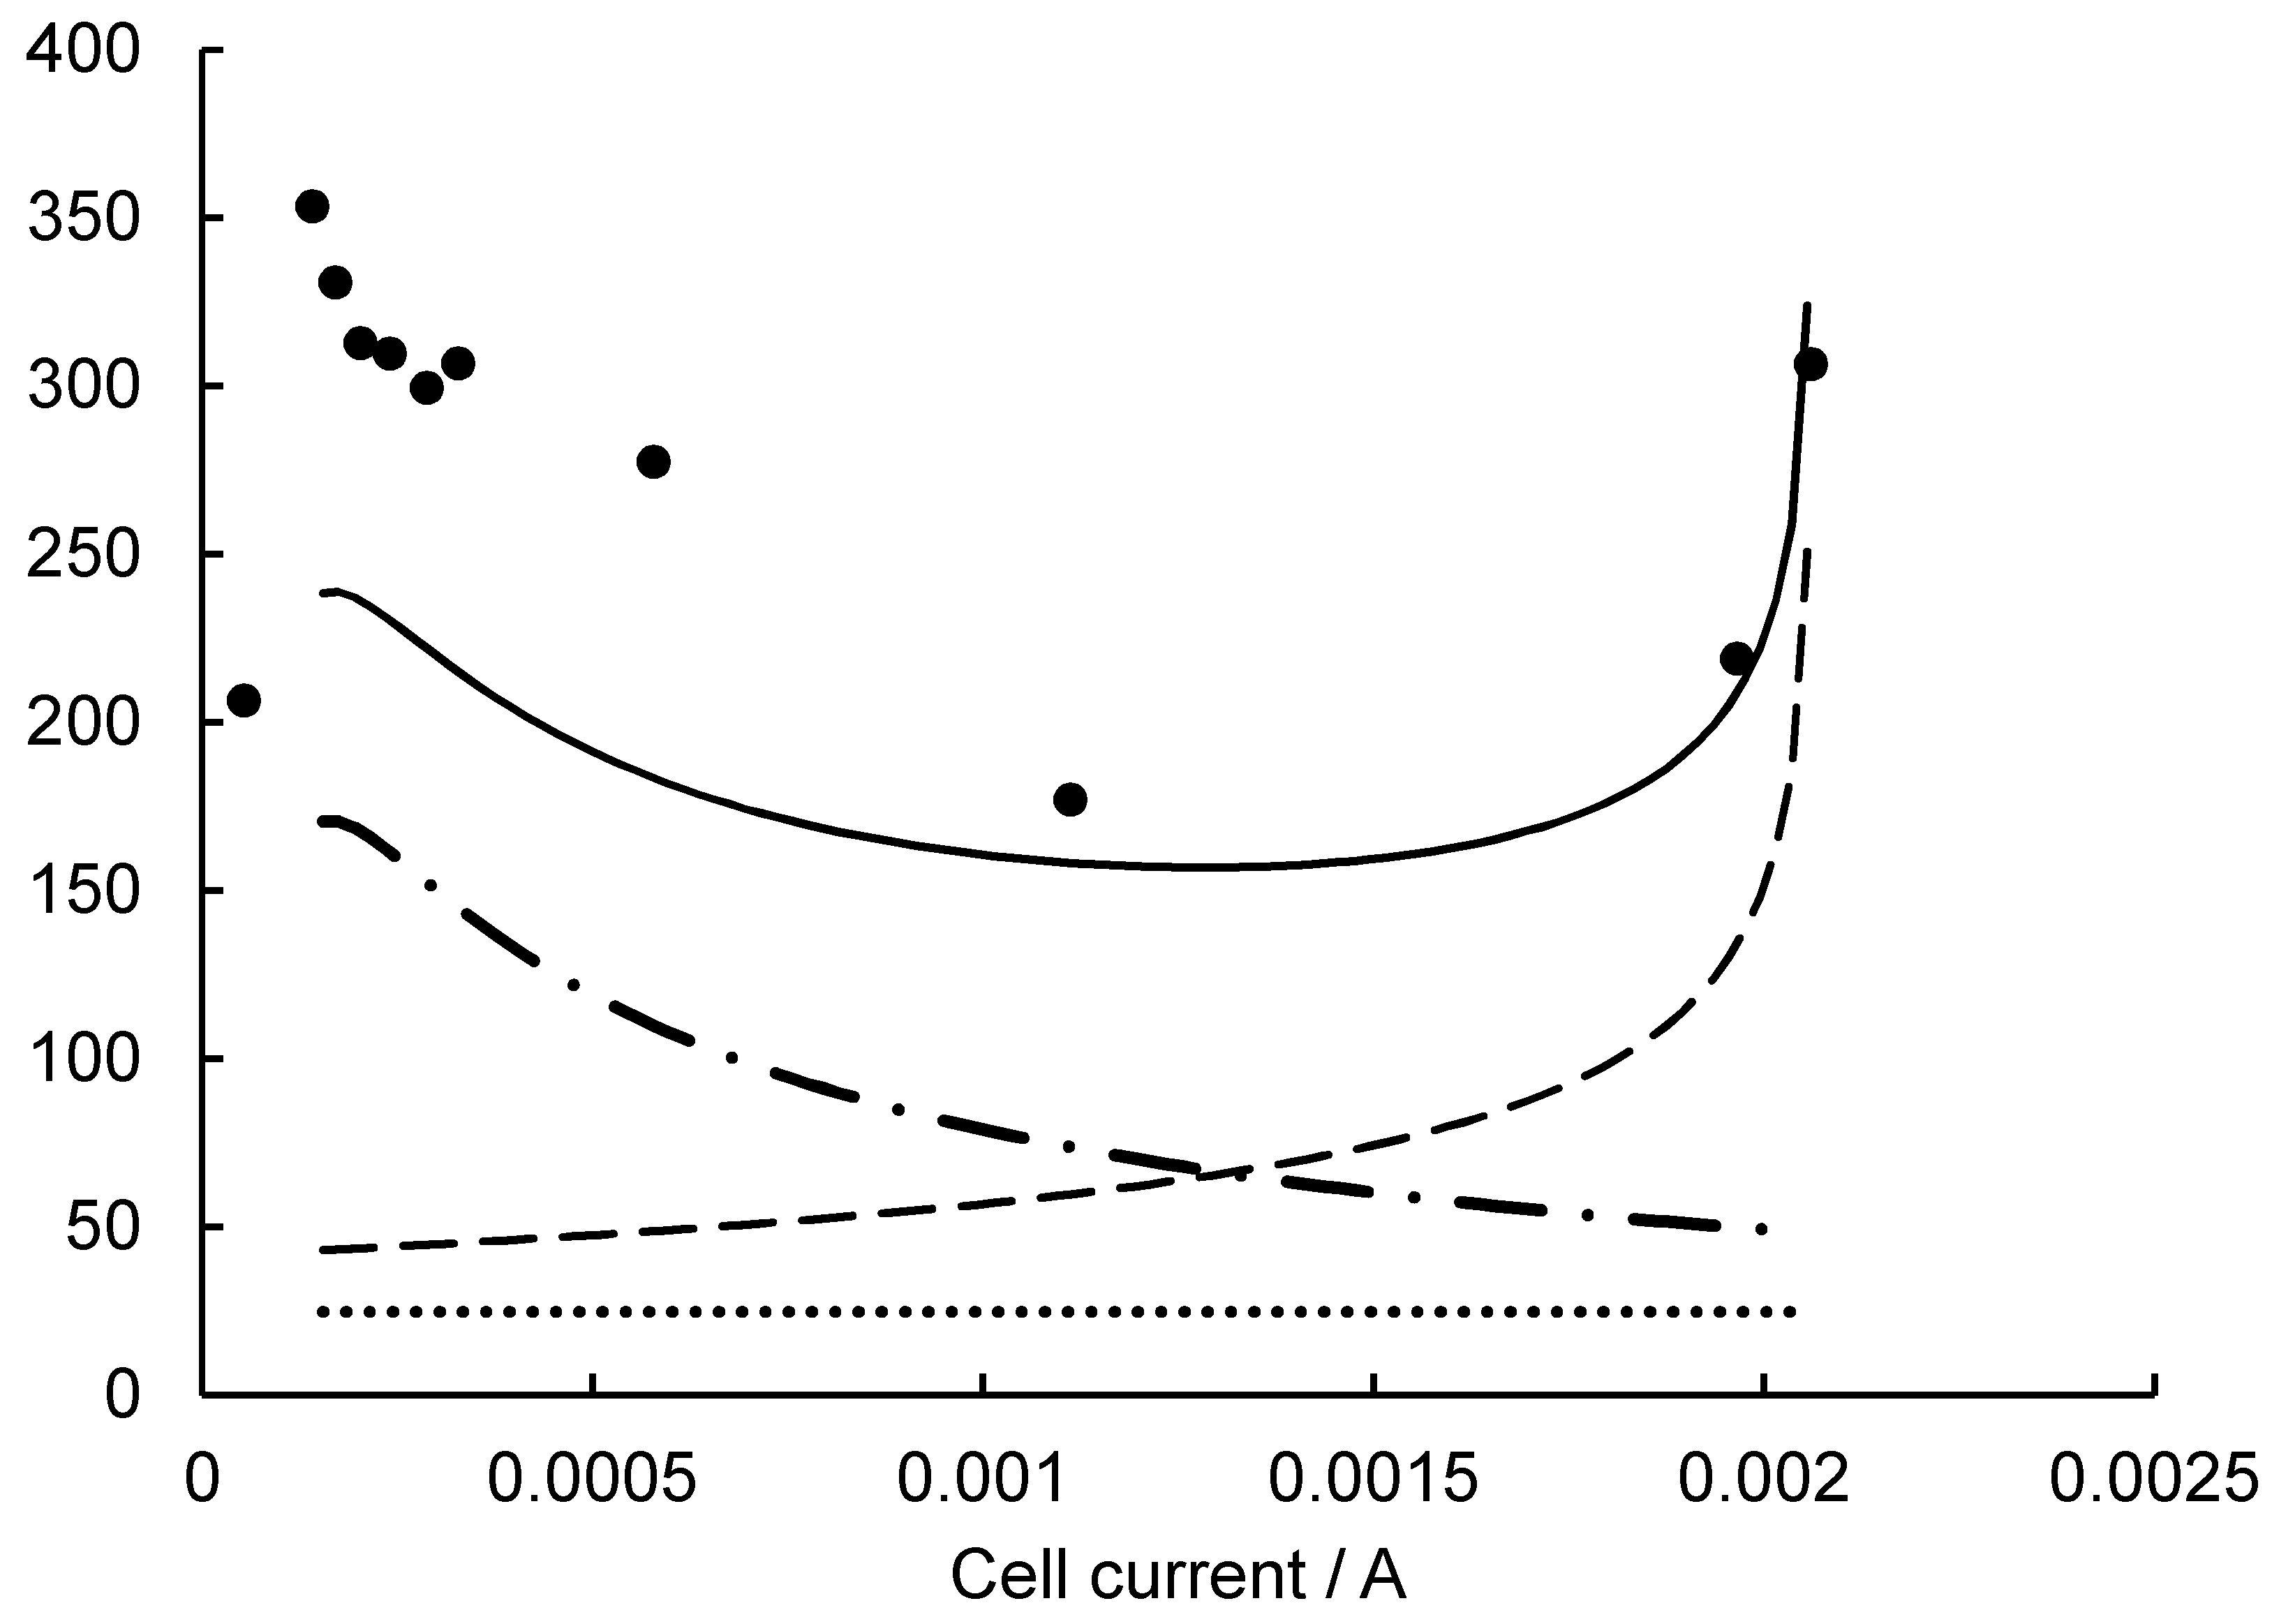
In this set of experiments, the lowest OCV value was caused by a higher pH value (pH 8). The change in pH from pH 8 to pH 2 increased the OCV by 0.55 V, and the polarization curves moved up to a more horizontal position while they were extending to a large current direction, thereby improving the SMFC power output. The cathodic ORR performs better at low pH values because of increases in the SMFC power output [42]. When the catholyte’s pH decreases by 2 pH units from pH 8 to pH 2, the SMFC Ri decreases as well. Figure 3, Figure 4, Figure 5 and Figure 6 show the effect of such a pH variation on Ri (experimental points, • and its predictions, solid black line) along the studied current range. Additionally, in the same graphs, the predictions of current-dependent parameters Ract (dashed dotted line), Rconc (dashed line), and the parameter independent of current, Rohmic (dotted line), are shown as well.
At pH 8 (Figure 3), the lowest contributor to the Ri is Rconc and the highest contributor is Rohmic over the entire current range studied; therefore, the goal was to decrease the Rohmic, although at low currents the Ract is high. At pH 6 (Figure 4) and low currents, a larger scattering between the experimental data points and the predicted values of Ri was detected. In this current interval, the main components contributing to Ri were underestimated. However, the general pattern is similar to that of the pH value above: the lowest contributor to the Ri is Rconc and the highest contributor remains Rohmic throughout the current range studied. Although Rac and Rconc decreased at pH 6, the Rohmic value (450 ohms) was almost the same as at pH 8. At pH 4 (Figure 5) a dramatic change was noted: except for low currents, the lowest contributors to the Ri are Ract and Rohmic. In general, at pH 4, all the components that contribute to the Ri are reduced compared to higher pH values. Rohmic is lowered more than an order of magnitude. For pH 2 (Figure 6) and low currents, a larger scattering between the experimental data points and the predicted values of Ri was detected. In this current interval, the main components contributing to the Ri were underestimated.
For the current range studied, the largest contributors to the Ri are Ract and Rconc. The lowest contributor to Ri is Rohmic, its value was reduced almost 20 times from that at pH 8. A systematic decrease in the catholyte’s pH reduces the SMFC Ri and simultaneously increases the power output. From the polarization curves (Figure 2), the power vs. current curves were obtained (not shown in this work). The maximum output power density, for each pH value, was evaluated from the point of maximum power, obtaining the following results: pH 8, 23 mW m−2; pH 6, 40 mW m−2; pH 4, 77 mW m−2; and pH 2, 187 mW m−2. If key parameters such as the Ri (~3000 ohms), output power (4 mW m−2), and maximum current (0.15 mA) obtained with the initial PCS (Section 2.2) are considered, after their modifications, they were drastically improved. The Ri was reduced by almost 20 times (~150 ohms), the output power was increased by almost 47 times (187 mW m−2), and the cell current was improved by 13 times (2 mA). The further improvement of an efficient SMFC technology, based on a quick and simple diagnosis of Ri (curve fitting), could focus on developing interesting environmental tasks, such as bioremediation or the energy recovery of heavy contaminated sediments.

3. Materials and Methods

3.1. SMFC Construction

A 20 L sample of PCS was taken from a polluted river (Coatzacoalcos River in the Gulf of Mexico, 594 km southeast Mexico City). The unmodified PCS sample was collected into a plastic vessel and kept at a low temperature until it was used in the experimental procedure. A cylindrical SMFC (0.16 m high, 0.105 m internal diameter) was set up as reported in a previous publication [19]. The anolyte consisted of 6.93 × 10⁻⁴ m3 of PCS + 3 g of kerosene to increase the initial organic matter content. The initial bacterial consortium in the PCS sample was taken as the inoculum without further modification. The catholyte consisted of 4.33 × 10⁻⁴ m3 of 0.8 M Na2SO4 (Merck, Mx) at different pH values. The volume was kept constant by the of addition of tap water. Air was constantly bubbled to maintain an O2-saturated catholyte. From circular pieces of carbon fabric, CF (Fibre Glast Development Corp. USA; 0.1 m diameter), cathode, and anode were manufactured. A birnessite/CF-cathode was directly synthetized as previously reported [19,39,43]. To increase power density, two CF pieces were used as an anode. Each CF-anode piece was cut into 4 pizza-like segments and buried in the amended PCS. To minimize bioturbation occurrences [44,45], each anode segment was individually bonded with an insulated stainless-steel wire to a single resistance and then to the birnessite/CF-cathode. Cathode and anode were separated for 0.04 m of petroleum contaminated sediment.

3.2. Data Acquisition

By means of an external load (38 k ohms), the anode and the cathode were electrically connected and a ΔV was slowly developed for 10 days until reaching the pseudo-steady state (reaching a maximum OCV ± 0.06 V). At this moment, the anode was colonized by an adapted bacterial group. Although the ideal time that is necessary to reach the pseudo-stationary condition before recording the OCV is unclear [24], the mentioned criterion was previously accepted as an indicator of a well-developed SMFC OCV [19,46]. A similar criterion was adopted when the polarization curve was formed. When the SMFC’s external electric circuit is closed with a high external resistance (Rext) and is then gradually replaced by a lower Rext (from 38 k ohms to 250 ohms), the cell current will flow, while the observed SMFC voltage (VSMFC) will fall accordingly, forming the polarization curve. For each Rext, its corresponding VSMFC was recorded until the pseudo-steady state was reached (~15 min); the corresponding cell current was derived from the law of Ohm. After this, the SMFC external electrical circuit was reverted to maximum OCV (38 k ohms) before testing a lower Rext. Experimental points (ΔV vs. cell current) were acquired, recorded, and administered by means of a commercial microcontroller board (Arduino UNO, model ATmega328, USA. Purchased in Mexico, at an ordinary hardware store) connected to a PC. Along the three regions of the polarization curve, some critical points were tested three times and then averaged. All standard deviations were assumed to be as found for triplicate tests. For some experiments, the cell power and current were normalized to the geometric cathode area.

3.3. Electrochemical Model Equations

When the SMFC electrical circuit is closed with a (Rext) and varies smoothly from a high value to a low value, the current will flow while the SMFC voltage will drop accordingly, due to irreversible losses. Consequently, the SMFC Ri develops by forming a polarization curve. Although several losses are caused by the SMFC, the most important are the following: polarization resistance (Rp), activation resistance (Ract), electrolyte solution resistance (Rohmic), and concentration resistance (Rconc) [23,47]. Irreversible losses can be expressed as overvoltages or as resistances. The polarization curve can be described as a set of overpotentials that are subtracted from OCV, according to Equation (1) [24,47]:
V S M F C = O C V η a c t η o h m i c η c o n c
Overpotentials due to activation (or polarization), ohmic losses, and concentration are represented by: ηact, ηohmic, and ηconc, respectively. The activation overpotential can be expressed as:
η a c t = R T α c n F ln ( i i 0 , c ) + R T α a n F ln ( i i 0 , a )
where R is the universal gas constant; T is the absolute temperature; F is the Faraday constant; n is the number of electrons; i is the observed current; αa and αc are the transfer coefficients for the anodic and cathodic electrochemical reactions, respectively; and i0,a and i0,c are the exchange currents of the anode and cathode, respectively. On the right side of Equation (2), all constant values of the cathode (i.e., R, T, F, n, αc, and i0,c) are algebraically collected in two constants, ac and bc, and the corresponding constant values of the anode are collected in constants aa and ba. Therefore, Equation (2) is rewritten as:
η a c t = ( a c + b c ln ( i ) ) + ( a a + b a ln ( i ) )
where a c = R T α c n F ln ( i 0 , c ) . and b c = R T α c n F are the constants related to the cathode. Similarly, constants aa and ba can be defined for the anode. Further simplifications can be made by considering a = ac + aa and b = bc + ba. Therefore, the activation overpotential can be expressed by Equation (4).
η a c t = ( a + b ln ( i ) )
Overpotential due to ohmic losses can be expressed as:
η o h m i c = i R o h m i c
where Rohmic is the ohmic internal resistance. Overpotential due to concentration can be expressed as:
η c o n c = c   ln ( i L i L i )
where c = R T n F and iL is the observed limiting current in the polarization curve. By combining Equations (4)–(6), a good approximation of the polarization curve is obtained:
V S M F C = O C V ( a + b ln ( i ) ) i R o h m i c c   ln ( i L i L i )
In general, the combination of experimental data (polarization curve) and Equation (7) allows for the estimation of the constants (a, b, c, and Rohmic, using a MATLAB commercial version) belonging to the three different regions of the polarization curve [33]. The main equivalent irreversible losses can be expressed as overpotentials (Equation (1)) or internal resistances that contribute (Ract =ηact/i, Rohmic = ηohmic/i, Rconc = ηconc/i) to Ri. From Equation (7), it is possible to simulate the MFC/SMFC polarization curve and its main parameters (Ri, Ract, Rohmic, Rconc, ηact, ηohmic, and ηconc) as a function of the cell current. Such a simulation allows for an evaluation of the performance of an MFC/SMFC in terms of energy and power output. Alternatively, the polarization curve (Equation (7)) can be expressed as a function of Ri according to Equation (8):
V S M F C = O C V R i i
As stated at the beginning of this section, the polarization curve is formed when Rext decreases smoothly. Therefore, introducing Ohm’s law (Rext = VSMFC/i) in Equation (8), an equivalent equation can be obtained that expresses Rint as a function of Rext:
R i = ( O C V V S M F C 1 ) R e x t
For each Rext value, the total Ri can be evaluated pointwise along the polarization curve from Equation (9). Additionally, from the experimental polarization curve (Equation (8)), the power density curve is derived and represented by Equation (10).
p S M F C = ( O C V ) i R i i 2
where pSMFC is the SMFC power output represented by a second-degree polynomial (a parabola). The Ri can be expressed as a sum of internal resistance fractions; for example, Ri = Ract + Rohmic + Rconc, where the addends correspond to the fractions of internal resistance to the anode, cathode, electrolyte, and concentration, respectively. More addends can be added to represent additional internal resistance fractions, such as membrane resistance (Rm). Each summand can be further discretized into more parameters to differentiate them from each other and facilitate their individual identification by curve fitting [30].

4. Conclusions

The SMFCs’ Ri values are very high when unmodified anodic PCS is used for energy recovery. The evaluation of the main resistance contributors and their minimization is an important task with respect to designing an experimental strategy that minimizes them and improves the power output of the SMFC. EIS is one of the most widely used techniques to evaluate Ri. In this work, a faster and simpler alternative procedure (curve fitting) was applied to EIS to estimate the Ract, Rohmic, and Rconc. Therefore, applying this procedure to a given MFC, the predicted Ri was 25% higher than that evaluated by EIS. In this work, the SMFCs’ Ri and their main resistance contributors were evaluated at initial conditions. They were then minimized by increasing the anode’s surface area, adding 3 g of kerosene to the anolyte, catalyzing the ORR, and using 0.8 M Na2SO4 catholyte at pH 2. As a result, the SMFC Ri was reduced by 20 times and its power output increased 47 times. A small Ri indicates low overpotentials and thus a high SMFC power output. For future work, this methodology can be implemented to improve the SMFC performance and focus it on bioelectrochemical remediation technology.

Author Contributions

Conceptualization, A.A.-G. and S.S.-M.; methodology, A.A.-G.; software, A.H.-P.; validation, S.K.K., L.A.-B. and S.S.-M.; formal analysis, S.S.-M.; investigation, A.A.-G.; resources, L.A.-B. and S.Z.A.; data curation, S.K.K. and S.Z.A.; writing—original draft preparation, A.A.-G.; writing—review and editing, S.S.-M.; visualization, A.A.-G. and A.H.-P.; supervision, A.A.-G.; project administration, A.A.-G. All authors have read and agreed to the published version of the manuscript.

Funding

This research received no external funding.

Data Availability Statement

Not applicable.

Conflicts of Interest

The authors declare no conflict of interest.

References

  1. Guo, G.; Tian, F.; Ding, K.; Wang, L.; Liu, T.; Yang, F. Effect of a bacterial consortium on the degradation of polycyclic aromatic hydrocarbons and bacterial community composition in Chinese soils. Int. Biodeterior. Biodegrad. 2017, 123, 56–62. [Google Scholar] [CrossRef]
  2. Srinivasarao Naik, B.; Mishra, I.M.; Bhattacharya, S.D. Biodegradation of total petroleum hydrocarbons from oily sludge. Bioremediat. J. 2011, 15, 140–147. [Google Scholar] [CrossRef]
  3. Lu, L.; Yazdi, H.; Jin, S.; Zuo, Y.; Fallgren, P.H.; Ren, Z.J. Enhanced bioremediation of hydrocarbon-contaminated soil using pilot-scale bioelectrochemical systems. J. Hazard. Mater. 2014, 274, 8–15. [Google Scholar] [CrossRef]
  4. Santoro, C.; Arbizzani, C.; Erable, B.; Ieropoulos, I. Microbial fuel cells: From fundamentals to applications. A Review. J. Power Source 2017, 356, 225–244. [Google Scholar] [CrossRef] [PubMed]
  5. Li, X.; Zheng, R.; Zhang, X.; Liu, Z.; Zhu, R.; Zhang, X. A novel exoelectrogen from microbial fuel cell: Bioremediation of marine petroleum hydrocarbon pollutants. J. Environ. Manag. 2019, 235, 70–76. [Google Scholar] [CrossRef]
  6. Prasad, J.; Tripathi, R.K. Voltage control of sediment microbial fuel cell to power the AC load. J. Power Source 2020, 450, 227721. [Google Scholar] [CrossRef]
  7. Yu, B.; Tian, J.; Feng, L. Remediation of PAH polluted soils using a soil microbial fuel cell: Influence of electrode interval and role of microbial community. J. Hazard. Mater. 2017, 336, 110–118. [Google Scholar] [CrossRef]
  8. Haritash, A.K.; Kaushik, C.P. Biodegradation aspects of Polycyclic Aromatic Hydrocarbons (PAHs): A review. J. Hazard. Mater. 2009, 169, 1–15. [Google Scholar] [CrossRef]
  9. Logeshwaran, P.; Megharaj, M.; Chadalavada, S.; Bowman, M.; Naidu, R. Petroleum hydrocarbons (PH) in groundwater aquifers: An overview of environmental fate, toxicity, microbial degradation and risk-based remediation approaches. Environ. Technol. Innov. 2018, 10, 175–193. [Google Scholar] [CrossRef]
  10. Varjani, S.J.; Rana, D.P.; Jain, A.K.; Bateja, S.; Upasani, V.N. Synergistic ex-situ biodegradation of crude oil by halotolerant bacterial consortium of indigenous strains isolated from on shore sites of Gujarat, India. Int. Biodeterior. Biodegrad. 2015, 103, 116–124. [Google Scholar] [CrossRef]
  11. Zhao, Q.; Li, R.; Ji, M.; Ren, Z.J. Organic content influences sediment microbial fuel cell performance and community structure. Bioresour. Technol. 2016, 220, 549–556. [Google Scholar] [CrossRef] [PubMed]
  12. Guo, H.; Tang, S.; Xie, S.; Wang, P.; Huang, C.; Geng, X. The oil removal and the characteristics of changes in the composition of bacteria based on the oily sludge bioelectrochemical system. Sci. Rep. 2020, 10, 15474. [Google Scholar] [CrossRef] [PubMed]
  13. Bond, D.R.; Holmes, D.E.; Tender, L.M.; Lovley, D.R. Electrode-reducing microorganisms that harvest energy from marine sediments. Science 2002, 295, 483–485. [Google Scholar] [CrossRef] [PubMed] [Green Version]
  14. Kondaveeti, S.K.; Seelam, J.S.; Mohanakrishna, G. Anodic electron transfer mechanism in bioelectrochemical systems. In Microb Fuel Cell a Bioelectrochemical System That Convert Waste to Watts; Das, D., Ed.; Springer: Cham, Switzerland, 2017; pp. 87–100. [Google Scholar] [CrossRef]
  15. Hong, S.W.; Chang, I.S.; Choi, Y.S.; Chung, T.H. Experimental evaluation of influential factors for electricity harvesting from sediment using microbial fuel cell. Bioresour. Technol. 2009, 100, 3029–3035. [Google Scholar] [CrossRef] [PubMed]
  16. Rismani-Yazdi, H.; Carver, S.M.; Christy, A.D.; Tuovinen, O.H. Cathodic limitations in microbial fuel cells: An overview. J. Power Source 2008, 180, 683–694. [Google Scholar] [CrossRef]
  17. Koo, B.; Jung, S.P. Improvement of air cathode performance in microbial fuel cells by using catalysts made by binding metal-organic framework and activated carbon through ultrasonication and solution precipitation. Chem. Eng. J. 2021, 424, 130388. [Google Scholar] [CrossRef]
  18. Sallam, E.R.; Khairy, H.M.; Elnouby, M.S.; Fetouh, H.A. Sustainable electricity production from seawater using Spirulina platensis microbial fuel cell catalyzed by silver nanoparticles-activated carbon composite prepared by a new modified photolysis method. Biomass Bioenergy 2021, 148, 106038. [Google Scholar] [CrossRef]
  19. Aleman-Gama, E.; Cornejo-Martell, A.J.; Ortega-Martínez, A.; Kamaraj, S.K.; Juárez, K.; Silva-Martínez, S. Oil-contaminated sediment amended with chitin enhances power production by minimizing the sediment microbial fuel cell internal resistance. J. Electroanal. Chem. 2021, 894, 115365. [Google Scholar] [CrossRef]
  20. Hindatu, Y.; Annuar, M.S.M.; Gumel, A.M. Mini-review: Anode modification for improved performance of microbial fuel cell. Renew Sustain. Energy Rev. 2017, 73, 236–248. [Google Scholar] [CrossRef]
  21. Rahimnejad, M.; Bakeri, G.; Najafpour, G.; Ghasemi, M.; Oh, S.E. A review on the effect of proton exchange membranes in microbial fuel cells. Biofuel Res. J. 2014, 1, 7–15. [Google Scholar] [CrossRef]
  22. Clauwaert, P.; Aelterman, P.; Pham, T.H.; De Schamphelaire, L.; Carballa, M.; Rabaey, K.; Verstraete, W. Minimizing losses in bio-electrochemical systems: The road to applications. Appl. Microbiol. Biotechnol. 2008, 79, 901–913. [Google Scholar] [CrossRef]
  23. Liang, P.; Huang, X.; Fan, M.Z.; Cao, X.X.; Wang, C. Composition and distribution of internal resistance in three types of microbial fuel cells. Appl. Microbiol. Biotechnol. 2007, 77, 551–558. [Google Scholar] [CrossRef] [PubMed]
  24. Zhao, F.; Slade, R.C.T.; Varcoe, J.R. Techniques for the study and development of microbial fuel cells: An electrochemical perspective. Chem. Soc. Rev. 2009, 38, 1926–1939. [Google Scholar] [CrossRef] [PubMed] [Green Version]
  25. Qu, X.; Alvarez, P.J.J.; Li, Q. Applications of nanotechnology in water and wastewater treatment. Water Res. 2013, 47, 3931–3946. [Google Scholar] [CrossRef] [PubMed]
  26. Wagner, N. Characterization of membrane electrode assemblies in polymer electrolyte fuel cells using a.c. impedance spectroscopy. J. Appl. Electrochem. 2002, 32, 859–863. [Google Scholar] [CrossRef]
  27. He, Z.; Wagner, N.; Minteer, S.D.; Angenent, L.T. An upflow microbial fuel cell with an interior cathode: Assessment of the internal resistance by impedance spectroscopy. Environ. Sci. Technol. 2006, 40, 5212–5217. [Google Scholar] [CrossRef] [PubMed]
  28. Jung, S.; Ahn, Y.H.; Oh, S.E.; Lee, J.; Cho, K.T.; Kim, Y. Impedance and thermodynamic analysis of bioanode, abiotic anode, and riboflavin-amended anode in microbial fuel cells. Bull. Korean Chem. Soc. 2012, 33, 3349–3354. [Google Scholar] [CrossRef] [Green Version]
  29. Lu, Z.; Girguis, P.; Liang, P.; Shi, H.; Huang, G.; Cai, L. Biological capacitance studies of anodes in microbial fuel cells using electrochemical impedance spectroscopy. Bioprocess Biosyst. Eng. 2015, 38, 1325–1333. [Google Scholar] [CrossRef]
  30. Fan, Y.; Sharbrough, E.; Liu, H. Quantification of the internal resistance distribution of microbial fuel cells. Environ. Sci. Technol. 2008, 42, 8101–8107. [Google Scholar] [CrossRef]
  31. Jemeï, S.; Hissel, D.; Péra, M.C.; Kauffmann, J.M. On-board fuel cell power supply modeling on the basis of neural network methodology. J. Power Source 2003, 124, 479–486. [Google Scholar] [CrossRef]
  32. Wei, L.I.; Xin-Jian, Z.; Zhi-Jun, M.O. Estimation of equivalent internal-resistance of PEM fuel cell using artificial neural networks. J. Cent. South Univ. Technol. 2007, 14, 690–695. [Google Scholar] [CrossRef]
  33. Zhang, P.Y.; Liu, Z.L. Experimental study of the microbial fuel cell internal resistance. J. Power Source 2010, 195, 8013–8018. [Google Scholar] [CrossRef]
  34. Logan, B.E.; Hamelers, B.; Rozendal, R.; Schröder, U.; Keller, J.; Freguia, S. Microbial fuel cells: Methodology and technology. Environ. Sci. Technol. 2006, 40, 5181–5192. [Google Scholar] [CrossRef] [PubMed]
  35. Rossi, R.; Cario, B.P.; Santoro, C.; Yang, W.; Saikaly, P.E.; Logan, B.E. Evaluation of Electrode and Solution Area-Based Resistances Enables Quantitative Comparisons of Factors Impacting Microbial Fuel Cell Performance. Environ. Sci. Technol. 2019, 53, 3977–3986. [Google Scholar] [CrossRef] [PubMed] [Green Version]
  36. Xochitl, D.B.; Sevda, S.; Vanbroekhoven, K.; Pant, D. The accurate use of impedance analysis for the study of microbial electrochemical systems. Chem. Soc. Rev. 2012, 41, 7228–7246. [Google Scholar] [CrossRef]
  37. Zhang, F.; Liu, J.; Ivanov, I.; Hatzell, M.C.; Yang, W.; Ahn, Y. Reference and counter electrode positions affect electrochemical characterization of bioanodes in different bioelectrochemical systems. Biotechnol. Bioeng. 2014, 111, 1931–1939. [Google Scholar] [CrossRef]
  38. Park, S.; Yoo, J.-S. Electrochemical impedance spectroscopy for better electrochemical measurements. Am. Chem. Soc. 2003, 75, 455A–461A. [Google Scholar]
  39. Fuentes-Albarrán, C.; Juárez, K.; Gamboa, S.; Tirado, A.; Alvarez-Gallegos, A. Improving the power density of a Geobacter consortium-based microbial fuel cell by incorporating a highly dispersed birnessite/C cathode. J. Chem. Technol. Biotechnol. 2020, 95, 3169–3178. [Google Scholar] [CrossRef]
  40. Bartha, R. Biotechnology of petroleum pollutant biodegradation. Microb. Ecol. 1986, 12, 155–172. [Google Scholar] [CrossRef]
  41. Shabir, G.; Afzal, M.; Anwar, F.; Tahseen, R.; Khalid, Z.M. Biodegradation of kerosene in soil by a mixed bacterial culture under different nutrient conditions. Int. Biodeterior. Biodegrad. 2008, 61, 161–166. [Google Scholar] [CrossRef]
  42. Logan, B.E. Microbial Fuel Cells; Wiley: New York, NY, USA, 2008. [Google Scholar] [CrossRef]
  43. Ma, S.B.; Ahn, K.Y.; Lee, E.S.; Oh, K.H.; Kim, K.B. Synthesis and characterization of manganese dioxide spontaneously coated on carbon nanotubes. Carbon 2007, 45, 375–382. [Google Scholar] [CrossRef]
  44. Karra, U.; Huang, G.; Umaz, R.; Tenaglier, C.; Wang, L.; Li, B. Stability characterization and modeling of robust distributed benthic microbial fuel cell (DBMFC) system. Bioresour. Technol. 2013, 144, 477–484. [Google Scholar] [CrossRef] [PubMed]
  45. Liu, B.; Weinstein, A.; Kolln, M.; Garrett, C.; Wang, L.; Bagtzoglou, A.; Karra, U.; Li, Y.; Li, B. Distributed multiple-anodes benthic microbial fuel cell as reliable power source for subsea sensors. J. Power Source 2015, 286, 210–216. [Google Scholar] [CrossRef]
  46. Salgado-Dávalos, V.; Osorio-Avilés, S.; Kamaraj, S.K.; Vega-Alvarado, L.; Juárez, K.; Silva-Martínez, S.; Alvarez-Gallegos, A. Sediment Microbial Fuel Cell Power Boosted by Natural Chitin Degradation and Oxygen Reduction Electrocatalysts. Clean-Soil Air Water 2021, 49, 200465. [Google Scholar] [CrossRef]
  47. Barbir, F. PEM Fuel Cells. Theory and Practice; Elsevier Academic Press: Burlington, MA, USA, 2005. [Google Scholar]
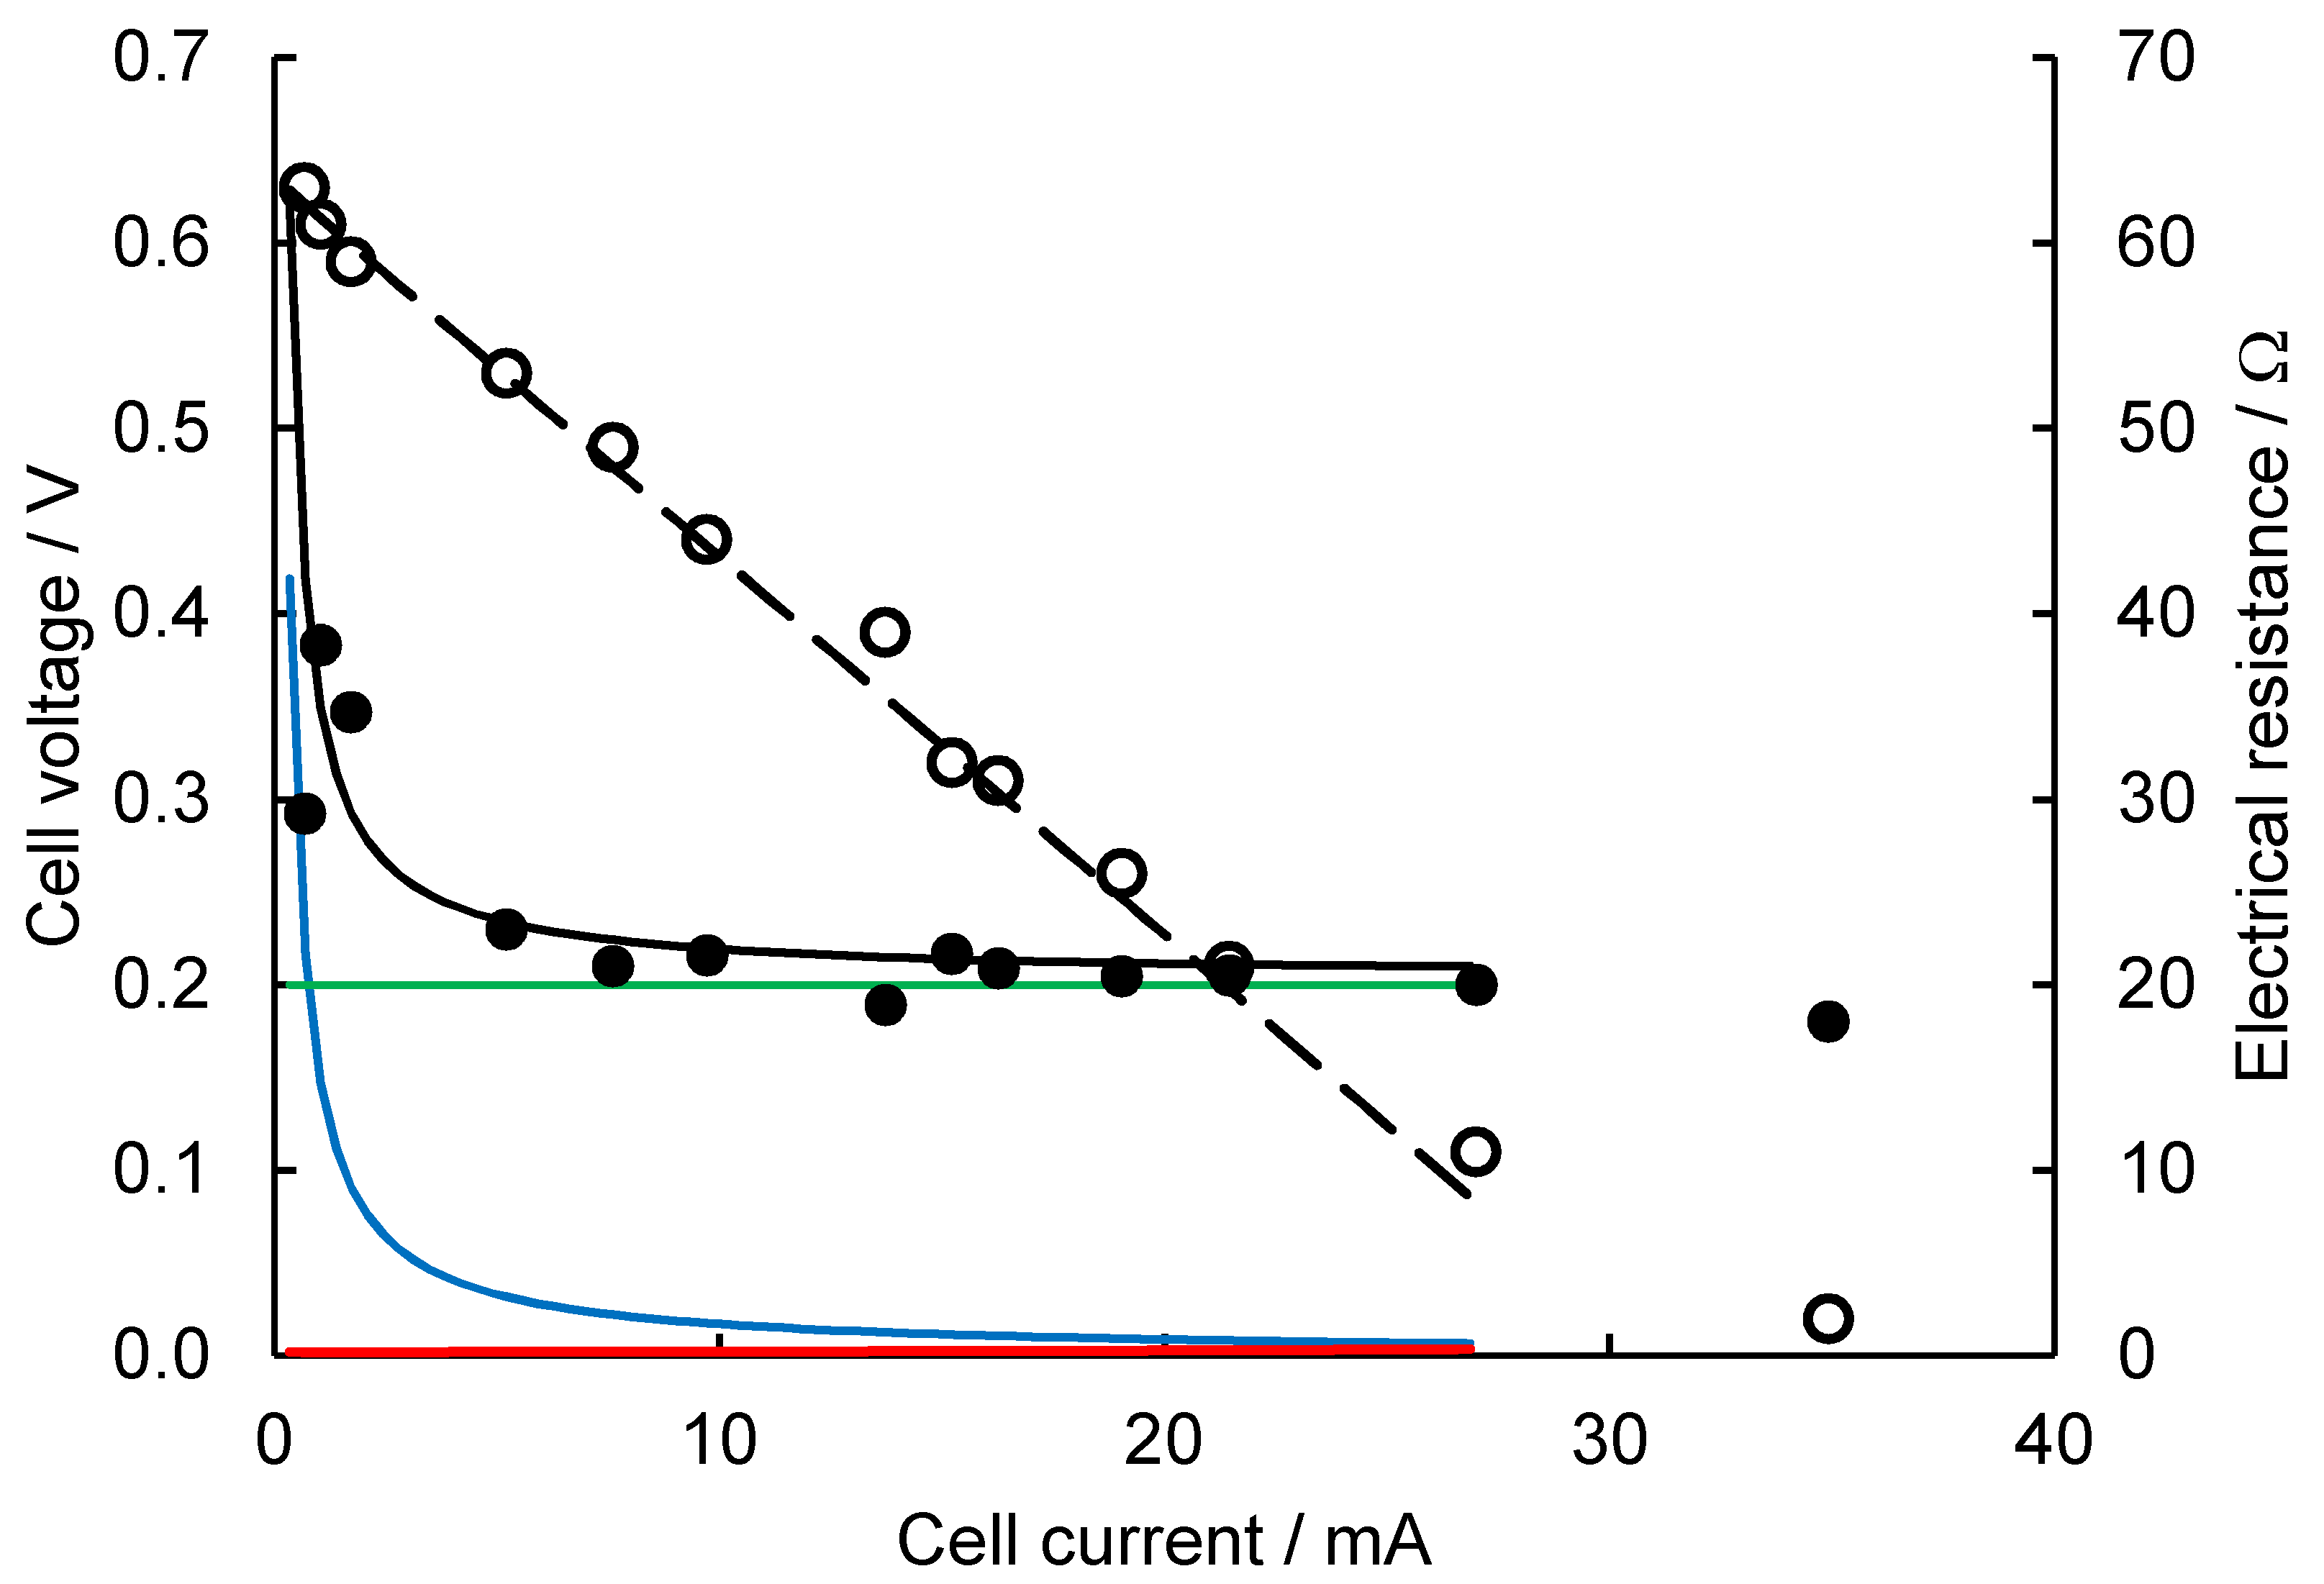
Figure 1. Polarization curve (ο) adapted from [27]. Predictions of polarization curve (dashed line), Ri (solid black line), Ract (solid blue line), Rconc (solid red line), and Rohmic (solid green line). Ri (•) evaluated from Equation (9).
Catalysts 12 00871 g001
Figure 2. Polarization curves at different pH values (from top to bottom: pH 2, pH 4, pH 6, and pH 8) of an SMFC; experimental data (•) and their corresponding predictions (solid black line). Anode: 2 pieces of CF; anolyte: PCS + 3 g of kerosene. Cathode: birnessite/CF; catholyte of 0.8 M Na2SO4.
Catalysts 12 00871 g002
Figure 3. Variation of SMFC resistances at pH 8: experimental Ri (•) and the predictions of Ri (solid line), Ract (dashed dotted line), Rconc (dashed line), and Rohmic (dotted line).
Catalysts 12 00871 g003
Figure 4. Variation of SMFC resistances at pH 6: experimental Ri (•) and the predictions of Ri (solid line), Ract (dashed dotted line), Rconc (dashed line), and Rohmic (dotted line).
Catalysts 12 00871 g004
Figure 5. Variation of SMFC resistances at pH 4: experimental Ri (•) and the predictions of Ri (solid line), Ract (dashed dotted line), Rconc (dashed line), and Rohmic (dotted line).
Catalysts 12 00871 g005
Figure 6. Variation of SMFC resistances at pH 2: experimental Ri (•) and the predictions of Ri (solid line), Ract (dashed dotted line), Rconc (dashed line) and Rohmic (dotted line).
Catalysts 12 00871 g006
Publisher’s Note: MDPI stays neutral with regard to jurisdictional claims in published maps and institutional affiliations.