Perspective

Analysis of the Ammonia Production Rates by Nitrogenase

Commonwealth Scientific and Industrial Research Office (CSIRO), Black Mountain, Canberra, ACT 2601, Australia
*
Author to whom correspondence should be addressed.
Catalysts 2022, 12(8), 844; https://doi.org/10.3390/catal12080844
Submission received: 24 June 2022 / Revised: 26 July 2022 / Accepted: 29 July 2022 / Published: 1 August 2022
(This article belongs to the Section Biocatalysis)

Abstract

:
Ammonia (NH3) is produced industrially by the Haber–Bosch process from dinitrogen (N2) and dihydrogen (H2) using high temperature and pressure with an iron catalyst. In contrast to the extreme conditions used in the Haber–Bosch process, biology has evolved nitrogenase enzymes, which operate at ambient temperature and pressure. In biological settings, nitrogenase requires large amounts of energy in the form of ATP, using at least 13 GJ ton−1 of ammonia. In 2016, Brown et al. reported ATP-free ammonia production by nitrogenase. This result led to optimism that the energy demands of nitrogenase could be reduced. More recent reports confirmed the ATP-free production of ammonia; however, the rates of reaction are at least an order of magnitude lower. A more detailed understanding of the role of ATP in nitrogenase catalysis is required to develop ATP-free catalytic systems with higher ammonia production rates. Finally, we calculated the theoretical maximal ammonia production rate by nitrogenase and compared it to currently used Haber–Bosch catalysts. Somewhat surprisingly, nitrogenase has a similar theoretical maximum rate to the Haber–Bosch catalysts; however, strategies need to be developed to allow the enzyme to maintain operation at its optimal rate.

1. Introduction

Nitrogen is an essential component of amino acids, one of the building blocks of biological life. While nitrogen is abundant in the atmosphere as dinitrogen (N2), this form of nitrogen is essentially inert due to the stability of the triple bond of N2. For N2 to become bio-available it must be either oxidised or reduced. The high temperatures of volcanos [1,2] and lightning strikes [3] are able to break the triple bond and oxidise N2 to nitrogen oxides. In addition to these abiotic processes, biology has evolved a family of bacterial enzymes, known as nitrogenases, which are able to reduce N2 to NH3 and are responsible for over 95% of non-anthropogenic nitrogen fixation [4,5].
In 1898, William Crookes, the President of the British Association for the Advancement of Science, highlighted the challenge of food supply in the face of an exponentially growing human population. Crookes outlined that nitrogen was the limiting nutrient for agricultural plant growth and called on chemists to address this limitation [6]. In 1906, Fritz Haber and Carl Bosch provided the solution. Using high temperature and pressure, with an iron-based catalyst, they developed an industrial process to produce ammonia from N2 and H2. The Haber–Bosch process has meant that we are able to meet the food demands of the population and it is estimated to be the most life-saving invention of the 20th century [7].
Whilst the Haber–Bosch process has served us well, the extreme process conditions and the energy required (28 GJ ton−1 of ammonia) mean that the Haber–Bosch process consumes 1% of the world’s annual energy output [8] and generates 1.9 tonnes of CO2 per tonne of NH3 produced, depending on the source of H2 used [9]. With the need to reduce our carbon emissions and develop sustainable industrial processes, attention has turned back to biology.
While nitrogenase enzymes operate at ambient temperature and pressure, biological ammonia production remains energy intensive, consuming 16 ATP molecules for every molecule of dinitrogen reduced (Equation (1)) requiring at least 13 GJ ton−1 of ammonia (assuming 28 kJ mol−1 produced by hydrolysis of ATP to ADP).
N2 + 8H+ + 16MgATP + 8e → 2NH3 + H2 + 16MgADP + 16Pi
In addition to ATP, nitrogenase requires eight electrons to reduce one molecule of N2 (Equation (1)). These electrons are supplied from either a flavodoxin or ferredoxin in vivo (Figure 1a) [10].
Nitrogenase is a two-component enzyme, made up of the reductase, known as the Fe-protein, and the catalytic component, named the MoFe-protein, after the metals it contains [11]. The transfer of a single electron requires the binding of two ATP molecules (Figure 1a). After electron transfer, the ATP hydrolyses to ADP and Pi. Finally, the bound ADP is released allowing the binding of a further two ATP molecules [12].

2. ATP-Free Ammonia Production

There was optimism when nitrogenase was reported to reduce N2 to NH3 without requiring ATP [13]. ATP-free catalysis was achieved by replacing the Fe-protein with a photoexcited cadmium sulphide nanocrystal to supply electrons and only the MoFe-protein was used (Figure 1b). Remarkably the rate of ammonia production by the CdS:nitrogenase biohybrid, reported by King and co-workers, was 63% of the rate catalysed using the natural systems with the Fe-protein and ATP (Table 1) with an ammonia production rate of 75 nmol NH3 nmol MoFe protein−1 min−1 [13].
Since this report in 2016, the field has recognised the importance of rigorous quantification of ammonia production. Up to this point, spectrophotometric detection such as the Beerthelot method had been utilised. In recent years, the use of highly purified 15N2 to produce 15NH3 detected by 1H NMR has become the “gold standard” as it avoids sample contamination from ambient ammonia. Ambient ammonia contamination has previously been observed to lead to artificially high production rates [14,15]. Using these stricter protocols for ammonia quantification, multiple research groups have now reported ATP-free ammonia production. The ammonia production rates, however, are an order of magnitude lower. It appears that a rate of 2–3 nmol NH3 nmol MoFe protein−1 min−1 is more realistic for ATP-free production (Table 1).
The lower rates of reaction using only the MoFe-protein were somewhat surprising, given that the rate-determining step is the dissociation between the Fe-protein and the MoFe-protein (Figure 1a) [16]. It was therefore assumed that this rate could be further increased when the Fe-protein in conjunction with ATP was not required. These latest reports raise important questions regarding the role of ATP in nitrogenase activity.

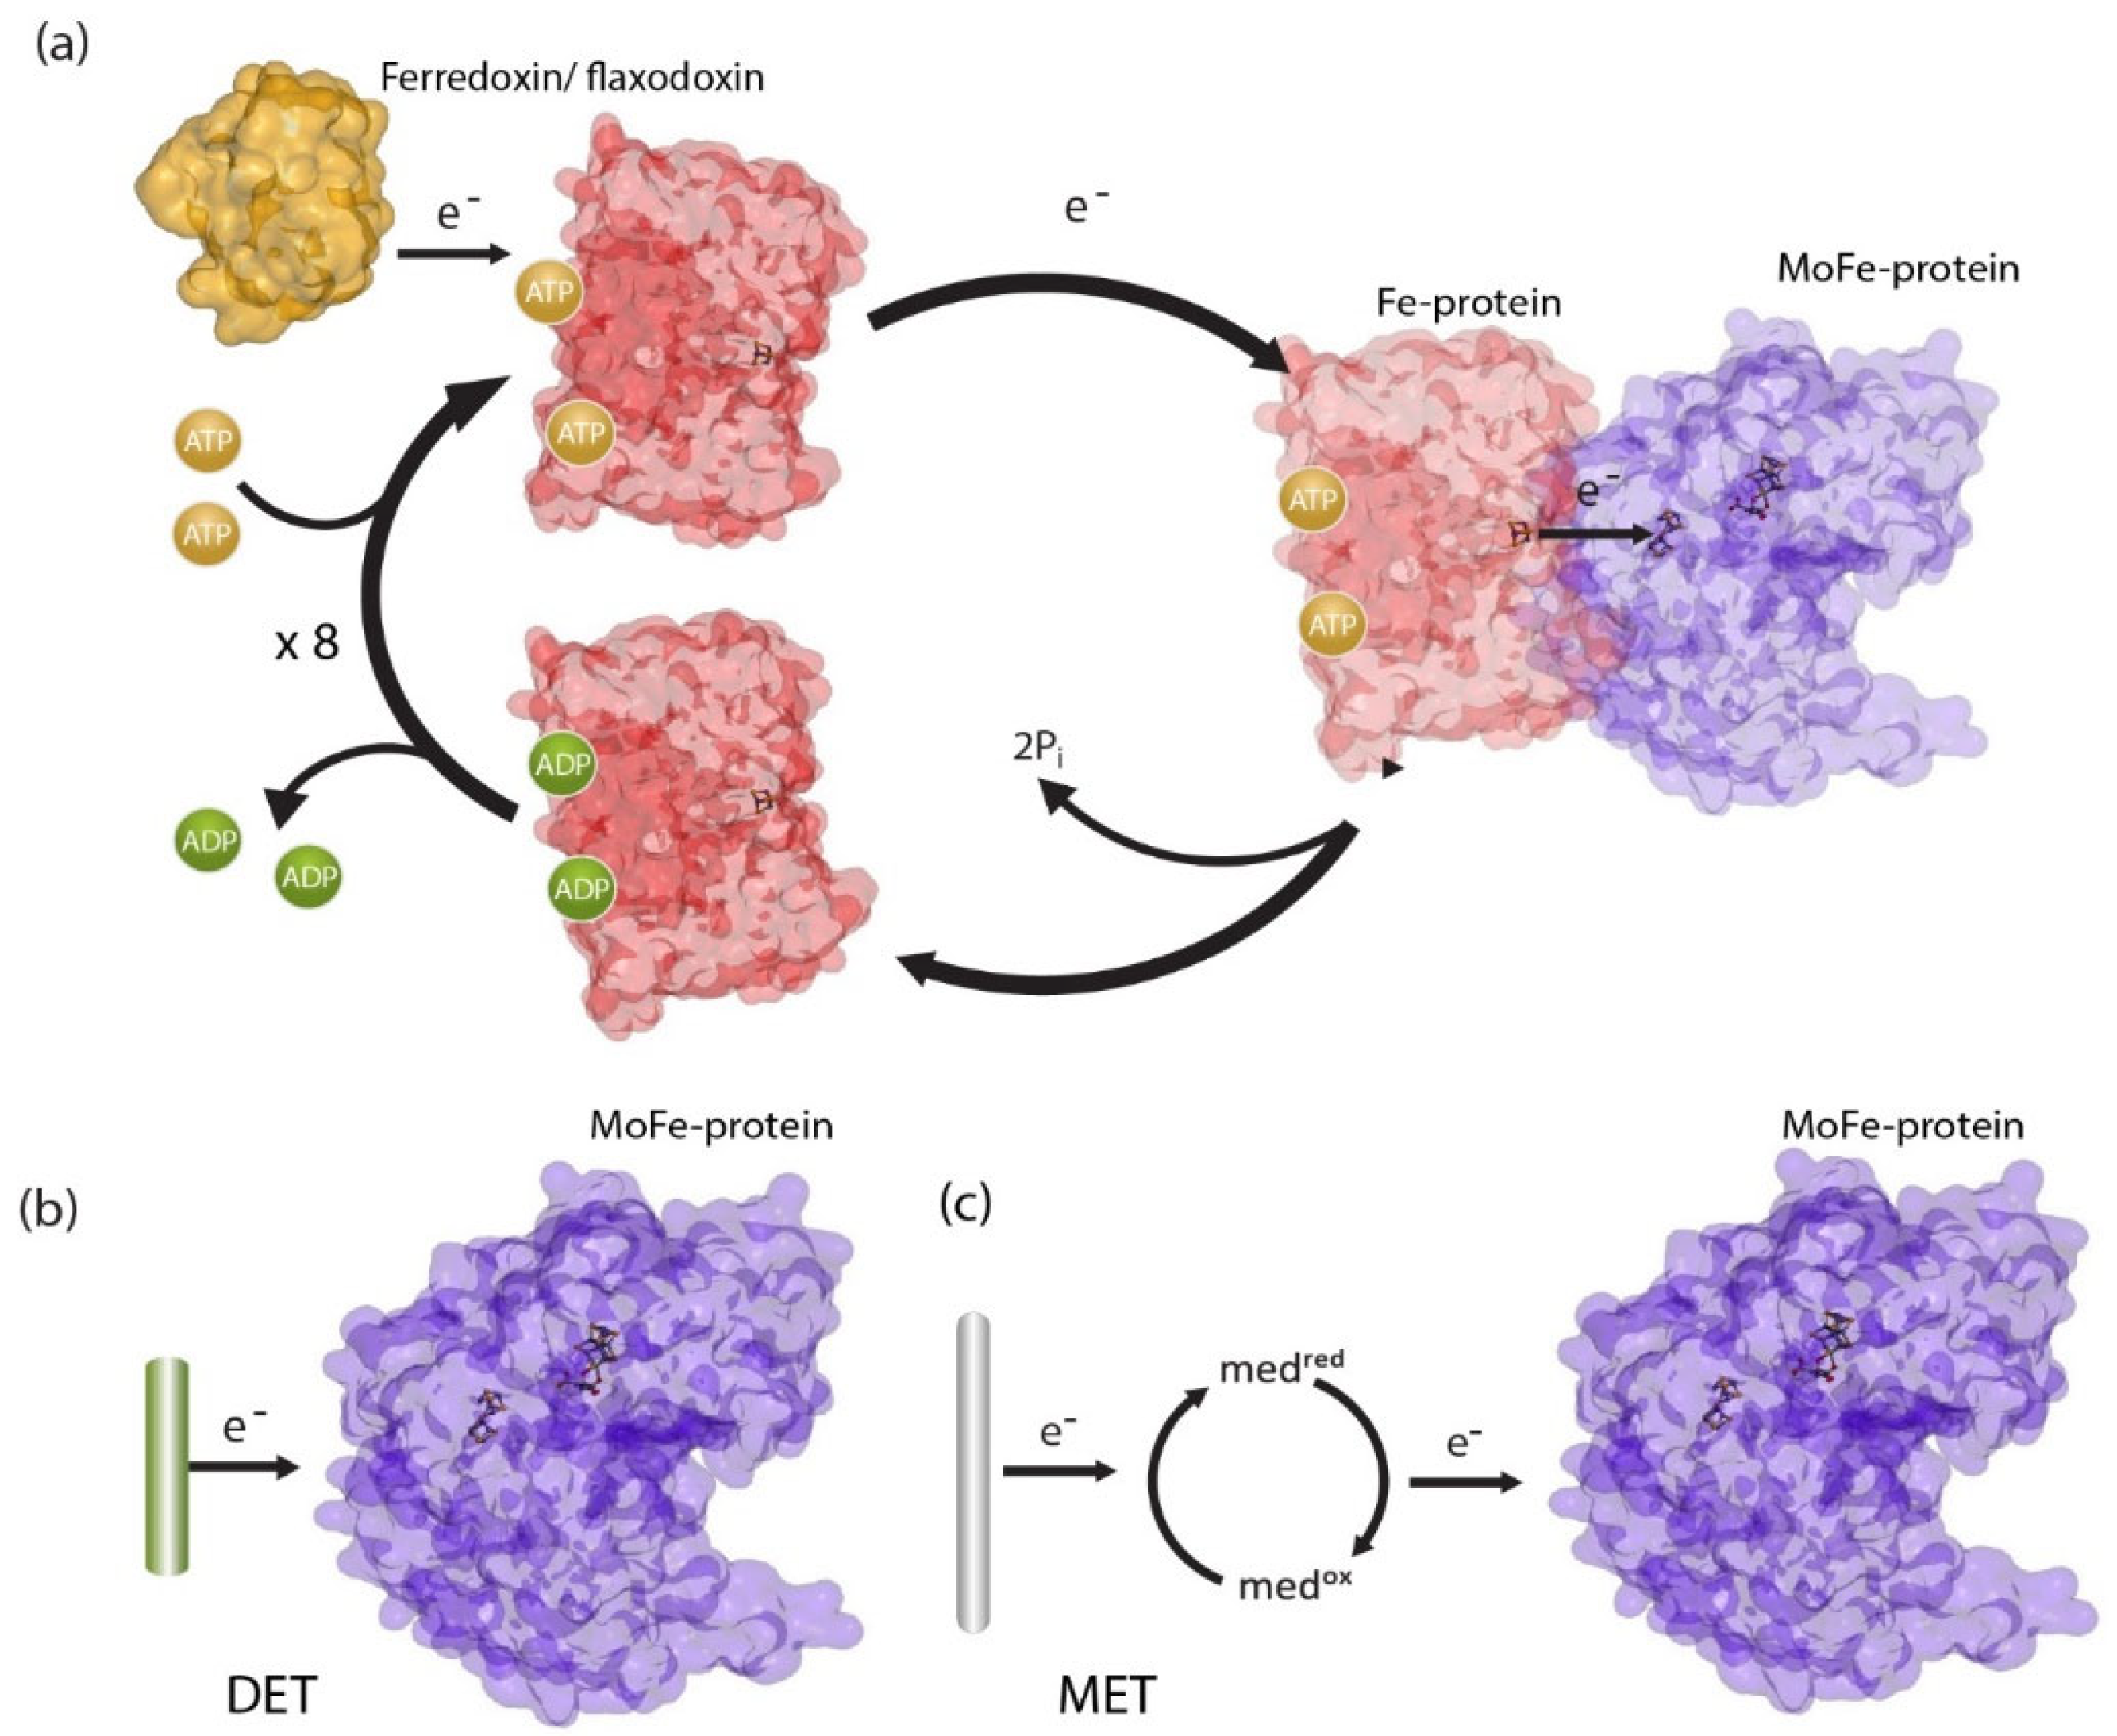
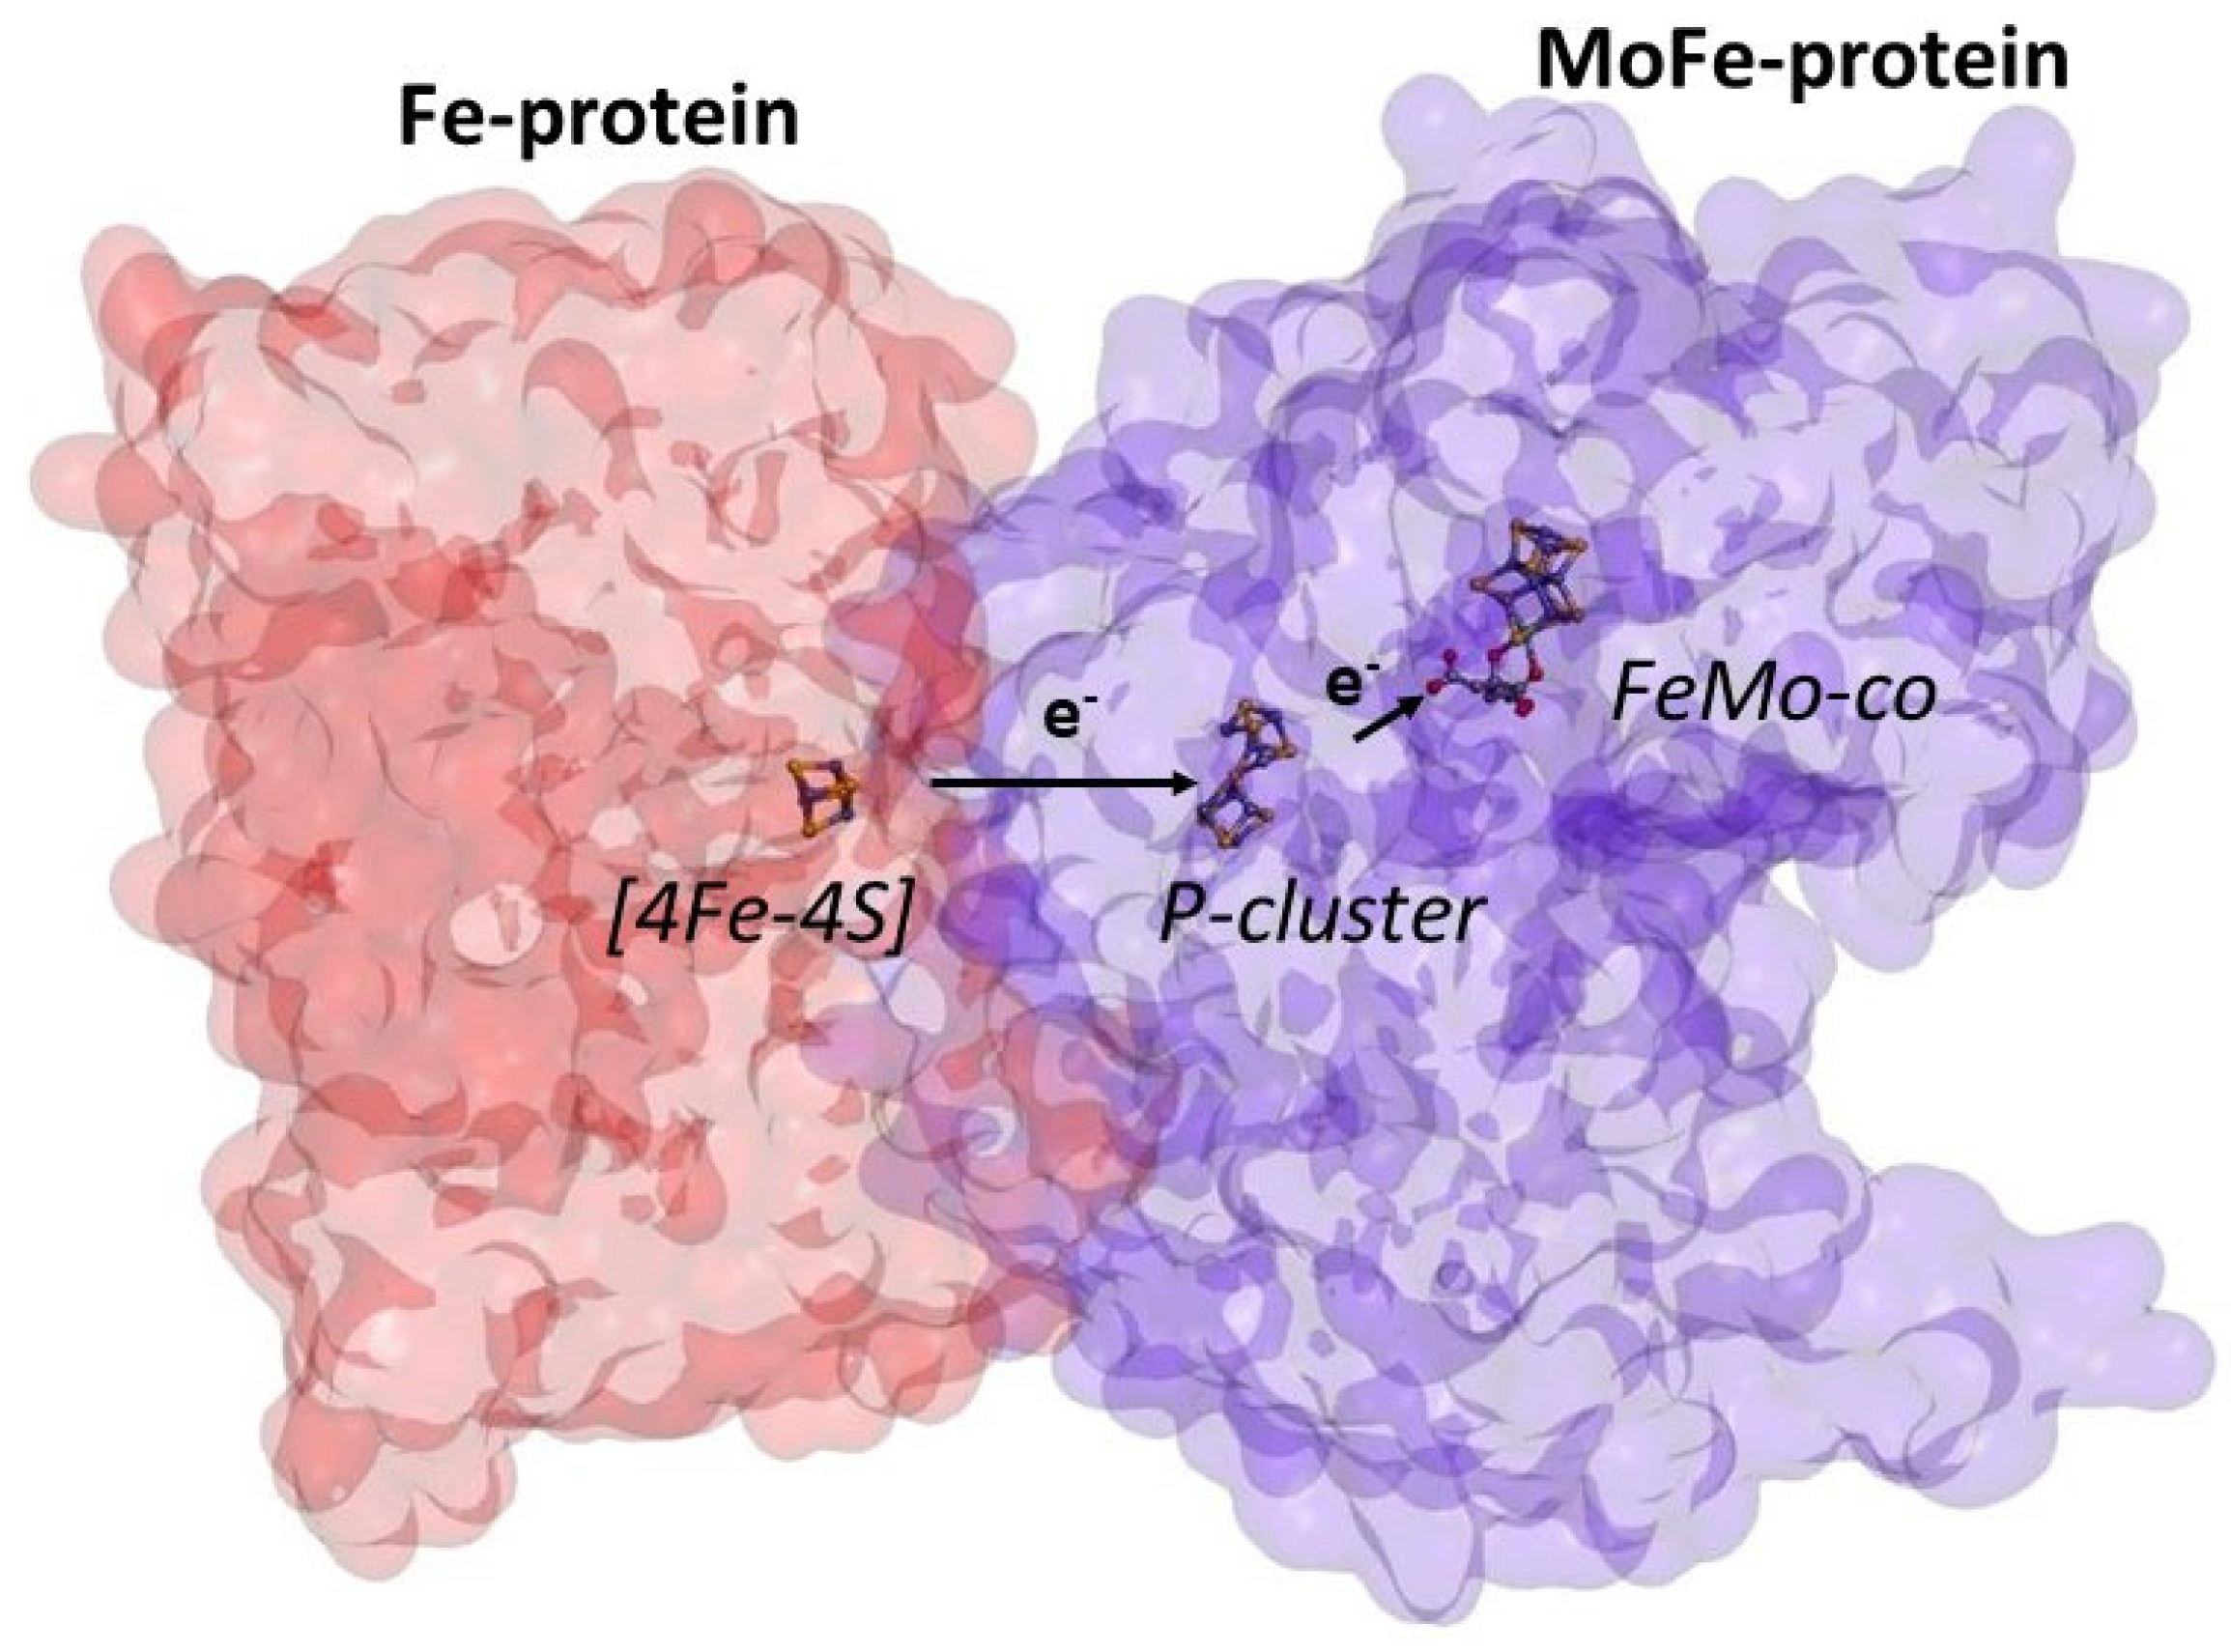
3. The Role of ATP in Nitrogenase Catalysis

To understand the role of ATP, some knowledge of nitrogenase structure is required. The reductase, the Fe-protein, has a single metal centre known as the [4Fe-4S] cluster (Figure 2). This is where electrons are held before they are transferred to the MoFe-protein. The MoFe-protein has two metal centres, the p-cluster and the active site known as the iron-molybdenum cofactor or FeMo-co (Figure 2). Electrons are transferred from the [4Fe-4S] cluster on the Fe-protein via the p-cluster to the FeMo-co where N2 is reduced [11].
The binding of ATP leads to pronounced conformational changes within the Fe-protein, which shifts the [4Fe-4S] cluster 5 Å towards the p-cluster on the MoFe-protein (Figure 3a) [23]. In contrast, the MoFe-protein conformation is essentially unchanged when a complex with the Fe-protein is formed (Figure 3a) [11].
In addition, the binding of ATP to the Fe-protein lowers the redox potential of the [4Fe-4S] cluster from −300 to −430 mV (Figure 3b) [24,25]. This makes the Fe-protein a stronger reductant favouring electron transfer from the Fe-protein to the p-cluster of the MoFe-protein.
There are, however, still many unanswered questions about the exact role of ATP in nitrogenase catalysis. One key question relates to how electron transfer is coupled to ATP hydrolysis, the stage during which the energy stored within ATP is released. Does ATP provide the extra energy required for electron transfer from the p-cluster to the FeMo-co? Whilst there is growing evidence that electron transfer from the Fe-protein to the p-cluster occurs before the hydrolysis of ATP [26] and that the release of the phosphate ion after the hydrolysis of ATP to ADP is the rate-limiting step [16], the matter is still unclear [10]. Recently, CryoEM structures of nitrogenase complexes have highlighted the asymmetry of both ATP hydrolysis and the interaction between the Fe-protein with the MoFe-protein. This asymmetry is likely to have important implications for the timing of electron transfer during catalysis and could control the rate at which electrons are transferred to the FeMo-co active site. This precise control allows nitrogenase to favour conditions for N2 reduction rather than the production of H2 [27].
ATP-free systems have been able to shed some fascinating insights into nitrogenase catalysis. For example, by immobilising the MoFe-protein on an electrode, Minteer and co-workers were able to probe the thermodynamic changes that take place with the binding of the Fe-protein. They observed that the binding of the Fe-protein to the MoFe-protein raises the redox potential of the FeMo-co from −590 to −390 mV (Figure 3b) [18]. For electron transfer to be thermodynamically feasible, electrons need to be transferred from a more negative potential to a less negative one [28]. The increase in the redox potential of the FeMo-co decreases the potential difference between the p-cluster and the FeMo-co to 160 mV (Figure 3b) and makes electron transfer more thermodynamically feasible. It is, however, still an endergonic process requiring extra energy [18].
Other insights that have been obtained from studying ATP-free nitrogenase systems include: the characterisation of the catalytic intermediates [29] and deepening our understanding of how the ratio of NH3:H2 produced can be optimised [22]. Furthermore, when only the MoFe-protein is used in cyclic voltammetry, the reduction of N2 has a slower rate of electron transfer compared to purely proton reduction producing H2 [18]. This is in contrast to the ATP-dependent catalysis with the Fe and MoFe-proteins where the rate of electron transfer was independent of whether ammonia or only hydrogen was being produced [30].

4. Calculating the Theoretical Maximal Rate of Ammonia Production by Nitrogenase in Comparison to the Haber–Bosch Process

To assess the commercial potential of nitrogenase, we decided to compare the maximal rate of nitrogenase with ATP, to the Haber–Bosch process. Typically, NH3 synthesis rates of these catalysts are expressed in units such as µmol g−1 h−1. The most commonly used industrial catalysts are iron-based with promoters such as Al2O3, Ca2+ and K+ added. The rate of these catalysts is around 10,000–32,000 µmol g−1 h−1 [31].
Interestingly, the native nitrogenase system operates at an ammonia production rate of 30,000 µmol g−1 h−1, the same order of magnitude as the Haber–Bosch process (calculations shown in Appendix A). This rate represents the theoretical limit of ammonia production that can be achieved using nitrogenase enzymes.
When comparing these results, there are a number of factors to keep in mind. The first relates to the nature of the catalysts being compared; industrial catalysts are solid-state catalysts and only the surface area is catalytically active. Therefore, a large proportion of the catalyst is inactive. By comparison, nitrogenase has two active sites within a large protein structure meaning that only ~0.3% of the mass of the enzyme is catalytically active.
A second key factor is that the rate of 30,000 µmol g−1 h−1 by purified enzymes is the maximum rate obtained in vitro using a large excess of a chemical reductant, for relatively short time periods (around 10 min) [32]. It is pertinent to highlight that when longer-term experiments have been carried out, the activity using redox mediators is notably lower, around 3 µmol g−1 h−1 [30,33]. Minteer and co-workers have noted that purified nitrogenase enzymes lose their activity when operated for a few days [34]. Therefore, strategies to stabilise nitrogenase need to be developed.
A good point to consider is how the cost of ammonia produced by nitrogenase would compare to the Haber–Bosch process. Although some proteins can be produced at costs as low as USD 10 kg−1 [35], nitrogenase is required to be purified under strict anaerobic conditions, meaning the predicted costs will be significantly higher. It is extremely unlikely that the cost of producing nitrogenase will be comparable to the Haber–Bosch catalysts. Furthermore, producing nitrogenase at a large scale will also be challenging. It is therefore likely that rather than being used to produce ammonia, nitrogenase enzymes could find their niche in producing higher-value products such as pharmaceuticals. The use of nitrogenase within an enzyme cascade to produce chiral amines has already been demonstrated at a laboratory scale [36]. In this system, nitrogenase converts N2 into NH3 in situ, which is used as the substrate of transaminases.

5. Avenues to Stabilise Nitrogenase

Immobilisation is one method that is often used to stabilise enzymes. The Minteer group has conducted extensive work on immobilising the MoFe-protein in hydrogels [17,18] and redox polymers [19,20]. The effect of immobilisation on the stability of the MoFe-protein has not been reported to date. When both the Fe-protein and MoFe-proteins are used, immobilisation is challenging due to the dynamic interaction required between the two components (Figure 1). For this reason, only the MoFe-protein has been successfully immobilised with low ammonia production rates (Table 1).
Another avenue to improve stability is to use enzymes from extremophiles that have evolved to be more thermally stable. All bioelectrochemistry of nitrogenase reported to date has used nitrogenases from Azotobacter vinelandii. There are many other nitrogenases from thermophilic bacteria and archaea that could have improved stability. One of the challenges in studying these nitrogenases is purifying the enzymes in sufficient quantity to test their activity and stability.
A final avenue gaining attention is to use whole bacteria rather than purified enzymes. Using either genetic engineering or inhibitors of glutamine synthase, NH3 produced can be excreted extracellularly [37]. There are a growing number of reports using electro-microbial biocatalysis to produce ammonia from dinitrogen [38,39,40,41]. An alternative option is to use H2 as the electron donor and energy source for a diazotroph. A good example of this approach is the use of Xanthobacter autrophicus, which is capable of fixing CO2 and N2 to produce ammonia [42]. Again, however, these bacterial systems have low ammonia production rates. A good summary of these rates is presented by Dong et al. [40].

6. Conclusions

This examination into the rates of ammonia production has revealed that while ATP-free catalysis is attractive, decreasing the energy requirement of nitrogenase. It comes with a pronounced effect on the efficiency of the enzyme to produce ammonia. On the basis of recent research, a deeper understanding of the role of ATP in nitrogenase catalysis is required to develop ATP-free systems with higher ammonia production rates. Finally, it is encouraging that nitrogenase theoretically can produce ammonia at rates comparable to that of the Haber–Bosch process. It is clear, however, that research needs to focus on how to keep nitrogenase operating at its maximal rate over relevant industrial time scales.

Author Contributions

T.D.R. writing—original draft preparation and editing, C.C.W. writing—review and editing. All authors have read and agreed to the published version of the manuscript.

Funding

This work was funded by the CSIRO Hydrogen Energy Systems Future Science Platform.

Acknowledgments

We thank Barnabas Gall for his assistance in preparing Figure 2 and Figure 3 and Jessica Bilyj for useful discussions and feedback while preparing the manuscript.

Conflicts of Interest

The authors declare no conflict of interest.

Appendix A

Rate of ammonia production by nitrogenase = 119 nmol NH3 nmol MoFe protein−1 min−1 Rate in µmole g−1 h−1 = ((119 mol NH3 mol MoFe protein−1 min−1 × 60 min h−1)/240,000 g) × 106 Molecular mass of the MoFe-protein is ~240,000 g mol−1.

References

  1. Mather, T.A.; Pyle, D.M.; Allen, A.G. Volcanic Source for Fixed Nitrogen in the Early Earth’s Atmosphere. Geology 2004, 32, 905–908. [Google Scholar] [CrossRef]
  2. Huebert, B.; Vitousek, P.; Sutton, J.; Elias, T.; Heath, J.; Coeppicus, S.; Howell, S.; Blomquist, B. Volcano Fixes Nitrogen into Plant-Available Forms. Biogeochemistry 1999, 47, 111–118. [Google Scholar] [CrossRef]
  3. Tuck, A.F. Production of Nitrogen Oxides by Lightning Discharges. Q. J. R. Meteorol. Soc. 1976, 102, 749–755. [Google Scholar] [CrossRef]
  4. Burris, R.H.; Wilson, P. Biological Nitrogen Fixation. Annu. Rev. Biochem. 1945, 14, 685–708. [Google Scholar] [CrossRef]
  5. Burns, R.C.; Bulen, W.A. ATP-Dependent Hydrogen Evolution by Cell-Free Preparations of Azotobacter Vinelandii. Biochim. Biophys. Acta 1965, 105, 437–445. [Google Scholar] [CrossRef]
  6. Crookes, W. Address of the President before the British Association for the Advancement of Science. Science 1898, 8, 561–575. [Google Scholar] [CrossRef] [Green Version]
  7. Yanes, J. The Lifesavers of Science. Available online: https://www.bbvaopenmind.com/en/science/leading-figures/the-lifesavers-of-science/ (accessed on 20 June 2022).
  8. Smith, C.; Hill, A.K.; Torrente-Murciano, L. Current and Future Role of Haber-Bosch Ammonia in a Carbon-Free Energy Landscape. Energy Environ. Sci. 2020, 13, 331–344. [Google Scholar] [CrossRef]
  9. Chen, J.G.; Crooks, R.M.; Seefeldt, L.C.; Bren, K.L.; Bullock, R.M.; Darensbourg, M.Y.; Holland, P.L.; Hoffman, B.; Janik, M.J.; Jones, A.K.; et al. Beyond Fossil Fuel–Driven Nitrogen Transformations. Science 2018, 360, eaar6611. [Google Scholar] [CrossRef] [Green Version]
  10. Rutledge, H.L.; Tezcan, F.A. Electron Transfer in Nitrogenase. Chem. Rev. 2020, 120, 5158–5193. [Google Scholar] [CrossRef]
  11. Einsle, O.; Rees, D.C. Structural Enzymology of Nitrogenase Enzymes. Chem. Rev. 2020, 120, 4969–5004. [Google Scholar] [CrossRef]
  12. Lanzilotta, W.N.; Seefeldt, L.C. Electron Transfer from the Nitrogenase Iron Protein to the [8Fe-(7/8)S] Clusters of the Molybdenum-Iron Protein. Biochemistry 1996, 35, 16770–16776. [Google Scholar] [CrossRef]
  13. Brown, K.A.; Harris, D.F.; Wilker, M.B.; Rasmussen, A.; Khadka, N.; Hamby, H.; Keable, S.; Dukovic, G.; Peters, J.W.; Seefeldt, L.C.; et al. Light-Driven Dinitrogen Reduction Catalyzed by a CdS:Nitrogenase MoFe Protein Biohybrid. Science 2016, 352, 448–450. [Google Scholar] [CrossRef]
  14. Hodgetts, R.Y.; Kiryutin, A.S.; Nichols, P.; Du, H.L.; Bakker, J.M.; MacFarlane, D.R.; Simonov, A.N. Refining Universal Procedures for Ammonium Quantification via Rapid 1H NMR Analysis for Dinitrogen Reduction Studies. ACS Energy Lett. 2020, 5, 736–741. [Google Scholar] [CrossRef]
  15. Andersen, S.Z.; Čolić, V.; Yang, S.; Schwalbe, J.A.; Nielander, A.C.; McEnaney, J.M.; Enemark-Rasmussen, K.; Baker, J.G.; Singh, A.R.; Rohr, B.A.; et al. A Rigorous Electrochemical Ammonia Synthesis Protocol with Quantitative Isotope Measurements. Nature 2019, 570, 504–508. [Google Scholar] [CrossRef] [Green Version]
  16. Yang, Z.-Y.; Ledbetter, R.; Shaw, S.; Pence, N.; Tokmina-Lukaszewska, M.; Eilers, B.; Guo, Q.; Pokhrel, N.; Cash, V.L.; Dean, D.R.; et al. Evidence That the Pi Release Event Is the Rate-Limiting Step in the Nitrogenase Catalytic Cycle. Biochemistry 2016, 55, 3625–3635. [Google Scholar] [CrossRef] [Green Version]
  17. Hickey, D.P.; Lim, K.; Cai, R.; Patterson, A.R.; Yuan, M.; Sahin, S.; Abdellaoui, S.; Minteer, S.D. Pyrene Hydrogel for Promoting Direct Bioelectrochemistry: ATP-Independent Electroenzymatic Reduction of N2. Chem. Sci. 2018, 9, 5172–5177. [Google Scholar] [CrossRef] [Green Version]
  18. Hickey, D.P.; Cai, R.; Yang, Z.Y.; Grunau, K.; Einsle, O.; Seefeldt, L.C.; Minteer, S.D. Establishing a Thermodynamic Landscape for the Active Site of Mo-Dependent Nitrogenase. J. Am. Chem. Soc. 2019, 141, 17150–17157. [Google Scholar] [CrossRef]
  19. Lee, Y.S.; Ruff, A.; Cai, R.; Lim, K.; Schuhmann, W.; Minteer, S.D. Electroenzymatic Nitrogen Fixation Using an Organic Redox Polymer-Immobilized MoFe Protein System. Angew. Chemie Int. Ed. 2020, 59, 16511–16516. [Google Scholar] [CrossRef]
  20. Lee, Y.S.; Yuan, M.; Cai, R.; Lim, K.; Minteer, S.D. Nitrogenase Bioelectrocatalysis: ATP-Independent Ammonia Production Using a Redox Polymer/MoFe Protein System. ACS Catal. 2020, 10, 6854–6861. [Google Scholar] [CrossRef]
  21. Meirovich, M.M.; Bachar, O.; Yehezkeli, O. Artificial, Photoinduced Activation of Nitrogenase Using Directed and Mediated Electron Transfer Processes. Catalysts 2020, 10, 979. [Google Scholar] [CrossRef]
  22. Brown, K.A.; Ruzicka, J.; Kallas, H.; Chica, B.; Mulder, D.W.; Peters, J.W.; Seefeldt, L.C.; Dukovic, G.; King, P.W. Excitation-Rate Determines Product Stoichiometry in Photochemical Ammonia Production by CdS Quantum Dot-Nitrogenase MoFe Protein Complexes. ACS Catal. 2020, 10, 11147–11152. [Google Scholar] [CrossRef]
  23. Tezcan, F.A.; Kaiser, J.T.; Mustafi, D.; Walton, M.Y.; Howard, J.B.; Rees, D.C. Nitrogenase Complexes: Multiple Docking Sites for a Nucleotide Switch Protein. Science 2005, 309, 1377–1380. [Google Scholar] [CrossRef] [Green Version]
  24. Lanzilotta, W.N.; Ryle, M.J.; Seefeldt, L.C. Nucleotide Hydrolysis and Protein Conformational Changes in Azotobacter Vinelandii Nitrogenase Iron Protein: Defining the Function of Aspartate 1291. Biochemistry 1995, 34, 10713–10723. [Google Scholar] [CrossRef]
  25. Watt, G.D.; Knotts, R.R.; Wang, Z.C. Redox Reactions of and Nucleotide Binding to the Iron Protein of Azotobacter Vinelandii. Biochemistry 1986, 25, 8156–8162. [Google Scholar] [CrossRef]
  26. Duval, S.; Danyal, K.; Shaw, S.; Lytle, A.K.; Dean, D.R.; Hoffman, B.M.; Antony, E.; Seefeldt, L.C. Electron Transfer Precedes ATP Hydrolysis during Nitrogenase Catalysis. Proc. Natl. Acad. Sci. USA 2013, 110, 16414–16419. [Google Scholar] [CrossRef] [Green Version]
  27. Rutledge, H.L.; Cook, B.D.; Nguyen, H.P.M.; Herzik, M.A.; Tezcan, A. CryoEM Structures of the Nitrogenase Complex during Catalytic Turnover. bioRxiv 2022, 1–8. [Google Scholar] [CrossRef]
  28. Gray, H.B.; Ellis, W.R. Electron Transfer. In Bioinorganic Chemistry; Bertini, I., Gray, H.B., Lippard, S.J., Valentine, J.S., Eds.; University Science Books: Sausalito, CA, USA, 1994; pp. 315–363. [Google Scholar]
  29. Chica, B.; Ruzicka, J.; Kallas, H.; Mulder, D.W.; Katherine, A.; Peters, J.W.; Seefeldt, L.C.; Dukovic, G.; King, P.W.; Chica, B.; et al. Defining Intermediates of Nitrogenase MoFe Protein during N Reduction under Photochemical Electron Delivery from CdS Quantum Dots Defining Intermediates of Nitrogenase MoFe Protein During N2 Reduction under Photochemical Electron Delivery from CdS Quantum dots. J. Am. Chem. Soc. 2020, 142, 14324–14330. [Google Scholar] [CrossRef]
  30. Badalyan, A.; Yang, Z.Y.; Seefeldt, L.C. A Voltammetric Study of Nitrogenase Catalysis Using Electron Transfer Mediators. ACS Catal. 2019, 9, 1366–1372. [Google Scholar] [CrossRef]
  31. Humphreys, J.; Lan, R.; Tao, S. Development and Recent Progress on Ammonia Synthesis Catalysts for Haber–Bosch Process. Adv. Energy Sustain. Res. 2021, 2, 2000043. [Google Scholar] [CrossRef]
  32. Newton, W.E.; Dilworth, M.J. Assays of Nitrogenase Reaction Products. Methods Mol. Biol. 2011, 766, 105–127. [Google Scholar] [CrossRef]
  33. Milton, R.D.; Cai, R.; Abdellaoui, S.; Leech, D.; De Lacey, A.L.; Pita, M.; Minteer, S.D. Bioelectrochemical Haber–Bosch Process: An Ammonia-Producing H2/N2 Fuel Cell. Angew. Chem. Int. Ed. 2017, 56, 2680–2683. [Google Scholar] [CrossRef] [PubMed]
  34. Cai, R.; Minteer, S.D. Nitrogenase Bioelectrocatalysis: From Understanding Electron-Transfer Mechanisms to Energy Applications. ACS Energy Lett. 2018, 3, 2736–2742. [Google Scholar] [CrossRef]
  35. Puetz, J.; Wurm, F.M. Recombinant Proteins for Industrial versus Pharmaceutical Purposes: A Review of Process and Pricing. Processes 2019, 7, 476. [Google Scholar] [CrossRef] [Green Version]
  36. Chen, H.; Prater, M.B.; Cai, R.; Dong, F.; Chen, H.; Minteer, S.D. Bioelectrocatalytic Conversion from N2 to Chiral Amino Acids in a H2/α-Keto Acid Enzymatic Fuel Cell. J. Am. Chem. Soc. 2020, 142, 4028–4036. [Google Scholar] [CrossRef]
  37. Mus, F.; Khokhani, D.; MacIntyre, A.M.; Rugoli, E.; Dixon, R.; Ané, J.-M.; Peters, J.W. Genetic Determinants of Ammonium Excretion in NifL Mutants of Azotobacter Vinelandii. Appl. Environ. Microbiol. 2022, 88, e01876-21. [Google Scholar] [CrossRef]
  38. Leddy, J.; Paschkewitz, T.M. Ammonia Production Using Bioelectrocatalytical Devices. U.S. Patent No. US2014/0011252 AI, 9 January 2016. [Google Scholar]
  39. Knoche, K.L.; Aoyama, E.; Hasan, K.; Minteer, S.D. Role of Nitrogenase and Ferredoxin in the Mechanism of Bioelectrocatalytic Nitrogen Fixation by the Cyanobacteria Anabaena Variabilis SA-1 Mutant Immobilized on Indium Tin Oxide (ITO) Electrodes. Electrochim. Acta 2017, 232, 396–403. [Google Scholar] [CrossRef]
  40. Dong, F.; Lee, Y.S.; Gaffney, E.M.; Liou, W.; Minteer, S.D. Engineering Cyanobacterium with Transmembrane Electron Transfer Ability for Bioelectrochemical Nitrogen Fixation. ACS Catal. 2021, 11, 13169–13179. [Google Scholar] [CrossRef]
  41. Dong, F.; Lee, Y.S.; Gaffney, E.M.; Grattieri, M.; Haddadin, H.; Minteer, S.D.; Chen, H. An Engineered, Non-Diazotrophic Cyanobacterium and Its Application in Bioelectrochemical Nitrogen Fixation. Cell Rep. Phys. Sci. 2021, 2, 100444. [Google Scholar] [CrossRef]
  42. Liu, C.; Sakimoto, K.K.; Colón, B.C.; Silver, P.A.; Nocera, D.G. Ambient Nitrogen Reduction Cycle Using a Hybrid Inorganic–Biological System. Proc. Natl. Acad. Sci. USA 2017, 114, 6450–6455. [Google Scholar] [CrossRef] [Green Version]
Figure 1. Methods of electron transfer to the Mo-Fe protein: (a) Biological electron transfer from a ferredoxin or flavodoxin to the Fe-protein. The Fe-protein provides a single electron to the MoFe-protein and requires the binding of two ATP molecules before an encounter complex with the MoFe-protein can form. Eight electrons are required to convert one molecule of N2 to two molecules of NH3; therefore, this process must occur eight times, meaning that 16 molecules of ATP are required. (b) ATP-free nitrogenase catalysis through Direct Electron Transfer (DET) using either a photoexcited nanoparticle (light driven) or a modified electrode to provide electrons directly to the MoFe-protein. (c) ATP-free nitrogenase catalysis through Mediated Electron Transfer (MET), whereby a mediator is used to shuttle electrons from an electrode to the MoFe-protein.
Catalysts 12 00844 g001
Figure 2. The structure of nitrogenase highlighting the [4Fe-4S] cluster on the Fe-protein, the p-cluster and the FeMo-co on the MoFe-protein. Electrons are transferred from the [4Fe-4S] cluster of the Fe-protein to the FeMo-co via the p-cluster.
Catalysts 12 00844 g002
Figure 3. Structural and thermodynamic changes with ATP binding: (a) Changes in the position of the [4Fe-4S] in the Fe-protein with the binding of ATP. The surface of the MoFe-protein is shown. For simplicity, the surface of the Fe-protein is not shown. Red metal centres: without ATP bound. Blue metal centres: with ATP bound. With the binding of ATP, the [4Fe-4S] cluster on the Fe-protein become 5 Å closer to the p-cluster on the MoFe-protein. No change is observed in the position of the p-cluster or FeMo-co on the MoFe-protein. Figure produced by superimposing PDB structures: 2AFH and 1G21. (b) Changes in the redox potential of metal clusters without ATP (red) and with ATP binding (blue). Black solid arrows indicate the pathway of electrons while dashed grey arrows indicate changes in the redox potential of the metal centres. The [4Fe-4S] cluster becomes more negative (from −300 to −430 mV). The FeMo-co redox couple becomes more positive (from −590 to −390 mV) with ATP and Fe-protein binding. No change is noted in the redox potential of the p-cluster. Redox potentials determined by Minteer and co-workers [18].
Catalysts 12 00844 g003
Table 1. Rate comparison for ammonia production by ATP-free and Fe-protein-free systems using only the MoFe-protein.
Nitrogenase SystemMethod
of Reduction
Method
of Quantification
NH3 Production
Rate a
Ref.
MoFe-protein + Fe-protein + ATPChemicalSpectrophotometric119[13]
MoFe-protein + CdS nanorodLight drivenSpectrophotometric75[13]
MoFe-protein in pyrene hydrogelDET aSpectrophotometric0.5[17]
MoFe-protein in pyrene hydrogelDET bSpectrophotometric + 15N20.13[18]
MoFe-protein in an organic redox polymerMET cSpectrophotometric + 15N23.3[19]
MoFe-protein in a redox polymerMET bSpectrophotometric + 15N22.3[20]
MoFe-protein + CdSLight drivenSpectrophotometric0.3[21]
MoFe-protein + CdS quantum dotsLight driven15N23.5[22]
a nmol NH3 nmol MoFe protein−1 min−1 b Direct Electron Transfer (DET) c Mediated Electron Transfer (MET).
Publisher’s Note: MDPI stays neutral with regard to jurisdictional claims in published maps and institutional affiliations.

