Article

Experimental Investigation and Modeling of the Sulfur Dioxide Abatement of Photocatalytic Mortar Containing Construction Wastes Pre-Treated by Nano TiO2

School of Civil Engineering, Guangzhou University, Guangzhou 510006, China
*
Author to whom correspondence should be addressed.
Catalysts 2022, 12(7), 708; https://doi.org/10.3390/catal12070708
Submission received: 16 May 2022 / Revised: 22 June 2022 / Accepted: 27 June 2022 / Published: 28 June 2022

Abstract

:
A photocatalytic mortar containing recycled clay brick powder (RCBP), recycled fine aggregate (RFA), recycled glass (RG), and nanoscale titanium dioxide (NT) was fabricated to degrade low-concentration sulfur dioxide. Instead of intermixing or dip-coating, NT was firstly loaded onto the surface of carriers (RFA and RG) using a soaking method to prepare composite photocatalysts (CPs) denoted as NT@RFA and NT@RG. The prepared CPs can both take full advantage of the intrinsic characteristics of construction wastes, namely, the high porosity and alkalinity of RFA and the light-transmitting property of RG, and can significantly reduce the cost of using NT. RG in high dosage potentially triggers alkali–silica reaction (ASR) in cement-based materials, which affects the durability of the prepared mortar. RCBP, another typical construction waste sourced from crushed clay bricks, was proven to be a pozzolan similar to grade II fly ash. The combined use of RCBP and RG in photocatalytic mortar is expected to simultaneously improve durable performance and further raise the upper content limit of construction wastes. Results exhibit that 70% cement plus 30% RCBP as cementitious material can sufficiently control ASR to an acceptable level. The filling effect and the pozzolanic reaction caused by RCBP result in a decline in porosity and lessened alkalinity, which decreases sulfur dioxide removal. The paper uses both response surface methodology (RSM) and an artificial neural network (ANN) to model photocatalytic efficiency with various initial concentrations and flow rates and finds the ANN to have a better fitting and prediction performance.

1. Introduction

The world faces serious environmental problems which are mainly embodied by solid waste accumulation and air pollution. The construction and demolition wastes (C&DW) that generate billions of tons each year consitute a considerable proportion of solid waste. Recycled concrete (RCs) and recycled clay bricks (RCBs) are two main compositions of C&DWs in China due to the fact that old buildings that have been demolished are mostly composed of a brick–concrete structure [1]. Those RCs are traditionally landfilled, exerting a heavy burden on the environment. Some researchers have attempted to crush and sieve RCs into recycled concrete aggregates (RCA) for the preparation of new concrete [2,3,4] and think of new approaches to raise the added value of RCAs, particularly recycled fine aggregates (RFA) that have a grading size of less than 5 mm. Relative to natural fine aggregates, RFAs have two main features of high porosity [5] and high alkalinity [6,7]. The former is attributed to micro cracks brought about by the mechanical crushing process; whilst the latter originates from calcium hydroxide [Ca(OH)2] that exists in the old mortar attached to the surface of virgin aggregates. Starting with the above two distinguishing features, the high added value of RFA can be obtained by the combined use of photocatalytic technology, which is always blamed for high costs.
Photocatalysis refers to a phenomenon in which the photocatalyst, which is in a general N-type semiconductor such as nanoscale titanium dioxide (TiO2) (NT) under the irradiation of ultraviolet (UV) light, triggers a photocatalytic effect that degrades pollutant materials. It was reported that an anodic TiO2 nanotube layer with a large area can be used for photocatalysis in the gaseous phase [8]. The entire process is light-driven and thus is environmentally friendly. The photon flux affects the kinetic process; whilst a lifted irradiance boosts the efficiency of photocatalysts [9]. The principle of photocatalysis is to use light to excite compound semiconductors such as titanium dioxide and to use their electrons and holes to participate in oxidation–reduction reactions. When light with energy greater than or equal to the energy gap irradiates semiconductor nanoparticles, the electrons in the valence band will be excited to transition to the conduction band, leaving relatively stable holes in the valence band, thus forming electron hole pairs. Because there are many defects and dangling bonds in nano materials, these defects and dangling bonds can capture electrons or holes and prevent the recombination of electrons and holes. These trapped electrons and holes diffuse to the surface of the particles, respectively, resulting in a strong redox potential. The superoxide anion and the hydroxyl radical are predominant species that trigger the synergistic effect between TiO2 photocatalysis and dye photosensitization [10]. Once RFAs are endowed with high added value through combination with NT, the high production cost of RFAs can be offset, and the large-scale reuse of RFAs can be realized.
Previous studies widely researched cementitious-materials-based photocatalytic mortar (PCM) containing NT and proved a myriad of value-added functions including air-purification, self-cleaning [11,12], and antialgae fouling [13]. A key limit of the traditional intermixing method, however, is the waste of photocatalysts. Attributing to the covering effect and the agglomeration effect, the content of NT in most cases is about 3–5 wt.% of cementitious materials to realize evident photocatalytic performance [14]. On the contrary, the combined use of RFA and NT in the form of a composite photocatalyst (NT@RFA) is a step further towards maximizing the value of both NT and the carrier of RFA. It was reported that an increased nitrogen oxides (NOx) removal was realized when the NT was loaded onto the porous carrier [15,16,17,18]. The alkaline medium was also proven to coordinate with photocatalysts in boosting the degradation of acidic pollutant gases such as sulfur dioxide (SO2) [19]. The above forms the theoretical basis for the upcycling of RFAs. Here, upcycling means that the value extracted from recycled wastes (RFAs) is improved through recycling. The added value of NT@RFA is comprehensively gained from the beneficial properties of the NT-induced photocatalytic activity and the RFA augmented effect.
Recycled glass (RG) was also used as a carrier to load NT; whilst the prepared composite photocatalyst (NT@RG) was verified to promote photocatalytic activity due to its light-transmitting property [20,21]. That research, however, only studied the photocatalytic performance of NT@RG alone rather than that of photocatalytic mortar using NT@RG as an aggregate. A huge gap evidently exists within the above two research objects. This study to some degree fills the gap. The combined use of NT@RFA and NT@RG as aggregates in photocatalytic mortar is quite interesting and meaningful. On one hand, the NT@RFA with a porous structure is of high water absorption and crushing index. It leads the end product (photocatalytic mortar) to have deteriorated properties, such as a reduced compressive strength, an increased drying shrinkage, and an increased water absorption. On the other hand, the near-zero porosity of NT@RG endows it with a higher hardness relative to NT@RFA and a better dimensional stability when the system is losing water. NT@RG is thus expected to compensate for the defects of NT@RFA and make extra light penetrate into deep pores of NT@RFA via its light-transmitting property.
The use of NT@RG as aggregate potentially triggers alkali–silica reaction (ASR). A principal countermeasure is to use pozzolanic materials to control that reaction. The use of pozzolanic materials at the same time can also save the use of cement and abate carbon dioxide emission. Apart from traditional pozzolanic materials such as fly ash and furnace slag, many researchers have tried to find new materials that are more adaptable to the local situation. For example, it was reported that marine clay can be utilized with high added value as a supplementary binding material in manufacturing sustainable concrete products [22,23]. Recycled fine aggregates and recycled glass powder can be co-used in concrete production, which reduces the total carbon dioxide emission by about 19% [24,25]. Incinerated sewage sludge ash sourced from the incineration of sewage sludge could be used with lime to produce building materials that are eco-friendly [26]. By investigating the incineration bottom ash sourced from municipal solid wastes, the constituents of ceramic and glass were proven to be of a similar efficiency strength index to fly ash and ground-granulated blast-furnace slag [
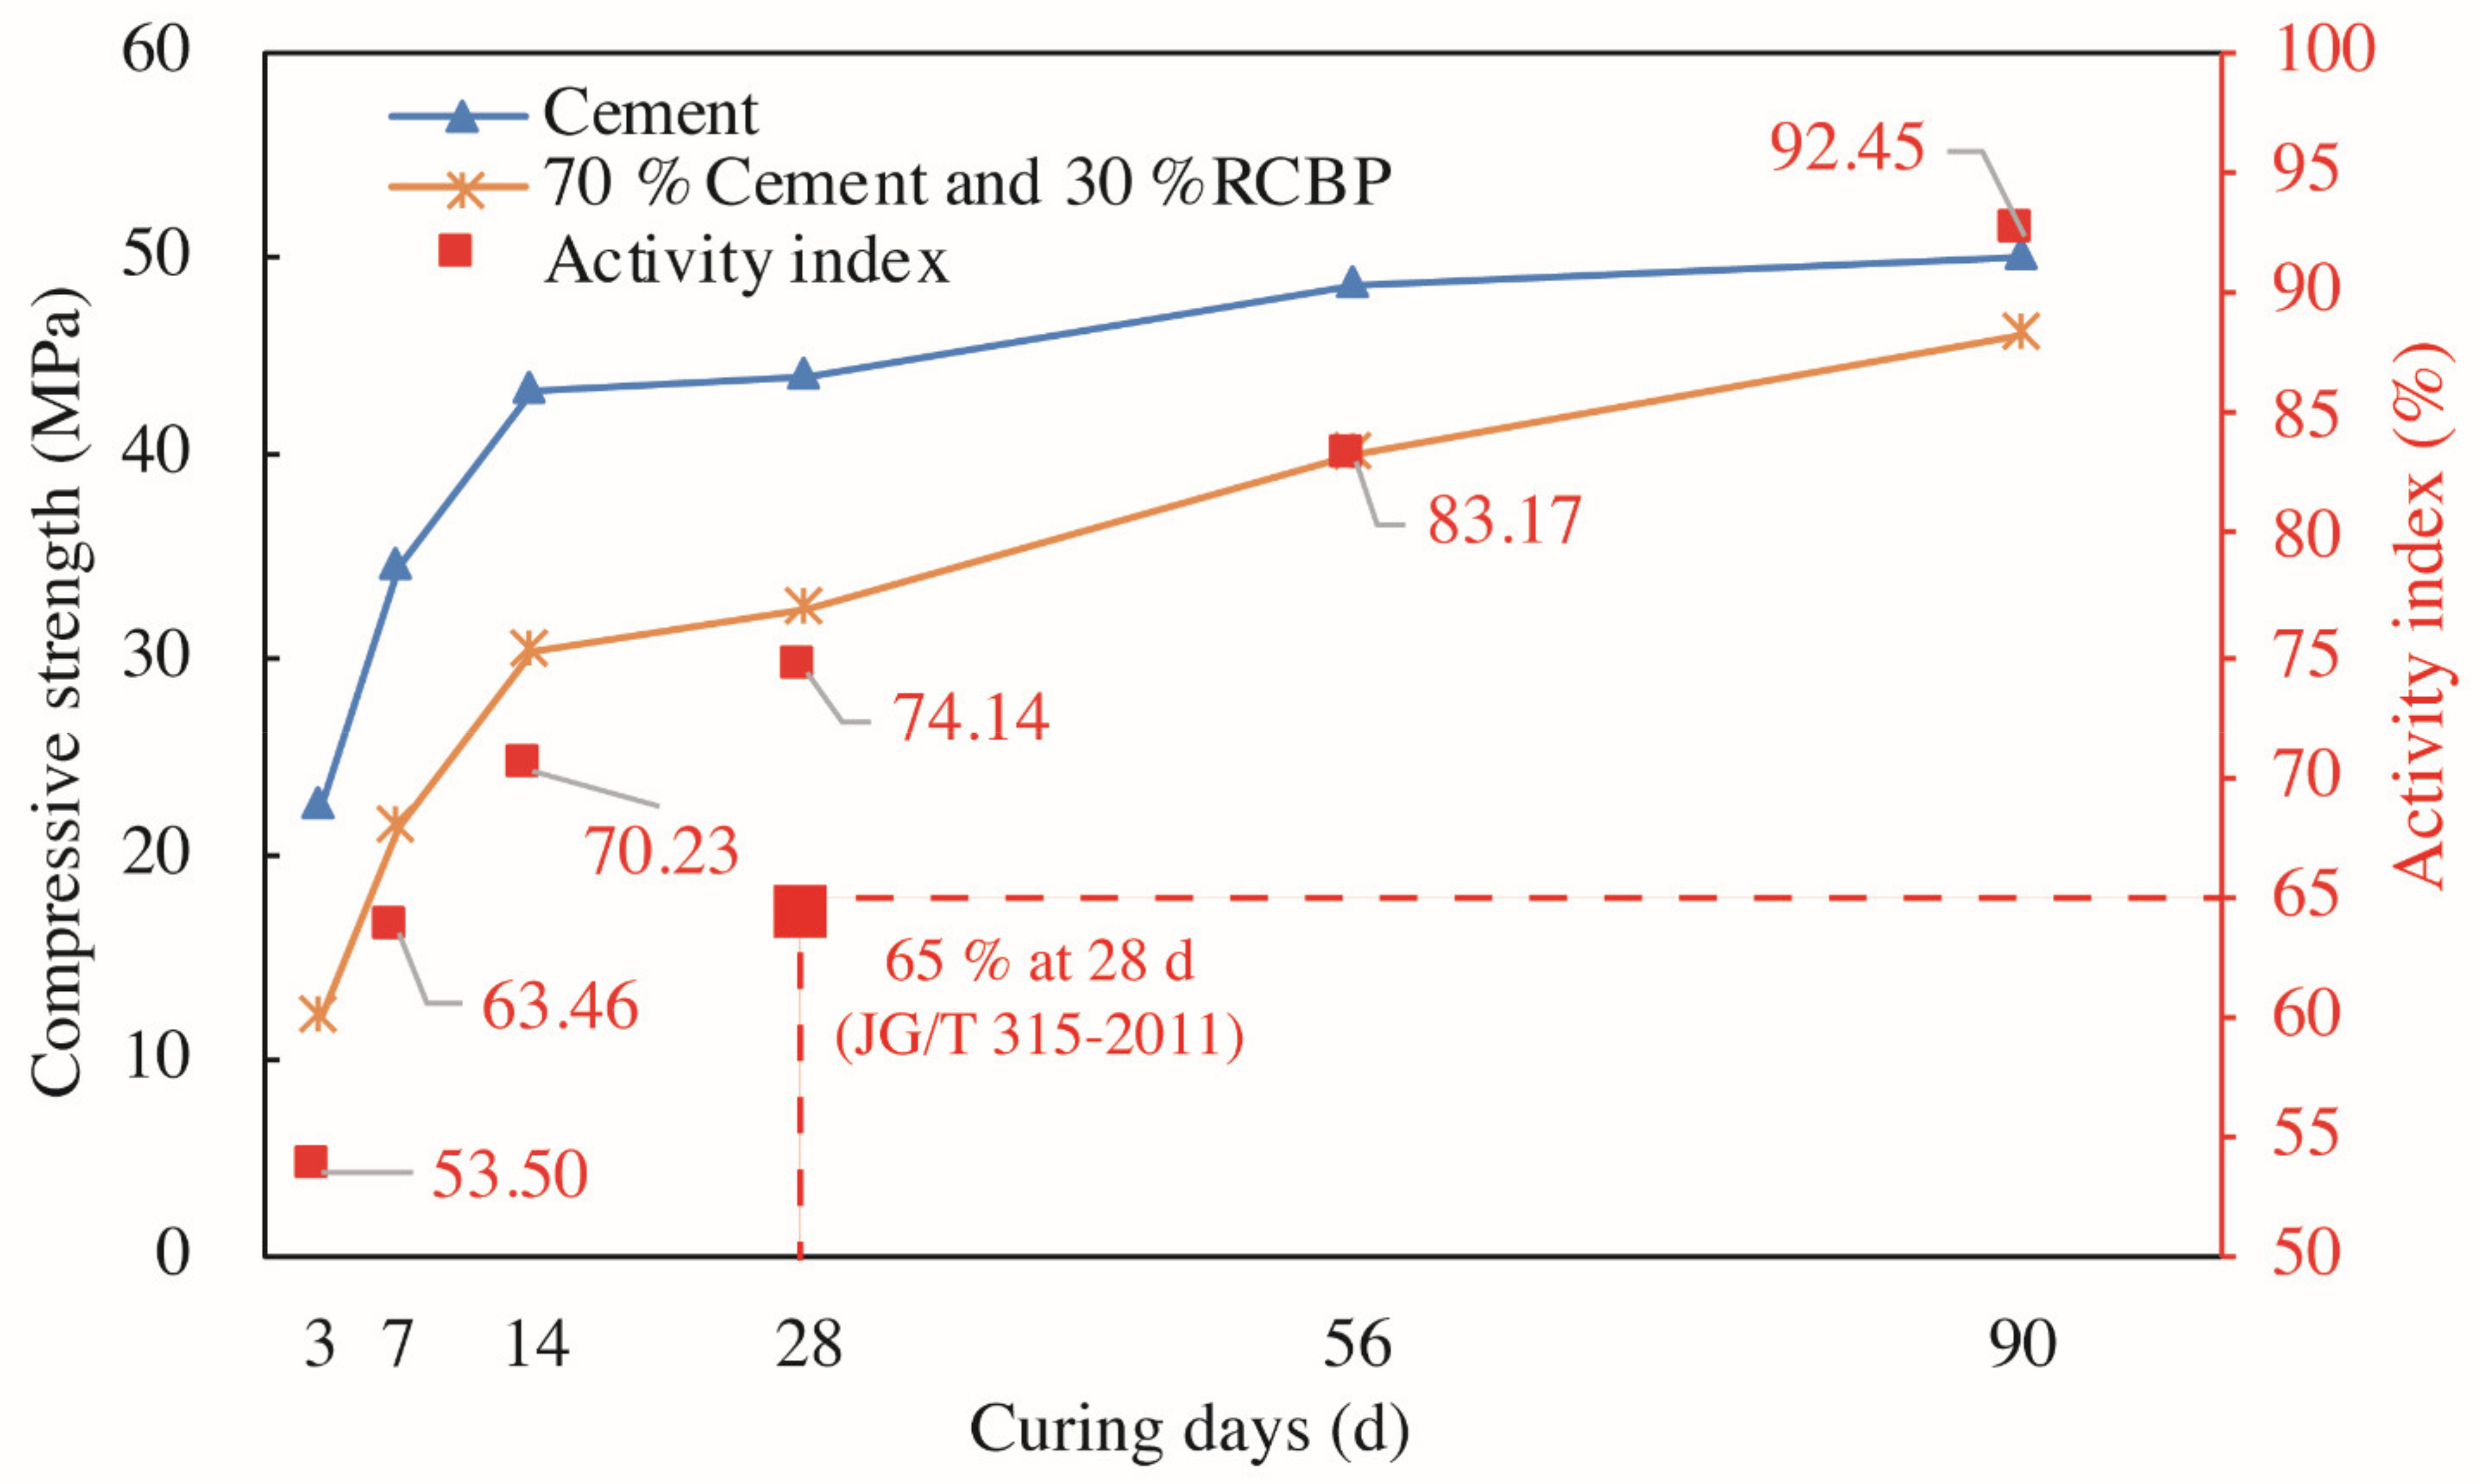
27]. Those mineral admixtures, attributing to the filling effect and the pozzolanic activity, can both save the use of cement and promote properties of the final product. The above cases, however, are not applicable to Shenzhen, a rising modern megacity of China, because Shenzhen possesses no heat-engine plants or steel works locally. Transporting those byproducts evidently causes extra costs and thus the use of fly ash is costly. By contrast, the fact that many buildings have been demolished provides Shenzhen with a tremendous amount of recycled clay brick powder (RCBP) [25]. Reusing RCBP in building materials such as photocatalytic mortars is therefore significant, especially considering the practical situation of Shenzhen, namely, its large-scale urban renewal and extreme shortage of natural resources.
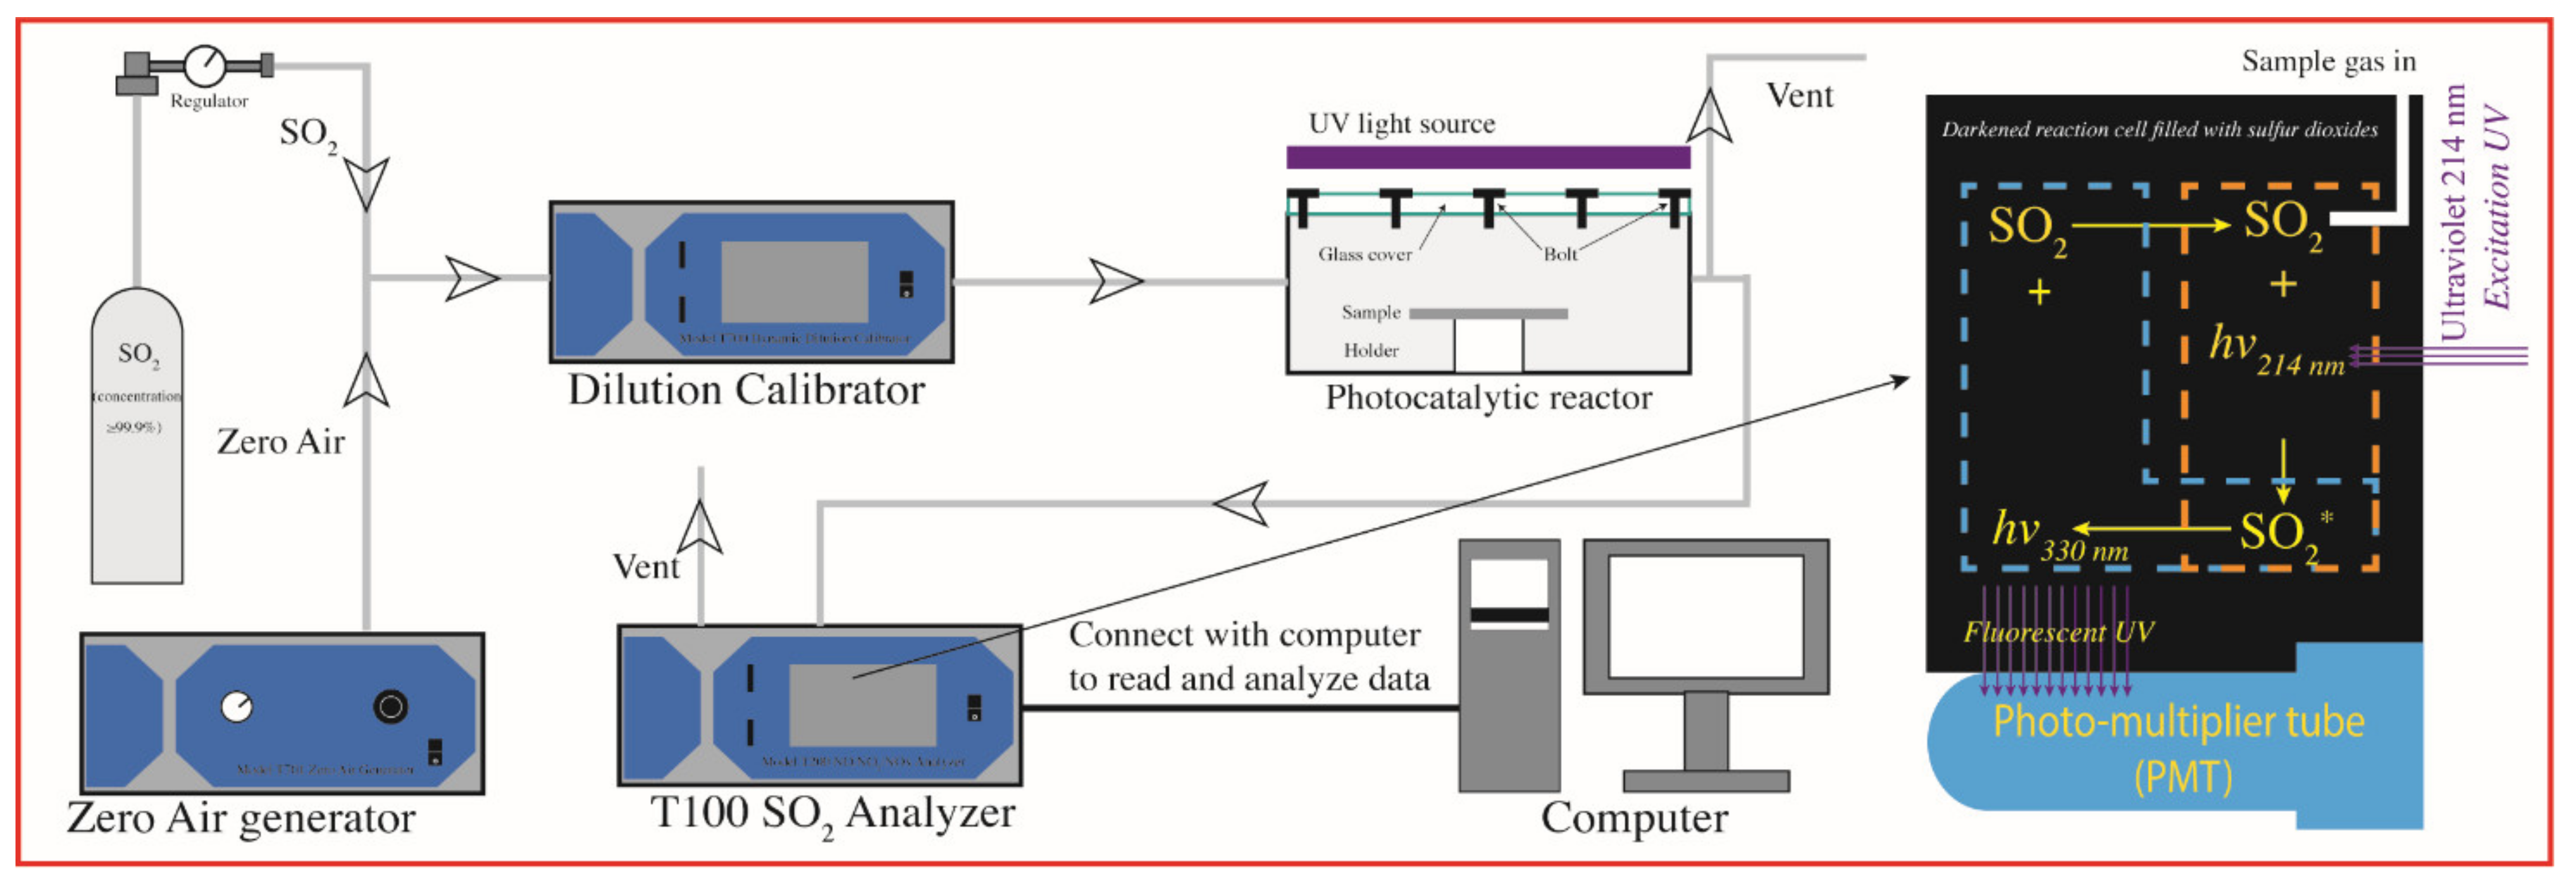
Besides the problem of solid waste accumulation, air pollution is also a difficult problem confronted by many developing countries including China. Photocatalytic technology is generally regarded as a potential efficient approach to solving this problem, especially when the technology is combined with cement-based materials such as mortar. Most of the previous studies related to photocatalytic degradation focused on NOx removal. Sulfur dioxide (SO2), another typical composition of haze, is less studied. The control of SO2 emissions, however, has been a crucial goal of China’s in the previous 20 years [28]. This is because SO2 produced by coal-fired power plants contributes to acid rain and affects climate patterns. Its high atmospheric level in China, relating to the country’s reliance on coal power, has caused significant infrastructural and environmental damage. Relative to the traditional flue-gas desulfurization, photocatalytic mortar can degrade SO2 that has already been discharged into the atmosphere.
The novelty of this study is the use of prepared composite photocatalysts (NT@RG and NT@RFA) as aggregates in photocatalytic mortar. It realizes the upcycling of RFA and RG. The high alkalinity of NT@RFA is relied on to boost SO2 removal. The NT@RG, via its near-zero water absorption, compensates for defects (e.g., poor dimensional stability) of the mortar containing NT@RFA. The NT@RG is also targeted to introduce some external light into deep pores of the NT@RFA because of its light-transmitting property. A typical local resource (RCBP) is also developed and researched for its potential use in controlling ASR associated with NT@RG. Furthermore, the response surface methodology (RSM) and an artificial neural network (ANN), which are considered as two excellent models to optimize issues relating to multi-influence factors [
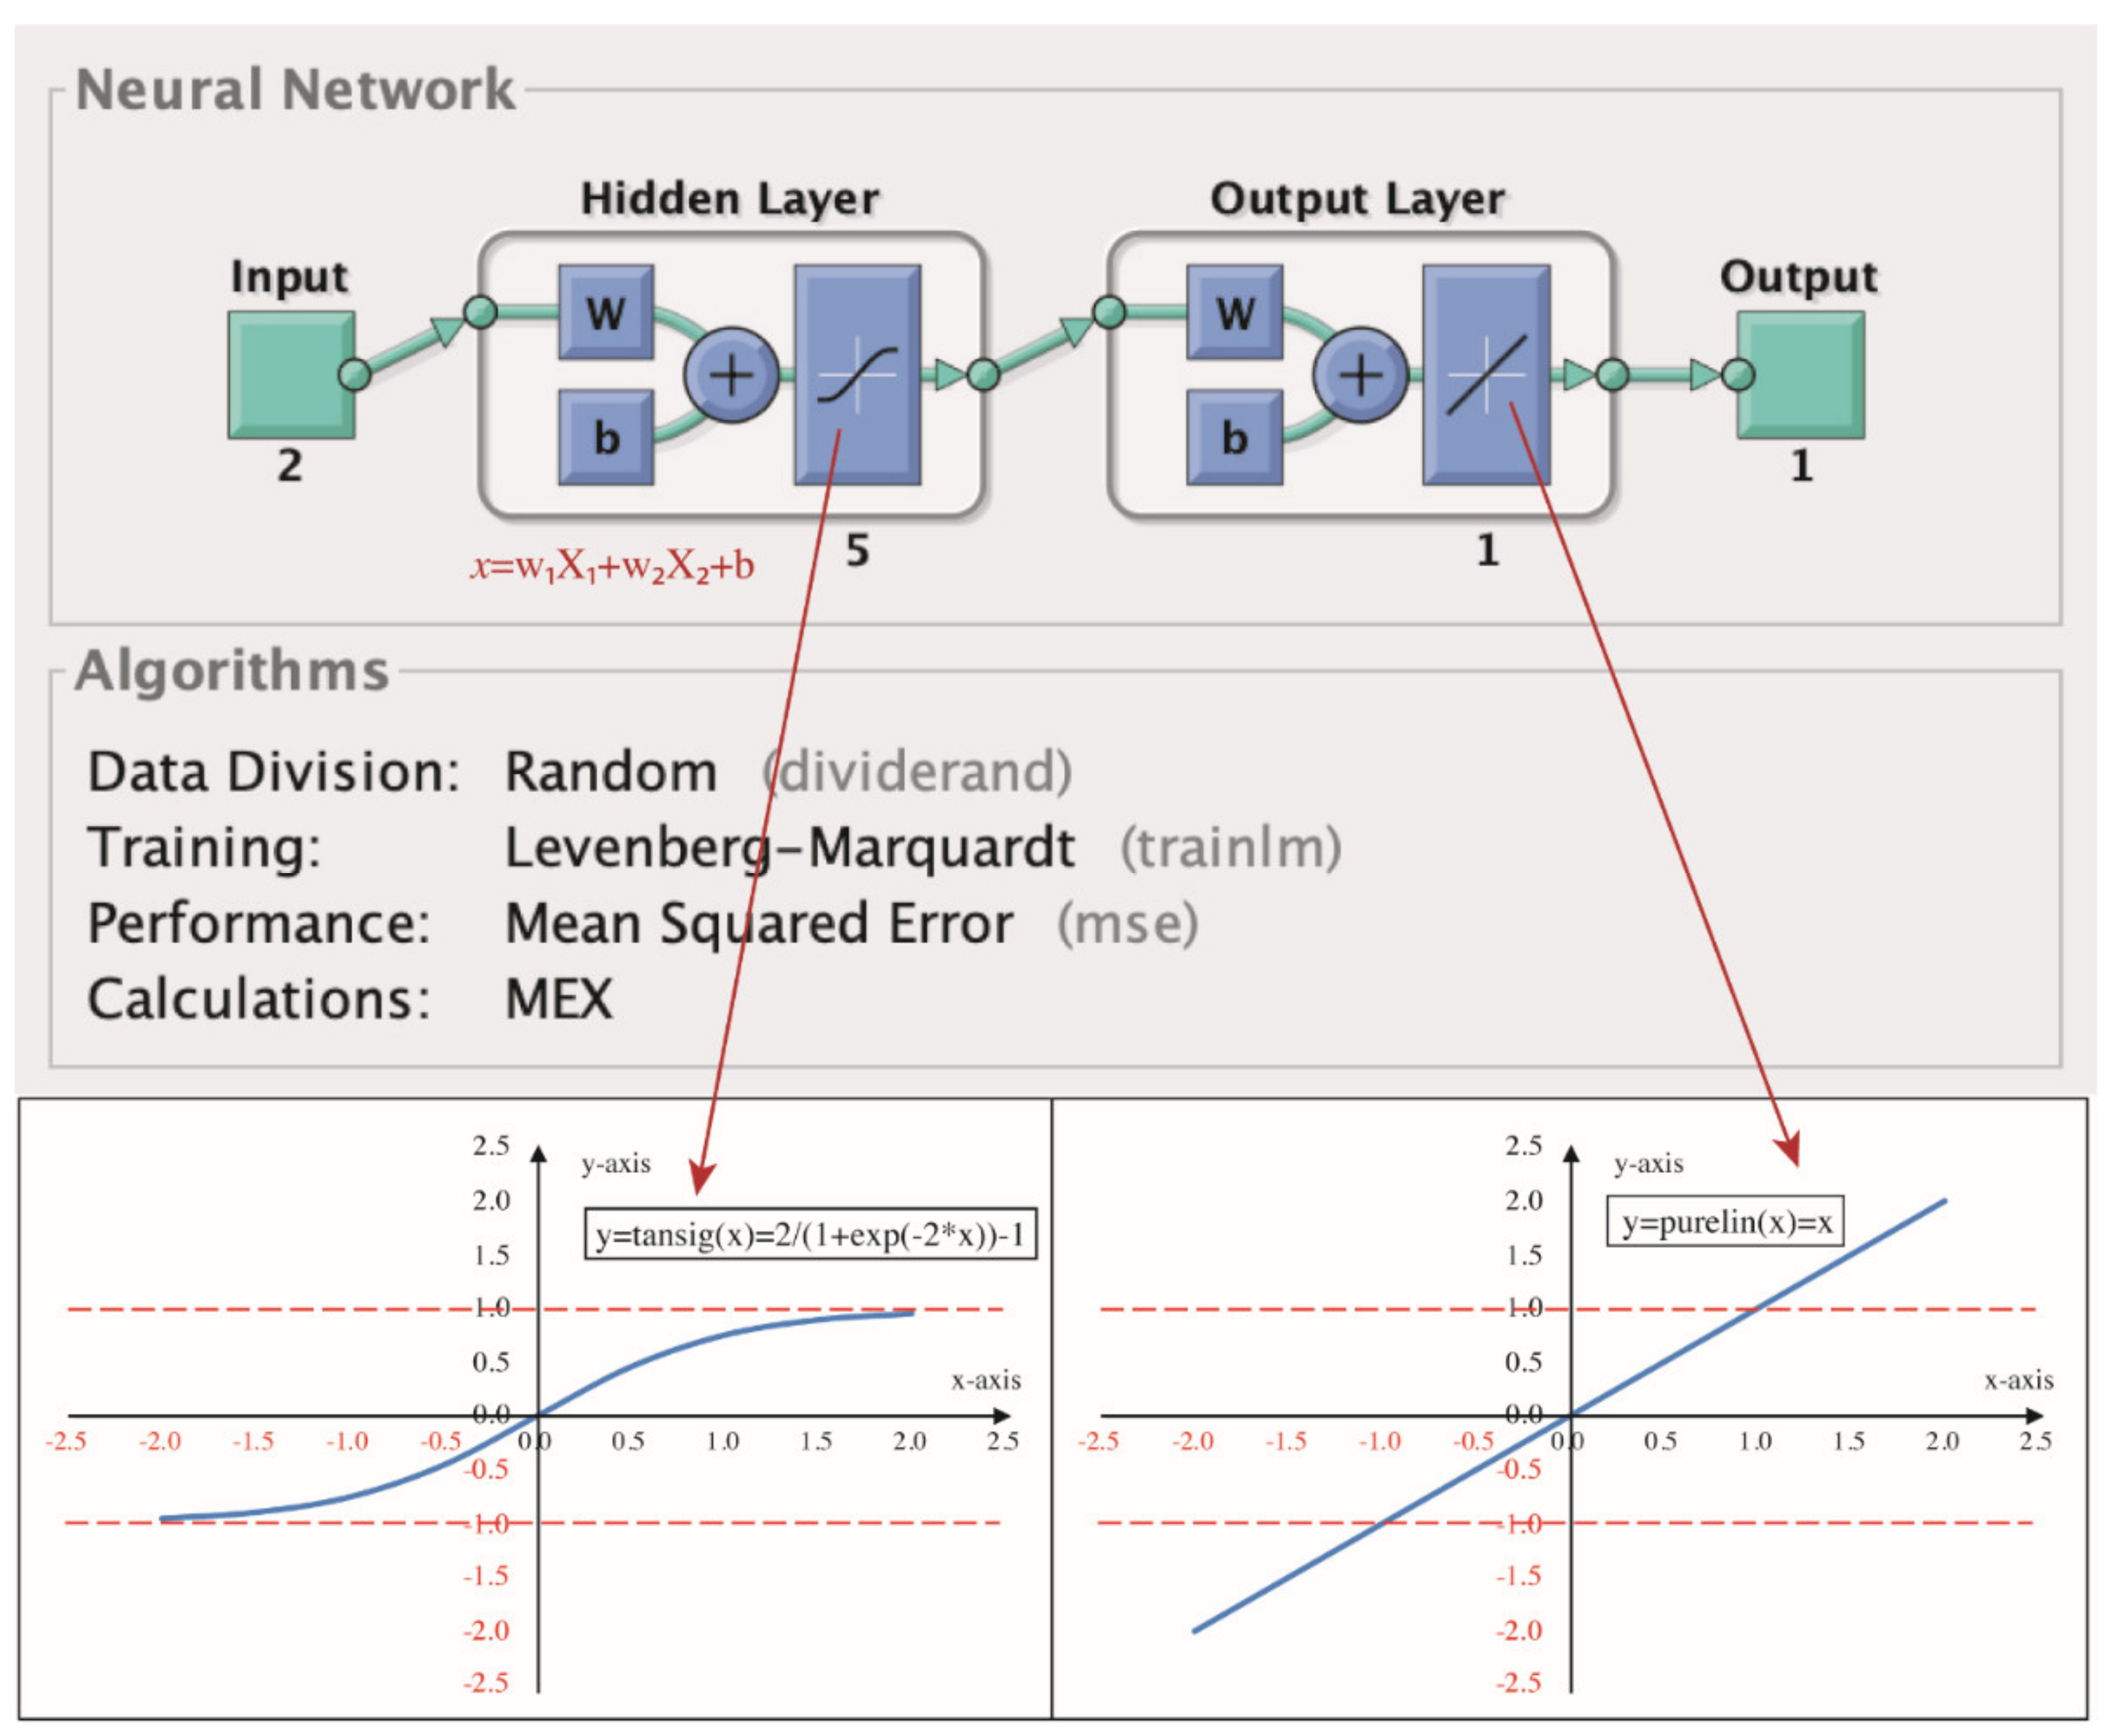
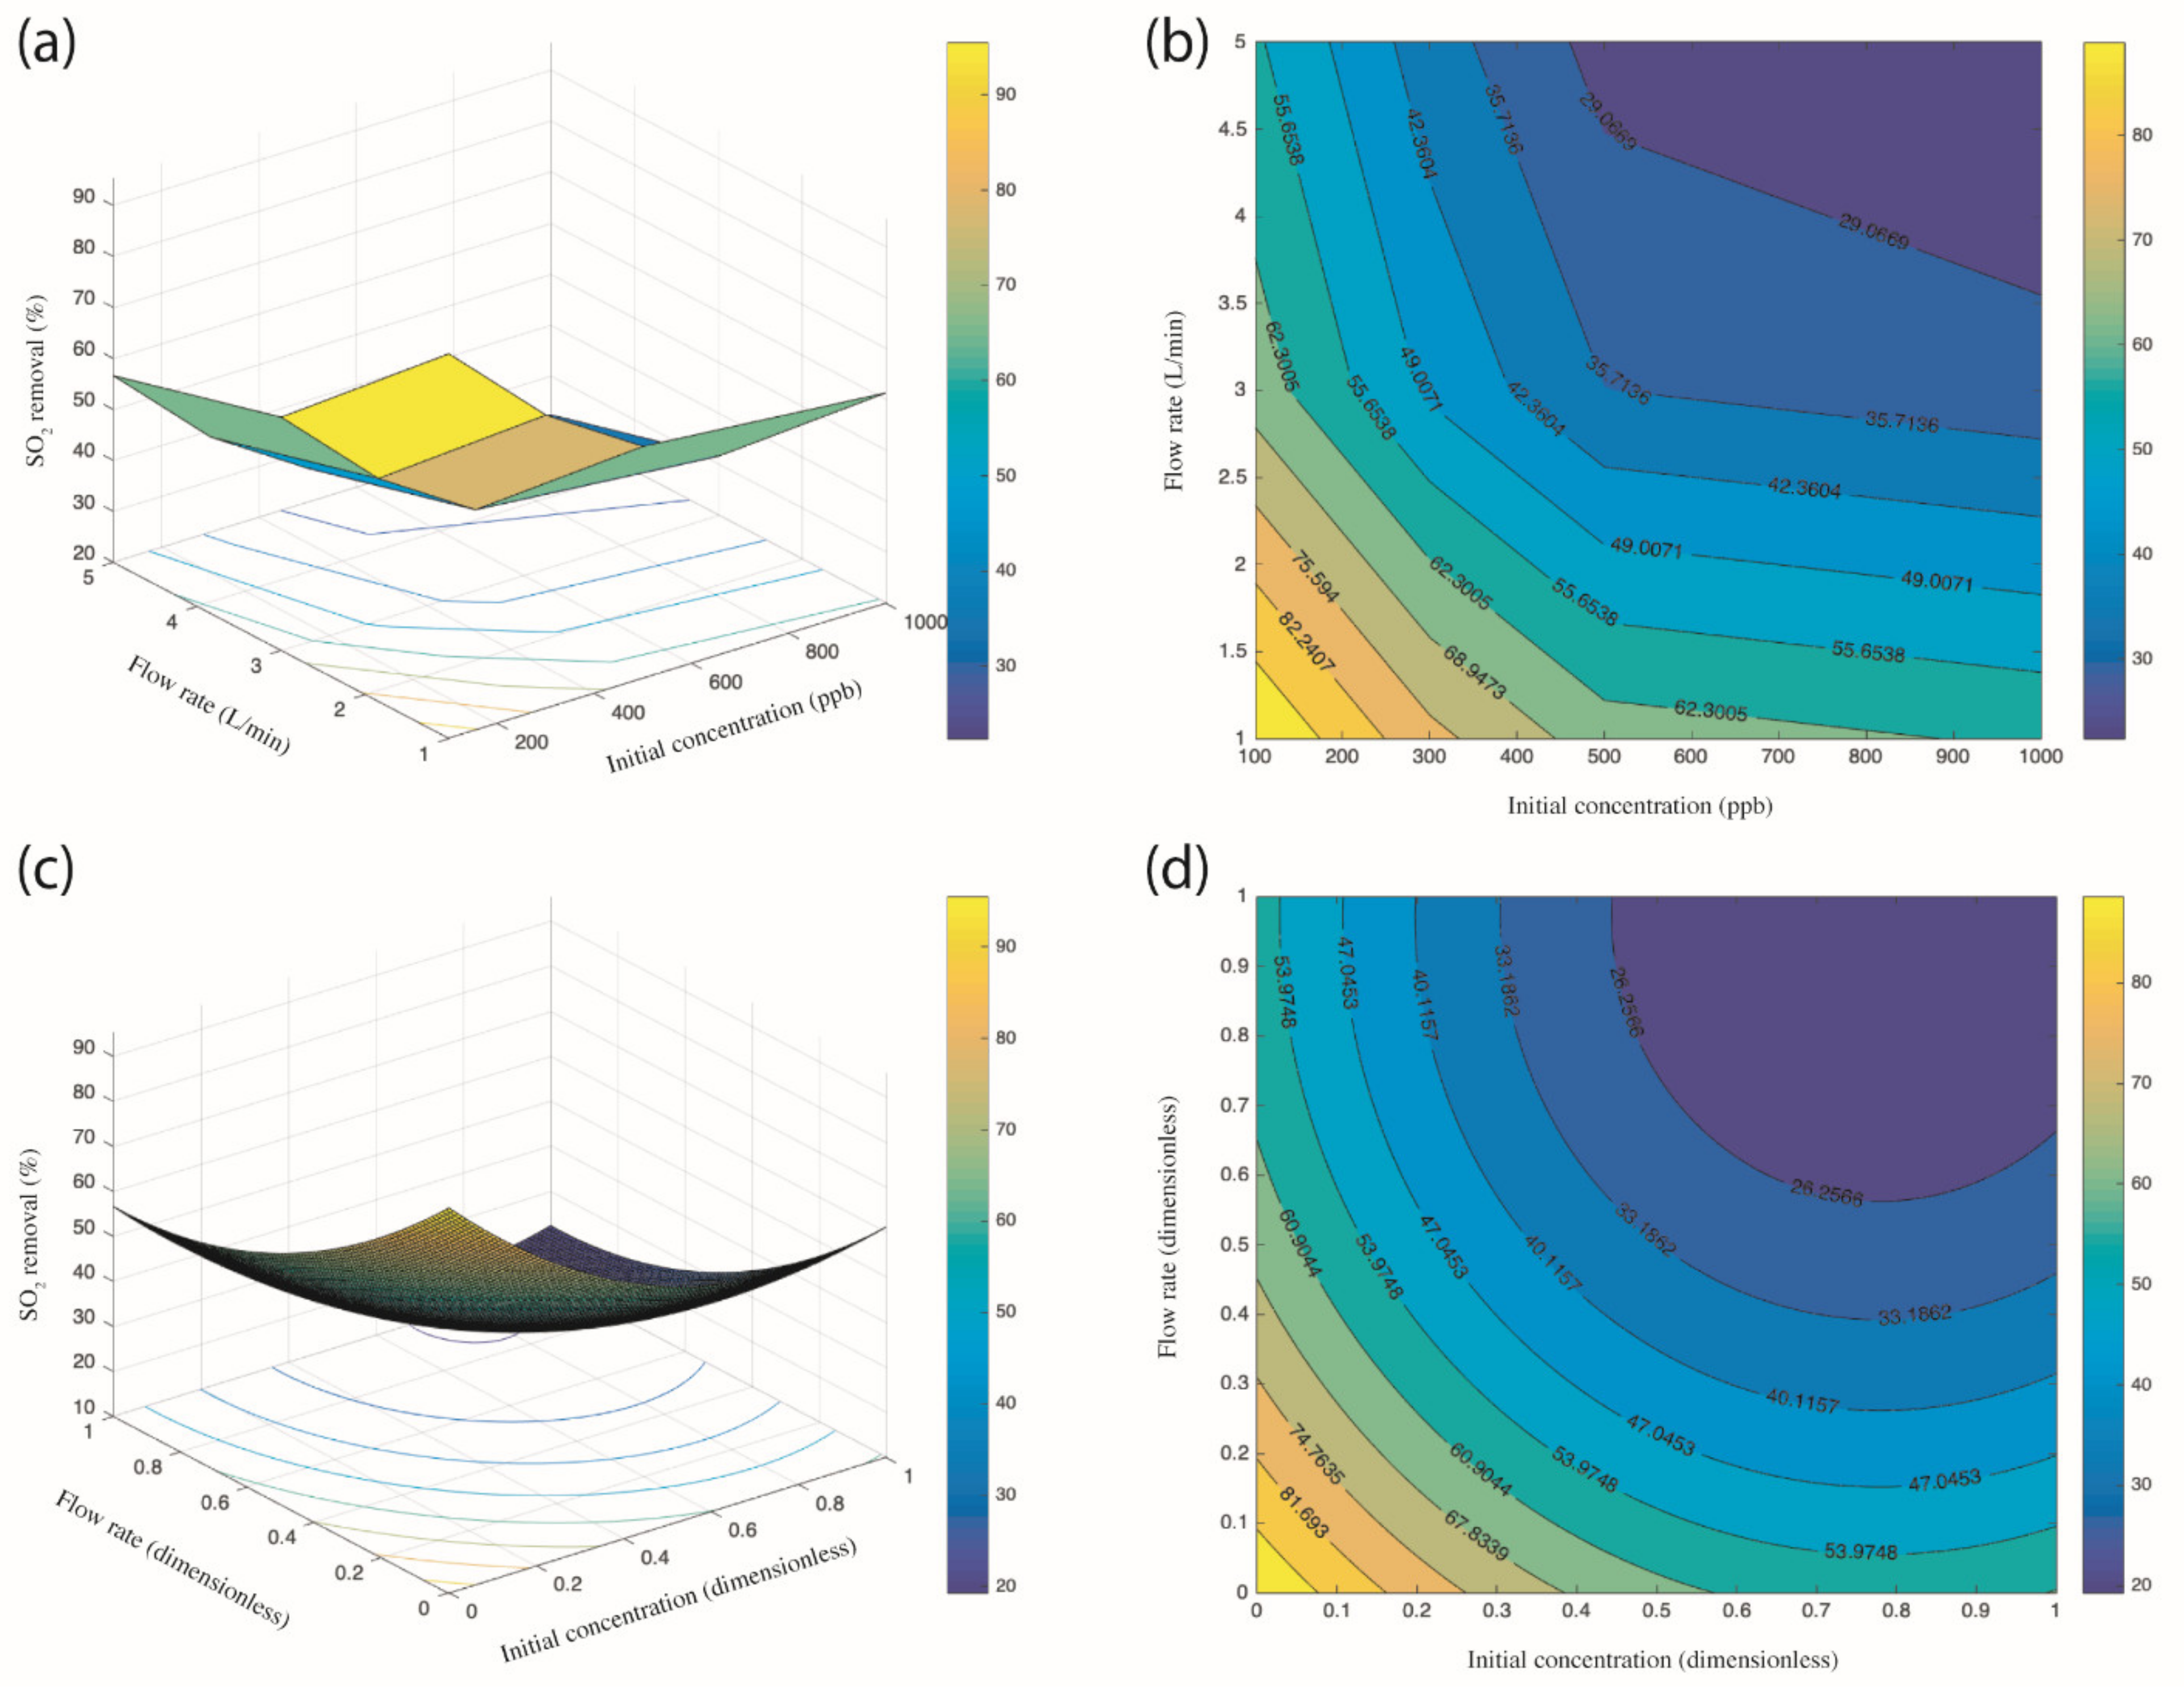
29], are used to predict the photocatalytic performance. RSM and ANN are promising modeling approaches since the photocatalytic process is typically characterized by various testing conditions and the associated changeable testing results. The initial concentration and the flow rate of the pollutant are two critical parameters in determining the final photocatalytic efficiency. This paper therefore co-uses RSM and ANN to predict the photocatalytic performance of photocatalytic mortar containing high-content construction wastes.

2. Experimental Details

2.1. Materials

The cement (P.O.42.5) was purchased from the China Resources Cement Co., Ltd. (Shenzhen, China). The chemical composition of cement is listed in Table 1; whilst the specific gravity of cement is 3.10 g/cm3. In particular, the cement by weight contains 80–95% cement clinkers and gypsum and 5–20% mineral admixtures as per the Chinese standard of Common Portland Cement [30]. The recycled clay bricks were provided by a local recycling company. By crushing and sieving, particles less than 300   μ   were put into a ball milling for 10 h, with final products denoted as recycled clay brick powder (RCBP). Recycled glass (RG) with a particle size larger than 0.6 mm and smaller than 2.36 mm was also sourced from the same company. The recycled fine aggregates (RFA), on the contrary, were not directly sourced from the construction site but from concrete cubes prepared in the laboratory. Concrete cubes prepared using the mixture proportion of cement:water:river sand:natural granite = 225:410:642:1048 and cured for 180 d in the standard curing condition were crushed and sieved into 0.6–2.36 mm. The river sand (RS) was purchased from a market. The crushing index (negatively correlates to hardness) of RFA, RS, and RG are 14.3%, 5.5% and 7.9%, respectively. The standard sand was purchased from the Ximen ISO Standard Sand Co., Ltd. It is composed of natural round siliceous sands with a silica content not less than 98%. Its particles are distributed in the range specified by the Chinese standard of Method of testing cements-determination of strength [31]. Standard sand was only used in the mixture determining the pozzolanic activity of RCBP, with other mixtures using common river sands. The particle size distribution of all aggregates including RS, RG, and RFA were manually adjusted by weight as 0.6–1.18:1.18–2.36 = 6:4 to ensure the same grain gradation. The chemical compositions were determined by an X-ray fluorescence spectrometer (Model: S4 Explorer, Bruker AXS GmbH, Germany). The particle size distribution of recycled clay brick powder (RCBP) was measured using a laser particle size analyzer (Model: VIBRI, Brookhaven, SYMPATEC GmbH, Germany), with results shown in Figure 1.
The x (50%) or D50 is 2.78 μ m . It signifies that the cumulative distribution percentage of particles with a size larger than 2.78 μ m is 50%; whilst for particles of a size smaller than 2.78 μ m it is also 50%. The average particle size of RCBP is 2.78 μ m . A commercial nano-TiO2 (NT) (P25, Degussa) with a particle size of 20–50 nm and a specific BET surface area of 50 ± 15 mg2g−1 was used as the photocatalyst to ensure homogeneity. It is chemically consisted of 80% anatase and 20% rutile. The chemical composition and physical properties of the above raw materials are exhibited in Table 1 and Table 2. It is noted that the sum of silica and alumina of RCBP is about 80%, making it a potential pozzolanic material. The Na2O in RG is 15.62%. This high content Na2O provides the system with sufficient alkali metal ion (Na), which coupled with hydroxyl ions provided by the hydrated product (calcium hydroxide) forms a crucial precondition of the potential expansion of ASR. The microstructures (see Figure 2) of RFA and RG were photographed using an environmental scanning electron microscope (ESEM: Quanta FEG 250, FEI, Hillsboro, OR, USA). As is shown in Figure 2, the RG has an irregular shape but a smooth surface; whilst the RFA has a relatively regular shape (almost circular appearance) but a rough surface.

2.2. Preparation of Composite Photocatalysts

The RFA and RG were soaked in NT solution to prepare the composite photocatalysts, which are denoted as NT@RFA and NT@RG, respectively. First, 1 g of NT was put into 100 mL of deionized water to produce the NT solution. The NT solution was then ultrasonically vibrated under 20 KHz for 1 h. A total of 80 g of aggregates (RFA, RG, or RS) cleaned by deionized water were next put into the solution to load NT for 6 h. The prepared composite photocatalysts were cleaned at length using deionized water and then oven dried at 105 °C for 48 h to obtain the final products. By an analytical balance that has an accuracy of 0.0001 g, the amount of NT loaded on per 80 g of RFA, RG, and RS was measured as 0.2554 g, 0.1244 g, and 0.1932 g, respectively.

2.3. Mortar Preparation and Testing

2.3.1. Determination of Hardened Properties of Mortars

Key hardened properties of mortars include the compressive strength, the drying shrinkage, and the water absorption. All the above stated properties are applied to samples cured for 28 days. As per the Chinese standard of Standard for test method of performance on building mortar [32], the compressive strength, the drying shrinkage, and the water absorption are respectively determined by Equations (1)–(3). Each value recorded is the average of three parallel tests.
Samples prepared based on Table 3 and cured in the standard chamber [20 ± 2 °C, >90% relative humidity (RH)] for 28 days were used to determine the compressive strength. The size of the samples was 70.7 × 70.7 × 70.7 mm.
f = N A
where, f is the compressive strength, accurate to 0.1 Mpa, N is the failing load, and A is the load-carrying area, mm2.
Table 3. Mix. proportion of photocatalytic mortars (for hardened properties).
Mortar Notation Binding Materials Water AggregatesSize Distribution of
All Aggregates
Cement RCBPRSNT@RSNT@RFANT@RGmm0.6–1.181.18–2.36
Control0.70.30.52.5---%6040
RS501.251.25--
RS100-2.5--
FRA501.25-1.25-
FRA100--2.5-
RG501.25--1.25
RG100---2.5
FRA50RG50--1.251.25
Samples for the drying shrinkage test were prepared using the following procedures. The mixture prepared as per Table 3 was at first poured into steel molds with internal dimensions of 40 × 40 × 160 mm and with a stainless steel probe on each end. The compacted samples were subsequently placed in a pre-curing chamber at a temperature of 20 ± 5 °C for 4 h and were then transferred to a standard curing chamber at a temperature of 20 ± 2 °C and relative humidity higher than 90% for 7 d. Afterwards, samples were demolded and marked with the initial length and the testing direction. The prepared samples were cured at length in a chamber at a temperature of 20 ± 2 °C and relative humidity of 60 ± 5% for 28 days.
ε 28 = L 28     L 0 L 0     2 × 100 %
where, ε 28 is the 28-d drying shrinkage rate of the sample, %
L 0 the initial length of samples, mm
L 28 the length of samples at 28-d, mm
the length of the probe, mm
Samples prepared according to Table 3 and cured in the standard chamber (20 ± 2 °C, >90% relative humidity (RH)) for 28 days were used to determine water absorption. The size of the samples was 40 × 40 × 160 mm. Samples were at first oven dried at 78 ± 3 °C for 48 ± 0.5 h and weighted at the initial weight. Samples with the formed surface facing down were subsequently placed on twoφ10 bars in a water tank. Afterwards, the water tank was covered and placed in a chamber (20 ± 3 °C, 80% RH) for 48 ± 0.5 h. A wet towel was used at length to wipe off surface water from the samples.
W 28 = m 1     m 0 m 0 × 100 %
where, W 28 is the 28-d water absorption of the sample, %
m 0 the initial weight of sample, g
m 1 the weight of sample after water absorption, g

2.3.2. Determination of Pozzolanic Activity of RCBP

As per the Chinese standard for natural pozzolanic materials used for cement mortar and concrete, a material that can be viewed as a pozzolanic material should satisfy two basic technical specifications of fineness and 28-day activity index. Fineness is defined as the weight ratio between particles left in the sieve with 45 μ m and particles passing through. The threshold is regulated at 20%. This means that pozzolanic materials should have at least 80% particles smaller than 45 μ m . The 28-day activity index is defined as the ratio of the 28-day compressive strength of the experimental mortar against the reference mortar, with mix proportions of mortars in Table 4 and Table 5. Prisms with dimensions of 40 × 40 × 160 mm were prepared to determine the compressive strength as per the Chinese standard method of testing cements’ determination of strength [33]. Samples were cured in the standard chamber (20 ± 2 °C, >90% RH) for 3, 7, 14, 28, 56, and 90 d. The required value is set at 65%. That is, a material can be considered of pozzolanic activity if it has a fineness higher than 20% and at the same time has a 28-d activity index higher than 65%.

2.3.3. Accelerated Alkali–Silica Reaction (ASR) Test

The inhibiting effect of RCBP upon ASR was tested as per the Chinese standard of technical code for prevention of alkali–aggregate reaction in concrete [34]. The method was sourced from the standard test method for determining the potential alkali–silica reactivity of combinations of cementitious materials and aggregate [35], but with some modifications. The threshold was changed from 0.1% to 0.03% because the binding material itself contains 5–20% mineral admixtures.
Mixtures prepared as per Table 6 were at first poured into steel molds with internal dimensions of 25 × 25 × 280 mm and with a stainless steel probe on each end. After 24 h curing in the standard condition, samples were demolded and then soaked in curing chambers filled with deionized water, followed by another 24 h curing in the oven at 80 ± 2 °C. Samples were subsequently taken out from the oven and the initial length measured (L0) at 20 ± 2 °C, accurate to 0.02 mm. Afterwards, the prepared samples were put into a curing chamber filled with NaOH solution of 1 mol/L at 80 ± 2 °C. The expansion rate was finally calculated using Equation (4), accurate to 0.001%. The final recorded value is the average of three parallel tests. If the expansion rate at 14 d is less than 0.03%, the conclusion that RCBP can inhibit ASR can be drawn.
ε t = L t L 0 L 0 2 × 100 %
where, ε t is the expansion rate of the sample at t-th d curing, %
L 0 the initial length of samples, mm
L t the length of samples at t-th d (3, 7, 10, 14 d in this study), mm
the length of the probe, mm.
Table 6. Mix. proportion of mortars used to determine the inhibiting effect of RCBP on ASR.
Binding Materials WaterAggregatesSize Distribution of Aggregates (River Sand)
Cement RCBPmm0.16–0.3150.315–0.630.630–1.251.25–2.52.5–5
RCBP200.80.20.472.25%1525252510
RCBP300.70.30.472.25

2.3.4. Determination of Photocatalytic Activity

The photocatalytic activity is embodied by the photocatalytic degradation of SO2. Samples prepared as per Table 7 and with a size of 100 × 100 × 5 mm were cured in the standard curing chamber (20 ± 2 °C, >90% RH) for 28 d until testing.
Figure 3 illustrates the testing system of the photocatalysis. A photocatalytic reactor with internal dimensions of 700 × 400 × 130 mm was connected to a dilution calibrator and a T100 SO2 analyzer (Teledyne, Englewood, CO, USA). This dilution calibrator dilutes the sample gas (>99.9% sulfur dioxide) by zero air to the target concentration (100, 300, 500, 1000 ppb) at the established flow rate (1, 3, 5 L/min). The SO2 analyzer reads the real-time SO2 concentration by relying on chemical fluorescence. The operation principle of the T100 UV Fluorescence SO2 analyzer is based on the fluorescence that occurs when SO2 in the excited state decays to the ground state, as depicted in Equation (5) and Figure 3.
S O 2 + h v 214 nm S O 2 * S O 2 * S O 2 + h v 330 nm
where, S O 2 indicates the S O 2 in the ground state, S O 2 * indicates the S O 2 in the excited state.
Test specimens were placed onto a sample holder located at the center of the reactor. Two UV-A fluorescent lamps (TL8W/08 BLB, Philips, Holland) were placed parallel to the glass cover of the reactor (c.a. 10 cm above the sample), providing UV light ranging from 300–400 nm and a 3 m W/cm2 intensity at the peak wavelength of 365 nm. The reactor was completely sealed with no detectable leakage. The testing temperature and relative humidity were set at 25 °C and 35%, respectively.
Before testing, sample gas was injected into the reactor without UV radiation for 1 h to obtain the gas–solid adsorption–desorption equilibrium. The UV lights were turned on afterwards to continuously radiate samples for 30 min, with real-time sulfur dioxide concentration recorded automatically per minute. The result was the average plus the standard deviation of three parallel samples. Two approaches are commonly available to calculate the sulfur dioxide removal, as shown in Equations (6) and (7). The relationship between R and r is plotted in Figure 4.
R   S O 2 = f 22.4 t 0 t 1 S O 2 in S O 2 out dt × M W S O 2 × 10 6 A × T
r   S O 2 = S O 2 in S O 2 out , min S O 2 in × 100 %
where, R ( S O 2 ): the S O 2 removal, mg m−2h−1;
M W S O 2 : the molecular weight of S O 2 , namely 64 g/mol;
r ( S O 2 ): the S O 2 removal, %;
[ S O 2 ]in: the inlet concentration of SO 2 , ppb
[ S O 2 ]out: the real-time outlet concentration of S O 2 , ppb
[ S O 2 ]out,min: the minimum outlet concentration of S O 2 , ppb
f: flow rate converted into that at the standard state (0 °C, 1.013 kPa), L min−1;
A: surface area of samples, m2;
T: time of removal operation, min;
Figure 4. Profile of the real-time concentration of sulfur dioxide and the visualized test indicators.
Catalysts 12 00708 g004

2.4. Modeling

2.4.1. Basic Information of Models

Prior to the model construction, two variables (factors) of initial concentration and flow rate were identified. The initial concentration was set at four levels of 100, 300, 500, and 1000 ppb; whilst the flow rate was set at three levels of 1, 3, and 5 L/min, with details available in Table 8. A 3 × 4 data matrix was consequently constructed in Table 9.

2.4.2. The Response Surface Methodology (RSM)

A second-order polynomial equation was established to express the response (the sulfur dioxide removal) generated by factors (initial concentration and flow rate), see Equations (8)–(11). Coefficients were solved based on the ordinary least squares method (OLS), see Equations (12)–(14).
X 1 = x 11 , x 12 , , x 1 i ,   i = 1 , 2 , 3 , , m
X 2 = x 21 , x 22 , , x 2 j , j = 1 , 2 , 3 , , n
Y t = f X 1 , X 2 , t = 1 , 2 , 3 , , k  
Y t ^ = β 0 + β 1 X 1 + β 2 X 2 + β 3 X 1 X 2 + β 4 ( X 1 ) 2 + β 5 ( X 2 ) 2 + ε
u t = Y t Y t ^
m i n i m i z e   t = 1 n u t 2
C C T β 0 , β 1 , β 2 , β 3 , β 4 , β 5 T = C Y t ^  
where, X1 is the matrix of the first factor;
X2 is the matrix of the second factor;
β i   i = 0   to   7 is the coefficient;
u is residual sum of squares (RSS)
C = X 1 , X 2 , 1 T

2.4.3. The Artificial Neural Network (ANN)

Figure 5 illustrates the algorithms and associated parameter settings of the back propagation artificial neural network (BP-ANN). The entire ANN model contains four sections, namely, the input, the hidden layer, the output layer, and the output. The input in the form of a matrix contains two factors (initial concentration and flow rate) at various levels, with details available in Table 8. To both avoid the problem of overfitting and minimize the prediction error, the number of neurons in the hidden layer was set as five. Transfer functions for all neurons in the hidden layer were all set as ‘tansig’ (see Equation (15)); whilst the transfer function in the output layer was set as ‘purelin’ (see Equation (16)). The above two functions together with varied weights and bias (see Equation (17)) transfer original inputs into the final output (the sulfur dioxide removal).
y = tansing   x = 2 1 + e 2 x 1
y = purelin   x = x
x = w 1 X 1 + w 2 X 2 + b
where, X1 is the matrix of the first factor;
X2 is the matrix of the second factor;
w1 is the weight of the first factor;
w2 is the weight of the second factor;
b is the bias of the weighted sum inputs;
x is the weighted sum inputs plus bias;
y is the output, it can either be the output of the hidden layer or the output of the output layer depending on the function involved.
Figure 5. Algorithms of the back propagation artificial neural network.
Catalysts 12 00708 g005

3. Results and Discussion

3.1. Hardened Properties of Photocatalytic Mortar

Figure 6 illustrates the effect of RCBP and aggregate types on the basic hardened properties of photocatalytic mortar. Figure 6a depicts the effect of RCBP on the compressive strength, the drying shrinkage and water absorption of mortars using 100% RS as fine aggregates. It is observed that once 30% cement is replaced by RCBP, the compressive strength declines by 16%, whilst the drying shrinkage and the water absorption are increased by 9.6% and 5.6%, respectively. The final compressive strength is determined by the two competing factors: the filling effect and the reduction of cement amount. The ultra-fine RCBP (D50 = 2.78 μ m ) can fill some pores and micro cracks in the mortar, enhancing the strength [25]. The effective content of the main binding material (cement) is, however, at the same time reduced and decreases the strength. The second (negative) factor defeats the first (positive) factor, ultimately resulting in a reduced strength. The high specific surface area and the porous structure of RCBP can translate into a higher water absorption of the entire system. The drying shrinkage means the mortar placed in the environment with unsaturated humidity cannot maintain its dimensional stability because of the generation of capillary stress [36]. The incorporation of RBCP leads to a higher potential loss of free water due to the high water absorption of RCBP itself; whilst the volume change in the drying condition is proportional to the quantity of free water lost. That is the reason why 30% RBCP results in a 9.6% higher drying shrinkage. This result is inconsistent with a previous study that stated that a glass powder modified mixture had a lower drying shrinkage [36]. This is because glass powder not only refines pores, but also has a good volume stability due to near-zero water absorption.
Figure 6b shows the effect of RFA on the compressive strength, drying shrinkage and water absorption of mortars using 100% cement as binding materials. It is observed that once 50% RS is replaced by RFA, the compressive strength, the drying shrinkage and the water absorption increase (negative value means decrease) by 16.67%, 41.54%, and 7.89%, respectively. Once the RS replacement ratio increases to 100% (replaced by RFA), the compressive strength, the drying shrinkage, and the water absorption relative to the 50% replacement ratio further increase −15%, 41.3% and 13.41%, respectively. The reduced compressive strength is led by the high crushing index of RFA whilst the low hardness is led by the old mortar attached [37]. These old mortars are porous and thus are of high water absorption, leading the entire mortar system to absorb more water. When the external environment becomes unsaturated, the mortar system loses that extra water. The lost water causes a high drying shrinkage of mortar containing high-content RFA.
Figure 6c shows the effect of RG on the compressive strength, the drying shrinkage and the water absorption of mortars using 100% cement as binding materials. Once 50% RS is replaced by RG, the compressive strength, the drying shrinkage, and the water absorption reduces by 8.33%, 12.31%, and 14.47%, respectively. When the replacement ratio increases to 100% (replaced by RG), a further reduction is observed for the compressive strength (16.67%↓), the drying shrinkage (17.54%↓) and the water absorption (7.69%↓). The decline in compressive strength is attributed to the low hardness of RG relative to RS. What should be noticed here is that the hardness of RG is higher than RFA but lower than RS. This result is consistent with a previous study [38] that observed a reduced compressive strength of concrete containing waste glass aggregate. Another key factor of RG, the near-zero porosity, makes RG absorb almost no water [39]. This feature of water impermeability leads to low water absorption and the associated low drying shrinkage of the mortar system.
Figure 6d–f illustrate the absolute values of the compressive strength, the drying shrinkage and the water absorption of mortars using 70% cement and 30% RCBP as binding materials but containing various types of fine aggregates. The RFA decreases the compressive strength but increases the water absorption and drying shrinkage. The same trend but of an enhanced level is observed for mortars containing a higher dosage of RFA. This is because the RFA has a higher crushing index and a higher water absorption due to the old mortar attached. In regard to all three selected dimensions (compressive strength, water absorption and drying shrinkage), RG generates a negative influence. The impact is also dependent on dosage. It is interesting to note that the RG, in regard to hardened properties of the mortar, has an effect that is totally distinct to that of RFA. It thereby makes it possible to use RG to offset defects triggered by RFA. Experimental results show that the RFA, once replaced by RG at the dosage of 50%, results in a 3.9% higher compressive strength, 31.6% lower drying shrinkage and 17.7% lower water absorption. The greater hardness of RG relative to RFA is believed to contribute to the higher compressive strength; whilst the zero-water absorption of RG translates into a decline in water absorption and decreased drying shrinkage of the end products. The improved hardened properties of mortar with combined used of RFA and RG fully demonstrate the existence of a positive synergistic effect between RFA and RG.

3.2. Inhibiting Effect of RCBP on ASR

Figure 7 illustrates the strength development trend of mortars with and without RCBP as supplementary cementitious materials. The obtained 28-d compressive strength of the experimental mortar and the reference mortar are 32.4 MPa and 43.7 MPa, respectively. This makes the 28-d activity index of RCBP 74.1% (32/43 = 74.1%) which is higher than the required value of 65%. RCBP thereby meets the second requirement as highlighted in Section 2.3.2. Referring to the particle size distribution (see Figure 1), the value of x90 (%) is 32.67 μ m . This means the cumulative distribution percentage of particles with a size smaller than 32.67 μ m is 90%. This means the RCBP also meets the first requirement of fineness (at least 80% particles smaller than 45 μ m ). The RCBP consequently can be viewed as a pozzolanic material. The result is consistent with a previous study [40] which stated that RCBP had similar properties to grade II fly ash. This is because the clay bricks, when manufactured, underwent burning at high temperatures from 600 to 1000 °C. The calcination process substantially changed the original crystal structure of silicates existing in the raw clays to an amorphous compound that could be reacted with lime at room temperature [41].
One significant problem of using high-content RG as sand is the potential alkali–silica reaction. Figure 8 exhibits the average expansion results of mortars with and without the incorporation of RCBP. It is observed that the control prepared using pure cement has a higher expansion than the deleterious limit of 0.03% at 14 d, as regulated by the Chinese standard [34]. Once 30% cement is replaced by RCBP, the expansion declines below the limit, with no evident cracks observed on the samples. The RCBP is therefore effective in inhibiting the expansion triggered by the alkali–silica reaction between RG and the binding materials. As a typical pozzolanic material verified above, RBCP consumes some alkalis and thus suppresses the expansion. It is believed that the mechanism is similar to that of other pozzolans which could be successfully used to mitigate ASR expansion, such as sewage sludge ash, waste aluminum powder [42], and recycled glass powders [43]. It is thereby possible to prepare photocatalytic mortars containing RG at high dosage as long as 30% cement is replaced by RCBP.

3.3. Sulfur Dioxide Degradation

The initial concentration and the flow rate of the sulfur dioxide are set as 1000 ppb and 3 L/min in this section. Sulfur dioxide concentration profiles of mortars are illustrated in Figure 9. It is observed that all curves have a similar pattern. The concentration rapidly decreases within the first 10–15 min and then reaches a relatively stable value afterwards.
Figure 10 shows the sulfur dioxide removal of all selected mortars. It is observed that the incorporation of RCBP reduces the sulfur dioxide removal slightly. A 10% dosage of RCBP reduces removal by 1.6% (5.27 μ mol/hm2 or 0.34 mg/hm2). Once the dosage increases to 30%, the reduction expands to 4.7% (15.66 μ mol/hm2 or 1 mg/hm2). The reduced photocatalytic activity is partially attributed to the filling effect generated by the extra generated CSH gel. The gel can adversely impact the contact between the sulfur dioxide molecules and the photocatalysts, triggering a decline in photocatalytic activity. The result is consistent with a previous study which stated that the accelerated carbonation process transformed some CH into tiny calcium carbonate crystals that could block the photocatalytic reaction [44]. With the same content of RCBP, the mortar containing 100% NT@RFA relative to that containing 100% NT@RS has a 17.5% higher sulfur dioxide removal because RFA has a higher alkalinity, which efficiently absorbs the sulfur dioxide molecules on the surface of photocatalysts and promotes photocatalytic reaction. Titanium dioxide is a photocatalyst in the process of sulfur dioxide removal. The entire degradation of SO2 can be summarized as follows: First, the external light irradiation that has higher energy than the band gap of TiO2 triggers the photo-generated carriers, viz. the photo-generated electrons and the photo-generated holes. The generated electron-hole pairs are recombined concurrently. However, the generation rate of these carriers is several times faster than the recombination rate. This ensures that the carriers diffuse and spread to the external surface of the catalysts, transforming solar energy into chemical energy. The photo-generated holes can react with water molecules and hydroxide ions and generate hydroxyl radicals. In contrast, the photo-generated electrons interact with oxygen molecules and produce superoxide. The generated superoxide can further undergo reactions and produce oxidants including hydrogen peroxide and hydroperoxyl radicals. The hydrogen peroxide forms extra hydroxyl radicals via photolysis and the reaction with photo-generated electrons. The sulfur dioxide is then oxidated and degraded by hydroxyl radicals and hydrogen peroxide that are produced by the activated titanium dioxide.
A similar phenomenon was reported by previous research that observed the alkali silicate relative to the epoxy coating had a higher chemisorption of the acidic sulfur dioxide because of neutralization [19]. In the photocatalytic oxidation of SO2 with NT@RFA, SO2, O2, and H2O are at first physiochemically adsorbed on the surface because of the catalyst’s high specific surface area and high alkalinity. It was also reported that the NT-intermixed cement materials held a selective photocatalytic activity for various gaseous pollutants [45]. Based on that research, acidic gas is more prone to degradation by an alkaline-based matrix. The acidic sulfur dioxide molecules, once captured, are either neutralized by the alkalis or degraded by the photocatalytic activity induced by the external light irradiations. Having suffered irradiation that is greater than the band gap of photocatalysts, photo-generated electrons (e) and holes (h+) are produced. The holes can react with water molecules and hydroxide ions to create hydroxyl radicals; whilst the electrons can interact with oxygen molecules to create superoxide, which further produces hydrogen peroxide and hydroperoxyl radicals [46]. These strongly oxidative surface particles chemically react with SO2 and yield SO32− and SO42−, realizing desulfurization [47]. The sulfur dioxide gas (acidic) in this case, when diffusing into the mortar, can be attracted and adsorbed by the alkalinity existing in both the mortar matrix and in the old mortar attached to the surface of the RFA. The alkaline nature of the RFA promotes the photocatalytic reaction between the contaminant and the radicals.
RG100P30, relative to RS100P30 and RFA100P30, has a 37.5% and 17% higher photocatalytic activity, respectively. NT@RG is not porous but has a light-transmitting property. This feature allows more photocatalysts attached to the surface of NT@RG effectively receive light, which consequently translates into a higher sulfur dioxide removal. The result signifies that, in terms of sulfur dioxide removal, the light-transmitting property is more important than the high alkalinity, especially because the amount of NT attached to the RG is even less than that of RFA.
The synergism between NT@RFA and NT@RG is also observed in respect to SO2 removal. 50% NT@RFA plus 50% NT@RG results in the highest SO2 removal which is 23.97% higher than that of 100% NT@RFA and is even 5.93% higher than that of 100% NT@RG. This is because the NT@RG, via its light-transmitting property, can introduce more external light into deep pores of the NT@RFA and activate more photocatalysts; whilst the NT@RFA, via its porous structure, can help accommodate some final products which otherwise accumulate on the surface of NT@RG. When the accumulation reaches a certain level, it forms a light-proof cover that impacts the light-transmitting property of NT@RG and subsequently weakens the photocatalysis. The aforementioned mutual impetus echoes the positive synergistic effects between RFA and RG in the optimization of hardened properties.

3.4. Modeling

3.4.1. Respond Surface Methodology (RSM)

In regard to adapting the traditional mathematical expression, namely, the x-y-z rectangular coordinate system, the two factors are respectively denoted as X and Y rather than X1 and X2 in this section. All items in Equation (11) were at first tested by the ANOVA analysis to evaluate the relevance to the final regression result, see Table 10. Results show all items but the interaction effect, namely, xy, have a close relationship to the response because only xy has a p-value higher than 0.05. Once the interaction is removed, all other items exhibit a strong relationship since all p-values are then smaller than 0.05 (see Table 11). The obtained four items plus the constant were then regressed by a multivariate regression model, with results in Table 12. It is observed that all items pass the t-test; whilst the entire regression passes the F-test. The adjust R-square of the regression is 0.9363, which is close to 1, indicating a good fitness performance.
Based on the above, the final regression equation is written as,
Z = 129.312 0.1192 X 25.1702 Y + 0.0000738 X 2 + 2.574367 Y 2
A visual verification of the effectiveness of Equation (18) is available in Figure 11. Figure 11a shows the real data and the data predicted by Equation (18). It is observed that some real data are located in the upper area of the respond trend surface; whilst some other real data are beneath the respond trend surface. This means that Equation (18) can either overestimate or underestimate the value of sulfur dioxide removal given various initial concentrations and flow rates. This kind of fluctuation is quantitatively illustrated by Figure 11b. In regard to the deviations, the highest is 16.51% whilst the lowest is 0.53%. The majority of deviations however are distributed within a range from −10% to 10%. It proves that the RSM has a fairly good regression performance. This conclusion echoes the high R-square value (0.9436) in Table 12.
Figure 12 illustrates the respond trend surfaces and the associated contour maps based on both real data and normalized data. It is observed that the respond trend surface forms an inclined spade shape, with the highest point at the coordinate origin. According to Figure 12b (the contour map based on real data), the increase in either the initial concentration or the flow rate leads to a decline in photocatalytic activity. This is because the mass transfer of pollutant materials to the surface of photocatalysts, the adsorption of pollutant materials, and the photochemistry are key processes in determining the photocatalytic process [45]. The adverse relationship between the initial concentration and the photocatalytic activity is attributed to the competition among sulfur dioxide molecules occupying limited active sites provided by the photocatalysts. When the initial concentration is high, the mass of pollutant material within a given time is correspondingly high. The number of active sites, however, is constant and limited. Once those active sites are all occupied, the upper limit of photocatalytic activity is reached, and no more pollutants can be degraded, thus weakening the photocatalytic efficiency. A similar phenomenon was reported by Guo et al., (2017) for NOx removal. The flow rate is negatively related to the sulfur dioxide removal because a lower flow rate means a higher retention time. The retention time is defined as the ratio between the volume of the container and the flow rate. When the flow rate is low, it takes a longer time for sulfur dioxide molecules to diffuse out the porous RFA and the mortar. This means that pollutants can fully diffuse through inter-connected pores and prolong the adsorption process locally at the surfaces of pores along the path of diffusion. The higher retention time thereafter translates into a corresponding higher pollutant removal since the gas stream has a longer contact time with the composite photocatalysts.
Both the initial concentration and the flow rate are negatively related to the photocatalytic activity, it is, however, unclear which factor is more influential. That is the reason why we also plotted the response surface and the contour map based on the normalized data in Figure 12c,d. It should be noted that the zero point in Figure 12d is not the real ‘zero point’ which means zero initial concentration and zero flow rate. Instead, the point (0,0) in Figure 12d is of the same meaning as the point (100,1) in Figure 12b. The normalized data are obtained by dividing [the difference between the data and the minimum] by [the difference between the maximum and the minimum]. The Min-Max method removes the effect of order of magnitude and the unit of selected data, offering a result that is more concise and reliable. Results show that the response is almost equally affected by the initial concentration and the flow rate. For example, both ~0.2 unit change (0.57 − 0.38 = 1.9) of initial concentration and ~0.2 unit change (0.63 − 0.45 = 0.18) of flow rate can increase the response from 60.9% to 67.8%. The result is meaningful and interesting because it provides a practical guide to realize effective and efficient sulfur dioxide degradation by manually adjusting the initial concentrations and flow rates. In areas with a high content of pollutant materials, the flow rate can be slowed down in order to achieve the maximized pollution degradation. On the contrary, in areas with a low content of pollutants, the flow rate can be sped up for the sake of a rapid but still effective pollutant removal. The flow rate can be adjusted according to a change in pollutant concentration, with no substantial impact on the efficiency of photocatalytic degradation.

3.4.2. Artificial Neural Network (ANN)

Besides the RSM, another typical fitting model of ANN was also used. In comparison to the RSM, the ANN is more accurate because ANN adopts a more complex algorithm that is far more sophisticated and flexible than the quadratic polynomial used in RSM. The equation used in ANN along with weights and bias in each layer is available in Table 13; whilst the regression performance of the equation is exhibited in Figure 13. Referring to Figure 13, the prediction equation has a high R value approaching 1, indicating a good fitting performance[48]. Deviations in Figure 14 are also all strictly located within a range from −10% to 10%.
This basically verifies that ANN relative to RSM has a better performance in predicting sulfur dioxide removal with various initial concentrations and flow rates. Once deviations obtained by RSM and ANN are put together and jointly compared with each other (see Figure 15), the superiority of ANN becomes more evident. It is noted that deviations of ANN only fluctuate within 5% of the upper or lower limit. The fluctuation is also quite smooth. Deviations of RSM, on the contrary, have a high volatility within 10% of the upper or lower limit, with some values even crossing the boundary. The R-square value and the room mean square error (RMSE) of the ANN model are 0.99 and 3.2, which are larger and smaller than that of RSM (0.94 and 5.6, respectively). All of the above resultantly highlight the higher applicability and accuracy of ANN in fitting and predicting photocatalytic performance, especially considering a situation where more than two variables are involved. The ANN is also well-known for dealing with problems that require the addition of extra variables during the calculation process since ANN is quite flexible. For example, the effect of different composite photocatalyst types (NT@RS, NT@RFA, and NT@RG) can easily be added to the existing ANN model in the form of dummy variable values denoted as ‘0’, ‘1’, and ‘2’, respectively. The RSM model, on the other hand, should be re-established before taking in another variable. The RSM actually cannot take into consideration more than two variables at the same time. Overall, ANN is a better approach than RSM in predicting photocatalytic activity under various testing conditions.

4. Conclusions

Waste cycling is always a key aspect in achieving sustainable development because it can both save the use of new natural resources and mitigate the emission of waste. Plenty of studies thereby use C&DWs as raw materials in preparing new construction materials. However, these studies only realize the low-value recycling application (downcycling) of those wastes. This study takes previous research a step further because the upcycling of RFA, RG, and RCBP is achieved. In the form of composite photocatalysts, the high alkalinity of RFA and the light-transmitting property of RG are taken advantage of to the maximum. Interestingly, a good complementarity exists between the NT@RFA and NT@RG in photocatalytic mortar. The combined use of NT@RFA and NT@RG can decrease the water absorption and drying shrinkage of photocatalytic mortar attributing to the impermeability of NT@RG. The NT@RG, via its light-transmitting property, can allow more light to penetrate deep pores of the NT@RFA, whilst the NT@RFA, via its porous structure, can provide a larger accommodation space to hold the final products. A locally abundant resource of RCBP has been proven to be able to replace traditional supplementary cementitious materials in inhibiting the ASR of NT@RG because the ultra-fine RCBP was verified as having an activity index of 74.14% at 28 days. Considering the fact that photocatalytic activity is easily affected by a variety of external conditions, the sulfur dioxide removals at different flow rates and initial concentrations were tested and modeled using RSM and ANN. ANN relies on an intricate fitting algorithm and is statistically better and more flexible. Although RSM has some deviations outside of the ±10% boundary, it is relatively simple and intuitive. The prepared photocatalytic mortar can comprehensively consume sulfur dioxide that exists in the atmosphere at a low cost. The mortar can be used on the surface of paving stones and on the façade of buildings. It is a crucial supplement to traditional desulfurization methods which mainly reduce sulfur dioxide in the emission process.

Author Contributions

X.-F.C.: Conceptualization, methodology, writing—review & editing; C.-J.J.: Supervision, project administration, funding acquisition, writing—review & editing. All authors have read and agreed to the published version of the manuscript.

Funding

The work was supported by a grant from the National Natural Science Foundation of China (Project No. 52078148 and 51778158), Special Research Projects in Key Areas for Colleges and Universities in Guangdong Province (Science and Technology Plan for Rural Revitalization, Project No.2021ZDZX4009), Key Innovation Program of Water Conservancy Science and Technology of Guangdong Province (Project No. 2017-32), Zhuhai Municipal Science and Technology Planning Project in the Field of Social Development(Project No. ZH22036201210032PWC).

Institutional Review Board Statement

Not applicable.

Informed Consent Statement

Not applicable.

Data Availability Statement

Not applicable.

Acknowledgments

The first author Chen, Xue-Fei herein would like to express his true love for his beloved wife Lin, Yan-Mei, and son Chen, Lin-Rui.

Conflicts of Interest

The authors declare no conflict of interest.

References

  1. Wu, H.; Duan, H.; Zheng, L.; Wang, J.; Niu, Y.; Zhang, G. Demolition waste generation and recycling potentials in a rapidly developing flagship megacity of South China: Prospective scenarios and implications. Constr. Build. Mater. 2016, 113, 618–1007. [Google Scholar] [CrossRef]
  2. Chen, X.-F.; Kou, S.-C.; Xing, F. Mechanical and durable properties of chopped basalt fiber reinforced recycled aggregate concrete and the mathematical modeling. Constr. Build. Mater. 2021, 298, 123901. [Google Scholar] [CrossRef]
  3. Chen, X.-F.; Jiao, C.-J. Microstructure and physical properties of concrete containing recycled aggregates pre-treated by a nano-silica soaking method. J. Build. Eng. 2022, 51, 104363. [Google Scholar] [CrossRef]
  4. Wang, D.; Cui, C.; Chen, X.-F.; Zhang, S.; Ma, H. Characteristics of autoclaved lightweight aggregates with quartz tailings and its effect on the mechanical properties of concrete. Constr. Build. Mater. 2020, 262, 120110. [Google Scholar] [CrossRef]
  5. Xie, J.; Liu, J.; Liu, F.; Wang, J.; Huang, P. Investigation of a new lightweight green concrete containing sludge ceramsite and recycled fine aggregates. J. Clean. Prod. 2019, 235, 1240–1254. [Google Scholar] [CrossRef]
  6. Long, W.-J.; Zheng, D.; Duan, H.; Han, N.; Xing, F. Performance enhancement and environmental impact of cement composites containing graphene oxide with recycled fine aggregates. J. Clean. Prod. 2018, 194, 193–202. [Google Scholar] [CrossRef]
  7. Chen, X.-F.; Kou, S.-C. Sulfur Dioxide Degradation by Composite Photocatalysts Prepared by Recycled Fine Aggregates and Nanoscale Titanium Dioxide. Nanomaterials 2019, 9, 1533. [Google Scholar] [CrossRef] [Green Version]
  8. Sopha, H.; Baudys, M.; Krbal, M.; Zazpe, R.; Prikryl, J.; Krysa, J.; Macak, J.M. Scaling up anodic TiO2 nanotube layers for gas phase photocatalysis. Electrochem. Commun. 2018, 97, 91–95. [Google Scholar] [CrossRef]
  9. Duta, A.; Andronic, L.; Enesca, A. The influence of low irradiance and electrolytes on the mineralization efficiency of organic pollutants using the Vis-active photocatalytic tandem CuInS2/TiO2/SnO2. Catal. Today 2018, 300, 18–27. [Google Scholar] [CrossRef]
  10. Diaz-Angulo, J.; Porras, J.; Mueses, M.; Torres-Palma, R.A.; Hernandez-Ramirez, A.; Machuca-Martinez, F. Coupling of heterogeneous photocatalysis and photosensitized oxidation for diclofenac degradation: Role of the oxidant species. J. Photochem. Photobiol. A Chem. 2019, 383, 112015. [Google Scholar] [CrossRef]
  11. Pozo-Antonio, J.S.; Dionísio, A. Self-cleaning property of mortars with TiO2 addition using real diesel exhaust soot. J. Clean. Prod. 2017, 161, 850–859. [Google Scholar] [CrossRef]
  12. Krishnan, P.; Zhang, M.-H.; Yu, L.E. Removal of black carbon using photocatalytic silicate-based coating: Laboratory and field studies. J. Clean. Prod. 2018, 183, 436–448. [Google Scholar] [CrossRef]
  13. Maury-Ramirez, A.; De Muynck, W.; Stevens, R.; Demeestere, K.; Belie, N. De Titanium dioxide based strategies to prevent algal fouling on cementitious materials. Cem. Concr. Compos. 2013, 36, 93–100. [Google Scholar] [CrossRef]
  14. Guo, M.-Z.; Ling, T.-C.; Poon, C.S. Photocatalytic NOx degradation of concrete surface layers intermixed and spray-coated with nano-TiO2: Influence of experimental factors. Cem. Concr. Compos. 2017, 83, 279–289. [Google Scholar] [CrossRef]
  15. Chen, X.-F.; Lin, S.-R.; Kou, S.-C. Effect of composite photo-catalysts prepared with recycled clay brick sands and nano-TiO2 on methyl orange and NOx removal. Constr. Build. Mater. 2018, 171, 152–160. [Google Scholar] [CrossRef]
  16. Chen, X.-F.; Kou, S.-C.; Poon, C.S. Rheological behaviour, mechanical performance, and NOx removal of photocatalytic mortar with combined clay brick sands-based and recycled glass-based nano-TiO2 composite photocatalysts. Constr. Build. Mater. 2020, 240, 117698. [Google Scholar] [CrossRef]
  17. Chen, X.-F.; Jiao, C.-J. Effect of construction wastes on the rheo-physical behavior of photocatalytic mortar. Case Stud. Constr. Mater. 2022, 16, e01049. [Google Scholar] [CrossRef]
  18. Chen, X.-F.; Jiao, C.-J. A photocatalytic mortar prepared by tourmaline and TiO2 treated recycled aggregates and its air-purifying performance. Case Stud. Constr. Mater. 2022, 16, e01073. [Google Scholar] [CrossRef]
  19. Krishnan, P.; Zhang, M.-H.; Cheng, Y.; Riang, D.T.; Yu, L.E. Photocatalytic degradation of SO2 using TiO2-containing silicate as a building coating material. Constr. Build. Mater. 2013, 43, 197–202. [Google Scholar] [CrossRef]
  20. Guo, M.-Z.; Li, J.-S.; Poon, C.S. Improved photocatalytic nitrogen oxides removal using recycled glass-nano-TiO2 composites with NaOH pre-treatment. J. Clean. Prod. 2019, 209, 1095–1104. [Google Scholar] [CrossRef]
  21. Chen, X.-F.; Jiao, C.-J. Effect of physical properties of construction wastes based composite photocatalysts on the sulfur dioxide degradation: Experimental investigation and mechanism analysis. Case Stud. Constr. Mater. 2022, 17, e01237. [Google Scholar] [CrossRef]
  22. Du, H.; Pang, S.D. Value-added utilization of marine clay as cement replacement for sustainable concrete production. J. Clean. Prod. 2018, 198, 867–873. [Google Scholar] [CrossRef]
  23. Chen, X.-F.; Quan, C.-Q.; Jiao, C.-J. Experimental Study of Chloride Resistance of Polypropylene Fiber Reinforced Concrete with Fly Ash and Modeling. Materials 2021, 14, 4417. [Google Scholar] [CrossRef]
  24. Letelier, V.; Henríquez-Jara, B.I.; Manosalva, M.; Moriconi, G. Combined use of waste concrete and glass as a replacement for mortar raw materials. Waste Manag. 2019, 94, 107–119. [Google Scholar] [CrossRef] [PubMed]
  25. Chen, X.F.; Kou, S.C.; Xing, F. Effect of agriculture and construction wastes on the properties of magnesium oxychloride cement mortar with tourmaline powder. Materials 2019, 12, 115. [Google Scholar] [CrossRef] [Green Version]
  26. Zhou, Y.; Li, J.; Lu, J.; Cheeseman, C.; Poon, C.S. Recycling incinerated sewage sludge ash (ISSA) as a cementitious binder by lime activation. J. Clean. Prod. 2020, 244, 118856. [Google Scholar] [CrossRef]
  27. Tang, P.; Chen, W.; Xuan, D.; Zuo, Y.; Poon, C.S. Investigation of cementitious properties of different constituents in municipal solid waste incineration bottom ash as supplementary cementitious materials. J. Clean. Prod. 2020, 258, 120675. [Google Scholar] [CrossRef]
  28. Jiao, J.; Han, X.; Li, F.; Bai, Y.; Yu, Y. Contribution of demand shifts to industrial SO2 emissions in a transition economy: Evidence from China. J. Clean. Prod. 2017, 164, 1455–1466. [Google Scholar] [CrossRef]
  29. Francioso, V.; Moro, C.; Martinez-Lage, I.; Velay-Lizancos, M. Curing temperature: A key factor that changes the effect of TiO2 nanoparticles on mechanical properties, calcium hydroxide formation and pore structure of cement mortars. Cem. Concr. Compos. 2019, 104, 103374. [Google Scholar] [CrossRef]
  30. GB 175-2007; Common Portland Cement. China National Standardization Administration: Beijing, China, 2007.
  31. JG/T 315-2011; Natural Pozzolanic Materials Used for Mortar and Concrete. China National Standardization Administration: Beijing, China, 2011.
  32. JGJ/T70-2009; Standard for Test Method of Performance on Building Mortar. China National Standardization Administration: Beijing, China, 2009.
  33. GB/T 17671-1999; Method of Testing Cements-Determination of Strength. China National Standardization Administration: Beijing, China, 1999.
  34. GB/T 50733-2011; Technical Code for Prevention of Alkali-Aggregate Reaction in Concrete. China National Standardization Administration: Beijing, China, 2011.
  35. ASTM C1567; Standard Test Method for Determining the Potential Alkali-Silica Reactivity of Combinations of Cementitious Materials and Aggregate. American Society for Testing Materials: West Conshohocken, PA, USA, 2008.
  36. Si, R.; Dai, Q.; Guo, S.; Wang, J. Mechanical property, nanopore structure and drying shrinkage of metakaolin-based geopolymer with waste glass powder. J. Clean. Prod. 2020, 242, 118502. [Google Scholar] [CrossRef]
  37. Berredjem, L.; Arabi, N.; Molez, L. Mechanical and durability properties of concrete based on recycled coarse and fine aggregates produced from demolished concrete. Constr. Build. Mater. 2020, 246, 118421. [Google Scholar] [CrossRef]
  38. Lu, J.-X.; Yan, X.; He, P.; Poon, C.S. Sustainable design of pervious concrete using waste glass and recycled concrete aggregate. J. Clean. Prod. 2019, 234, 1102–1112. [Google Scholar] [CrossRef]
  39. Bostanci, S.C. Use of waste marble dust and recycled glass for sustainable concrete production. J. Clean. Prod. 2020, 251, 119785. [Google Scholar] [CrossRef]
  40. Cheng, H. Reuse Research Progress on Waste Clay Brick. Procedia Environ. Sci. 2016, 31, 218–296. [Google Scholar] [CrossRef] [Green Version]
  41. Aliabdo, A.A.; Abd-Elmoaty, A.-E.M.; Hassan, H.H. Utilization of crushed clay brick in concrete industry. Alex. Eng. J. 2014, 53, 151–168. [Google Scholar] [CrossRef] [Green Version]
  42. Hay, R.; Ostertag, C.P. On utilization and mechanisms of waste aluminium in mitigating alkali-silica reaction (ASR) in concrete. J. Clean. Prod. 2019, 212, 864–879. [Google Scholar] [CrossRef]
  43. Guo, S.; Dai, Q.; Sun, X.; Xiao, X.; Si, R.; Wang, J. Reduced alkali-silica reaction damage in recycled glass mortar samples with supplementary cementitious materials. J. Clean. Prod. 2018, 172, 3621–3633. [Google Scholar] [CrossRef]
  44. Guo, M.-Z.; Maury-Ramirez, A.; Poon, C.S. Photocatalytic activities of titanium dioxide incorporated architectural mortars: Effects of weathering and activation light. Build. Environ. 2015, 94, 395–402. [Google Scholar] [CrossRef]
  45. Chen, J.; Kou, S.C.; Poon, C.S. Photocatalytic cement-based materials: Comparison of nitrogen oxides and toluene removal potentials and evaluation of self-cleaning performance. Build. Environ. 2011, 46, 1827–1833. [Google Scholar] [CrossRef]
  46. Chen, D.; Cheng, Y.; Zhou, N.; Chen, P.; Wang, Y.; Li, K.; Huo, S.; Cheng, P.; Peng, P.; Zhang, R.; et al. Photocatalytic degradation of organic pollutants using TiO2-based photocatalysts: A review. J. Clean. Prod. 2020, 268, 121725. [Google Scholar] [CrossRef]
  47. Wang, H.; You, C.; Tan, Z. Enhanced photocatalytic oxidation of SO2 on TiO2 surface by Na2CO3 modification. Chem. Eng. J. 2018, 350, 89–99. [Google Scholar] [CrossRef]
  48. Shaw, M.C. Engineering Statistics. In Engineering Problem Solving; Shaw, M.C., Ed.; William Andrew Publishing: Norwich, NY, USA, 2001; pp. 375–407. ISBN 978-0-8155-1447-3. [Google Scholar]
Figure 1. Particle size distribution of recycled clay brick powder.
Catalysts 12 00708 g001
Figure 2. Microstructures of recycled glass (RG) and recycled fine aggregate (RFA): (a) micrographs of RG; (b) micrographs of RFA.
Catalysts 12 00708 g002
Figure 3. Schematic representation of the photocatalytic reactor and the operation principle of T100 Sulfur Oxides Analyzer.
Catalysts 12 00708 g003
Figure 6. Hardened properties of photocatalytic mortar: (a) effect of RCBP on the mortar; (b) effect of RFA on the mortar; (c) effect of RG on the mortar; (d) effect of aggregate types on the compressive strength; (e) effect of aggregate types on the drying shrinkage; (f) effect of aggregate types on the water absorption.
Catalysts 12 00708 g006
Figure 7. Compressive strength and strength activity index of reference (without RCBP) and experimental mortar (with RCBP).
Catalysts 12 00708 g007
Figure 8. Alkali–silica expansion from RG with and without RCBP.
Catalysts 12 00708 g008
Figure 9. Sulfur dioxide concentration profiles: real time concentration of sulfur dioxide.
Catalysts 12 00708 g009
Figure 10. Sulfur dioxide removal and the change (RS50P0 as benchmark).
Catalysts 12 00708 g010
Figure 11. Validation of the regression model: (a) Real data (the blue circles) against the modeled respond surface; (b) quantitative test with deviations (deviation: [the difference between predicted data and real data] against the real data in percentage).
Catalysts 12 00708 g011
Figure 12. Respond surface and colored contour map: (a) respond surface (original data); (b) contour map (original data); (c) respond surface (normalized data); (d) contour map (normalized data).
Catalysts 12 00708 g012
Figure 13. Regression performance of the ANN model.
Catalysts 12 00708 g013
Figure 14. Validation of the regression model of BP-ANN (Deviation: [the difference between predicted data and real data] against the real data in percentage).
Catalysts 12 00708 g014
Figure 15. Comparison of deviations of RSM and ANN.
Catalysts 12 00708 g015
Table 1. Chemical composition and physical properties of raw materials (Cement and RCBP).
Component/%Cement RCBPNano-TiO2
Chemical composition SiO222.8758.380% anatase + 20% rutile
CaO64.056.7
MgO2.462.5
Fe2O33.488.4
Al2O34.4719.6
Others2.674.5
Physical properties Specific surface area (m2/g)3.4120.150 ± 15
Average particle size (μm)18.362.7820–50 nm
Table 2. Chemical composition and physical properties of raw materials (RFA, RG and RS).
MaterialsSiO2Fe2O3Al2O3CaOMgOSO3Na2OLoIDensityWater
Absorption
Crushing Value
(%)(%)(%)(%)(%)(%)(%)(%)(kg/m3)(%)(%)
RFA 59.634.6616.314.331.51.43-2.1523686.812.4
RG63.810.2611.775.561.57-15.621.412500~08.3
RS96.180.062.74----1.0226510.855.5
Table 4. Mix. proportion of experimental and reference mortars used in the pozzolanic activity test.
MortarCement/gPozzolanic Material (RCBP)/gStandard Sand/gWater/mL
Reference mortar450-1350225
Experimental mortar3151351350225
Table 5. Size distribution of standard sands.
Side Length of Squares/mm2.01.61.00.50.160.08
Accumulated sieve residue/%07 ± 533 ± 567 ± 587 ± 599 ± 1
Table 7. Mix. proportion of photocatalytic mortars (for photocatalytic property).
Mortar Notation Binding Materials WaterAggregates TypesSize Distribution of
All Aggregates
Cement RCBPRSNT@RSNT@RFANT@RGmm0.6–1.181.18–2.36
RS50P01-0.51.251.25--%6040
RS100P01--2.5--
RS100P100.90.1-2.5--
RS100P300.70.3-2.5--
RFA50P300.70.3-1.251.25-
RFA100P300.70.3--2.5-
RG50P300.70.3-1.25-1.25
RG100P300.70.3---2.5
RFA50RG50P300.70.3 --1.251.25
Table 8. Factors and levels for both RSM and ANN.
Factors Symbol UnitLevels
Initial concentrationX1ppb1003005001000
Flow rateX2L/min135-
Table 9. Experimental design.
Flow Rate (L/min)Initial Concentration (ppb)Test
1003005001000SO2 Removal
1333312
3333312
5333312
Total 999936
Note: Values in the main table indicate the number of experiments at specific conditions.
Table 10. ANOVA analysis with all items.
Number of Obs.36R-Squared0.9463
Root MSE5.56Adj. R-squared0.9373
SourcedfMSFProb. > F
Model53266.84105.670.0000
x12143.5269.330.0000
y11869.5660.470.0000
xy146.891.520.2277
x211462.0347.290.0000
y21848.3127.440.0000
Residual 3030.92
Total 35493.19
Table 11. ANOVA analysis with all items but the xy.
Number of Obs.36R-Squared0.9436
Root MSE5.61Adj. R-squared0.9363
SourcedfMSFProb. > F
Model44071.83129.550.0000
x12779.1188.420.0000
y12172.1369.110.0000
x211462.0346.520.0000
y21848.3126.990.0000
Residual 3131.43
Total 35493.19
Table 12. Regression analysis with all items but the xy.
SourceSSdfMSNumber of Obs.36
Model 16287.3044071.83 F (4,31)129.55
Residual974.363131.43 Prob. > F0.000
Total 17261.6735493.19 R-squared0.9436
Adj. R-squared0.9363
Root MSE5.6063
zCoef.Std. Err.tP > | t |[95% Conf. Interval]
x−0.11920.013−9.40.0012−0.145−0.093
y−25.17023.028−8.310.0020−31.345−18.995
x20.00007380.00001086.820.00170.00005170.0000958
y22.57440.4965.20.00001.5643.585
_cons.129.31234.51428.640.0120120.105138.519
Table 13. Prediction equations used in ANN.
InputHidden Layerw1iw2ibHiwHiOutput

X1
H1yH1 = tansig (H1)Y = purelin(Y *)
H1 = w11×1 + w21X2 + bH14.35802.1389−1.9978−1.2701
Equation: YH1 = 2/(exp(9989/2500 − (2139 × x2)/500 − (2179 × x1)/250) + 1) − 1Y* = wH1yH1 + wH2yH2 + wH3yH3 + wH4yH4 + wH5yH5 + by
H2yH2 = tansig (H2)
H2 = w12X1 + w22X2 + bH2−2.8321−0.95280.9402−1.1835
Equation: YH2 = 2/(exp((28,321 × x1)/5000 + (4769 × x2)/2500 − 4701/2500) + 1) − 1
H3yH3 = tansig (H3)
H3 = w13X1 + w23X2 + bH3−0.42642.91440.8542−0.2701
X2
 
Equation: YH3 = 2/(exp((533 × x1)/625 − (3643 × x2)/625 − 4271/2500) + 1) − 1
H4yH4 = tansig (H4)
H4 = w14X1 + w24X2 + bH4−4.4087−1.4817−2.63370.5428
Equation: YH4 = 2/(exp((44,087 × x1)/5000 + (14,817 × x2)/5000 + 26,337/5000) + 1) − 1
H5yH5 = tansig (H5)
H5 = w15X1 + w25X2 + bH5−1.87371.5688−4.46130.6351
Equation: YH5 = 2/(exp((18,737 × x1)/5000 − (1961 × x2)/625 + 44,613/5000) + 1) − 1(by = 0.5884)
Overall Equation:
Y = 6351/(5000 × (exp((18,737 × x1)/5000 − (1961 × x2)/625 + 44,613/5000) + 1)) − 12701/(5000 × (exp(9989/2500 − (2139 × x2)/500 − (2179 × x1)/250) + 1)) − 2367/(1000 × (exp((28,321 × x1)/5000 + (4769 × x2)/2500 − 4701/2500) + 1)) − 2701/(5000 × (exp((533 × x1)/625 − (3643 × x2)/625 − 4271/2500) + 1)) + 1357/(1250 × (exp((44,087 × x1)/5000 + (14,817 × x2)/5000 + 26,337/5000) + 1)) + 10671/5000
Publisher’s Note: MDPI stays neutral with regard to jurisdictional claims in published maps and institutional affiliations.

