Article

Photodegradation of Pharmaceutical Pollutants: New Photocatalytic Systems Based on 3D Printed Scaffold-Supported Ag/TiO2 Nanocomposite

1
Department of Chemistry, Life Science and Environmental Sustainability, University of Parma, Parco Area delle Scienze 17/A, 43124 Parma, Italy
2
Food and Drug Department, University of Parma, Parco Area delle Scienze 27/A, 43124 Parma, Italy
3
Department of Veterinary Science, University of Parma, Via Del Taglio n.10, 43126 Parma, Italy
4
Department of Mathematical, Physical and Computer Sciences, University of Parma, Parco Area delle Scienze 7/A, 43124 Parma, Italy
*
Authors to whom correspondence should be addressed.
Catalysts 2022, 12(6), 580; https://doi.org/10.3390/catal12060580
Submission received: 24 April 2022 / Revised: 17 May 2022 / Accepted: 23 May 2022 / Published: 25 May 2022
(This article belongs to the Special Issue Photocatalytic Activity of TiO2 and Its Applications)

Abstract

:
Due to the release of active pharmaceutical compounds in wastewater and their persistence in the environment, dangerous consequences can develop in the aquatic and terrestrial organisms. Chitosan/Ag/TiO2 3D printed scaffolds, at different Ag nanoparticle concentrations (10, 100, 1000 ppm) are investigated here as promising materials for photocatalytic degradation under the UV–Vis irradiation of pharmaceutical compounds in wastewater. As target drugs, amoxicillin, paracetamol and their 1:1 mix were selected. Ag nanoparticles increase the photocatalytic efficiency of the system based on titanium dioxide embedded in the chitosan scaffold: in the presence of Chitosan/Ag100/TiO2, the selected pharmaceuticals (PhCs), monitored by UV–Vis spectroscopy, are completely removed in about 2 h. The photodegradation products of the PhCs were identified by Liquid Chromatography–Mass Spectroscopy and assessed for their toxicological impact on six different bacterial strains: no antibacterial activity was found towards the tested strains. This new system based on Ag/TiO2 supported on 3D chitosan scaffolds may represent an effective strategy to reduce wastewater pollution by emerging contaminants.

Graphical Abstract

1. Introduction

Pharmaceutical compounds (PhCs) are intrinsically active on biological systems, and the release of active pharmaceutical substances in the environment can cause severe health hazards [1,2,3].
The diffuse presence of PhCs in aquatic ecosystems is a consequence of their widespread use. In the last year, due to the COVID-19 pandemic, the use of PhCs has dramatically increased worldwide [4].
In recent years, antibiotics and antipyretics have come under attention, as they were detected at relatively high concentrations in various compartments of aquatic, sediment and biota ecosystems around the world [3,5]. The European Union (EU) has recently established a watchlist of substances for Union-wide monitoring in the field of water policy by including several antibiotics and antipyretics in the list [6].
There is a direct relationship between the development of bacterial resistance and the overuse of antibiotics in human and veterinary medicine [7,8,9]. In 2019, the World Health Organization [10] enumerated bacterial resistance among the top 10 global threats to public health. It was estimated that antibiotics consumption has increased by 65% over the past decade [11]. At present, it is impossible to quantify their increase during this pandemic period, as about 75% of COVID-19 patients have received antibiotics both as a prevention method and as a treatment for secondary bacterial infection [12,13,14].
Analgesic-antipyretic drugs are extensively used worldwide, especially in self-medication, with a great increase in consumption over the past decade and, in particular, in the last two years [13,15]. They are the most prevalent class of PhCs detected in the environment, at concentrations from ng/L and μg/L up to hundreds of micrograms per liter in sewage influents and landfill leachate [16,17].
The removal of ECs from water systems and the development of effective and ecological water treatments are pressing challenges to guaranteeing the quality and safety of water [18,19].
Conventional technologies such as chlorination and ozonation, widely used in wastewater treatment plants, raise increasing concerns about the formation of dangerous by-products and may not be useful for the treatment of emerging contaminants [20].
Advanced oxidation processes (AOPs) are receiving great attention as valid strategies for the purification and treatment of water contaminated by ECs, toxins and other organic and inorganic pollutants [20,21,22]. The oxidation process is based on the creation of highly reactive radical and oxygen species that are able to oxidize and mineralize a large variety of non-biodegradable contaminants, even at high concentrations [8,20,23]. Among the AOPs, heterogeneous photocatalysis (HPC) is a feasible, environmentally friendly method to face water pollution problems [24,25,26].
HPC is a photoinduced reaction that utilizes semiconductors, oxides and sulfides in order to generate reactive species capable of degrading and mineralizing organic contaminants, avoiding the use of hazardous oxidants (e.g., ozone, chlorine) [7,27,28,29]. Semiconductor-mediated photocatalysis is one of the most studied HPC methods used to decompose diverse water recalcitrant contaminants, such as pharmaceuticals [30,31,32]. The photoinduced reactions can be briefly described as follows: when a semiconductor is exposed to radiation with energy equal to or higher than its bandgap energy (Eg), the photons are absorbed, and a photoelectron (e−) is promoted in the conduction band, leaving a hole (h+) in the valence band. The photogenerated e−/h+ pairs can be trapped at the surface of the catalyst, where they react with the adsorbed molecules (H2O, -OH, O2) to form highly reactive radical and oxygen species. Therefore, the redox reactions can take place, achieving the degradation of the organic molecules [29,33,34].
The most used semiconductor catalyst is titanium dioxide (TiO2). TiO2 is found in nature in three different polymorphs: rutile, anatase (both crystallizing in the tetragonal system) and brookite (orthorhombic) [32,35]. Rutile is, thermodynamically, the most stable phase. Among the several factors influencing TiO2 photoactivity, the particle size seems to play a major role, enhancing the available surface for the photocatalysis effect [36,37]. Nanocrystalline titania, with an anatase structure, is as of now the most investigated photocatalyst [29,33,34].
TiO2 is photo and chemically stable, non-toxic, relatively inexpensive, easy to immobilize on various surfaces and highly photoactive: the photogenerated holes are highly oxidizing (redox potential (RP) +2.53 V), and the conduction band electrons have an RP negative enough (−0.52 V) to reduce dioxygen to superoxide [29]. Due to its properties, nanocrystalline TiO2 has been employed in many environmental applications [29,38,39,40,41].
The actual limited industrial application of HPC in water treatment is mainly due to the complexity of the photocatalyst recovery by means of expensive filtration or centrifugation processes and its recycling after use. Efficient photodegradation of organic pollutants can be obtained by using catalysts that show both high adsorption ability and photoactivity [42,43]. However, the shielding effect of the matrix may limit the light absorption of the catalyst and, consequently, the photoinduced reactions [44]. To solve this drawback, several authors have proposed the immobilization of nanoparticles in biopolymers, such as chitosan, as one of the simplest and most efficient methods to form membranes or hydrogels with designed photoactive, antibacterial and adsorbent properties [45,46,47,48].
In this work, a 3D printed chitosan scaffold in the form of a stable hydrogel, without the use of a cross-linking agent, is proposed as a means of support for the Ag/TiO2 photocatalyst. The advantage of the 3D printing technology lies in the possibility of obtaining materials with defined geometries that can be arbitrarily set during the design step [49,50,51]. The Ag nanoparticles can act as a reinforcing agent, enhancing the mechanical properties of the chitosan matrix [52,53,54]. They can also delay the recombination of the photogenerated electrons and holes on TiO2, increasing the photocatalytic efficiency [55,56].
Amoxicillin and paracetamol were chosen as the representative drugs to test the photodegradation efficiency of the 3D Ag/TiO2–Chitosan scaffolds. Amoxicillin (AMX) is a penicillin-type antibiotic widely used to treat several diseases in human and veterinary therapy. N-acetyl(p-aminophenol), also known as paracetamol (PAM), is the most prescribed antipyretic drug in the world and is widely used for COVID-19 patients [16].
The characterization of the Ag and TiO2 nanoparticles was carried out by DLS–ELS, UV–Vis spectroscopy and XRD. SEM–EDS was used to investigate the morphology of the scaffolds and the nanoparticles distribution. FTIR measurements were also performed to characterize the scaffolds. The photocatalytic degradation of the selected compound was monitored by UV–Vis spectroscopy. The by-products were identified by MS, and their toxicological impact was assessed on the following microorganisms: Enterococcus faecalis, Lactobacillus gasseri, Micrococcus spp., Acinetobacter baumannii, Alcaligenes spp. and Salmonella pullorum.

2. Results and Discussion

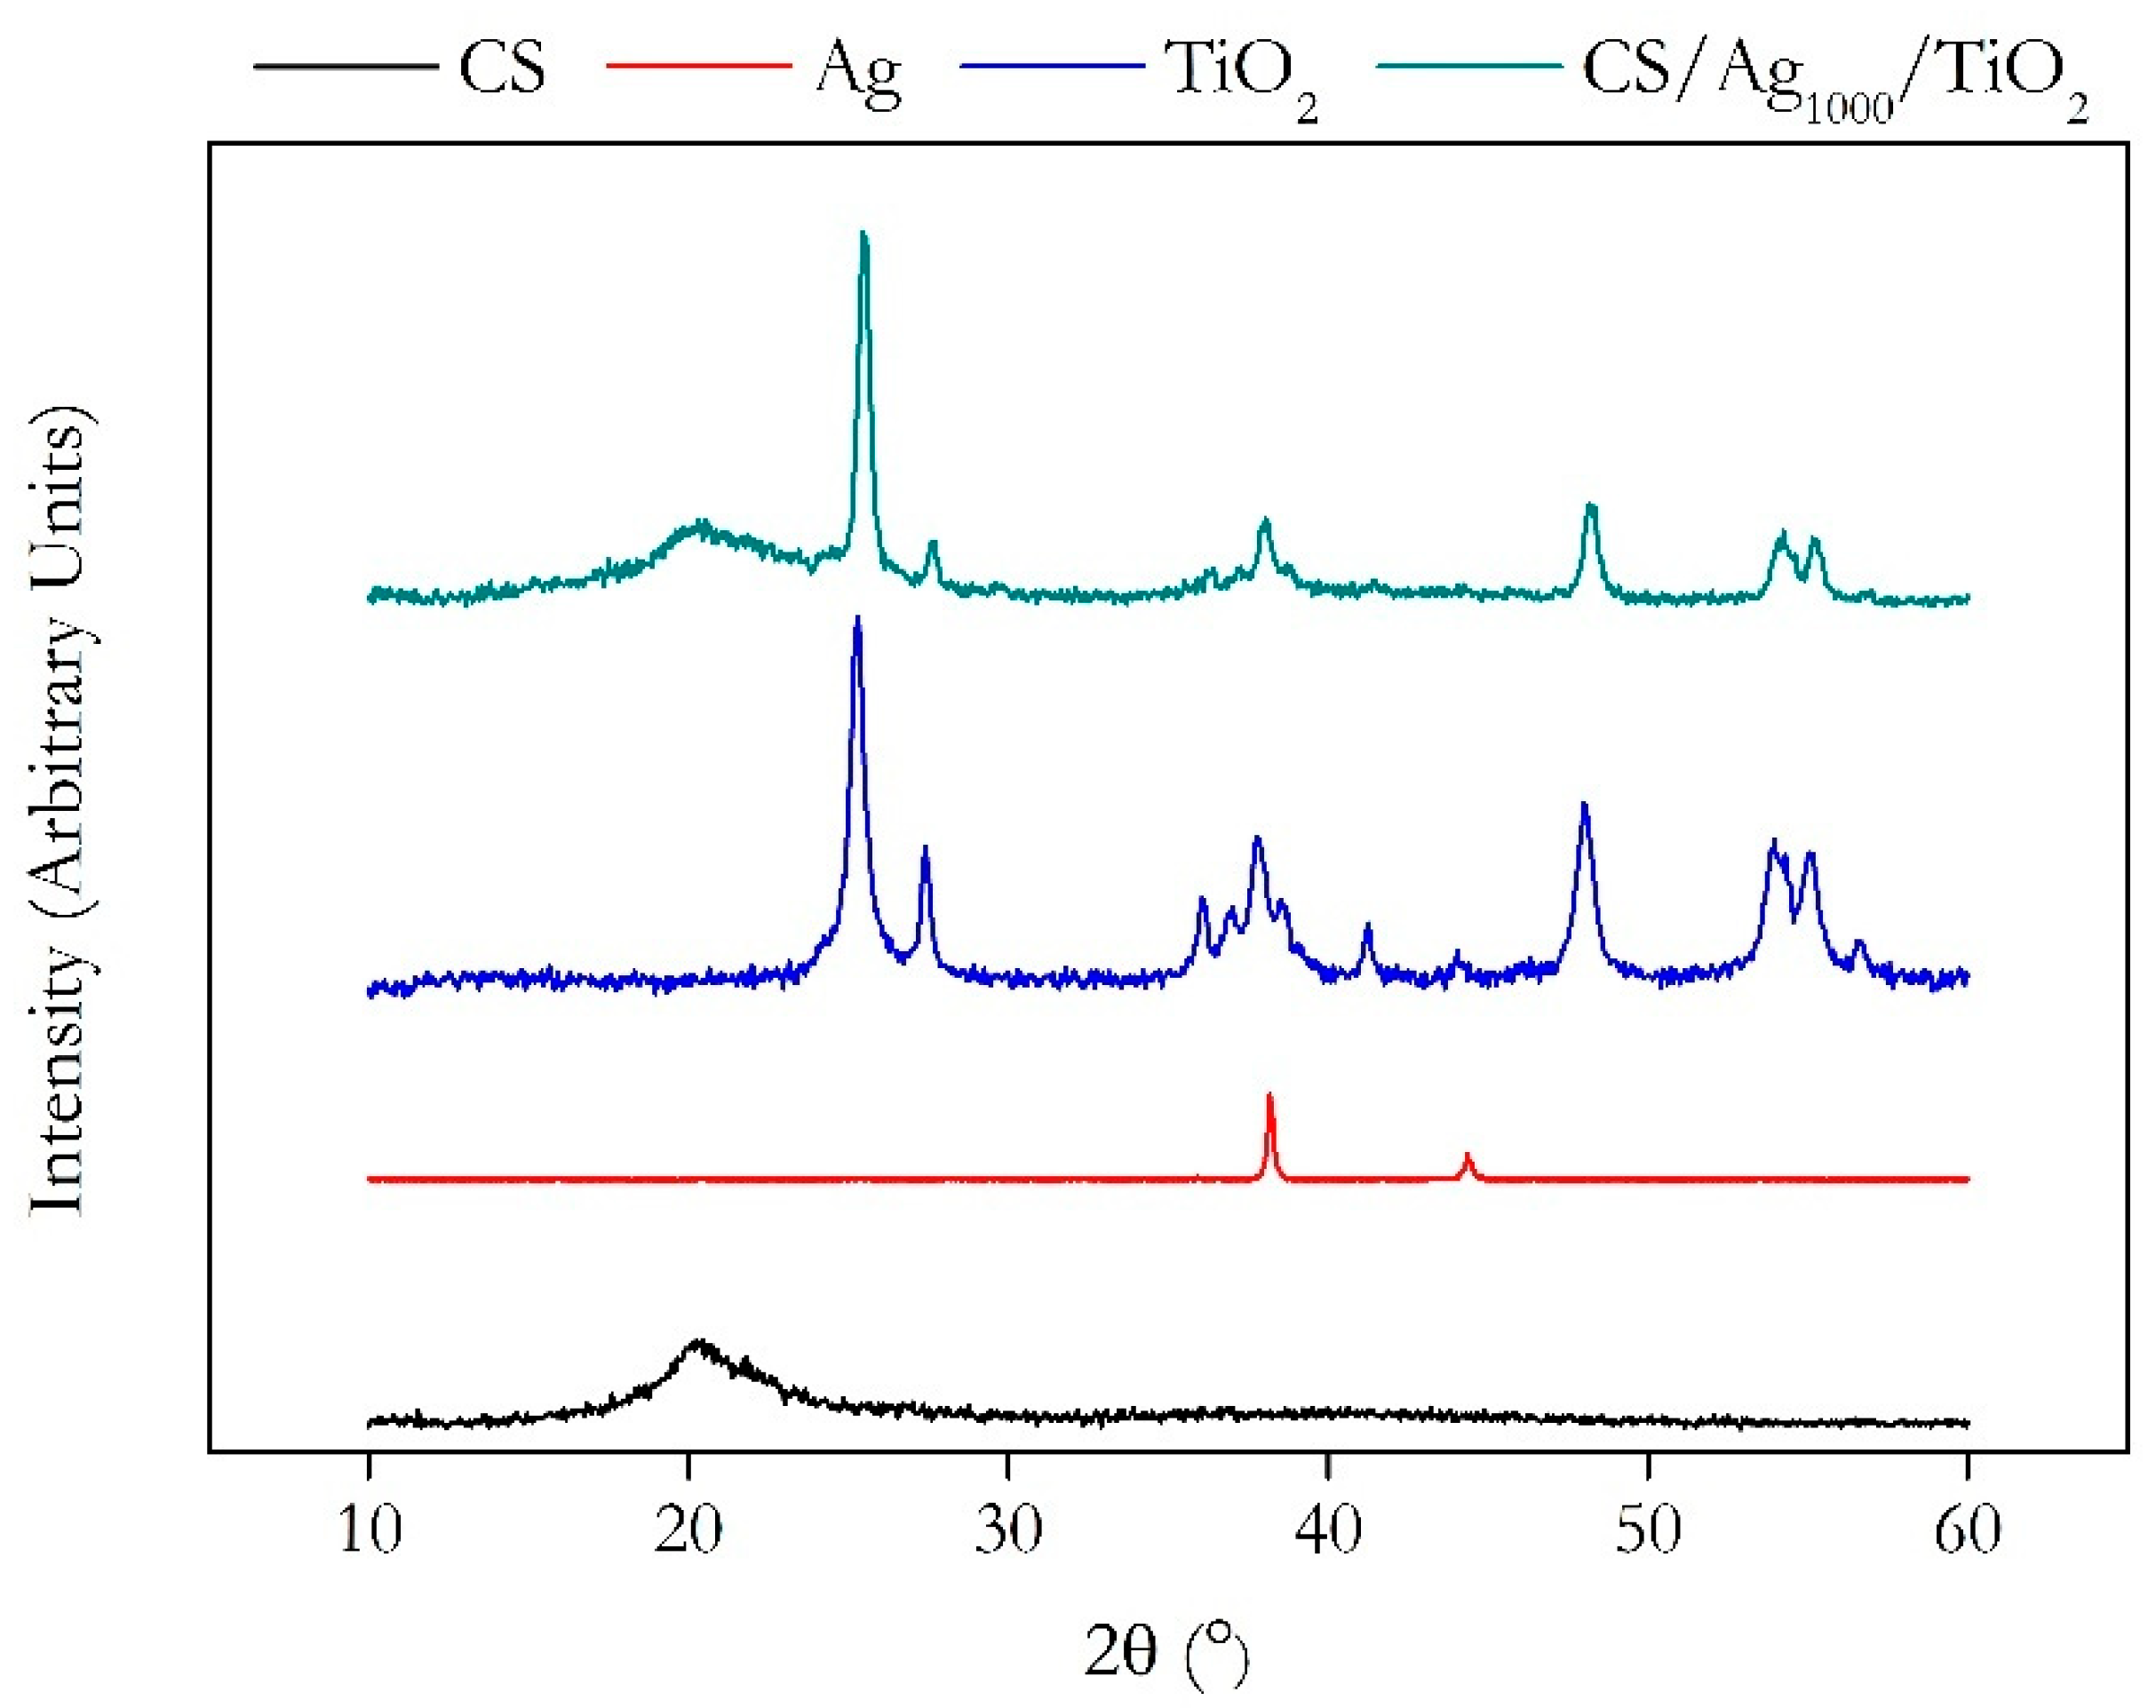
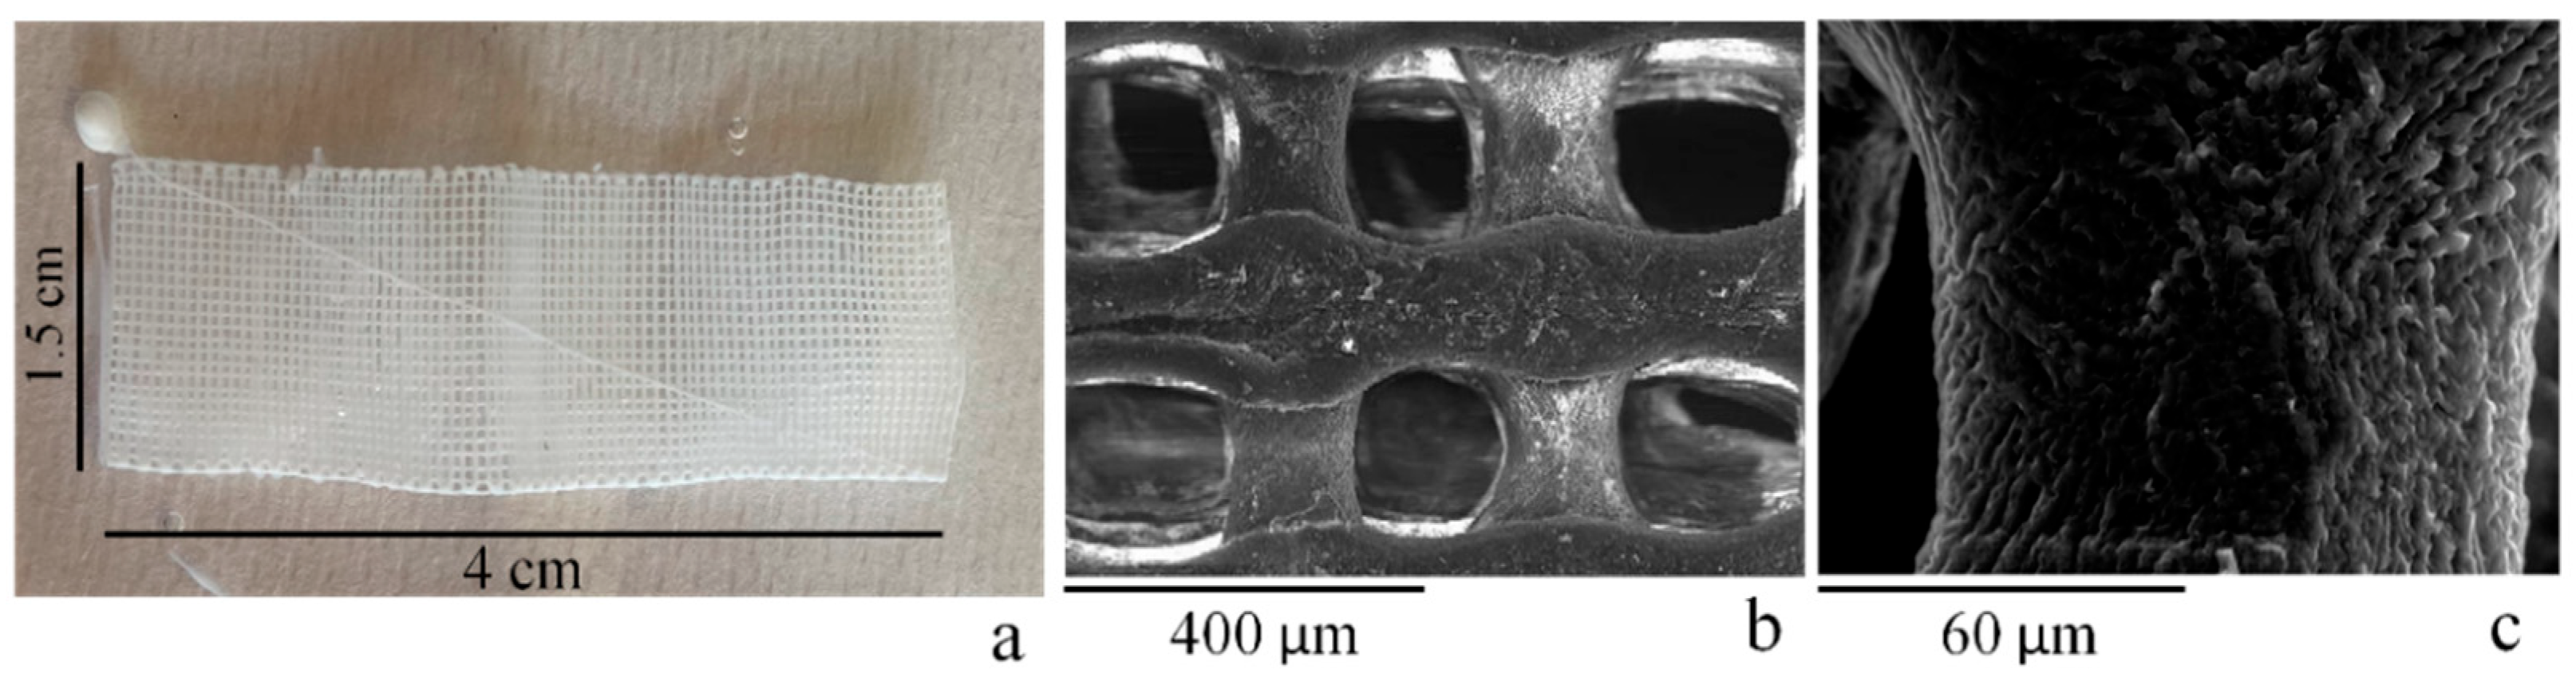
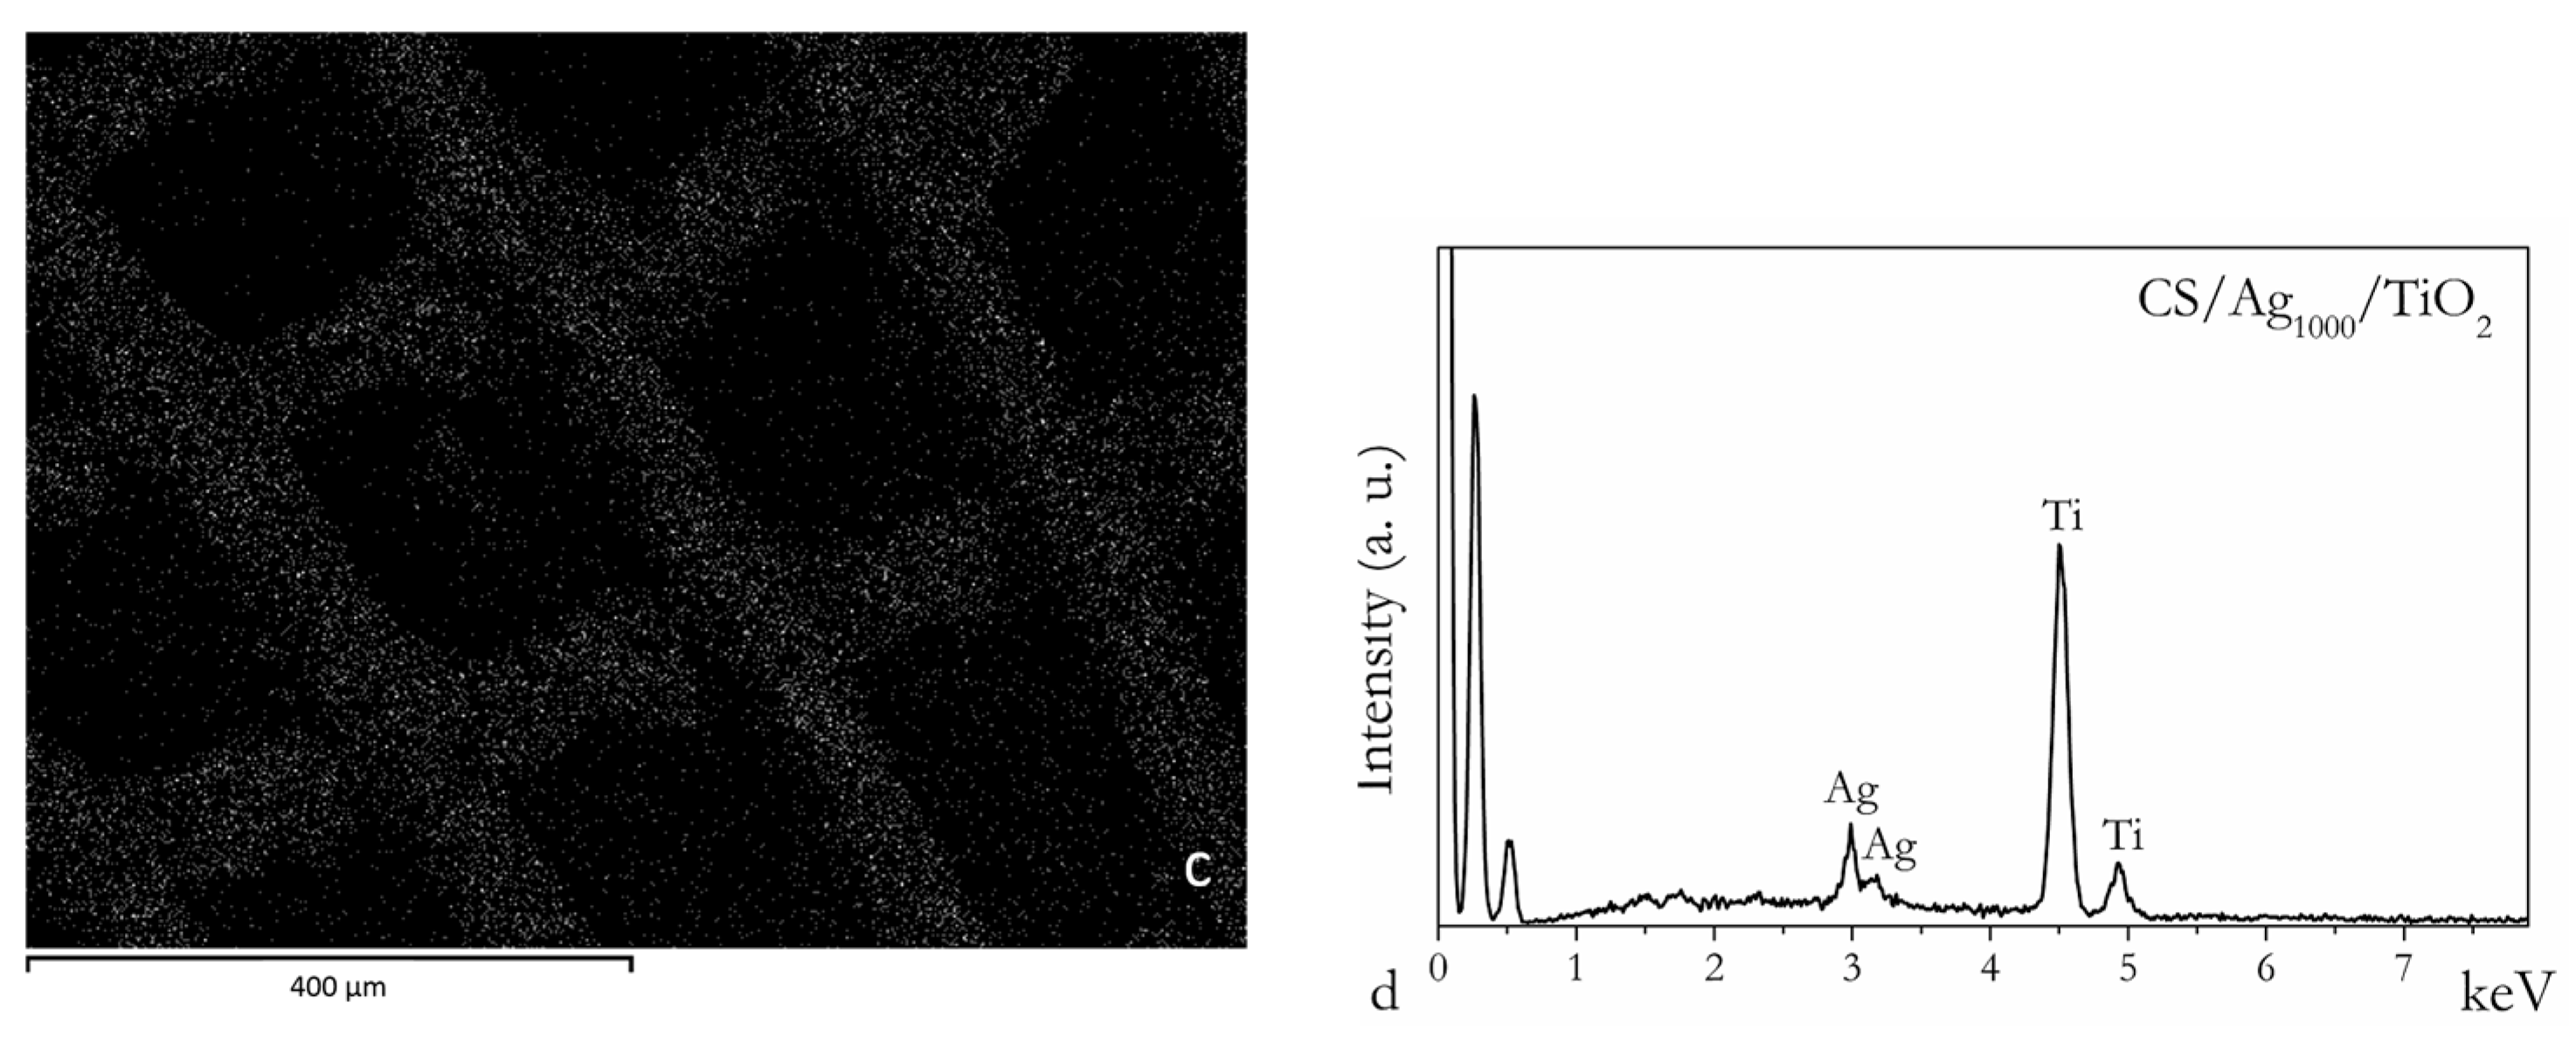
2.1. Chitosan Ag/TiO2 Scaffold Characterization

The UV–Vis absorption spectra of silver sols at different concentrations (10, 100, 1000 ppm) are reported in Figure S1. The absorption peak at about 400 nm is attributed to the surface plasmon excitation in Ag nanoparticles. The spectral position of the absorption band depends on the size of the metal nanoparticles [57]: larger silver nanoparticles exhibit absorption peaks at longer wavelengths (red shifting) [58]. The Ag nanoparticles sols show a strong and broad absorption band at λmax = 418 nm (1000 ppm), 405 nm (100 ppm) and 400 nm (10 ppm), corresponding to a size of 45 nm, 30 nm and 20 nm, respectively [58,59]. The colloidal sol Ag1000 has a wide and asymmetrical absorption band, probably due to the presence of two or three “families” of nanoparticles with different sizes.
In Figure 1, the FTIR spectra collected on the CS, CS/TiO2 and CS/Ag1000/TiO2 scaffolds are reported.
The FTIR spectra of all of the scaffolds show the typical features of chitosan: the stretching vibrations νO-H and νN-H in the 3500–3300 cm−1 range, the stretching vibration of amide I (νC = O at 1640 cm−1), the bending vibration of amide II (δN-H at 1556 cm−1) and the stretching vibration of the amide III bands (νC-N+ δN-H at 1261 cm−1). In the FTIR spectra of CS/TiO2 and CS/Ag1000/TiO2, νO-H, νN-H and δN-H slightly shift to lower wavenumbers, evidencing the interaction of the amino and hydroxyl groups in the chitosan with the TiO2 and Ag nanoparticles [25,60]. The other features do not show changes.
The X-ray diffraction pattern of Ag/TiO2 embedded in the 3D chitosan scaffold (CS/Ag1000/TiO2), compared to those of chitosan (CS), TiO2 powder (P25) and silver reference (Ag) (RUFF Database no R070416), is reported in Figure 2.
The rutile and anatase features are clearly detectable in the CS/Ag1000/TiO2 diffraction pattern, along with the contribution of Ag nanoparticles (2θ = 38.15° and 44.35°) and amorphous chitosan (broad background centered at 2θ~20.2°). The reflection planes of the anatase phases (101), (004), (200), (105) and (211) are at 2θ = 25.3°, 38.0°, 48.1°, 53.9° and 55.2°, respectively, while the reflection planes of the rutile phases (110), (101), (111), (210) and (211) are at 2θ = 27.6°, 36.2°, 41.3°, 44.5°, 54.4°, respectively. The TiO2 nanoparticle size, both pure and embedded in the scaffold, is ~20 nm for the anatase phase and ~25 nm for the rutile phase, as determined by the Scherrer equation [32,39].
The highly ordered structure and dimensional accuracy of the chitosan scaffold were easily attained by 3D printing, as clearly evidenced by the picture and SEM images (Figure 3).
The geometry of the scaffold is accurate, well-defined (Figure 3a) and characterized by a 3D structure made of a weave of filaments of about 100 μm, building a uniform lattice. The threads in a layer are rotated by 90° with respect to those of the previous one, forming inner square channels with apparent sides of about 200 μm (Figure 3b). At high magnification, the surface of the filaments appears spongy, with non-interconnected pores roughly homogenously distributed (Figure 3c). In Figure 4, the SEM image in the secondary electron (a), the EDS elemental Ti and Ag maps (b and c) and the elemental analysis (d) recorded on CS/Ag1000/TiO2 are reported. The geometry and size of the threads and interconnected channels are not altered by the addition of Ag and TiO2. Moreover, the EDS elemental map reveals that Ag and TiO2 are homogeneously dispersed into the chitosan matrix, and the TiO2 nanoparticles are arranged in micrometer sized agglomerates.

2.2. Adsorption and Photocatalytic Degradation Experiments

2.2.1. Equilibrium Adsorption Experiments

The effective photodegradation of pollutant molecules requires their adsorption on the photocatalyst. The adsorption is a surface phenomenon at a solid/liquid interface leading to a change in the concentration of the pollutant adsorbate in the solution. The interaction between the adsorbate and the adsorbent mainly depends on the surface charge and porosity of the substrate and the pH of the solution [61].
The adsorption of the pharmaceuticals (0.01 mM and 0.1 mM) on scaffolds in batch was verified with dark tests for 180 min.
The adsorption percentage (Ads (%)) of the PhCs was determined by:
A d s   % = C 0 C e C 0   100
where C0 and Ce are the initial and equilibrium concentrations, respectively.
The adsorption capacity (adsorption uptake) at equilibrium qe (mg/g) was calculated by:
q e   = C 0 C e w   V
where V (mL) is the volume of the adsorbate solution (PhCs) and w (g) is the weight of the adsorbent chitosan.
The adsorption percentage Ads (%) and the adsorption capacity qe of AMX, PAM and AMX/PAM are reported in Table 1.
The experimental curves expressed as qt (mg/g) versus t (min) are shown in Figure S2. The adsorption rate is high during the first 30 min for all the PhCs; then, after 60 min, it quickly decreases until equilibrium. The rapid adsorption of the PhCs may be favored by the presence of several available sites of the scaffolds, which progressively decrease, causing a slowdown of the adsorption. It is known that chitosan has a great adsorption capacity thanks to its high contents of the OH and NH functional groups, which can provide electrostatic interaction with organic molecules [62,63].
The main functional groups in AMX (COOH, NH2 and OH) and in PAM (C = O, NH2 and OH) may be involved in electrostatic interactions and hydrogen bonds. At a working pH of 6.8, the AMX is negatively charged (isoelectric point IP = 5.7), while the chitosan is positively charged (IP = 6.3) [64], and, consequently, thanks to electrostatic interactions, 10.8% and 7.6% of the antibiotic, for the 0.01 mM and 0.1 mM concentrations, respectively, can be physisorbed on the CS matrix. The presence of TiO2 nanoparticles in the chitosan matrix does not influence the AMX adsorption at 0.01 mM, while an increase occurs for higher concentrations. An increased adsorption percentage Ads (%) is observed on the scaffolds with silver nanoparticles for both AMX concentrations. Since the adsorption sites on the scaffold surface derive from the different phases (chitosan, TiO2 and Ag), the presence of nanoparticles on the chitosan surface, thanks their high surface area, can increase the available sites, improving the adsorption capacity of the scaffolds [65,66].
In the case of PAM on all scaffolds, the adsorption percentage Ads (%) is lower than for AMX: from 7.3% to 9.8% for 0.01 mM and from 3.6% to 6.4% for 0.1 mM (Table 1). Paracetamol in solution, which is weakly electrolytic, can be found in ionized and non-ionized forms depending on the pH. Its dissociation constant, pKa, is 9.4 [67]: at pH 6.8, paracetamol is mainly in its non-ionized form (molecular form). The adsorbent/adsorbate electrostatic interactions are not very efficient for the adsorption process, unlike what happens for AMX. Intermolecular hydrogen bonds, N-H···O and O-H···O, are expected to provide the main contribution to PAM adsorption on chitosan [67]. The TiO2 and Ag nanoparticles added into the scaffold induce an improvement in PAM adsorption. This may be due to an increase in the available active sites on the nanocomposite surface, enhancing the adsorbate–adsorbent interactions [68].
For the absorption of the AMX/PAM, both drugs compete for the same active sites. Ads (%) appears to be intermediate between the two PhCs, from 5.6% to 9.1%, as reported in Table 1. An enhancement in adsorption is achieved on the CS scaffolds with TiO2 and Ag nanoparticles, as was also reported separately for AMX and PAM alone.
For the sake of comparison, the adsorption percentage Ads (%) was also determined on pure TiO2, with the following results: 7.3 and 5.1 (AMX) and 4.4 and 3.2 (PAM) for 0.01 mM and 0.1 mM concentrations of the PhCs, respectively, and 2.7 in AMX/PAM for 0.1 mM.
The adsorption capacity qe is higher for AMX and AMX/PAM than for PAM due to the electrostatic interactions and hydrogen bonds developed with the chitosan matrix. The Ag nanoparticles, promoting the adsorbate–adsorbent interactions, enhanced the adsorption capacity qe for all PhCs.
For all the PhCs and scaffolds, there is a relationship between the initial concentration of PhCs and the adsorption capacity qe: at a fixed amount of adsorbent, passing from 0.01 mM to 0.1 mM of PhCs, qe increases; on the contrary, Ads (%) decreases. At low initial drug concentrations, the adsorption is fast and rapidly reaches equilibrium. The molecules of the PhCs form an external monolayer covering the scaffolds. On the other hand, at higher concentrations, the adsorbent surface is progressively occupied by the drug molecules, and the adsorption rate decreases. The result is a higher qe and a high quantity of molecules left in the solution, or lower Ads (%) [61].

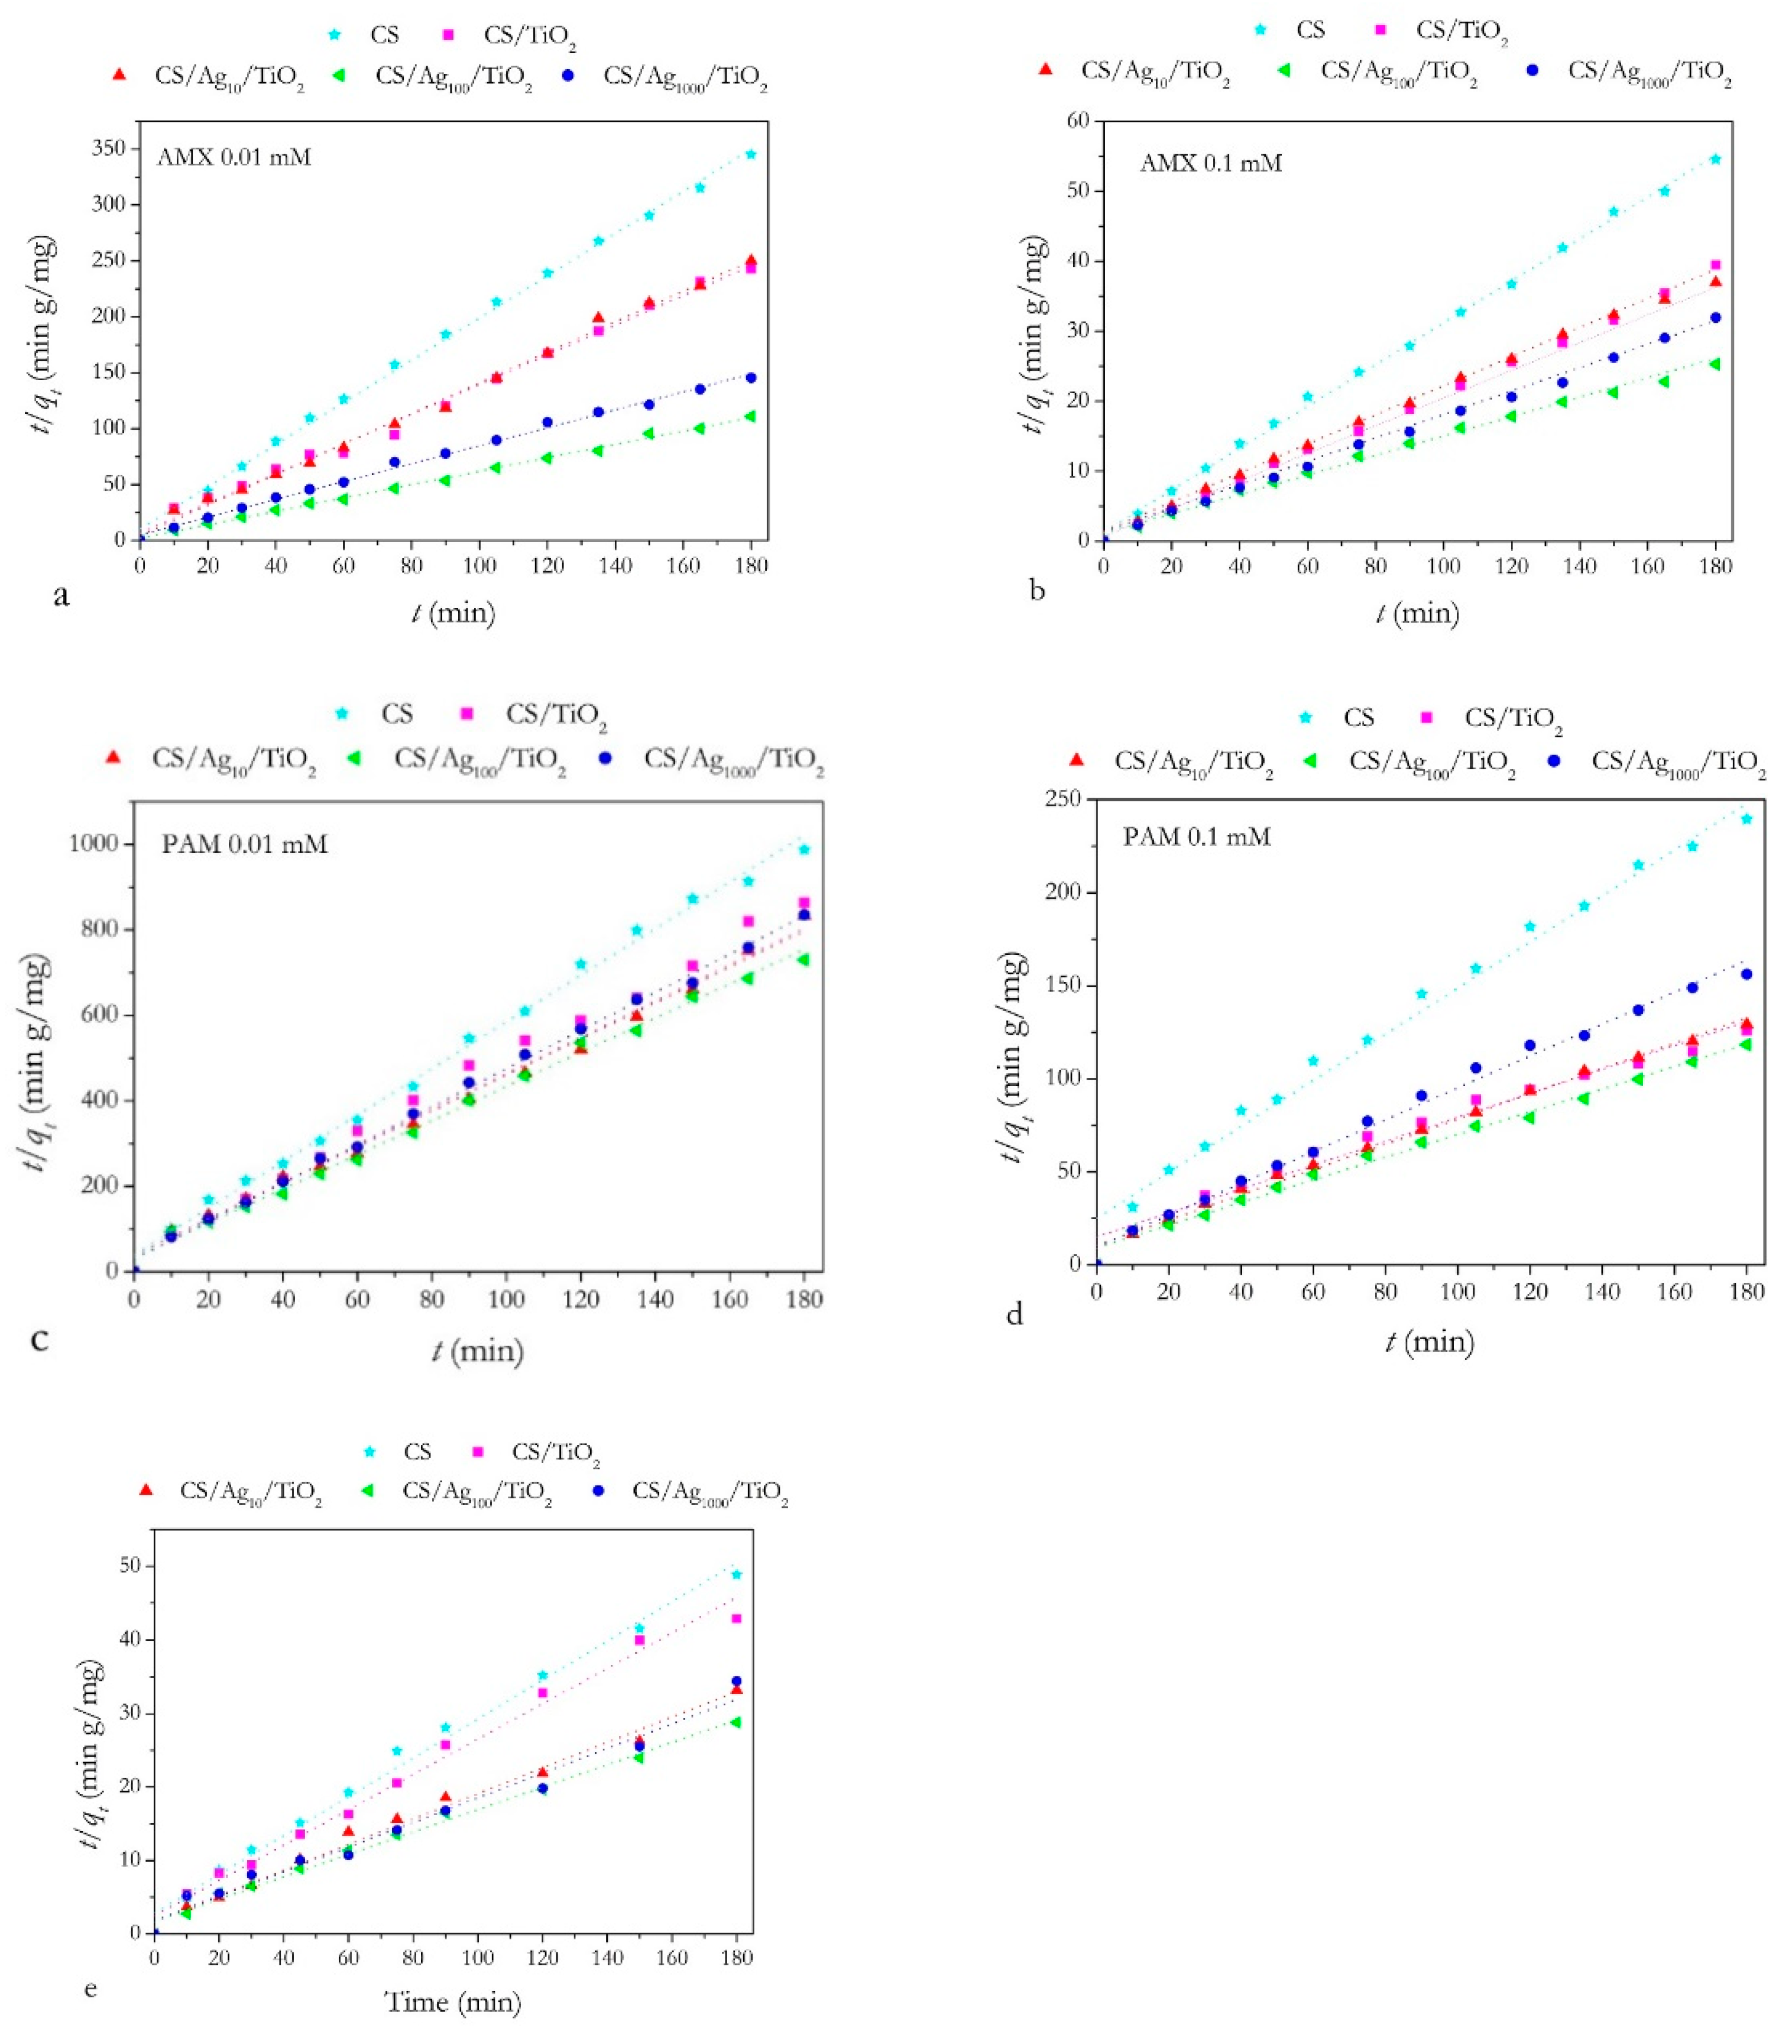
Adsorption Kinetics Studies

The adsorption kinetics studies were performed by fitting the experimental data to pseudo-first order (PFOads) and pseudo-second order (PSOads) models, which are used to predict the uptake rate of PhCs onto the adsorbent [18,69,70].
The differential form for PFOads is:
d q t d t = k 1 q e q t
where qe and qt are the adsorption uptakes (mg/g) at equilibrium and at time t, respectively; t is the time (min); k1 (min−1) is the first order constant.
With the boundary condition q0 = 0, the solution of (3) may be written as:
l n q e q e q t = k 1 t
k1 can be obtained by the slope of the linear fit of ln (qe/(qeq)) vs. t and indicates the rate to reach equilibrium (higher k1, shorter times).
In the PSOads model, the uptake rate is described by a second order reaction with respect to the number of available adsorption surface sites.
d q t d t = k 2 q e q t 2
where k2 (g/(mg min)) is the PSOads rate constant. By integrating Equation (5) with the boundary condition q0 = 0 and by subsequent rearrangement, a linearized form is obtained:
t q t = 1 k 2 q e 2 + t q e
The PSOads rate constant k2 may be estimated by a linear fit to t/qt vs. t.
The adsorption kinetics of all the PhCs adsorbed on the chitosan and nanocomposite scaffolds fit well with a pseudo-second order model (r2 ≥ 0.96). On the contrary, the pseudo-first order model adequately fits the experimental data only for the first 20–30 min of the sorption process, providing an r2 ≤ 0.90.
For a PSOads model, a plot of t/qt vs. t should provide a linear relationship (Equation (6)): this is shown in Figure 5, and the PSOads rate constants are reported in Table 1.
The PSO model is based on the hypothesis that the adsorption rate is proportional to the initial concentration [C] of adsorbate species and to the square of the number of empty sites [18,71].

2.2.2. Photocatalytic Experiments

The photolysis and the photocatalysis under UV–Vis light irradiation were determined by the decrease in the absorbance at the main absorption peak of the PhCs solution, as previously explained. As an example, Figure S3 shows the typical absorption curves of AMX, PAM and AMX/PAM on CS/Ag100/TiO2 as a function of irradiation time, with a UV–Vis light source intensity of 3.5 mW/cm2 on the sample.
Figure 6 displays the results of the photodegradation of amoxicillin (Figure 6a,b), paracetamol (Figure 6c,d) and the AMX/PAM mix (Figure 6e) in the presence of the pure photocatalyst (TiO2) and TiO2 supported on the chitosan scaffolds (CS/TiO2 and CS/Agxx/TiO2, where the “xx” subscript indicates the Ag concentration in ppm, i.e., 10, 100, 1000). In the same figure, the direct photolysis results are shown (AMX, PAM, AMX/PAM and CS).
AMX is relatively stable under a radiation of wavelength above 300 nm: by direct photolysis, nearly 15% of it is degraded after exposure to UV–Vis light according to several authors [41,42,43]. The photolytic degradation is mainly due to the AMX hydrolysis: H2O attacks the β-lactam ring, causing the ring opening [22]. Pure chitosan scaffolds do not exhibit photocatalytic activity: no substantial variations are observed for the AMX photolysis adsorbed on CS at both AMX concentrations (about 10–12%).
The TiO2 catalyst, both pure and CS-immobilized, exhibits a significant efficiency of AMX photodegradation (Figure 6a,b). The complete removal of AMX on the pure TiO2 catalyst for a 0.01 mM concentration is reached in about 80 min, and that for 0.1 mM is reached in 120 min. In the presence of CS/TiO2, the complete AMX degradation is reached in 180 min and 280 min for 0.01 mM and 0.1 mM concentrations, respectively.
The photocatalytic efficiency of CS/TiO2 is lower than that of pure TiO2 due to the minor number of TiO2 nanoparticles available for photocatalysis when incorporated into the matrix. A great improvement in the photocatalytic efficiency of the scaffolds is observed after adding Ag nanoparticles into the matrix. In particular, the CS/Ag100/TiO2 scaffold gives the best results for both AMX concentrations: 90 min for the photodegradation of AMX 0.01 mM and 140 min for AMX 0.1 mM, comparable with the pure TiO2 catalyst. The improvement in photocatalytic activity in the presence of silver nanoparticles can be explained by a synergistic effect of both Ag nanoparticles plasmon resonance excited by the visible component of the irradiation light and a delayed electron-hole recombination induced by Ag nanoparticles [72]. Moreover, the AMX adsorption on CS/Agxx/TiO2 photocatalysts, as found from the dark experiments (Table 1), improves the surface contact between the AMX molecules and the reactive oxygen species generated on the catalyst surface by photoexcitation [54,73].
The direct photolysis of PAM alone and PAM adsorbed on CS under UV–Vis irradiation, due to its poor absorbance at wavelengths >350 nm, shows a negligible effect, while a considerable increase in the photodegradation rate for both PAM concentrations is obtained with the addition of the photocatalysts (Figure 6c,d). In presence of pure TiO2, the complete degradation occurs in about 100 min and 125 min for 0.01 mM and 0.1 mM concentrations, respectively. The PAM removal mediated by CS-supported TiO2 is reached in more than 180 min (0.01 mM) and 300 min (0.1 mM), more slowly than with TiO2 alone. As for the AMX photodegradation, the addition of Ag nanoparticles increases the photocatalysis efficiency, and the best performance is reached by CS/Ag100/TiO2: PAM is completely photodegraded in 130 min for 0.01 mM and in about 200 min for 0.1 mM. After increasing the Ag content (CS/Ag1000/TiO2), a decrease in drug degradation is observed. A high Ag content could reduce the TiO2 photocatalytic activity because the slightly negatively charged Ag nanoparticles [74] can act as recombination centers for the photogenerated holes, reducing the efficiency of charge separation [54,75].
All of the photocatalysts exhibit a good degradation efficiency towards the mixed solution of PhCs AMX/PAM (0.1 mM), as shown in Figure 6e. The photodegradation of AMX/PAM is faster than that of the single drugs, especially with respect to PAM. As reported by several authors, the photodegradation process of secondary residues, as reported below, can influence the decomposition rate of the component drugs [20,76].
The reusability of the photocatalysts was tested only on the AMX 0.01 mM photodegradation using the CS/Agxx/TiO2 scaffolds (Figure S4). Three cycles consisting of adsorption in the dark, photocatalytic experiments and scaffold washing in distilled water were carried out. In all of the scaffolds, a good photocatalytic efficiency is retained: CS/Ag100/TiO2 exhibits the best performance, and more than 80% of AMX is photodegraded until the last cycle. Only in the case of CS/Ag10/TiO2 does the efficiency decrease, and about 65% of AMX is degraded after a third cycle.
The photocatalytic degradation process may be described by specific kinetics models. The main reported model for heterogeneous photocatalysis is the Langmuir–Hinshelwood mechanism, which states that the degradation rate, DR (mmol L−1 min−1), is proportional to the fractional coverage of the reactant on the catalyst surface [21,25,31,67]. The Langmuir equation is as follows
DR = −dCt/dt = kKLCt/(1 + KLCt)
where Ct is the concentration (mmol L−1) at the irradiation time t (min); k and KL are the rate constant (mmol L−1 min−1) and the Langmuir adsorption constant (l mmol−1), respectively.
The DR equation can be simplified to pseudo-first order kinetics (PFOpht) in the case of low concentrations or the relatively weak adsorption of pollutants (KLCt << 1). The exponential solution is Ct = C0 exp(−kappt), where kapp = kKL (min−1) is the rate constant and C0 is the initial concentration of PhC. kapp can be determined by a linear fit of ln (Ct/C0) vs. t. If KLCt >> 1, the reaction kinetics are of pseudo-zero order (PZOpht) Ct = C0kt or, equivalently, Ct = C0 (1 − k0t), where C0k0 = k and k0 (min−1) is the zeroth order rate constant.
The photodegradation kinetics results are shown in Figure 7 and listed in Table 2.
The photocatalytic degradation kinetics of AMX onto TiO2 powder (inserts in Figure 7a,b) satisfactorily fit with a PFOpht, whereas, in the presence of the CS/TiO2 and CS/Agxx/TiO2 scaffolds, the concentration of AMX decreases linearly (PZOpht) with the irradiation time, as depicted in Figure 7a,b. Even if this behavior is less frequent than a pseudo-first order, it is reported for several heterogenous photocatalysis systems [32,73,77,78].
The experimental data of PAM photocatalysis on all catalysts agree better with the PFOpht model, as evident in the plot of ln (Ct/C0) versus irradiation time reported in Figure 7c,d. The photodegradation of AMX/PAM on the different scaffolds (Figure 7e) suggests a PZOpht kinetic behavior. On the CS/Agxx/TiO2 scaffolds, two photodegradation rates are noticed.
In the case of the CS/Ag10/TiO2 and CS/Ag100/TiO2 scaffolds, a significant decrease in the kinetic constant occurs after approximately 100 min and 75 min, respectively, when the degradation of AMX/PAM has reached approximately 85%. An opposite behavior occurs in the presence of the scaffold with CS/Ag1000/TiO2: after about 100 min, when only 30% of the drugs are photodegraded, the degradation rate considerably increases until complete removal (240 min). This allowed for the identification of two different k0 reported in Table 2. The degradation rate of the mixture in the presence of TiO2 powder clearly shows a PFOpht behavior, as is the case for AMX and PAM alone.

2.3. Liquid Chromatography–Mass Spectrometry Analysis of AMX and PAM Degradation Products

Liquid chromatography–mass spectrometry allowed for the checking of the presence of amoxicillin, paracetamol and their degradation products in the sample solutions treated by photocatalysis. The monitored SIM ions are reported on Table 3.
The LC–MS analysis of AMX suggests the presence of two main degradation pathways for AMX, as was already reported by Guo et al. (2015) [79]. The first one is based on the hydroxylation of the AMX phenolic ring and of the amino group by the addition of one (m/z 382) to four hydroxyl groups (m/z 428), with intermediates observed at m/z 383, 398 and 412. At m/z 231, a degradation end-product coming from the cleavage between the nitrogen of the amino group and the carbonyl group was observed. The second degradation mechanism, based on the opening of the β-lactam ring, allowed for the observation of the presence of the penicilloic acid (m/z 384) and other derivatives at m/z 340, 354 and 160.
A lower concentration of degradation products was recorded with the TiO2 catalyst at the end of irradiation treatment (about 75 min) with respect to CS/Ag1000/TiO2 (monitored at the end of the irradiation process at 120 min). When AMX and PAM were simultaneously present in the solution with all catalysts, a higher number of AMX degradation products was observed at the end of the irradiation, in comparison to AMX only.
The LC–MS analysis of the PAM samples evidences all the degradation products (i.e., hydroquinone, 1,2,4-trihydroxybenzene, benzoquinone and p-nitrophenol) reported in Table 3. The photocatalytic degradation process of paracetamol was already described by Moctezuma et al. (2012) [80].
Hydroquinone, an intermediate PAM degradation product, was detected in all the samples investigated. Its concentration monitored after 60 min in PAM on the CS/Ag1000/TiO2 samples was almost constant over the time investigated (180 min). The PAM samples on TiO2 that were analyzed at the end of the photodegradation process (after about 120 min irradiation) showed a lower concentration of the hydroquinone degradation product with respect to the PAM samples on CS/Ag1000/TiO2 (monitored at the end of the process after 210 min irradiation). On the contrary, when PAM and AMX are mixed onto CS/Ag1000/TiO2, the hydroquinone concentration increased over time up to the end of the photocatalysis process (about 210 min), suggesting a competition in the drug degradation process. With TiO2, higher PAM degradation efficiency with respect to CS/Ag1000/TiO2 was found, and the hydroquinone concentration decreased after 30 min until the end of the degradation process.
The concentration of the degradation intermediate product benzoquinone derived from hydroquinone increased almost linearly during the degradation process for PAM alone or PAM mixed with AMX, in the presence of the CS/Ag1000/TiO2 catalyst.
In the case of 1,2,4-trihydroxybenzene, another PAM degradation intermediate derived from hydroquinone, its concentration reaches the maximum at the end of the process for all the samples investigated. P-nitrophenol was also monitored, and it was observed that its concentration decreased over time when PAM is mixed with AMX for the TiO2 catalyst. For the PAM/AMX mix, in the presence of CS/Ag1000/TiO2, the P-nitrophenol concentration increases over time until the end of the degradation process, whereas for PAM, it reaches a plateau after 120 min.

2.4. Residual Biocidal Activity of the PhCs Degradation Products

As observed by the LC–MS analyses, at the end of the PhCs photocatalytic degradation, some by-products were formed. The disappearance of the parent compound does not ensure that the by-products do not have biocidal and/or biostatic activity. The results of the Agar Disk Diffusion Assay (Table S1) confirm the biocidal inactivity of paracetamol, while the inhibition zone diameter for amoxicillin varies between 8 and 20 mm. An example of the inhibition test result is displayed in Figure S5. After the photodegradation process, as described above, all of the PhC degradation products identified by LC–MS show no biocidal activity. Unexpectedly, at the tested concentration, the AMX before photodegradation shows no biocidal activity in the mixed AMX/PAM. Further investigations beyond the scope of this study are needed.

3. Materials and Methods

3.1. Chemicals

The Aeroxide@ P25-TiO2 (Evonik Industries AG, Essen, Germany), silver nitrate, glacial acetic acid, amoxicillin and acetaminophen (paracetamol) were purchased from Sigma-Aldrich (Saint Louis, MO, USA) and used as received.
The Chitosan ChitoclearTM (degree of deacetylation 95%; molecular weight 150–200 kDa) was obtained from PRIMEX Ehf (Siglufjordur, Iceland). For all the experiments, ultrapure water (Water Purification System—Millipore Milli-Q® Academic A10® Ultra Pure, Merck Millipore, Burlington, MA, USA) was used.

3.2. Chitosan/Ag/TiO2 Formulations

The Chitosan ChitoclearTM (6% w/v) and Aeroxide@ P25-TiO2 (1% w/v) powders were accurately mixed and suspended in ultrapure water. The mixture was stirred to obtain a homogeneous dispersion. Then, the silver nanoparticles sols (10, 100, 1000 ppm)—obtained by the chemical reduction of AgNO3 using NaBH4 as a reducing agent (Ag/NaBH4 ratio 5/1) in the presence of PVA 1% (Ag/PVA ratio 100/1) to prevent the particles’ aggregation—were put into the chitosan/TiO2 dispersion [74]. Finally, glacial acetic acid (2% v/v) was added to dissolve the chitosan in order to embed the Ag and TiO2 nanoparticles. The formulation was maintained under magnetic stirring for 24 h. The blended material was then ready to be printed.

3.3. 3D Scaffold Design and Gelation Process

For the design of the Ag/TiO2–Chitosan composite, the Solidworks™ software (Dassault Systèmes SolidWorks Corporation, Waltham, MA, USA) was used, which allows for the creation of 3D models in stl format. The models are processed with the Slic3r™ (RepRap) program, which generates a machine code (G-code) for the 3D printer.
The 3D printer employed to realize the scaffolds was in-house-built. Arduino Mega2560 hardware coupled with a RAMPS 1.4. and the Marlin™ software were used. The 3D printer is provided with a printing surface made up of aluminum plates cooled by Peltier’s cells to freeze the deposited material. The extrusion apparatus consists of a pump that acts on a 5 mL syringe mounting a 26G needle (inner diameter 192 mm) loaded with the polymer formulation. During the process, the extrusion apparatus moves along the x, y and z axes.
The scaffolds are built by an orthogonal grid composed of crossed filaments of about 100 μm, arranged in superimposed layers and forming square-section channels with 200 μm per side. The 3D scaffold dimensions (formed by five layers) are 15 mm × 40 mm × 1 mm. The fully frozen 3D scaffold was then placed in a gelling environment to maintain the three-dimensional structure [51]. The chitosan scaffolds were placed in a chamber saturated with ammonia vapors (ammonia solution 28%) to favor the sol-gel transition: the positive charges on the acetic acid, used to dissolve the chitosan polymer, are neutralized in the alkaline environment, and an ionotropic gelation occurs, allowing for the formation of a stable network between the polymer chains [49].
The scaffolds developed were pure chitosan (CS), chitosan with embedded TiO2 (CS/TiO2) and chitosan with embedded TiO2 and silver nanoparticles (CS/Agxx/TiO2, where an “xx” subscript indicates the Ag concentration in ppm, i.e., 10, 100, 1000).

3.4. Characterization of Materials

The hydrodynamic size and surface charge (zeta potential) of the Ag nanoparticles sol were evaluated by dynamic light scattering (DLS) and electrophoretic light scattering (ELS) measurements at 25 °C (6 scans for each analysis), using a Brookhaven 90Plus Nanoparticle Size Analyzer (Brookhaven Instruments Corporation, Holtsville, NY, USA).
The UV–Vis characterization of the Ag nanoparticles was carried out by a Lambda-Bio 20 UV/Vis Spectrometer (Perkin Elmer Italia S.P.A., Milan, Italy) at 23 °C.
The crystal structure of the TiO2 and Ag nanoparticles was established by CuKα radiation (λ = 1.5406 Å) at 40 kV and 40 mA, using a Thermo ARL X’TRA X-ray diffractometer equipped with Si–Li detector (Thermo Fisher Scientific, Waltham, MA, USA). The X-ray powder diffraction patterns were acquired at room temperature in the range 10°–60° and at a 0.2° scan rate (in 2θ). The Scherrer equation was applied to estimate the average diameter of the crystallites using the line broadening of the main diffraction peaks.
A Jeol JSM 6400 (JeolSpa, Milan, Italy) Scanning Electron Microscope (SEM) was used to investigate the 3D printing accuracy and the scaffolds’ morphology. The distribution of the TiO2 and Ag nanoparticles into the chitosan matrix was scanned by an Oxford Instruments Link Analytical Si (Li) Energy Dispersive System (EDS) detector connected to an SEM instrument. The data were elaborated on by the INCA built-in software.
A Thermo-Nicolet Nexus spectrometer (Thermo Fisher Scientific, Milan, Italy) equipped with a Thermo Smart Orbit ATR diamond accessory was employed to collect FTIR spectra directly on dried samples. The measurements were carried out in the 4000–400 cm−1 range, with spectral resolution of 4 cm−1.

3.5. Adsorption and Photocatalytic Degradation Experiments

The adsorption and photocatalytic experiments were performed in a small-scale reactor system previously described [45]. Briefly, an open glass vessel was equipped with a stainless-steel grid on which the chitosan scaffolds were fixed, pure or functionalized; a water-jacketed 125 W Helios-Italquartz medium pressure mercury-vapor lamp (emission range 300–800 nm), as an irradiation source, was kept at 14 cm from the solution surface. The irradiation power at the water surface was 3.5 mW/cm2, as measured by a digital meter PCE-UV34.
The adsorption ability and photocatalytic activity of the chitosan scaffold and chitosan-supported Ag/TiO2 were evaluated by experiments in the dark and under UV–Vis irradiation, respectively. The experiments were performed under varying PhC concentrations (0.1 and 0.01 mM) in order to test a PhC:TiO2 molar ratio of 1/10 and 1/100.

3.5.1. Equilibrium Adsorption Experiments

For the dark experiments, an aqueous solution (100 mL) of PhC (AMX, PAM and AMX/PAM) was put into a reactor equipped with CS or CS/Agxx/TiO2 scaffolds fixed on a support, just under the surface of the solution. The solution was maintained under stirring at room temperature until constant concentration. The PhC concentration was determined by absorbance measurements, according to the Lambert Beer law, using a Lambda-Bio 20 UV/Vis Spectrometer (Perkin Elmer Italia S.P.A., Milan, Italy) at a wavelength λmax corresponding to the maximum absorbance (229 nm for AMX, 244 nm for PAM and 236 nm for AMX/PAM). The PhC suspension was centrifuged and filtered by a 0.45 µm Cronus 13 mm nylon syringe filter prior the analysis.

3.5.2. Photocatalytic Degradation

For the photodegradation test, the UV absorbance at equilibrium at the end of the dark experiment was taken as the initial absorbance (A0). During the irradiation with the UV–Vis lamp, at defined time intervals, 2 mL of the solution was taken and filtrated by 0.45 µm Cronus 13 mm nylon syringe filters. The absorbance At of the PhC solution at time t was measured at 229, 244 and 236 nm for AMX, PAM and AMX/PAM, respectively. The normalized absorbance At/A0 of the PhC solution was assumed to be the measure of the concentration ratio Ct/C0, and the removal percentage due to photocatalysis was determined by R p h t   % =   C t C 0   100 .
The photolysis of the PhCs under irradiation (without any catalyst), in conditions identical to those of the photodegradation experiments, was also verified.
All the experiments were done in triplicate.

3.6. Liquid Chromatography–Mass Spectrometry Analysis of AMX and PAM Degradation Products

The amoxicillin and paracetamol sample solutions were characterized by liquid chromatography–mass spectrometry (LC–MS) by using single ion monitoring (SIM) acquisition mode to identify the degradation products. The samples were analyzed as technical replicates (n = 3) using an Agilent HP 1260 liquid chromatography system (Agilent Technology, Santa Clara, CA, USA) equipped with a 200-vial capacity sample tray and coupled to a QTRAP 4000 triple quadrupole/ion trap mass spectrometer (ABSCIEX, Framingham, MA, USA) interfaced with an electrospray source (ESI). A Luna C18 (2.1 × 150 mm, 5 µm) column (Phenomenex, Torrance, CA, USA) was used for separation. The injection volume was 10 µL. An elution system based on a solvent gradient (solution A: 0.1% aqueous formic acid (v/v); solution B: 0.08% formic acid in acetonitrile (v/v)) was delivered at 0.2 mL/min. A flow rate of 200 µL/min and a 30 min linear gradient were applied.
The source parameters were set as follows: ESI voltage 5.5 kV, declustering potential 70 V, ion source temperature 350 °C. The sheath gas (nitrogen, 99.999% purity) and the auxiliary gas (nitrogen, 99.998% purity) were delivered at flow rates of 45 and 5 arbitrary units, respectively. As for the relative quantitative analysis, the experiments were performed under positive ion-SIM conditions using a 20 ms-dwell time for each ion monitored.

3.7. Residual Antibacterial Activity

The residual antibacterial activity was evaluated by adopting the Kirby–Bauer disk diffusion test. Each strain used was subjected to a test of sensitivity to AMX and PAM before and after photocatalysis with the TiO2 and CS/Ag1000/TiO2 catalysts. The samples exposed to analysis came from the same batch (subjected to photodegradation), and their contents were previously analyzed by LC–MS. The antibacterial activity was tested following the NCCLS guidelines [81]. The bacterial strains used were: Enterococcus faecalis (ATCC 29212), Lactobacillus gasseri (ATCC 9857), Micrococcus spp., Acinetobacter baumannii, Alcaligenes spp. and Salmonella pullorum (specifically identified from the bacterial collection of the Microbiology Laboratory of the Department of Veterinary Science of Parma University). Each strain was chosen for its sensibility to amoxicillin, which was previously verified trough the Kirby–Bauer disk diffusion method. Before proceeding with the analysis, the samples were submitted to sterilization by filtration (0.22 μm filters) in order to completely avoid contamination.
The microorganisms were suspended, in a pure culture, in a Mueller Hinton broth tube and incubated aerobically for 1–2 h at 35 ± 2 °C. The inoculum concentration was adjusted to a 0.5 McFarland standard. Then, the broth culture was spread on Mueller Hinton Agar by streaking a sterile swab over the entire agar surface. A spot of 10 μL of the sample was added. Each test was carried out in duplicate for reproducibility. A negative and positive control was performed for each test. The plates were incubated under aerobic conditions for 18–24 h at a temperature of 35 ± 2 °C. Only the Lactobacillus gasseri needed a longer time of incubation, corresponding, in details, to the overnight culture for the inoculum and 48 h for the lecture.
The antimicrobial activities of both amoxicillin and paracetamol were tested against all the selected strains using the Agar Disk Diffusion Assay. All the experiments were performed in aseptic conditions under a laminar airflow cabinet, providing two replicates for each strain used. The inhibition zone diameter for any antimicrobial category selected was measured and expressed in millimeters.

4. Conclusions

Pharmaceutical compounds that are not completely metabolized, along with their by-products, predominantly excreted in urine and feces, are released in urban wastewater, causing potential (eco-) toxicological risks. To address this important environmental problem, Chitosan/Ag/TiO2 3D printed scaffolds were proposed as promising nanocomposite materials for photocatalytic degradation under the UV–Vis irradiation of AMX and PAM as target systems.
The Ag/TiO2 embedding in Chitosan 3D scaffolds enhances the adsorption of drugs on the catalysts, improving their photocatalytic efficiency and allowing for the separation of the photocatalyst from the polluted solution. The 3D printing technology allows for the obtention of a matrix with defined and repeatable geometries.
The SEM images confirm the accurate geometry of the scaffold, which is characterized by a 3D structure made of a weave of filaments of about 100 μm, building a uniform lattice. The EDS elemental maps show Ag and Ti homogeneously dispersed into the chitosan matrix.
The adsorption of pharmaceuticals on scaffolds rapidly reaches the equilibrium, and high uptakes were observed on the CS/Agxx/TiO2 scaffolds. The adsorption kinetics of all the PhCs adsorbed on the chitosan and nanocomposite scaffolds fit well with the pseudo-second order model.
All of the catalysts show good photocatalytic activity in the PhC degradation, and the addition of Ag provides the maximum efficiency for CS/Ag100/TiO2.
The photocatalytic degradation kinetics of AMX onto all the scaffolds are better described by PZOpht, while PAM follows a more common PFOpht. Interestingly, for the photodegradation of AMX/PAM on the CS/Agxx/TiO2, two PZOpht kinetics in different time intervals are observed, probably due to the different degradation rates for the two drugs.
The LC–MS analysis of AMX and PAM during photocatalysis indicates the formation of several intermediate compounds. When PAM and AMX are mixed, a competition in the residual products due to the photodegradation process occurs, favoring the PAM degradation.
After the photodegradation process, for all the PhC residual products, one observes the inactivation of the biocidal activity against the tested strains.
The incorporation of nanoparticles on reusable 3D scaffolds can provide interesting industrial applications of HPCs for wastewater cleaning from emerging contaminants.

Supplementary Materials

The following supporting information can be downloaded at: https://www.mdpi.com/article/10.3390/catal12060580/s1, Figure S1: UV–Vis absorption spectra of Ag nanoparticles sols at different concentrations (10, 100, 1000 ppm); Figure S2: Experimental adsorption kinetics curves of the PhCs on the different scaffolds, expressed as qt (mg/g) versus t (min); Figure S3: PhC photocatalytic degradation of pharmaceuticals measured by the decrease in the absorbance at different UV irradiation times (UV/Vis light source intensity of 3.5 mW/cm2 on the sample); Figure S4: AMX (0.01 mM) removal efficiency with CS/Agx/TiO2 scaffolds after three photodegradation cycles; Figure S5: Acinetobacter baumannii test. AMX (plate 1) and PAM (plate 6) before degradation; AMX-TiO2 (plate 3) and AMX-CS/Ag1000/TiO2 (plate 5) after degradation; Table S1: Antibiotic activity of PhC degradation products after photodegradation experiments compared to that of the original drugs. The presence/absence of the inhibition zone is measured by its diameter (mm). R indicates a resistant strain.

Author Contributions

Conceptualization, L.B., C.G., P.P.L., R.B. and L.E.; Data curation: L.B., C.B. and C.R.; Formal analysis: P.P.L.; Investigation, L.B., C.B., M.P. and C.R.; Project administration, C.G. and L.E.; Supervision, C.G., P.P.L., R.B. and L.E.; Validation, M.C.O. and L.E.; Visualization, L.B., M.P. and P.P.L.; Writing—original draft preparation, L.B., M.P., M.C.O. and L.E.; Writing—review and editing, L.B, C.G., M.C.O., P.P.L. and L.E. All authors have read and agreed to the published version of the manuscript.

Funding

This research received no external funding.

Data Availability Statement

Not applicable.

Acknowledgments

The authors would like to thank Maria Gabriella Boldrini for the language support, Giovanni Predieri for the useful discussion and Nicholas Guerra for the experimental work during his degree thesis.

Conflicts of Interest

The authors declare no conflict of interest.

References

  1. Hu, Y.; Lei, D.; Wu, D.; Xia, J.; Zhou, W.; Cui, C. Residual β-lactam antibiotics and ecotoxicity to Vibrio fischeri, Daphnia magna of pharmaceutical wastewater in the treatment process. J. Hazard. Mater. 2022, 425, 127840. [Google Scholar] [CrossRef] [PubMed]
  2. Giardina, S.; Castiglioni, S.; Corno, G.; Fanelli, R.; Maggi, C.; Migliore, L.; Sabbatucci, M.; Sesta, G.; Zaghi, C.; Zuccato, E. Approccio Ambientale All’antimicrobico-Resistenza; Rapporti ISTISAN 21/3; Istituto Superiore di Sanità: Rome, Italy, 2021; pp. 1123–3117. [Google Scholar]
  3. Tousova, Z.; Oswald, P.; Slobodnik, J.; Blaha, L.; Muz, M.; Hu, M.; Brack, W.; Krauss, M.; Di Paolo, C.; Tarcai, Z.; et al. European demonstration program on the effect-based and chemical identification and monitoring of organic pollutants in European surface waters. Sci. Total Environ. 2017, 601, 1849–1868. [Google Scholar] [CrossRef] [PubMed]
  4. Nippes, R.P.; Macruz, P.D.; da Silva, G.N.; Scaliante, M.H.N.O. A critical review on environmental presence of pharmaceutical drugs tested for the COVID-19 treatment. Process Saf. Environ. Prot. 2021, 152, 568–582. [Google Scholar] [CrossRef] [PubMed]
  5. Igwegbe, C.A.; Aniagor, C.O.; Oba, S.N.; Yap, P.-S.; Iwuchukwu, F.U.; Liu, T.; de Souza, E.C.; Ighalo, J.O. Environmental protection by the adsorptive elimination of acetaminophen from water: A comprehensive review. J. Ind. Eng. Chem. 2021, 104, 117–135. [Google Scholar] [CrossRef]
  6. The European Union. European commission implementation decision 2018/840. Establishing a watch list of substances for union-wide monitoring in the field of water policy pursuant to directive 2008/105/EC of the European Parliament and of the council and repealing commission implementing decision (EU) 2015/495. Off. J. Eur. Union 2018, 61, 9–12. [Google Scholar]
  7. Saravanan, A.; Kumar, P.S.; Jeevanantham, S.; Anubha, M.; Jayashree, S. Degradation of toxic agrochemicals and pharmaceutical pollutants: Effective and alternative approaches toward photocatalysis. Environ. Pollut. 2022, 298, 118844. [Google Scholar] [CrossRef]
  8. Hiller, C.X.; Hübner, U.; Fajnorova, S.; Schwartz, T.; Drewes, J.E. Antibiotic microbial resistance (AMR) removal efficiencies by conventional and advanced wastewater treatment processes: A review. Sci. Total Environ. 2019, 685, 596–608. [Google Scholar] [CrossRef]
  9. Singer, A.C.; Shaw, H.; Rhodes, V.; Hart, A. Review of antimicrobial resistance in the environment and its relevance to environmental regulators. Front. Microbiol. 2016, 7, 1728. [Google Scholar] [CrossRef] [Green Version]
  10. World Health Organization. Global Antimicrobial Resistance and Use Surveillance System (GLASS) Report: 2021; World Health Organization: Geneva, Switzerland, 2021; ISBN 978-92-4-002733-6. Available online: https://apps.who.int/iris/bitstream/handle/10665/341666/9789240027336-eng.pdf (accessed on 14 March 2022).
  11. Bassetti, S.; Tschudin-Sutter, S.; Egli, A.; Osthoff, M. Optimizing antibiotic therapies to reduce the risk of bacterial resistance. Eur. J. Intern. Med. 2022, 99, 7–12. [Google Scholar] [CrossRef]
  12. Langford, B.J.; So, M.; Raybardhan, S.; Leung, V.; Soucy, J.-P.R.; Westwood, D.; Daneman, N.; MacFadden, D.R. Antibiotic prescribing in patients with COVID-19: Rapid review and meta-analysis. Clin. Microbiol. Infect. 2021, 27, 520–531. [Google Scholar] [CrossRef]
  13. Teymoorian, T.; Teymourian, T.; Kowsari, E.; Ramakrishna, S. Direct and indirect effects of SARS-CoV-2 on wastewater treatment. J. Water Process Eng. 2021, 42, 102193. [Google Scholar] [CrossRef] [PubMed]
  14. Wang, D.; Ning, Q.; Dong, J.; Brooks, B.W.; You, J. Predicting mixture toxicity and antibiotic resistance of fluoroquinolones and their photodegradation products in Escherichia coli. Environ. Pollut. 2020, 262, 114275. [Google Scholar] [CrossRef] [PubMed]
  15. Nason, S.L.; Lin, E.; Eitzer, B.; Koelmel, J.; Peccia, J. Changes in sewage sludge chemical signatures during a COVID-19 community lockdown, part 1: Traffic, drugs, mental health, and disinfectants. Environ. Toxicol. Chem. 2021, 41, 1179–1192. [Google Scholar] [CrossRef] [PubMed]
  16. Park, S.; Oh, S. Detoxification and bioaugmentation potential for acetaminophen and its derivatives using Ensifer sp. isolated from activated sludge. Chemosphere 2020, 260, 127532. [Google Scholar] [CrossRef] [PubMed]
  17. Klein, E.Y.; Van Boeckel, T.P.; Martinez, E.M.; Pant, S.; Gandra, S.; Levin, S.A.; Goossens, H.; Laxminarayan, R. Global increase and geographic convergence in antibiotic consumption between 2000 and 2015. Proc. Natl. Acad. Sci. USA 2018, 115, E3463–E3470. [Google Scholar] [CrossRef] [PubMed] [Green Version]
  18. Bergamonti, L.; Gentili, S.; Acquotti, D.; Tegoni, M.; Lottici, P.P.; Graiff, C. Toxic metal sequential sequestration in water using new amido-aminoacid ligand as a model for the interaction with polyamidoamines. J. Hazard. Mater. 2021, 410, 124585. [Google Scholar] [CrossRef]
  19. Sescu, A.M.; Favier, L.; Lutic, D.; Soto-Donoso, N.; Ciobanu, G.; Harja, M. TiO2 doped with noble metals as an efficient solution for the photodegradation of hazardous organic water pollutants at ambient conditions. Water 2021, 13, 19. [Google Scholar] [CrossRef]
  20. Kanakaraju, D.; Glass, B.D.; Oelgemöller, M. Advanced oxidation process-mediated removal of pharmaceuticals from water: A review. J. Environ. Manag. 2018, 219, 189–207. [Google Scholar] [CrossRef]
  21. Favier, L.; Simion, A.I.; Matei, E.; Grigoras, C.-G.; Kadmi, I.; Bouzaza, A. Photocatalytic oxidation of a hazardous phenolic compound over TiO2 in a batch system. Environ. Eng. Manag. J. 2016, 15, 1059–1067. [Google Scholar] [CrossRef]
  22. Elmolla, E.S.; Chaudhuri, M. Comparison of different advanced oxidation processes for treatment of antibiotic aqueous solution. Desalination 2010, 256, 43–47. [Google Scholar] [CrossRef]
  23. Amor, C.; Marchão, L.; Lucas, M.S.; Peres, J.A. Application of advanced oxidation processes for the treatment of recalcitrant agro-industrial wastewater: A review. Water 2019, 11, 205. [Google Scholar] [CrossRef] [Green Version]
  24. Miklos, D.B.; Remy, C.; Jekel, M.; Linden, K.G.; Drewes, J.E.; Hübner, U. Evaluation of advanced oxidation processes for water and wastewater treatment—A critical review. Water Res. 2018, 139, 118–131. [Google Scholar] [CrossRef] [PubMed]
  25. Kadam, A.N.; Bhopate, D.P.; Kondalkar, V.V.; Majhi, S.M.; Bathula, C.D.; Tran, A.V.; Lee, S.W. Facile synthesis of Ag-ZnO core–shell nanostructures with enhanced photocatalytic activity. J. Ind. Eng. Chem. 2018, 61, 78–86. [Google Scholar] [CrossRef]
  26. Nguyen, V.-H.; Vo, T.-T.T.; Do, H.H.; Le, V.T.; Nguyen, T.D.; Vo, T.K.; Nguyen, B.-S.; Nguyen, T.T.; Phung, T.K.; Tran, V.A. Ag@ ZnO porous nanoparticle wrapped by rGO for the effective CO2 electrochemical reduction. Chem. Eng. Sci. 2021, 232, 116381. [Google Scholar] [CrossRef]
  27. Nguyen, H.T.T.; Tran, K.N.T.; Van Tan, L.; Tran, V.A.; Doan, V.D.; Lee, T.; Nguyen, T.D. Microwave-assisted solvothermal synthesis of bimetallic metal-organic framework for efficient photodegradation of organic dyes. Mater. Chem. Phys. 2021, 272, 125040. [Google Scholar] [CrossRef]
  28. Ounnar, A.; Favier, L.; Bouzaza, A.; Bentahar, F.; Trari, M. Kinetic study of spiramycin removal from aqueous solution using heterogeneous photocatalysis. Kinet. Catal. 2016, 57, 200–206. [Google Scholar] [CrossRef]
  29. Fujishima, A.; Zhang, X.; Tryk, D.A. TiO2 photocatalysis and related surface phenomena. Surf. Sci. Rep. 2008, 63, 515–582. [Google Scholar] [CrossRef]
  30. Calvete, M.J.; Piccirillo, G.; Vinagreiro, C.S.; Pereira, M.M. Hybrid materials for heterogeneous photocatalytic degradation of antibiotics. Coord. Chem. Rev. 2019, 395, 63–85. [Google Scholar] [CrossRef]
  31. Romão, J.; Barata, D.; Ribeiro, N.; Habibovic, P.; Fernandes, H.; Mul, G. High throughput screening of photocatalytic conversion of pharmaceutical contaminants in water. Environ. Pollut. 2017, 220, 1199–1207. [Google Scholar] [CrossRef]
  32. Bergamonti, L.; Alfieri, I.; Lorenzi, A.; Montenero, A.; Predieri, G.; Di Maggio, R.; Girardi, F.; Lazzarini, L.; Lottici, P.P. Characterization and photocatalytic activity of TiO2 by sol-gel in acid and basic environments. J. Sol-Gel Sci. Technol. 2015, 73, 91–102. [Google Scholar] [CrossRef]
  33. Hashimoto, K.; Irie, H.; Fujishima, A. TiO2 photocatalysis: A historical overview and future prospects. Jpn. J. Appl. Phys. 2005, 44, 8269. [Google Scholar] [CrossRef]
  34. Herrmann, J.M. Heterogeneous photocatalysis: Fundamentals and applications to the removal of various types of aqueous pollutants. Catal. Today 1999, 53, 115–129. [Google Scholar] [CrossRef]
  35. Serga, V.; Burve, R.; Krumina, A.; Romanova, M.; Kotomin, E.A.; Popov, A.I. Extraction–pyrolytic method for TiO2 polymorphs production. Crystals 2021, 11, 431. [Google Scholar] [CrossRef]
  36. Sun, X.; Yan, X.; Su, H.; Sun, L.; Zhao, L.; Shi, J.; Wang, Z.; Niu, J.; Qian, H.; Duan, E. Non-stacked γ-Fe2O3/C@TiO2 double-layer hollow nanoparticles for enhanced photocatalytic applications under visible light. Nanomaterials 2022, 12, 201. [Google Scholar] [CrossRef] [PubMed]
  37. Kokorin, A.I.; Sviridova, T.V.; Konstantinova, E.A.; Sviridov, D.V.; Bahnemann, D.W. Dynamics of photogenerated charge carriers in TiO2/MoO3, TiO2/WO3 and TiO2/V2O5 photocatalysts with mosaic structure. Catalysts 2020, 10, 1022. [Google Scholar] [CrossRef]
  38. Zarzuela, R.; Moreno-Garrido, I.; Gil, M.A.; Mosquera, M.J. Effects of surface functionalization with alkylalkoxysilanes on the structure, visible light photoactivity and biocidal performance of Ag-TiO2 nanoparticles. Powder Technol. 2021, 383, 381–395. [Google Scholar] [CrossRef]
  39. Fornasini, L.; Bergamonti, L.; Bondioli, F.; Bersani, D.; Lazzarini, L.; Paz, Y.; Lottici, P.P. Photocatalytic N-doped TiO2 for self-cleaning of limestones. Eur. Phys. J. Plus 2019, 134, 539. [Google Scholar] [CrossRef]
  40. Luna, M.; Mosquera, M.J.; Vidal, H.; Gatica, J.M. Au-TiO2/SiO2 photocatalysts for building materials: Self-cleaning and de-polluting performance. Build. Environ. 2019, 164, 106347. [Google Scholar] [CrossRef]
  41. O’Regan, B.; Grätzel, M. A low-cost, high-efficiency solar cell based on dye-sensitized colloidal TiO2 films. Nature 1991, 353, 737–740. [Google Scholar] [CrossRef]
  42. Torkian, N.; Bahrami, A.; Hosseini-Abari, A.; Momeni, M.M.; Abdolkarimi-Mahabadi, M.; Bayat, A.; Hajipour, P.; Rourani, H.A.; Abbasi, M.S.; Torkian, S.; et al. Synthesis and characterization of Ag-ion-exchanged zeolite/TiO2 nanocomposites for antibacterial applications and photocatalytic degradation of antibiotics. Environ. Res. 2021, 207, 112157. [Google Scholar] [CrossRef]
  43. Kanakaraju, D.; Kockler, J.; Motti, C.A.; Glass, B.D.; Oelgemöller, M. Titanium dioxide/zeolite integrated photocatalytic adsorbents for the degradation of amoxicillin. Appl. Catal. B Environ. 2015, 166, 45–55. [Google Scholar] [CrossRef]
  44. Lee, J.; Lee, M. Improved light harvest in diffraction grating-embedded TiO2 nanoparticle film. Appl. Phys. A 2017, 123, 737. [Google Scholar] [CrossRef]
  45. Bergamonti, L.; Bergonzi, C.; Graiff, C.; Lottici, P.P.; Bettini, R.; Elviri, L. 3D printed chitosan scaffolds: A new TiO2 support for the photocatalytic degradation of amoxicillin in water. Water Res. 2019, 163, 114841. [Google Scholar] [CrossRef] [PubMed]
  46. Elviri, L.; Bianchera, A.; Bergonzi, C.; Bettini, R. Controlled local drug delivery strategies from chitosan hydrogels for wound healing. Expert Opin. Drug Deliv. 2017, 14, 897–908. [Google Scholar] [CrossRef]
  47. Galli, C.; Parisi, L.; Elviri, L.; Bianchera, A.; Smerieri, A.; Lagonegro, P.; Lumetti, S.; Manfredi, E.; Bettini, R.; Macaluso, G.M. Chitosan scaffold modified with D-(+) raffinose and enriched with thiol-modified gelatin for improved osteoblast adhesion. Biomed. Mater. 2016, 11, 015004. [Google Scholar] [CrossRef] [Green Version]
  48. Elviri, L.; Asadzadeh, M.; Cucinelli, R.; Bianchera, A.; Bettini, R. Macroporous chitosan hydrogels: Effects of sulfur on the loading and release behaviour of amino acid-based compounds. Carbohydr. Polym. 2015, 132, 50–58. [Google Scholar] [CrossRef] [PubMed]
  49. Bergonzi, C.; Remaggi, G.; Graiff, C.; Bergamonti, L.; Potenza, M.; Ossiprandi, M.C.; Zanotti, I.; Bernini, F.; Bettini, R.; Elviri, L. Three-dimensional (3D) printed silver nanoparticles/alginate/nanocrystalline cellulose hydrogels: Study of the antimicrobial and cytotoxicity efficacy. Nanomaterials 2020, 10, 844. [Google Scholar] [CrossRef]
  50. Sayed, M.; El-Maghraby, H.F.; Bondioli, F.; Naga, S.M. 3D carboxymethyl cellulose/hydroxyapatite (CMC/HA) scaffold composites based on recycled eggshell. J. Appl. Pharm. Sci. 2018, 8, 23–30. [Google Scholar] [CrossRef]
  51. Elviri, L.; Foresti, R.; Bergonzi, C.; Zimetti, F.; Marchi, C.; Bianchera, A.; Bernini, F.; Silvestri, M.; Bettini, R. Highly defined 3D printed chitosan scaffolds featuring improved cell growth. Biomed. Mater. 2017, 12, 045009. [Google Scholar] [CrossRef]
  52. Sciancalepore, C.; Moroni, F.; Messori, M.; Bondioli, F. Acrylate-based silver nanocomposite by simultaneous polymerization-reduction approach via 3D stereolithography. Compos. Commun. 2017, 6, 11–16. [Google Scholar] [CrossRef]
  53. Amin, K.A.M. Reinforced materials based on chitosan, TiO2 and Ag composites. Polymers 2012, 4, 590–599. [Google Scholar] [CrossRef] [Green Version]
  54. Sobana, N.; Muruganadham, M.; Swaminathan, M. Nano-Ag particles doped TiO2 for efficient photodegradation of direct azo dyes. J. Mol. Catal. A Chem. 2006, 258, 124–132. [Google Scholar] [CrossRef]
  55. Taspika, M.; Desiati, R.D.; Mahardika, M.; Sugiarti, E.; Abral, H. Influence of TiO2/Ag particles on the properties of chitosan film. Adv. Nat. Sci. Nanosci. Nanotechnol. 2020, 11, 015017. [Google Scholar] [CrossRef]
  56. Jbeli, A.; Hamden, Z.; Bouattour, S.; Ferraria, A.; Conceição, D.; Ferreira, L.V.; Chehimi, M.; Rego, A.B.D.; Vilar, M.R.; Boufi, S. Chitosan-Ag-TiO2 films: An effective photocatalyst under visible light. Carbohydr. Polym. 2018, 199, 31–40. [Google Scholar] [CrossRef] [PubMed]
  57. Desai, R.; Mankad, V.; Gupta, S.K.; Jha, P.K. Size distribution of silver nanoparticles: UV-visible spectroscopic assessment. Nanosci. Nanotechnol. Lett. 2012, 4, 30–34. [Google Scholar] [CrossRef]
  58. Paramelle, D.; Sadovoy, A.; Gorelik, S.; Free, P.; Hobley, J.; Fernig, D.G. A rapid method to estimate the concentration of citrate capped silver nanoparticles from UV-visible light spectra. Analyst 2014, 139, 4855–4861. [Google Scholar] [CrossRef]
  59. Amirjani, A.; Firouzi, F.; Haghshenas, D.F. Predicting the size of silver nanoparticles from their optical properties. Plasmonics 2020, 15, 1077–1082. [Google Scholar] [CrossRef]
  60. Kumar-Krishnan, S.; Prokhorov, E.; Hernández-Iturriaga, M.; Mota-Morales, J.D.; Vázquez-Lepe, M.; Kovalenko, Y.; Sanchez, I.C.; Luna-Bárcenas, G. Chitosan/silver nanocomposites: Synergistic antibacterial action of silver nanoparticles and silver ions. Eur. Polym. J. 2015, 67, 242–251. [Google Scholar] [CrossRef]
  61. Crini, G.; Badot, P.M. Application of chitosan, a natural aminopolysaccharide, for dye removal from aqueous solutions by adsorption processes using batch studies: A review of recent literature. Prog. Polym. Sci. 2008, 33, 399–447. [Google Scholar] [CrossRef]
  62. Semwal, A.; Singh, R.; Dutta, P.K. Chitosan: A promising substrate for pharmaceuticals. J. Chitin Chitosan Sci. 2013, 1, 87–102. [Google Scholar] [CrossRef]
  63. Rinaudo, M. Chitin and chitosan: Properties and applications. Prog. Polym. Sci. 2006, 31, 603–632. [Google Scholar] [CrossRef]
  64. Adriano, W.S.; Veredas, V.; Santana, C.C.; Gonçalves, L.B. Adsorption of amoxicillin on chitosan beads: Kinetics, equilibrium and validation of finite bath models. Biochem. Eng. J. 2005, 27, 132–137. [Google Scholar] [CrossRef]
  65. Lotfollahzadeh, R.; Yari, M.; Sedaghat, S.; Delbari, A.S. Biosynthesis and characterization of silver nanoparticles for the removal of amoxicillin from aqueous solutions using Oenothera biennis water extract. J. Nanostruct. Chem. 2021, 11, 693–706. [Google Scholar] [CrossRef]
  66. Wang, A.; Zhu, Q.; Xing, Z. Multifunctional quaternized chitosan@ surface plasmon resonance Ag/N-TiO2 core-shell microsphere for synergistic adsorption-photothermal catalysis degradation of low-temperature wastewater and bacteriostasis under visible light. Chem. Eng. J. 2020, 393, 124781. [Google Scholar] [CrossRef]
  67. Nguyen, D.T.; Tran, H.N.; Juang, R.-S.; Dat, N.D.; Tomul, F.; Ivanets, A.; Woo, S.H.; Hosseini-Bandegharaei, A.; Nguyen, V.P.; Chao, H.-P. Adsorption process and mechanism of acetaminophen onto commercial activated carbon. J. Environ. Chem. Eng. 2020, 8, 104408. [Google Scholar] [CrossRef]
  68. Rahmanifar, B.; Dehaghi, S.M. Removal of organochlorine pesticides by chitosan loaded with silver oxide nanoparticles from water. Clean Technol. Environ. 2014, 16, 1781–1786. [Google Scholar] [CrossRef]
  69. Ho, Y.S.; McKay, G. A comparison of chemisorption kinetic models applied to pollutant removal on various sorbents. Process Saf. Environ. Prot. 1998, 76, 332–340. [Google Scholar] [CrossRef] [Green Version]
  70. Simonin, J.P. On the comparison of pseudo-first order and pseudo-second order rate laws in the modeling of adsorption kinetics. Chem. Eng. J. 2016, 300, 254–263. [Google Scholar] [CrossRef] [Green Version]
  71. Lasheen, M.R.; Ammar, N.S.; Ibrahim, H.S. Adsorption/desorption of Cd (II), Cu (II) and Pb (II) using chemically modified orange peel: Equilibrium and kinetic studies. Solid State Sci. 2012, 14, 202–210. [Google Scholar] [CrossRef]
  72. Zhang, X.; Chen, Y.L.; Liu, R.S.; Tsai, D.P. Plasmonic photocatalysis. Rep. Prog. Phys. 2013, 76, 046401. [Google Scholar] [CrossRef] [Green Version]
  73. Tran, V.A.; Vo, T.T.T.; Nguyen, P.A.; Don, T.N.; Vasseghian, Y.; Phan, H.; Lee, S.W. Experimental and computational investigation of a green Knoevenagel condensation catalyzed by zeolitic imidazolate framework-8. Environ. Res. 2022, 204, 112364. [Google Scholar] [CrossRef] [PubMed]
  74. Bergamonti, L.; Potenza, M.; Poshtiri, A.H.; Lorenzi, A.; Sanangelantoni, A.M.; Lazzarini, L.; Lottici, P.P.; Graiff, C. Ag-functionalized nanocrystalline cellulose for paper preservation and strengthening. Carbohydr. Polym. 2020, 231, 115773. [Google Scholar] [CrossRef] [PubMed]
  75. Sclafani, A.; Herrmann, J.M. Influence of metallic silver and of platinum-silver bimetallic deposits on the photocatalytic activity of titania (anatase and rutile) in organic and aqueous media. J. Photochem. Photobiol. A 1998, 113, 181–188. [Google Scholar] [CrossRef]
  76. Guerra, M.H.; Alberola, I.O.; Rodriguez, S.M.; López, A.A.; Merino, A.A.; Alonso, J.Q. Oxidation mechanisms of amoxicillin and paracetamol in the photo-Fenton solar process. Water Res. 2019, 156, 232–240. [Google Scholar] [CrossRef]
  77. Zhang, J.; Fu, D.; Wu, J. Photodegradation of Norfloxacin in aqueous solution containing algae. J. Environ. Sci. 2012, 24, 743–749. [Google Scholar] [CrossRef]
  78. Ilisz, I.; László, Z.; Dombi, A. Investigation of the photodecomposition of phenol in near-UV-irradiated aqueous TiO2 suspensions. I: Effect of charge-trapping species on the degradation kinetics. Appl. Catal. A Gen. 1999, 180, 25–33. [Google Scholar] [CrossRef]
  79. Guo, W.; Wu, Q.L.; Zhou, X.J.; Cao, H.O.; Du, J.S.; Yin, R.L.; Ren, N.Q. Enhanced amoxicillin treatment using the electro-peroxone process: Key factors and degradation mechanism. RSC Adv. 2015, 5, 52695–52702. [Google Scholar] [CrossRef]
  80. Moctezuma, E.; Leyva, E.; Aguilar, C.A.; Luna, R.A.; Montalvo, C. Photocatalytic degradation of paracetamol: Intermediates and total reaction mechanism. J. Hazard. Mater. 2012, 243, 130–138. [Google Scholar] [CrossRef]
  81. NCCLS. Performance Standards for Antimicrobial Disk Susceptibility Tests; Approved Standard, 8th ed.; NCCLS Document M2-A8; NCCLS: Wayne, PA, USA, 2003; ISBN 1-56238-485-6. [Google Scholar]
Figure 1. FTIR spectra of Chitosan (CS), Chitosan/TiO2 (CS/TiO2) and Chitosan/silver 1000 ppm/TiO2 (CS/Ag1000/TiO2).
Catalysts 12 00580 g001
Figure 2. X-ray diffraction patterns of chitosan (CS), silver reference (Ag), P25 (TiO2) and Ag/TiO2 embedded in the chitosan scaffold (CS/Ag1000/TiO2).
Catalysts 12 00580 g002
Figure 3. Chitosan scaffold (CS): (a) Picture; (b) SEM image (150×); (c) SEM image of a filament (1000×).
Catalysts 12 00580 g003
Figure 4. SEM image (magnification 150×) of CS/Ag1000/TiO2 (a); EDS elemental Ti (b) and Ag (c) maps and EDS analysis (d) acquired on (a).
Catalysts 12 00580 g004aCatalysts 12 00580 g004b
Figure 5. Linear Pseudo-Second Order (PSOads) fitting to t/qt vs. t. AMX 0.01 mM (a) and 0.1 mM (b); PAM 0.01 mM (c) and 0.1 mM (d); AMX/PAM 0.1 mM (e). Symbols: experimental data. Dotted line: PSOads fit.
Catalysts 12 00580 g005
Figure 6. Photocatalysis on different catalysts and photolysis of AMX 0.01 mM (a) and 0.1 mM (b), PAM 0.01 mM (c) and 0.1 mM (d), AMX/PAM 0.1 mM (e) vs. time (UV–Vis light source intensity of 3.5 mW/cm2 on the sample).
Catalysts 12 00580 g006
Figure 7. PZOpht (a,b,e) and PFOpht (c,d) linear fits to the photocatalytic degradation of PhCs. In the inserts, the PFOpht for TiO2 catalyst. Two different degradation rates are found in (e) for CS/Agxx/TiO2.
Catalysts 12 00580 g007
Table 1. Adsorption percentage Ads %, adsorption capacity qe and PSOads kinetic constant k2 of AMX, PAM and AMX/PAM for the different scaffolds and for two different PhCs concentrations [C]. k2 was obtained by fitting the experimental curves through Equation (6). Standard deviation in parentheses.
AMX
[C] mM CSCS/TiO2CS/Ag10/TiO2CS/Ag100/TiO2CS/Ag1000/TiO2
0.01
0.1
Ads (%)10.8 (9)12.5 (8)14.4 (5)18.4 (3)
(9)
16.4 (8)
0.1 7.6 (4)8.9 (6)11.0 (3)14.3 (7)10.4 (6)
0.01
0.1
qe (mg/g)0.52 (3)0.66 (1)0.73 (1) 1.62 (2)1.24 (2)
0.1 3.3 (6)4.6 (4)4.9 (4)7.2 (5)5.7 (3)
0.01k2 (g/(mg min)) 0.35 (2)0.31 (3)0.25 (6)0.17 (2)0.13 (1)
0.1 0.069 (7)0.13 (5)0.073 (3)0.015 (4)0.031 (4)
PAM
[C] mM CSCS/TiO2CS/Ag10/TiO2CS/Ag100/TiO2CS/Ag1000/TiO2
0.01
0.1
Ads (%)7.3 (5)8.3 (4)8.3 (4)9.8 (1)8.5 (3)
0.1 3.6 (4)6.1 (7)5.8 (4)6.4 (1)5.7 (4)
0.01
0.1
qe (mg/g)0.18 (4)0.22 (1)0.23 (2)0.25 (4)0.21 (5)
0.1 0.78 (2)1.42 (9)1.39 (4)1.52 (8)1.15 (9)
0.01k2 (g/(mg min)) 0.75 (8)0.68 (5)0.66 (7)0.41(6)0.64 (6)
0.1 0.077 (3)0.038 (5)0.043 (2)0.035 (5)0.065 (3)
AMX/PAM
[C] mM CSCS/TiO2CS/Ag10/TiO2CS/Ag100/TiO2CS/Ag1000/TiO2
0.1Ads (%)5.6 (2)6.4 (3)8.2 (1)9.1 (2)8.7 (5)
0.1qe (mg/g)3.7 (4)4.2 (3)5.4 (1)6.3 (3)5.2 (6)
0.1k2 (g/(mg min))0.026 (2)0.023 (2)0.019 (2)0.015 (3)0.021 (2)
Table 2. Rate constants (kapp for PFOpht and k0 for PZOpht), half-lives t1/2 and r2 for the photocatalytic degradation measurements for two PhCs:TiO2 molar ratios. For AMX/PAM on CS/Agxx/TiO2, the two k0 photodegradation rates are reported. Standard errors on the rate constants are given in parentheses.
Amoxicillin
AMX:TiO2kapp (min−1)k0 (min−1)t1/2 (min)r2
PFOphtPZOpht
TiO21/100
1/10
0.049 (1) 0.036 (2) -
-
14.2 (0.3)
19 (1)
0.99
0.98
CS/TiO21/100
1/10
-
-
0.0052 (3) 0.0034 (1)96 (6)
147 (5)
0.98
0.99
CS/Ag10/TiO21/100
1/10
-
-
0.0091 (5) 0.0051 (2)55 (3)
98 (4)
0.99
0.99
CS/Ag100/TiO21/100
1/10
-
-
0.0132 (6) 0.0056 (2)38 (2)
89 (3)
0.97
0.96
CS/Ag1000/TiO21/100
1/10
-
-
0.0085 (4) 0.0028 (1) 59 (3)
178 (6)
0.99
0.96
Paracetamol
PAM:TiO2kapp (min−1)k0 (min−1)t1/2 (min)r2
PFOphtPZOpht
TiO21/100
1/10
0.039 (6) 0.028 (4)-
-
18 (3)
25 (3)
0.99
0.99
CS/TiO21/100
1/10
0.016 (2) 0.007 (1)-
-
43 (5)
99 (10)
0.99
0.99
CS/Ag10/TiO21/100
1/10
0.023 (1) 0.014 (2)-
-
30 (1)
50 (7)
0.98
0.98
CS/Ag100/TiO21/100
1/10
0.033 (4) 0.017 (2)-
-
21 (3)
41 (5)
0.98
0.99
CS/Ag1000/TiO21/100
1/10
0.019 (1) 0.012 (2)-
-
36 (2)
58 (9)
0.99
0.99
Amoxicillin/Paracetamol
AMX/PAM:TiO2kapp (min−1)k0 (min−1)t1/2 (min)r2
PFOphtPZOpht
TiO21/100.035 (1)-20 (1)0.98
CS/TiO21/10-0.0056 (1)89 (1)0.98
CS/Ag10/TiO21/10-0.0082 (1)
0.0030 (1)
61 (1)
167 (3)
0.99
0.99
CS/Ag100/TiO21/10-0.0103 (3)
0.0034 (4)
49 (1)
147 (8)
0.99
0.92
CS/Ag1000/TiO21/10-0.0025 (1)
0.0071 (2)
200 (4)
70 (1)
0.96
0.99
Table 3. Amoxicillin and paracetamol protonated degradation products monitored by LC–MS under SIM acquisition mode.
Compound FormulaMolecular Massm/z
amoxicillin (AMX)C16H19N3O5S365366
A1 (dihydroxylated AMX)C16H19N3O6S381382
A2 (derivative of hydroxylated AMX)C15H18N2O7S382383
A3 (penicilloic acid)C16H21N3O6S383384
A4 (derivative of penicilloic acid)C15H19N3O5S353354
A5 (derivative of penicilloic acid)C15H21N3O4S339340
A6 (derivative of hydroxylated AMX)C16H19N3O8S411412
A7 (tetrahydroxylated AMX)C16H17N3O9S427428
A8 (derivative from destruction of lactamic bond)C8H10N2O4S230231
A9 (derivative of penicilloic acid)C6H9NO2S159160
paracetamol (PAR)C8H9NO2151152
P1 (hydroquinone)C6H6O2110111
P2 (1,2,4-trihydroxybenzene)C6H6O3126127
P3 (benzoquinone)C6H4O2108109
P4 (p-nitrophenol)C6H5NO3139140
Publisher’s Note: MDPI stays neutral with regard to jurisdictional claims in published maps and institutional affiliations.

