
Kinetics of Catalytic Decarboxylation of Naphthenic Acids over HZSM-5 Zeolite Catalyst

Abstract
1. Introduction
2. Results and Discussions
2.1. Naphthenic Acid Removal Assessment
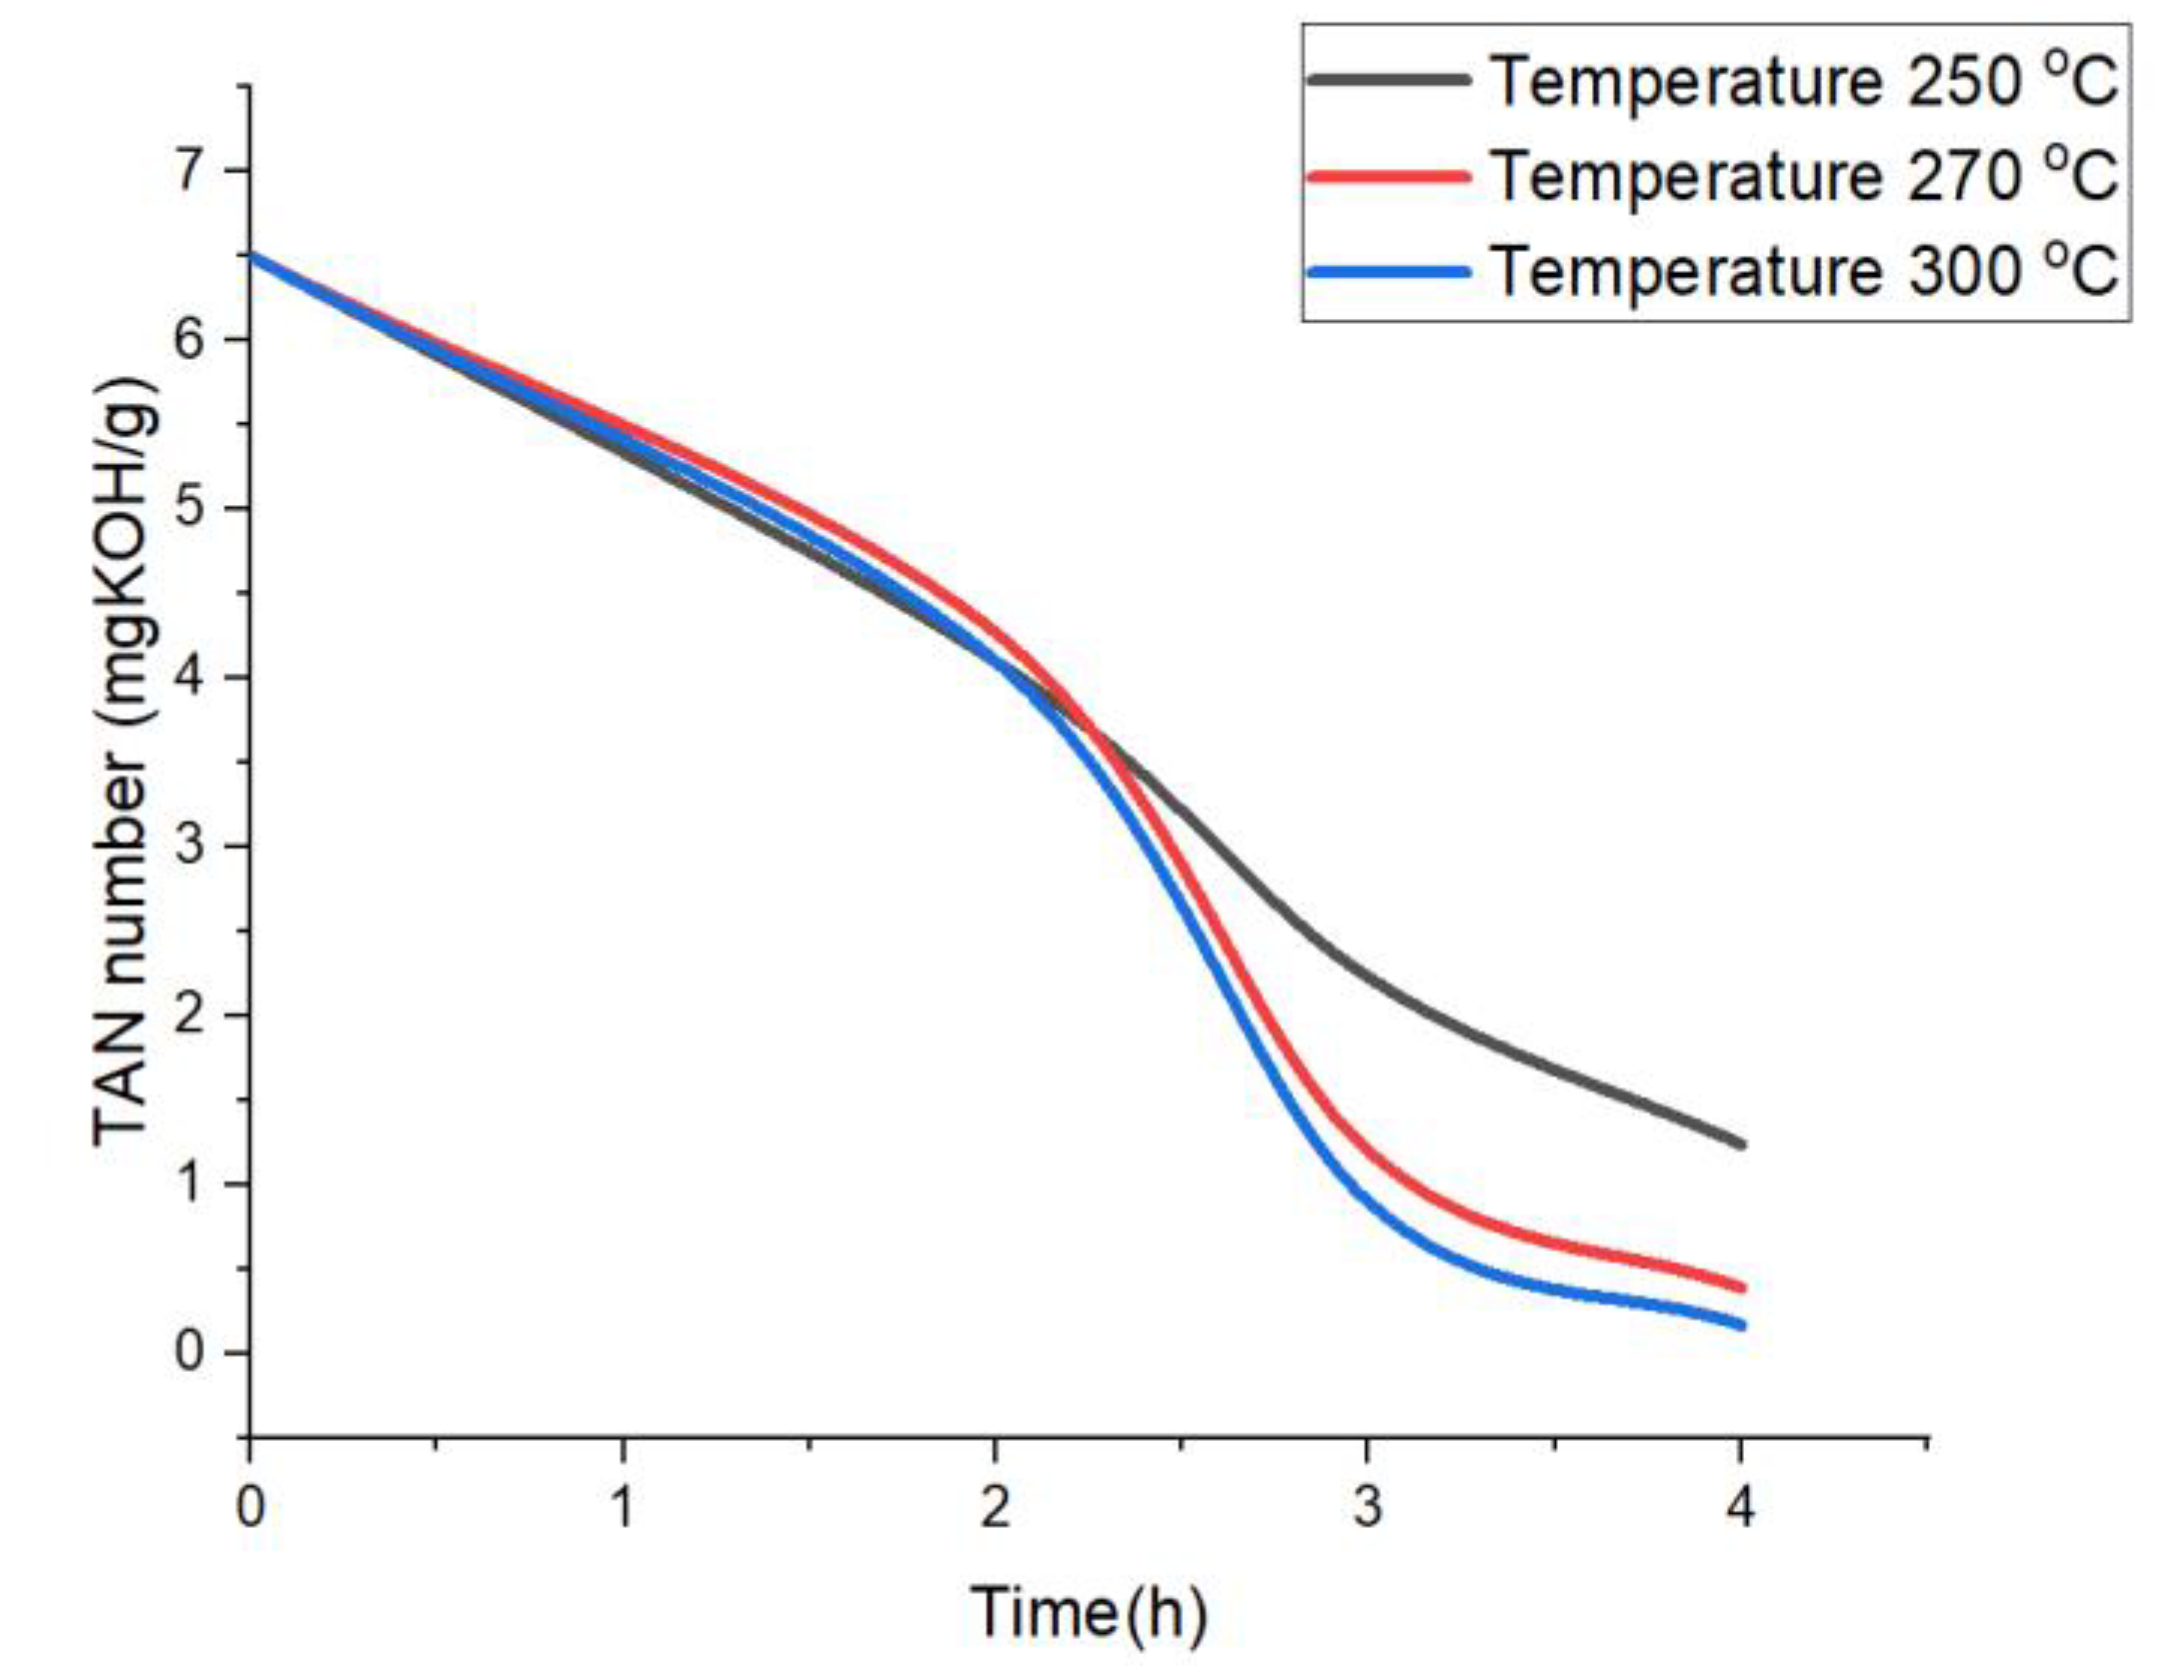
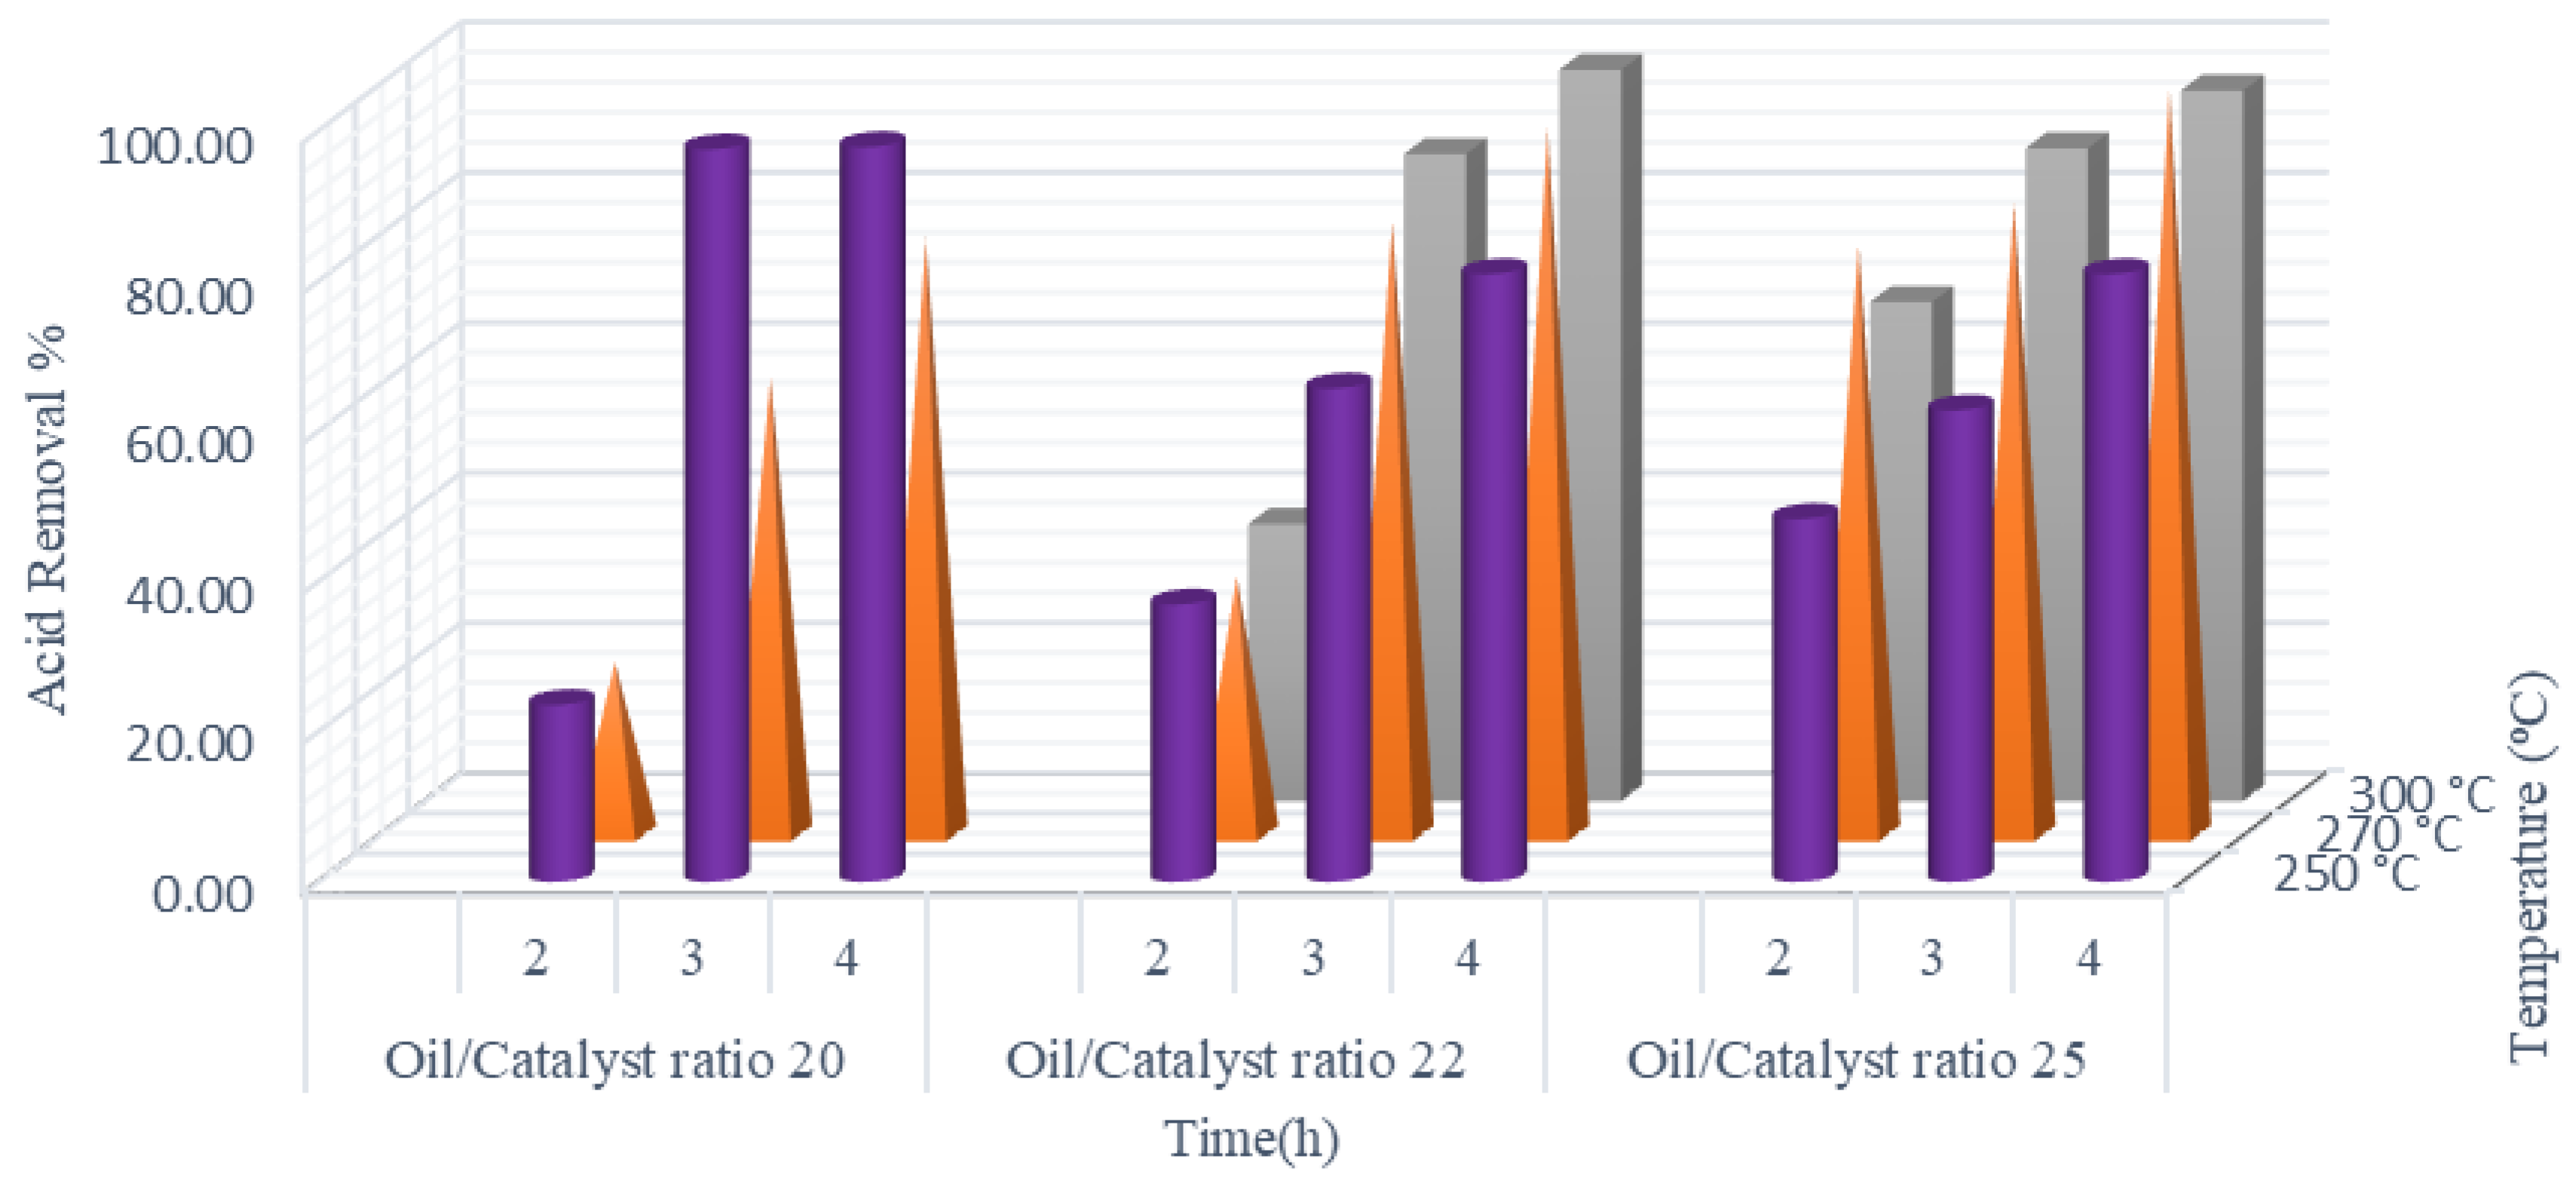
2.1.1. Effect of Reaction Temperature
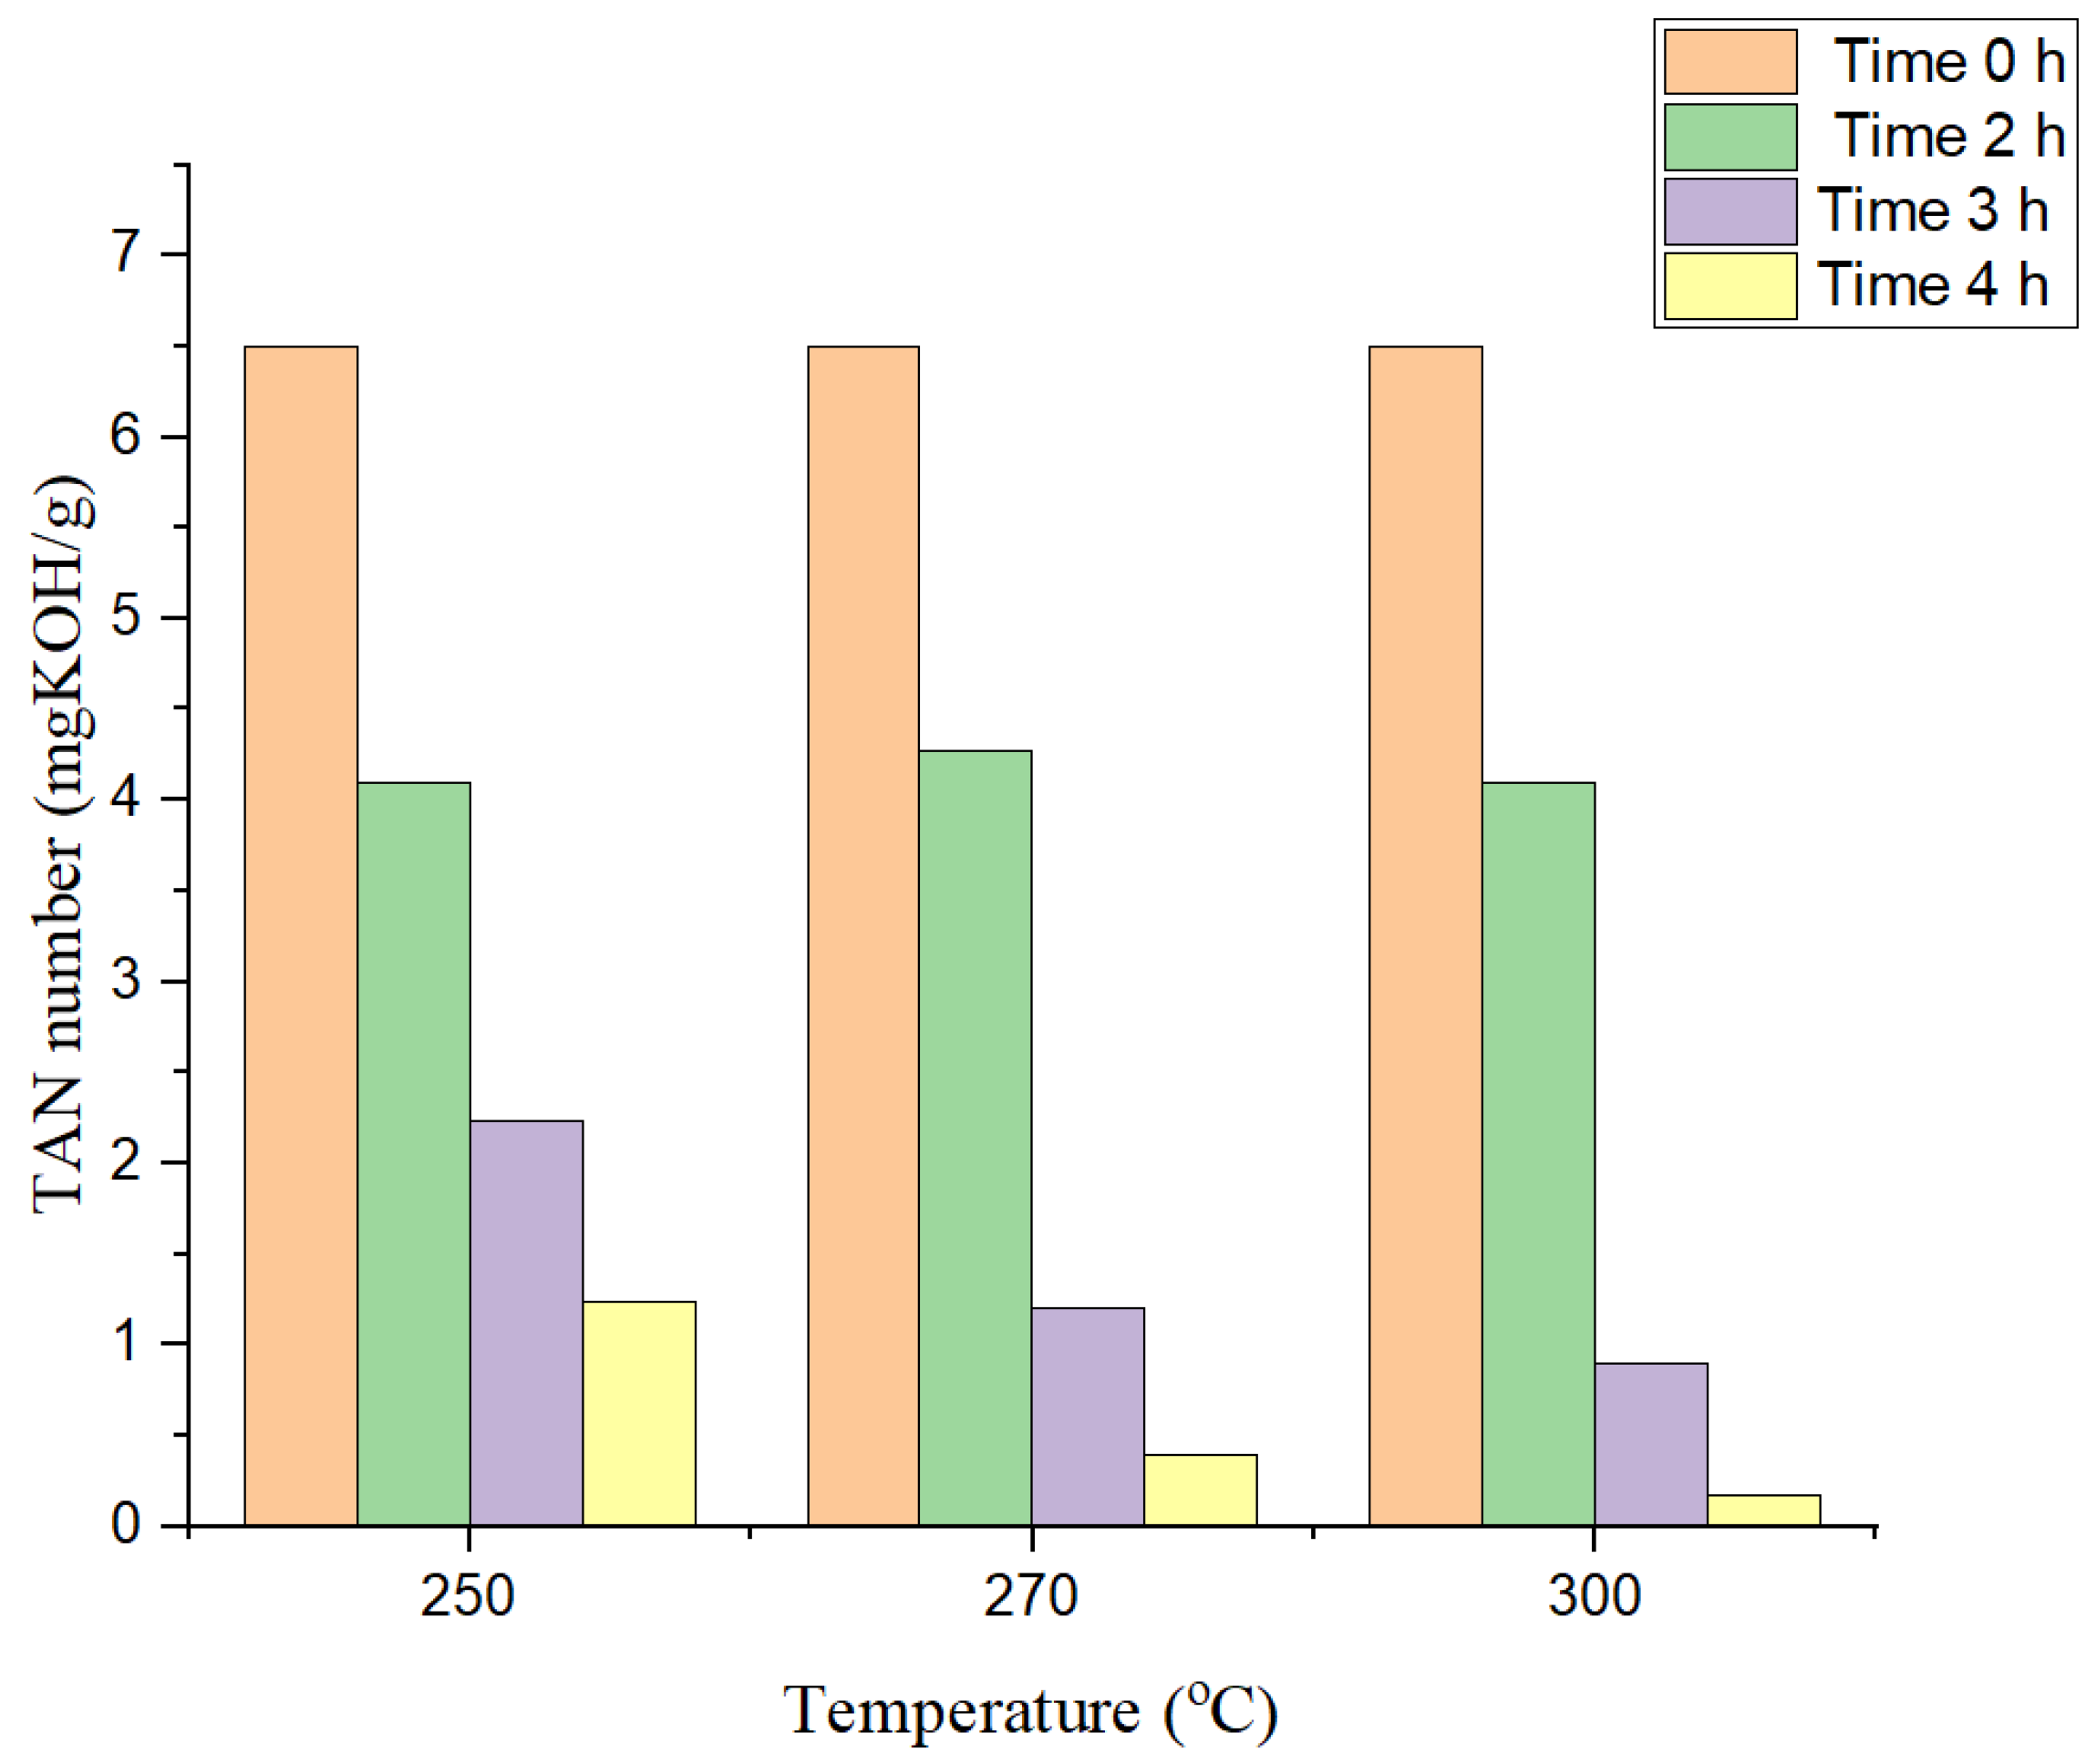
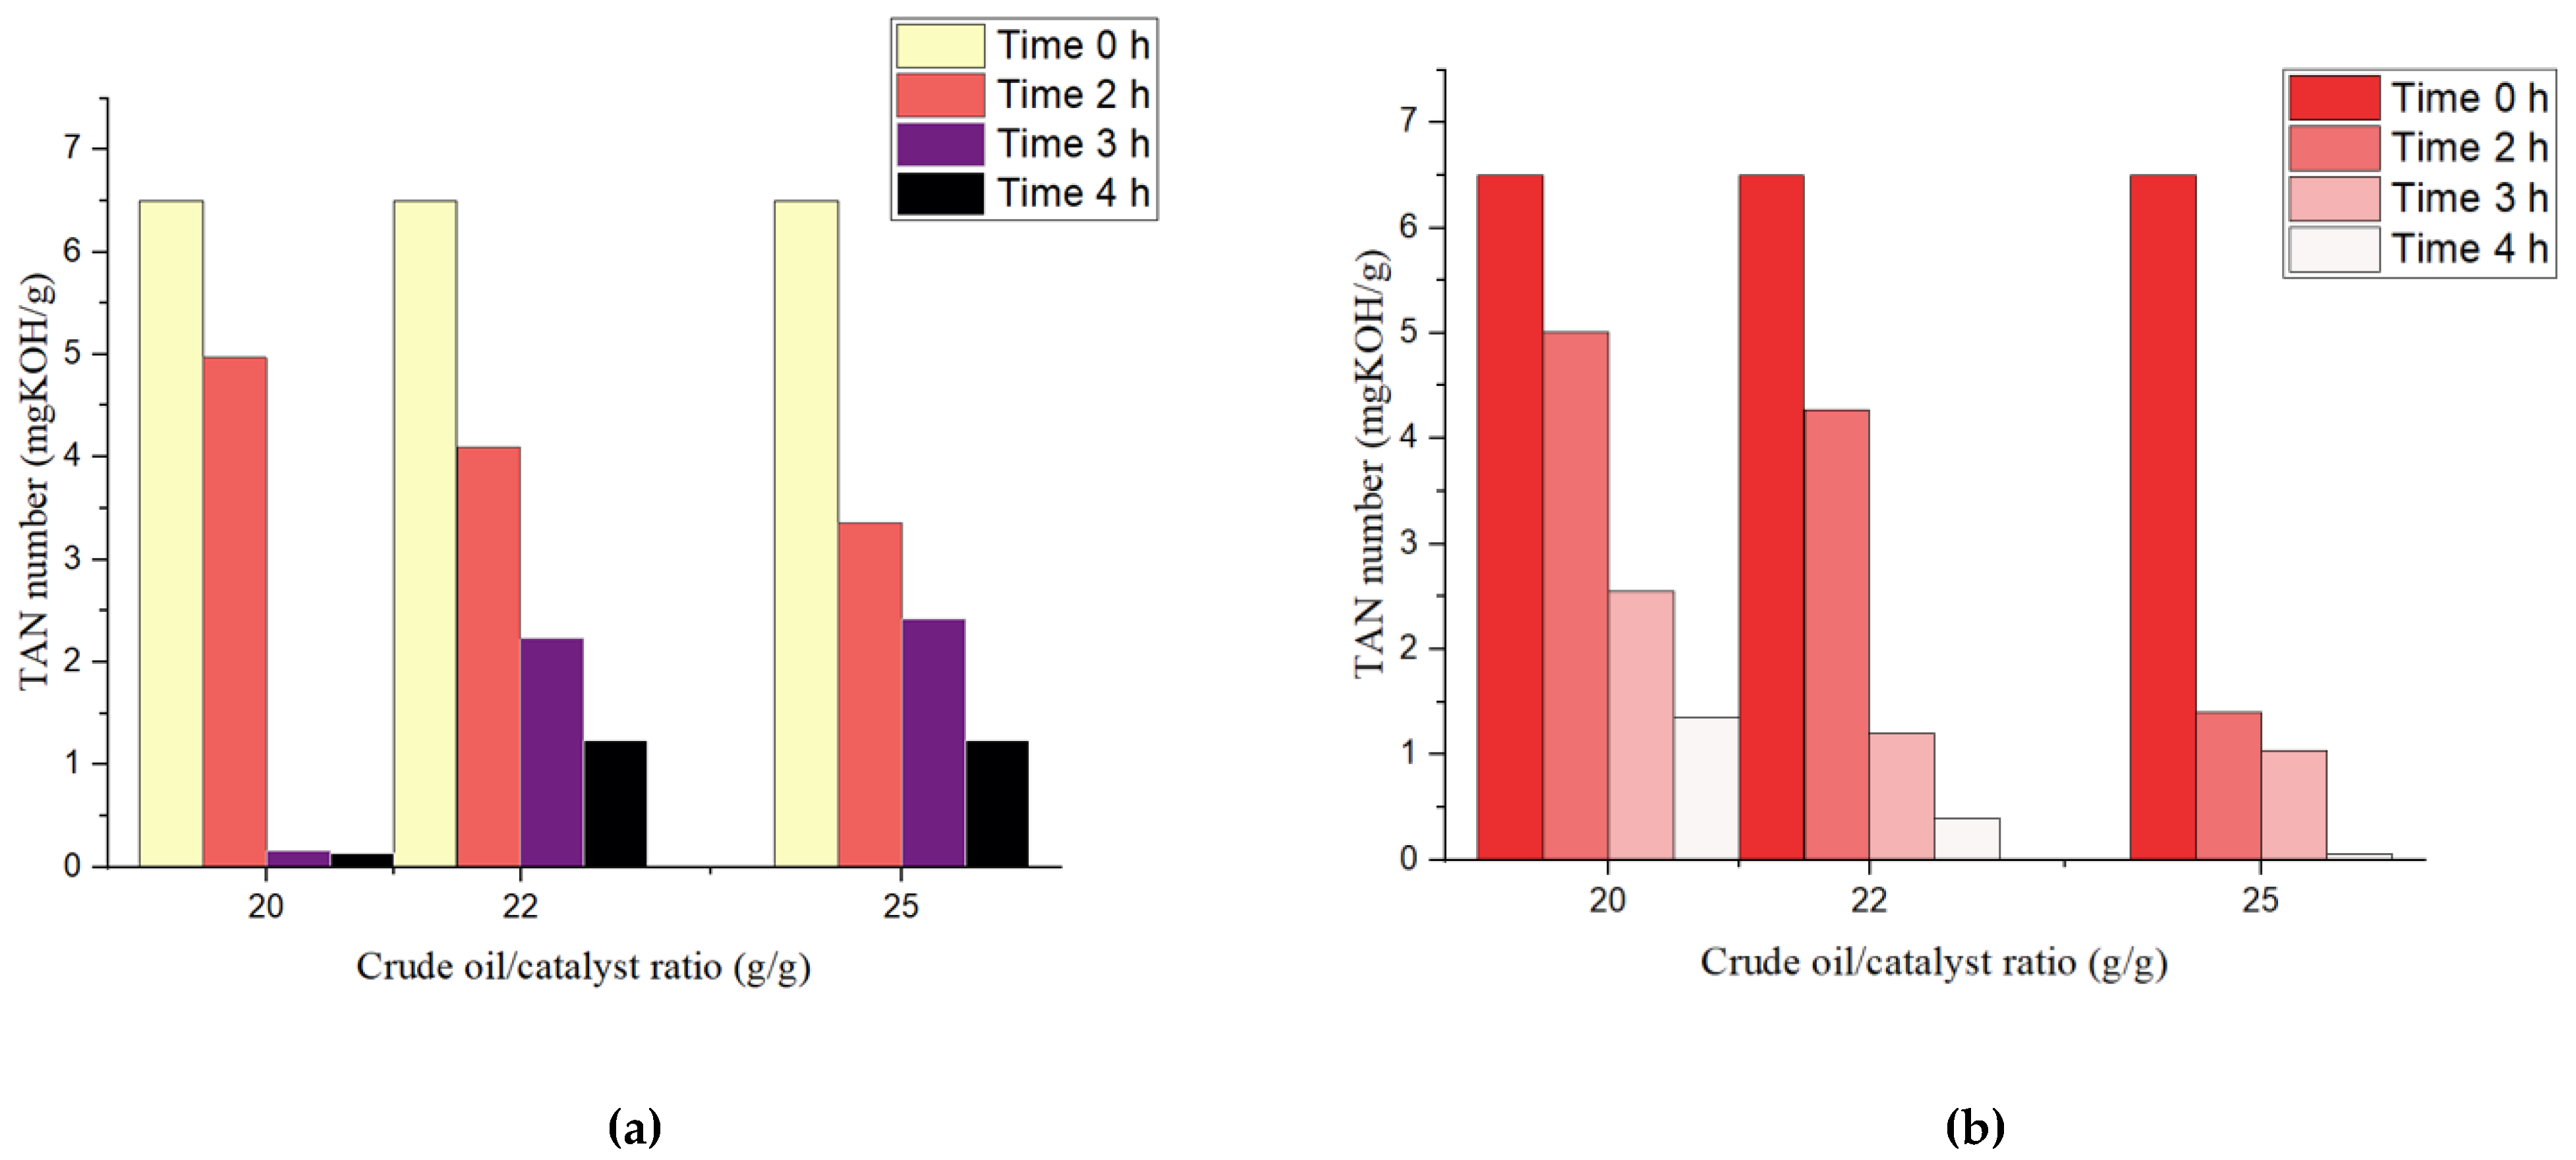
2.1.2. Effect of Reaction Time
2.1.3. Effect of Oil:Catalyst Ratio
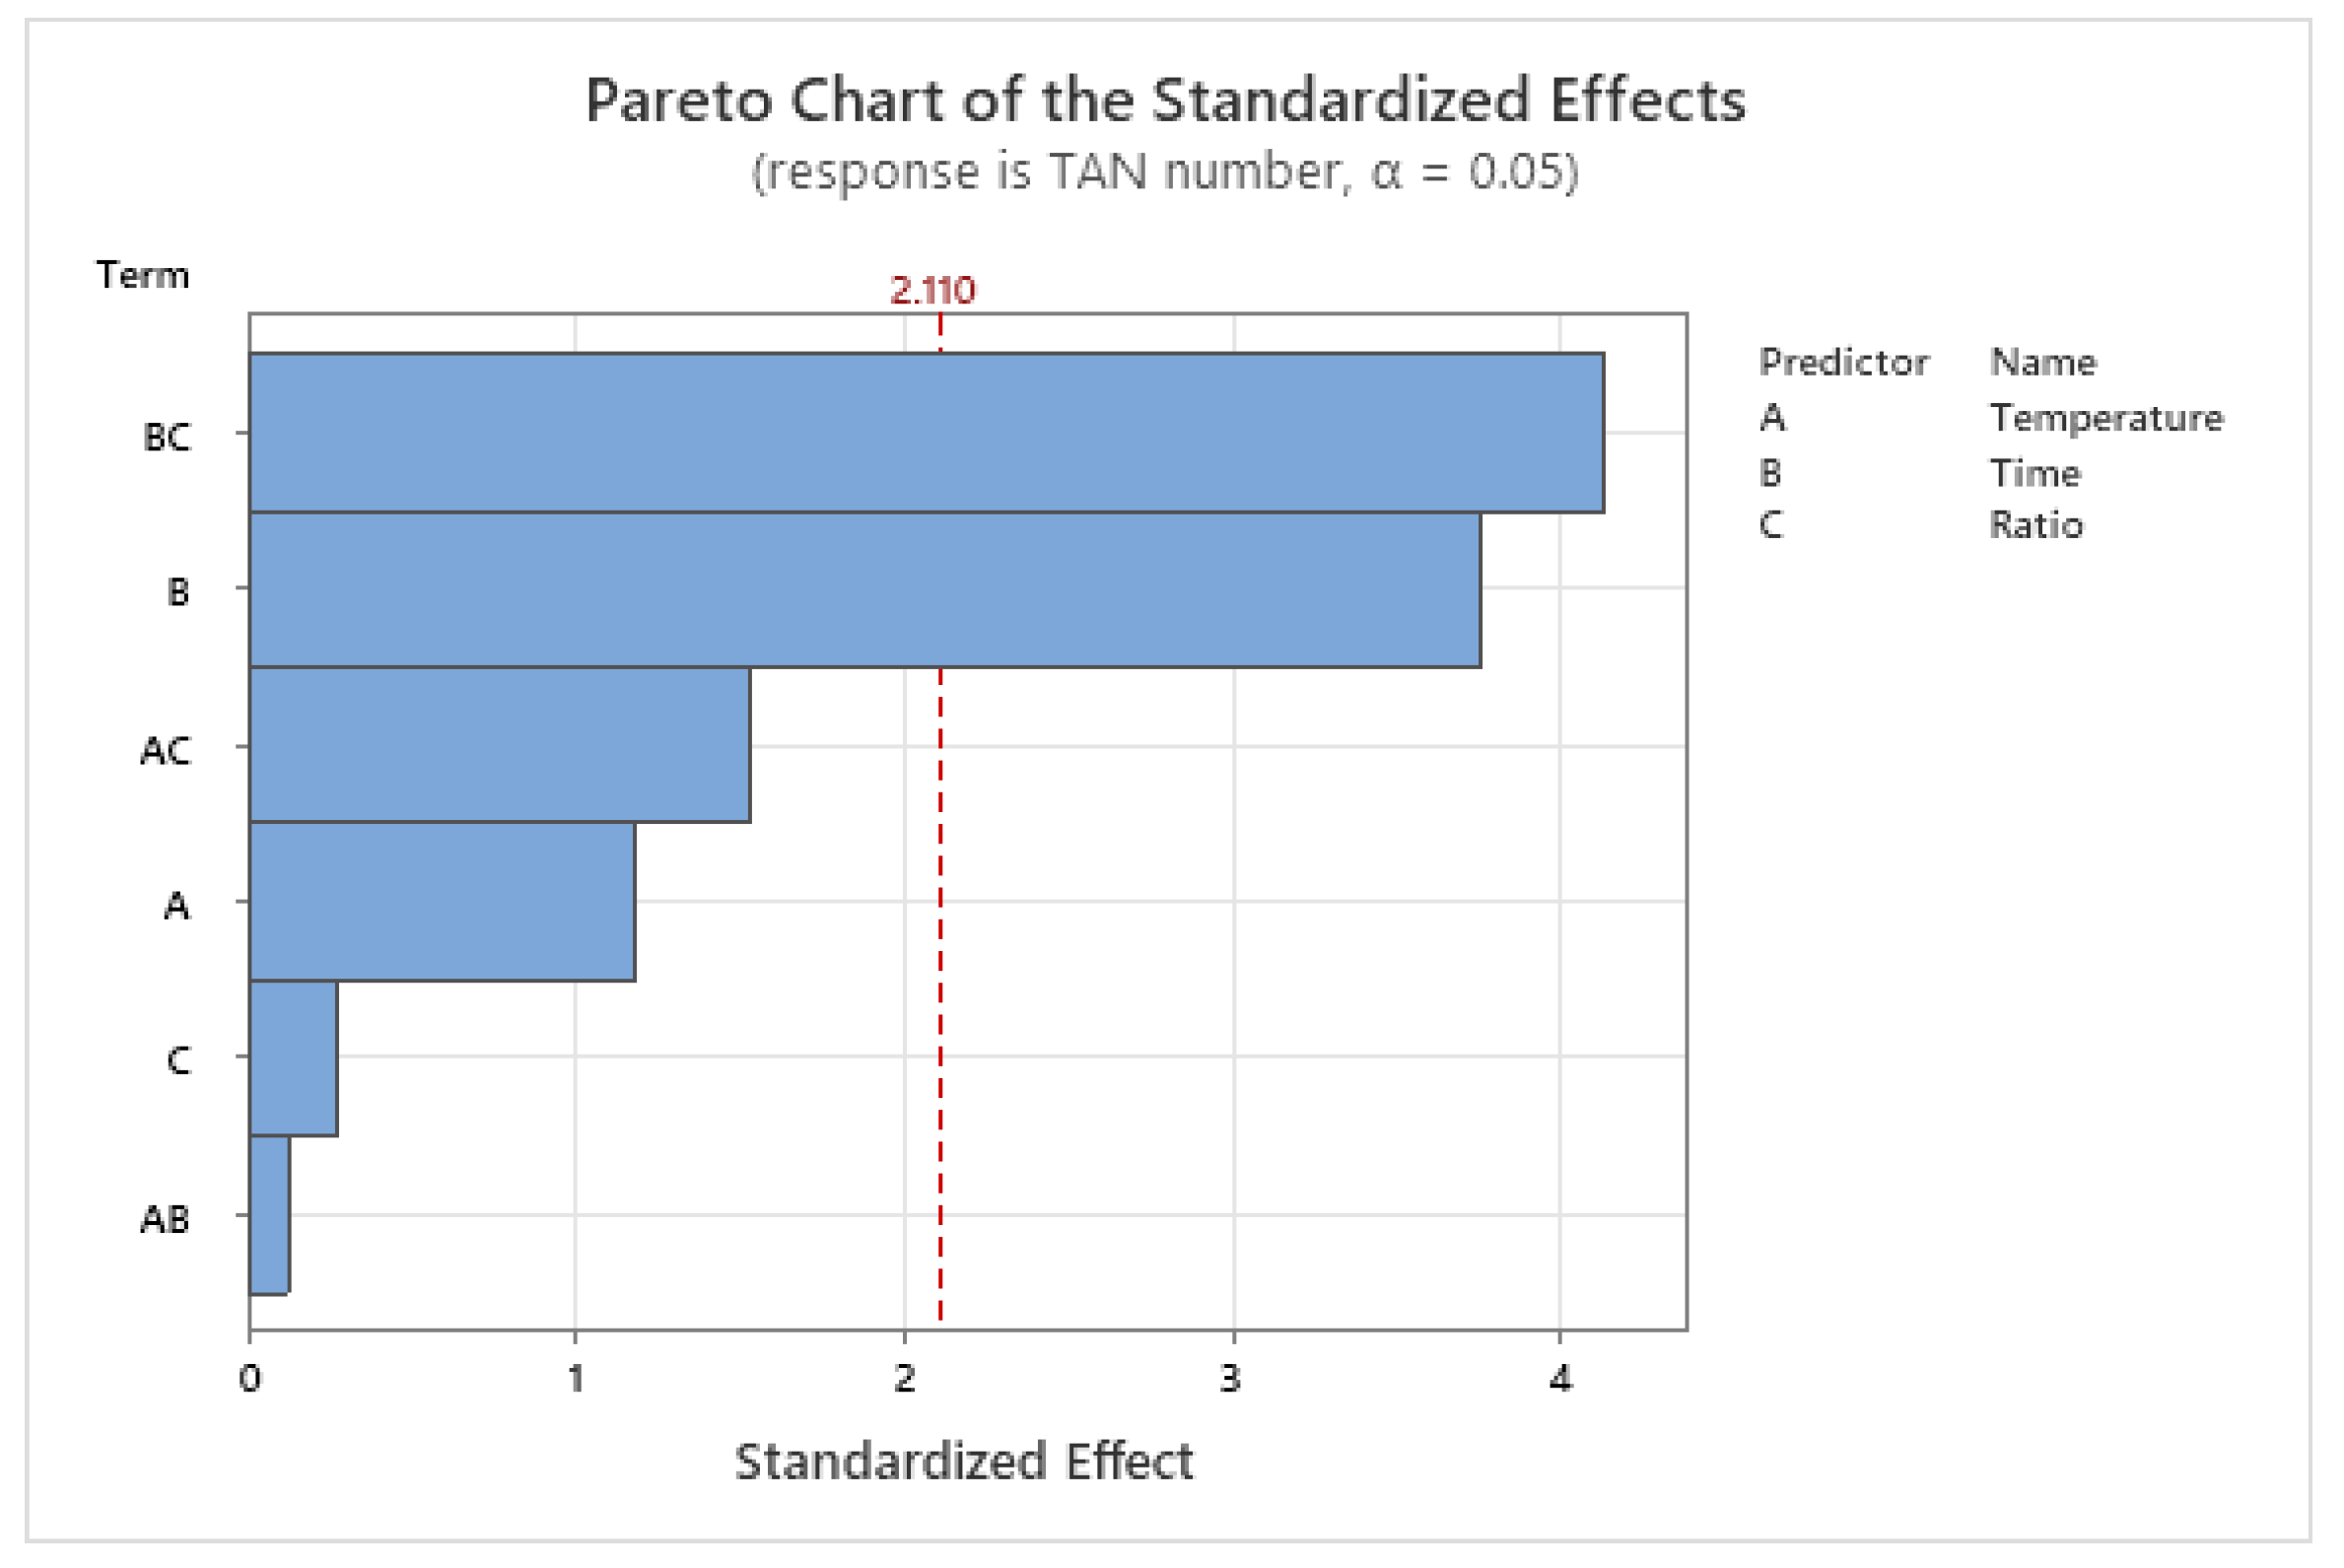
2.1.4. Combined Effect of Temperature, Time, and Oil:Catalyst Ratio
2.2. The Kinetics Model Parameters
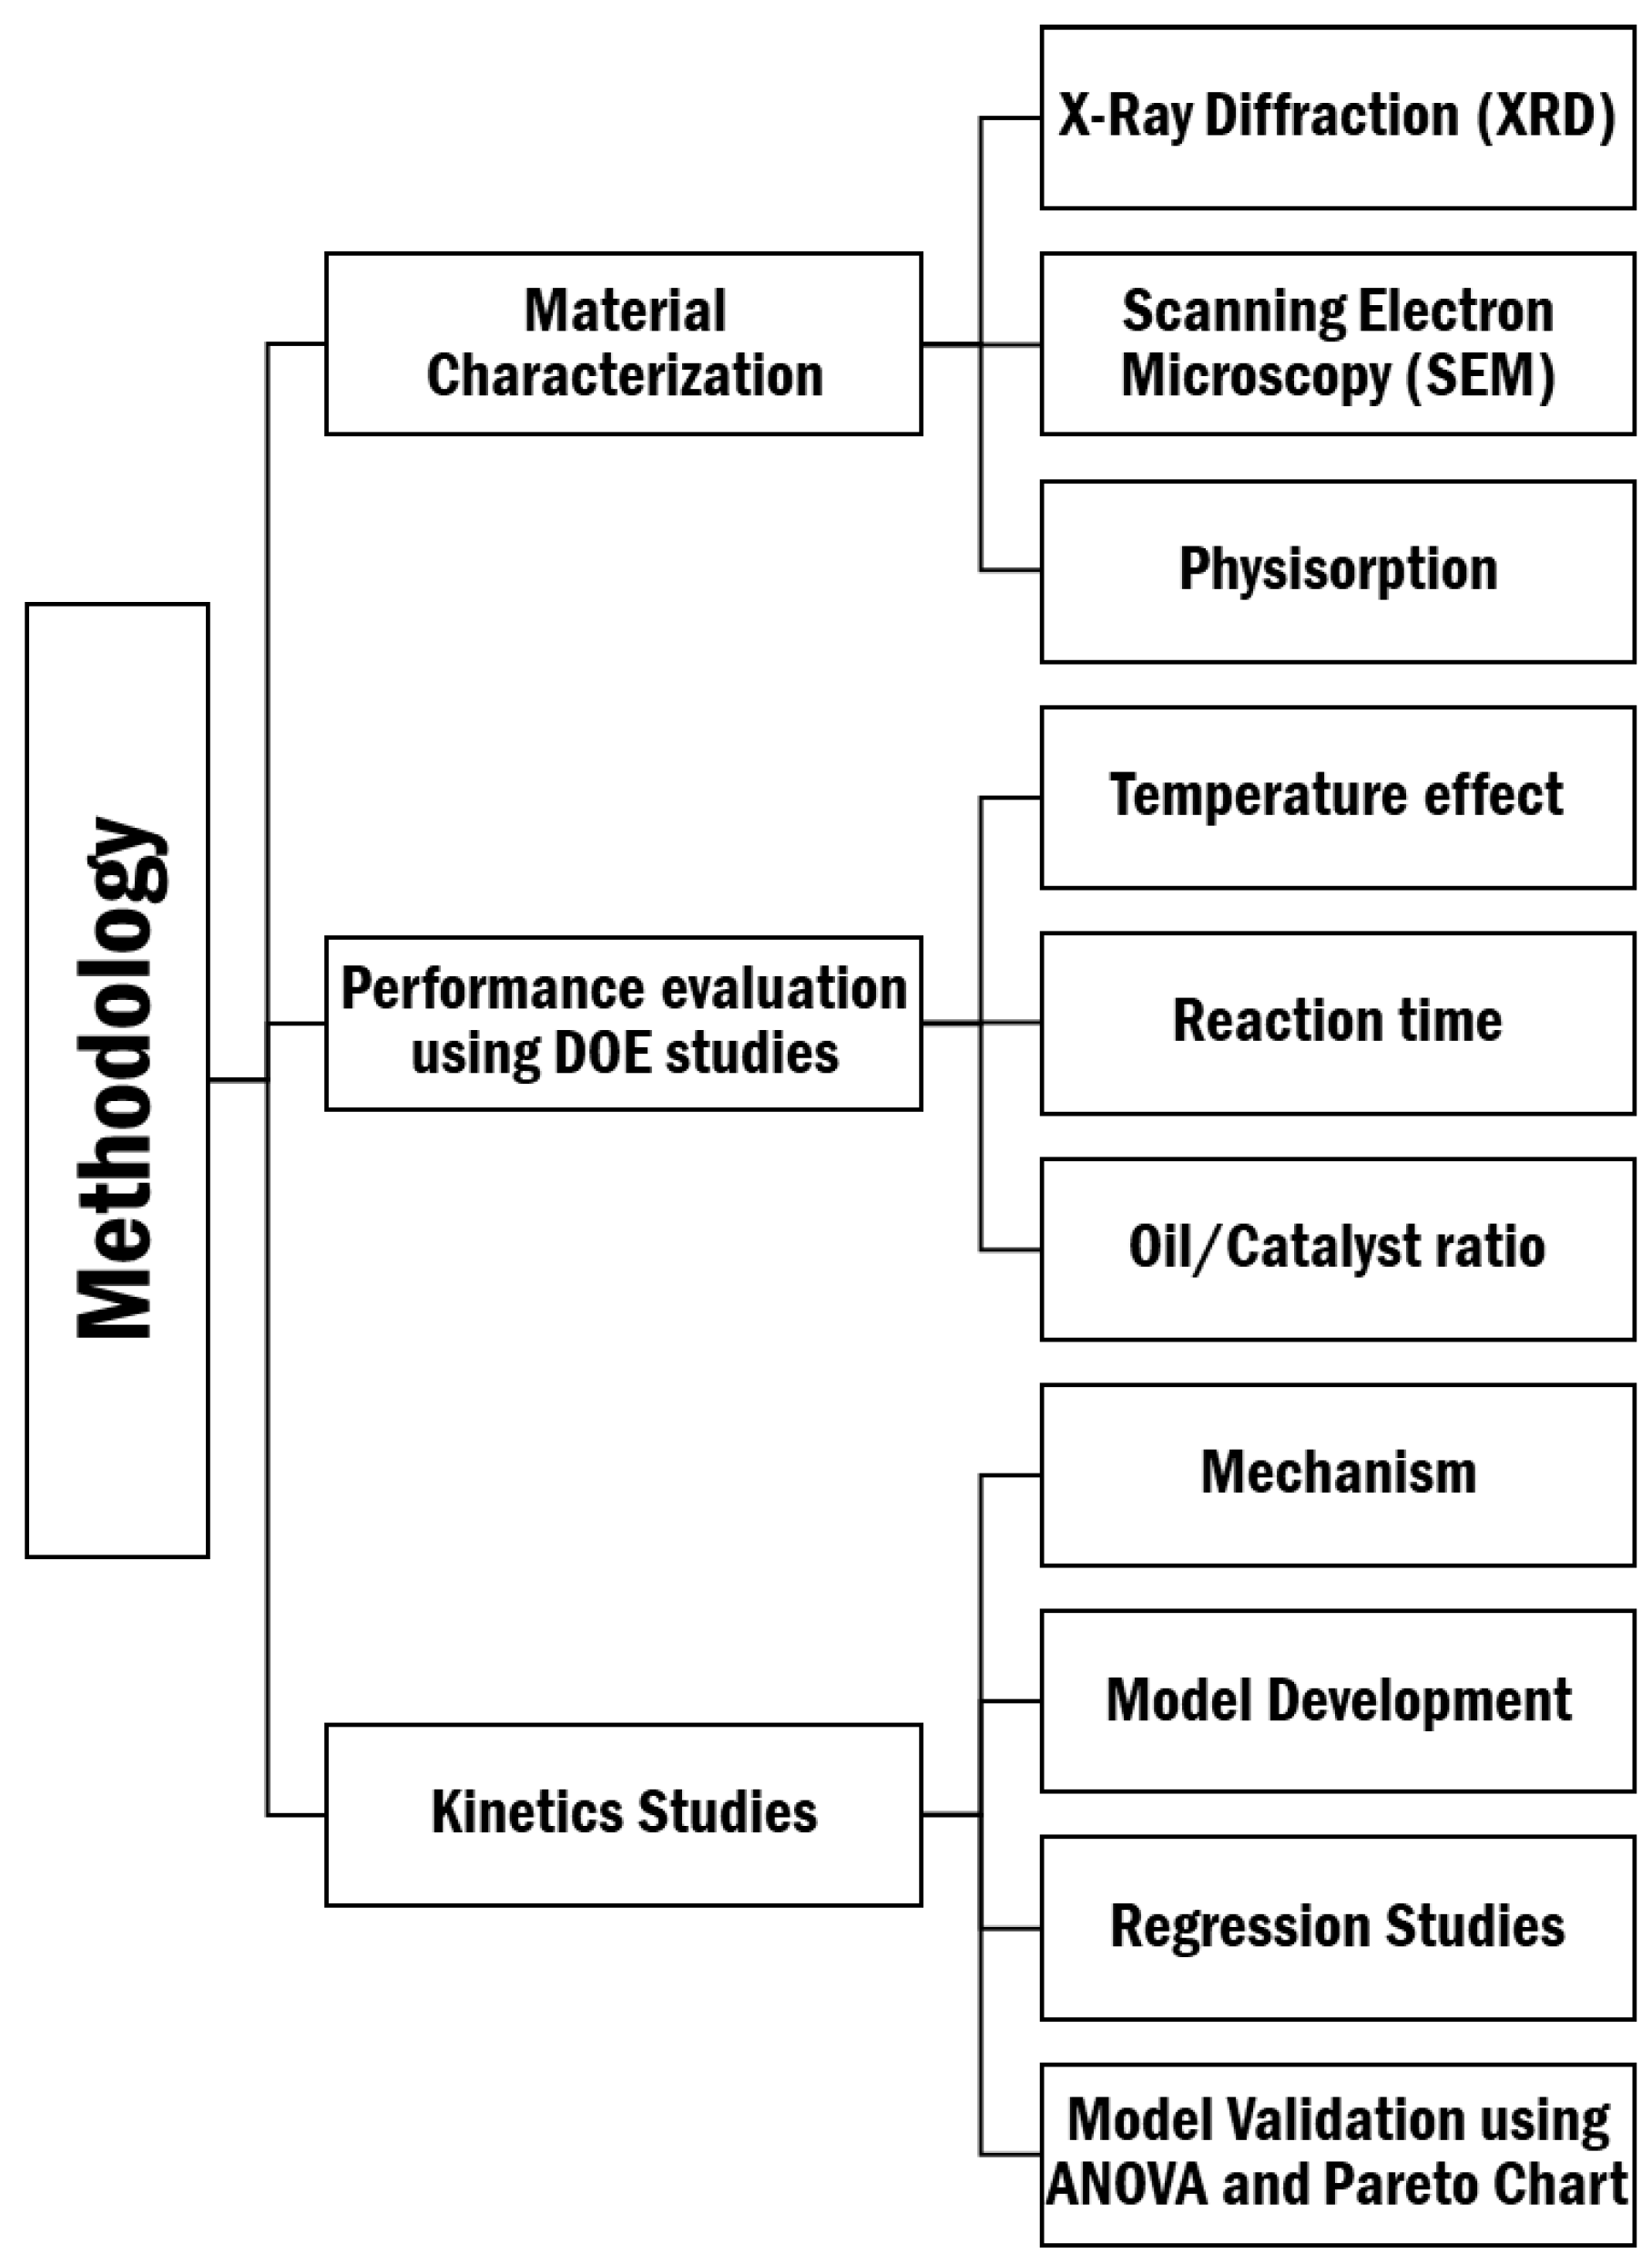
3. Materials and Methods
3.1. Materials
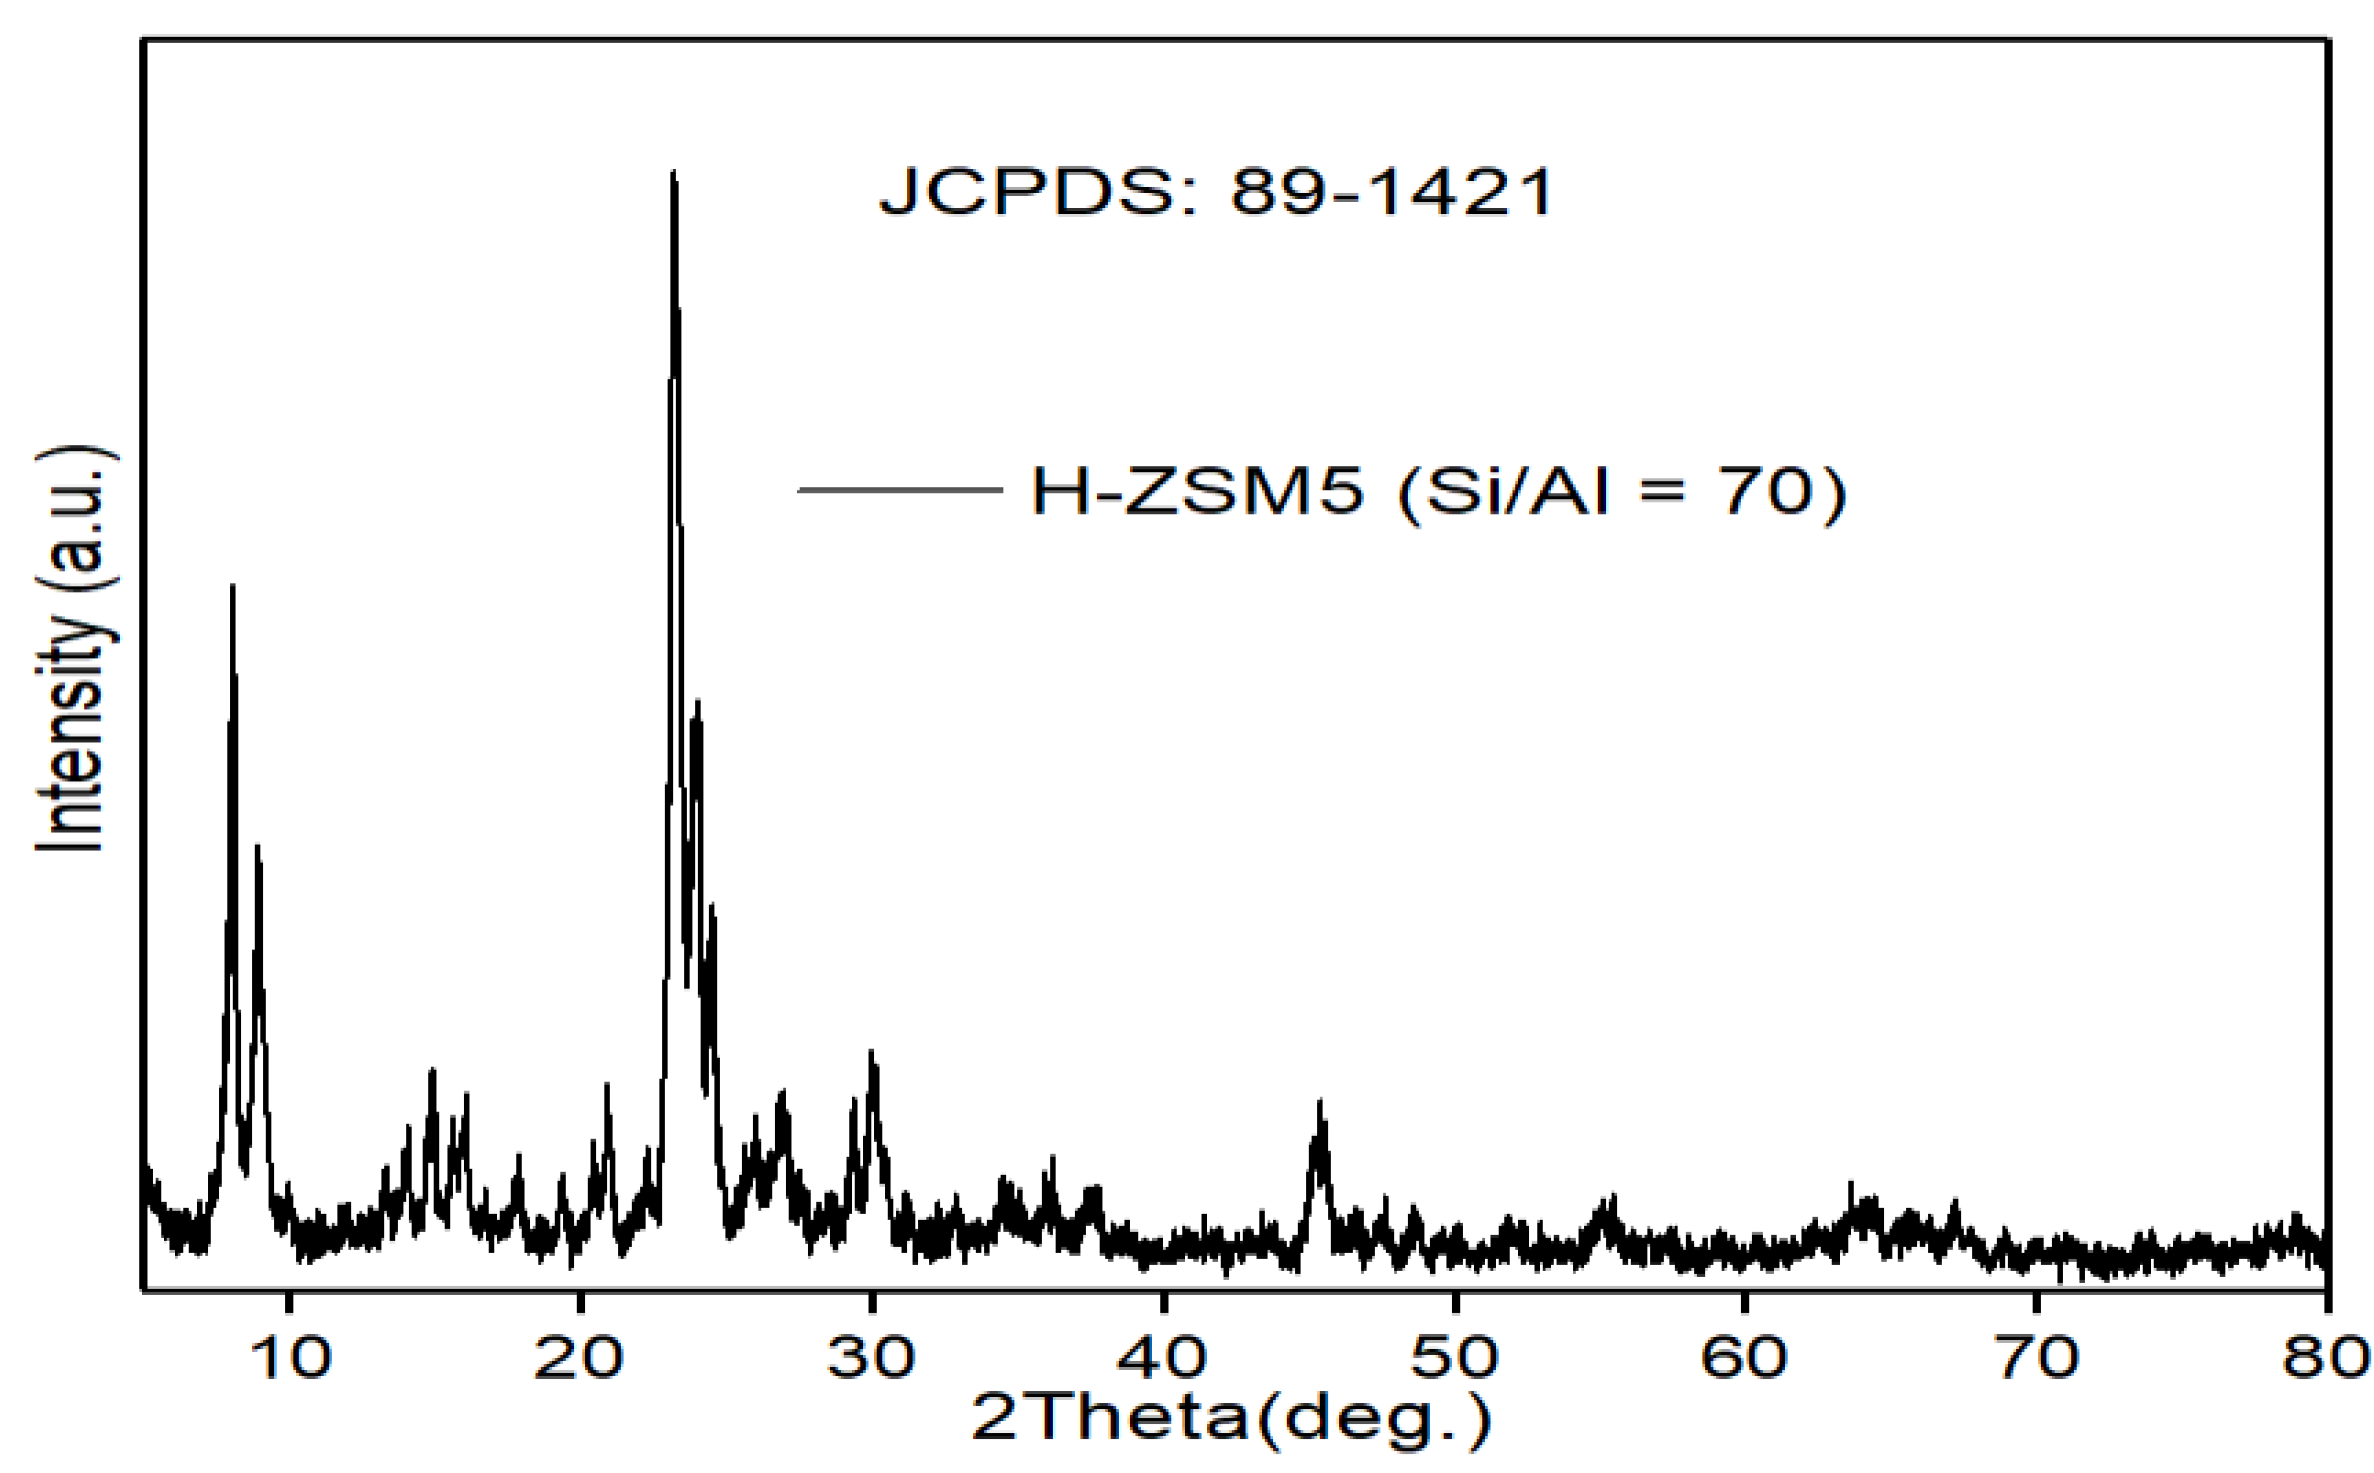
3.2. Catalyst Characterization
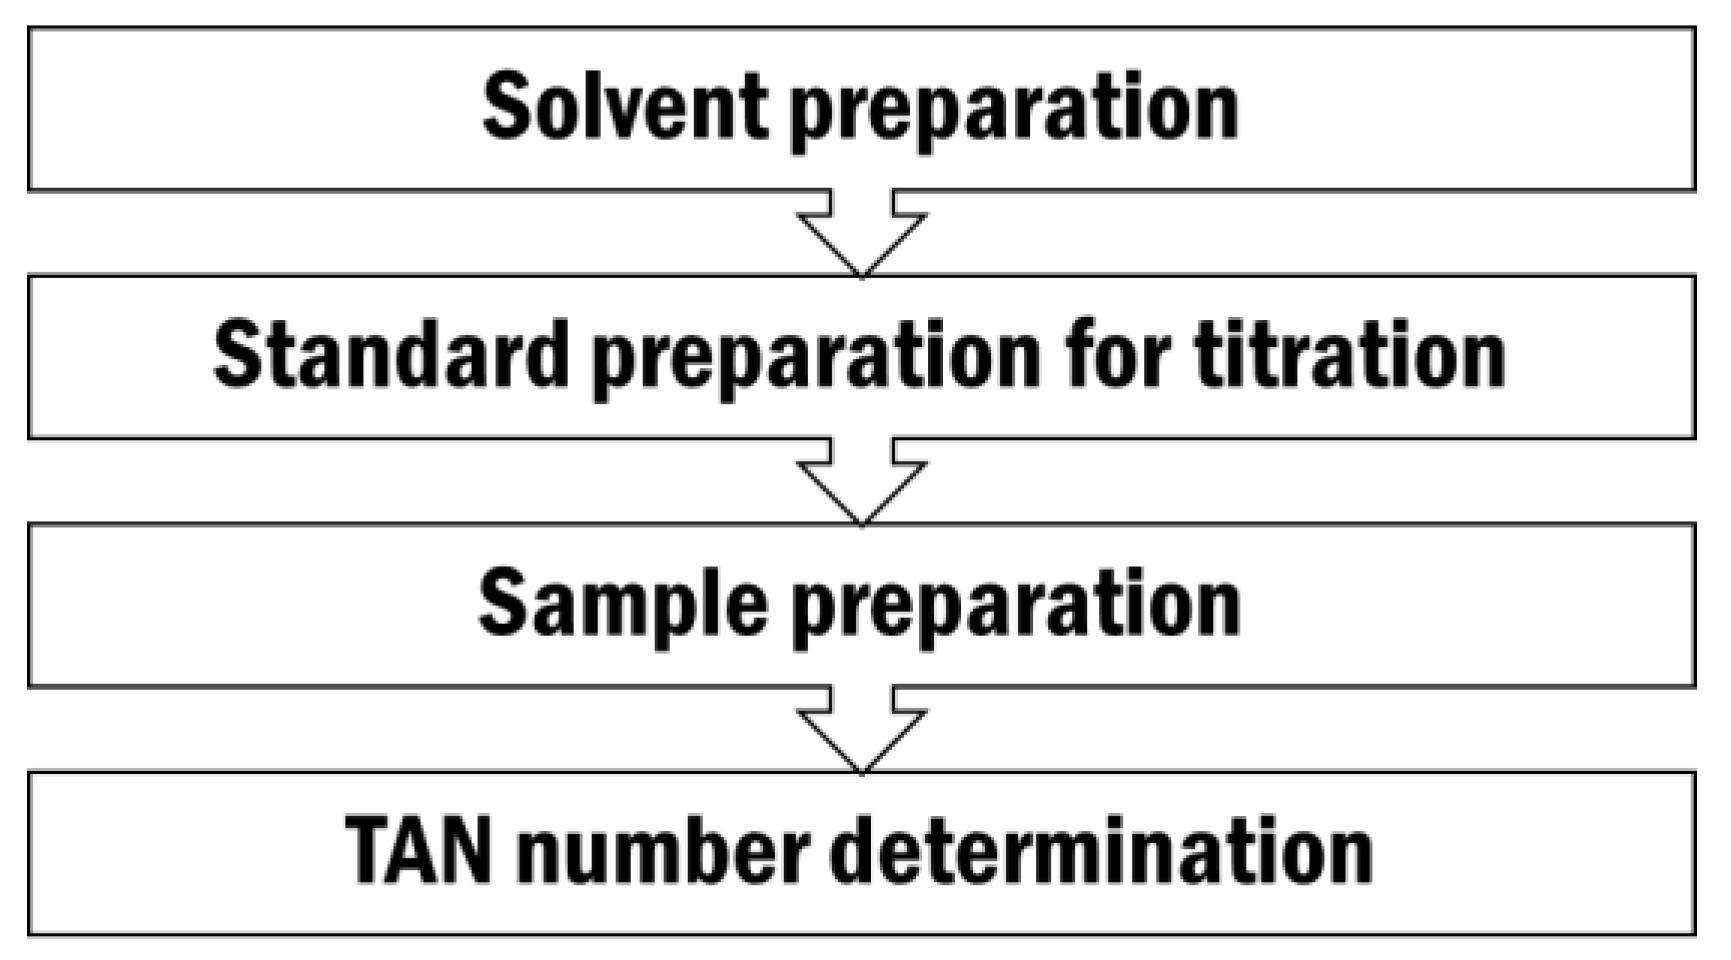
3.3. Analytical Method for TAN Number Determination
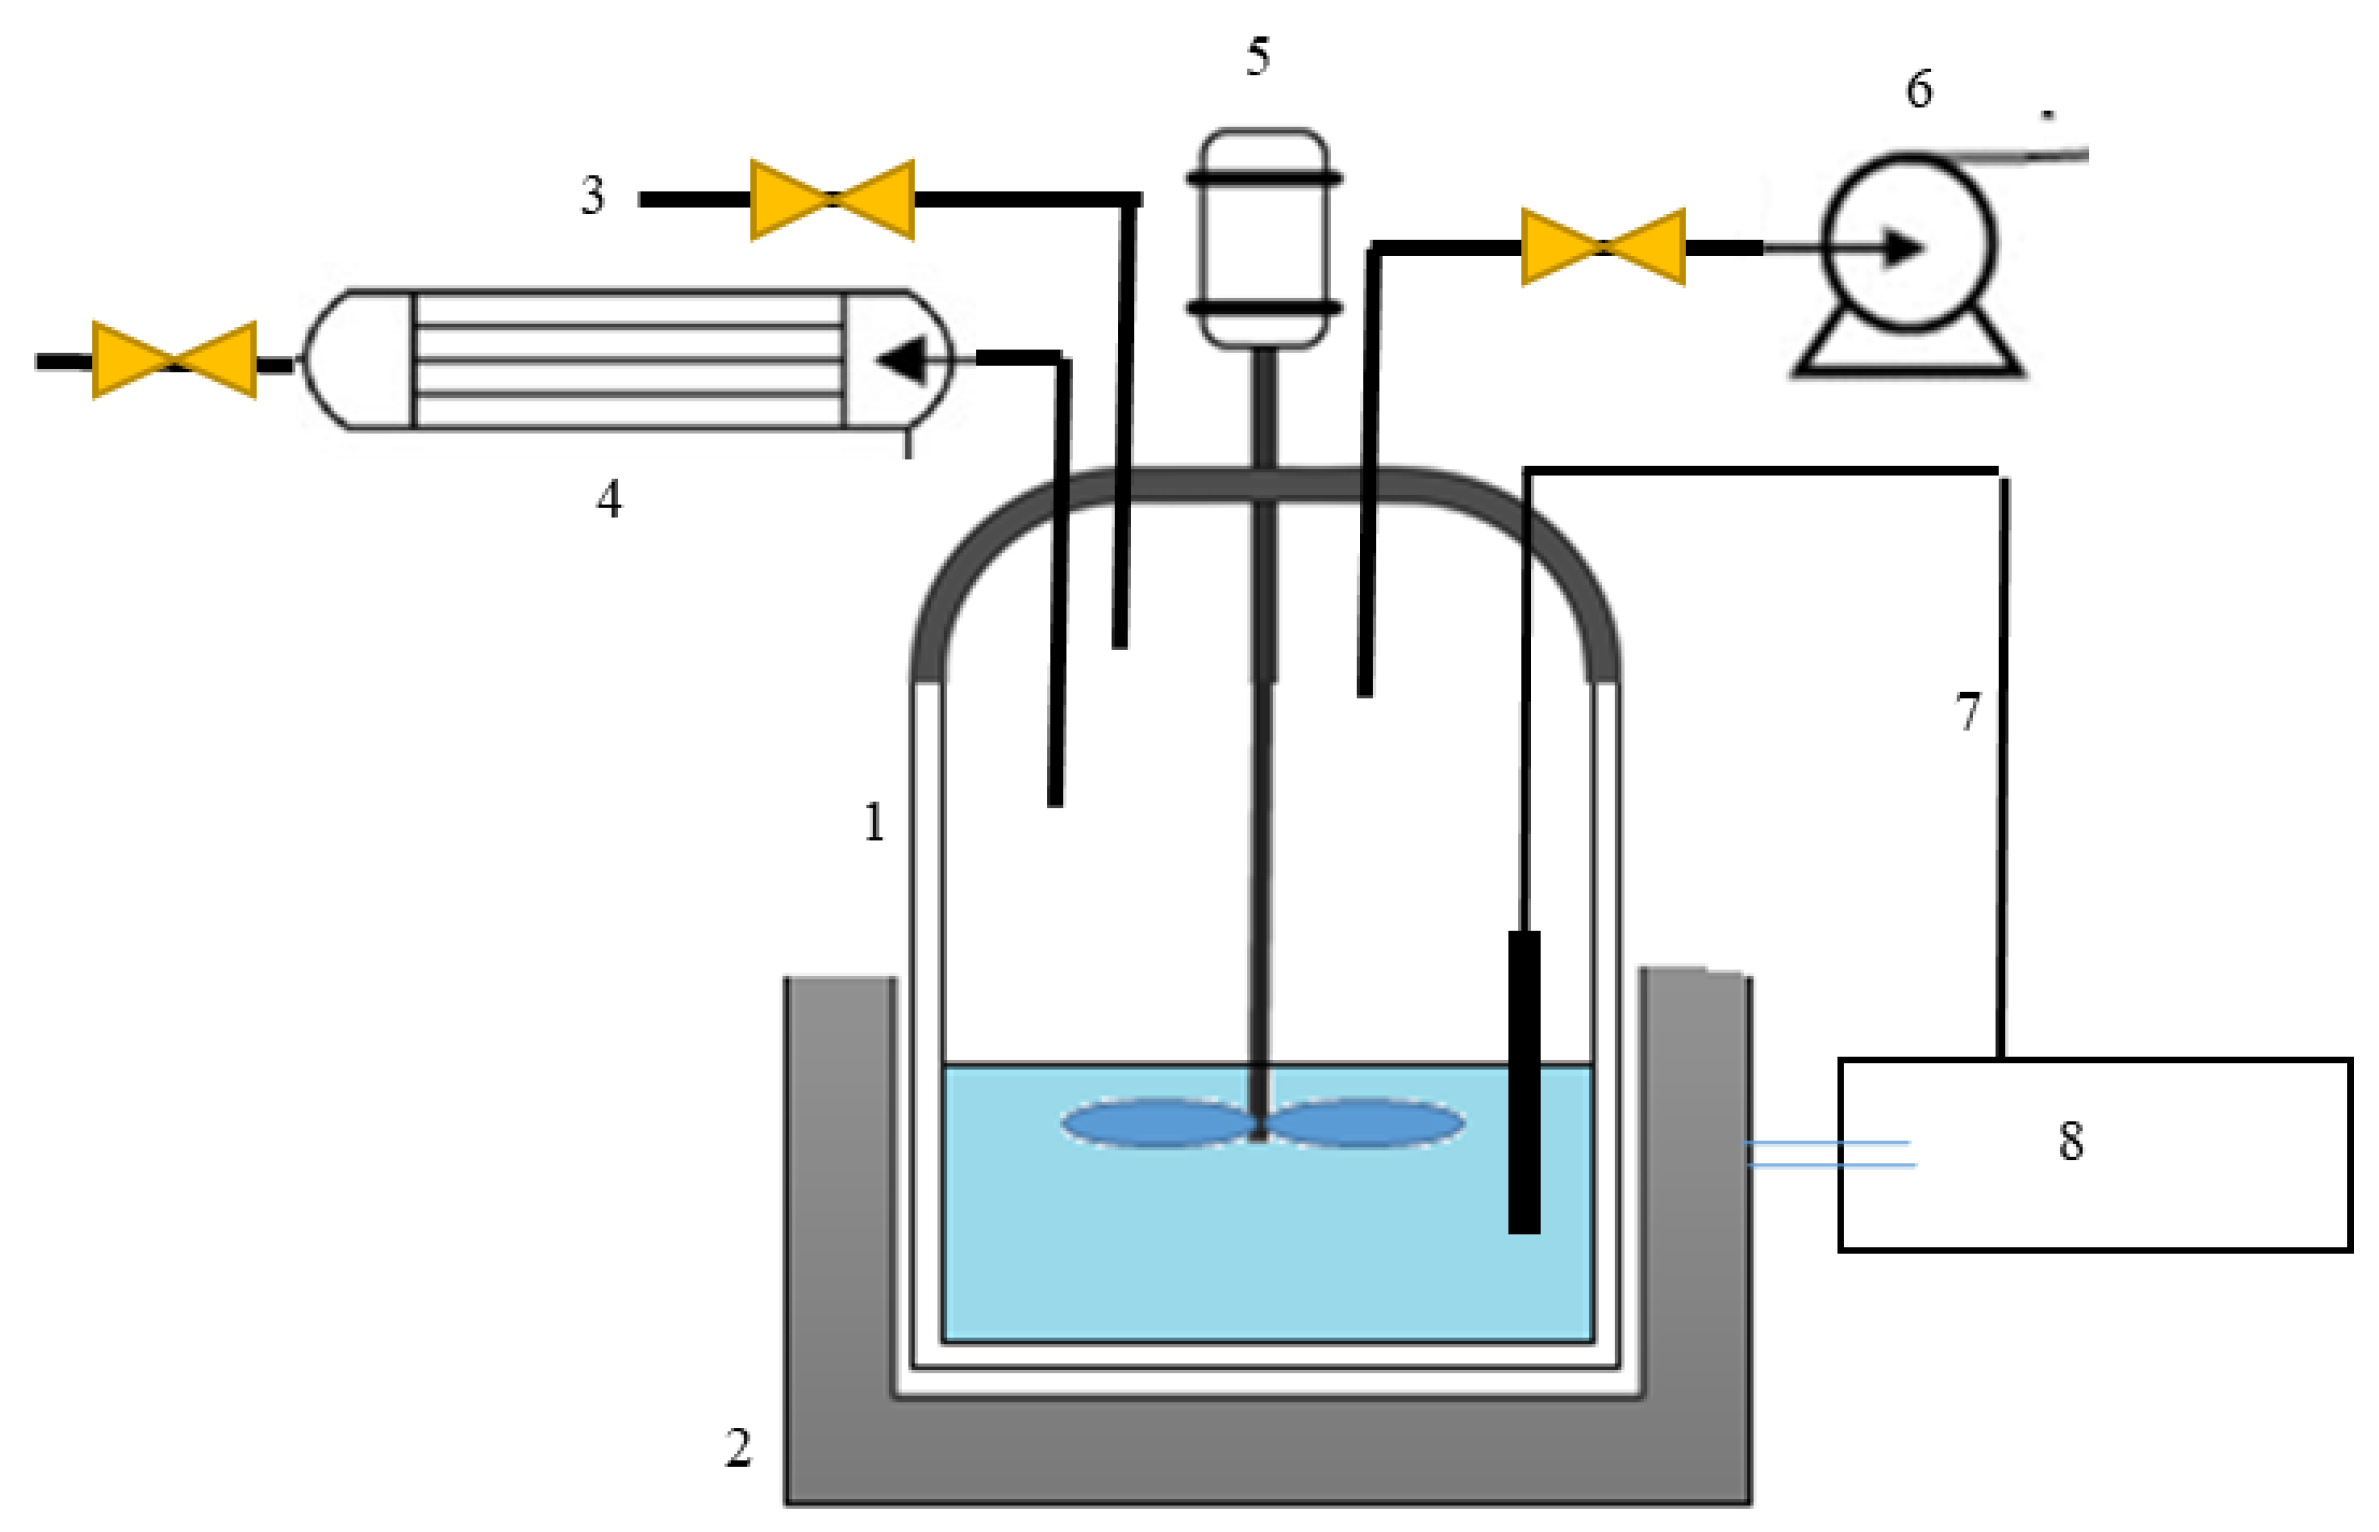
3.4. Experimental Section
3.4.1. Naphthenic Acid Removal Assessment
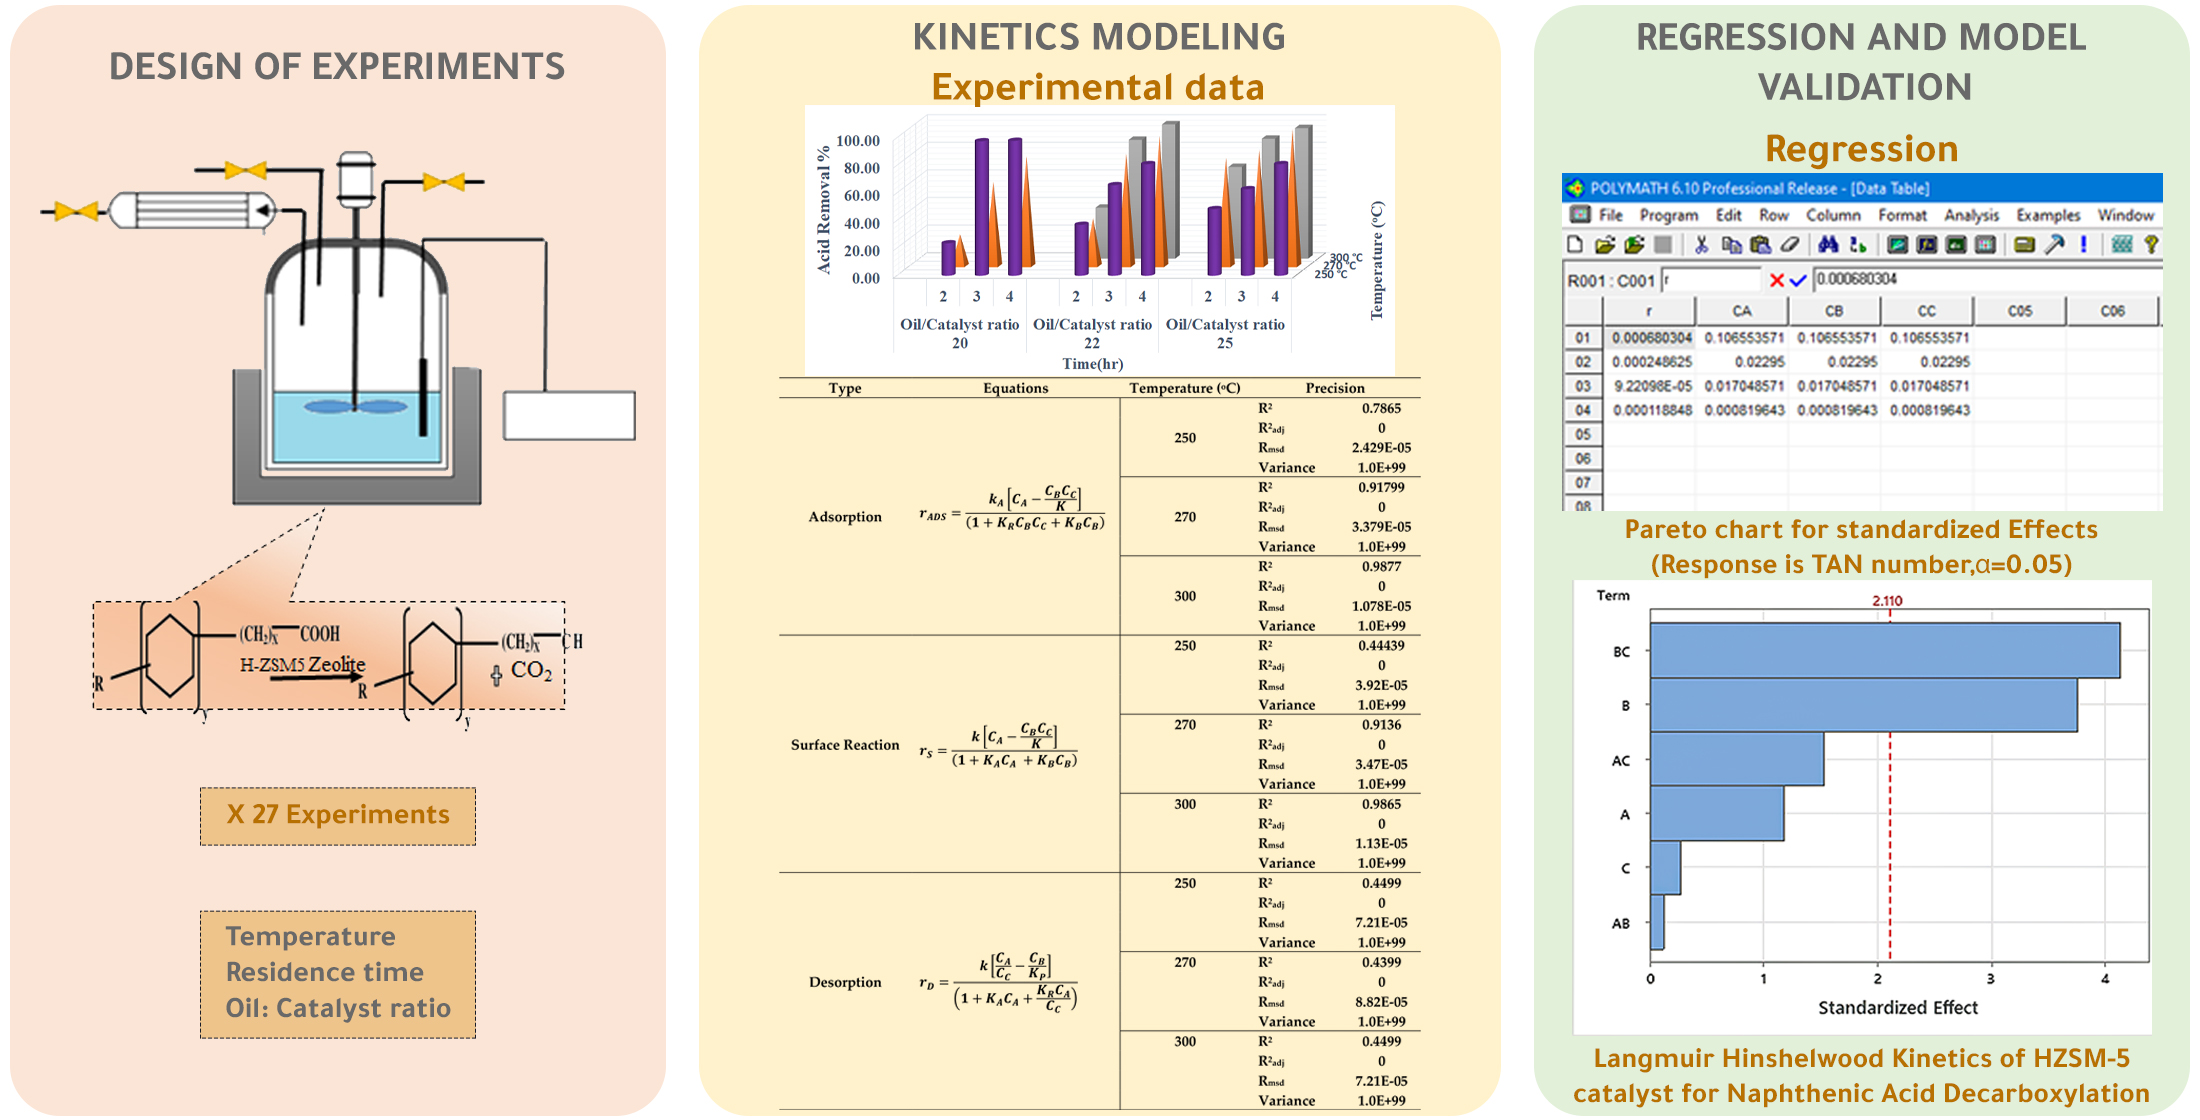
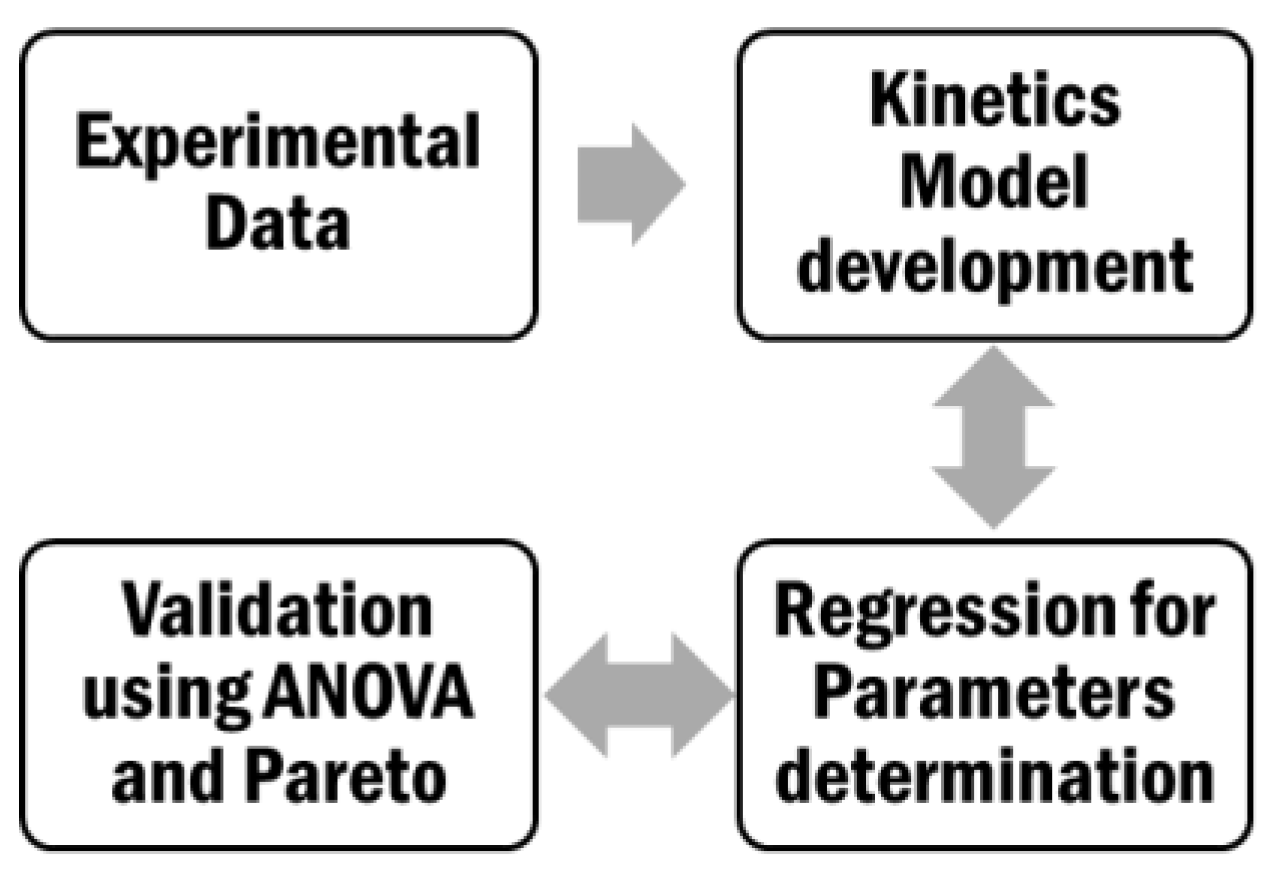
3.4.2. Kinetic Modeling and Regression Analysis
- The reactor was assumed to be operated under isothermal conditions.
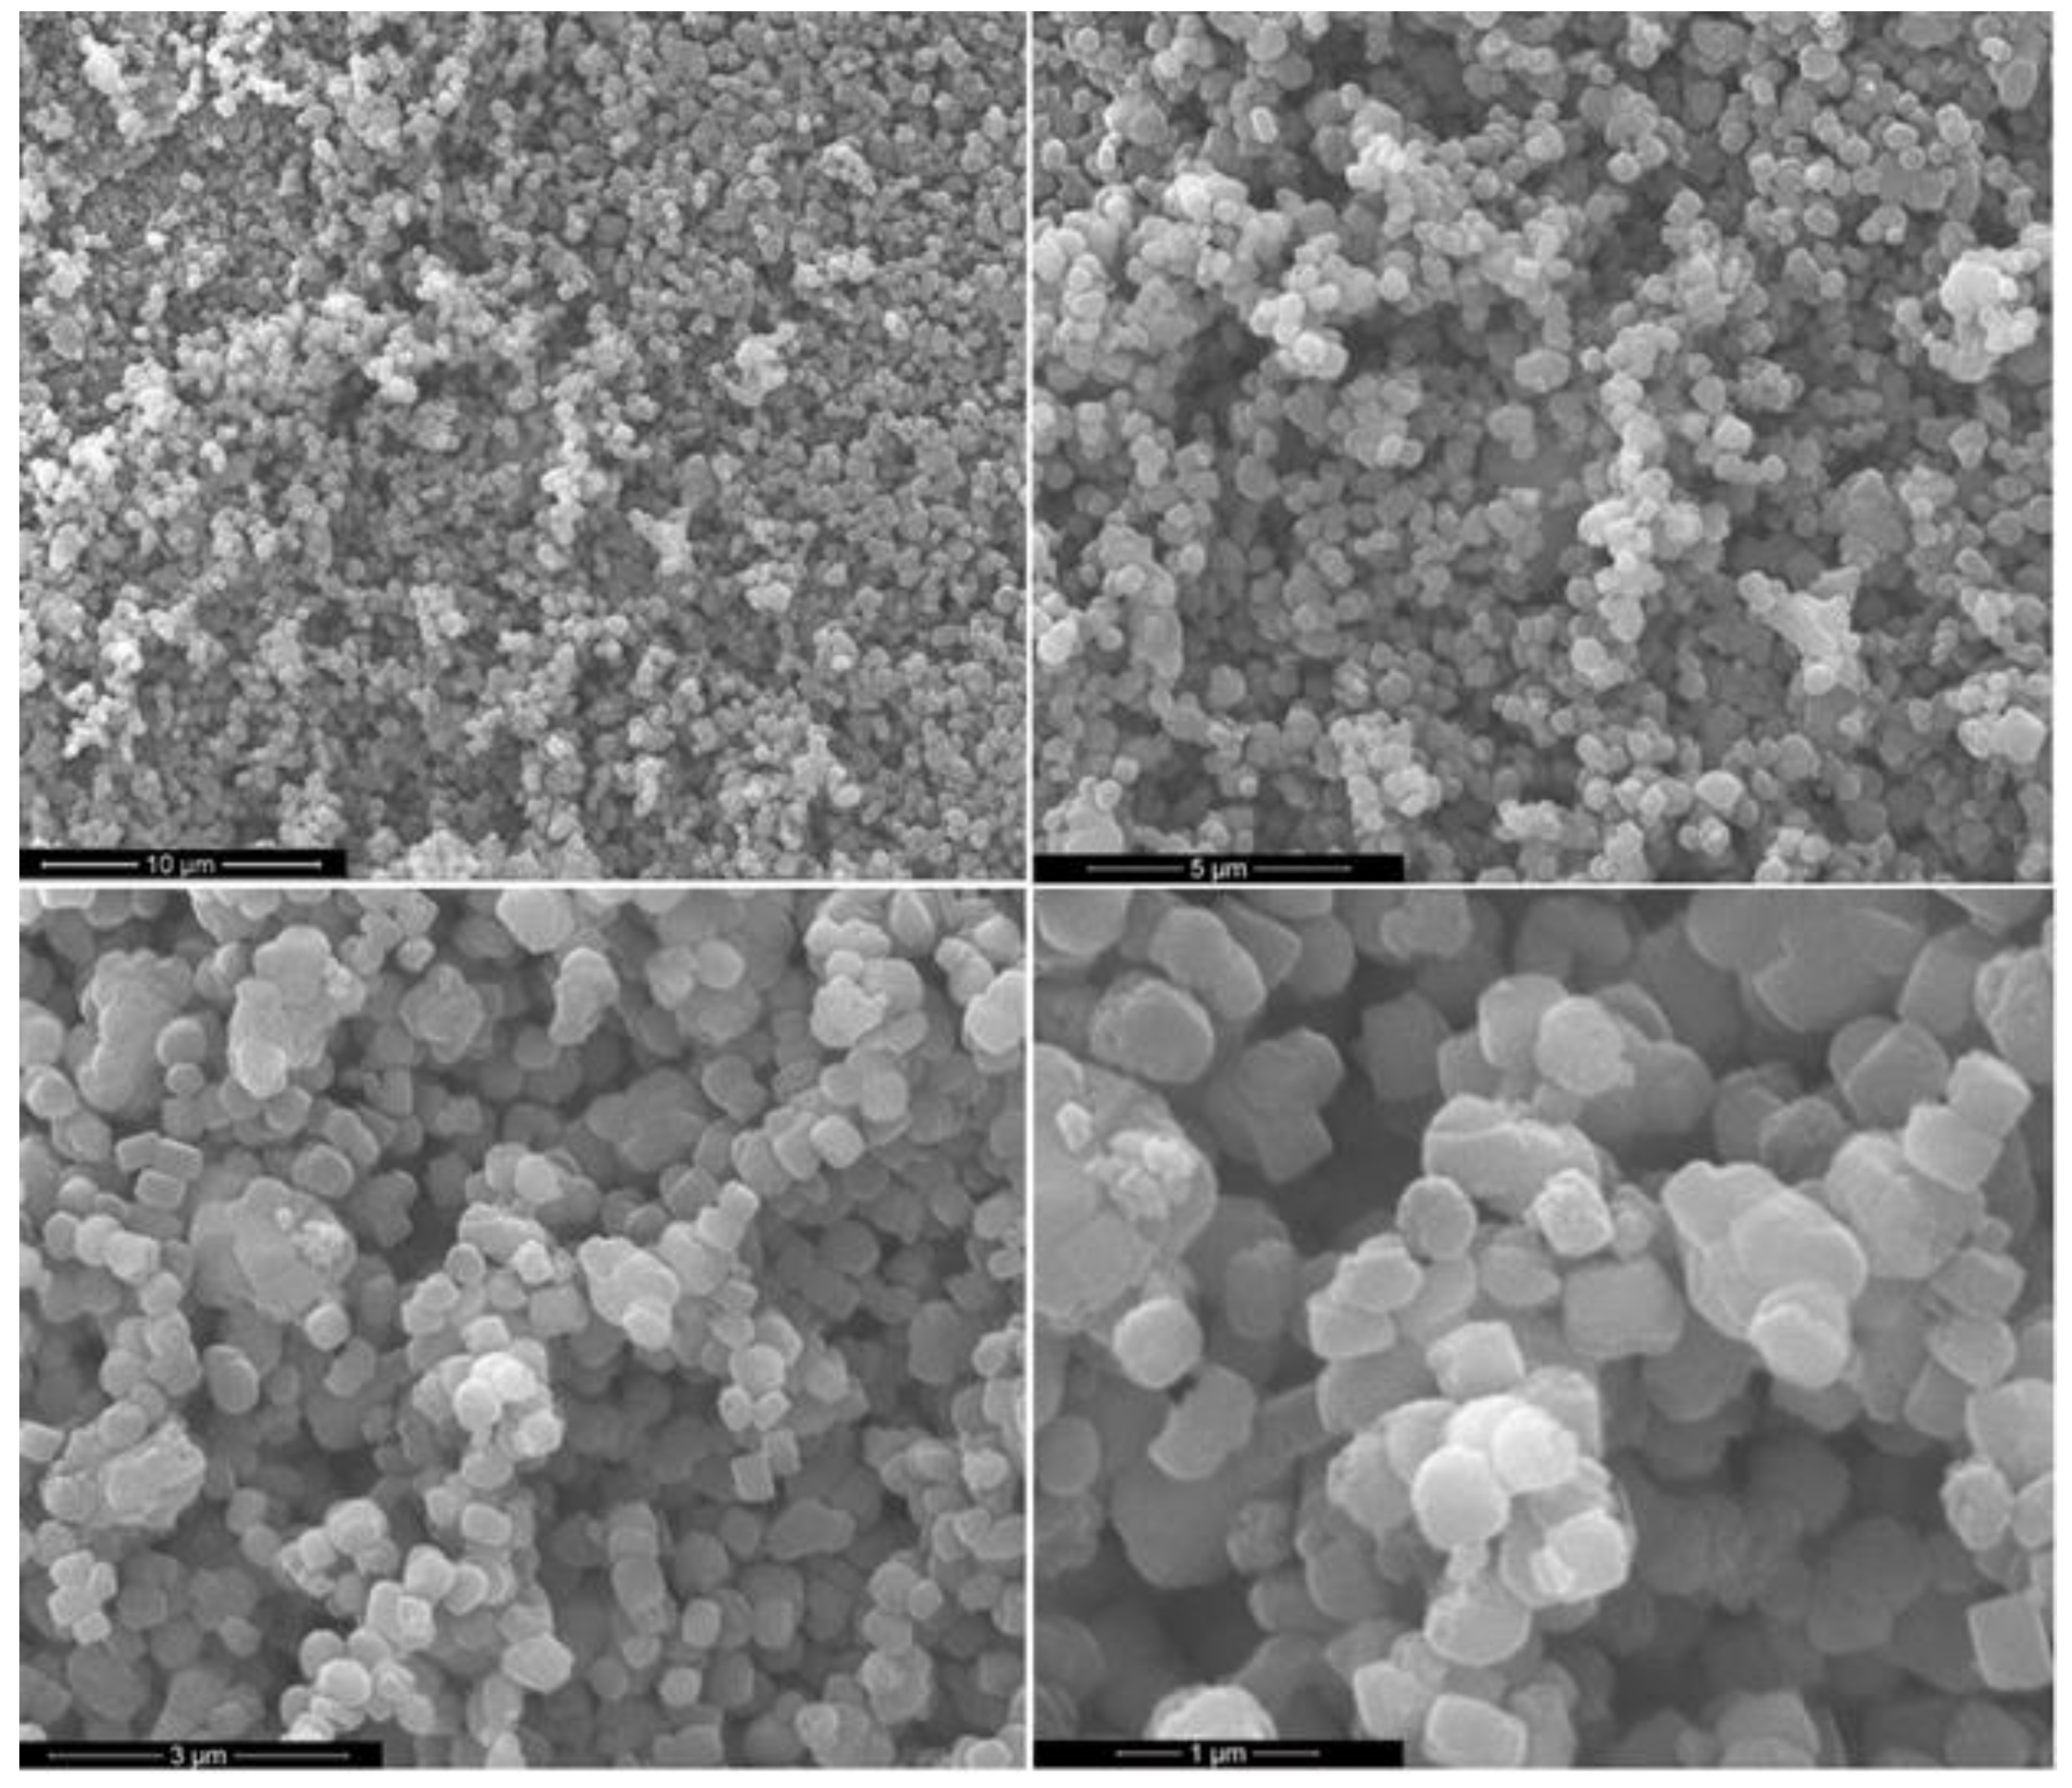
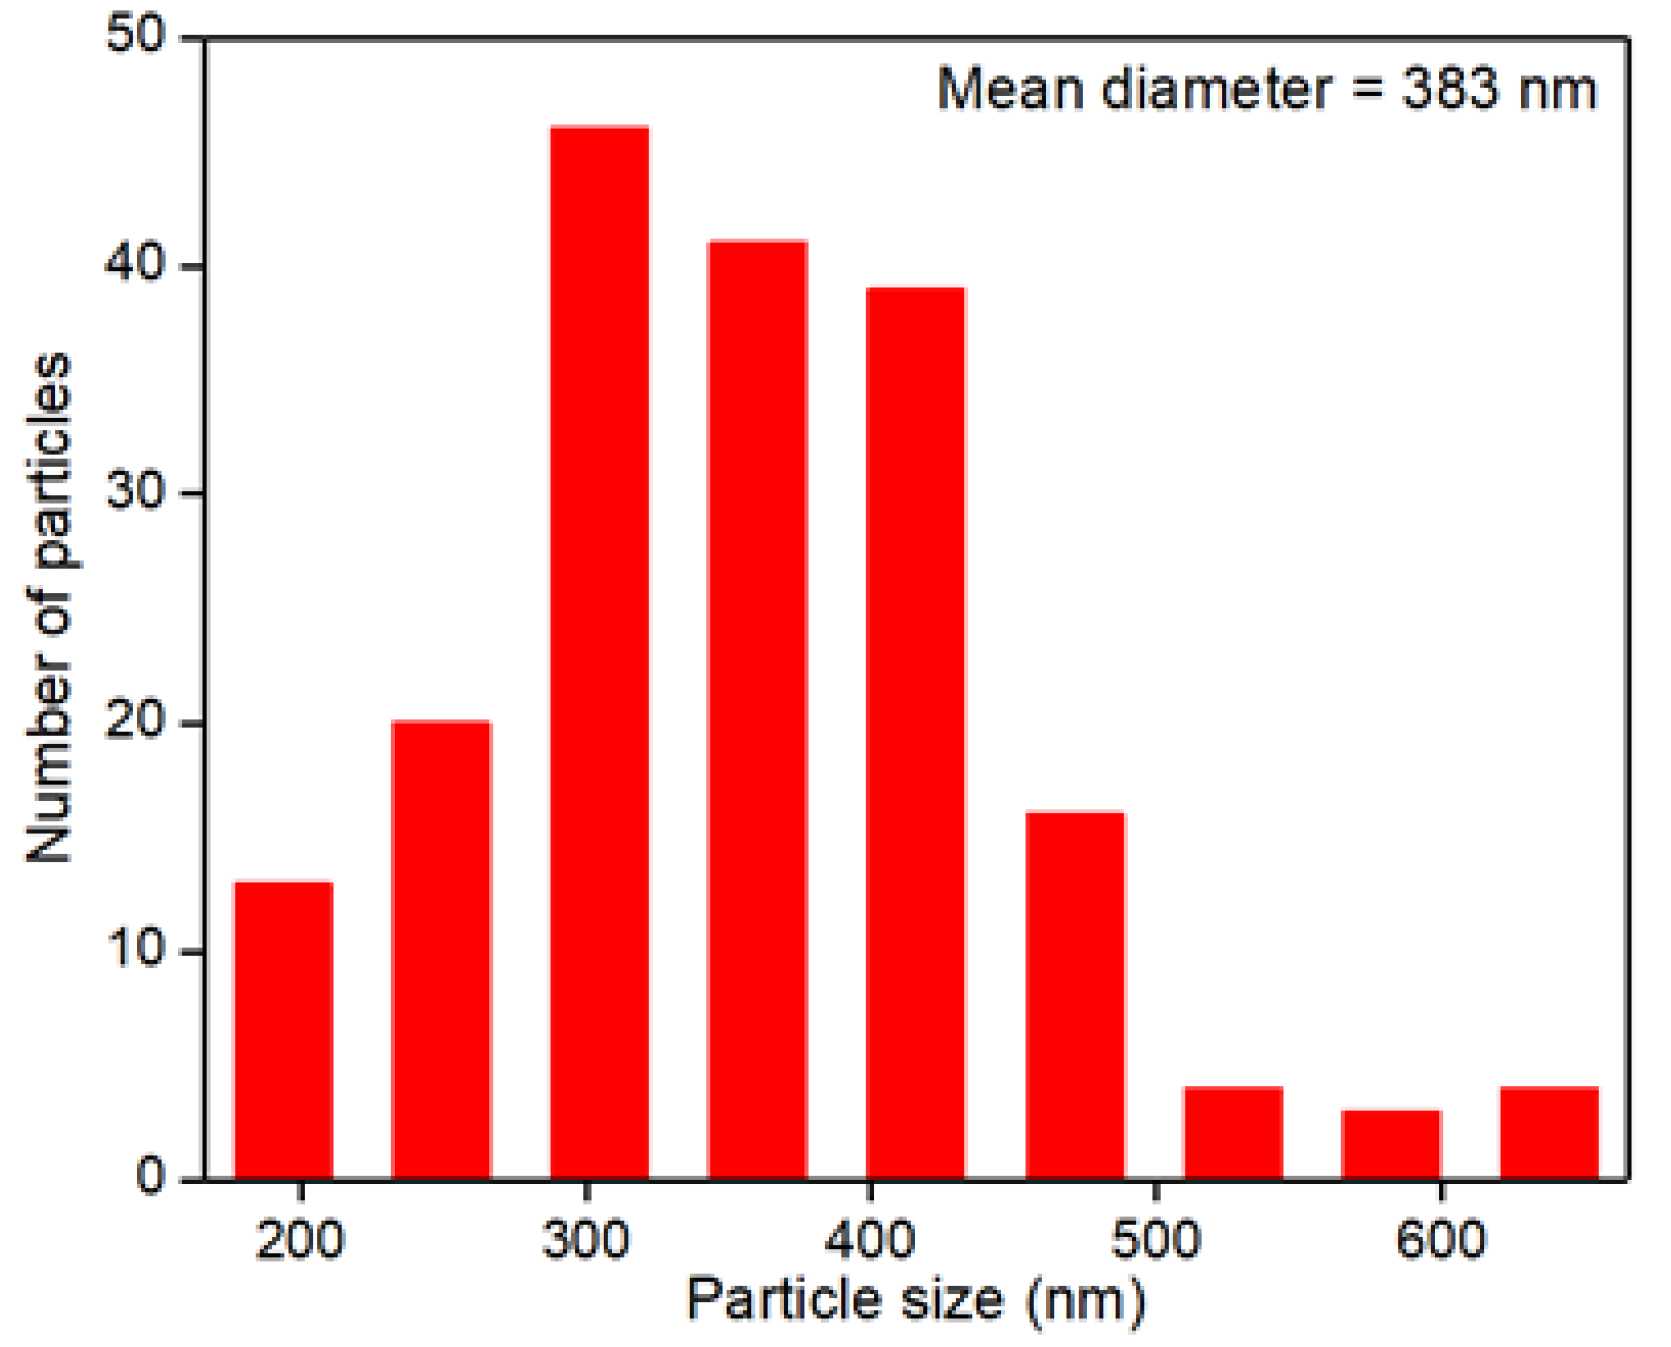
- The external diffusion is assumed to be negligible due to the high stirring rate, which avoids the formation of films around the catalyst. Moreover, the internal diffusion was negligible as a powder catalyst with particle size <1 µm was used (Refer to Figure 9 for particle size distribution). Therefore, the time to diffuse into and out of the pellet is almost instantaneous.
4. Conclusions
Supplementary Materials
Author Contributions
Funding
Data Availability Statement
Acknowledgments
Conflicts of Interest
Nomenclature
| A | RCOOH |
| Adj SS | Adjusted sums of squares |
| Adj MS | Adjusted mean squares |
| ANOVA | Analysis of variance |
| B | RH |
| C | CO2 |
| CA·S | The concentration of component A adsorb on site |
| CB·S | The concentration of component B adsorb on site |
| CO2 | Carbon dioxide |
| CS | Vacant sites |
| CT | Total sites available |
| DF | Degree of Freedom |
| E | Activation Energy |
| F-Value | Test statistics use in the analysis of variance |
| ΔHads | heat of adsorption |
| k | Kinetic constant |
| K | Equilibrium constant |
| KHP | Potassium Hydrogen Phthalate |
| P | Pressure |
| p-Value | Analysis of variance test gives the significance of each factor |
| R | Gas constant |
| R2 | Coefficient of determination |
| R2adj | Adjusted Coefficient of determination |
| rADS | Rate of adsorption |
| rD | Rate of desorption |
| Rmsd | root-mean-square deviation |
| rS | Rate of surface reaction |
| T | Temperature |
| TAN | Total acid number |
References
- Zhang, A.; Ma, Q.; Wang, K.; Tang, Y.; Goddard, W.A. Improved Processes to Remove Naphthenic Acids; California Inst. of Technology (CalTech): Pasadena, CA, USA, 2005. [Google Scholar]
- Patrick, B.N. Understanding Naphthenic Acid Corrosion in Refinery Settings; California Digital Library: Berkeley, CA, USA, 2015. [Google Scholar]
- Zhang, A.; Ma, Q.; Wang, K.; Liu, X.; Shuler, P.; Tang, Y. Naphthenic acid removal from crude oil through catalytic decarboxylation on magnesium oxide. Appl. Catal. A Gen. 2006, 303, 103–109. [Google Scholar] [CrossRef]
- Rana, B.S.; Cho, D.-W.; Cho, K.; Kim, J.-N. Total Acid Number (TAN) reduction of high acidic crude oil by catalytic esterification of naphthenic acids in fixed-bed continuous flow reactor. Fuel 2018, 231, 271–280. [Google Scholar] [CrossRef]
- Liu, G.Q.; Zhang, X.L.; Qu, D.R.; Zheng, Y.G.; Jiang, S.L.; Jiang, X.; Yang, Q.X.; Han, F.L. Naphthenic acid corrosion characteristic and corrosion product film resistance of carbon steel and Cr5Mo low alloy steel in secondary vacuum gas oil. Corros. Eng. Sci. Technol. 2016, 51, 445–454. [Google Scholar] [CrossRef]
- Cho, K.; Rana, B.S.; Cho, D.-W.; Beum, H.T.; Kim, C.-H.; Kim, J.-N. Catalytic removal of naphthenic acids over Co-Mo/γ-Al2O3 catalyst to reduce total acid number (TAN) of highly acidic crude oil. Appl. Catal. A Gen. 2020, 606, 117835. [Google Scholar] [CrossRef]
- Harun, N.S.C.; Shohaimi, N.A.M.; Daud, S. Total Acid Number Reduction of Acidic Petroleum Crude Oil by Using 2-Methylimidazole in Polyethylene Glycol and Ca/Al2O3 Catalyst. Mater. Sci. Forum 2021, 1025, 337–342. [Google Scholar] [CrossRef]
- Wang, Y.-Z.; Li, J.-Y.; Sun, X.-Y.; Duan, H.-L.; Song, C.-M.; Zhang, M.-M.; Liu, Y.-P. Removal of naphthenic acids from crude oils by fixed-bed catalytic esterification. Fuel 2013, 116, 723–728. [Google Scholar] [CrossRef]
- Park, J.; Zafar, F.; Kim, C.H.; Choi, J.; Bae, J.W. Synergy effects of basic graphitic-C3N4 over acidic Al2O3 for a liquid-phase decarboxylation of naphthenic acids. Fuel Process. Technol. 2018, 184, 36–44. [Google Scholar] [CrossRef]
- Mandal, P.C.; Wahyudiono, P.C.; Sasaki, M.; Goto, M. Reduction of total acid number (TAN) of naphthenic acid (NA) using supercritical water for reducing corrosion problems of oil refineries. Fuel 2012, 94, 620–623. [Google Scholar] [CrossRef]
- Wu, C. Computational Study on Removal of Naphthenic Acids from Petroleum-Based Systems; University of Calgary: Calgary, Alberta, 2017. [Google Scholar]
- Santos, D.F.; Chaves, A.R.; Ostroski, I.C. Naphthenic acid removal in model and real aviation kerosene mixture. Chem. Eng. Commun. 2020, 208, 1405–1418. [Google Scholar] [CrossRef]
- Derungs, W. Naphthenic acid corrosion—An old enemy of the petroleum industry. Corrosion 1956, 12, 41–46. [Google Scholar] [CrossRef]
- Barth, T.; Moen, L.; Dyrkorn, C. Comparison of acid numbers and carboxylic acid molecular compositions in biodegraded and normal crude oils. Prepr. Am. Chem. Society. Div. Pet. Chem. 1998, 43, 134–136. [Google Scholar]
- Jaffé, R.; Gallardo, M.T. Application of carboxylic acid biomarkers as indicators of biodegradation and migration of crude oils from the Maracaibo Basin, Western Venezuela. Org. Geochem. 1993, 20, 973–984. [Google Scholar] [CrossRef]
- Headley, J.V.; Peru, K.M.; Barrow, M.P. Mass spectrometric characterization of naphthenic acids in environmental samples: A review. Mass Spectrom. Rev. 2008, 28, 121–134. [Google Scholar] [CrossRef] [PubMed]
- Grewer, D.M.; Young, R.F.; Whittal, R.M.; Fedorak, P.M. Naphthenic acids and other acid-extractables in water samples from Alberta: What is being measured? Sci. Total Environ. 2010, 408, 5997–6010. [Google Scholar] [CrossRef]
- Yang, C.; Zhang, G.; Serhan, M.; Koivu, G.; Yang, Z.; Hollebone, B.; Lambert, P.; Brown, C.E. Characterization of naphthenic acids in crude oils and refined petroleum products. Fuel 2019, 255, 115849. [Google Scholar] [CrossRef]
- Rowland, S.J.; West, C.E.; Scarlett, A.G.; Jones, D.; Boberek, M.; Pan, L.; Ng, M.; Kwong, L.; Tonkin, A. Monocyclic and monoaromatic naphthenic acids: Synthesis and characterisation. Environ. Chem. Lett. 2011, 9, 525–533. [Google Scholar] [CrossRef]
- Messele, S.A.; Chelme-Ayala, P.; El-Din, M.G. Catalytic ozonation of naphthenic acids in the presence of carbon-based metal-free catalysts: Performance and kinetic study. Catal. Today 2021, 361, 102–108. [Google Scholar] [CrossRef]
- Kang, S.S.; Kang, J.W. Extraction of naphthenic acid from low-grade crude oil using diol compounds. Fuel 2020, 275, 117828. [Google Scholar] [CrossRef]
- Adams, F.V.; Chukwuneke, C.E.; Agboola, B.O. Recent Techniques for the Removal of Naphthenic Acid from Heavy Crude Oils. Process. Heavy Crude Oils Chall. Oppor. 2019, 2019, 185. [Google Scholar] [CrossRef][Green Version]
- Dias, H.P.; Gonçalves, G.R.; Freitas, J.C.; Gomes, A.O.; de Castro, E.V.; Vaz, B.G.; Aquije, G.M.; Romão, W. Catalytic decarboxylation of naphthenic acids in crude oils. Fuel 2015, 158, 113–121. [Google Scholar] [CrossRef]
- Ding, L.; Rahimi, P.; Hawkins, R.; Bhatt, S.; Shi, Y. Naphthenic acid removal from heavy oils on alkaline earth-metal oxides and ZnO catalysts. Appl. Catal. A Gen. 2009, 371, 121–130. [Google Scholar] [CrossRef]
- Fu, X.; Dai, Z.; Tian, S.; Long, J.; Hou, S.; Wang, X. Catalytic Decarboxylation of Petroleum Acids from High Acid Crude Oils over Solid Acid Catalysts. Energy Fuels 2008, 22, 1923–1929. [Google Scholar] [CrossRef]
- Coto, B.; Suárez, I.; Tenorio, M.J.; Nieto, S.; Alvarez, N.; Peña, J.L. Oil acidity reduction by extraction with imidazolium ionic liquids: Experimental, COSMO description and reutilization study. Sep. Purif. Technol. 2020, 254, 117529. [Google Scholar] [CrossRef]
- Takemura, Y.; Nakamura, A.; Taguchi, H.; Ouchi, K. Catalytic decarboxylation of benzoic acid. Ind. Eng. Chem. Prod. Res. Dev. 1985, 24, 213–215. [Google Scholar] [CrossRef]
- Zhuman, B.; Anis, S.F.; Saepurahman; Singravel, G.; Hashaikeh, R. Catalytic Cracking of n-Hexadecane Using Carbon Nanostructures/Nano-Zeolite-Y Composite Catalyst. Catalysts 2020, 10, 1385. [Google Scholar] [CrossRef]
- Xu, B.; Sievers, C.; Hong, S.B.; Prins, R.; van Bokhoven, J.A. Catalytic activity of Brønsted acid sites in zeolites: Intrinsic activity, rate-limiting step, and influence of the local structure of the acid sites. J. Catal. 2006, 244, 163–168. [Google Scholar] [CrossRef]
- Silva, V.; Crispim, A.; Queiroz, M.; Laborde, H.; Rodrigues, M.; Menezes, R. Characterization structural and morphology ZSM-5 zeolite by hydrothermal synthesis. In Proceedings of the Seventh International Latin American Conference on Powder Technology, Atibaia, SP, Brazil, 8–10 November 2009. [Google Scholar]
- Oh, H.-Y.; Park, J.-H.; Rhee, Y.-W.; Kim, J.-N. Decarboxylation of naphthenic acid using alkaline earth metal oxide. J. Ind. Eng. Chem. 2011, 17, 788–793. [Google Scholar] [CrossRef]
- Wang, Y.-Z.; Zhong, D.-L.; Duan, H.-L.; Song, C.-M.; Han, X.-T.; Ma, X.-R. Removal of naphthenic acids from crude oils by catalytic decomposition using Mg–Al hydrotalcite/γ-Al2O3 as a catalyst. Fuel 2014, 134, 499–504. [Google Scholar] [CrossRef]
- Zafar, F.; Park, J.; Kim, C.H.; Bae, J.W. Contributions of acidic-basic sites on hybridized FER@g-C3N4 for liquid-phase decarboxylation of naphthenic acids. Fuel 2021, 296, 120679. [Google Scholar] [CrossRef]
- Shukri, N.M.; Jaafar, J.; Abu Bakar, W.A.W.; Majid, Z.A. Optimization of basic catalyst with ammoniated polyethylene glycol for the removal of naphthenic acid from petroleum crude oil by Box–Behnken design. Clean Technol. Environ. Policy 2015, 17, 2387–2400. [Google Scholar] [CrossRef]
- Mathews, P.G. Design of Experiments with MINITAB; ASQ Quality Press: Milwaukee, WI, USA, 2005. [Google Scholar]
- Shah, K.K.; Saikia, J.; Saikia, D.; Talukdar, A.K. Synthesis and characterization of isomorphously zirconium substituted Mobil Five (MFI) zeolite. Mater. Chem. Phys. 2012, 134, 43–49. [Google Scholar] [CrossRef]
- Deng, S.; Lv, G.; Zhai, Y.; Yang, Z.; Zhu, Y.; Li, H.; Wang, F.; Zhang, X. Framework Fe-Doped Mobil Five (MFI) Zeolites as Highly Active and Stable Fenton-Like Catalysts for Basic Dyes Degradation. J. Nanosci. Nanotechnol. 2020, 20, 1520–1529. [Google Scholar] [CrossRef] [PubMed]
- Kwok, K.M.; Chen, L.; Zeng, H.C. Design of hollow spherical Co@ hsZSM5@ metal dual-layer nanocatalysts for tandem CO2 hydrogenation to increase C2+ hydrocarbon selectivity. J. Mater. Chem. A 2020, 8, 12757–12766. [Google Scholar] [CrossRef]
- Marsiezade, N.; Javanbakht, V. Novel hollow beads of carboxymethyl cellulose/ZSM-5/ZIF-8 for dye removal from aqueous solution in batch and continuous fixed bed systems. Int. J. Biol. Macromol. 2020, 162, 1140–1152. [Google Scholar] [CrossRef] [PubMed]
- Hassanpour, S.; Taghizadeh, M.; Yaripour, F. Preparation, Characterization, and Activity Evaluation of H-ZSM-5 Catalysts in Vapor-Phase Methanol Dehydration to Dimethyl Ether. Ind. Eng. Chem. Res. 2010, 49, 4063–4069. [Google Scholar] [CrossRef]
- Wang, X.; Zhang, J.; Zhang, T.; Xiao, H.; Song, F.; Han, Y.; Tan, Y. Mesoporous ZnZSM-5 zeolites synthesized by one-step desilication and reassembly: A durable catalyst for methanol aromatization. RSC Adv. 2016, 6, 23428–23437. [Google Scholar] [CrossRef]
- Thommes, M. Textural Characterization of Zeolites and Ordered Mesoporous Materials by Physical Adsorption. Stud. Surf. Sci. Catal. 2007, 168, 495–523. [Google Scholar] [CrossRef]
- Dollimore, D.; Spooner, P.; Turner, A. The bet method of analysis of gas adsorption data and its relevance to the calculation of surface areas. Surf. Technol. 1976, 4, 121–160. [Google Scholar] [CrossRef]
- Khan, M.K.; Riaz, A.; Yi, M.; Kim, J. Removal of naphthenic acids from high acid crude via esterification with methanol. Fuel Process. Technol. 2017, 165, 123–130. [Google Scholar] [CrossRef]
- ASTM D664-11; Standard Test Method for Acid Number of Petroleum Products by Potentiometric Titration. ASTM International West Conshohocken: West conshohocken, PA, USA, 2004.
- Nascimento, G.; Duarte, M.; Schuler, A.; Barbosa, C. Synthesis, characterization, and application of the mesoporous molecular sieve Sr-MCM-41 in the removal of naphthenic acids from a model mixture of aviation kerosene by adsorption. Braz. J. Pet. Gas 2014, 8, 1405–1418. [Google Scholar] [CrossRef][Green Version]
- Campos, N.F.; Barbosa, C.M.; Rodríguez-Díaz, J.M.; Duarte, M.M. Removal of naphthenic acids using activated charcoal: Kinetic and equilibrium studies. Adsorpt. Sci. Technol. 2018, 36, 1405–1421. [Google Scholar] [CrossRef]
- Hendges, L.T.; Costa, T.C.; Temochko, B.; González, S.Y.G.; Mazur, L.P.; Marinho, B.A.; da Silva, A.; Weschenfelder, S.E.; de Souza, A.A.U.; de Souza, S.M.G.U. Adsorption and desorption of water-soluble naphthenic acid in simulated offshore oilfield produced water. Process Saf. Environ. Prot. 2020, 145, 262–272. [Google Scholar] [CrossRef]
- Sabyasachi, M.; Venkatesh, M.; Ajay, K.D.; Dena, W.M.; John, V.H.; Kerry, M.P. Photocatalysis of naphthenic acids in water. J. Water Resour. Prot. 2010, 2010, 644–650. [Google Scholar]
- Bingol, D.; Tekin, N.; Alkan, M. Brilliant Yellow dye adsorption onto sepiolite using a full factorial design. Appl. Clay Sci. 2010, 50, 315–321. [Google Scholar] [CrossRef]
- Fogler, H.S. Essentials of Chemical Reaction Engineering: Essenti Chemica Reactio Engi; Pearson Education: New Delhi, India, 2010. [Google Scholar]
- Brown, B.R. The mechanism of thermal decarboxylation. Q. Rev. Chem. Soc. 1951, 5, 131–146. [Google Scholar] [CrossRef]
- Chumaidi, A.; Dewajani, H.; Sulaiman, M.A.; Angestine, F.; Putri, A.; Pravitasari, S.A. Effect of temperature and Mg-Zn catalyst ratio on decarboxylation reaction to produce green diesel from kapok oil with saponification pretreatment using NaOH. IOP Conf. Ser. Mater. Sci. Eng. 2021, 1073, 012002. [Google Scholar] [CrossRef]
- Rajadurai, S. Pathways for Carboxylic Acid Decomposition on Transition Metal Oxides. Catal. Rev. 1994, 36, 385–403. [Google Scholar] [CrossRef]
- Pham, T.N.; Shi, D.; Resasco, D.E. Reaction kinetics and mechanism of ketonization of aliphatic carboxylic acids with different carbon chain lengths over Ru/TiO2 catalyst. J. Catal. 2014, 314, 149–158. [Google Scholar] [CrossRef]
- Kumar, K.V.; Porkodi, K.; Rocha, F. Langmuir–Hinshelwood kinetics—A theoretical study. Catal. Commun. 2008, 9, 82–84. [Google Scholar] [CrossRef]


| Model Oil | Catalyst | System | Total Acid Conversion (%) | Temperature (°C) | Reference |
|---|---|---|---|---|---|
| Benzoic acid | Zeolite | 80 mL Autoclave | - | 400 | [27] |
| Model naphthenic acids dissolved in dodecane | Alkaline earth metal oxide (CaO, MgO, BaO, SrO) | 3/8- inch stainless steel tube reactor | ~100 | 200–300 | [31] |
| Model naphthenic Acids dissolved in dodecane | ZSM5 zeolite catalyst | 9 mL Sealed glass batch reactor | 65% | 200–300 | [1] |
| 2-naphthoic acid, cyclohexane carboxylic acid, and cyclohexane propionic acid. | Magnesium oxide (MgO) | 2 mL sealed glass tube batch reactors—stainless steel reactor (0.4 cm i.d. and 29 cm in length) | 92.5% | 150–250 | [3] |
| Model naphthenic acids in diesel oil | Acidic solid catalyst (activated alumina (γ-Al203)- quartz sands) | Fixed bed reaction | 97% | 460 | [25] |
| Crude oil and industrial naphthenic acids | Mg–Al hydrotalcite/c-Al2O3 | 200 mL Autoclave | 80% | 330 | [32] |
| Heavy crude oil and naphthenic acids | Co-Mo/γ-Al2O3 catalyst | Fixed bed reactor (1.0 cm in inner diameter and 45 cm in length) | 76.6% | 250 | [6] |
| Dodecane solvent (model chemical having a similar average molecular weight with crude oil) NAs (mixtures of cyclopentyl and cyclohexyl carboxylic acids mainly) | Graphitic carbon nitride | 100 mL Batch reactor | 37.2% | 250 | [9] |
| A mixture of dodecane solvent and benzoic acid (BA) and a mixture of NAs | Hybridized heterogeneous basic graphitic carbon nitride coated on the acidic ferrierite zeolite | 100 mL Batch reactor | 54.4% | 300 | [33] |
| Bitumen derived heavy vacuum gas oil (HVGO) | Alkaline earth metal oxides and ZnO | 300-mL Autoclave | 8.5% | 350 | [24] |
| No | Temperature (°C) | Time (h) | Crude Oil/Zeolite Ratio (g/g) | TAN |
|---|---|---|---|---|
| 1 | 270 | 2 | 22 | 4.27 |
| 2 | 250 | 4 | 25 | 1.24 |
| 3 | 270 | 4 | 20 | 1.35 |
| 4 | 250 | 3 | 25 | 2.42 |
| 5 | 300 | 4 | 22 | 0.17 |
| 6 | 250 | 4 | 22 | 1.24 |
| 7 | 300 | 2 | 25 | 2.18 |
| 8 | 250 | 3 | 20 | 0.16 |
| 9 | 300 | 3 | 20 | - |
| 10 | 250 | 4 | 20 | 0.14 |
| 11 | 270 | 3 | 20 | 2.55 |
| 12 | 270 | 4 | 25 | 0.05 |
| 13 | 270 | 2 | 25 | 1.4 |
| 14 | 300 | 2 | 20 | - |
| 15 | 270 | 3 | 25 | 1.04 |
| 16 | 300 | 4 | 20 | - |
| 17 | 250 | 2 | 22 | 4.1 |
| 18 | 250 | 3 | 22 | 2.23 |
| 19 | 270 | 3 | 22 | 1.20 |
| 20 | 300 | 4 | 25 | 0.35 |
| 21 | 270 | 4 | 22 | 0.39 |
| 22 | 270 | 2 | 20 | 5.01 |
| 23 | 300 | 3 | 25 | 0.85 |
| 24 | 250 | 2 | 25 | 3.36 |
| 25 | 300 | 2 | 22 | 4.10 |
| 26 | 250 | 2 | 20 | 4.97 |
| 27 | 300 | 3 | 22 | 0.90 |
| Temperature (°C) | Time (h) | Oil/Catalyst Ratio (g/g) | Removal % |
|---|---|---|---|
| 250 | 3 | 20 | 97.54 |
| 250 | 4 | 20 | 97.85 |
| 270 | 4 | 22 | 94.00 |
| 270 | 4 | 22 | 99.23 |
| 300 | 4 | 25 | 97.38 |
| 300 | 4 | 25 | 94.62 |
| Source | DF | Adj SS | Adj MS | F-Value | p-Value |
|---|---|---|---|---|---|
| Regression | 6 | 50.4624 | 8.41041 | 31.08 | 0.000 |
| Temperature | 1 | 0.3774 | 0.37738 | 1.39 | 0.254 |
| Time | 1 | 3.8291 | 3.82914 | 14.15 | 0.002 |
| Ratio | 1 | 0.0206 | 0.02059 | 0.08 | 0.786 |
| Temperature * Time | 1 | 0.0041 | 0.00410 | 0.02 | 0.903 |
| Temperature * Ratio | 1 | 0.6309 | 0.63090 | 2.33 | 0.145 |
| Time * Ratio | 1 | 4.6237 | 4.62373 | 17.08 | 0.001 |
| Error | 17 | 4.6008 | 0.27063 | - | - |
| Total | 23 | 55.0632 | - | - | - |
| Type | Equations | Temperature (°C) | Precision | |
|---|---|---|---|---|
| Adsorption | 250 | R2 | 0.7865 | |
| R2adj | 0 | |||
| Rmsd | 2.429 × 10⁻⁵ | |||
| Variance | 1.0 × 1099 | |||
| 270 | R2 | 0.91799 | ||
| R2adj | 0 | |||
| Rmsd | 3.379 × 10⁻⁵ | |||
| Variance | 1.0 × 1099 | |||
| 300 | R2 | 0.9877 | ||
| R2adj | 0 | |||
| Rmsd | 1.078 × 10⁻⁵ | |||
| Variance | 1.0 × 1099 | |||
| Surface Reaction | 250 | R2 | 0.44439 | |
| R2adj | 0 | |||
| Rmsd | 3.92 × 10⁻⁵ | |||
| Variance | 1.0 × 1099 | |||
| 270 | R2 | 0.9136 | ||
| R2adj | 0 | |||
| Rmsd | 3.47× 10⁻⁵ | |||
| Variance | 1.0 × 1099 | |||
| 300 | R2 | 0.9865 | ||
| R2adj | 0 | |||
| Rmsd | 1.13 × 10⁻⁵ | |||
| Variance | 1.0 × 1099 | |||
| Desorption | 250 | R2 | 0.4499 | |
| R2adj | 0 | |||
| Rmsd | 7.21 × 10⁻⁵ | |||
| Variance | 1.0 × 1099 | |||
| 270 | R2 | 0.4399 | ||
| R2adj | 0 | |||
| Rmsd | 8.82 × 10⁻⁵ | |||
| Variance | 1.0 × 1099 | |||
| 300 | R2 | 0.4499 | ||
| R2adj | 0 | |||
| Rmsd | 7.21 × 10⁻⁵ | |||
| Variance | 1.0 × 1099 | |||
| Constant (Units) | Initial Guess | Value |
|---|---|---|
| Experiment 1 | ||
| 0.001 | 0.0069972 | |
| K (mol/L) | 0.1 | 11.0996 |
| KR (1/(mol/L)2) | 10 | 25.10734 |
| KB (1/(mol/L)) | 1 | 8.707089 |
| Experiment 2 | ||
| 0.2 | 0.0095885 | |
| K (mol/L) | 1 | 101.9947 |
| KR (1/(mol/L)2) | 1 | 15.16707 |
| KB (1/(mol/L)) | 15 | 3.155769 |
| Experiment 3 | ||
| 1 | 0.0088041 | |
| K (mol/L) | 1 | 101.9955 |
| KR (1/(mol/L)2) | 1 | 8.407307 |
| KB (1/(mol/L)) | 15 | 6.423856 |
| Variable | Constant | Ea (j/mole) | Statistic | |
|---|---|---|---|---|
| ) | 2.0889 | 1475.29 | R2 | 0.425 |
| R2adj | −0.151 | |||
| Rmsd | 0.068 | |||
| Variance | 0.041 | |||
| Variable | Constant | ∆H (j/mole) | Statistic | |
|---|---|---|---|---|
| K (mol/L) | −28.808 | −10,980 | R2 | 0.7045 |
| R2adj | 0.409 | |||
| Rmsd | 0.281 | |||
| Variance | 0.712 | |||
| KR (1/(mol/L)2) | −9.265 | −6522 | R2 | 0.443 |
| R2adj | −0.113 | |||
| Rmsd | 0.222 | |||
| Variance | 0.442 | |||
| KB (1/(mol/L)) | −0.57 | 1253.258 | R2 | 0.041 |
| R2adj | −0.918 | |||
| Rmsd | 0.240 | |||
| Variance | 0.520 | |||
| Properties | Result | Method |
|---|---|---|
| Density @ 15 °C, kg/m3 | 927.5 | ASTM D4052 |
| Specific Gravity | 0.9283 | ASTM D4052 |
| API° | 20.93 | ASTM D4052 |
| Viscosity @100 °C, mm2/s | 38.07 | ASTM D7024 |
| Pour point, °C | −1 | ASTM D5853 |
| Carbon residue, m% | 4.41 | SH/T 0170-92 |
| Water Content, m% | 0.50 | ASTM D4006 |
| Salt Content As Nacl mg/L | 3.6 | ASTM D6470 |
| Acid number, mg KOH/g | 6.5 | ASTM D664 |
| Sulfur, m% | 0.127 | ASTM D4294 |
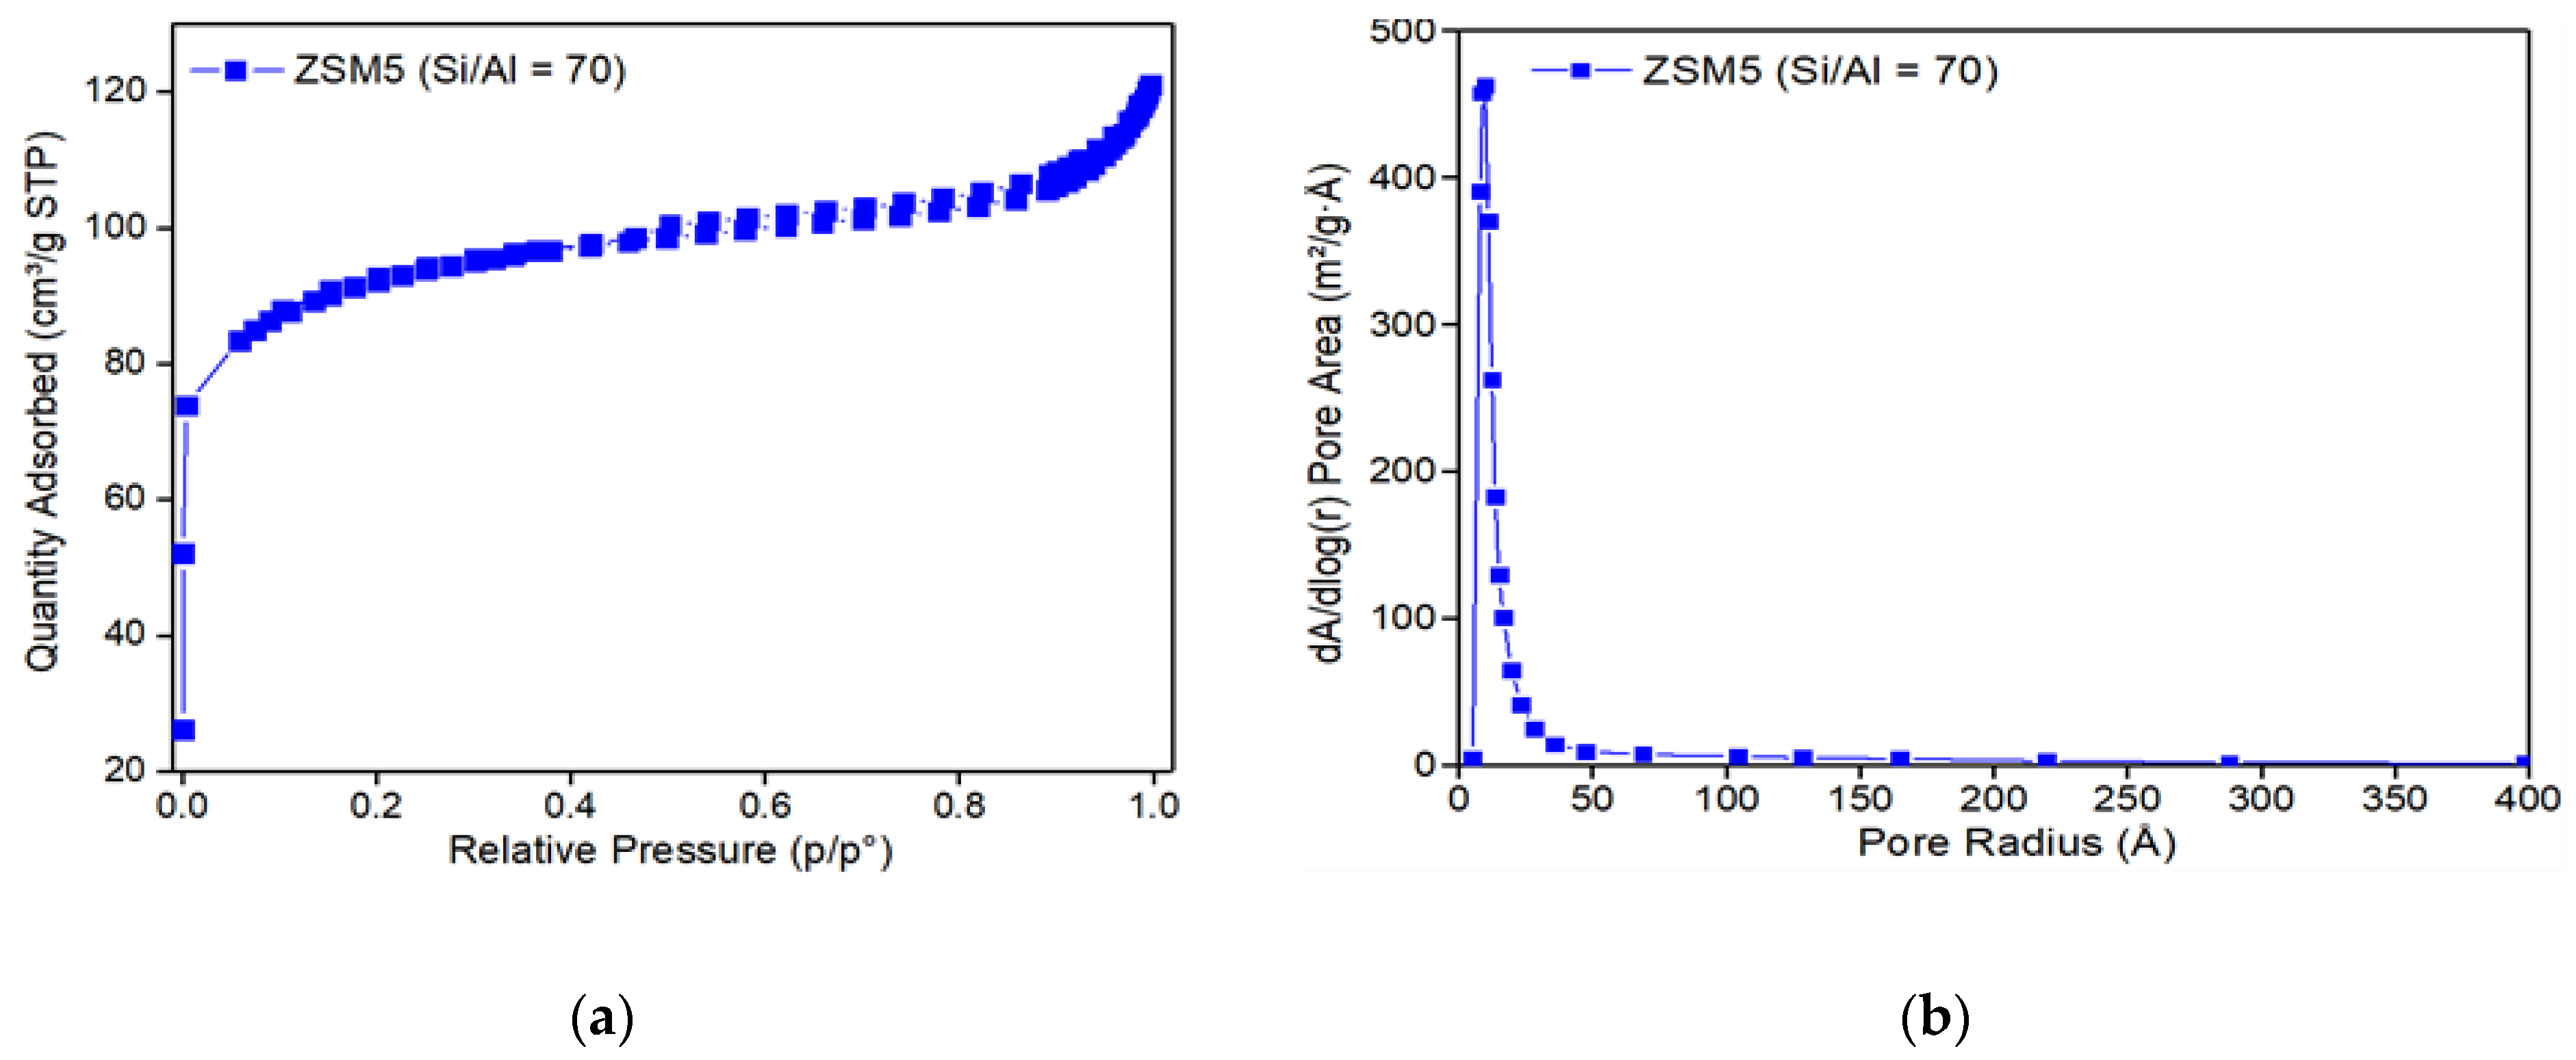
| Sample | Surface Area (m2/g) | Pore Volume (cm3/g) | Pore Size (Å) |
|---|---|---|---|
| HZSM-5 zeolite catalyst | 300 | 0.18 | 25 |
| TAN [mg KOH/g Sample] | Sample Weight [g] | Weighing Accuracy [30] |
|---|---|---|
| 0.05–0.9 | 10 ± 2 | 100 |
| 1–4.9 | 5 ± 0.5 | 20 |
| 5–19 | 1 ± 0.1 | 5 |
| 20–99 | 0.25 ± 0.02 | 1 |
| 100–250 | 0.1 ± 0.01 | 0.5 |
| Factors | Low Level (−) | Medium Level (0) | High Level (+) |
|---|---|---|---|
| Temperature (T in °C) | 250 | 270 | 300 |
| Time (t in h) | 2 | 3 | 4 |
| Crude Oil/Zeolite ratio (R in g/g) | 25 | 22 | 20 |
| Temperature (°C) | Time (min) | TAN (mg KOH/g) | CA (mol/L) | dCA/dt (mol/L·min) |
|---|---|---|---|---|
| 250 | 0 | 6.5 | 0.10655 | 0.00039 |
| 120 | 3.36 | 0.05508 | 0.00019 | |
| 180 | 2.42 | 0.03967 | 0.00014 | |
| 240 | 1.24 | 0.02032 | 0.00012 | |
| 270 | 0 | 6.5 | 0.10655 | 0.00068 |
| 120 | 1.4 | 0.02295 | 0.00025 | |
| 180 | 1.04 | 0.01705 | 0.00009 | |
| 240 | 0.05 | 0.00082 | 0.00012 | |
| 300 | 0 | 6.5 | 0.00053 | 0.10655 |
| 120 | 2.18 | 0.00026 | 0.03574 | |
| 180 | 0.85 | 0.00013 | 0.01393 | |
| 240 | 0.35 | 0.0000074 | 0.00574 |
| Rate Limiting Step | Rate Equation |
|---|---|
| Adsorption | |
| Surface reaction | |
| Desorption |
Publisher’s Note: MDPI stays neutral with regard to jurisdictional claims in published maps and institutional affiliations. |
© 2022 by the authors. Licensee MDPI, Basel, Switzerland. This article is an open access article distributed under the terms and conditions of the Creative Commons Attribution (CC BY) license (https://creativecommons.org/licenses/by/4.0/).
Share and Cite
Hassan, N.O.; Challiwala, M.; Beshir, D.M.; Elbashir, N.O. Kinetics of Catalytic Decarboxylation of Naphthenic Acids over HZSM-5 Zeolite Catalyst. Catalysts 2022, 12, 495. https://doi.org/10.3390/catal12050495
Hassan NO, Challiwala M, Beshir DM, Elbashir NO. Kinetics of Catalytic Decarboxylation of Naphthenic Acids over HZSM-5 Zeolite Catalyst. Catalysts. 2022; 12(5):495. https://doi.org/10.3390/catal12050495
Chicago/Turabian StyleHassan, Nihad Omer, Mohamed Challiwala, Dhallia Mamoun Beshir, and Nimir O. Elbashir. 2022. "Kinetics of Catalytic Decarboxylation of Naphthenic Acids over HZSM-5 Zeolite Catalyst" Catalysts 12, no. 5: 495. https://doi.org/10.3390/catal12050495
APA StyleHassan, N. O., Challiwala, M., Beshir, D. M., & Elbashir, N. O. (2022). Kinetics of Catalytic Decarboxylation of Naphthenic Acids over HZSM-5 Zeolite Catalyst. Catalysts, 12(5), 495. https://doi.org/10.3390/catal12050495