
Studies of Clinoptilolite-Rich Zeolitic Tuffs from Different Regions and Their Activity in Photodegradation of Methylene Blue

 ,
,  ,
, 
 and
and 
Abstract
:
1. Introduction
2. Results and Discussion
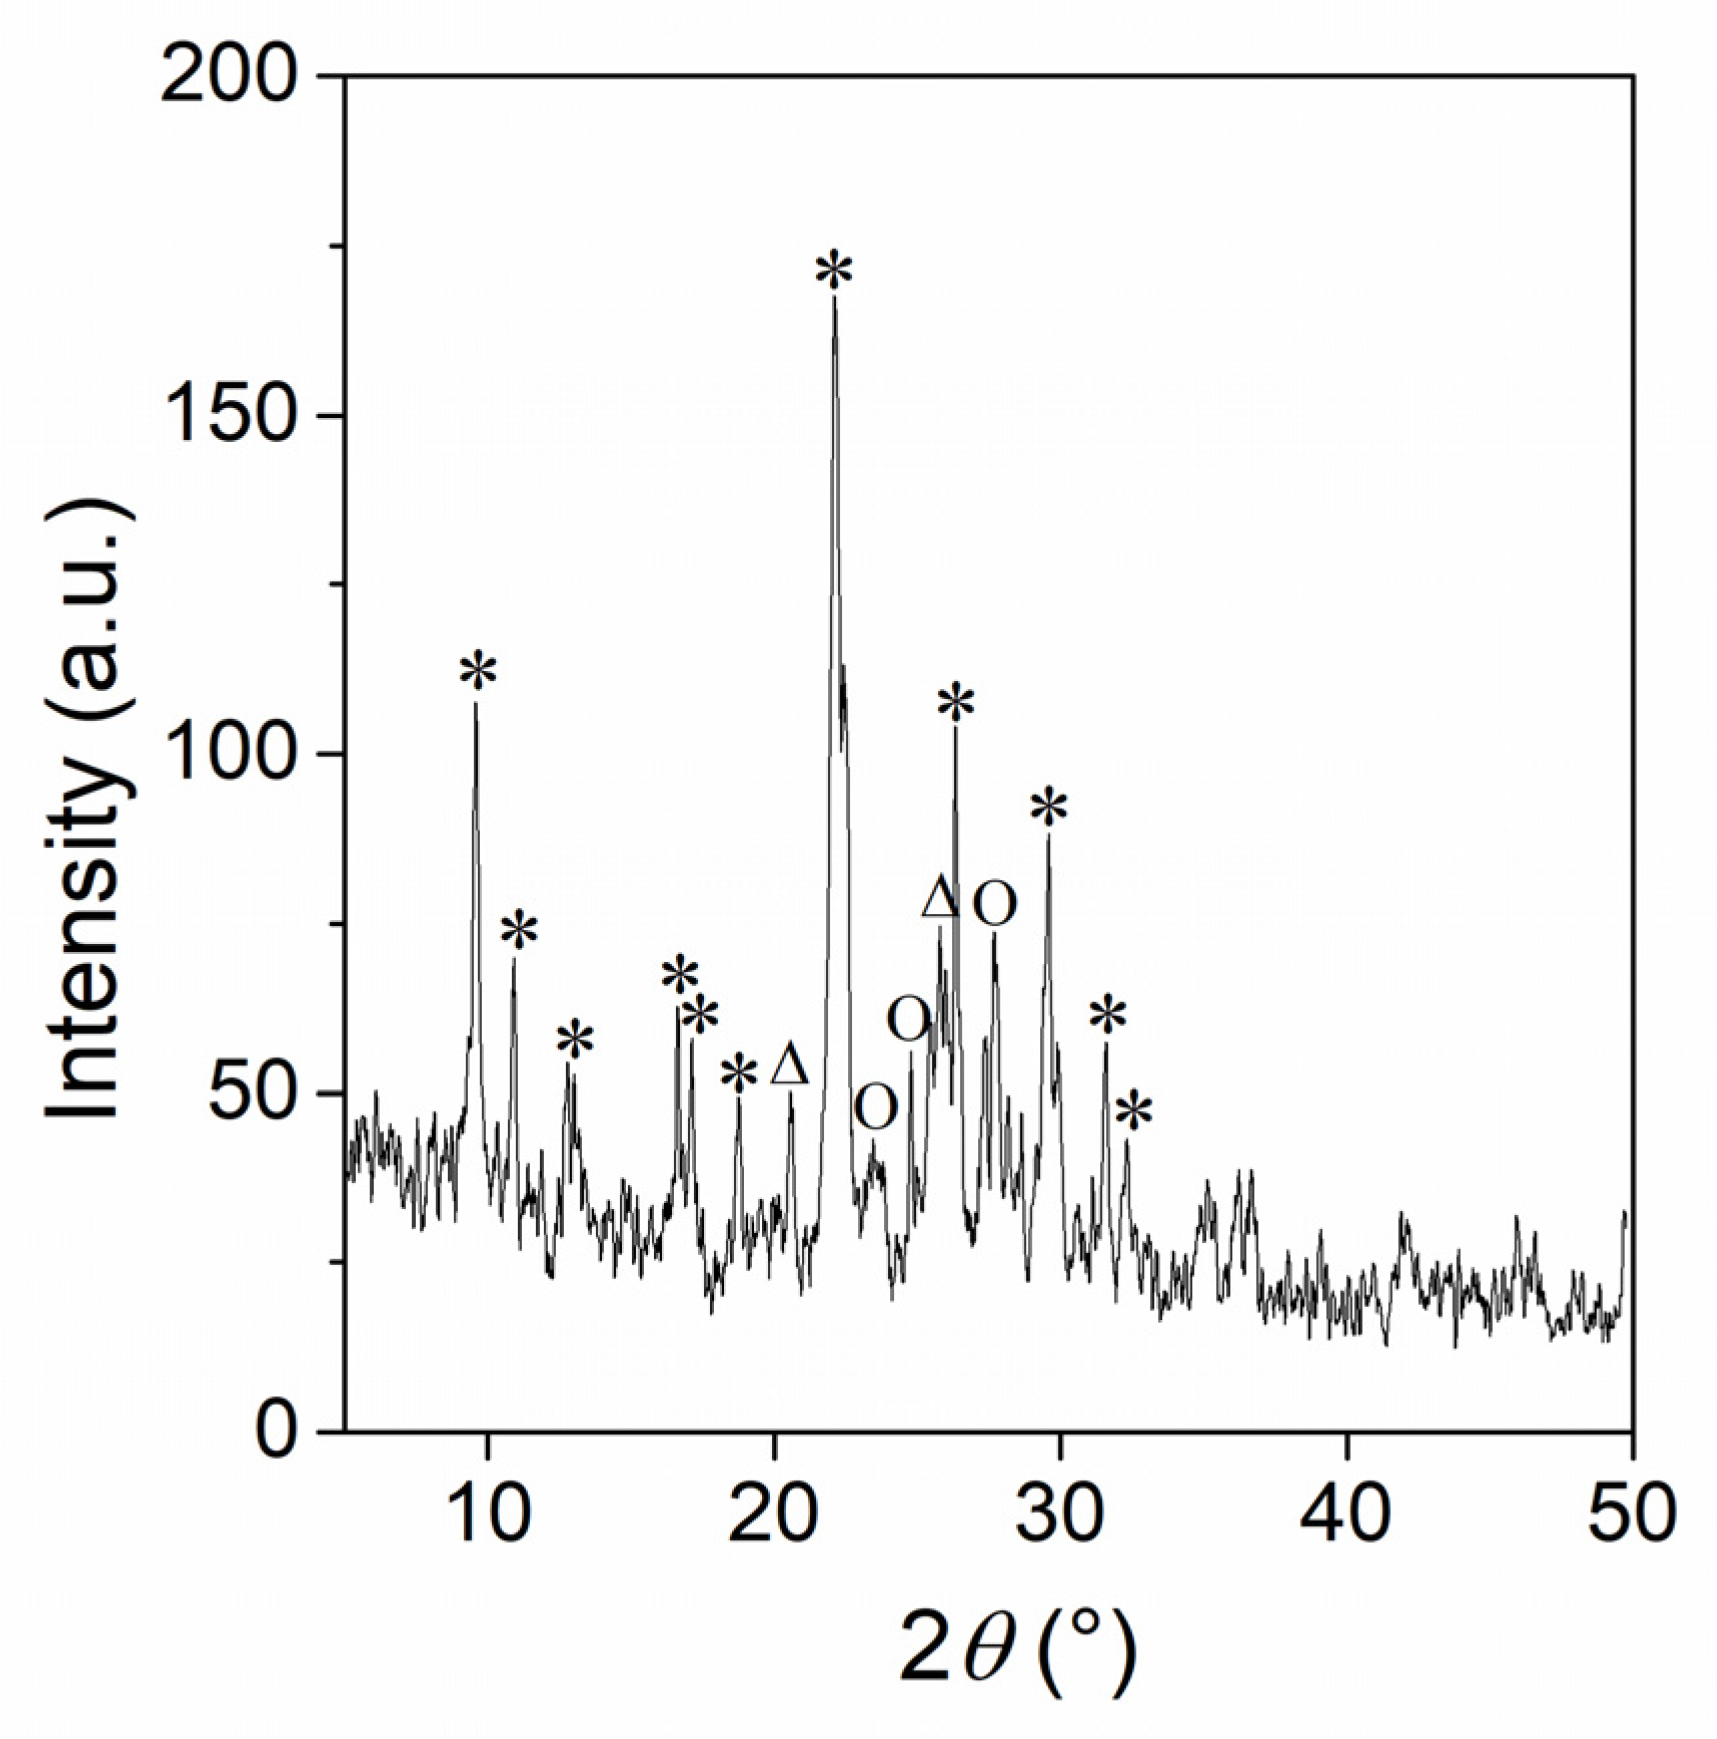
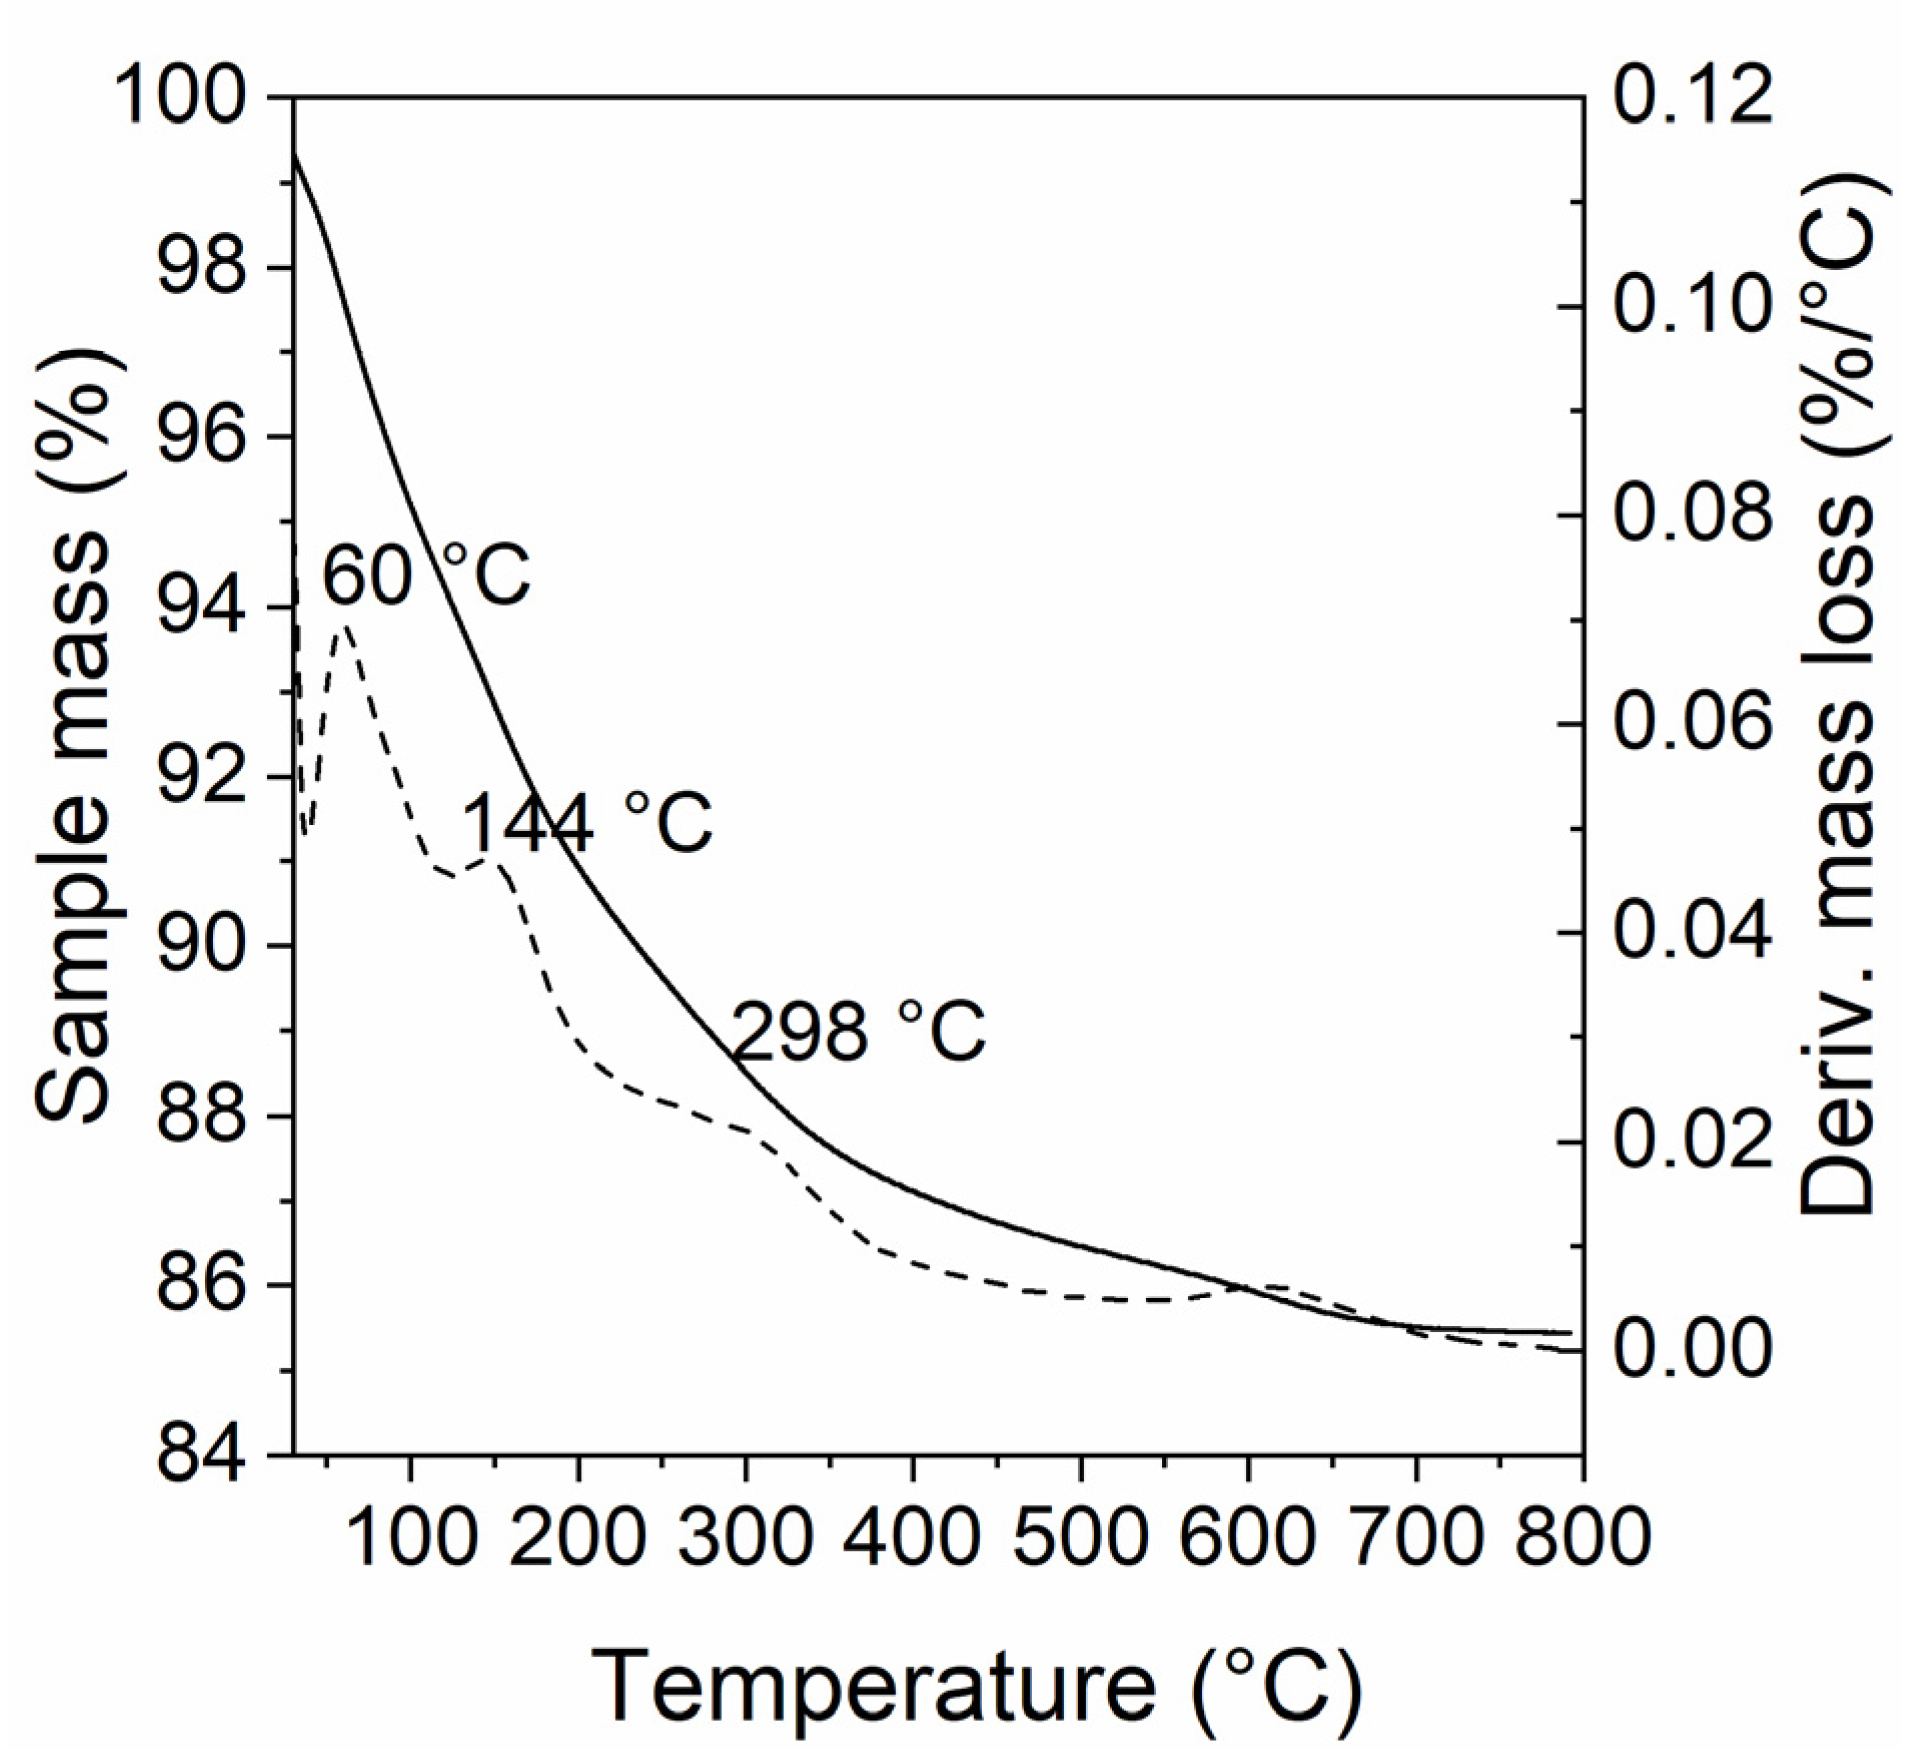
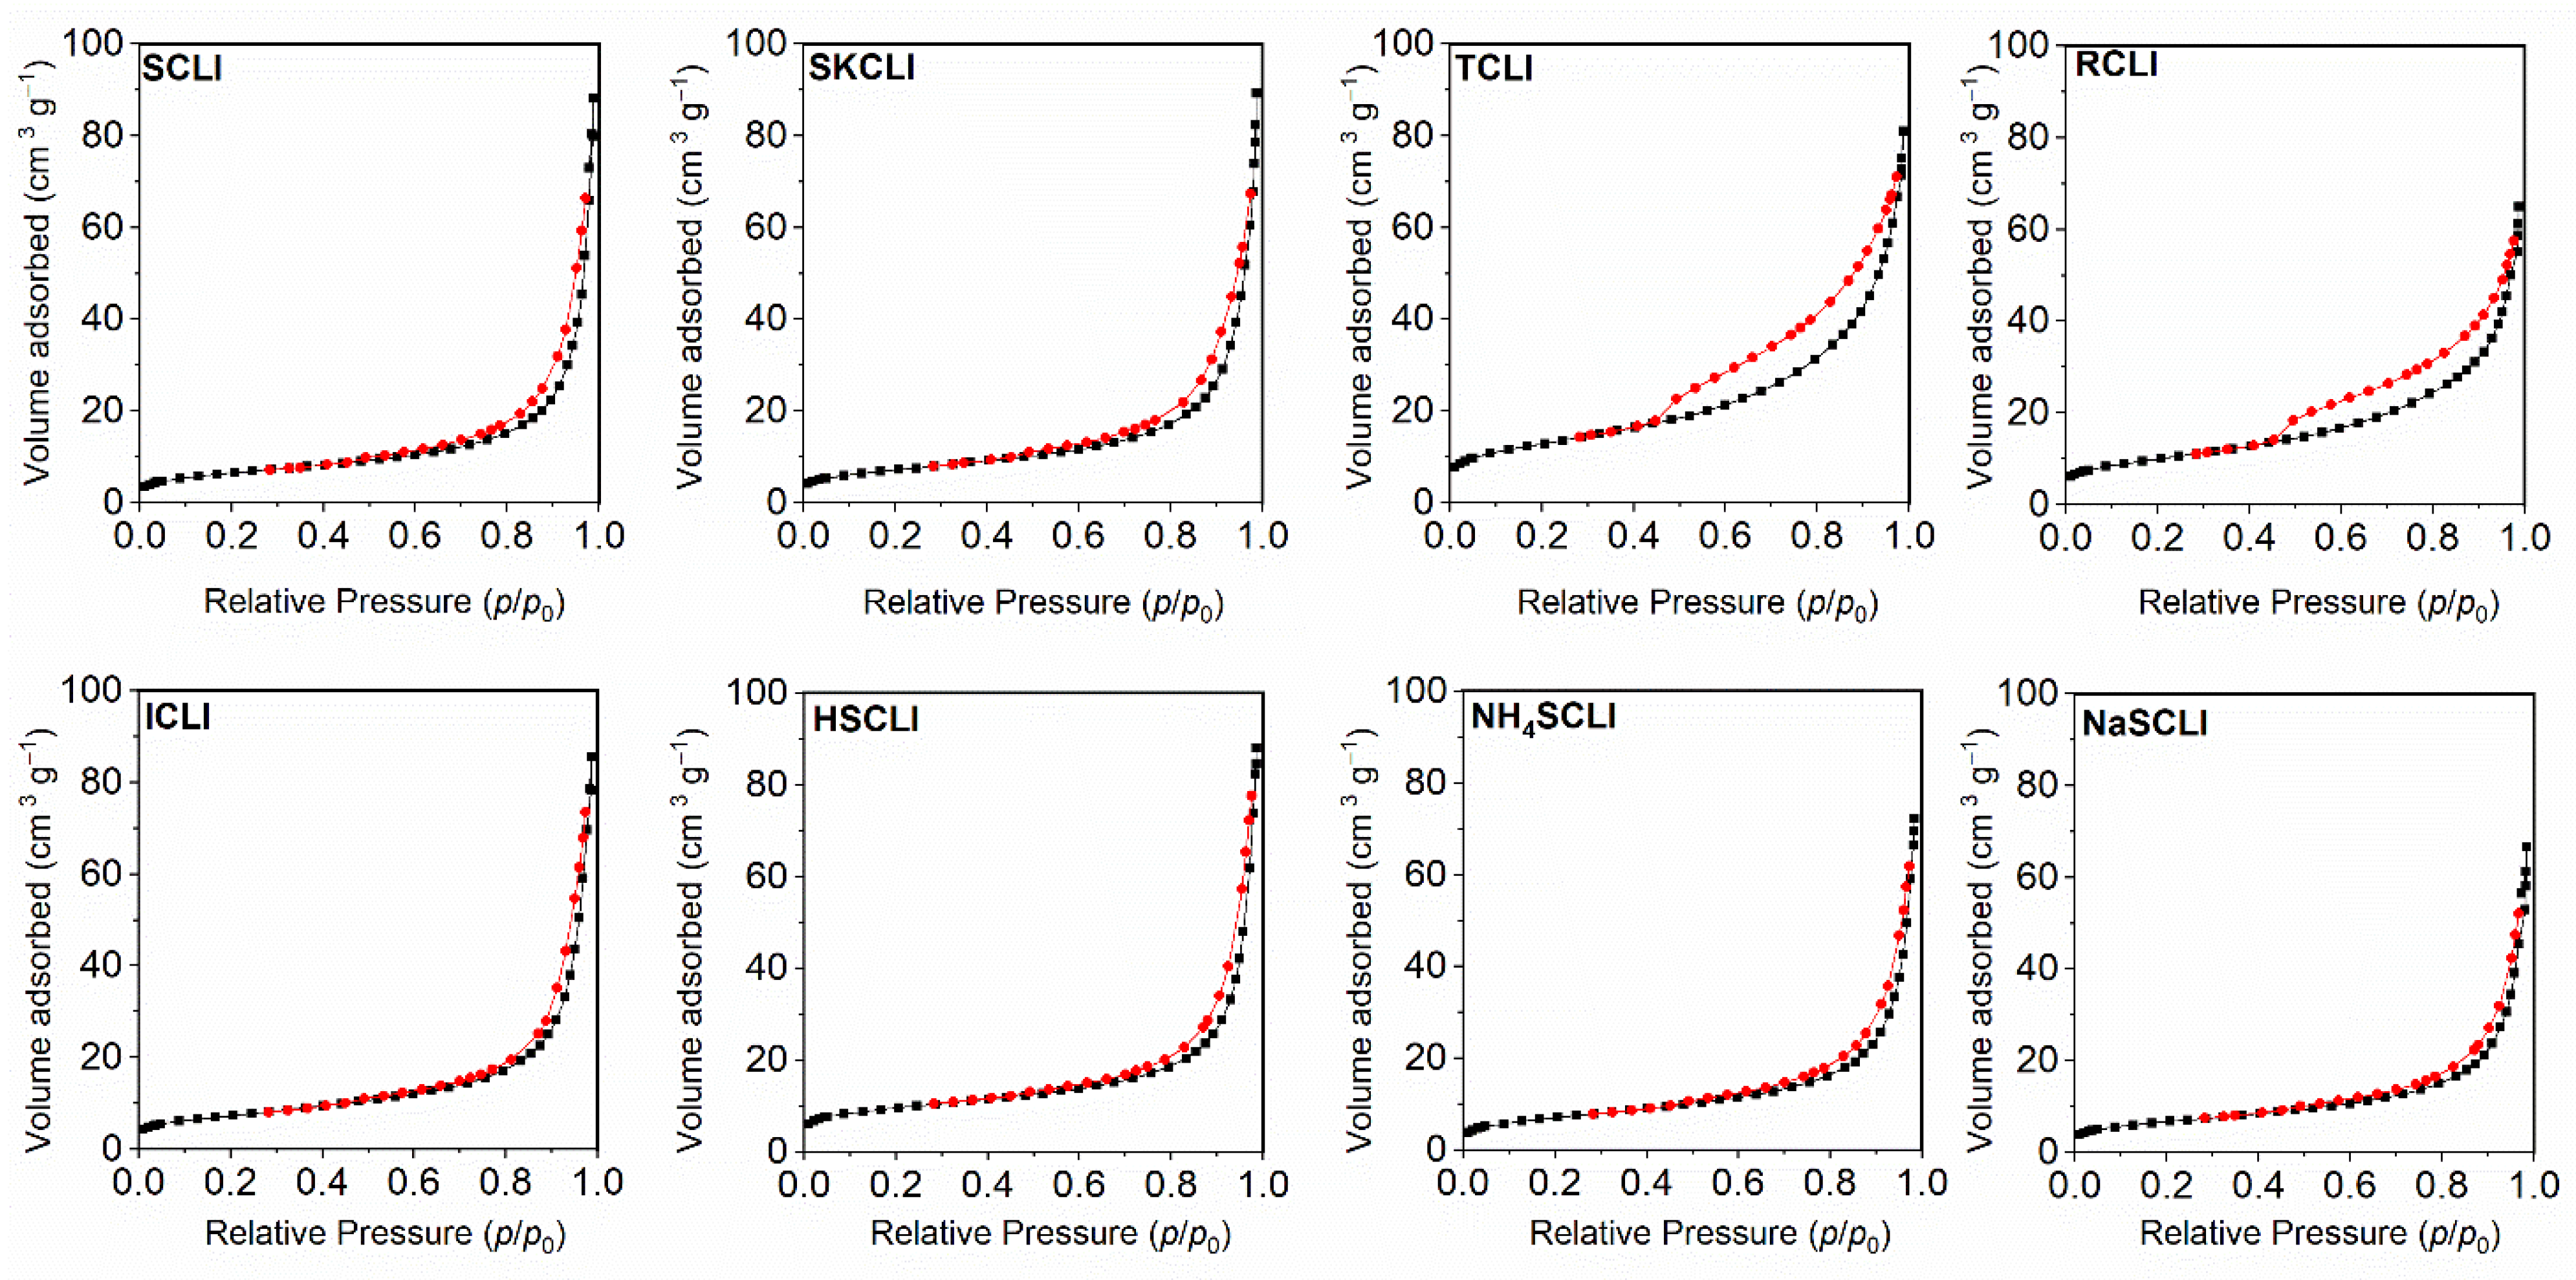
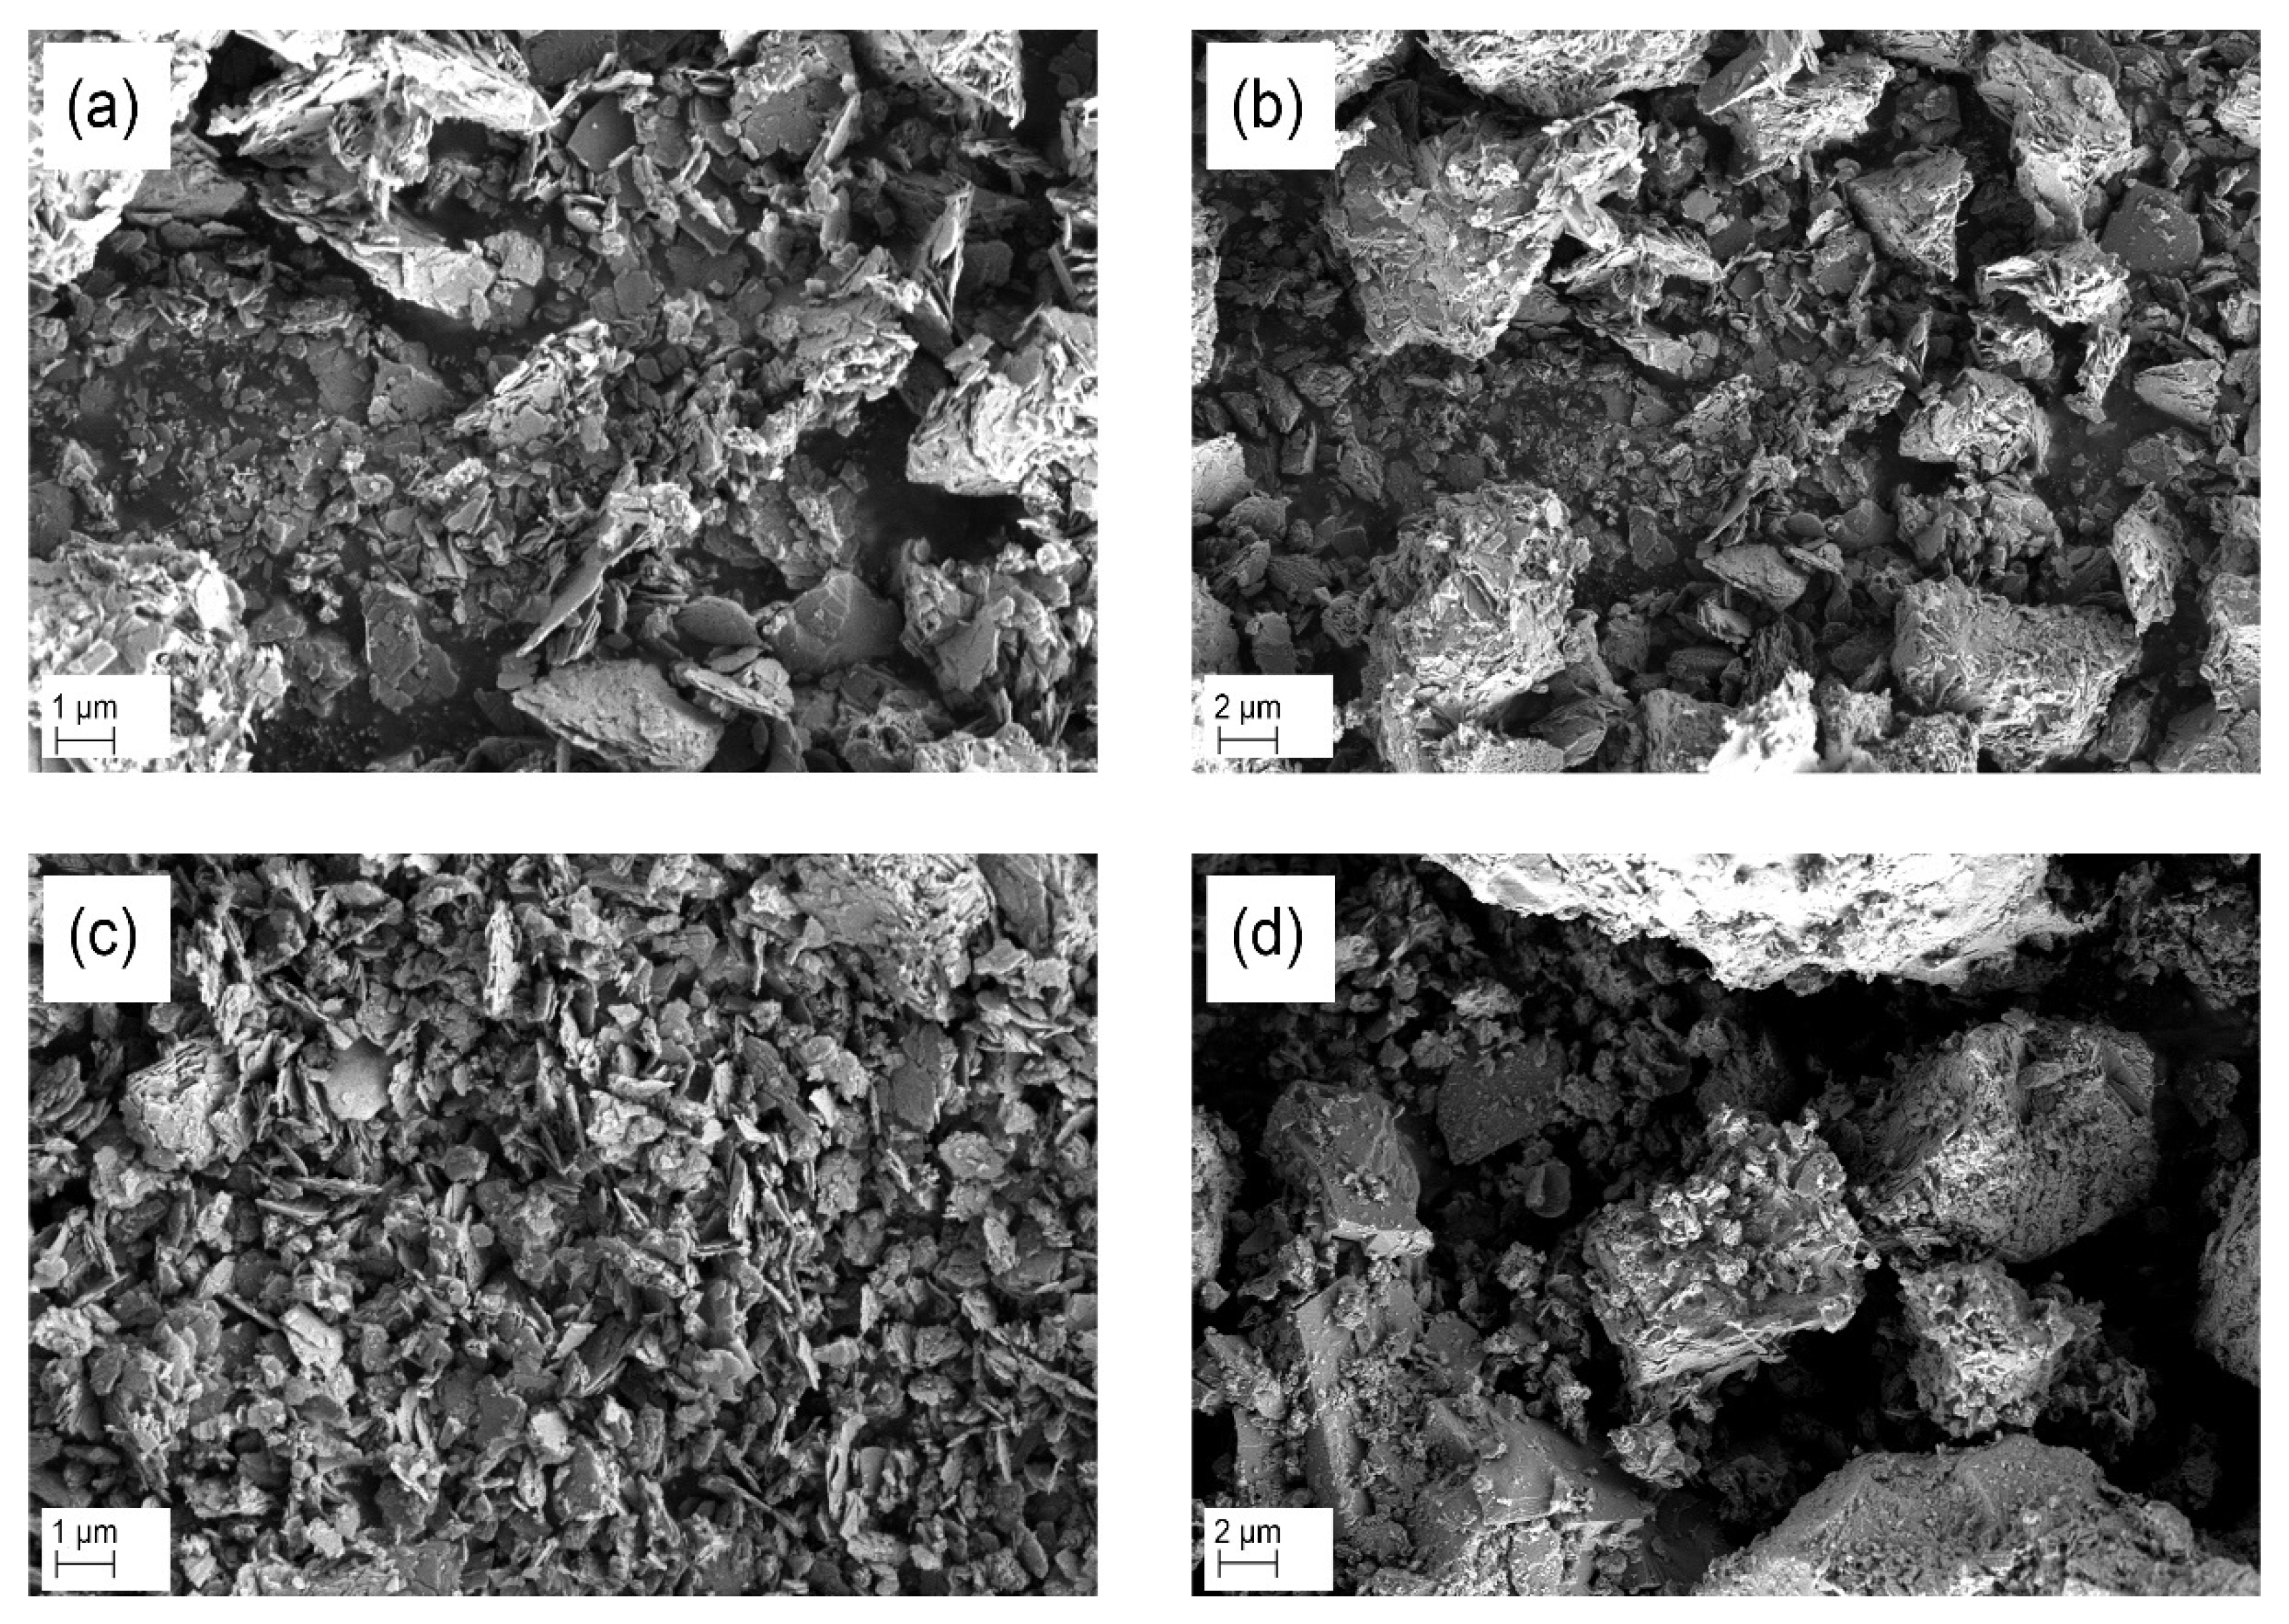
2.1. Characterization
2.2. Photocatalytic Tests
2.2.1. Kinetic Study of the MB Photocatalytic Process
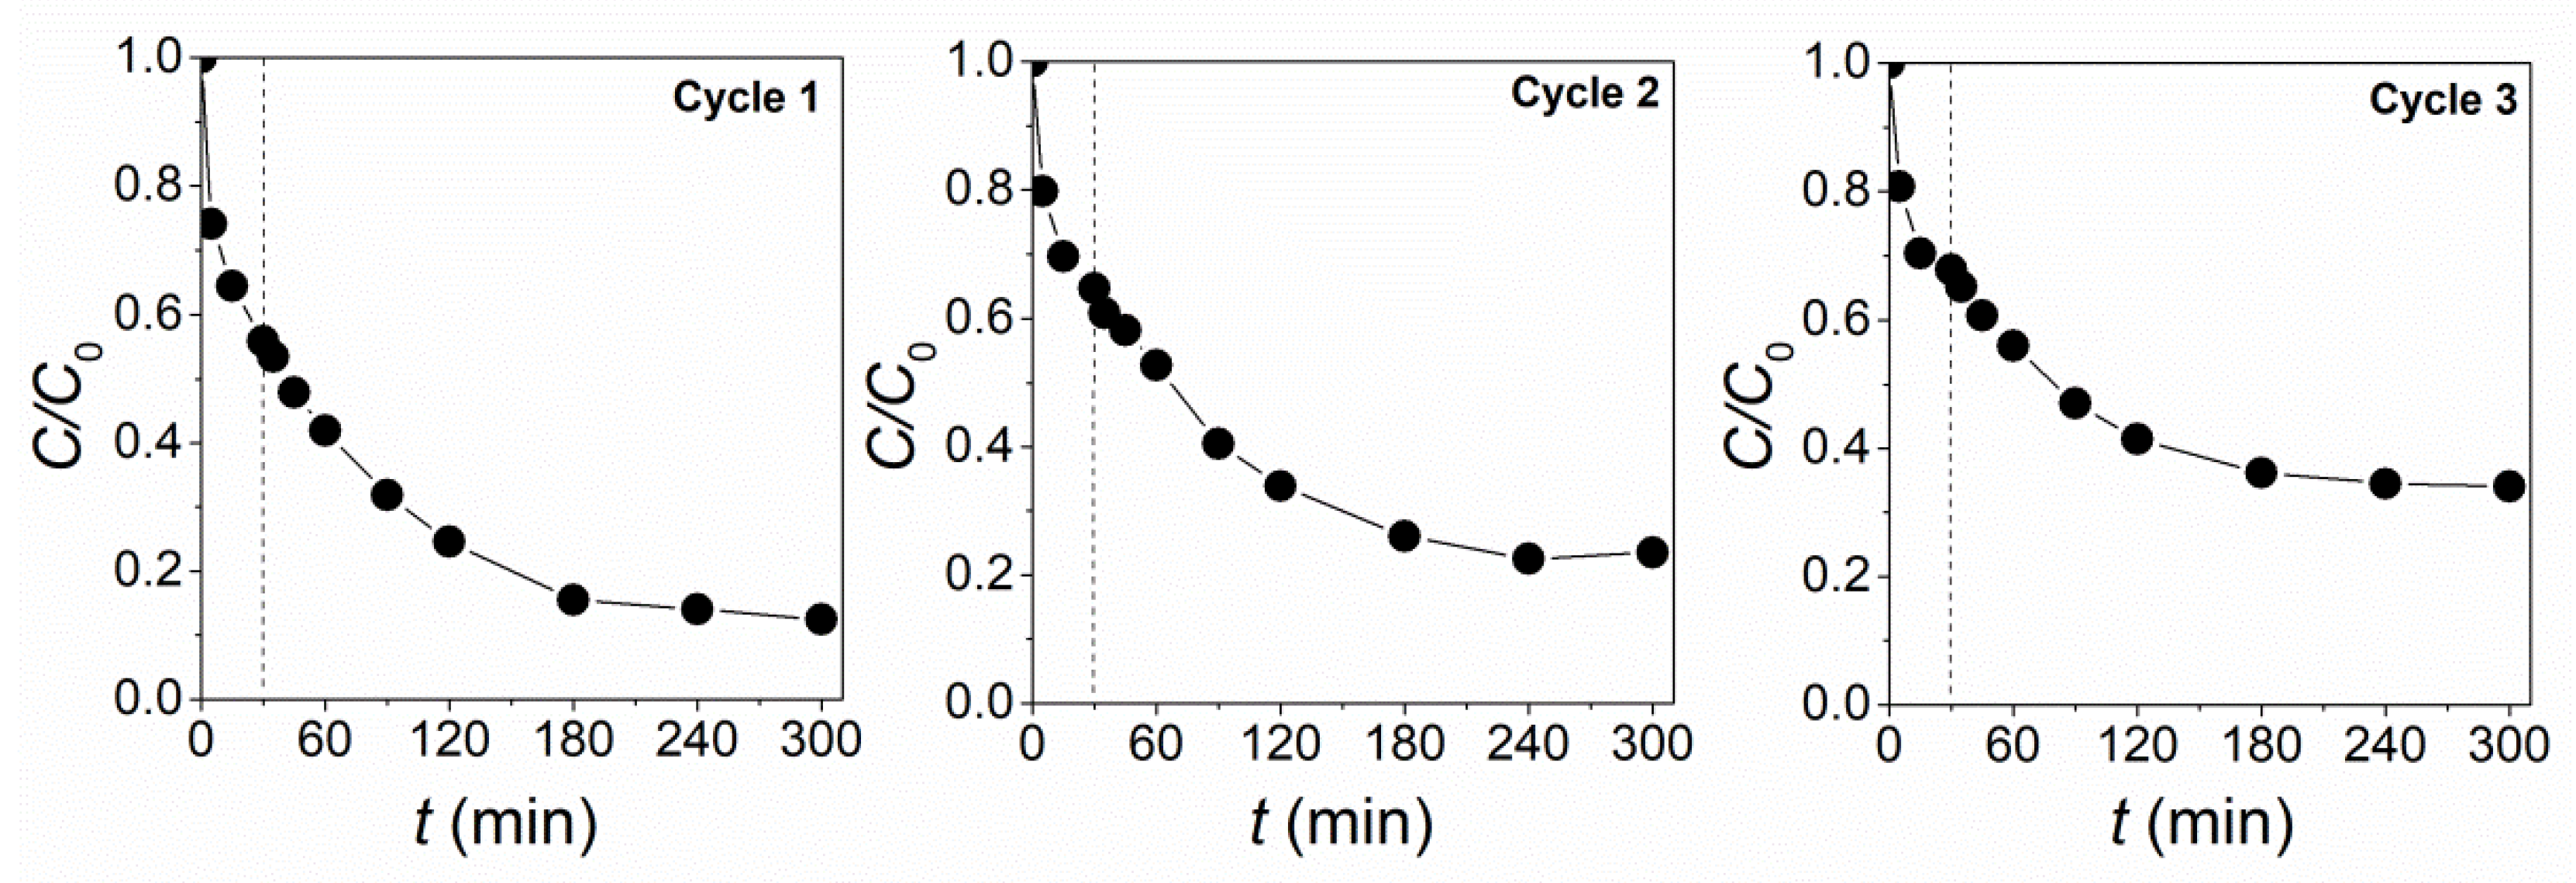
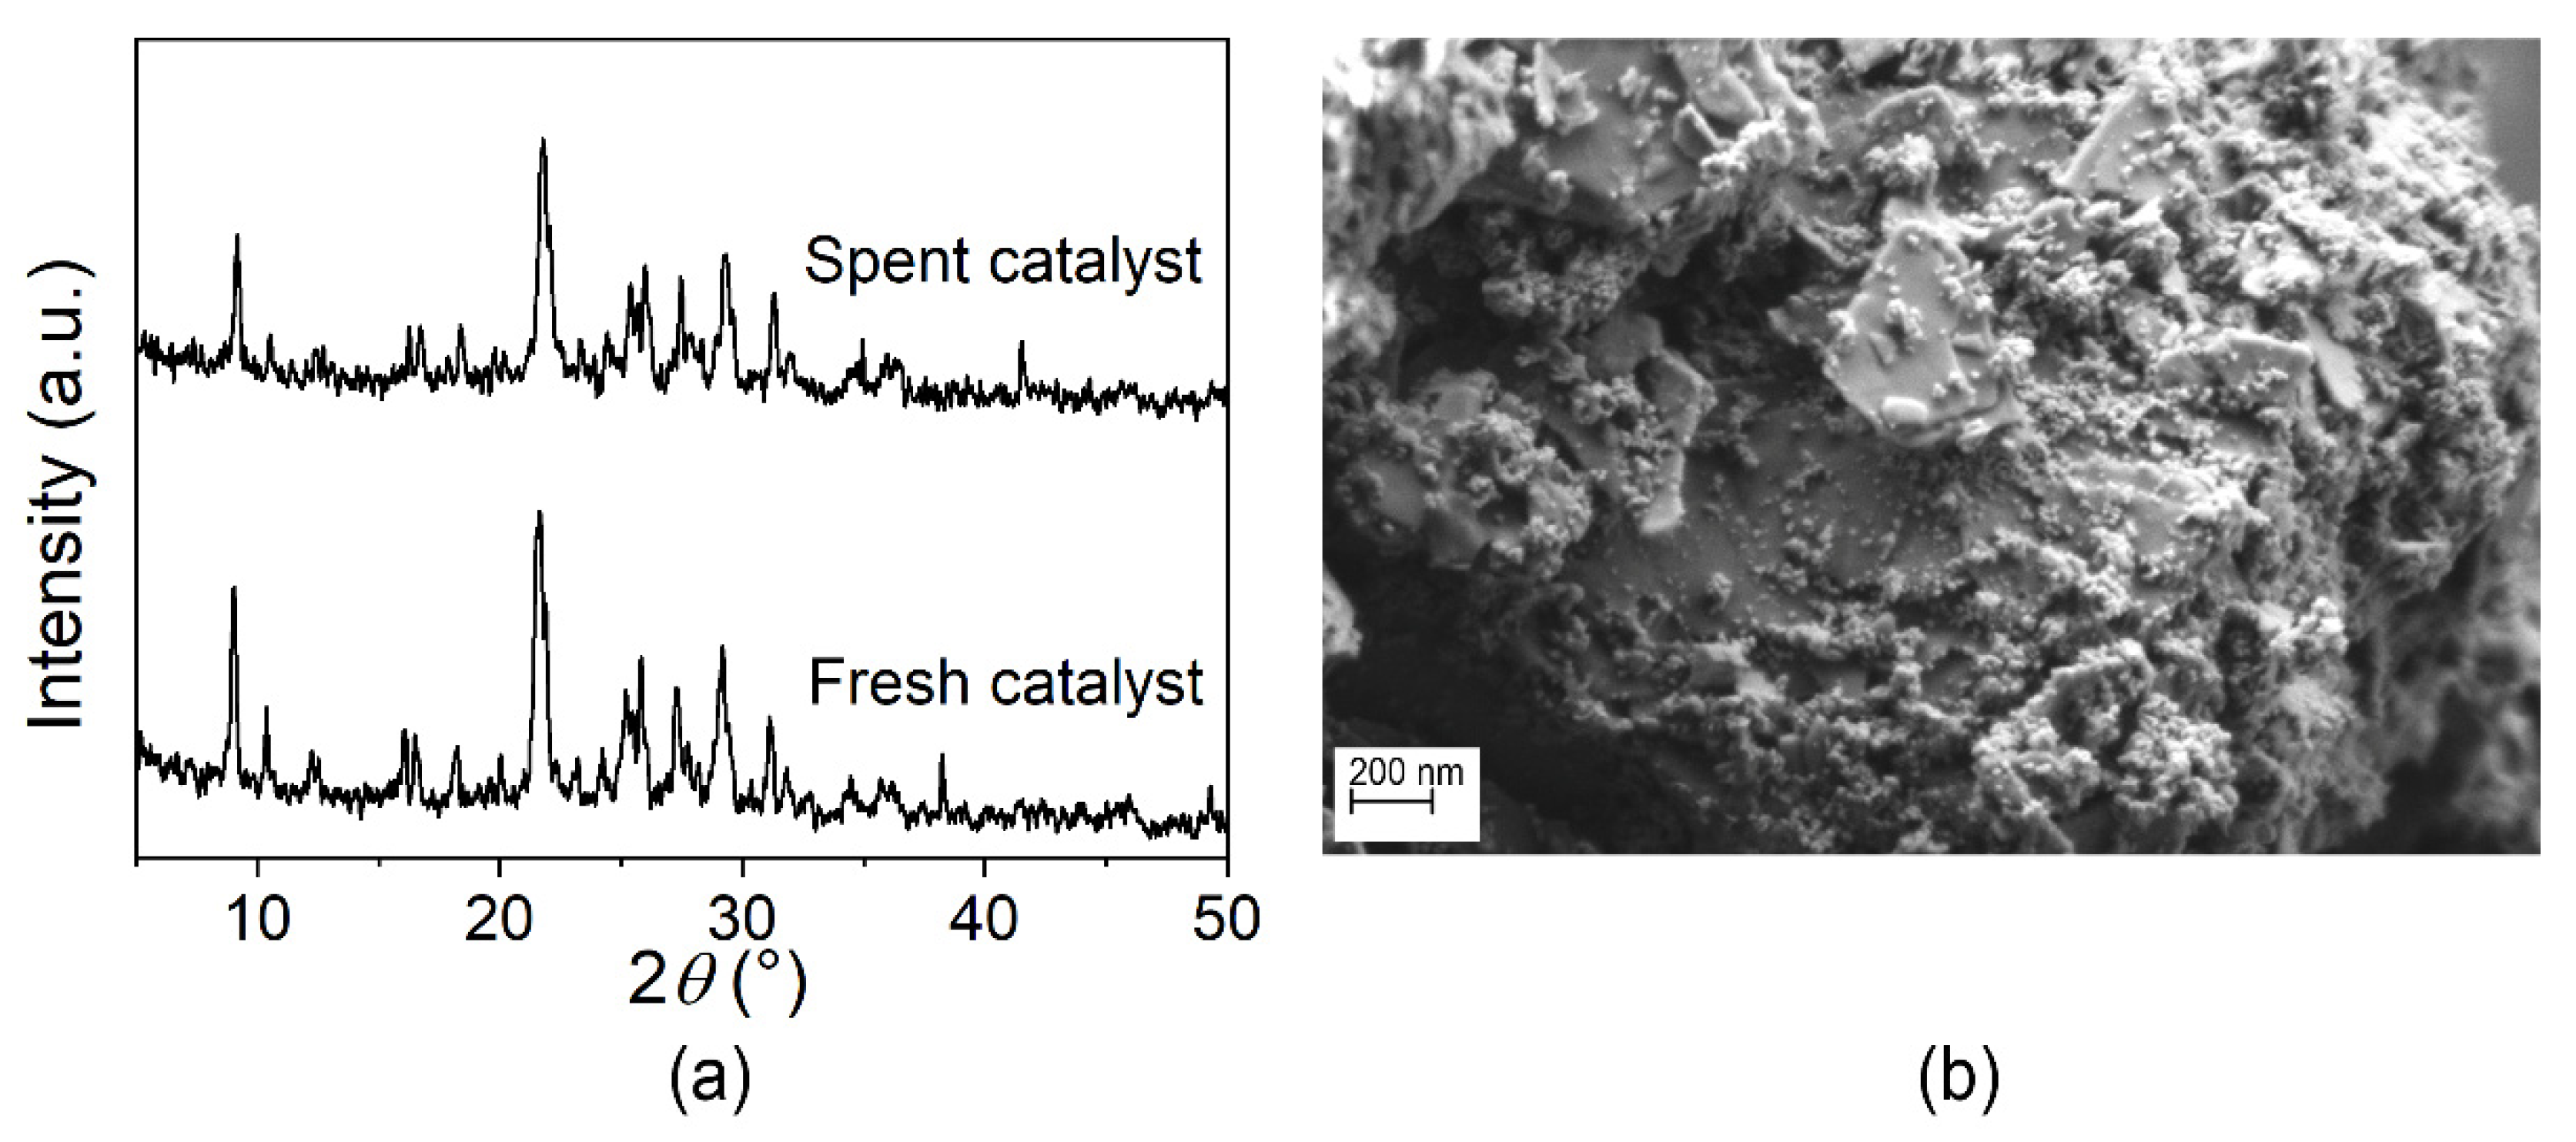
2.2.2. Recyclability of the Zeolite-Based Photocatalyst
3. Materials and Methods
3.1. Materials
3.2. Characterization
3.3. Photocatalytic Tests
Recyclability of the Photocatalyst
4. Conclusions
Author Contributions
Funding
Data Availability Statement
Conflicts of Interest
References
- Li, W.; Mu, B.; Yang, Y. Feasibility of industrial-scale treatment of dye wastewater via bioadsorption technology. Bioresour. Technol. 2019, 277, 157–170. [Google Scholar] [CrossRef] [PubMed]
- Benkhaya, S.; M’rabet, S.; El Harfi, A. A review on classifications, recent synthesis and applications of textile dyes. Inorg. Chem. Commun. 2020, 115, 107891. [Google Scholar] [CrossRef]
- Tkaczyk, A.; Mitrowska, K.; Posyniak, A. Synthetic organic dyes as contaminants of the aquatic environment and their implications for ecosystems: A review. Sci. Total Environ. 2020, 717, 137222. [Google Scholar] [CrossRef] [PubMed]
- Rauf, M.A.; Ashraf, S.S. Fundamental principles and application of heterogeneous photocatalytic degradation of dyes in solution. Chem. Eng. J. 2009, 151, 10–18. [Google Scholar] [CrossRef]
- Neelgund, G.M.; Oki, A. ZnO conjugated graphene: An efficient sunlight driven photocatalyst for degradation of organic dyes. Mater. Res. Bull. 2020, 129, 110911. [Google Scholar] [CrossRef]
- Motahari, F.; Mozdianfard, M.R.; Soofivand, F.; Salavati-Niasari, M. NiO nanostructures: Synthesis, characterization and photocatalyst application in dye wastewater treatment. RSC Adv. 2014, 4, 27654–27660. [Google Scholar] [CrossRef]
- Dariani, R.S.; Esmaeili, A.; Morteyaali, A.; Dehghanpour, S. Photocatalytic reaction and degradation of methylene blue on TiO2 nano-sized particles. Optik 2016, 74, 7143–7154. [Google Scholar] [CrossRef]
- Kim, S.P.; Choi, M.Y.; Choi, H.C. Photocatalytic activity of SnO2 nanoparticles in methylene blue degradation. Mater. Res. Bull. 2016, 74, 85–89. [Google Scholar] [CrossRef]
- Imran, M.; Abutaleb, A.; Ali, A.A.; Ahamad, T.; Ansari, A.R.; Shariq, M.; Lolla, D.; Khan, A. UV light enabled photocatalytic activity of α-Fe2O3 nanoparticles synthesized via phase transformation. Mater. Lett. 2020, 258, 136748. [Google Scholar] [CrossRef]
- Maučec, D.; Šuligoj, A.; Ristić, A.; Dražić, G.; Pintar, A.; Novak Tušar, N. Titania versus zinc oxide nanoparticles on mesoporous silica supports as photocatalysts for removal of dyes from wastewater at neutral pH. Catal. Today 2018, 310, 32–41. [Google Scholar] [CrossRef]
- Hass Caetano Lacerda, E.; Casanova Monteiro, F.; Regina Kloss, J.; Fujiwara, S.T. Bentonite clay modified with Nb2O5: An efficient and reused photocatalyst for the degradation of reactive textile dye. J. Photoch. Photobiol. A 2020, 388, 112084. [Google Scholar] [CrossRef]
- Hu, G.; Yang, J.; Duan, X.; Farnood, R.; Yang, C.; Yang, J.; Liu, W.; Liu, Q. Recent developments and challenges in zeolite-based composite photocatalysts for environmental applications. Chem. Eng. J. 2021, 417, 129209. [Google Scholar] [CrossRef]
- Ramírez-Aparicio, J.; Samaniego-Benítez, J.E.; Murillo-Tovar, M.A.; Benítez-Benítez, J.L.; Munoz-Sandoval, E.; García-Betancourt, M.L. Removal and surface photocatalytic degradation of methylene blue on carbon nanostructures. Diam. Relat. Mater. 2021, 119, 108544. [Google Scholar] [CrossRef]
- Derikvandi, H.; Nezamzadeh-Ejhieh, A. A comprehensive study on electrochemical and photocatalytic activity of SnO2-ZnO/clinoptilolite nanoparticles. J. Mol. Catal. A Chem. 2017, 426, 158–169. [Google Scholar] [CrossRef]
- Tedla, H.; Díaz, I.; Kebede, T.; Taddesse, A.M. Synthesis, characterization and photocatalytic activity of zeolite supported ZnO/Fe2O3/MnO2 nanocomposites. J. Environ. Chem. Eng. 2015, 3, 1586–1591. [Google Scholar] [CrossRef]
- Badvi, K.; Javanbakht, V. Enhanced photocatalytic degradation of dye contaminants with TiO2 immobilized on ZSM-5 zeolite modified with nickel nanoparticles. J. Clean. Prod. 2021, 280, 124518. [Google Scholar] [CrossRef]
- Ikhlaq, A.; Fatima, R.; Qazi, U.Y.; Javaid, R.; Akram, A.; Ibn Shamsah, S.; Qi, F. Combined Iron-Loaded Zeolites and Ozone-Based Process for the Purification of Drinking Water in a Novel Hybrid Reactor: Removal of Faecal Coliforms and Arsenic. Catalysts 2021, 11, 373. [Google Scholar] [CrossRef]
- Ullah, R.; Liu, C.; Panezai, H.; Gul, A.; Sun, J.; Wu, X. Controlled crystal phase and particle size of loaded-TiO2 using clinoptilolite as support via hydrothermal method for degradation of crystal violet dye in aqueous solution. Arab. J. Chem. 2020, 13, 4092–4101. [Google Scholar] [CrossRef]
- Godelitsas, A.; Armbruster, T. HEU-type zeolites modified by transition elements and lead. Micropor. Mesopor. Mat. 2003, 61, 3–24. [Google Scholar] [CrossRef]
- Eroglu, N.; Emekci, M.; Athanassiou, C.G. Applications of natural zeolites on agriculture and food production. J. Sci. Food Agric. 2017, 97, 3487–3499. [Google Scholar] [CrossRef]
- Behin, J.; Ghadamnan, E.; Kazemian, H. Recent advances in the science and technology of natural zeolites in Iran. Clay Miner. 2019, 54, 131–144. [Google Scholar] [CrossRef]
- Serati-Nouri, H.; Jafari, A.; Roshangar, L.; Dadashpour, M.; Pilehvar-Soltanahmadi, Y.; Zarghami, N. Biomedical applications of zeolite-based materials: A review. Mater. Sci. Eng. C 2020, 116, 111225. [Google Scholar] [CrossRef] [PubMed]
- Dzinum, H.; Othman, M.H.; Ismail, A.F. Photocatalytic performance of TiO2/Clinoptilolite: Comparison study in suspension and hybrid photocatalytic membrane reactor. Chemosphere 2019, 228, 241–2498. [Google Scholar] [CrossRef] [PubMed]
- Šuligoj, A.; Pavlović, J.; Arčon, I.; Rajić, N.; Novak Tušar, N. SnO2-containing clinoptilolite as a composite photocatalyst for dyes removal from wastewater under solar light. Catalysts 2020, 10, 253. [Google Scholar] [CrossRef] [Green Version]
- Abdollahi, B.; Shakeri, A.; Aber, S.; Bonab, M.S. Simultaneous photodegradation of acid orange 7 and removal of Pb2+ from polluted water using reusable clinoptilolite–TiO2 nanocomposite. Res. Chem. Intermediat. 2018, 44, 1505–1521. [Google Scholar] [CrossRef]
- Bahrami, M.; Nezamzadeh-Ejhieh, A. Effect of the supported ZnO on clinoptilolite nano-particles in the photodecolorization of semi-real sample bromothymol blue aqueous solution. Mater. Sci. Semicon. Proc. 2015, 30, 275–284. [Google Scholar] [CrossRef]
- Nezamzadeh-Ejhieh, A.; Zabihi-Mobarakeh, H. Heterogeneous photodecolorization of mixture of methylene blue and bromophenol blue using CuO-nano-clinoptilolite. J. Ind. Eng. Chem. 2014, 20, 1421–1431. [Google Scholar] [CrossRef]
- Sydorchukv, V.; Vasylechko, V.; Khyzhun, O.; Gryshchouk, G.; Khalameida, S.; Vasylechko, L. Effect of high-energy milling on the structure, some physicochemical and photocatalytic properties of clinoptilolite. Appl. Catal. A Gen. 2021, 610, 117930. [Google Scholar] [CrossRef]
- Dong, X.; Lin, Y.; Ren, G.; Ma, Y.; Zhao, L. Catalytic degradation of methylene blue by Fenton-like oxidation of Ce doped MOF. Colloid. Surf. A 2021, 608, 125578. [Google Scholar] [CrossRef]
- Bingül, Z. Determination of affecting parameters on removal of methylene blue dyestuff from aqueous solutions using natural clay: Isotherm, kinetic, and thermodynamic studies. J. Mol. Struct. 2022, 1250, 131729. [Google Scholar] [CrossRef]
- Khnifira, M.; El Hamidi, S.; Sadiq, M.; Şimşek, S.; Kaya, S.; Barka, N.; Abdennouri, M. Adsorption mechanisms investigation of methylene blue on the (001) zeolite 4A surface in aqueous medium by computational approach and molecular dynamics. Appl. Surf. Sci. 2022, 572, 151381. [Google Scholar] [CrossRef]
- Wainwright, M.; Crossley, K.B. Methylene Blue—A Therapeutic Dye for All Seasons? J. Chemother. 2002, 14, 431–443. [Google Scholar] [CrossRef] [PubMed]
- Khan, I.; Saeed, K.; Zekker, I.; Zhang, B.; Hendi, A.H.; Ahmad, A.; Ahmad, S.; Zada, N.; Ahmad, H.; Shah, L.A.; et al. Review on Methylene Blue: Its Properties, Uses, Toxicity and Photodegradation. Water 2022, 14, 242. [Google Scholar] [CrossRef]
- Treacy, M.M.J.; Higgins, J.B. Collection of Simulated XRD Powder Patterns for Zeolites, 1st ed.; Elsevier: Amsterdam, The Netherlands, 2001; pp. 186–187. ISBN 9780080529349. [Google Scholar]
- Garcia-Basabe, Y.; Rodriguez-Iznaga, I.; de Menorval, L.-C.; Llewellyn, P.; Maurin, G.; Lewis, D.W.; Binions, R.; Autie, M.; Ruiz-Salvador, A.R. Step-wise dealumination of natural clinoptilolite: Structural and physicochemical characterization. Micropor. Mesopor. Mater. 2010, 135, 187–196. [Google Scholar] [CrossRef]
- Pavlović, J.; Popova, M.; Mihalyi, R.M.; Mazaj, M.; Mali, G.; Kovač, J.; Lazarova, H.; Rajić, N. Catalytic activity of SnO2- and SO4/SnO2-containing clinoptilolite in the esterification of levulinic acid. Micropor. Mesopor. Mater. 2019, 27, 10–18. [Google Scholar] [CrossRef]
- Farías, T.; Ruiz-Salvador, A.R.; Velazco, L.; de Ménorval, L.C.; Rivera, A. Preparation of natural zeolitic supports for potential biomedical applications. Mater. Chem. Phys. 2009, 118, 322–328. [Google Scholar] [CrossRef]
- Kouvelos, E.; Kesore, K.; Steriotis, T.; Grigoropoulou, H.; Bouloubasi, D.; Theophilou, N.; Tzintzos, S.; Kanelopoulos, N. High pressure N2/CH4 adsorption measurements in clinoptilolites. Micropor. Mesopor. Mater. 2007, 99, 106–111. [Google Scholar] [CrossRef]
- De Souza Macedo, J.; da Costa Júnior, N.B.; Almeida, L.E.; da Silva Vieira, E.F.; de Fátima Gimenez, I.; Carreño, N.L.V.; Barreto, L.S. Kinetic and calorimetric study of the adsorption of dyes on mesoporous activated carbon prepared from coconut coir dust. J. Colloid. Interf. Sci. 2006, 298, 515–522. [Google Scholar] [CrossRef]
- Li, H.; Liu, L.; Cui, J.; Cui, J.; Wang, F.; Zhang, F. High-efficiency adsorption and regeneration of methylene blue and aniline onto activated carbon from waste edible fungus residue and its possible mechanism. RSC Adv. 2020, 10, 14262–14273. [Google Scholar] [CrossRef] [Green Version]
- Alvarez-Aguiñaga, E.A.; Elizade-González, M.P.; Sabinas-Hernández, S.A. Unpredicted photocatalytic activity of clinoptilolite–mordenite natural zeolite. RSC Adv. 2020, 10, 39251–39260. [Google Scholar] [CrossRef]
- Cheng, M.; Song, W.; Ma, W.; Chen, C.; Zhao, J.; Lin, J.; Zhu, H. Catalytic activity of iron species in layered clays for photodegradation of organic dyes under visible irradiation. Appl. Catal. B Environ. 2008, 77, 355–363. [Google Scholar] [CrossRef]
- Wang, Z.; Huang, L.; Du, L.; Sheng, H.; Lv, B. Photocatalysis by iron-rich montmorillonite for the treatment of dyeing wastewater. Chem. Eng. Comm. 2010, 197, 1048–1056. [Google Scholar] [CrossRef]
- Pereira, M.C.; Oliveira, L.C.A.; Murad, E. Iron oxide catalysts: Fenton and Fentonlike reactions—A review. Clay Miner. 2012, 47, 285–302. [Google Scholar] [CrossRef]
- Marbán, G.; Vu, T.T.; Valdés-Solís, T. A simple visible spectrum deconvolution technique to prevent the artefact induced by the hypsochromic shift from masking the concentration of methylene blue in photodegradation experiments. Appl. Catal. A Gen. 2011, 402, 218–223. [Google Scholar] [CrossRef]
- Rauf, M.A.; Meetani, M.A.; Khaleel, A.; Ahmed, A. Photocatalytic degradation of Methylene Blue using a mixed catalyst and product analysis by LC/MS. Chem. Eng. J. 2010, 157, 373–378. [Google Scholar] [CrossRef]
- Mondal, S.; Reyes, M.E.; Pal, U. Plasmon induced enhanced photocatalytic activity of gold loaded hydroxyapatite nanoparticles for methylene blue degradation under visible light. RSC Adv. 2017, 7, 8633. [Google Scholar] [CrossRef] [Green Version]
- Moustakas, N.G.; Kontos, A.G.; Likodimos, F.; Katsaros, F.; Boukos, N.; Tsoutsou, D.; Dimoulas, A.; Romanos, G.E.; Dionysoou, D.D.; Falaras, P. Inorganic–organic core–shell titania nanoparticles for efficient visible light activated photocatalysis. Appl. Catal. B Environ. 2013, 130–131, 14–24. [Google Scholar] [CrossRef]
- Zaied, M.; Peulon, S.; Bellakhal, N.; Desmazières, B.; Chaussé, A. Studies of N-demethylation oxidative and degradation of methylene blue by thin layers of birnessite electrodeposited onto SnO2. Appl. Catal. B Environ. 2011, 101, 441–450. [Google Scholar] [CrossRef]
- Zhou, S.; Du, Z.; Li, X.; Zhang, Y.; He, Y.; Zhang, Y. Degradation of methylene blue by natural manganese oxides: Kinetics and transformation products. R. Soc. Open Sci. 2019, 6, 190351. [Google Scholar] [CrossRef] [PubMed] [Green Version]
- Coelho, A. TOPAS Academic 4.1 Coelho Software; Coelho Software: Brisbane, Australia, 2007. [Google Scholar]
- Ming, D.W.; Dixon, J.B. Quantitative determination of clinoptilolite in soils by a cation-exchange capacity method. Clay Clay Miner. 1987, 35, 463–468. [Google Scholar] [CrossRef]
- CEM, MARS 6, Microwave Acid Digestion, Method Note Compendium. 2019. Available online: https://cem.com/en/mars-6-method-note-compendium (accessed on 28 January 2022).


| Catalyst | Dye | Irradiation Source | Experimental Conditions | Degradation Efficiency | Reusability | Ref. |
|---|---|---|---|---|---|---|
| TiO2-CLI | Reactive Black 5 | 8 W UV lamp | 0.4 g dm–3, 10 ppm, pH = 6, 500 min | 86% | / | [23] |
| TiO2-CLI | Acid orange 7 | 30 W UV-C Hg lamp | 80 g dm–3, 10 ppm, 90 min | 85% | 67% after 4 cycles | [25] |
| ZnO-CLI | Bromothymol blue | 35 W Hg lamp | 0.1 g dm–3, 4 ppm, pH = 7.8, 300 min | 80% | 48% after 3 cycles | [26] |
| CuO-CLI | Methylene blue | 75 W Hg lamp | 0.2 g dm–3, 7 ppm, pH = 5.9, 180 min | 61% | 28% after 4 cycles | [27] |
| CuO-CLI | Bromophenol blue | 32% | 17% after 4 cycles | |||
| SnO2-CLI | Methylene blue | Visible light lamp, 8 mW cm–2 | 0.2 g dm–3, 10 ppm, pH = 6, 180 min | 45% | 30% after 3 cycles | [24] |
| CLI | Rhodamine B | 100 W LED Cool daylight lamp | 0.75 g dm–3, 4.8 ppm, 600 min | 70% | 60% after 3 cycles | [28] |
| Sample | Na+ | K+ | Ca2+ | Mg2+ | ∑ |
|---|---|---|---|---|---|
| Concentration (mmol M+/100 g) | |||||
| SCLI | 18.6 | 11.2 | 118.9 | 34.2 | 182.9 |
| TCLI | 4.3 | 25.5 | 79.8 | 15.8 | 125.4 |
| SKCLI | 3.6 | 45.1 | 86.9 | 5.3 | 140.9 |
| RCLI | 5.2 | 50.6 | 173.7 | 6.8 | 236.3 |
| ICLI | 59.8 | 21.8 | 44.6 | 3.5 | 129.7 |
| NaSCLI | 188.3 | 5.7 | 18.9 | 2.9 | 215.8 |
| NH4SCLI | 0.6 | 1.5 | 10.9 | 16.0 | 29.0 |
| HSCLI | 3.2 | 7.3 | 2.8 | 1.5 | 14.8 |
| Sample | SBET1, m2 g−1 | S2Lang, m2 g−1 | Smic3, m2 g−1 | Sext4, m2 g−1 | Vmic5, cm3 g−1 | Vt6, m3 g−1 | D7, nm |
|---|---|---|---|---|---|---|---|
| SCLI | 23.0 | 36.8 | 0.7259 | 22.2656 | 0.1335 | 0.1361 | 19.4 |
| TCLI | 45.1 | 72.3 | 4.3185 | 40.7610 | 0.1217 | 0.1253 | 8.3 |
| SKCLI | 25.1 | 40.4 | 1.5393 | 23.5839 | 0.1357 | 0.1379 | 17.8 |
| RCLI | 35.1 | 56.2 | 3.0254 | 32.0343 | 0.0978 | 0.1004 | 8.5 |
| ICLI | 25.8 | 41.7 | 1.3850 | 24.4316 | 0.1303 | 0.1323 | 17.8 |
| HSCLI | 33.0 | 50.6 | 8.6373 | 24.3537 | 0.1315 | 0.1361 | 19.4 |
| NH4SCLI | 24.8 | 40.0 | 0.3504 | 24.4839 | 0.1088 | 0.1116 | 15.9 |
| NaSCLI | 23.5 | 37.5 | 1.6290 | 21.9144 | 0.1004 | 0.1030 | 16.1 |
| Sample | pH = 3 | pH = 6 | pH = 9 |
|---|---|---|---|
| SCLI | |||
| kapp, min–1 | 0.0011 | 0.0035 | 0.0036 |
| R2 | 0.9813 | 0.9996 | 0.9980 |
| TCLI | |||
| kapp, min–1 | 0.0024 | 0.0064 | 0.0066 |
| R2 | 0.9944 | 0.9986 | 0.9904 |
| ICLI | |||
| kapp, min–1 | 0.0017 | 0.0037 | 0.0038 |
| R2 | 0.9978 | 0.9979 | 0.9994 |
| RCLI | |||
| kapp, min–1 | 0.0027 | 0.0052 | 0.0054 |
| R2 | 0.9951 | 0.9883 | 0.9866 |
| SKCLI | |||
| kapp, min–1 | 0.0014 | 0.0040 | 0.0044 |
| R2 | 0.9987 | 0.9937 | 0.9977 |
| NaSCLI | |||
| kapp, min–1 | 0.0009 | 0.0029 | 0.0034 |
| R2 | 0.9967 | 0.9988 | 0.9969 |
| NH4SCLI | |||
| kapp, min–1 | 0.0007 | 0.0028 | 0.0024 |
| R2 | 0.9863 | 0.9996 | 0.9999 |
| HSCLI | |||
| kapp, min–1 | 0.0004 | 0.0017 | 0.0024 |
| R2 | 0.9914 | 0.9994 | 0.9995 |
| Property | |
|---|---|
| IUPAC name | [7-(dimethylamino)phenothiazin-3-ylidene]-dimethylazanium;chloride |
| Chemical structure | 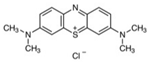 |
| Molecular formula | C16H18ClN3S |
| Molecular weight, g mol–1 | 319.9 |
| Type of dye | Cationic |
| Solubility in water | Soluble |
| Absorption spectrum of MB, (maximum absorption wavelength, nm) | 664 |
Publisher’s Note: MDPI stays neutral with regard to jurisdictional claims in published maps and institutional affiliations. |
© 2022 by the authors. Licensee MDPI, Basel, Switzerland. This article is an open access article distributed under the terms and conditions of the Creative Commons Attribution (CC BY) license (https://creativecommons.org/licenses/by/4.0/).
Share and Cite
Pavlović, J.; Šuligoj, A.; Opresnik, M.; Tušar, N.N.; Logar, N.Z.; Rajić, N. Studies of Clinoptilolite-Rich Zeolitic Tuffs from Different Regions and Their Activity in Photodegradation of Methylene Blue. Catalysts 2022, 12, 224. https://doi.org/10.3390/catal12020224
Pavlović J, Šuligoj A, Opresnik M, Tušar NN, Logar NZ, Rajić N. Studies of Clinoptilolite-Rich Zeolitic Tuffs from Different Regions and Their Activity in Photodegradation of Methylene Blue. Catalysts. 2022; 12(2):224. https://doi.org/10.3390/catal12020224
Chicago/Turabian StylePavlović, Jelena, Andraž Šuligoj, Mojca Opresnik, Nataša Novak Tušar, Nataša Zabukovec Logar, and Nevenka Rajić. 2022. "Studies of Clinoptilolite-Rich Zeolitic Tuffs from Different Regions and Their Activity in Photodegradation of Methylene Blue" Catalysts 12, no. 2: 224. https://doi.org/10.3390/catal12020224
APA StylePavlović, J., Šuligoj, A., Opresnik, M., Tušar, N. N., Logar, N. Z., & Rajić, N. (2022). Studies of Clinoptilolite-Rich Zeolitic Tuffs from Different Regions and Their Activity in Photodegradation of Methylene Blue. Catalysts, 12(2), 224. https://doi.org/10.3390/catal12020224