Abstract
The photocatalytic degradation and adsorption of the oxamyl pesticide utilizing a nano-HTiO2@activated carbon-amorphous silica nanocomposite catalyst (HTiO2@AC/SiO2). Sol-gel Synthesis was used to produce HTiO2@AC/SiO2, which was examined using Scanning Electron Microscopy, Transmission Electron Microscopy, and an X-ray diffractometer. The analyses confirmed that HTiO2 is mainly present in its crystalline form at a size of 7–9 nm. The efficiency of HTiO2@AC/SiO2 was assessed at various pHs, catalyst doses, agitating intensities, initial pesticide concentrations, contact times, and temperatures under visible light and in darkness. Oxamyl adsorption kinetics followed a pseudo-second-order kinetic model, suggesting that the adsorption process is dominated by chemisorption, as supported by a calculated activation energy of −182.769 kJ/mol. The oxamyl adsorption is compatible with Langmuir and Freundlich isotherms, suggesting a maximum adsorption capacity of 312.76 mg g−1. The adsorption capacity increased slightly with increasing temperature (283 K < 323 K < 373 K), suggesting an exothermic process with the Gibbs free energy change ΔG, enthalpy change ΔH, and entropy change ΔS°, being –3.17 kJ/mol, −8.85 kJ/mol, and −0.019 J/mol K, respectively, at 310 K for HTiO2@AC/SiO2 under visible light. This indicates spontaneous adsorption, and negative (ΔS) explain a decreased randomness process. HTiO2@AC/SiO2 would be a promising material.
Keywords:
titanium (IV) dioxide; activated carbon; photocatalyst; pesticides; degradation; adsorption; oxamyl 1. Introduction
As the world’s population continues to grow, agrochemicals such as pesticides are applied in higher quantities to meet the ever-increasing food demand. Pesticides are thus critical components of modern agriculture, combating pests and weed infestation [1,2], and ultimately reducing yield loss. Several reports reveal that chlorinated hydrocarbon pesticide residues, which were heavily used several decades ago, are still detectable in several environmental compartments, though at declining levels.
Pesticides have been quantified in surface water bodies worldwide [3], causing adverse effects [4] and raising widespread concern [5]. Although pesticides usually enter surface water bodies through non-point sources [6], significant loads of pesticides can enter these ecosystems through wastewater [7]. Consequently, removing pesticides as efficiently as possible, also from wastewater, remains an important societal challenge.
A variety of techniques, including advanced oxidation processes (AOPs) [7,8,9], are effectively eliminating a broad range of organic pollutants, including pesticides [8]. Among AOPs, photocatalysis is a highly efficient process that has been extensively explored for pesticide removal [7]. Numerous photocatalytic materials have been developed, with their widely used titanium dioxide (TiO2) and doped complexes [9]. This frequent utilization of TiO2 is explained by its high-cost efficiency, assumed low toxicity, and chemical inertness to microorganisms [10]. Under UV irradiation, electrons (e−) are stimulated to the conduction band, whereas electron holes (h+) stay in the valence band. These electron holes operate as a strong oxidizing agent, interacting with water molecules or hydroxyl groups on the TiO2 surface, releasing hydroxyl radicals (OH•) and initiating the photodegradation of organic pollutants. Furthermore, excited electrons can react with oxygen molecules to generate superoxide radicals (O2•−), which may react with protons (H+), forming hydroxyl radicals [11]. During wastewater treatment, titanium dioxide can be applied as a suspension [5] or attached to surfaces, such as membranes [6], carbon nanotube arrays [7], or graphene oxide nanosheets [8]. Even though a suspension has a higher surface area than titanium dioxide attached to a surface, using a porous material such as a polymer membrane will increase the overall surface area [9,10]. In addition to the surface area, the crystallite structure has a significant impact on the photocatalytic activity of TiO2 [10,11]. Amorphous TiO2 does not have any photoactive properties [11]. Despite the wider bandgap (3.2 eV for anatase, versus 3.0 eV for rutile) [12,13], the crystalline form anatase, which is considered a more efficient photocatalyst than rutile, is extensively employed.
Moreover, TiO2 doping, metal coating, surface sensitization, and support (immobilization by increasing the illuminated specific catalyst area [14]) are increasingly used to improve the photocatalytic response [12]. Moreover, attempts to employ an adsorbent such as silica, alumina, zeolite, or activated carbon have previously been made [13]. AC has a high capacity to absorb the pollutant by itself; moreover, TiO2 can absorb the pollutant before the degradation process. From different work and previous work, we can say that the recovery and reusability of catalysts in nano-sized titania powders pose considerable operational challenges, making the large-scale application of this technology problematic. Activated carbon is a commonly used carrier of titanium dioxide. However, it was found that when activated carbon is used as a support, the presence of a large number of cropping structures would hinder the diffusion of organic pollutants towards the catalyst surface, and HTiO2 may clog the pore structure [13,14].
Therefore, the immobilization of the photoactive powder on various supports is extensively studied [15]. Concerning our work, our composite HTiO2@AC/SiO2 has the following characteristics:
- When irradiated with light, it is nontoxic, photo-stable, inexpensive, and extremely effective.
- The photodegradation of organic contaminants by titanium oxide immobilization on carbon supports has recently received a lot of interest. We use one of the titanium oxide components as a titanium oxide composite matrix.
- Moreover, active carbon has a far-reaching effect on HTiO2′s catalytic properties, which goes beyond a simple synergistic effect on degradation rates.
- Crucially, due to the AC’s porous support and the fact that it includes the amorphous silica, HTiO2@AC/SiO2 has a greater activity because it facilitates adsorption between the catalyst and the substrate. Since photogenerated oxidizing species (•OH) do not travel far from the HTiO2 active centers, catalytic breakdown occurs mostly at the catalyst/water contact.
- We hypothesize that the HTiO2@AC/SiO2 is able to absorb and/or further oxidize the intermediates formed during degradation to minimize the secondary pollution they cause [16]. It has been determined that activated carbon (AC) with a high specific surface area and porosity is most suited for textile waste treatment [17].
In the present study, we investigated the potential of a composite catalyst made of nano-sized HTiO2 and activated carbon, creating HTiO2@AC/SiO2, synthesized by the sol-gel method, to reduce pesticide loads in water. More specifically, we focused on the removal of carbamate pesticide oxamyl (methyl N0-dimethyl-N-[(methyl carbamoyl) oxy]-l-thiooxamimidate) through adsorption and photodegradation in darkness and sunlight exposure, respectively. Oxamyl was selected as a model pesticide as it is applied to various crops, including vegetables, fruits, soya beans, potatoes, and sugar beet, to control nematodes [18].
The removal efficiency of oxamyl by HTiO2@AC/SiO2 was assessed at varying pH levels, HTiO2@AC/SiO2 dosages, pollutant concentrations, velocities, temperatures, and contact times. The composite catalyst was further characterized by Scanning Electron Microscopy (SEM), Transmission Electron Microscopy (TEM), surface area (SBET), and an X-ray diffractometer (XRD). The adsorption isotherm and degradation kinetics of oxamyl by HTiO2@AC/SiO2 were assessed against various theoretical models (e.g., pseudo-first- and -second-order kinetics). Thereby, insights on the possibility and suitability of HTiO2@AC/SiO2 to reduce pesticide loads in water and ultimately wastewater have been generated, stimulating further research.
2. Results and Discussion
2.1. Material Characterization
2.1.1. X-ray Diffractometry
The XRD patterns of AC/SiO2, HTiO2, and HTiO2@AC/SiO2 are shown in Figure 1. The TiO2 and HTiO2@AC/SiO2 composites showed peaks of nanocrystalline anatase (a form of TiO2) as the only phase present. The highest peak was found at 25.29° as (101) plane. This was due to the heat treatment at 500 °C, which is known to produce high anatase content. Calcination at 500 °C was used because HTiO2 has a better photocatalytic activity. Due to the higher electron-hole pair lifetime than anatase and rutile. However, It may be the presence of AC that could affect phase transformation. For the AC sample, 26.8° and 35.02° are the main representative peaks in the XRD pattern. For HTiO2@AC/SiO2 composites, the peak intensity gradually decreased with increasing AC.
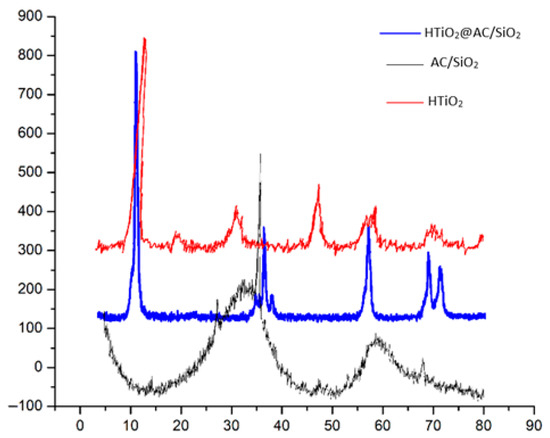
Figure 1.
XRD patterns of activated carbon (AC/SiO2), titanium dioxide (HTiO2), and HTiO2@AC/SiO2 composites.
The crystal structure of the obtained hydrated TiO2 had great impacts on the HTiO2@AC/SiO2 nanocomposite crystal structure and would ultimately affect the photodegradation properties of HTiO2@AC/SiO2.
The crystalline sizes of synthesized samples were in the range of 5–10 nm, which was obtained from Scherrer’s equation using Equation (1):
where λ (wavelength of X-ray) = 0.15418 nm, β = full width and half maxima, θ = Bragg’s angle (2θ = 25.15). D = Crystallite size, K = Scherrer constant (0.089), and B = the line width at half-maximum height after the subtraction of equipment broadening. Generally, the hydrated TiO2 was an anatase phase with low crystallinity due to its wide, flat diffraction peaks and low diffraction intensity.
2.1.2. Morphology of HTiO2@AC/SiO2 Nanocomposite
A TEM picture demonstrates the anchoring of HTiO2 particles on the surface of AC (Figure 2a). It was possible to see a difference in the properties of HTiO2 crystals and amorphous carbon. The particle uniformity was good. The average size was about 40 nm, consistent with the particle size test results. The size of HTiO2@AC/SiO2 was different, which might be related to the slow hydrolysis rate and uneven hydrolysis process of the TiOSO4 solution. Better particle morphology and particle size distribution would contribute to the improvement of photodegradation performance.
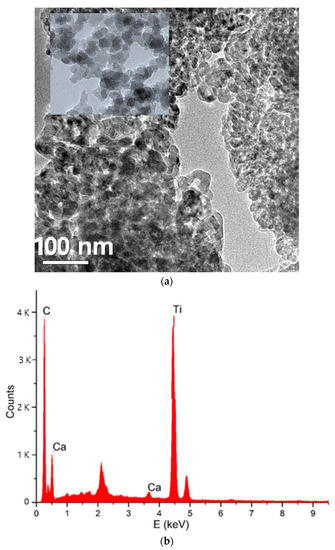
Figure 2.
TEM (a) and EDx (b) analysis of HTiO2 particle anchoring on the surface of AC/SiO2.
A point EDX spectrum acquired from the region, indicated by a white circle, is shown in Figure 2b. The simultaneous presence of C–K, O–K, F–K, and Ti–K EDX peaks supports XRD and TEM results concerning the HTiO2 doping of AC.
The HTiO2 nanocrystals (Figure 2) were tetragonal in shape. The particle sizes were 20–35 nm in diameter, which are the characteristics of an anatase structure. Furthermore, from Figure 2, all HTiO2@AC/SiO2 composites showed similar morphology to HTiO2 due to the same preparation conditions. The particle sizes obtained from TEM were similar to those obtained from XRD.
SEM was used to describe the surface morphology of the HTiO2@AC/SiO2 composite (Figure 3). Activated carbon’s porous surface was easily visible. Moreover, the HTiO2 nanoparticles were well-disseminated and intertwined on the surface of the activated carbon. The latter appears to have a denser and more packed structure compared to other activated carbon structures [19], due to the high production of early hydration products.
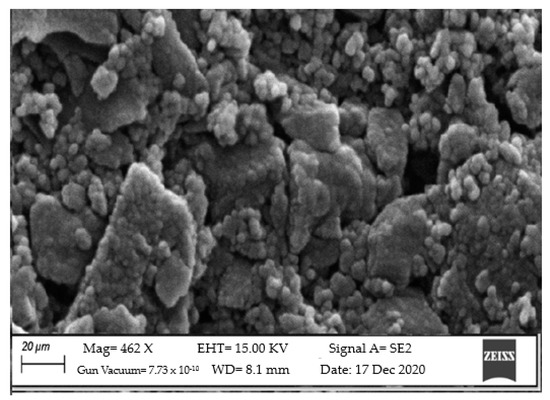
Figure 3.
SEM of HTiO2@AC/SiO2 composite for surface morphology. Mag = 462 X, EHT = 15.00 KV, Signal A = SE2, Gun Vacuum = 7.73 × 10⁻¹⁰, WD = 8.1 mm. Date: 17 December 2020.
2.1.3. Surface Properties of Prepared Nanomaterials
BET is an analysis technique used to measure the total specific surface area. The analysis also provides information about surface porosity and particle size. The BET surface area of the HTiO2@AC/SiO2, AC/SiO2, and HTiO2 were analyzed by nitrogen adsorption. The surface area was determined by a multipoint BET method using the adsorption data with a relative pressure (P/P0) range of 0.050354–0.60029 to achieve the value of 2228, 1857, and 251.5 m2/g, respectively. From the Barret-Joymer-Halender method, a desorption isotherm was used to determine the pore size distribution to gain the value of the pore diameter, 2.322 nm, and the pore volume, 0.57 cc/g, for the HTiO2@AC/SiO2 nanocomposite. Concerning AC and HTiO2, the pore diameters were 4.322 and 0.2 nm and the pore volumes were 0.57 and 0.047 cc/g, respectively, as shown in Figure 4. The BET surface area, total pore volume, micropore volume, and average pore diameter of the raw activated carbon and HTiO2@AC/SiO2 nanocomposite were obtained from adsorption isotherms. The sample shows a high proportion of micropore volume (about 90% of total pore volume). This means that the HTiO2@AC/SiO2 nanocomposite indicates a higher volume of wide micropores and the presence of small mesopores.
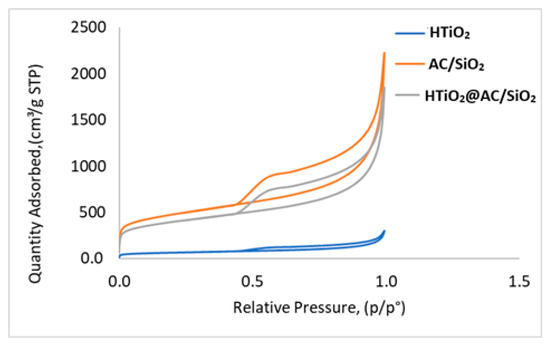
Figure 4.
Adsorption-desorption isotherm of AC/SiO2, HTiO2, and HTiO2@AC/SiO2 composites.
2.1.4. Optical Characterization of AC/SiO2 and HTiO2@AC/SiO2 Composite
As the composite structure contains both oxides (SiO2 and HTiO2), it was crucial to investigate the optical properties of these materials (Figure 5). The DRS experiment assessed the optical properties of the as-prepared AC/SiO2 and HTiO2@AC/SiO2 nanocomposite spheres. As shown in Figure 5, the AC/SiO2 sphere shows strong absorption at 397 nm; thus, the photocatalytic activity is only active in the UV region, while in the DRS of the HTiO2@AC/SiO2 nanocomposite, a notable absorption was observed in the visible light region around 460 nm. The HTiO2@AC/SiO2 shows that the visible light absorption region extends from 400 to 550 nm, confirming that these catalysts efficiently enhanced the photodegradation of oxamyl under visible light. This part of absorption corresponded to the intrinsic absorption of HTiO2, which was the energy absorbed by the electron transition from the valence band of titanium dioxide to the conduction band [17]. The fine fluctuation of the absorption spectra might be caused by different sizes of the HTiO2 crystals in the main HTiO2@AC/SiO2 nanocomposite [17].
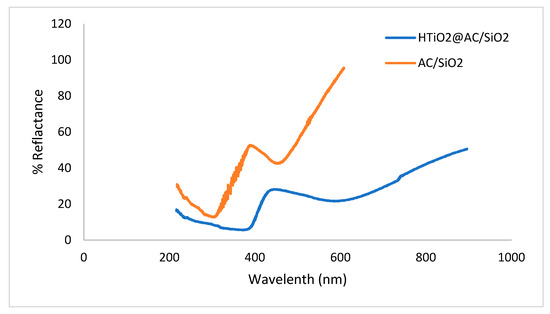
Figure 5.
The reflectance spectra of the prepared AC/SiO2 and HTiO2@AC/SiO2 composites.
2.2. Batch Studies
2.2.1. The Effect of pH
The impact of pH on oxamyl adsorption was investigated using HTiO2@AC/SiO2 in dark and visible light with agitation speeds (400 rpm), 300 mg L−1 oxamyl concentration, and a 50 g L−1 adsorbent dose at 50 min and 310 K. One important parameter that affects the equilibrium adsorption mechanism in HTiO2@AC/SiO2 is the interaction between the acid sites of the HTiO2@AC/SiO2 and the functional groups of the adsorbate.
The pH increase from 2.4 to 9.0 decreased the oxamyl removal ratio from 85.4% to 10.8% (r −0.98, p 0.0005) and from 90.60% to 16.0% (r −0.98, p 0.0005) in the dark and in visible light, respectively. The results of using AC@ HTiO2 in dark and visible light are displayed in Figure 6. A decrease in pH from 9.00 to 2.4 improved the efficiency of the removal of oxamyl from 27.1% to 95.30% and from 34.1% to 100.00% in dark and visible light, respectively, while the increase in pH from 1.3 to 2.40 increased the efficiency of the removal of oxamyl from 73.7% to 95.3% (r 0.904, p 0.002) and from 80.7% to 100% (r 0.909, p 0.0018) in dark and visible light, respectively.
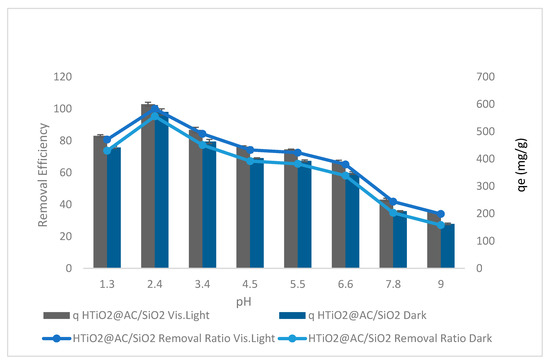
Figure 6.
The effect of pH on oxamyl adsorption by HTiO2@AC/SiO2.
Figure 6 shows the higher adsorption of oxamyl by HTiO2@AC/SiO2. The pH values of pesticide solutions control the ionization of the acidic and basic compounds and affect the surface charge. Thus, the acidic medium can increase the adsorption of negatively charged substrate molecules (oxamyl), resulting in greater adsorption of oxamyl at lower pH values than at higher pH values. The reason is that oxamyl has a delocalization of π electrons, making it a negatively charged species and, thus, it has a lower pH value adsorption. HTiO2@AC/SiO2 nanoparticles with higher pH have a greater negative charge that does not assist oxamyl adsorption due to electrostatic repulsion between oxamyl molecules and the nanoparticle surface, producing an apparent decrease in oxamyl adsorption. For further studies, pH 2.4 was chosen, as it provides a better removal efficiency of oxamyl [19].
The oxamyl removal ratio performance at pH from 1.1 to 6.6 can be described as follows: at extremely low pH values, a decreased adsorption effectiveness was observed due to the competition between H+ and oxamyl molecules for active sites on the adsorbent surface. As a result of the electrostatic attraction force, oxamyl can migrate toward the positively charged surface area of the adsorbent, increasing its removal at low pH values. A significant enhancement in adsorption was observed at high pH due to the increased electrostatic repulsion between the adsorbent and oxamyl. It is widely known that the pH of the solution has a significant impact on adsorption. The principal active site in all pesticides examined is an epoxide group, such as oxacyclopropane or oxirane. A strained group is easily impacted by nearby substituent acids and bases [20].
2.2.2. HTiO2@AC/SiO2 Dosage Effect
The HTiO2@AC/SiO2 dosage effect in dark and visible light on the oxamyl removal ratio and adsorption capacity was studied with an aqueous solution volume of 300 mg L−1 at contact time = 50 min, pH = 2.4, Temp = 310 K, and agitation speed = 400 rpm, as shown in Figure 7.
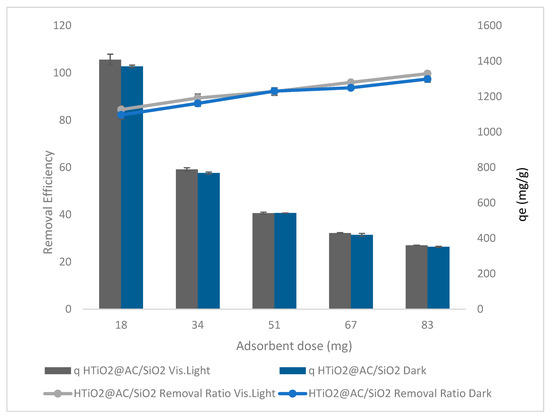
Figure 7.
The effect of HTiO2@AC/SiO2 doses in dark and visible light on oxamyl removal.
The results of using HTiO2@AC/SiO2 in dark and visible light are shown in Figure 7. The oxamyl removal ratio gradually increased from 82% to 97% (r 0.98, p 0.002) and 84.5% to 99.7% (r 0.99, p 0.0002) in dark and visible light, respectively, with a rise in HTiO2@AC/SiO2 dose from 18 to 83 g L−1. Increased HTiO2 dosage may improve oxamyl removal due to increased surface area accessibility [20].
Vishnu et al. [21] indicated that increasing the particle dose accelerates adsorption. It shortens the time required to reach equilibrium by raising the slope of the kinetic curve at a given time. There are more collisions between the surfaces of particles in a liquid, which results in quicker adsorption. The previous study by Vishnu et al. [21] documented that increasing particle doses considerably impact removal efficiency. They increase the overall amount of adsorption surface area accessible.
At a high particle dosage of 83 mg L−1, the obtained qt is 25 mg g−1, and the removal efficiency is 100%.
Additionally, Ferreir et al. [22] confirmed that higher adsorbent dosages result in a higher removal percentage. When the adsorbent concentration increases, the diffusion reduces due to various causes such as solute availability, interference between binding sites, electrostatic interactions, and reduced mixing due to high adsorbent concentration in the solution. Because of the limited availability of the adsorbate, many unsaturated adsorption sites remain, reducing absorption and adsorption effectiveness.
2.2.3. Initial Concentration Effect
The initial oxamyl concentration was studied from 20 to 401 mg L−1 with a pH of 2.4, an HTiO2@AC/SiO2 dosage of 83 g L−1, and a stirring rate of 400 rpm for 50 min in dark and visible light, as shown in Figure 8.
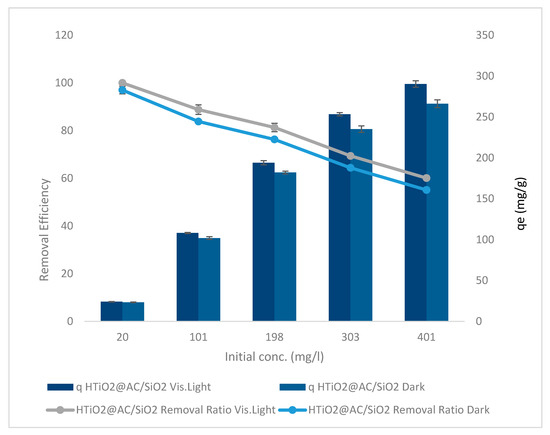
Figure 8.
The initial oxamyl concentration HTiO2@AC/SiO2 in dark and visible light.
The results of using HTiO2@AC/SiO2 in dark and visible light are shown in Figure 8. Increasing the initial oxamyl concentration from 20 to 401 mg L−1 linearly decreased the oxamyl removal ratios from 97% to 55% and 100% to 60%, with r 0.99, p 0.0004, and r 0.997, p 0.0001, respectively. While qe elevated from 23.4 to 266.2 mg g−1, with r 0.979, p 0.003, and 24.1 to 290.4 mg g−1, with r 0.983, p 0.003, in dark and visible light, respectively.
The results indicated that increasing the initial oxamyl concentration resulted in decreased availability of active surface sites, which resulted in decreased bleaching and degradation. As a result, the generation of hydroxyl radicals decreased, potentially impairing photocatalytic activity. As the oxamyl concentration rises, however, it also shortens the path taken by photons entering the oxamyl solution as they approach the solution’s surface. When oxamyl concentrations are high, the oxamyl molecules may absorb a large proportion of solar light, which may reduce the catalytic efficiency [23,24]; therefore, an oxamyl concentration of 10 mg L−1 was selected for further study.
Increases in oxamyl’s initial concentration are followed by a decrease in removal ratios and an increase in adsorption capacity. When the oxamyl load was low, the number of ions competing for unoccupied active sites in activated carbon and HTiO2@AC/SiO2 decreased. As a result, there was enough surface area in the solution to house the available oxamyl. At greater initial oxamyl concentrations, the diffusion rate increased in the saturation of adsorption sites, and the possibility of oxamyl–sorbent interactions increased [25]. The increase in loading capacity of HTiO2@AC/SiO2 related to oxamyl concentration is due to a high driving force of mass transfer [26].
2.2.4. The Effect of Stirring
The effect of the stirring rate on oxamyl adsorption in dark and visible light with agitation speeds of 259, 293, 349, 426, and 568 rpm, at pH 2.4, an oxamyl concentration of 20 mg L−1, and an 83 g L−1 dose of the adsorbent at 50 min is shown in Figure 9.
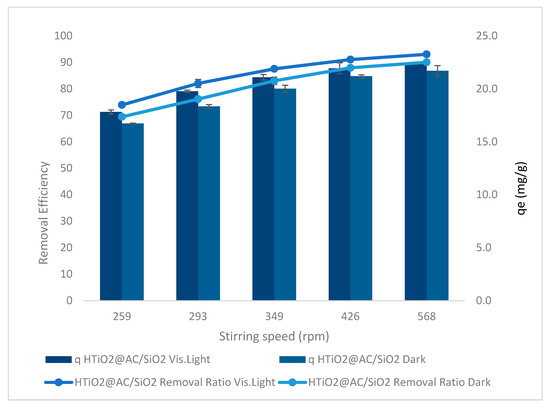
Figure 9.
The effect of stirrer rate on oxamyl adsorption, using HTiO2@AC/SiO2 in dark and visible light.
The agitation rate results of using HTiO2@AC/SiO2 on the oxamyl removal ratio are shown in Figure 9 for dark and visible light. Experiments were performed at a reaction time of 50 min, pH of 2.4, initial pesticide concentration of 20 mg L−1, and an 83 mg L−1 amount of the catalyst to examine the stirring effect. The maximum removal efficiency of 69% to 80% and 74% to 93% in dark and visible light, respectively, was recorded at an agitation speed from 259 to 568 rpm with r 0.9, p 0.037 and r 0.87, p 0.054. The results shown in Figure 9 demonstrate that as agitation speed increased, the rate of oxamyl removal increased.
This process’s dispersion of adsorbent particles is critical. Mass transfer governs the adsorption process. The liquid mass transfer resistance is thought to be in charge of the process. With bulk motion, the adsorption rate rises [14]. It has long been known that as the agitation speed increases, so does the mass transfer rate. The adsorbate will be separated from the adsorbent surface if the mixing is more intense. This suggests that the adsorbate-adsorbent link will likely break up. We know that, depending on the agitation of the fluid particle system, the rate of adsorption can be modulated by either film or pore diffusion. Lower agitation speeds result in a thicker liquid film surrounding the particle, and it appears that film diffusion is a rate-limiting process. Adsorption kinetics are affected by the limited mass transfer of the adsorbate to the internal surface of the particle. At greater agitation speeds, on the other hand, film diffusion reaches a maximum, and pore diffusion takes over as the rate-controlling step. The results show that stirring the solution promoted bleaching and degradation. Initially, agitation creates turbulence in the solution, which promotes oxygen in the solution. Soluble oxygen is critical in generating hydroxyl radicals and reactive oxygen species. Furthermore, stirring the solution reduces the equilibrium time by boosting the rate of pesticide transfer and diffusion to the adsorbent surface, resulting in a reduction in the equilibrium time.
2.2.5. Temperature Impact
Oxamyl removal efficiency and adsorption capacity versus temperature is shown in Figure 10 at an adsorbent dose = 83 g L−1, pH = 2.4, an oxamyl concentration = 20 mg L−1, and an agitation speed = 425 rpm. Three calcination temperatures of 283, 298, 323, 348, and 373 K were investigated using HTiO2@AC/SiO2 photocatalysts. Due to the rise in the oxamyl molecules’ movability in rising temperatures from 283 K to 373 K, the temperature’s effect on oxamyl adsorption using HTiO2@AC/SiO2 is presented in Figure 10. The qe and removal ratio increased slightly with increasing temperature. Results show that the oxamyl adsorption by HTiO2@AC/SiO2 is an endothermic process. The increase in qe of 14.1 to 18.6 mg g−1 (r 0.97, p 0.006) and 15.2 to 19.7 mg g−1 (r 0.98, p 0.004) in dark and visible light, respectively, and the increase in the percentage of removal from 59 to 77% (r 0.97, p 0.006) and 63 to 82% (r 0.98, p 0.004) in dark and visible light, respectively, could be associated with a rise in the movability of the oxamyl molecules with rising temperature (283 to 373 K).
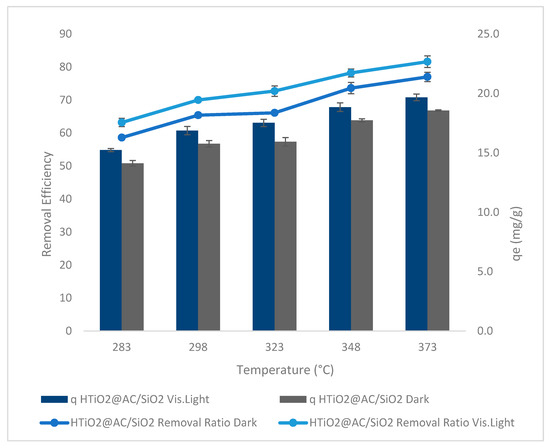
Figure 10.
Temperature versus removal efficiency using HTiO2@AC/SiO2.
Furthermore, many pesticide molecules may get enough energy to interact with active sites on the adsorbent surface. The temperature increase also causes swelling effects on the internal structure of the adsorbent and an increase in the size of the pores, which allows pesticide molecules to penetrate further into the adsorbent. In another study, oxamyl was shown to adhere to green pea peels, and the results were very similar [27,28].
2.2.6. The Effect of Contact Time
Figure 11 depicts the relationship between contact time and removal effectiveness as well as oxamyl adsorption capacity at an optimum adsorbent dose = 83 g L−1, an oxamyl concentration of 20 mg L−1, pH = 2.4, and stirring rate = 425 rpm. Using HTiO2@AC/SiO2 in both low and high light, when the time increased from 24 to 259 min (r 0.836, p 0.0002) in dark and (r 0.858, p 0.000) in visible light, the oxamyl removal steadily increased from 67% to 93% and 73% to 99%, respectively. At 259 min, qe improved to 22.3 mg g−1 (r 0.836, p 0.0002) and 9.5 mg g−1 (r 0.858, p 0.000) in dark and visible light, respectively.
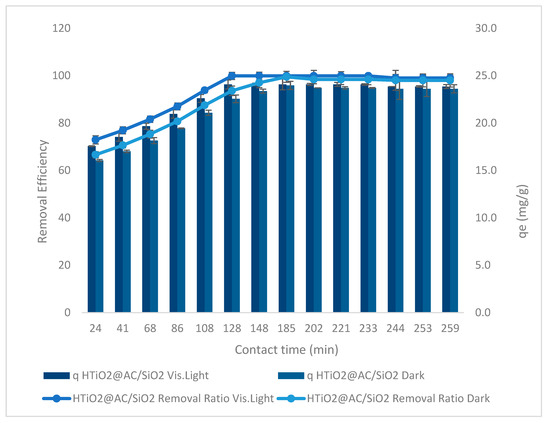
Figure 11.
Contact time versus oxamyl removal effectiveness using HTiO2@AC/SiO2 in visible light and in the dark.
Even after conducting the batch experiment for 259 min, an increase in contact time had a significant (p ˂ 0.05) influence on adsorption, indicating that the contact time is important. Several factors contribute to this prolonged equilibrium period. These factors include: (i) the adsorbate diffuses from the particle surface to the active site within the pore-filled liquid and then migrates along the solid surface of the pore, (ii) the oxamyl molecule adsorbs on the active sites of the pores’ interior surface, and (iii) a rapid uptake of oxamyl was observed during the adsorption process. A rapid oxamyl absorption was seen during adsorption, and a slower oxamyl elimination was followed.
Depending on the number of binding sites on the adsorbent surface and the resistance of aggregated oxamyl molecules on the surface, we could interpret the faster and slower phases of pesticide adsorption [24]. Oxamyl solutions with initial concentrations of 20 mg L−1 were found to take 200 min to establish equilibrium, according to the findings. Based on the results of this experiment, the amount of oxamyl adsorbed onto the activated carbon grew with time until it reached a fixed value, beyond which no more oxamyl could be removed from the solution.
2.3. Models Studies
The oxamyl adsorption rate was examined at the initial oxamyl concentration of 20 mg L−1, at an optimal pH, and optimal adsorbent dosage, at varied time intervals for 200 min. Isotherm, kinetic, and diffusion models described oxamyl adsorption by HTiO2@AC/SiO2 [25].
2.3.1. Isothermal Model
According to adsorption isotherms, a substance’s absorption rate is proportional to its concentration. Four isotherm models, including the Langmuir, Freundlich, Dubinin–Radushkevich, and Tempkin isotherms were used to investigate the capacity and equilibrium parameters of oxamyl adsorption by HTiO2@AC/SiO2 [25].
2.3.2. Langmuir Isotherm
The coefficients of determination (R2) for oxamyl were 0.993, 0.989, 0.307, 0.307, 0.983, and 0.309 for linear and 0.997, and 0.759 for nonlinear, as illustrated in Table 1. It was revealed that the oxamyl adsorption by for HTiO2@AC/SiO2-Dark and HTiO2@AC/SiO2-Light, respectively, sound suited with the Langmuir nonlinear model, but we cannot say the same for the linear. The qo (mg g−1) values were about 290.654 and 264.214 for linear 312.762 and 966,708.048 for nonlinear, and the KL (L mg−1) values were about 0.047 and 0.007 for linear, 0.030 and 1.02182 × 10⁻⁶ for nonlinear for oxamyl.

Table 1.
Isothermal model.
Material efficiency is demonstrated by qm, while KL represents the nature of the adsorption process using HTiO2@AC/SiO2-Dark and HTiO2@AC/SiO2-Light. The Langmuir isotherm describes the monolayer adsorption of Oxamyl on the adsorbent surface at the functional groups/relative locations. The adsorbed layer appears thick in one molecule [26,27]. Oxamyl did not adequately obey Langmuir’s model.
The key features of the Langmuir isotherm can be expressed in terms of a dimensionless factor (RL) as:
Table 1 displays coefficients of the isotherm study (Langmuir model) for oxamyl adsorption using HTiO2@AC/SiO2-Dark and HTiO2@AC/SiO2-light, respectively (at a room temperature of 25.00 ± 3.00 °C). Oxamyl’s coefficient of determination (R2 = 0.76) was low, confirming that the Langmuir model did not work well for HTiO2@AC/SiO2-Light, while R2 = 0.99 was high, ensuring that the Langmuir model was favorable for HTiO2@AC/SiO2-Dark.
2.3.3. Freundlich Isotherm
The Freundlich model denotes multilayer adsorption on a heterogeneous surface with adsorption sites. The smaller the value of 1/n (~zero), the more heterogeneous the adsorption surface.
According to the linear Freundlich model, the R2 values for oxamyl were 0.974, 0.984, 0.881, 0.994, and 0.882, suggesting that the linear model adequately described the oxamyl adsorption. The values of KF were 30.035 and 4.925 mg g−1 and the values of n were 2.282 and 1.504 L−1 g for HTiO2@AC/SiO2-Dark and HTiO2@AC/SiO2-Light, respectively. The R2 values for the nonlinear Freundlich model, as shown in Table 1, were 0.986 and 0.924 for HTiO2@AC/SiO2-Dark and HTiO2@AC/SiO2-Light, respectively, suggesting that the nonlinear model could also capture the relationship between the quantity of oxamyl adsorbed by the HTiO2@AC/SiO2 and its equilibrium concentration in the solution. The values of KF were 39.056 and 4.46985 × 10⁻⁶ mg g−1 and the values of n were 2.654 and 0.297 L−1 g for HTiO2@AC/SiO2-Dark and HTiO2@AC/SiO2-Light, respectively. In this study, the 1/n values ranged between 0.00 and 1.00, suggesting that oxamyl adsorption by AC/SiO2, HTiO2, and HTiO2@AC/SiO2 biomass was beneficial under the conditions examined. This could be related to the distribution of functional surface sites or other variables, such as decreased adsorbent–adsorbate interactions with increasing surface density in the case of 1/n < 1.00. Because the Freundlich model considers that adsorption can occur in numerous layers, saturation is not expected to occur. In Equation (2), KF is an index of adsorption capacity, and n is the Freundlich constant (index of adsorption intensity or surface heterogeneity). The constants 1/n and k play a significant role in defining the adsorption capacity of the adsorbent for oxamyl reduction. The slope 1/n depends on the order of the decrease in oxamyl concentrations with the adsorbent dose. At the same time, KF is dependent on the extent of oxamyl removal by the adsorbent.
Hui Li et al. [29] studied the adsorptive capabilities of polyethylene microplastics (PE) in an aqueous solution in three pesticides (Imidacloprid, Buprofezin, Difenoconazole). The adsorbed (Imidacloprid, Buprofezin) experimental data of Imidacloprid, Buprofezin, and Difenoconazole on polyethylene follow the Freundlich adsorption isotherms. The adsorption isotherms for the Freundlich model coefficients, KF, n, and R2 were 0.4234, 3.113, and 0.9566, 0.4441, 3.804, and 0.9940, and 0.3796, 3.082, and 0.9509, respectively, exploring the higher monolayer adsorption for AC-Dark, AC-Light, HTiO2-Dark, HTiO2-Light, HTiO2@AC/SiO2-Dark, and HTiO2@AC/SiO2-Light.
Table 1 shows the values of the corresponding isotherm parameters and the correlation coefficients (R2) for each parameter. Table 1 shows that fitting the experimental data to the Langmuir isotherm model yields strong R2 values of 0.997, 0.759, 0.983, and 0.309 for the linear model for HTiO2@AC/SiO2-Dark and HTiO2@AC/SiO2-Light, respectively. In the case of HTiO2@AC/SiO2-Dark, the R2 is higher than 0.99.
The nonlinear Freundlich isotherm model values were 0.986, 0.924, and for the linear model were 0.994, 0.882, for HTiO2@AC/SiO2-Dark and HTiO2@AC/SiO2-Light, respectively. R2 > 0.92 for HTiO2@AC/SiO2-Light and the nonlinear Tempkin R2 values were 0.931 and 0.599 and the linear values were 0.931 and 0.599. The Dubinin–Radushkevich R2 for the nonlinear model was 0.577 and, for the linear, 0.865 and 0.751 for HTiO2@AC/SiO2-Dark and HTiO2@AC/SiO2-Light, respectively.
These findings demonstrate that while the Freundlich and nonlinear Langmuir isotherm models can accurately reproduce experimental data, the linear Langmuir, Dubinin–Radushkevich, and Tempkin isotherm models cannot.
The Langmuir model computed a maximum adsorption capacity of 312.762 mg oxamyl/g for HTiO2@AC/SiO2-Dark and 966,708.048 mg oxamyl/g for HTiO2@AC/SiO2-Light, respectively. These values are consistent with the reported adsorbed amounts and nearly match the adsorption isotherm plateau, showing that both Freundlich and Langmuir’s nonlinear models of the adsorption system are valid. Additionally, the experimental system’s adsorption mechanism could be due to monolayer adsorption.
The Dubinin-Radushkevich and Tempkin model states that the nonlinear regression theoretical monolayer capacity values are lower than the experimental quantities corresponding to the adsorption plateau, showing that the Dubinin-Radushkevich and Tempkin adsorption system is unsuitable. In contrast, Freundlich > Langmuir > Tempkin > Dubinin-Radushkevich, therefore, best matches the range of the isotherm for the experimental data in this work.
2.3.4. Kinetic and Diffusion Models
Kinetic models depict pollutants’ interacting molecules or ions with active surfaces (pseudo-first-order, pseudo-second-order). These models do not consider diffusion; however, it is widely known that intraparticle diffusion can alter kinetic data [29]. The models (film, pore, and intraparticle diffusion) imply an instantaneous interaction between pollutants and active sites relative to diffusion steps, hence regulating overall diffusion rates [30]. The applicability of adsorption kinetics with pseudo-first and second-order models and diffusion models was investigated [31]. The following sections provide brief descriptions of these models (for more details, refer to Supplementary S1).
2.3.5. The Pseudo-First-Order Kinetic Model
The calculated qe value of the pseudo-first-order model was consistent with the experimental results, as shown in Table 2. In addition, a correlation with the pseudo-first-order model was R2 = 0, 0.926 and 0.886 for linear and R2 = 0.730 and 0.959 for nonlinear for HTiO2-Light, HTiO2@AC/SiO2-Dark and HTiO2@AC/SiO2-Light respectively. Therefore, the pseudo-first-order model is suitable for the kinetic adsorption in linear form for HTiO2@AC/SiO2-Dark and nonlinear for HTiO2@AC/SiO2-light.

Table 2.
Biosorption kinetics.
2.3.6. The Pseudo-Second-Order Model
The calculated data for the pseudo-second-order model was qe (24.138, 14.197 nonlinear, 25.853, 13.925 linear) mg g−1, as indicated in Table 2. In addition, the linear model achieved R2 = 0.992 and 0.858 and nonlinear 0.844 and 0.938 for HTiO2@AC/SiO2-Dark and HTiO2@AC/SiO2-Light, respectively. This means that oxamyl adsorption matched the pseudo-second-order kinetics. The rate-limiting stage refers to chemical sorption when pollutant cations adsorb the adsorbent surface through chemical bonding (typically covalent) and tend to choose locations that maximize their coordination with the surface.
2.3.7. Intraparticle Diffusion Model
The aforementioned dynamic models do not distinguish between the diffusion systems and the rates that control the adsorption. The dispersion of the intraparticle was demonstrated in light of the hypotheses suggested by Weber and Morris, which shows adsorption shapes. The adsorption rate is based on the adsorbate’s rate of diffusing to the adsorbent [25]. The amount of oxamyl adsorbed versus t1/2 for linear, t for nonlinear for different initial oxamyl loads is illustrated in Table 3. The model achieves R2 = 0.793 and 0.931 for HTiO2@AC/SiO2-Dark and HTiO2@AC/SiO2-Light, respectively, which does not fit the experimental data well.

Table 3.
Diffusion model.
As previously stated, the adsorption mechanism for removing oxamyl via an adsorption process involves the following four steps: (i) bulk diffusion, (ii) film diffusion, (iii) pore or intraparticle diffusion, and (iv) pollutant adsorption on the sorbent surface.
It has been demonstrated in the literature that the first step can be “ignored” if the stirring speed is sufficient. The first segment of an intraparticle diffusion plot demonstrates the presence of a boundary layer during the earliest stages of adsorption. The second segment of the linear curve represents the progressive adsorption stage, during which intraparticle diffusion is the rate-limiting factor. In some situations, a third portion exists, which is the final equilibrium stage. In this stage, intraparticle diffusion slows down due to the extremely low adsorbate concentrations, which remain in the solutions. Kid and C were determined using the second linear segment. The computed intraparticle diffusion parameters for the adsorption process are shown in Table 3. A linear relationship existed for a period of time, but it did not pass through the origin. It showed that intraparticle diffusion was present but was not the only rate-controlling mechanism and that another mechanism could be involved [26,29].
The rates of intra-particle diffusion, kid, are determined by the slopes of the lines in stage 2 (Table 3). With the experimental adsorption setup, the maximum value of kid for oxamyl is 5.836 mg g−1 min−1/2. As shown in Table 3, the intercepts, C, positively correlated with the boundary layer effect, are likewise derived from the second linear component of the qt vs. t1/2 plots. The deviations of the linear parts of the qt vs. t1/2 plots near the origin caused by HTiO2@AC/SiO2-Dark and HTiO2@AC/SiO2-Light adsorbents are noticeable. It can be concluded that the mechanism of oxamyl adsorption on HTiO2@AC/SiO2-Dark and HTiO2@AC/SiO2-Light is complex and that the adsorption process is not simply regulated by the intra-particle diffusion step [29].
Film diffusion and poring diffusion were suggested to learn more about the mechanism and the rate control processes impacting the adsorption kinetics. The equation of film diffusion may be represented as [3]:
A (μm) is the average HTiO2@AC/SiO2 radius, and D1 is the film diffusion coefficient (μm2 S−1).
The pattern in oxamyl plots of qt/qe vs. t0.5 is consistent with diffusion, containing three portions. The diffusion of oxamyl from the exterior surface of HTiO2@AC/SiO2 via the boundary layer reveals a dominating control. By comparing the pore diffusion model, we can characterize the adsorption kinetics. Reichenberg formulated the equation of pore diffusion as follows [30]:
The square root of time (t0.5) represents the fractional absorption of oxamyl (qt/qe). The plots of the fractional uptake of oxamyl vs. t0.5 for HTiO2@AC/SiO2 showed plots with sections reflecting an early uptake. The pattern of oxamyl ion absorption into pores was similar to that of intraparticle diffusion, with a rapid initial stage followed by a slow final adsorption stage. The oxamyl adsorption film diffusion (D1) in the HTiO2@AC/SiO2 is calculated on the slopes of the qt/qe plots against t0.5 and displayed in Table 3. Causes for the greater D1 value for HTiO2@AC/SiO2 are suggested: for example, repulsion from the positively charged oxamyl generated by the HTiO2@AC/SiO2/oxamyl system as it crosses the liquid layer pH-positioned adsorbent surface and roughness on the surface of the adsorbent. In the film diffusion coefficient of the 10−6–10−8 cm2 s−1 range, Michelson et al. [32] showed that film diffusion plays a role in adsorption. In our investigation, the magnitude of the film diffusion coefficient for HTiO2@AC/SiO2 ranged between 10−7, indicating that film diffusion was active throughout the oxamyl adsorption process on HTiO2@AC/SiO2. The following equation [33] can be used to compute the effective pore diffusion coefficient, D2 (m2 S−1)
In an ideal linear circumstance (Bt vs. t plot), the porosity control defines the mass transfer rate while passing through the original fit. Therefore, the conclusion can be that the film diagram or chemical reaction also regulates the adsorption rate. The plot is nonlinear or linear only when the intercept differs from zero. As shown in Table 3, the Bt vs. t curves for oxamyl adsorption were initially unpassed and exhibited a nonlinear segment at short adsorption times, corroborating the previous statements that film dispersion or chemical reaction controls adsorption during that time [21,31,32].
The present study’s findings were consistent with those of [34], who studied the adsorption of dichlorodiphenyltrichloroethane pesticide (DDT) onto the zeolite surface in an aqueous solution at various DDT concentrations ranging from 5 to 50 mg L−1 using 0.1, 0.5, 0.8, and 1.2 g of zeolite. The result demonstrates that the pseudo-second-order model best fits the experiments in terms of kinetic and diffusion models of adsorption. Zeolite follows the pseudo-first-order (R2 = 0.997) model, widely recognized for data fitting. As a result, the pseudo-first-order model can be used to describe DDT adsorption on zeolite, even though DDT adsorption on zeolite is not a first-order reaction. The fictitious second-order (R2 = 0.995); the results indicate that the pseudo-second-order model fits the experimental data reasonably well. The R2 values have converged to unity, indicating that the experimental and theoretical uptakes concur well. This demonstrates the second-order kinetic model’s suitability for describing the adsorption of DDT onto zeolite. Intra-particle models (R2 = 0.866, K1 = 0.448 kg mg−1 h−0.5, C = 0.826) indicate that intraparticle diffusion is not the rate-limiting phase in the DDT adsorption mechanism on the zeolite surface. These findings indicate that physical adsorption was the major mode of action for activated carbon. Physical adsorption is the chemical bonding of a non-polar adsorbate to a relatively wide surface area due to macropores, mesopores, and micropores. The linear least-squares regression approach and the trial-and-error nonlinear regression method in Microsoft Excel were used to obtain the kinetic isotherm parameters. In the nonlinear method, the “solver add-in” in Microsoft Excel was used to determine the pseudo-first- and pseudo-second-order kinetic parameters by trial-and-error. The experimental data for the sorption of oxamyl utilizing HTiO2@AC/SiO2-Dark and HTiO2@AC/SiO2-Light were compared to the pseudo-first-order and pseudo-second kinetic models derived by the nonlinear technique.
2.4. Thermodynamic Study
The thermodynamic parameters such as enthalpy change (ΔH), entropy change (ΔS), and Gibbs free energy change (ΔG) were calculated using Equation (6), which is the integrated form of the Van ’t Hoff equation.
where Ke represents equilibrium constants (derived by Ke = (Co\Ce)/Ce) [15], i.e., ΔS changes entropies (kJ/K/mol), i.e., ΔH changes enthalpy (kJ/mol), i.e., ΔG changes in free energy from Gibb (kJ/mol). R is a universal gas constant (8.314−10−3 kJ/mol/K), and T the absolute temperature (K). The free energy change for Gibbs (ΔG) can be estimated with Equation (7):
To determine the thermodynamic parameters provided in Table 4, the formulas in Equations (6)–(8) were used. The results are shown in the following Table: ΔG, ΔH, and ΔS. The negative G value indicates that the procedure is feasible and that the adsorption of oxamyl onto HTiO2@AC/SiO2 is a spontaneous process. With an increase in temperature, the absolute value of ΔG increases, showing that the adsorption at a higher temperature is more conducive to an endothermic procedure. Temperature increases the percentage of oxamyl that is removed from the water. Additionally, a negative value for ΔH implies that the adsorption of oxamyl onto HTiO2@AC/SiO2 is exothermal. Negative ΔS indicates that the system’s randomness decreases at the solid–liquid interface during adsorption. The results are consistent with an oxamyl and lead adsorption study onto polyaniline-grafted cross-linked chitosan beads (GXCS) [23].

Table 4.
The Thermodynamic model.
2.5. Reusing of the Photocatalytic Materials
Under optimized conditions, repeated degradation experiments were performed to study the proposed photocatalysts’ reusability. At the end of the degradation process, the suspension was centrifuged, and the catalyst was washed with water and dried at 110 °C for future uses (Figure 12). The decrease in degradation efficiency is not significant for the supported HTiO2@AC/SiO2 and HTiO2 materials, HTiO2@AC/SiO2 and HTiO2, whereas, for the nonsupported titania powder, HTiO2, the decrease in activity is noticeable with a slight reduction in the COD value to 80 from 100 mg/L. These results prove the positive effect of using a porous HTiO2@AC/SiO2, resulting in higher photocatalytic activity, enhancing the proposed materials’ stability, and reducing the TOC value to be near 2 mg/L in all seven cycles.
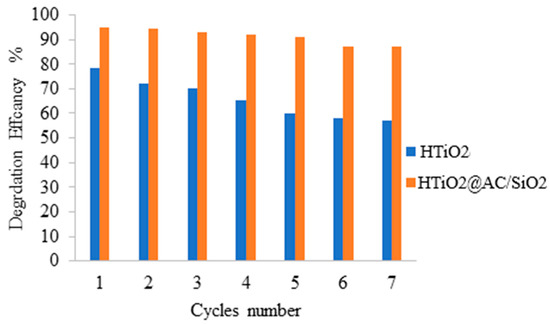
Figure 12.
Oxamyl degradation by repeated use of the prepared photocatalysts (initial concentration of oxamyl = 100 mg, photocatalyst amount = 18 mg, and irradiation time = 60 min).
3. Materials and Methods
3.1. Materials
Oxamyl of analytical grade was purchased from The National Company for Fertilizers and Chemicals (Agrochem, Saratoga Springs, NY, USA). From Sigma-Aldrich (St. Louis, MO, USA), we obtained hydroxide (NH4OH), titanium hydroxide (Ti(OH)4), titanium tetrachloride (TiCl4), HCl, and NaOH. The rice straw samples were collected from a local farm. Oxamyl of analytical grade was serially diluted in dual distilled water without modifying the pH. This stock solution was used throughout the present study for all experiments and chemical analyses.
3.2. Synthesis of Activated Carbon Silica Composite from Rice Straw
Rice straw samples were collected from a local farm. The rice straw was cut into small pieces, washed, and dried at 110 °C for 24 h. Rice straw material with moisture content lower than 5% was selected for further experiment. The rice straw material was ground and sieved to collect size 60 mesh particles. All solvents and chemicals used were either high-performance liquid chromatography (HPLC) grade or analytical grade and were purchased commercially from Sigma-Aldrich Corporation (St. Louis, MO, USA).
3.3. Carbonization Step
The highest lignin content was selected to go on to the carbonization step. The rice straw material was carbonized at 500 °C in a furnace for 3 h. After carbonization, the obtained activated carbon/amorphous silica (AC/SiO2) was cooled down to room temperature in a desiccator before being investigated for Oxamyl adsorption.
3.4. Activation Step
Carbonization and activation are two stages in activated carbon production. Carbonization occurs at 450 to 600 °C temperatures in an anoxic environment (often molecular nitrogen). The source material degrades into hydrocarbon molecules and carbonaceous byproducts. The most volatile chemicals are eliminated as gaseous byproducts. Because high-enough porosity for most applications has not yet been achieved, the porosity of the carbon generated during the carbonization stage should be enhanced further. Activated carbons can be created through either physical or chemical activation. Physical activation is normally carried out at temperatures ranging from 700 to 900 °C using carbon dioxide or steam (water vapor). Dehydrating agents, such as zinc chloride or phosphoric acid, are the most frequent compounds used in chemical activation. Furthermore, alkali metal salts, hydroxides, and carbonates of potassium and sodium, to name a few, are commonly employed. However, variable mixtures of these two can be used in the preparation procedure [35].
The activation step was performed by reflux using 85% H3PO4 and 85% KOH as an activating agent in refluxing ratios of 1:8 and 1:20 w/v at 100 °C for 3 h. Then, the obtained AC/SiO2 samples were washed with hot water to remove residual acid and base. The neutral AC/SiO2 samples were then dried at 110 °C for 24 h and cooled in a desiccator. The AC/SiO2 sample was measured for Oxamyl adsorption.
3.5. Synthesis of Nanocomposite HTiO2@AC/SiO2
The sol-gel technique was used to prepare the HTiO2@AC/SiO2 composite: 10 mL of titanium tetrachloride (TiCl4) was slowly dropped into 14 mL of deionized water at 4 ± 1 °C with continuous stirring. Titanium hydroxide (Ti(OH)4) solution or sol was obtained. Various amounts of activated charcoal (0, 5, 10, 20, 25, and 30 wt% of AC) were added to the sol. A droplet of 30% v/v of ammonium hydroxide (NH4OH) was continuously added until the gel was formed. The gel was then washed with distilled water and dried in the oven at 100 °C for 4 h. The dried gel of TiO2 and HTiO2@AC/SiO2 was heated in a nitrogen atmosphere to 500 °C at a heating rate of 10 °C min−1. The sample was dried for a further 4 h at 500 °C. However, a slight decomposition—about 5%—of AC was observed at 500 °C. This value was acceptable for using AC as a support for the catalyst [11].
3.6. Photocatalytic Activity
The photocatalytic activity of the composite catalyst (HTiO2@AC/SiO2) was assessed by determining oxamyl degradation in an aqueous solution under solar light irradiation. Oxamyl concentrations were quantified through photospectrometry (JASCO 7800) at 270 nm, a cost-effective but suitable approach. Absorbance changes over time were transferred to oxamyl concentrations (C/Co) [15] using standard oxamyl at 100 mgL−1 in distilled water, and its serial dilution is a calibration curve. Before being exposed to sunlight, 200 mL of the oxamyl solution and 0.4 g of the catalyst were stirred for 1 h in darkness at 30 °C. Subsequently, this mixture was exposed to sunlight for 3 h, with samples for pesticide analyses being taken every 30 min [16].
3.7. Characterization Tools
The morphology and homogeneity of the powder samples were examined using scanning electron microscopy (SEM, Quanta 450 FEG, FEI Company, North Brabant, The Netherlands). At a working distance of five millimeters and a magnification of one hundred thousand times, images were captured using a secondary electron detector and a 5 kV electron beam. The Energy Dispersive Spectroscopy (EDS) analyzer KEVEX Si (Li) Brüker was used to determine the chemical composition of powder particles. X-ray diffraction powder (a Bruker D8-Advance, Billerica, MA, USA) and Transmission Electron Microscopy (TEM, model JEM-200CX (JEOL 2100, JEOL, Tokyo, Japan) were used to study the crystal structure and morphology of the HTiO2@AC/SiO2 composite. The experiment was conducted using a Bruker model D8 advanced X-ray diffractometer with a Cu K anode (λ = 1.5418 Å). At room temperature, samples were taken at a rate of 1 s/point in the range 2θ = 20–70 with a 0.02° step (E2).
After sputtering an Au/Pd layer on the samples, SEM-EDX data was acquired using a JEOL JSM-5500LV scanning electron microscope. The average EDX values (excluding the sputtered layer) were computed from 6 measurement points on each sample. The TEM images were captured using an FEI Morgagni 268 transmission electron microscope set to 300 keV. Before the measurements, the materials were dispersed in EtOH before being dropped on Cu grids and coated with a Formvar coating of 10 nm thickness.
Nitrogen adsorption–desorption isotherms were measured at −196 °C (Fisons Sorptomatic 1990) after outgassing (10−5 Pa) for 24 h at ambient temperature. The specific surface area, SBET, was determined according to the Brunauer-Emmett-Teller (BET) method at the relative pressure, p/p0, in the range of 0.05–0.1. The Chemical Oxygen Demand (COD) was determined using the reactor digestion method based on acidic oxidation by bichromate.
3.8. Adsorption Activity
500 mL of oxamyl at a concentration of 300 mg L−1 was added to 600 mL Erlenmeyer flasks, mixed with 50 mg HTiO2@AC/SiO2 L−1, and agitated at 220 rpm on an orbital shaker at 310 K. At predefined time intervals (every 20 min), 50 mL water samples were taken for oxamyl quantification. The adsorbent’s equilibrium time was determined considering variable parameters that may influence performance: pH, initial oxamyl concentration, temperature, stirring, and composite concentration. A critical factor affecting adsorption is the pH, which may modify the surface charge of the adsorbent with consequences for pesticide removal [33,36,37]. To quantify the impact of pH, this parameter was actively modified using HCl and NaOH to values of 1.3, 4, 5, 6, 7, 8, and 9. Adsorption also depends on the temperature. Consequently, this factor was modified ranging from 310 to 373 K to quantify its impact on oxamyl removal by the composite. At a constant adsorbent dose, pH, and temperature, different pesticide concentrations (19, 30, 50, 70, 100, 150, 200, 250, 300, and 401 mg L−1) were employed to determine the pesticide removal efficiency and capacity of the composite. At equilibrium time, the effect of various adsorbent doses (18 to 83 mg L−1) was investigated, while the oxamyl concentration, pH, and temperature remained constant with the best conditions obtained from the experiments. In general, each sample was fixed to 50 mL water samples (50 mg) added to 25 mL of various pesticide concentrations (50–500 mg L−1), and each sample was shaken for 4–6 h to ensure the equilibrium of the adsorption by each adsorbent, which varied between 1–3 h. The sample was extracted, and the pesticide content was determined using a UV-Vis spectrophotometer (JENWAY 6715, Shimadzu, Columbia, MD, USA) set to 270 nm [17]. An Erlenmeyer flask with the same pesticide concentration but without HTiO2@AC/SiO2 was used as a blank. During the experiment, air was continuously bubbled into the catalyst suspension. The suspension was magnetically stirred in the dark for at least 60 min before irradiation to establish an adsorption/desorption equilibrium.
The adsorption capacity qe (mg g−1) of the pesticides and the removal effectiveness R (%) of the composite were determined using Equations (9) and (10), respectively:
Adsorption Capacity:
Removal efficiency [38,39]:
Co represents the initial concentration of the pesticide solutions, and Ce represents the final concentration (in milligrams per liter of solution). The adsorbate solution volume is represented by V (L). The variables represent the dry adsorbent mass W (g). The pH of the solution was adjusted with the appropriate amounts of 0.1 M HCL and/or 0.1 N NaOH before adding the adsorbent. Kinetic experiments were compared to equilibrium investigations to see which was better. For the pesticide concentrations, different aqueous sample collection durations were used.
4. Conclusions
Batch processing was used to investigate oxamyl degradation in aqueous solutions using HTiO2@AC/SiO2. The results demonstrate the effect of experimental variables on the capacity of oxamyl adsorption, such as adsorbent dosages, pH values, temperature, pesticide concentration, and contact time. At pH = 2.4, the maximal oxamyl adsorption capacity was 312.762 mg g−1. Based on the correlation coefficient (R2 = 0.997, 0.994), experimental data at equilibrium demonstrates that it is compatible with the Langmuir and Freundlich isotherms, respectively. The adsorption kinetics indicated that the pseudo-second-order linear model is best described during adsorption. The oxamyl desorption investigations have shown the favorable potential of HTiO2@AC/SiO2 adsorbent regeneration and reuse, the adsorbent utilized in this work having several prospective commercial benefits in the future. The results have shown that HTiO2@AC/SiO2 is economically attractive for wastewater treatment. HTiO2@AC/SiO2 has been shown to have excellent adsorption performance with high and low oxamyl levels, simple pre-treatment of the adsorbent material, and ease and high desorption and sorption capacity regeneration feasibility. Based on the experimental results, nano HTiO2@AC/SiO2 composites will contribute to future usage as an adsorbent material to degrade different types of pesticides.
Supplementary Materials
The following supporting information can be downloaded at: https://www.mdpi.com/article/10.3390/catal12020163/s1, Table S1: Biosorption kinetics, Table S2: Diffusion model.
Author Contributions
Conceptualization, A.E.M., M.F.M. and A.E.S.; methodology, A.E.M., M.F.M. and A.E.S.; software, A.H.R., D.M.D.B. and I.A.A.; validation, A.E.M., M.F.M. and A.E.S.; formal analysis, A.H.R., D.M.D.B. and I.A.A.; investigation, A.E.S., M.F.M. and A.E.M.; resources, A.H.R., D.M.D.B. and I.A.A.; data curation, A.E.M., M.F.M. and A.E.S.; writing—original draft preparation, A.E.M., M.F.M. and A.E.S.; writing—review and editing, A.E.S., M.F.M. and A.E.M.; visualization, D.M.D.B. and A.H.R.; supervision, A.E.S. and M.F.M., project administration, A.E.S. and M.F.M.; funding acquisition, A.H.R., D.M.D.B. and I.A.A. All authors have read and agreed to the published version of the manuscript.
Funding
This research was assisted funded by the Dean of Science and Research at King Khalid University via the General Research Project: Grant no. (R.G.P.1/355/42).
Acknowledgments
The authors would like to express their gratitude to the Dean of Science and Research at King Khalid University for giving financial support.
Conflicts of Interest
The authors state that they do not have any conflicts.
References
- Yang, Y.; Chen, C.; Sun, H. LiVPO4F@C particles anchored on boron-doped graphene sheets with outstanding Li+ storage performance for high-voltage Li-ion battery. Solid State Ion. 2019, 331, 6–11. [Google Scholar] [CrossRef]
- Aktar, M.W.; Sengupta, D.; Chowdhury, A. Impact of pesticides use in agriculture: Their benefits and hazards. Interdiscip. Toxicol. 2009, 2, 1–12. [Google Scholar] [CrossRef] [Green Version]
- Challis, J.K.; Cuscito, L.D.; Joudan, S.; Luong, K.H.; Knapp, C.W.; Hanson, M.L.; Wong, C.S. Inputs, source apportionment, and transboundary transport of pesticides and other polar organic contaminants along the lower Red River, Manitoba, Canada. Sci. Total Environ. 2018, 635, 803–816. [Google Scholar] [CrossRef] [Green Version]
- Posthuma, L.; Zijp, M.C.; De Zwart, D.; Van de Meent, D.; Globevnik, L.; Koprivsek, M.; Focks, A.; Van Gils, J.; Birk, S. Chemical pollution imposes limitations to the ecological status of European surface waters. Sci. Rep. 2020, 10, 14825. [Google Scholar] [CrossRef]
- Morrissey, C.A.; Mineau, P.; Devries, J.H.; Sanchez-Bayo, F.; Liess, M.; Cavallaro, M.C.; Liber, K. Neonicotinoid contamination of global surface waters and associated risk to aquatic invertebrates: A review. Environ. Int. 2015, 74, 291–303. [Google Scholar] [CrossRef]
- Zhang, S.; Jiao, Z.; Zhao, X.; Sun, M.; Feng, X. Environmental exposure to 17β-trenbolone during adolescence inhibits social interaction in male mice. Environ. Pollut. 2021, 289, 117710. [Google Scholar] [CrossRef]
- Ali, H.; Khan, E.; Ilahi, I. Environmental Chemistry and Ecotoxicology of Hazardous Heavy Metals: Environmental Persistence, Toxicity, and Bioaccumulation. J. Chem. 2019, 2019, 6730305. [Google Scholar] [CrossRef] [Green Version]
- Trojanowicz, M. Removal of persistent organic pollutants (POPs) from waters and wastewaters by the use of ionizing radiation. Sci. Total Environ. 2020, 718, 134425. [Google Scholar] [CrossRef]
- Bel Hadjltaief, H.; Omri, A.; Ben Zina, M.; Da Costa, P.; Galvez, M.E. Titanium Dioxide Supported on Different Porous Materials as Photocatalyst for the Degradation of Methyl Green in Wastewaters. Adv. Mater. Sci. Eng. 2015, 2015, 1–10. [Google Scholar] [CrossRef] [Green Version]
- Dutt, M.A.; Hanif, M.A.; Nadeem, F.; Bhatti, H.N. A review of advances in engineered composite materials popular for wastewater treatment. J. Environ. Chem. Eng. 2020, 8, 104073. [Google Scholar] [CrossRef]
- Szczepanik, B.; Rogala, P.; Słomkiewicz, P.M.; Banaś, D.; Kubala-Kukuś, A.; Stabrawa, I. Synthesis, characterization and photocatalytic activity of TiO2-halloysite and Fe2O3-halloysite nanocomposites for photodegradation of chloroanilines in water. Appl. Clay Sci. 2017, 149, 118–126. [Google Scholar] [CrossRef]
- Etacheri, V.; Di Valentin, C.; Schneider, J.; Bahnemann, D.; Pillai, S.C. Visible-light activation of TiO2 photocatalysts: Advances in theory and experiments. J. Photochem. Photobiol. C Photochem. Rev. 2015, 25, 1–29. [Google Scholar] [CrossRef] [Green Version]
- Lu, L.; Shan, R.; Shi, Y.; Wang, S.; Yuan, H. A novel TiO2/biochar composite catalysts for photocatalytic degradation of methyl orange. Chemosphere 2019, 222, 391–398. [Google Scholar] [CrossRef]
- Pinna, M.; Binda, G.; Altomare, M.; Marelli, M.; Dossi, C.; Monticelli, D.; Spanu, D.; Recchia, S. Biochar Nanoparticles over TiO2 Nanotube Arrays: A Green Co-Catalyst to Boost the Photocatalytic Degradation of Organic Pollutants. Catalysts 2021, 11, 1048. [Google Scholar] [CrossRef]
- Pastrana-Martínez, L.; López-Ramón, M.; Moreno-Castilla, C. Adsorption and thermal desorption of the herbicide fluroxypyr on activated carbon fibers and cloth at different pH values. J. Colloid Interface Sci. 2009, 331, 2–7. [Google Scholar] [CrossRef] [PubMed]
- Rao, A.; Kumar, A.; Dhodapkar, R.; Pal, S. Adsorption of five emerging contaminants on activated carbon from aqueous medium: Kinetic characteristics and computational modeling for plausible mechanism. Environ. Sci. Pollut. Res. 2021, 28, 21347–21358. [Google Scholar] [CrossRef]
- Derylo-Marczewska, A.; Blachnio, M.; Marczewski, A.W.; Seczkowska, M.; Tarasiuk, B. Phenoxyacid pesticide adsorption on activated carbon–Equilibrium and kinetics. Chemosphere 2019, 214, 349–360. [Google Scholar] [CrossRef]
- Mohammad, S.G.; Ahmed, S.M. Preparation of environmentally friendly activated carbon for removal of pesticide from aqueous media. Int. J. Ind. Chem. 2017, 8, 121–132. [Google Scholar] [CrossRef] [Green Version]
- Kaur, Y.; Bhatia, Y.; Chaudhary, S.; Chaudhary, G.R. Comparative performance of bare and functionalize ZnO nanoadsorbents for pesticide removal from aqueous solution. J. Mol. Liq. 2017, 234, 94–103. [Google Scholar] [CrossRef]
- Farghali, R.A.; Sobhi, M.; Gaber, S.E.; Ibrahim, H.; Elshehy, E.A. Adsorption of organochlorine pesticides on modified porous Al30/bentonite: Kinetic and thermodynamic studies. Arab. J. Chem. 2020, 13, 6730–6740. [Google Scholar] [CrossRef]
- Vishnu Priyan, V.; Shahnaz, T.; Suganya, E.; Sivaprakasam, S.; Narayanasamy, S. Ecotoxicological assessment of micropollutant Diclofenac biosorption on magnetic sawdust: Phyto, Microbial and Fish toxicity studies. J. Hazard. Mater. 2021, 403, 123532. [Google Scholar] [CrossRef] [PubMed]
- Ferreira da Silva, A.J.; Paiva de Alencar Moura, M.C.; da Silva Santos, E.; Saraiva Pereira, J.E.; Lins de Barros Neto, E. Copper removal using carnauba straw powder: Equilibrium, kinetics, and thermodynamic studies. J. Environ. Chem. Eng. 2018, 6, 6828–6835. [Google Scholar] [CrossRef]
- Wang, X.Q.; Liu, J.; Zhang, N.; Yang, H. Adsorption, mobility, biotic and abiotic metabolism and degradation of pesticide exianliumi in three types of farmland. Chemosphere 2020, 254, 126741. [Google Scholar] [CrossRef] [PubMed]
- Wang, Y.; Lin, C.; Liu, X.; Ren, W.; Huang, X.; He, M.; Ouyang, W. Efficient removal of acetochlor pesticide from water using magnetic activated carbon: Adsorption performance, mechanism, and regeneration exploration. Sci. Total Environ. 2021, 778, 146353. [Google Scholar] [CrossRef] [PubMed]
- Gacem, M.A.; Telli, A.; Ould El Hadj Khelil, A. Chapter 15—Nanomaterials for detection, degradation, and adsorption of pesticides from water and wastewater. In Aquananotechnology; Abd-Elsalam, K.A., Zahid, M., Eds.; Elsevier: Amsterdam, The Netherlands, 2021; pp. 325–346. [Google Scholar] [CrossRef]
- Rodríguez-Liébana, J.A.; Peña, A. Differences in the sorption kinetics of various non-ionisable pesticides in a limited number of agricultural soils from the Mediterranean basin. J. Environ. Manag. 2020, 276, 111336. [Google Scholar] [CrossRef]
- Selmi, T.; Seffen, M.; Celzard, A.; Fierro, V. Effect of the adsorption pH and temperature on the parameters of the Brouers-Sotolongo models. Environ. Sci. Pollut. Res. Int. 2020, 27, 23437–23446. [Google Scholar] [CrossRef]
- Albroomi, H.I.; Elsayed, M.A.; Baraka, A.; Abdelmaged, M.A. Batch and fixed-bed adsorption of tartrazine azo-dye onto activated carbon prepared from apricot stones. Appl. Water Sci. 2016, 7, 2063–2074. [Google Scholar] [CrossRef] [Green Version]
- Li, H.; Wang, F.; Li, J.; Deng, S.; Zhang, S. Adsorption of three pesticides on polyethylene microplastics in aqueous solutions: Kinetics, isotherms, thermodynamics, and molecular dynamics simulation. Chemosphere 2021, 264, 128556. [Google Scholar] [CrossRef]
- Van Pham, T.; Van Tran, T.; Duy Nguyen, T.; Thi Hong Tham, N.; Thanh Tri Quang, P.; Thi To Uyen, D.; Thi Hong Le, N.; Vo, D.-V.N.; Trung Thanh, N.; Giang Bach, L. Adsorption behavior of Congo red dye from aqueous solutions onto exfoliated graphite as an adsorbent: Kinetic and isotherm studies. Mater. Today Proc. 2019, 18, 4449–4457. [Google Scholar] [CrossRef]
- Mueses, M.A.; Colina-Márquez, J.; Machuca-Martínez, F.; Li Puma, G. Recent advances on modeling of solar heterogeneous photocatalytic reactors applied for degradation of pharmaceuticals and emerging organic contaminants in water. Curr. Opin. Green Sustain. Chem. 2021, 30, 100486. [Google Scholar] [CrossRef]
- Yeganeh, M.; Charkhloo, E.; Reza Sobhi, H.; Esrafili, A.; Gholami, M. Photocatalytic processes associated with degradation of pesticides in aqueous solutions: Systematic review and meta-analysis. Chem. Eng. J. 2021, 428, 130081. [Google Scholar] [CrossRef]
- Umar, M.; Abdul, H. Photocatalytic Degradation of Organic Pollutants in Water. In Organic Pollutants—Monitoring, Risk and Treatment; IntechOpen: London, UK, 2013. [Google Scholar] [CrossRef] [Green Version]
- Ahmed, S.M.; Taha, M.R.; Taha, O.M.E. Kinetics and isotherms of dichlorodiphenyltrichloroethane (DDT) adsorption using soil–zeolite mixture. Nanotechnol. Environ. Eng. 2018, 3, 4. [Google Scholar] [CrossRef]
- Kumar, R.; Singh, L.; Zularisam, A. Microbial fuel cells: Types and applications. In Waste Biomass Management–A Holistic Approach; Springer: Berlin/Heidelberg, Germany, 2017; pp. 367–384. [Google Scholar]
- Nasrollahzadeh, M.S.; Hadavifar, M.; Ghasemi, S.S.; Arab Chamjangali, M. Synthesis of ZnO nanostructure using activated carbon for photocatalytic degradation of methyl orange from aqueous solutions. Appl. Water Sci. 2018, 8, 1–12. [Google Scholar] [CrossRef] [Green Version]
- Ghasemi, B.; Anvaripour, B.; Jorfi, S.; Jaafarzadeh, N. Enhanced Photocatalytic Degradation and Mineralization of Furfural Using UVC/TiO2/GAC Composite in Aqueous Solution. Int. J. Photoenergy 2016, 2016, 1–10. [Google Scholar] [CrossRef]
- El-Maghrabi, H.H.; Hosny, R.; Ramzi, M.; Zayed, M.A.; Fathy, M. Preparation and Characterization of Novel Magnetic ZnFe2O4–Hydroxyapatite Core–Shell Nanocomposite and Its Use as Fixed Bed Column System for Removal of Oil Residue in Oily Wastewater Samples. Egypt. J. Pet. 2019, 28, 137–144. [Google Scholar] [CrossRef]
- Dotto, G.L.; Cadaval, T.; Pinto, L. Preparation of bionanoparticles derived from Spirulina platensis and its application for Cr (VI) removal from aqueous solutions. J. Ind. Eng. Chem. 2012, 18, 1925–1930. [Google Scholar] [CrossRef]
Publisher’s Note: MDPI stays neutral with regard to jurisdictional claims in published maps and institutional affiliations. |
© 2022 by the authors. Licensee MDPI, Basel, Switzerland. This article is an open access article distributed under the terms and conditions of the Creative Commons Attribution (CC BY) license (https://creativecommons.org/licenses/by/4.0/).