Article

Study on the Formaldehyde Oxidation Reaction of Acid-Treated Manganese Dioxide Nanorod Catalysts

1
State Key Laboratory of Coal Conversion, Institute of Coal Chemistry, Chinese Academy of Sciences, Taiyuan 030001, China
2
State College of Chemistry and Chemical Engineering, North University of China, Taiyuan 030051, China
3
State China Sedinningbo Engineering Co., Ltd., Ningbo 315103, China
*
Authors to whom correspondence should be addressed.
Catalysts 2022, 12(12), 1667; https://doi.org/10.3390/catal12121667
Submission received: 25 October 2022 / Revised: 3 December 2022 / Accepted: 8 December 2022 / Published: 18 December 2022
(This article belongs to the Special Issue Recent Trends in Catalysis for Syngas Production and Conversion)

Abstract

:
Formaldehyde is an important downstream chemical of syngas. Furniture and household products synthesized from formaldehyde will slowly decompose and release formaldehyde again during use, which seriously affects indoor air quality. In order to solve the indoor formaldehyde pollution problem, this paper took the catalytic oxidation of formaldehyde as the research object; prepared a series of low-cost, acid-treated manganese dioxide nanorod catalysts; and investigated the effect of the acid-treatment conditions on the catalysts’ activity. It was found that the MnNR-0.3ac-6h catalyst with 0.3 mol/L sulfuric acid for 6 h had the best activity. The conversion rate of formaldehyde reached 98% at 150 °C and 90% at 25 °C at room temperature. During the reaction time of 144 h, the conversion rate of formaldehyde was about 90%, and the catalyst maintained a high activity. It was found that acid treatment could increase the number of oxygen vacancies on the surface of the catalysts and promote the production of reactive oxygen species. The amount of surface reactive oxygen species of the MnNR-0.3ac-6h catalyst was about 13% higher than that of the catalyst without acid treatment.

1. Introduction

Formaldehyde is an important downstream product of syngas. Gaseous formaldehyde can be obtained via the partial oxidation or dehydrogenation of methanol from syngas through the methanol route. At present, 35% of the world’s methanol production is used to meet the world’s demand for formaldehyde, making formaldehyde the first product that is directly derived from methanol. In recent years, there have also been studies on the direct synthesis of formaldehyde using syngas, which bypasses the production of methanol and has a low reaction temperature, thus improving the conversion efficiency without producing CO2 [1,2].
As an important chemical raw material, formaldehyde can be used to produce a variety of daily products such as processed wood, paint, cosmetics, resins, polymers, adhesives, etc. [3]. However, in artificial boards and other decoration materials that use formaldehyde as the raw material, paraformaldehyde depolymerizes and continuously releases [4], which seriously pollutes the indoor environment. Methods to eliminate indoor formaldehyde pollution include ventilation [5], plant purification [6], adsorption [7,8], plasma purification [9], catalytic oxidation [10], etc. Among these, the ventilation and air exchange method is simple and feasible but has limitations in application scenarios due to the influence of the house layout and climatic conditions. The removal process of the plant purification method is relatively passive and the processing speed is slow, so it is only suitable for the auxiliary means of formaldehyde purification [11]. The adsorption method is simple in principle and widely used, but it is difficult for it to play a long-term and stable purification role due to the inherent problem of adsorption saturation. Plasma air-purification technology has a good formaldehyde purification effect and strong processing capacity, but the energy consumption of the process is high and there may be secondary pollution. The catalytic oxidation method, which uses oxygen in the air to react and generate H2O and CO2 with a good reaction stability [12], high treatment efficiency, mild reaction conditions, and no secondary pollution, has broad application prospects [13]. Formaldehyde oxidation catalysts can be divided into noble metal catalysts and non-noble-metal catalysts [14,15,16].
Among these, noble metal catalysts have specific excellent catalytic activity at low temperatures or even room temperature [17], but noble metals are expensive, which is not conducive to practical application [18]. Compared with noble metal catalysts, non-noble metals such as Mn, Co, and Ce are relatively abundant in reserves and have various electronic structures, reducibility, thermal stability, oxidative degradability, a low price, and other excellent characteristics that have attracted great attention in the fields of energy and environmental protection [19]. Formaldehyde oxidation of non-noble metal oxide catalysts is a hot research topic at present. As early as 2002, Sekinel [20] compared the catalytic oxidation performance of formaldehyde at a low temperature for a variety of non-noble metal oxides. The results showed that when ZnO, La2O3, and V2O5 were used as catalysts, the reaction activity was low and the conversion rate of the formaldehyde was less than 10%; while MnO2 had a better catalytic performance and showed a conversion rate of the formaldehyde of more than 90%.
Mn is a commonly used transition metal element in catalytic reactions [21,22]. Mn atom has the outer electronic structure of 3d54s2, and its oxide can form the [MnO6] octahedron, which is used as the basic structural unit. The crystal structure of a one-dimensional tunnel, two-dimensional layer, or three-dimensional network is formed by common edges, common angular tops, or coplanes [23,24,25]. Under different conditions, crystalline manganese oxides of α, δ, γ, λ, β, and ε can be generated [21,25].
Zhang et al. [26] investigated the activity of four crystalline MnO2 catalysts (α, δ, λ, and β) and found that the δ-MnO2 catalyst could completely oxidize formaldehyde at 80 °C; while the α-, λ-, and β-MnO2 catalysts had higher formaldehyde complete conversion temperatures of 125 °C, 200 °C, and 150 °C, respectively. This was due to the fact that the delta-MnO2 layered structure had more active sites, which increased the adsorption and diffusion rate of formaldehyde. Other studies have shown that the (310) crystal surface of α-MnO2 had the highest surface energy, which was conducive to the adsorption and activation of O2 and H2O, and could improve the oxidation activity of HCHO [27]; the (100) crystal surface of α-MnO2 was conducive to the adsorption and activation of O2; and the (001) crystal surface of layered δ-MnO2 was conducive to the desorption of H2O [28]. The pore structure of potassium manganese ore (0.26 nm) was similar to the dynamic diameter of the formaldehyde molecule (0.243 nm) and showed high catalytic activity in the reaction [29].
When manganese oxide has a special morphology, its unique microstructure and texture properties were also conducive to an improvement in catalytic performance [30,31,32]. Boyjoo et al. [33] prepared a hollow microglobular MnO2 catalyst; subsequent studies showed that the catalyst had a large specific surface area, a highly dispersed mesoporous structure, and a large number of oxygen vacancies on the surface, which could promote the migration of oxygen species in the reaction process. Bai et al. [34] prepared a 3D mesoporous MnO2 catalyst using the template method. The results showed that 3D-MnO2 had a large specific surface area, that the Mn4+ on its (110) crystal plane provided the main active site for formaldehyde oxidation, and that it had good catalytic performance.
Acid treatment is an important way to improve the surface chemical properties of catalysts [35,36,37]. Wang et al. [37] found that after acid treatment of an MnO2/LaMnO3 catalyst, the number of oxygen vacancies and reactive oxygen species on the surface increased significantly, which promoted toluene adsorption and a catalytic reaction. Studies have found that acid treatment can affect the distribution and number of oxygen-containing functional groups on the surface of carbon nanotubes [35]. Cui et al. [36] found that sulfuric acid treatment made a TiO2 nanoribbon surface rough and that the catalyst had an obvious mesoporous structure, which could promote the adsorption, diffusion, and transfer of reactants and provide more surface active sites. Gao et al. [38] found that the addition of dilute nitric acid in the forming process of an HZSM-5 molecular sieve increased the content of medium and strong acids and formed layered pores, which helped to reduce the reaction capacity of cracking, aromatization, and hydrogen transfer of the catalyst; improved the diffusion performance of the catalyst; and slowed the deposition rate of coke. In this study, MnO2 nanorod catalysts were prepared using hydrothermal synthesis and treated with acid. By adjusting the acid concentration and reaction time during the acid treatment, a series of MnO2 nanorod catalysts were obtained after acid treatment under different conditions. The structure and properties of the catalysts after acid treatment were explored through various representations, and the influence of the acid treatment on the catalytic oxidation activity of the formaldehyde was explained.

2. Results and Discussion

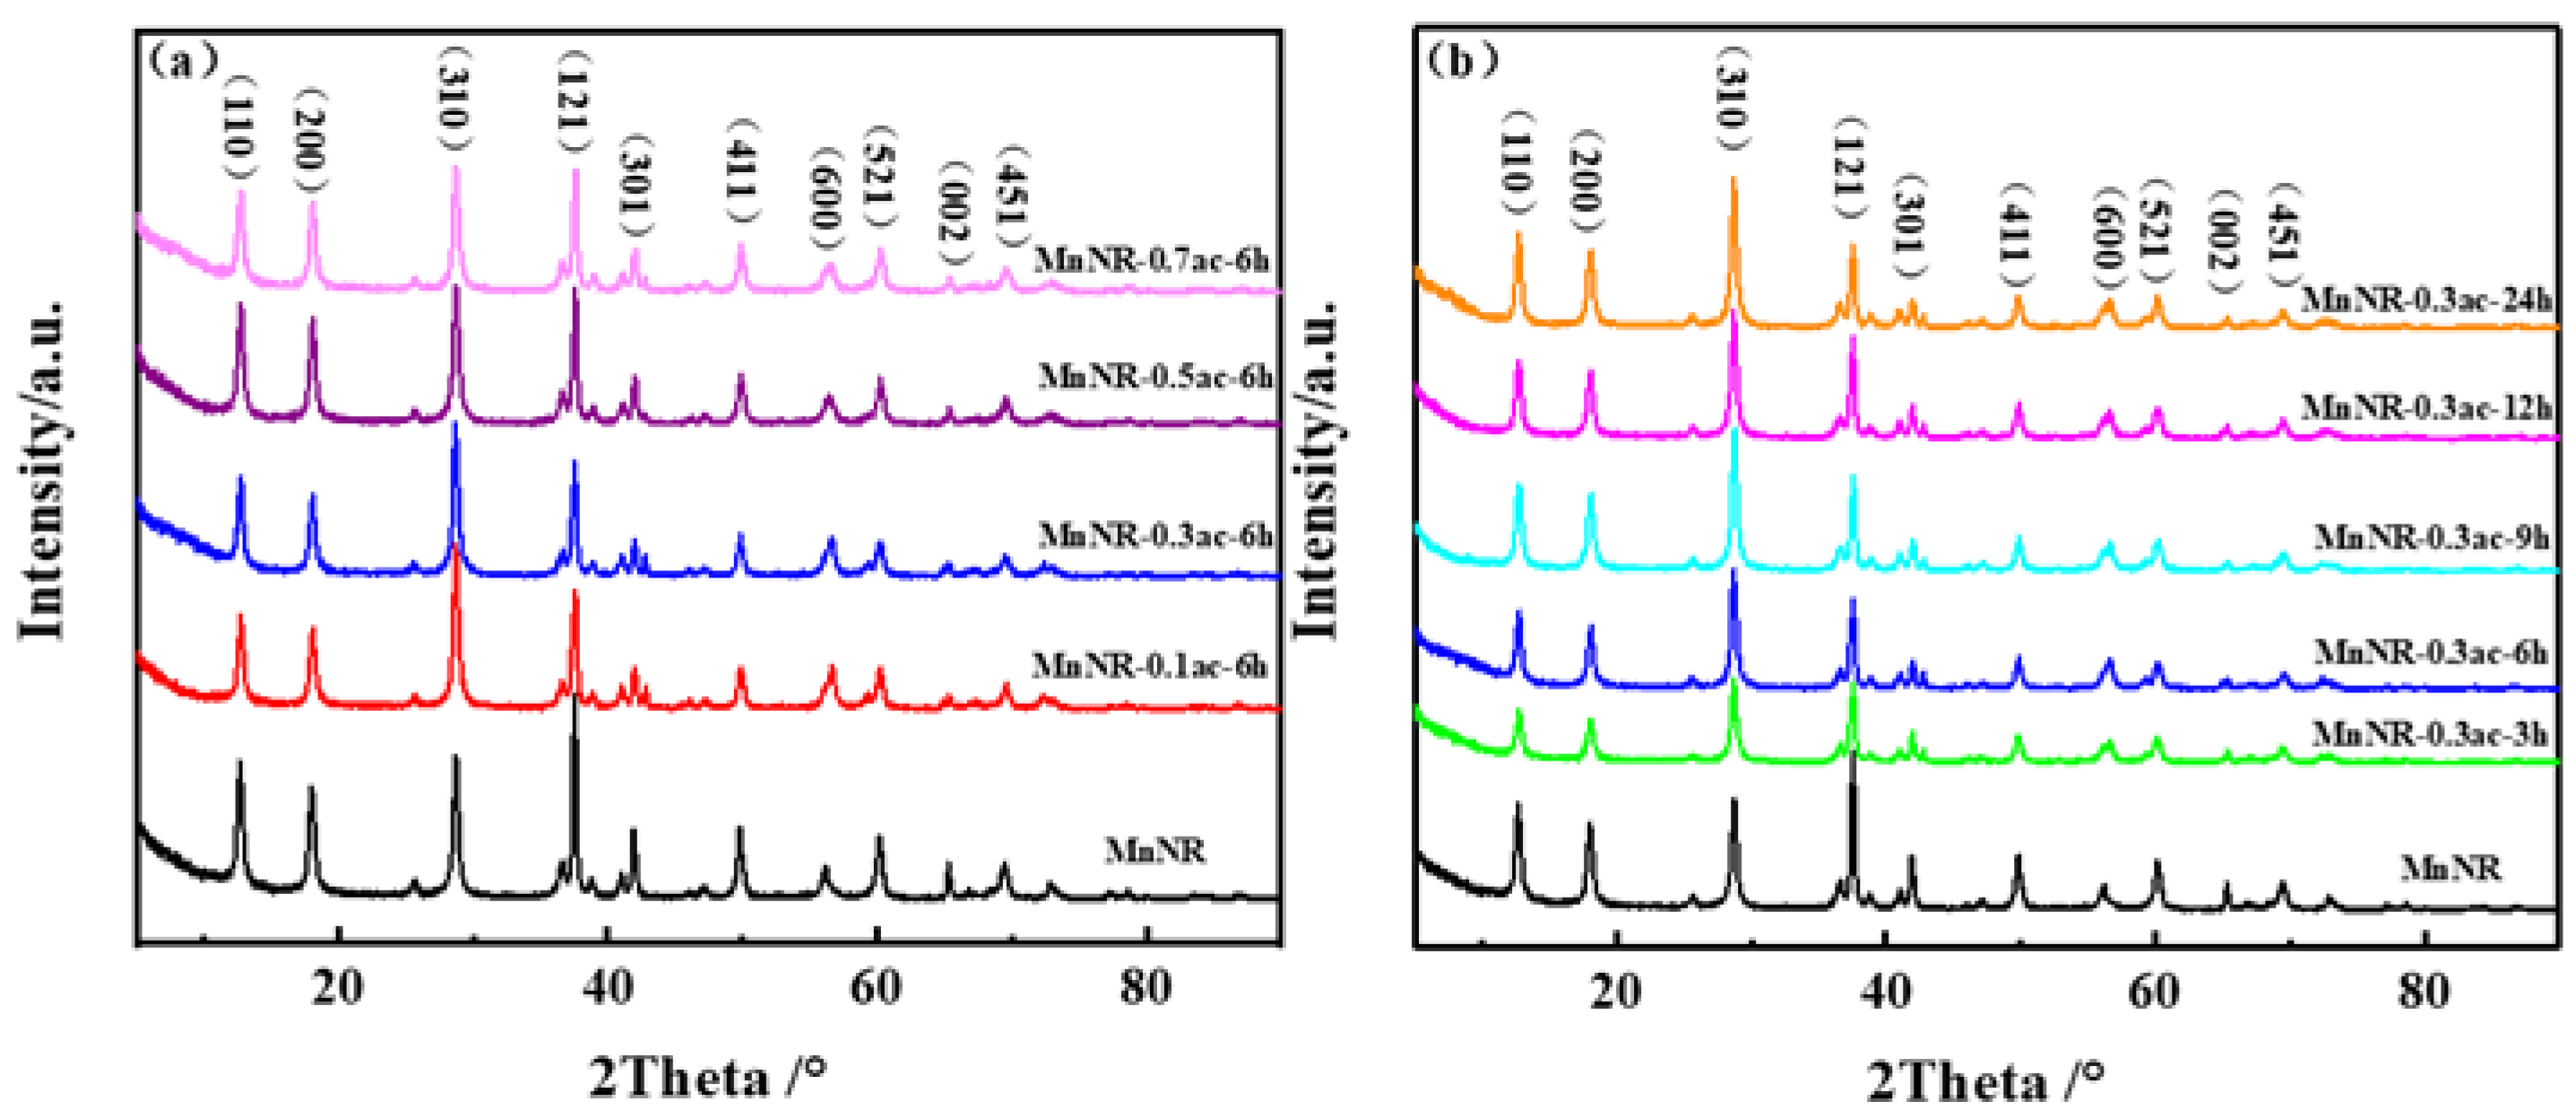
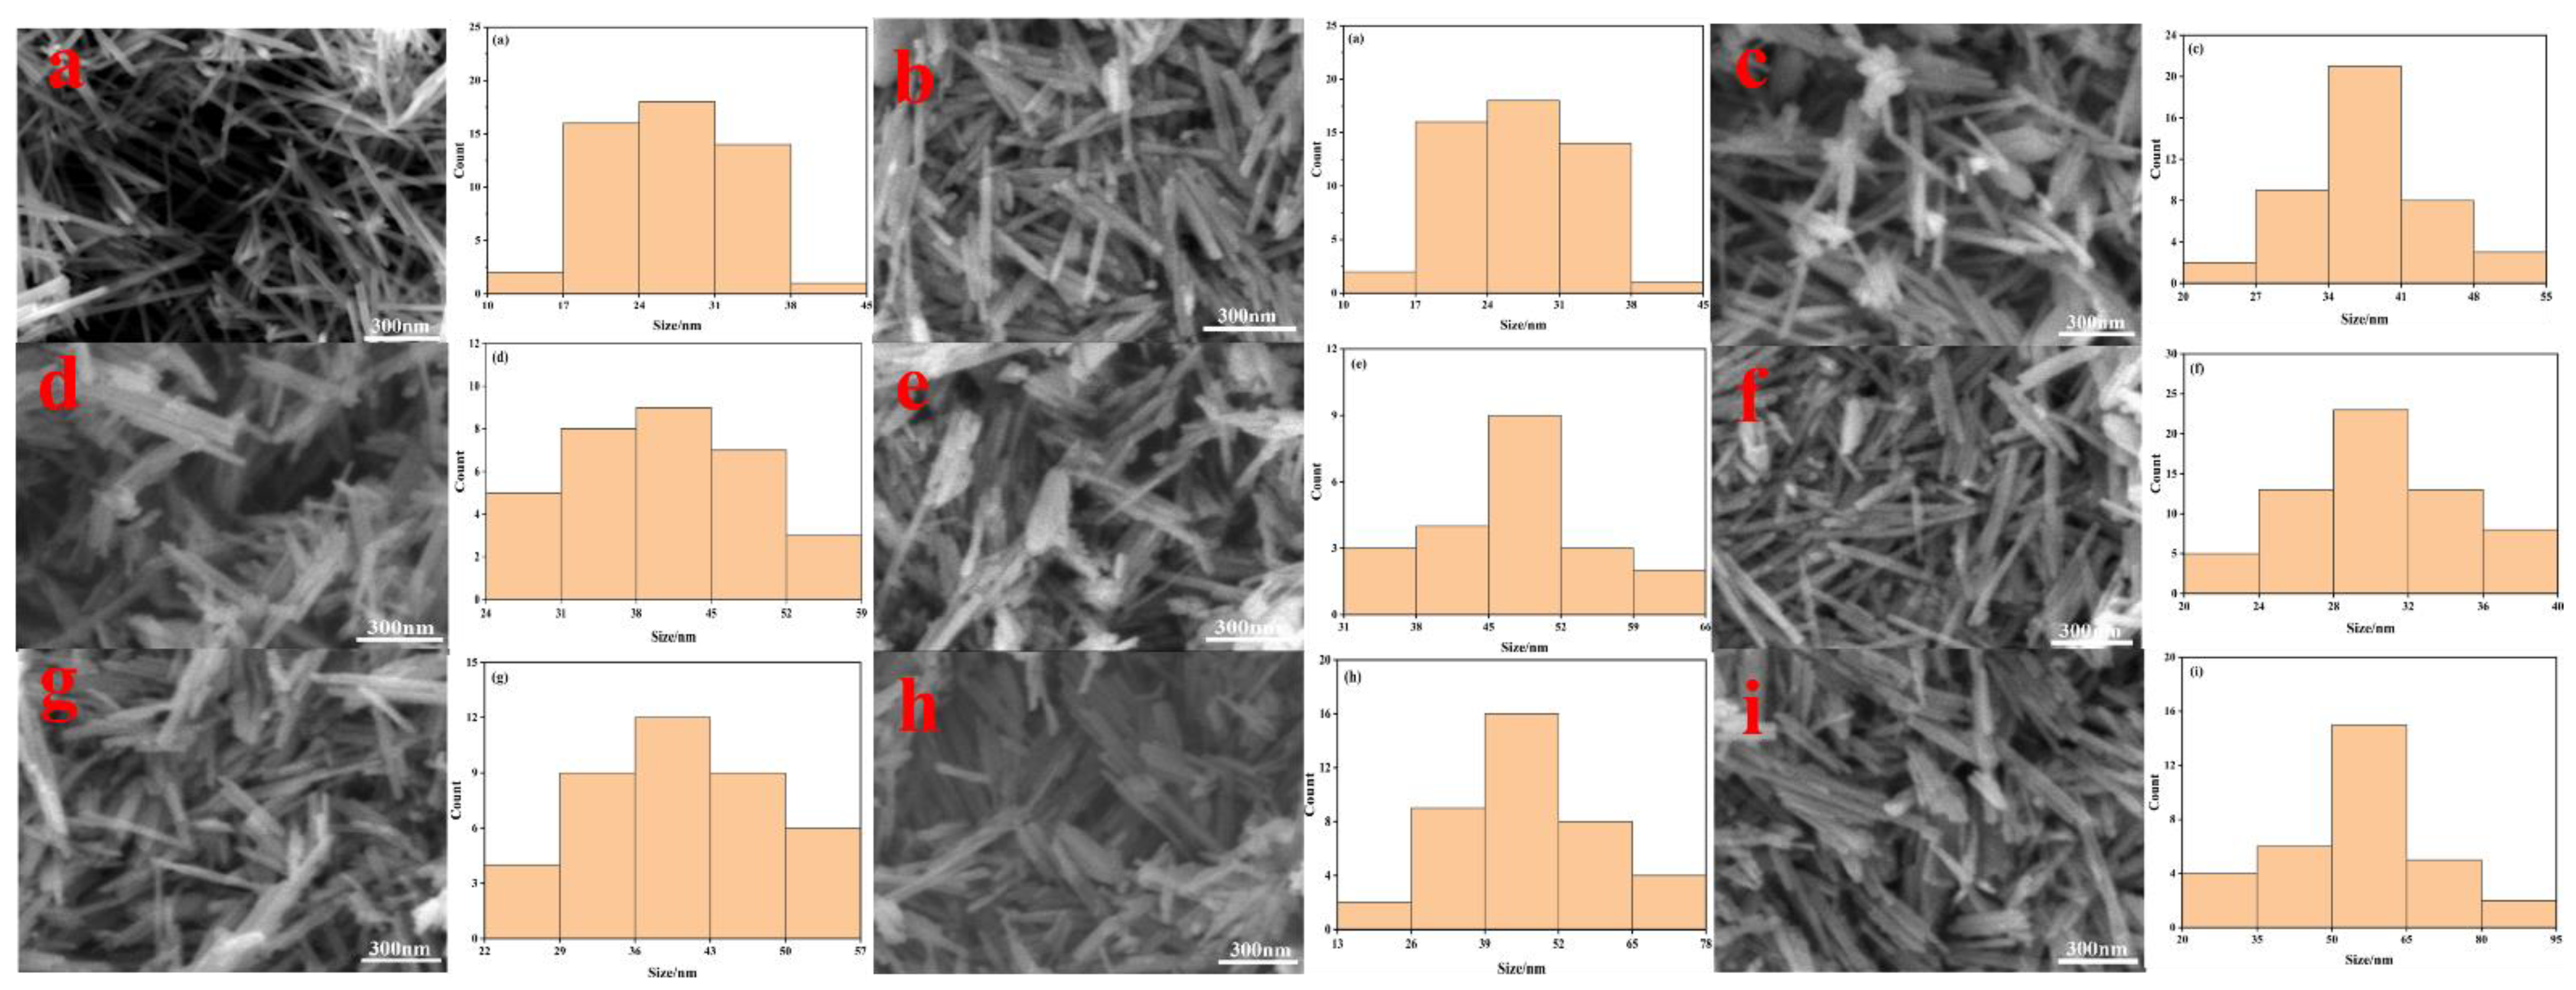
2.1. Microstructure of Catalysts

In order to study the crystal structure and phase of the catalysts treated with different concentrations of acid and different times, an XRD characterization was carried out, the results of which are shown in Figure 1. It can be seen that there were characteristic diffraction peaks of α-MnO2 at 2θ = 12.8°, 18.1°, 28.8°, 37.5°, and 49.8°, which corresponded to the (110), (200), (310), (121), and (411) crystal planes, respectively. This indicated that the prepared MnO2 nanorods were α-crystalline MnO2. The (310) and (110) crystal surface energies of the α-MnO2 were higher, which was conducive to the adsorption and activation of O2 and H2O and could improve the oxidation activity of HCHO [27,28]. It can be seen in Figure 1a that after treatment of the MnNR catalysts with different concentrations of acid, the increase in the acid concentration in the process of acid treatment did not change the characteristic diffraction peak position of the catalysts, which meant that the structure of the catalysts did not change during the treatment with different concentrations of acid. As shown in Figure 1b, the extension of acid treatment time did not change the structure of the catalysts.
The SEM characterization results for the manganese dioxide catalysts treated using different acid conditions are shown in Figure 2. Without acid treatment, as shown in Figure 2a, the MnNR catalyst process was obviously rod-like. After the treatment with different concentrations of acid, as shown in Figure 2b, the surface of the MnNR-0.1ac-6h catalyst prepared via the reaction of 0.1 mol/L sulfuric acid for 6 h was rough and weakly agglomerated, the particle size started to become large, and the rod-like structure could still be seen. As shown in Figure 2e, with the increase in acid concentration, the acid treatment changed the surface energy of the nanoparticles and increased the contact interface between the particles. The surface of the MnNR-0.7ac-6h catalyst prepared via the reaction of 0.7 mol/L sulfuric acid for 6 h was rougher with obvious agglomeration and no obvious rod-like structure. Figure 2f–i show the catalysts of MnO2 nanorods treated with acid at different times. It can be seen that the MnNR-0.3ac-3h catalyst prepared via a 0.3 mol/L sulfuric acid reaction for 3 h showed weak agglomeration. With the gradual increase in the acid treatment time, the catalyst also gradually presented obvious nanoparticle agglomeration, the rod-like structure was no longer obvious with the extension of time, and the MnNR-0.3ac-24h catalyst did not show an obvious rod-like structure.
The specific surface area, pore size, and pore volume data of the MnNR series of catalysts are shown in Table 1. As can be seen in the table, the specific surface area of the MnNR catalyst without acid treatment was 47.6 m2/g, the average pore size was 11.6 nm, and the average pore volume was 0.14 cm3/g. When the MnNR catalyst was treated with different concentrations of acid, the specific surface area of the catalyst increased slightly, and the average pore size and average pore volume increased significantly, which may have been caused by the disappearance of a large number of micropores due to acid etching. The MnNR-0.3ac-6h catalyst prepared via the reaction of 0.3 mol/L sulfuric acid for 6 h had the largest specific surface area of 51.8 m2/g, which meant that this catalyst could expose more active sites. The specific surface area of the MnNR catalyst gradually increased with time after acid treatment for different times. After 6 h of acid treatment, the specific surface area of the MnNR-0.3ac-6h catalyst was the largest at 51.8 m2/g. With the extension of the acid treatment time, the specific surface area of the catalyst decreased. When combined with the SEM characterization results shown in Figure 2, it can be seen that as the concentration of acid treatment continued to increase and the time of acid treatment continued to increase, an agglomeration of the catalyst occurred, which may have be the reason for the slight decrease in the specific surface area.

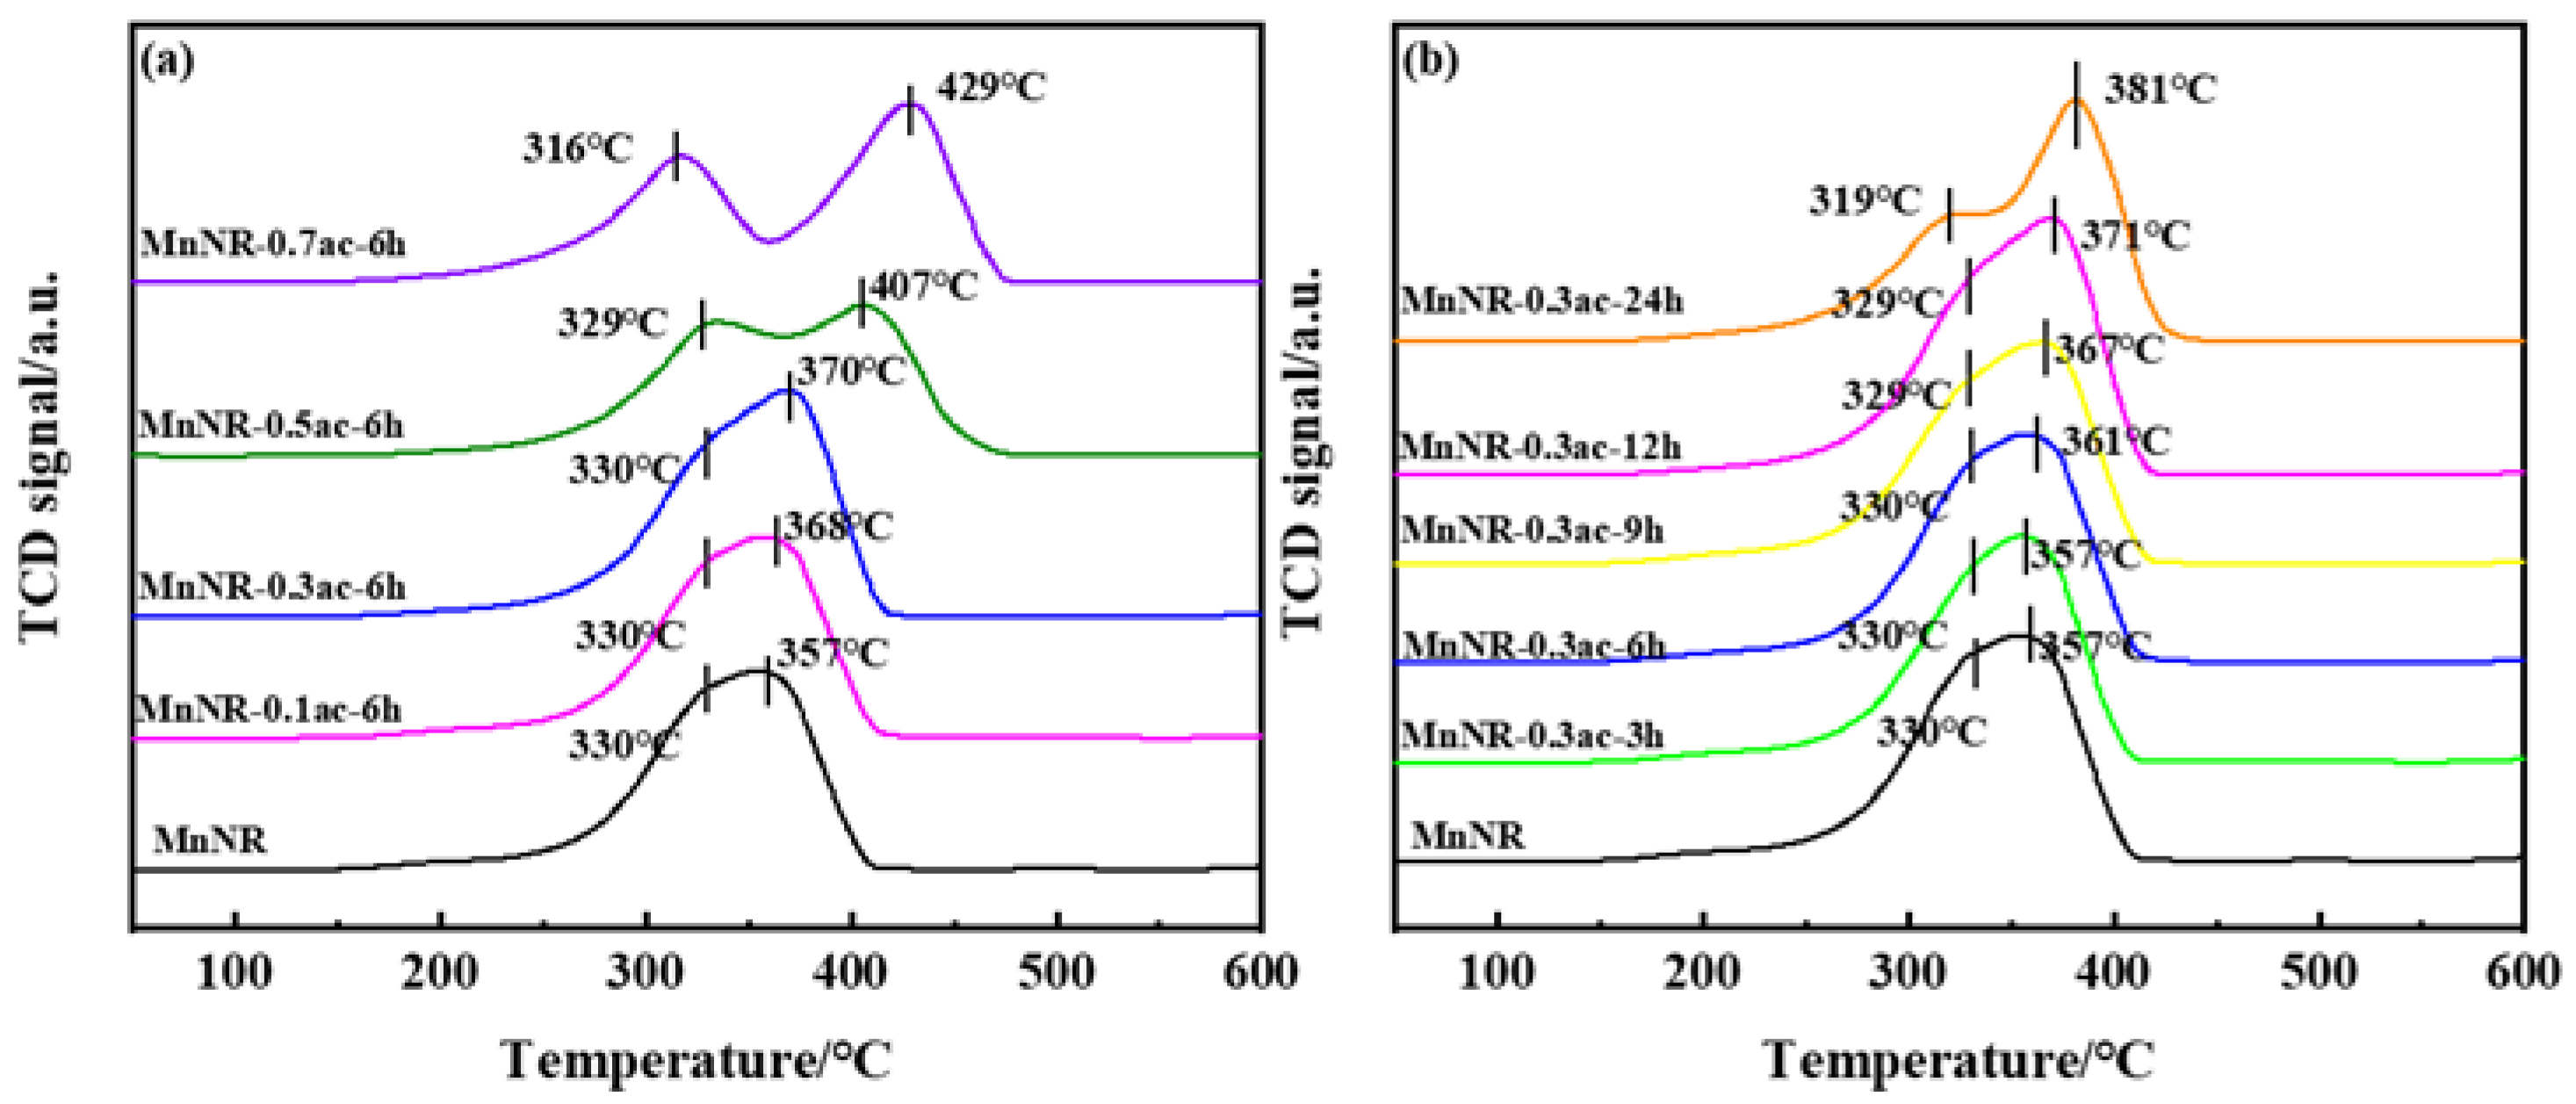
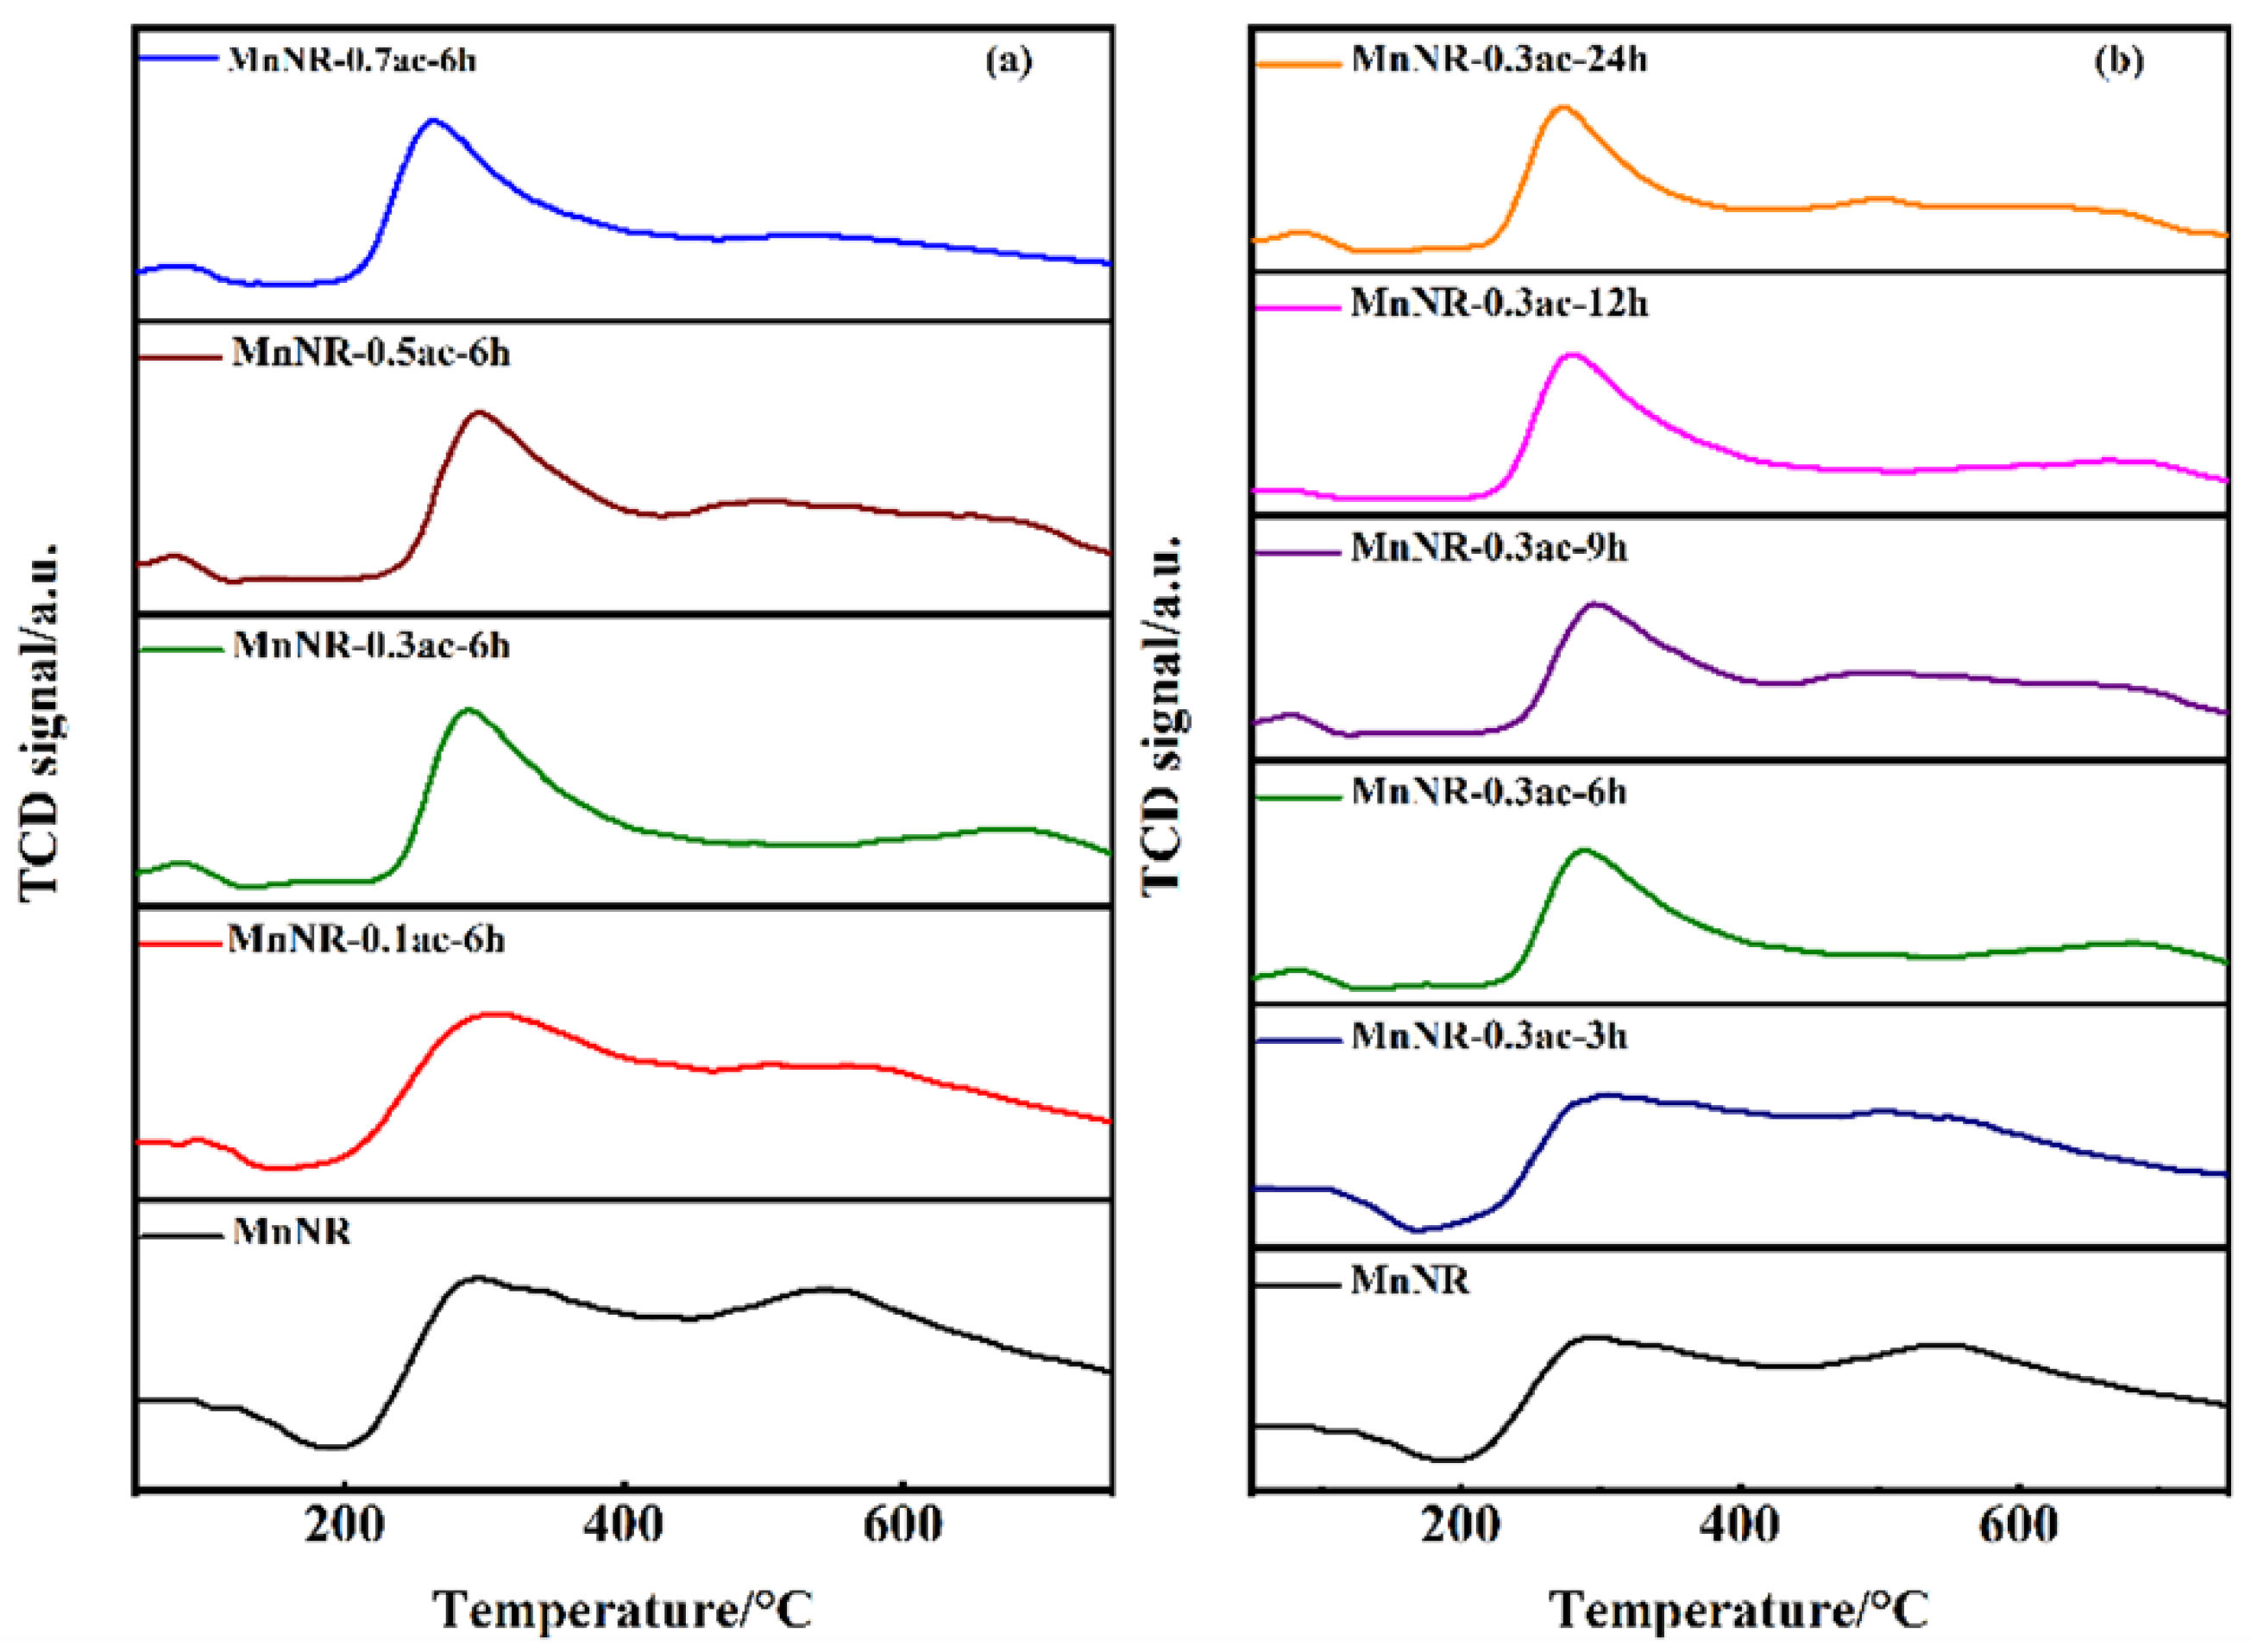
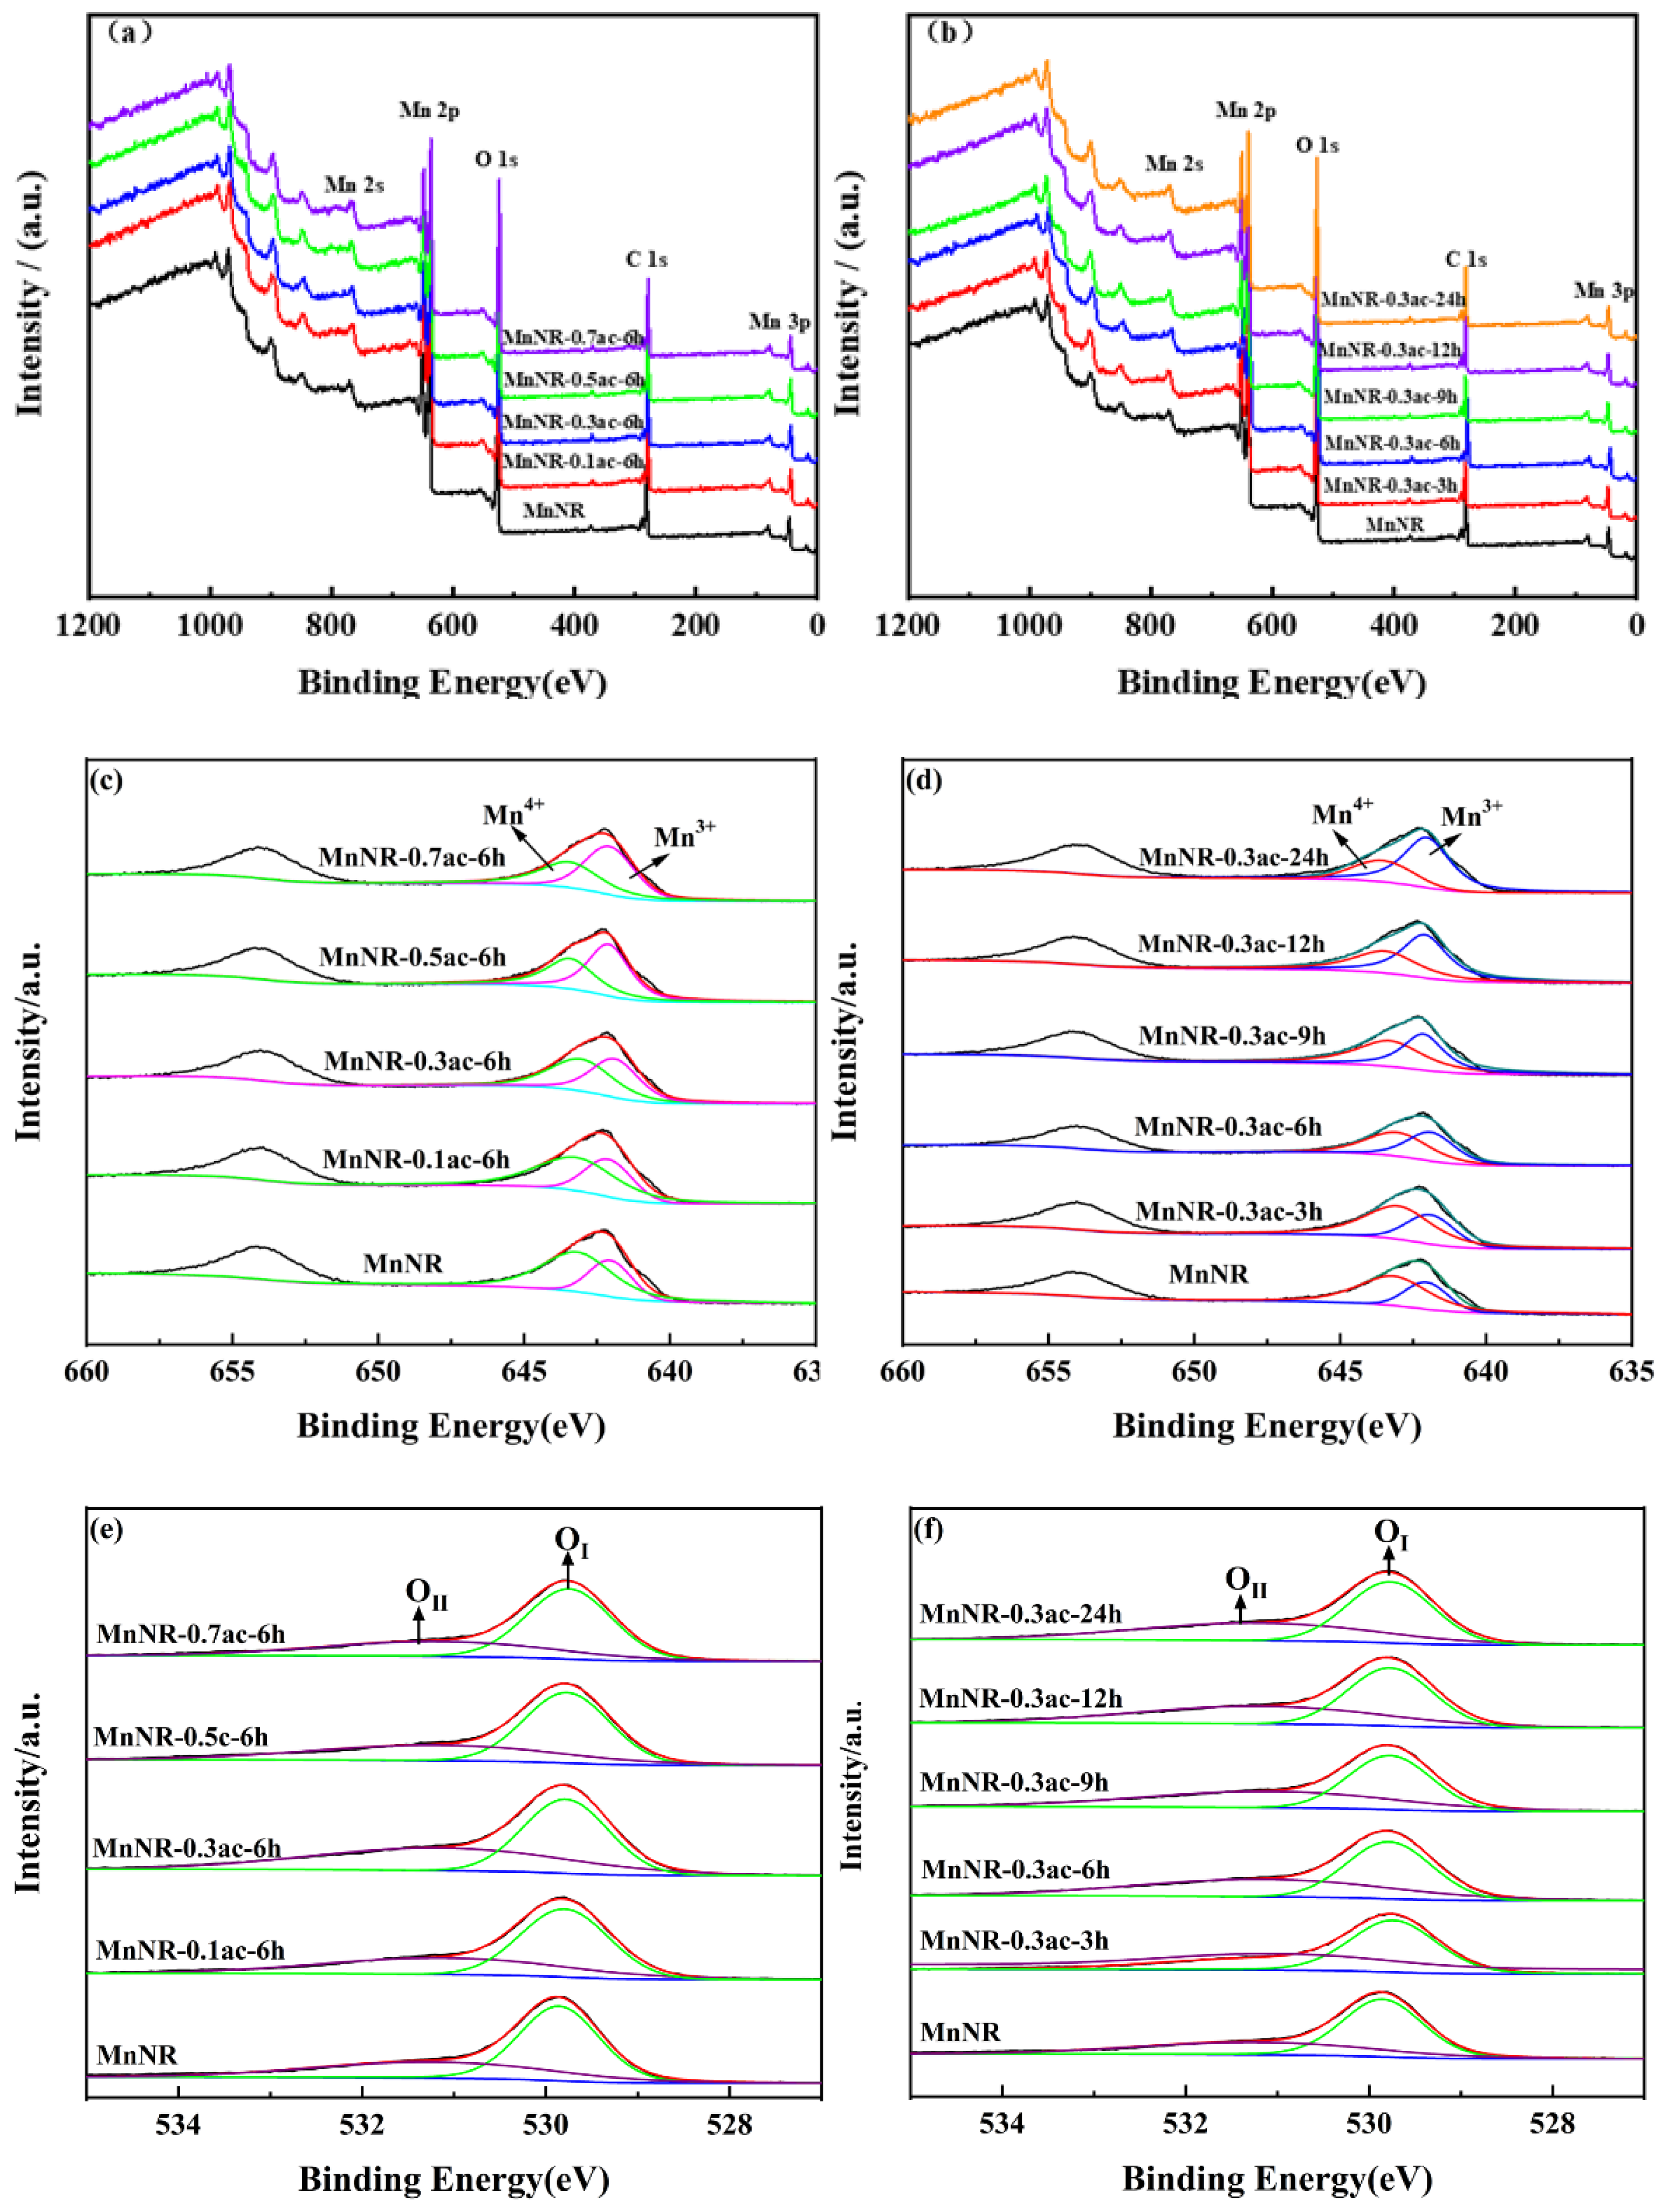
2.2. Chemical Properties of the Catalysts

The reducibility of the catalysts was investigated using H2-TPR characterization; the characterization results are shown in Figure 3. It can be seen in Figure 3a that the MnNR catalyst had a low-temperature reduction peak near 330 °C and a high-temperature reduction peak near 357 °C, which corresponded to the reduction of MnO2 to Mn2O3 and of Mn2O3 to MnO, respectively [39,40]. After acid treatment, the high-temperature reduction peak of the MnNR-0.1ac-6h catalyst increased to 368 °C, while the low-temperature reduction peak did not change. With the increase in the acid concentration, the peak reduction temperature at a high temperature increased gradually, while the peak reduction temperature at a low temperature decreased. The high-temperature reduction peak of the MnNR-0.7ac-6h catalyst increased to 429 °C, and the low-temperature reduction peak was 316 °C. According to Figure 3b, after 3 h of acid treatment, the MnNR-0.3ac-3h catalyst had a low-temperature reduction peak near 330 °C and a high-temperature reduction peak near 357 °C. With the prolongation of the acid treatment process time, the peak reduction temperature for high-temperature reduction also increased, and the peak reduction temperature for low-temperature reduction decreased. The high-temperature reduction peak of the MnNR-0.3ac-24h catalyst increased to 381 °C, and the low-temperature reduction peak was 319 °C. The reduction peak temperature probably decreased because the Mn-O bond was more likely to break under the action of H+ in the acid treatment process. A lower reduction temperature meant that the reduction was enhanced, the bond of the surface oxygen species was more easily broken, and the surface oxygen species was more easily activated, all of which were conducive to the enhancement of the activity. Lu et al. [41] believed that the reducibility of catalysts was related to oxygen–oxygen vacancies and that catalysts with a better reducibility could generate more oxygen vacancies [42]. Oxygen vacancies can promote oxygen activation, generate reactive oxygen species, and improve catalytic activity.
The O2-TPD characterization results for the catalysts are shown in Figure 4. The O2-TPD characterization could obtain the type of oxygen species on the surface of the catalyst. It was known from a literature survey [43,44] that the desorption order of oxygen species on the catalyst surface is: oxygen molecule (O2) > oxygen molecule ion (O2) > oxygen ion (O) > lattice oxygen (O2−). Oxygen molecules can usually be adsorbed on the surface of a catalyst when the temperature is below 200 °C, while the desorption temperature of the reactive oxygen species O2 and O is usually between 200 and 400 °C. In addition, the lattice oxygen has the highest desorption temperature, which generally exceeds 400 °C [45,46].
It can be seen in Figure 4a that the MnNR catalyst had a weak desorption peak at 100 °C, which corresponded to the adsorption peak of oxygen molecules; the desorption peaks of reactive oxygen species O2 and O appeared at 300 °C; and the desorption peak of lattice oxygen appeared at 540 °C. After acid treatment, the desorption peak of the reactive oxygen species of the MnNR-0.7ac-6h catalyst also appeared at 300 °C. With the increase in the acid concentration, the desorption peak position of the reactive oxygen species shifted to the left; that is, the peak temperature decreased, and the lattice oxygen desorption peak of the catalyst gradually disappeared. The reactive oxygen desorption peak of the MnNR-0.7ac-6h catalyst appeared at 261 °C. It may have been that the strong acid reacted with part of the lattice oxygen to form oxygen vacancies, which led to the decrease in the lattice oxygen desorption peak. It can also be seen in Figure 4b that after acid treatment for different times, the desorption peak position of the reactive oxygen species of the catalysts also decreased with the increase in acid treatment time. The reactive oxygen species desorption peak of the MnNR-0.3ac-24h catalyst appeared at 270 °C. The desorption temperature of the oxygen was closely related to the activity of the catalysts. The lower the desorption temperature, the more likely the reactive oxygen species were to be generated. Reactive oxygen species can accelerate catalytic reactions [47], which is the most important factor that affects catalytic activity. In addition, Huang [43] found that oxygen vacancies could accelerate the generation of reactive oxygen species and that H2-TPR characterization also proved that acid treatment could produce more oxygen vacancies in MnO2 nanorod catalysts, so it could be predicted that acid treatment could improve the activity of the MnNR catalyst [41].
In order to explore the surface chemical composition and surface chemical valence of the MnNR catalysts under different treatment conditions, the high-resolution XPS spectra of the catalysts were obtained as shown in Figure 5. As can be seen in Figure 5a,b, all of the catalysts had obvious diffraction peaks for Mn and O elements, which meant that the catalysts contained manganese oxide compounds.
Figure 5c,d reflect the Mn 2p spectra of the MnNR catalyst under different treatment conditions. It can be seen from the figure that the MnNR catalyst had two energy level peaks at 642 eV and 654 eV, which corresponded to Mn 2p3/2 and Mn 2p1/2, respectively. By using Xpspeak41 to divide the peaks of Mn 2p3/2, the Mn3+ and Mn4+ diffraction peaks appeared around 642 eV and 643 eV, respectively [48,49] and no Mn2+ diffraction peak appeared, which proved that there was no Mn2+ on the surface of the catalyst. The positions and proportions of the Mn3+ and Mn4+ peaks are shown in Table 2. As can be seen in the table, the MnNR catalyst’s surface contained a small amount of Mn3+ (about 31%). The Mn3+ content on the surface of the MnNR-0.5ac-6h catalyst increased with the acid treatment; the Mn3+ content on the surface of the MnNR-0.5ac-6h catalyst was 56%. With the increase in the acid concentration, the Mn3+ and Mn4+ contents on the surface of the MnNR-0.7ac-6h catalyst increased continuously; the Mn3+ and Mn4+ contents were 57% and 43%, respectively. After acid treatment for different times, the Mn3+ content on the catalyst surface also increased while the Mn4+ content decreased. The contents of Mn3+ and Mn4+ on the surface of the MnNR-0.3ac-3h catalyst are 33% and 67%, respectively. The contents of Mn3+ and Mn4+ on the surface of the MnNR-0.3ac-24h catalyst were 61% and 39%, respectively. The increase in the Mn3+ content may have been due to the reaction of acid ions with lattice oxygen during the acid treatment, thereby leading to Mn electron transfer and the formation of oxygen vacancies. Oxygen vacancies were conducive to the adsorption and activation of oxygen molecules in the gas phase, which resulted in the generation of surface oxygen species and also promoted the stripping of reactive oxygen species at the adsorption site (oxygen vacancies) to enhance the activity of the catalysts.
The spectra of catalyst O 1s are shown in Figure 5e,f. It can be seen that the O 1s profile of the catalyst could be fitted into two subpeaks, which meant that there were two different types of oxygen species. According to the literature, the OI diffraction peak around 529.8 eV corresponds to the lattice oxygen of the catalyst itself; and the OII diffraction peak around 531.5 eV corresponds to O2, O, the surface hydroxyl group, and other surface-adsorbed oxygen species. The positions and proportions of the OII and OI peaks in Table 2 showed that the OI and OII energy levels of the MnNR catalyst were 529.9 and 531.1 eV, respectively. After the acid treatment, the OI level of the MnNR-0.7ac-6h catalyst was slightly decreased and the OII level was slightly increased. This should be regarded as a negligible systematic displacement. It can be seen in Table 2 that the proportion of reactive oxygen species on the surface of the MnNR catalyst was 35%. After treatment at different concentrations and times, we found that the proportion of reactive oxygen species on the surface of the MnNR-0.3ac-6hcatalyst was the highest at 48%. The literature has proved that the surface adsorption of oxygen plays an important role in the process of HCHO oxidation at low temperatures. By combining the Mars–van Krevelen (MvK) mechanism and the previous results, it can be seen that surface oxygen groups could promote formaldehyde oxidation at room temperature. The MnNR-0.3ac-6h catalyst exhibited a better catalytic performance than the other catalysts.

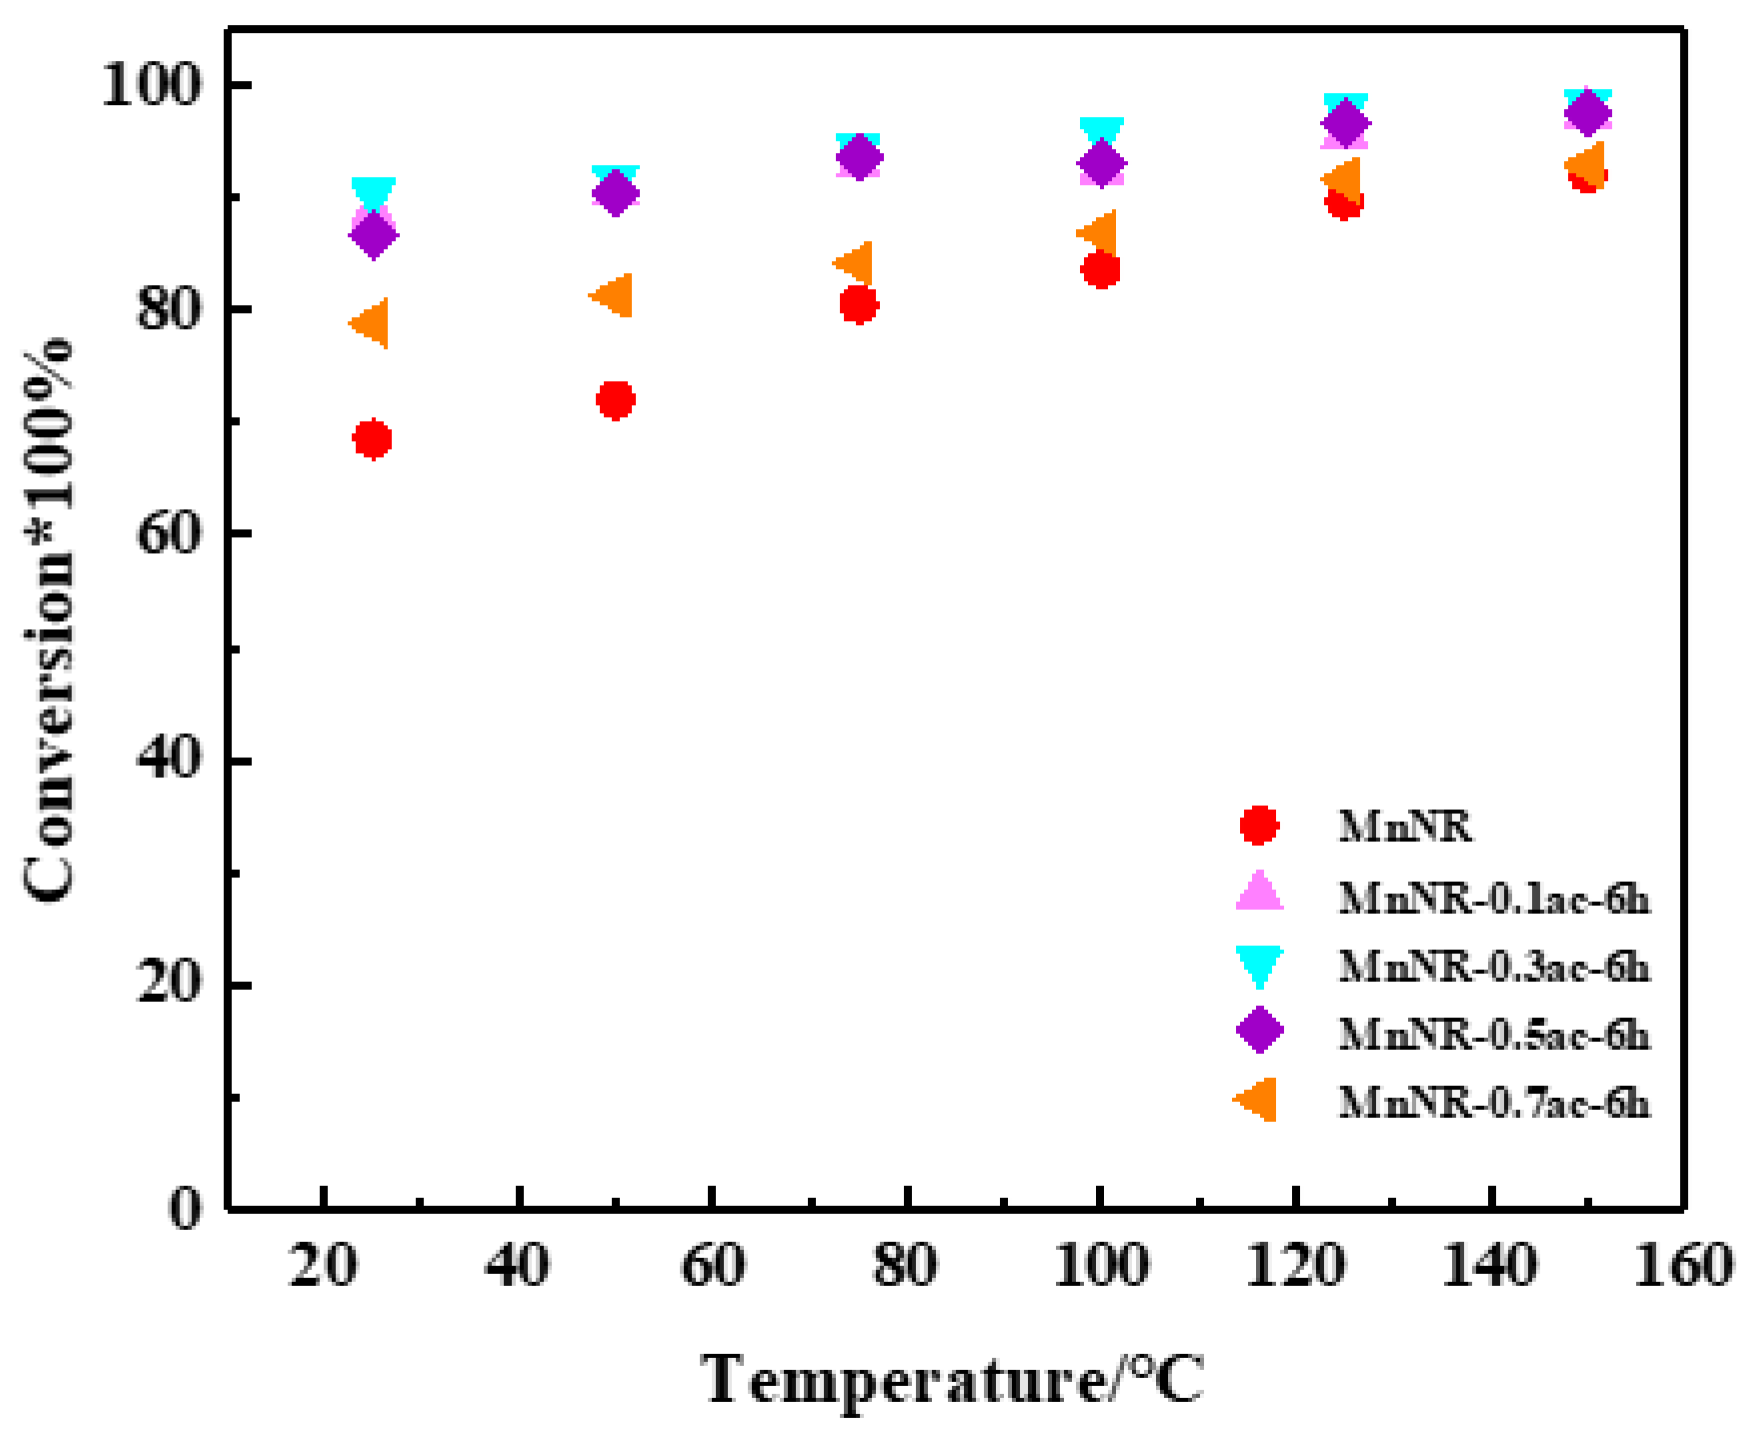
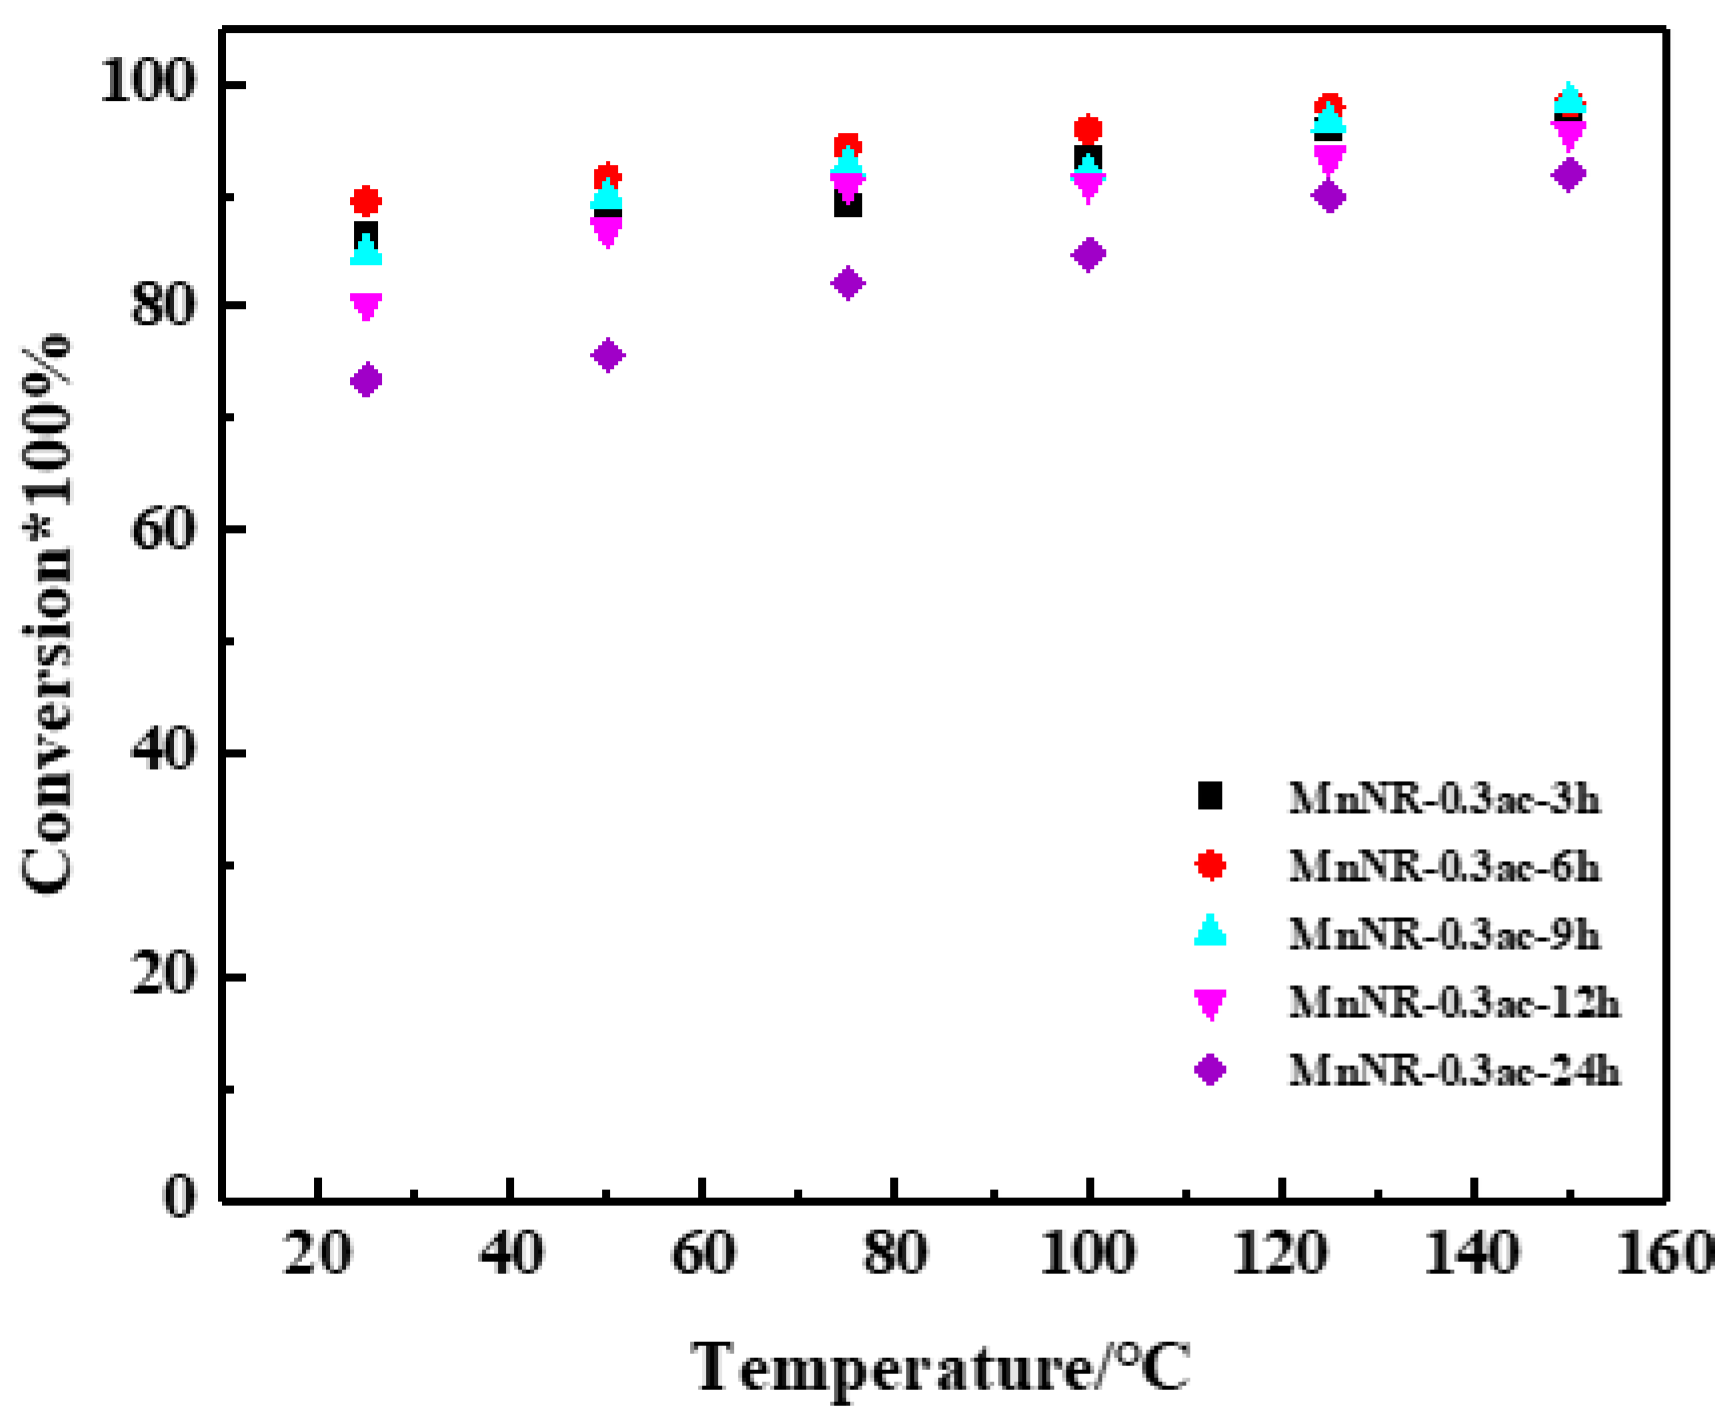
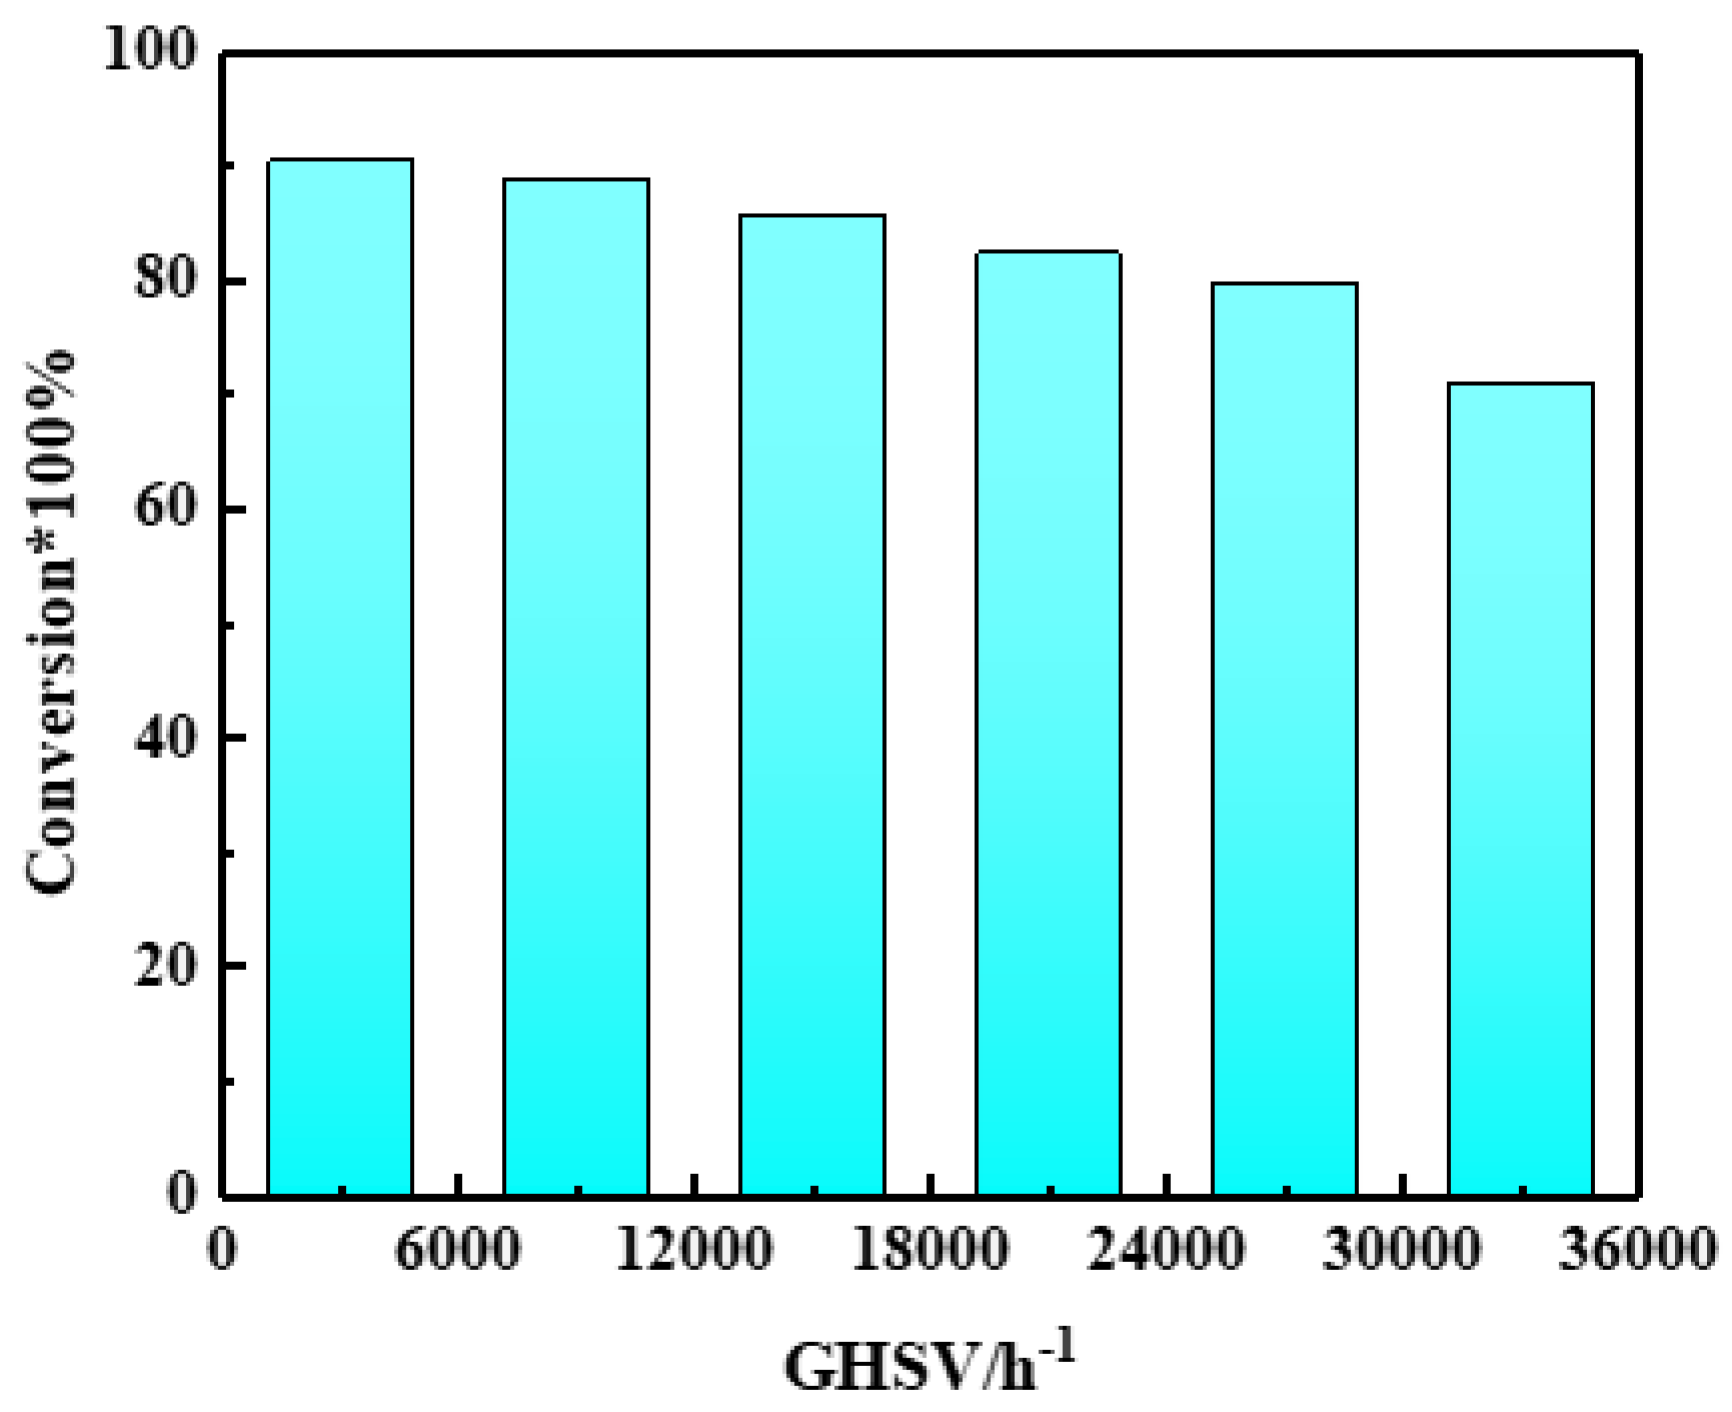
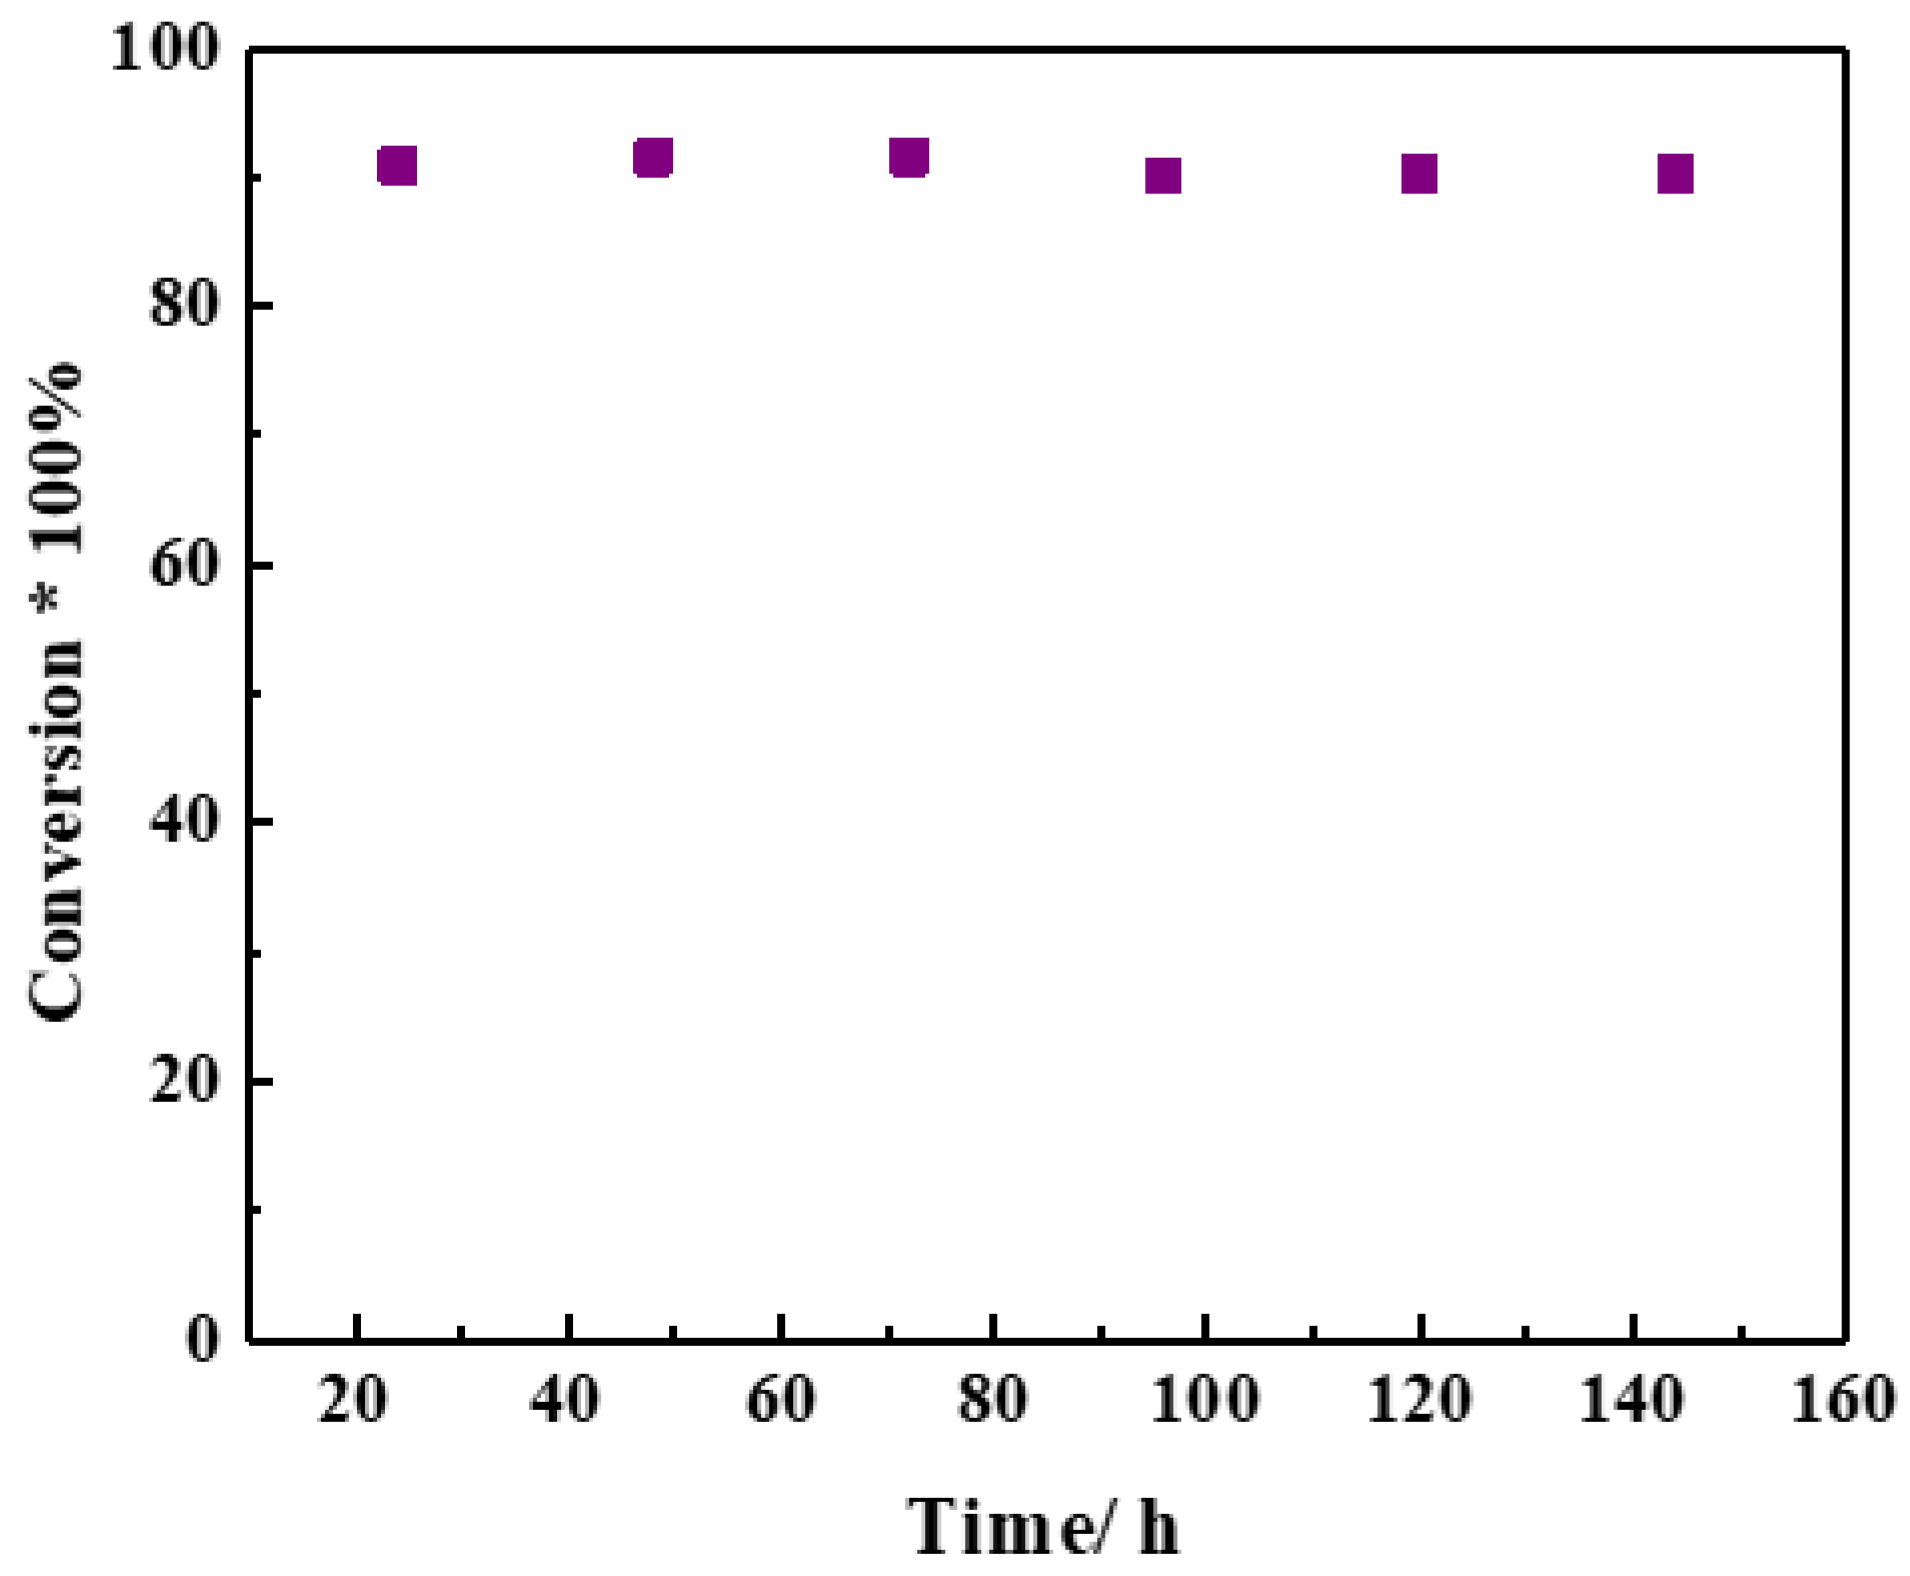
2.3. Reaction Performance of Catalysts

The evaluation results of the formaldehyde catalytic oxidation of the MnO2 nanorod catalysts treated with different concentrations of acid at 25–150 °C are shown in Figure 6. It can be seen that the formaldehyde conversion rate of the MnO2 nanorod catalyst without acid treatment was only 68% at 25 °C. With the increase in the reaction temperature, the conversion rate of the formaldehyde increased; when the reaction temperature was 150 °C, the conversion rate of the formaldehyde increased to 92%. The catalytic activity of the MnO2 nanorods increased after acid treatment; the conversion rate of formaldehyde of the MnNR-0.1ac-6h catalyst obtained via 0.1 mol/L sulfuric acid treatment increased to 97% at 150 °C. The formaldehyde conversion rate of the MnNR-0.3ac-6h catalyst reached 98% at 150 °C and 90% at 25 °C (room temperature). With the increase in the acid concentration, the catalyst activity decreased. The formaldehyde conversion rate of the MnNR-0.5ac-6h catalyst was 86% at 25 °C. The conversion rate of the MnNR-0.7ac-6h catalyst decreased to 92% at 150 °C, and the conversion rate of formaldehyde was as low as 78% at room temperature (25 °C).
In addition, the effect of the acid treatment time on the catalyst activity was also evaluated via the formaldehyde reaction. The evaluation results of the formaldehyde catalytic oxidation of the catalysts at different temperatures are shown in Figure 7. It can be seen that when the concentration of sulfuric acid was 0.3 mol/L, the formaldehyde conversion rate of the MnNR-0.3ac-3h catalyst after three hours of reaction was 97% at 150 °C. With the extension of the reaction time, the formaldehyde conversion rate increased; the formaldehyde conversion rate of the MnNR-0.3ac-6h catalyst was 98% at 150 °C. The conversion rate of formaldehyde was still 90% at room temperature. With the increase in the acid treatment time, the formaldehyde conversion rate of the MnNR-0.3ac-9h catalyst decreased to 84% at 25 °C. When the acid reaction time continued to increase, the catalyst activity decreased; the formaldehyde conversion rate of the MnNR-0.3ac-24h catalyst decreased to 91% at 150 °C and was only 73% at 25 °C.
Under the reaction condition of 50 °C and a formaldehyde concentration of 5 ppm, the effect of the space velocity on the conversion of the MnNR-0.3ac-6h catalyst was investigated; the results were shown in Figure 8. When the airspeed was 3000 h−1, the conversion rate of the catalyst was 90%. With the increasing airspeed, the reaction conversion rate decreased gradually. When the airspeed was increased to 33,000 h−1, the conversion rate of the reaction decreased to 70%, which was due to the reduced contact time between the catalyst and the formaldehyde.
The catalytic stability of the MnNR-0.3ac-6h catalyst was evaluated at 50 °C and a formaldehyde concentration of 5 ppm; the results are shown in Figure 9. It can be seen in the figure that during the reaction time of 144 h, the conversion rate of formaldehyde remained around 90%, and the catalyst always maintained a high activity. When the reaction time exceeded 144 h, the catalyst activity decreased slightly until 168 h, and the MnNR-0.3ac-6h catalyst could still maintain a conversion rate of more than 87% under the condition of a formaldehyde concentration of 5 ppm. It can be seen that the MnNR-0.3ac-6h catalyst had a better stability in formaldehyde oxidation at a low temperature.

3. Experimental

3.1. Preparation of Catalysts

For the preparation of the α-MnO2 nanorods, we added 3 mmol of KMnO4 and 4.5 mmol of MnSO4·H2O to 30 mL of deionized water and stirred for one hour [41], then added 1.5 mL of sulfuric acid (98 wt.%), stirred the above solution at room temperature until completely dissolved, transferred it into PTFE lining, sealed it, and loaded it into a high-pressure reaction kettle. The reaction was conducted at 160 °C for 12 h. At the end of the reaction, the product was filtered and washed until neutral and was denoted as MnNR.
For the preparation of the catalysts for acid treatment with different concentrations, MnO2 nanorods were placed in different concentrations of an H2SO4 solution and heated in an oil bath at 80 °C with reflux stirring. The ratio of the solid to liquid mass was kept at 1:60. Under the condition of maintaining the heating temperature as unchanged, the suspension was treated with sulfuric acid at 0.1, 0.3, 0.5, and 0.7 mol/L for 6 h; then the suspension was filtered and washed repeatedly with deionized water until the pH value of the eluent was about 7 and then dried at 105 °C. After drying, the powder was ground, pressed, crushed, and screened; the resulting products were respectively denoted as MnNR-0.1ac-6h, MnNR-0.3ac-6h, MnNR-0.5ac-6h, and MnNR-0.7ac-6h.
For the preparation of the catalysts for acid treatment at different times, MnO2 nanorods were placed in 0.3 mol/L of the H2SO4 solution and heated in an oil bath at 80 °C with reflux stirring. The ratio of the solid to liquid mass was kept at 1:60. Under the condition of maintaining the heating temperature as unchanged, the reaction was carried out for 3 h, 9 h, 6 h, 12 h, and 24 h, respectively. The suspension was filtered and washed repeatedly with deionized water until the pH value of the eluent was about 7 and then dried at 105 °C. After drying, it was ground, pressed, crushed, and sieved; the resulting products were respectively denoted as MnNR-0.3ac-3h, MnNR-0.3ac-9h, MnNR-0.3ac-6h, MnNR-0.3ac-12h, and MnNR-0.3ac-24h.

3.2. Catalyst Characterization

The crystal structure of the sample was detected using an X-ray powder diffractometer (XRD, Bruker’s D8 ADVANCE A2) using a Cu target (Kα-ray, λ = 1.5418 Å) at a large angle of 10~90°. The BET surface area of the sample was measured using the nitrogen adsorption and desorption isotherms at 77 K using a Tristar II (3020) mesoporous physical adsorption analyzer.
Before measurement, the samples were desorbed at 200 °C and 1.33 Pa for 6 h. The chemical valence of the catalyst surface was determined using X-ray photoelectron spectroscopy (XPS, AXIS ULTRA DLD model). The radiation source was Al Kα, and the modified binding energy was 284.8 eV with contaminated carbon C1s. Scanning electron microscopy (SEM) was carried out on a JSM-7900F (Japan Electronics, Japan, Tokyo) instrument. Firstly, a small amount of powder catalyst sample was coated on conductive adhesive and then the gold-sprayed treatment was performed. The temperature-programmed reduction (H2-TPR) used H2 as the reducing gas and was operated on an adsorption meter equipped with a TCD detector. The 100 mg samples were pretreated with N2 at 300 °C for 60 min to remove the moisture on the catalyst surface and then cooled to room temperature (25 °C) under an N2 atmosphere. After the baseline was stabilized in the H2/N2 atmosphere, the reduction treatment was carried out at 25–800 °C at a heating rate of 10 °C/min, and the data were detected and recorded by the TCD detector. For the oxygen-programmed temperature desorption (O2-TPD), which used the same equipment as the H2-TPR, 100 mg samples were pretreated with H2 at 300 °C for 60 min then cooled to room temperature (25 °C) under a He atmosphere, adsorbed for 60 min under an O2/He atmosphere, and then purged with He for 60 min. The desorption was performed under pure He (25–800 °C).

3.3. Catalyst Evaluation

The formaldehyde-catalyzed oxidation reaction was evaluated using a fixed-bed reactor under atmospheric pressure. A 20–40 mesh 2.0 g catalyst was weighed into the fixed-bed reactor, then the formaldehyde solution was sucked into the heating tube with a pump and heated and vaporized at 150 °C. The air carried away the formaldehyde vapor and part of the water vapor (a formaldehyde concentration of about 5 ± 1 ppm) through the heating tower into the fixed-bed reactor where the catalyst was located for the catalytic oxidation reaction. The raw material and formaldehyde after reaction were tested using a gas pump combined with a formaldehyde reaction tube.
Conversion rate of formaldehyde (%) = (Raw material formaldehyde concentration − product formaldehyde concentration)/Raw material formaldehyde concentration × 100%

4. Conclusions

The experimental results confirmed the reason why acid treatment can improve the catalytic activity and why the acid treatment time and acid concentration in the process of acid treatment will affect the catalytic activity. The MnNR-0.3ac-6h catalyst was the most active after being treated with 0.3 mol/L sulfuric acid for 6 h. The conversion rate of formaldehyde reached 98% at 150 °C and 90% at 25 °C. During the reaction time of 144 h, the conversion rate of formaldehyde was about 90%, and the catalyst maintained a high activity. It was found that acid treatment did not change the crystal shape of the catalysts. After acid treatment, the surface of the nanorods was obviously rough with obvious mesoporous characteristics, and the specific surface area was increased. The specific surface area of the MnNR-0.3ac-6h catalyst after acid treatment was increased by about 9% compared to that without acid treatment, and the increase in the specific surface area was conducive to the adsorption and diffusion of formaldehyde and oxygen. As the acid concentration became too high and the acid treatment time was prolonged, sulfuric acid reduced the surface energy of the nanoparticles, increased the contact interface between the nanoparticles, and caused the nanorods to easily agglomerate and the specific surface area to decrease. After acid treatment, MnO2 nanorod catalysts had a good low-temperature reduction ability. The MnNR-0.3ac-6h catalyst had the best reducibility, which could promote the formation of oxygen vacancies and bond-breaking of oxygen species on the surface, and the oxygen molecules were more easily activated. After acid treatment, the oxygen desorption temperature of the catalysts decreased, and reactive oxygen species were more likely to be generated. The amount of reactive oxygen species on the surface of the MnNR-0.3ac-6h catalyst increased by about 13%. Acid treatment increased the content of Mn3+ on the surface of the catalysts, and the redox reaction between Mn4+ and Mn3+ promoted the activation of oxygen and the generation of reactive oxygen species, thereby promoting the improvement in the catalytic activity.

Author Contributions

Conceptualization, K.J.; methodology, Y.L.; software, Y.S.; validation, Y.S., P.L., K.Z., Y.Y. and K.J.; investigation, Y.S.; resources, K.Z.; data curation, Y.S.; writing—original draft preparation, Y.L.; writing—review and editing, Y.L.; visualization, Y.L. and Y.S.; supervision, P.L. and K.Z.; project administration, P.L. and K.Z.; funding acquisition, P.L., K.Z. and K.J. All authors have read and agreed to the published version of the manuscript.

Funding

This research was funded by the Youth Foundation of Shanxi Province, grant number 202103021223460, the CAS Key Technology Talent Program, grant number E1YC916201 and the CAS Strategic Priority Research Program, grant number Y8YCZ11621.

Data Availability Statement

There are no other supplementary supporting data, excluding this project.

Acknowledgments

The authors acknowledge the financial support from the Youth Foundation of Shanxi Province, the CAS Key Technology Talent Program, and the CAS Strategic Priority Research Program.

Conflicts of Interest

The authors declare no conflict of interest.

References

  1. Bahmanpour, A.-M.; Hoadley, A.; Mushrif, S.-H. Hydrogenation of Carbon Monoxide into Formaldehyde in Liquid Media. ACS Sustain. Chem. Eng. 2016, 4, 3970–3977. [Google Scholar] [CrossRef]
  2. Kaithal, A.; Hölscher, M.; Leitner, W. Carbon monoxide and hydrogen (syngas) as a C1-building block for selective catalytic methylation. Chem. Sci. 2020, 12, 976–982. [Google Scholar] [CrossRef] [PubMed]
  3. Heim, L.-E.; Konnerth, H.; Prechtl, M.-H.-G. The Prospecting Shortcut to an Old Molecule: Formaldehyde Synthesis at Low Temperature in Solution. ChemSusChem 2016, 9, 2905–2907. [Google Scholar] [CrossRef] [PubMed]
  4. Jiang, C.-J.; Li, D.-D.; Zhang, P.-Y.; Li, J.-G.; Wang, J.; Yu, J.G. Formaldehyde and volatile organic compound (VOC) emissions from particleboard: Identification of odorous compounds and effects of heat treatment. Build. Environ. 2017, 117, 118–126. [Google Scholar] [CrossRef]
  5. Gilbert, N.-L.; Guay, M.; Gauvin, D.; Dietz, R.-N.; Chan, C.-C.; Lévesque, B. Air change rate and concentration of formaldehyde in residential indoor air. Atmos. Environ. 2007, 42, 2424–2428. [Google Scholar] [CrossRef]
  6. Giese, M.; Bauer-Doranth, U.; Langebartels, C.; Sandermann, H. Detoxification of Formaldehyde by the Spider Plant (Chlorophytum comosum L.) and by Soybean (Glycine max L.) Cell-Suspension Cultures. Plant Physiol. 1994, 104, 1301–1309. [Google Scholar] [CrossRef] [Green Version]
  7. Suresh, S.; Bandosz, T.-J. Removal of formaldehyde on carbon -based materials: A review of the recent approaches and findings. Carbon 2018, 137, 207–221. [Google Scholar] [CrossRef]
  8. Ye, J.-W.; Zhu, X.-F.; Cheng, B.; Yu, J.-G.; Jiang, C.-J. Few-Layered Graphene-like Boron Nitride: A Highly Efficient Adsorbent for Indoor Formaldehyde Removal. Environ. Sci. Technol. Lett. 2017, 4, 20–25. [Google Scholar] [CrossRef]
  9. Liang, W.-J.; Li, J.; Li, J.-X.; Zhu, T.; Jin, Y.-Q. Formaldehyde removal from gas streams by means of NaNO2 dielectric barrier discharge plasma. J. Hazard. Mater. 2009, 175, 1090–1095. [Google Scholar] [CrossRef]
  10. Liao, Y.-C.; Xie, C.-S.; Liu, Y.; Chen, H.; Li, H.-Y.; Wu, J. Comparison on photocatalytic degradation of gaseous formaldehyde by TiO2, ZnO and their composite. Ceram. Int. 2012, 38, 4437–4444. [Google Scholar] [CrossRef]
  11. Kehr, E.; Riehl, G.; Hoferichter, E.; Roffael, E.; Dix, B. Feuchtebeständigkeit und Hydrolyseresistenz von Holz-zu-Holz-Bindungen in Spanplatten, hergestellt mit formaldehydarmen modifizierten Harnstoff-Formaldehydharzen unter Einsatz verschiedener Härtungsbeschleunigersysteme. Holz als Roh-und Werkstoff 1993, 52, 253–260. [Google Scholar] [CrossRef]
  12. Duan, Y.-Y.; Song, S.-Q.; Cheng, B.; Yu, J.-G.; Jiang, C.-J. Effects of hierarchical structure on the performance of tin oxide-supported platinum catalyst for room-temperature formaldehyde oxidation. Chin. J. Catal. 2017, 38, 199–206. [Google Scholar] [CrossRef]
  13. Ma, C.-Y.; Sun, S.-M.; Lu, H.; Hao, Z.-P.; Yang, C.-G.; Wang, B.; Chen, C.; Song, M.-Y. Remarkable MnO2 structure-dependent H2O promoting effect in HCHO oxidation at room temperature. J. Hazard. Mater. 2021, 414, 125542. [Google Scholar] [CrossRef] [PubMed]
  14. Wang, S.; Wang, Y.; Wang, F.-G. Room temperature HCHO oxidation over the Pt/CeO2 catalysts with different oxygen mobilities by changing ceria shapes. Appl. Catal. A Gen. 2022, 630, 118469. [Google Scholar] [CrossRef]
  15. Wang, S.; Han, K.-H.; Deng, Z.-Y.; Wang, F.-G. CeO2 Nanorods Decorated with Pt Nanoparticles as Catalysts for Oxidative Elimination of Formaldehyde. ACS Appl. Nano Mater. 2022, 5, 10036–10046. [Google Scholar] [CrossRef]
  16. Wang, F.-G.; Wang, Y.; Han, K.-H.; Yu, H. Efficient elimination of formaldehyde over Pt/Fe3O4 catalyst at room temperature. J. Environ. Chem. Eng. 2020, 8, 104041. [Google Scholar] [CrossRef]
  17. Dong, Y.-X.; Su, C.-G.; Liu, K.; Wang, H.-M.; Zheng, Z.; Zhao, W.; Lu, S.-H. The Catalytic Oxidation of Formaldehyde by FeOx-MnO2-CeO2 Catalyst: Effect of Iron Modification. Catalysts 2021, 11, 555. [Google Scholar] [CrossRef]
  18. Fan, Z.-Y.; Fang, W.-J.; Zhang, Z.-X.; Chen, M.-X.; Shangguan, W.-F. Highly active rod-like Co3O4 catalyst for the formaldehyde oxidation reaction. Catal. Commun. 2018, 103, 10–14. [Google Scholar] [CrossRef]
  19. Cui, W.-Y.; Wang, C.; Wu, J.; Tan, N.-D. Research progress of formaldehyde oxidation over manganese oxide catalyst. Fine Chem. Ind. 2019, 36, 2353–2363. [Google Scholar] [CrossRef]
  20. Sekine, Y. Oxidative decomposition of formaldehyde by metal oxides at room temperature. Atmos. Environ. 2002, 36, 5543–5547. [Google Scholar] [CrossRef]
  21. Li, Y.-B.; Han, S.-H.; Zhang, L.-P.; Yu, Y.-F. Manganese-Based Catalysts for Indoor Volatile Organic Compounds Degradation with Low Energy Consumption and High Efficiency. Trans. Tianjin Univ. 2021, 28, 53–66. [Google Scholar] [CrossRef]
  22. Li, S.-J.; Chen, L.-L.; Ma, Z.; Li, G.-S.; Zhang, D.-Q. Research Progress on Photocatalytic/Photoelectrocatalytic Oxidation of Nitrogen Oxides. Trans. Tianjin Univ. 2021, 27, 295–312. [Google Scholar] [CrossRef]
  23. Li, S.-D.; Zheng, D.-S.; Guo, F. Research progress on catalytic oxidation of manganese dioxide. Mod. Chem. Ind. 2020, 40, 52–56. [Google Scholar] [CrossRef]
  24. Tian, H.; He, J.-H. Research progress of formaldehyde oxidation catalyzed by manganese oxide. Chem. Bull. 2013, 76, 100–106. [Google Scholar] [CrossRef]
  25. Robinson, D.-M.; Go, Y.-B.; Mui, M.; Gardner, G.; Zhang, Z.-G.; Mastrogiovanni, D.; Garfunkel, E.; Li, J.; Greenblatt, M.; Dismukes, G.C. Photochemical water oxidation by crystalline polymorphs of manganese oxides: Structural requirements for catalysis. J. Am. Chem. Soc. 2013, 135, 3494–3501. [Google Scholar] [CrossRef]
  26. Zhang, J.-H.; Li, Y.-B.; Wang, L.; Zhang, C.-B.; He, H. Catalytic oxidation of formaldehyde over manganese oxides with different crystal structures. Catal. Sci. Technol. 2015, 5, 2305–2313. [Google Scholar] [CrossRef]
  27. Rong, S.-P.; Zhang, P.-Y.; Liu, F.; Yang, Y.-J. Engineering Crystal Facet of α-MnO2 Nanowire for Highly Efficient Catalytic Oxidation of Carcinogenic Airborne Formaldehyde. ACS Catal. 2018, 8, 3435–3446. [Google Scholar] [CrossRef]
  28. Zhou, J.; Qin, L.-F.; Xiao, W.; Zeng, C.; Li, N.; Lv, T.; Zhu, H. Oriented growth of layered-MnO2 nanosheets over α-MnO2 nanotubes for enhanced room-temperature HCHO oxidation. Appl. Catal. B Environ. 2017, 207, 233–243. [Google Scholar] [CrossRef]
  29. Chen, T.; Dou, H.-Y.; Li, X.-L.; Tang, X.-F.; Li, J.-H.; Hao, J.-M. Tunnel structure effect of manganese oxides in complete oxidation of formaldehyde. Microporous Mesoporous Mater. 2009, 122, 270–274. [Google Scholar] [CrossRef]
  30. Liu, Z.; Zhang, X.-L.; Cai, J.; Zhan, Y.-K.; He, N.-D. Manganese based catalysts for catalytic oxidation of formaldehyde and their synergistic effects. Adv. Chem. 2019, 31, 311–321. [Google Scholar]
  31. Bai, B.-Y.; Qiao, Q.; Li, J.-H.; Hao, J.-M. Progress in research on catalysts for catalytic oxidation of formaldehyde. Chin. J. Catal. 2016, 37, 102–122. [Google Scholar] [CrossRef]
  32. Wei, Y.-Z.; Chen, M.-Y.; Ren, X.-Y.; Wang, Q.-F.; Han, J.-F.; Wu, W.-Z.; Yang, X.-G.; Wang, S.; Yu, J.-H. One-Pot Three-Dimensional Printing Robust Self-Supporting MnOx /Cu-SSZ-13 Zeolite Monolithic Catalysts for NH3-SCR. CCS Chem. 2022, 4, 1708–1719. [Google Scholar] [CrossRef]
  33. Boyjoo, Y.; Rochard, G.; Giraudon, J.-M.; Liu, J.; Lamonier, J.-F. Mesoporous MnO2 hollow spheres for enhanced catalytic oxidation of formaldehyde. Sustain. Mater. Technol. 2018, 20, e00091. [Google Scholar] [CrossRef]
  34. Bai, B.-Y.; Qiao, Q.; Li, J.-H.; Hao, J.-M. Synthesis of three-dimensional ordered mesoporous MnO2 and its catalytic performance in formaldehyde oxidation. Chin. J. Catal. 2016, 37, 27–31. [Google Scholar] [CrossRef]
  35. Wepasnick, K.-A.; Smith, B.-A.; Schrote, K.-E. Surface and structural characterization of multi-walled carbon nanotubes following different oxidative treatments. Carbon 2011, 49, 24–36. [Google Scholar] [CrossRef]
  36. Cui, W.-Y.; Xue, D.; Yuan, X.-L.; Zheng, B.; Jia, M.-J.; Zhang, W.-X. Acid-treated TiO2 nanobelt supported platinum nanoparticles for the catalytic oxidation of formaldehyde at ambient conditions. Appl. Surf. Sci. 2017, 411, 105–112. [Google Scholar] [CrossRef] [Green Version]
  37. Wang, S.-H.; Liu, Q.; Zhao, Z.-Q.; Fan, C.; Chen, X.-P.; Xu, G.; Wu, M.-H.; Chen, J.-J.; Li, J.-H. Enhanced Low-Temperature Activity of Toluene Oxidation over the Rod-like MnO2/LaMnO3 Perovskites with Alkaline Hydrothermal and Acid-Etching Treatment. Ind. Eng. Chem. Res. 2020, 59, 6556–6564. [Google Scholar] [CrossRef]
  38. Gao, J.-H.; Zhou, H.; Zhang, F.-C.; Ji, K.-M.; Liu, P.; Liu, Z.-H.; Zhang, K. Effect of Preparation Method on the Catalytic Performance of HZSM-5 Zeolite Catalysts in the MTH Reaction. Materials 2022, 15, 2206. [Google Scholar] [CrossRef]
  39. Fang, R.-M.; Feng, Q.-Y.; Huang, H.-B.; Ji, J.; He, M.; Zhan, Y.-J.; Liu, B.-Y.; Leung, D.-Y.-C. Effect of K + ions on efficient room-temperature degradation of formaldehyde over MnO2 catalysts. Catal. Today 2019, 327, 154–160. [Google Scholar] [CrossRef]
  40. Sun, D.; Wageh, S.; Al-Ghamdi, A.-A.; Le, Y.; Yu, J.-G.; Jiang, C.-J. Pt/C@MnO2 composite hierarchical hollow microspheres for catalytic formaldehyde decomposition at room temperature. Appl. Surf. Sci. 2018, 466, 301–308. [Google Scholar] [CrossRef]
  41. Lu, S.-H.; Wang, X.; Zhu, Q.-Y.; Chen, C.-C.; Zhou, X.-F.; Huang, F.-L.; Li, K.-L.; He, L.-L.; Liu, Y.-X.; Pang, F.-J. Ag–K/MnO2 nanorods as highly efficient catalysts for formaldehyde oxidation at low temperature. RSC Adv. 2018, 8, 14221–14228. [Google Scholar] [CrossRef] [PubMed]
  42. Li, D.-D.; Yang, G.-L.; Li, P.-L.; Wang, J.-L.; Zhang, P.-Y. Promotion of formaldehyde oxidation over Ag catalyst by Fe doped MnOx support at room temperature. Catal. Today 2016, 277, 257–265. [Google Scholar] [CrossRef]
  43. Huang, H.; Dai, Q.-G.; Wang, X.-Y. Morphology effect of Ru/CeO2 catalysts for the catalytic combustion of chlorobenzene. Appl. Catal. B Environ. 2014, 158–159, 96–105. [Google Scholar] [CrossRef]
  44. Cai, T.; Huang, H.; Deng, W.; Dai, Q.-G.; Liu, W.; Wang, X.-Y. Catalytic combustion of 1,2-dichlorobenzene at low temperature over Mn-modified Co3O4 catalysts. Appl. Catal. B Environ. 2015, 166–167, 393–405. [Google Scholar] [CrossRef]
  45. Xue, L.; Zhang, C.-B.; He, H.; Teraoka, Y. Catalytic decomposition of N2O over CeO2 promoted Co3O4 spinel catalyst. Appl. Catal. B Environ. 2007, 75, 167–174. [Google Scholar] [CrossRef]
  46. Ma, C.-Y.; Wang, D.-H.; Xue, W.-J. Investigation of Formaldehyde Oxidation over Co3O4-CeO2 and Au/ Co3O4-CeO2 Catalysts at Room Temperature: Effective Removal and Determination of Reaction Mechanism. Environ. Sci. Technol. ES&T 2011, 45, 3628–3634. [Google Scholar] [CrossRef]
  47. Jiang, T.-T.; Wang, X.; Chen, J.-Z.; Mai, Y.-L.; Liao, B.; Hu, W. Hierarchical Ni/Co-LDHs catalyst for catalytic oxidation of indoor formaldehyde at ambient temperature. J. Mater. Sci. Mater. Electron. 2020, 31, 3500–3509. [Google Scholar] [CrossRef]
  48. Wang, M.; Zhang, L.-X.; Huang, W.-M.; Xiu, T.-P.; Zhuang, C.-G.; Shi, J.-L. The catalytic oxidation removal of low-concentration HCHO at high space velocity by partially crystallized mesoporous MnOx. Chem. Eng. J. 2017, 320, 667–676. [Google Scholar] [CrossRef]
  49. Han, Z.; Wang, C.; Zou, X.; Chen, T.; Dong, S.; Zhao, Y.; Xie, J.; Liu, H. Diatomite-supported birnessite-type MnO2 catalytic oxidation of formaldehyde: Preparation, performance and mechanism. Appl. Surf. Sci. 2020, 502, 144201. [Google Scholar] [CrossRef]
Figure 1. XRD patterns of catalysts. (a) XRD patterns of catalysts treated with different acid concentrations; (b) XRD patterns of catalysts with different acid treatment times.
Catalysts 12 01667 g001
Figure 2. SEM images and particle size distributions of MnNR (a); MnNR-0.1ac-6h (b); MnNR-0.3ac-6h (c); MnNR-0.5ac-6h (d); MnNR-0.7ac-6h (e); MnNR-0.3ac-3h (f); MnNR-0.3ac-9h (g); MnNR-0.3ac-12h (h); MnNR-0.3ac-24h (i).
Catalysts 12 01667 g002
Figure 3. H2-TPR profiles of various catalysts. (a) H2-TPR profiles of catalysts treated with different acid concentrations; (b) H2-TPR profiles of catalysts treated with different acid treatment times.
Catalysts 12 01667 g003
Figure 4. O2-TPD profiles of various catalysts. (a) O2-TPD profiles of catalysts treated with different acid concentrations; (b) O2-TPD profiles of catalysts treated with different acid treatment times.
Catalysts 12 01667 g004
Figure 5. XPS spectra of catalysts for different acid treatment conditions and high-resolution XPS spectra of Mn 3s, Mn 2p, and O 1s. (a) high-resolution XPS spectra of catalysts treated with different acid concentrations of Mn 3s, Mn 2p, O 1s; (b) high-resolution XPS spectra of catalysts treated with different acid treatment times of Mn 3s, Mn 2p, O 1s; (c) XPS spectra of catalysts treated with different acid concentrations of Mn 2p; (d) XPS spectra of catalysts treated with different acid treatment times of Mn 2p; (e) XPS spectra of catalysts treated with different acid concentrations of O 1s; (f) XPS spectra of catalysts treated with different acid treatment times of O 1s.
Catalysts 12 01667 g005
Figure 6. Experimental evaluation results of catalysts with different concentrations of acid treatment (GSHV = 3000 h−1, 5 ± 1 ppm).
Catalysts 12 01667 g006
Figure 7. Experimental evaluation results of catalysts with different times of acid treatment (GSHV = 3000 h−1, 5 ± 1 ppm).
Catalysts 12 01667 g007
Figure 8. Experimental evaluation results of MnNR-0.3ac-6h catalysts with different GSHVs.
Catalysts 12 01667 g008
Figure 9. Stability test results of the MnNR-0.3ac-6h catalyst.
Catalysts 12 01667 g009
Table 1. Physical properties of the as-prepared samples.
SampleSBET (m2/g)Dp (nm)Vp (cm3/g)
MnNR47.611.60.14
MnNR-0.1ac-6h49.718.20.20
MnNR-0.3ac-6h51.820.20.21
MnNR-0.5ac-6h49.620.30.24
MnNR-0.7ac-6h48.020.60.25
MnNR-0.3ac-3h48.217.10.20
MnNR-0.3ac-9h50.920.90.20
MnNR-0.3ac-12h48.421.30.22
MnNR-0.3ac-24h45.522.20.22
Table 2. Chemical states of the surface elements determined using XPS.
SampleMn3+Mn4+OIOIIMolar Ratio of Surface Elements
OII/OI + OII aMn3+ aMn4+ a
MnNR641.8643529.9531.135%31%69%
MnNR-0.1ac-6h641.9643.1529.8531.140%35%65%
MnNR-0.3ac-6h641.9643.1529.8531.248%47%53%
MnNR-0.5ac-6h642643.3529.8531.242%56%44%
MnNR-0.7ac-6h642.1643.4529.7531.341%57%43%
MnNR-0.3ac-3h641.9643529.8531.248%33%67%
MnNR-0.3ac-9h641.9643.1529.8531.248%50%50%
MnNR-0.3ac-12h642643.1529.7531.247%52%48%
MnNR-0.3ac-24h642643.5529.7531.245%61%39%
a Surface element molar ratio calculated according to the peak areas of the XPS.
Publisher’s Note: MDPI stays neutral with regard to jurisdictional claims in published maps and institutional affiliations.

