Article

Limestone Calcination Kinetics in Microfluidized Bed Thermogravimetric Analysis (MFB-TGA) for Calcium Looping

Key Laboratory for Thermal Science and Power Engineering of Ministry of Education, Department of Energy and Power Engineering, Tsinghua University, Beijing 100084, China
*
Author to whom correspondence should be addressed.
Catalysts 2022, 12(12), 1661; https://doi.org/10.3390/catal12121661
Submission received: 16 November 2022 / Revised: 13 December 2022 / Accepted: 14 December 2022 / Published: 17 December 2022

Abstract

:
Limestone calcination is an important part of calcium looping (CaL) technology and is critical to the design and operation optimization of fluidized bed reactors. However, obtaining a method of measuring the fast calcination kinetics in a fluidizing environment with isothermal conditions is still a challenge in the field of calcium looping. We address this challenge in this work and develop a new method of obtaining limestone calcination kinetics by injecting limestone particles into the hot fluidizing sands in a microfluidized bed thermogravimetric analysis (MFB-TGA) with a mass measurement resolution of 1 mg. The calcination characteristics of limestone are investigated at different particle sizes (150–1250 μm), temperatures (750–920 °C), and CO2 concentrations (0–30 vol.%). The experimental data measured from MFB-TGA were analyzed using a detailed model including surface reaction and intraparticle and external diffusion. The results show that the kinetics of limestone calcination measured by MFB-TGA are faster than those measured via regular TGA. This particle-injecting method of MFB-TGA provides a new experimental idea for measuring fast calcination kinetics occurring inside fluidized bed reactors and provides guidance on the application of CaL technology.

1. Introduction

Calcium looping technology is a promising technology based on the calcination/carbonation reaction of calcium carbonate (CaCO3) [1,2]. It can be widely applied in carbon capture, adsorption-enhanced steam methane reforming (SE-SMR), integrated CO2 capture and conversion, and thermochemical heat storage [3,4,5,6,7]. CaL technology typically involves the use of dual interconnected circulating fluidized bed (CFB) reactors [8,9]. In the first reactor, lime (CaO) reacts with CO2 in the temperature range of 600–700 °C to form CaCO3. The CaCO3 is then subsequently transported to the second CFB reactor for calcination. The regenerated CaO is then looped back to the first reactor. CaL technology has the following advantages [10,11]: abundant and inexpensive natural limestone with high theoretical CO2 capture capacity and relatively low energy consumption; high energy storage density and great heat recovery potential due to high-temperature carbonation reaction. The CaCO3 calcination stage, as a major part of the CaL technology, has a significant influence on the design and operation of the regeneration reactor, system integration and optimization, and the sintering of the CaO absorbent [12,13].
CaCO3 calcination is a complex physical and chemical process in which reaction, heat transfer, and mass transfer are mutually coupled [14]. Researchers have studied the influence mechanism of CaCO3 calcination, and it is generally accepted that with a decrease in particle size, the influence of heat transfer on calcination kinetics weakens and the influence of chemical reaction enhances [15,16,17]. For very small particles (<90 µm), the chemical reaction is the controlling step [17]. For particles >6 mm, heat transfer becomes a key process [18]. For the particle size between these values, both chemical reaction and mass transfer control the calcination kinetics [19]. Several models have been developed in the past to describe the calcination behavior, including the shrinking core model [20], the grain model [21], the uniform transformation model [17], and the random pore model [15]. The calcination of CaCO3 particles with low porosity has been typically described using the shrinking core model, which assumes that there is an obvious reaction interface between the nonporous CaCO3 and the generated CaO [19,20,22]. However, the diffusion of generated CO2 through the CaO layer and external diffusion processes in the atmosphere are generally ignored. Diffusion resistance has an important influence on the decomposition of kinetics, especially for larger particle sizes [23]. In addition, due to several factors affecting the calcination of CaCO3, such as particle size, temperature, CO2 concentration, and experimental apparatus, there is no consensus on the calcination mechanism of CaCO3 particles, and the obtained kinetic parameters are markedly different. It has been reported [24,25,26] that the activation energy of CaCO3 calcination is in the range of 100–230 kJ/mol. Furthermore, researchers [19,27,28,29] have found that the CO2 concentration in the atmosphere has a significant effect on the CaCO3 calcination rate. The effect of CO2 partial pressure on the calcination is normally described with the form of (1 − P/Peq)n (where P is the CO2 partial pressure in the atmosphere and Peq is the CO2 equilibrium partial pressure), and the value of the exponent n ranges from 0.5 to 2 [19,30,31]. Some researchers adopt surface elementary reactions to explain the chemical reaction kinetics of CaCO3 calcination in CO2 atmosphere [19,32,33]. The broad activation energy and CO2 partial pressure ranges reveal that calcination experiments and modeling under fluidized bed conditions are of great significance for the future scaling up of CaL technology. Regardless of the concept used for describing the calcination kinetics, the calcination data must be measured based on an accurate experimental method.
In order to obtain the kinetics of CaCO3 calcination, there are mainly the following methods: (i) Thermogravimetric analyzer (TGA) is a method commonly adopted by researchers [22,25,29,34,35,36]. However, it is still a challenge to obtain calcination results at constant temperatures [36], especially at high temperatures. In addition, the heating rate of particles is usually lower than 100 K/min, and the diffusion resistance is serious in TGA instruments, which is not conducive to the development of kinetics models. The solid sample in the crucible of TGA is in a packed state, which is somewhat different from the fluidization in a fluidized reactor. (ii) Fluidized bed reactor based on gas signal measurement [27]. The vigorous movement of solid particles means excellent heat and mass transfer, which is a natural advantage of fluidized bed reactors for kinetic studies. The difficulty of the method lies in the capture of minor change in the gas concentration signal of rapid reaction, especially when the CO2 produced by the sample is very little at high CO2 concentrations [37]. Moreover, the blend of gas species affects the original signal and causes errors when there are variations in the concentration of multiple constituent gases in the experiment. (iii) Tube furnace [38] and high-temperature gas–solid suspension furnace [39,40]; the particle heating rate is fast, but the sample size is smaller than ~70 μm, and the residence time is shorter than 5 s. At the same time, the gas and particles inside the drop tube furnace are in entrained flow, while the gas inside the fluidized bed is divided into a bubble phase and an emulsion phase. The particles inside the fluidized bed will form a dense phase. Therefore, the calcination kinetics obtained from drop tube furnace cannot be accurately applied for the development of a fluidized bed reactor. (iv) In situ XRD method [32]; the change in crystal structure of CaCO3 particles during calcination is analyzed using X-ray diffraction, which can be combined with TGA to obtain in situ particle conversion.
Limestone calcination for calcium looping occurs in a fluidizing state; therefore, it is necessary to measure the calcination kinetic data from the fluidized bed reactor. The aim of the work is to obtain the limestone calcination characteristics in the fluidized bed condition and to describe the calcination kinetics to guide the design and operation scale-up of the fluidized bed reactor. First, based on the previously constructed MFB-TGA with a mass measurement resolution of 1 mg and strong heat and mass transfer properties [41], a new method of injecting the limestone particles into the MFB-TGA is proposed and developed to measure the calcination kinetics under the fluidization and isothermal conditions with various particle sizes, temperatures, and CO2 partial pressures under constant temperature conditions. Then, a shrinking core model is established considering the effects of CO2 concentration and mass transfer rate on the calcination process. Finally, the relative importance of surface reactions, intraparticle diffusion, and external gas diffusion is analyzed and discussed based on experimental data and established models.

2. Results

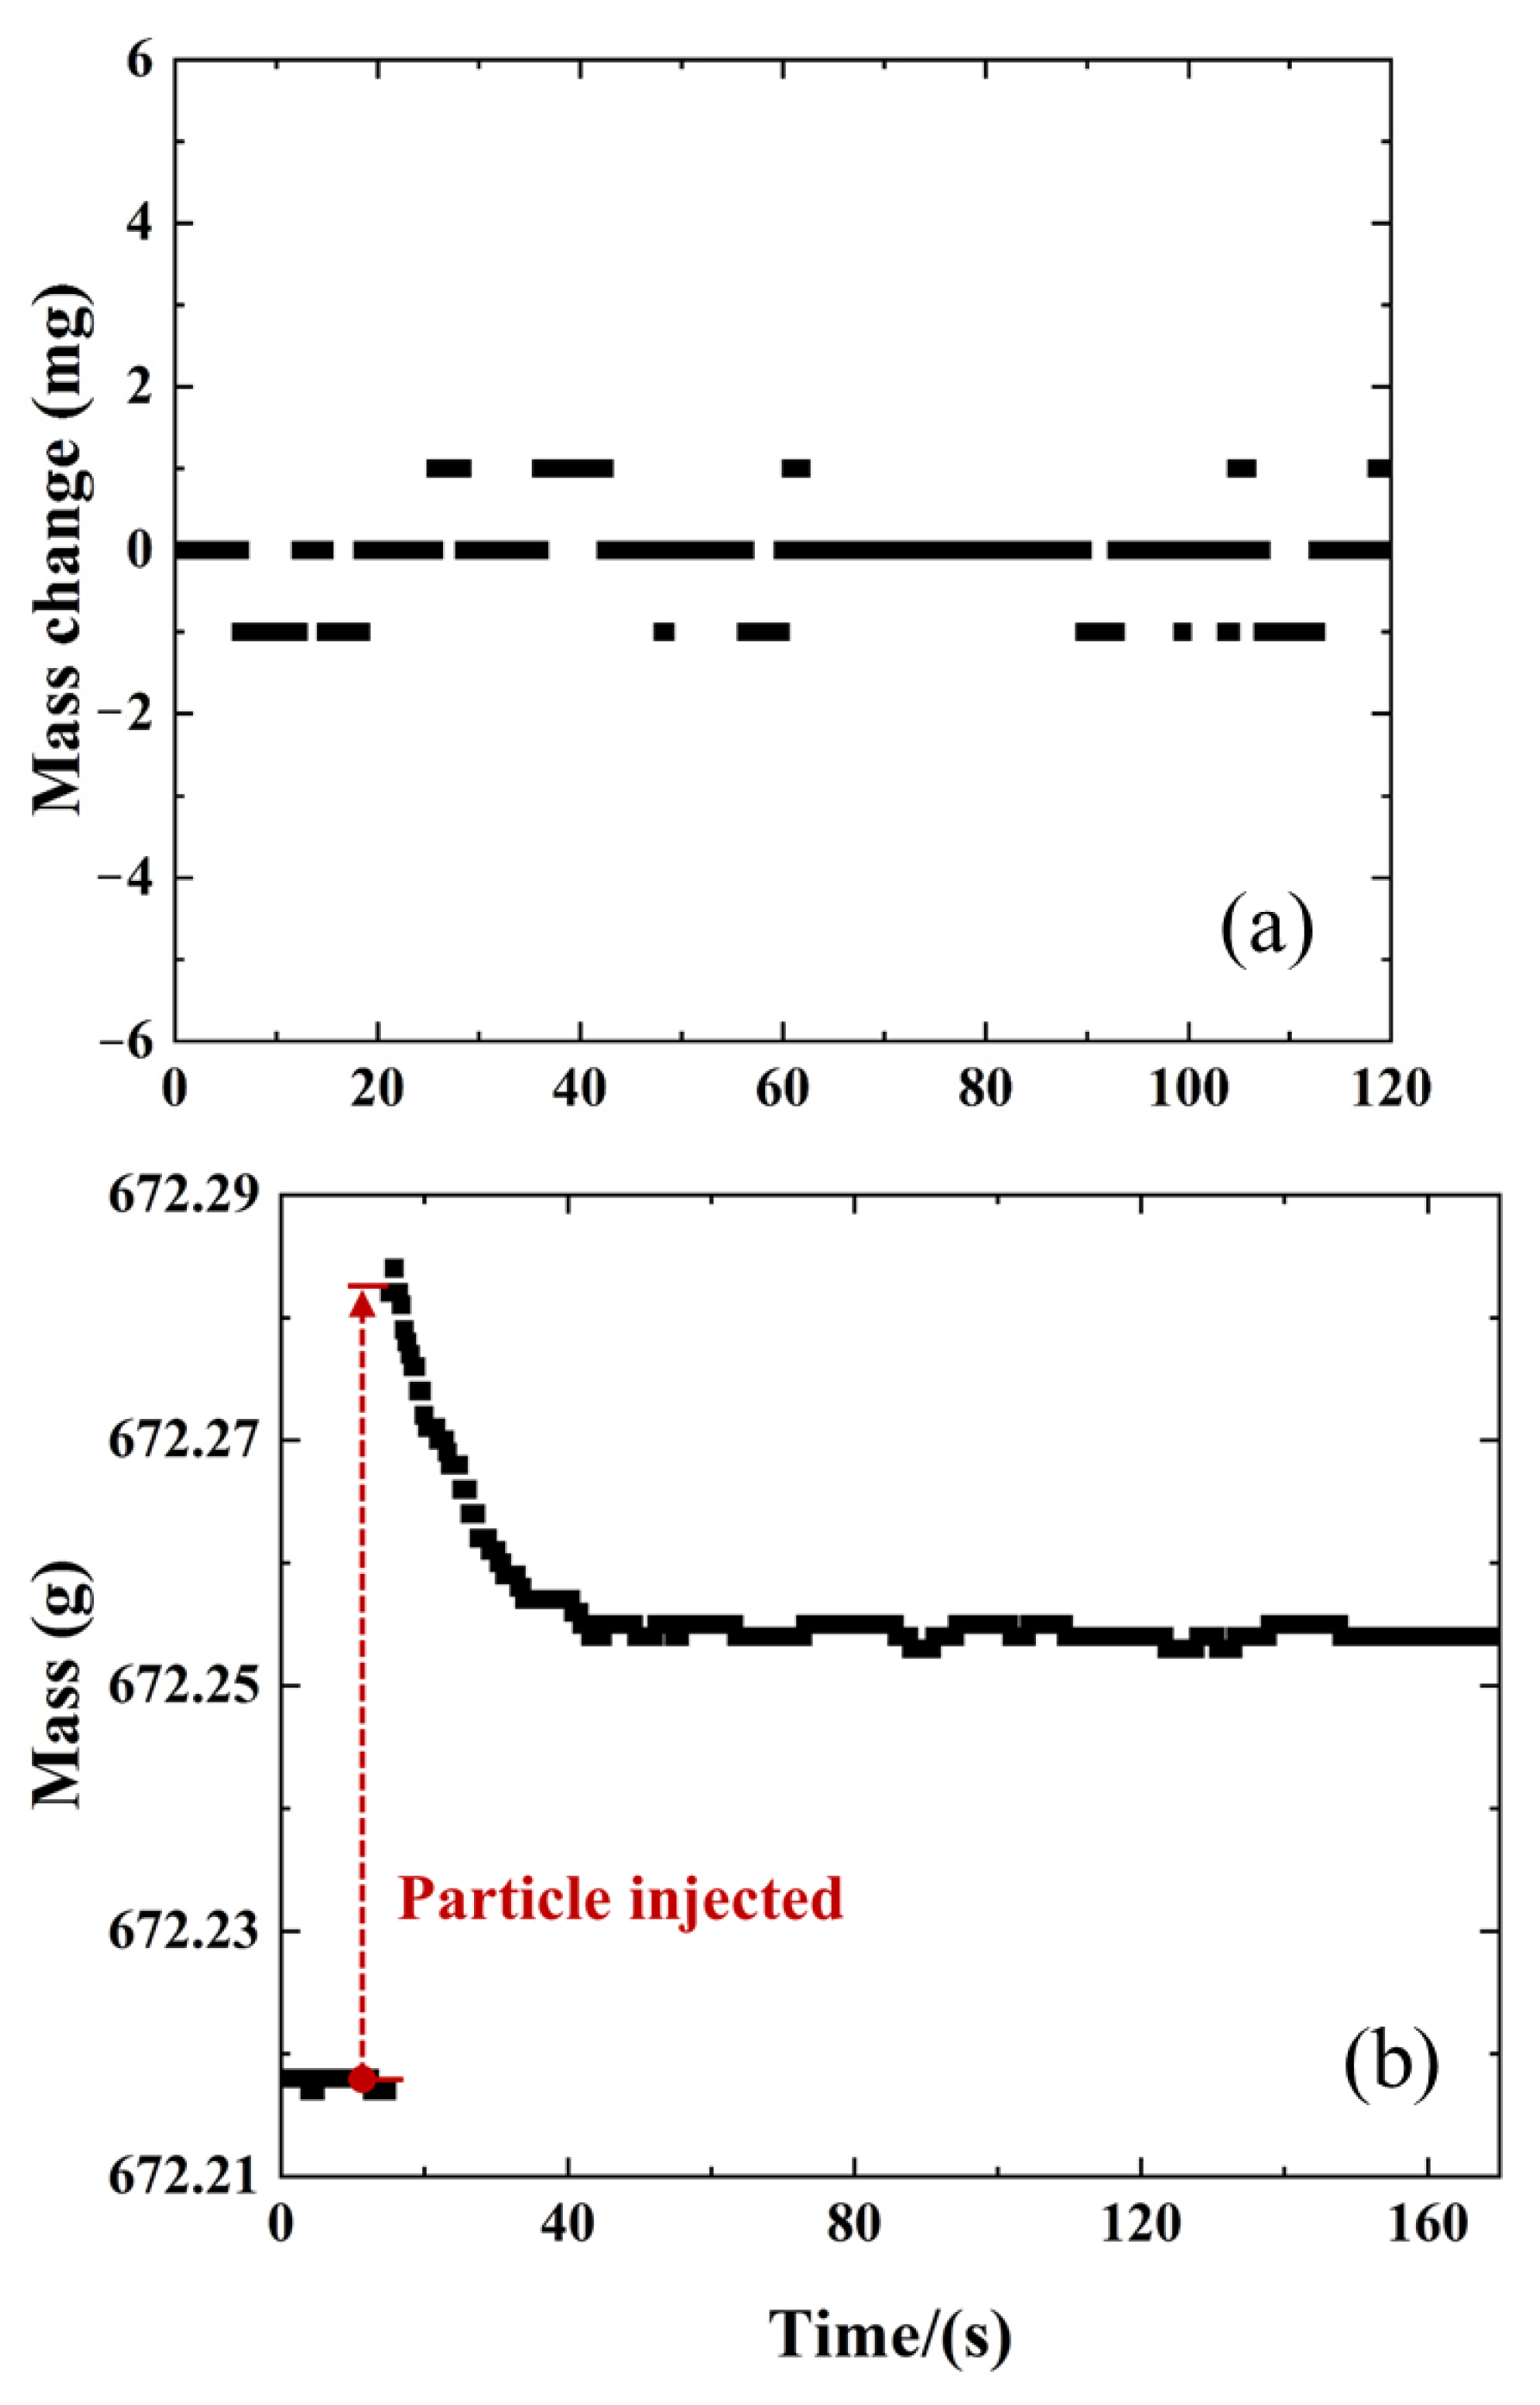
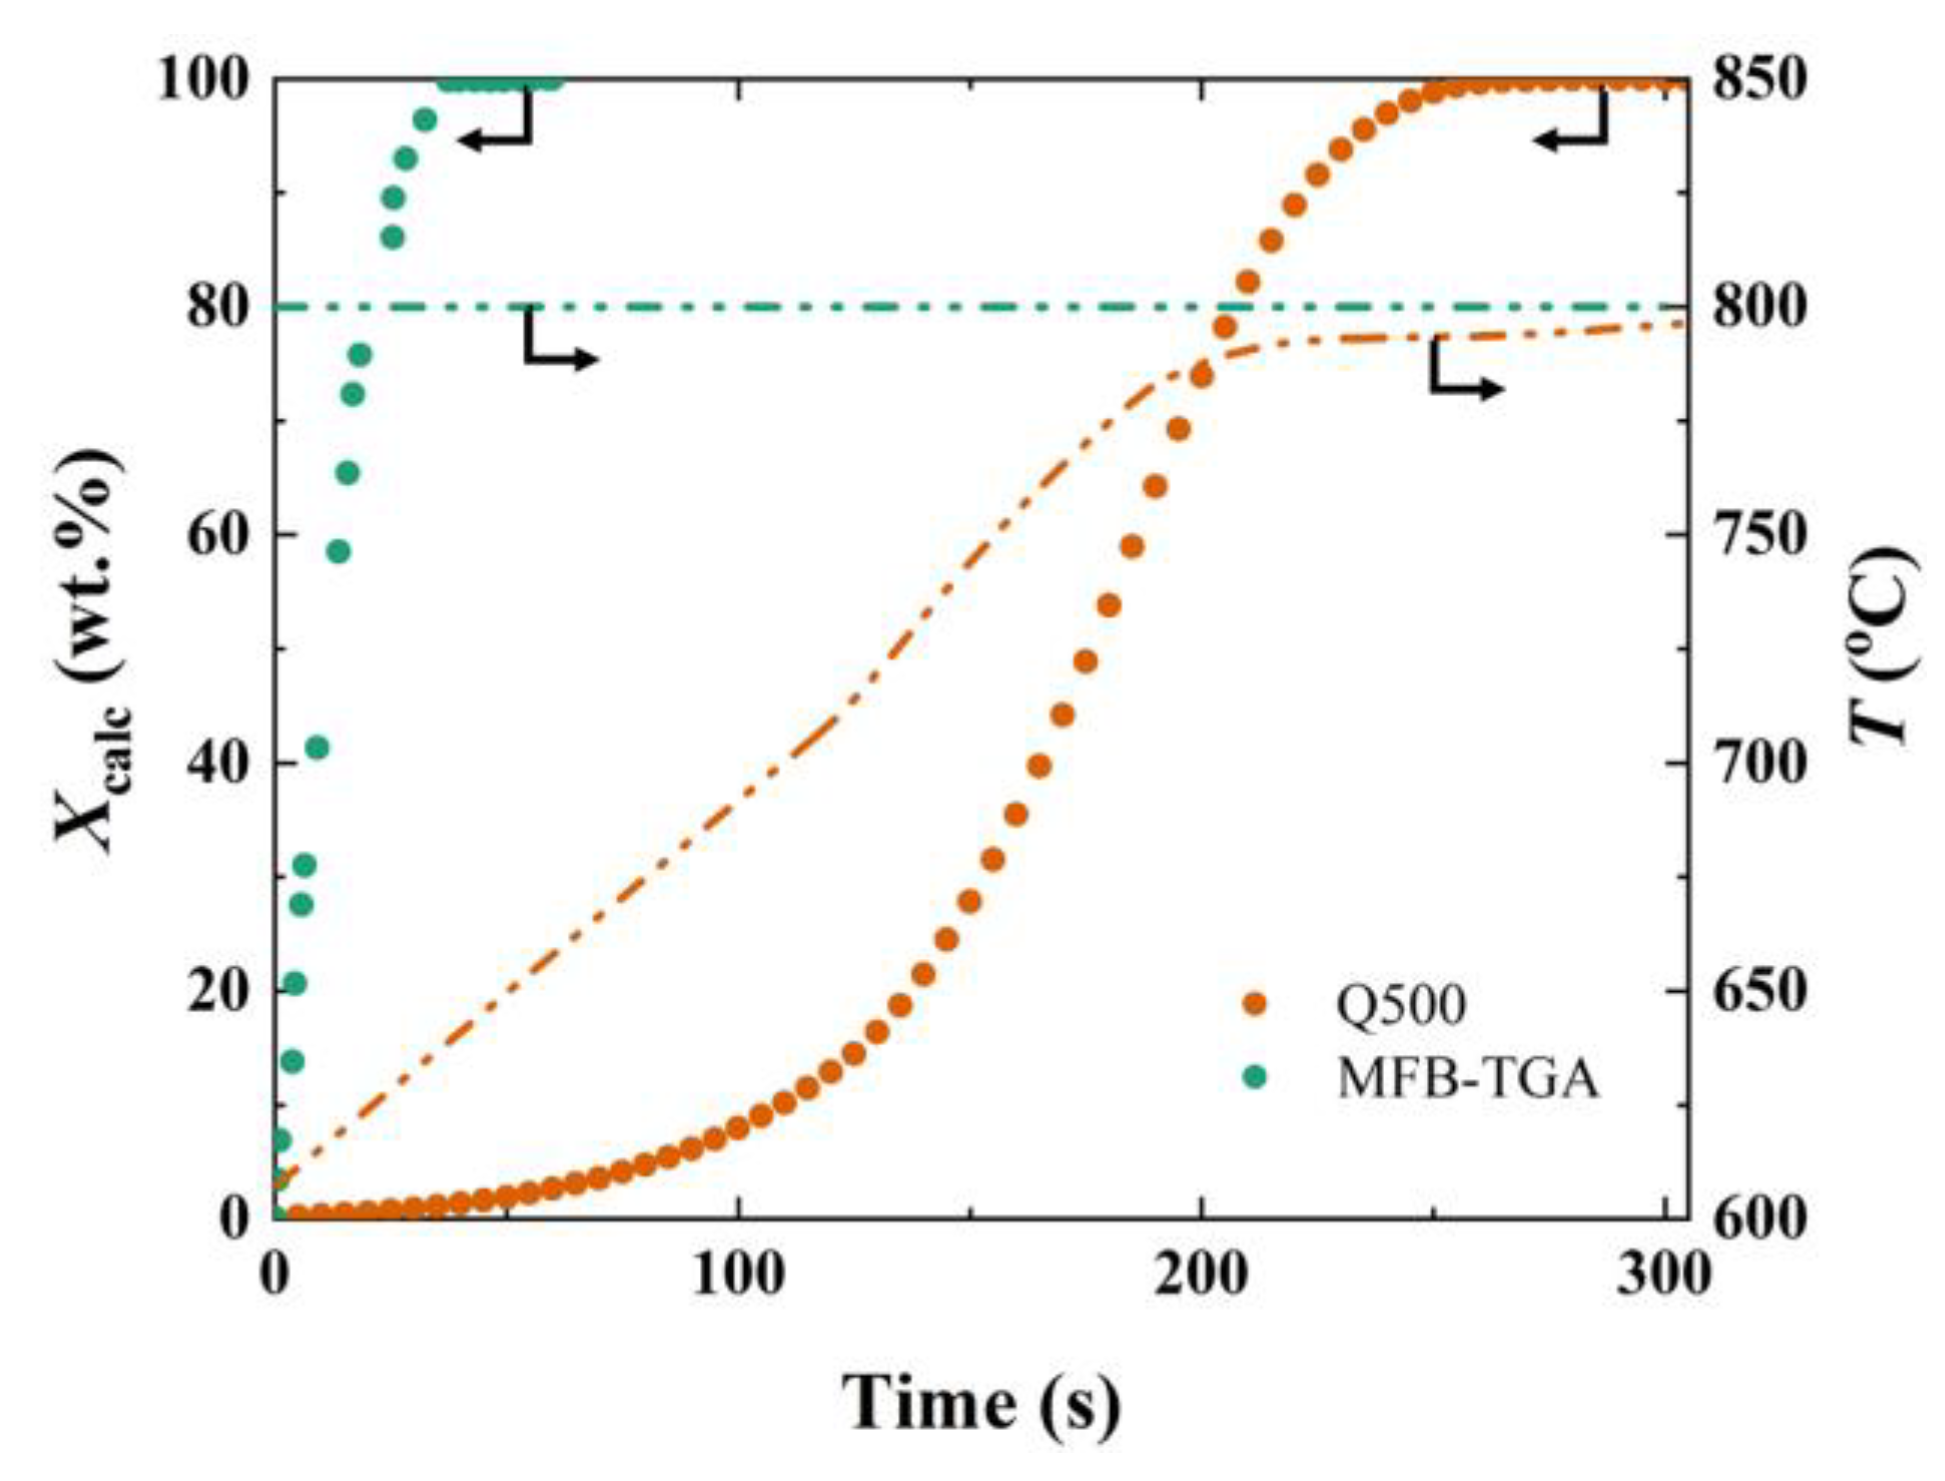
2.1. Comparison of MFB-TGA with Regular TGA

TGA is a commonly used commercial instrument for measuring the kinetics of limestone calcination [22,25,29,35]. In the TGA experiment, a 5–10 mg sample is placed in a crucible and heated at a heating rate of 50 K/min to obtain the weightless curvature of the limestone. It can be seen from Figure 1 that the limestone particles are decomposed during the heating process. The decomposition characteristics of limestone particles under constant temperature conditions are difficult to obtain, which is of great significance for the establishment of the decomposition models and the determination of kinetics. Furthermore, the conversion of limestone particles in TGA is slower compared to MFB-TGA due to the gas diffusion resistance. Thus, a smaller value of calculated chemical reaction rate constant could be obtained from TGA results. Correspondingly, the controlling step may be wrongly determined as a chemical reaction. It still remains a challenge for the TGA method to eradicate the mass transfer effects and maintain isothermal decomposition, especially for rapid reactions [41,42]. MFB-TGA couples the accurate and real-time quality monitoring characteristics of TGA and the motion state of particle fluidization with good heat and mass transfer effects [27]. The CO2 produced by the calcination of the 60–70 mg limestone sample is limited. Coupled with the fast external diffusion rate, the effect of mass transfer is significantly reduced. Details on the reduction of mass transfer effects by MFB-TGA can be found in previous works [41,43].

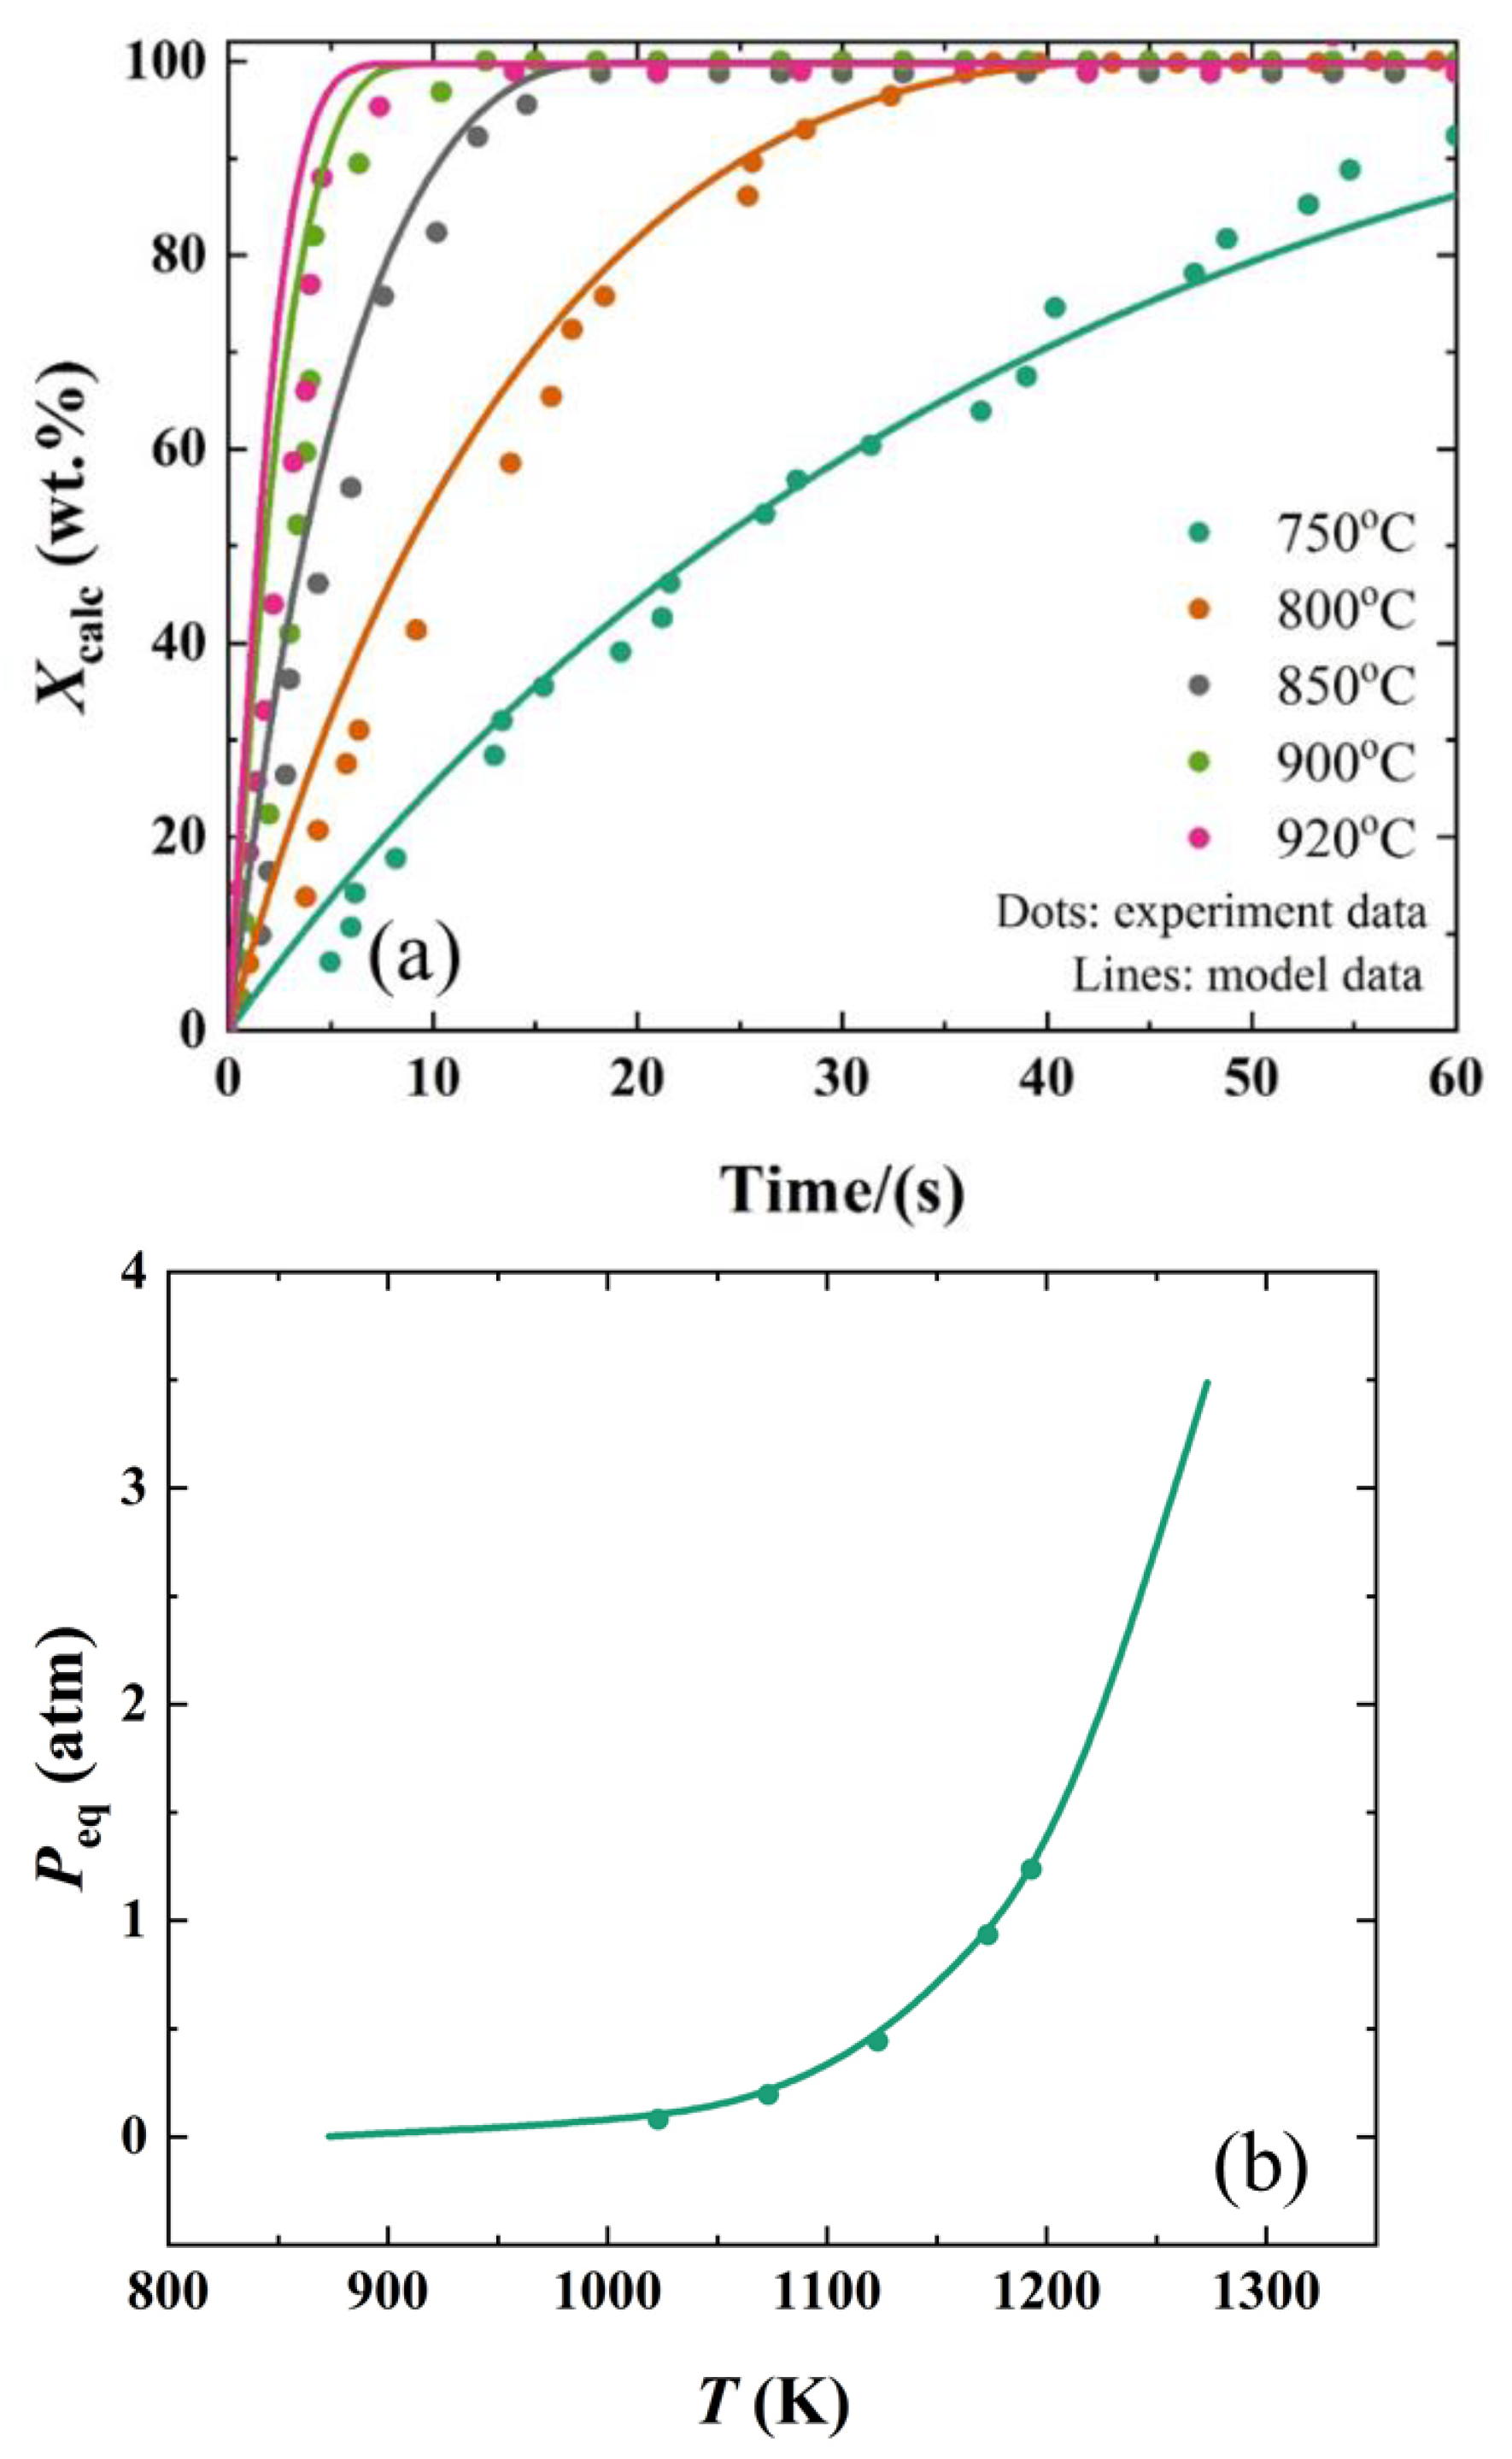
2.2. Effect of Temperature on the Calcination Kinetics

Temperature has a significant effect on the calcination performance of limestone in a broad range. Calcination experiments of limestone with particle sizes of 150 μm are conducted at temperatures from 750 to 920 °C under N2 atmosphere in MFB-TGA apparatus. The model results are compared with the experimental data of MFB-TGA at various temperatures shown in Figure 2a. The conversion of limestone particles increases rapidly from initial to full conversion with time, especially at high temperature. Under 900 °C, it only takes ~10 s for particle conversion to achieve ~100%. Even at 750 °C, the particle conversion reaches more than 90% in ~60 s, which is significantly faster than the calcination rate reported in other works [23,25,44]. It is mainly due to the fact that the limestone particles are injected into the quartz reactor in the MFB-TGA experiments. The particles achieve the target temperature and CO2 concentration in an instant for calcination. In the state of vigorous fluidization, the particles are well blended with the inert bed material, and the temperature of the particles are basically kept consistent with the inert bed material.
The conversion of limestone particles increases significantly with temperature. At 750, 800, 850, 900, and 920 °C, the time for the particle conversion to attain ~90% corresponds to 54 s, 25 s, 15 s, 8 s, and 6 s, respectively. This is mainly attributable to the calcium carbonate calcination reaction being an endothermic reaction with a standard enthalpy of +178 kJ/mol. In addition, as shown in Figure 2b, the thermodynamic equilibrium partial pressure of CO2 corresponding to calcium carbonate calcination increases exponentially with temperature. Based on Equation (29), the calcination driving force (Peq-Pg) increases, resulting in a gradual increase in the calcination rate. The above discussion indicates that the model can predict well the effect of temperature on calcination characteristics.

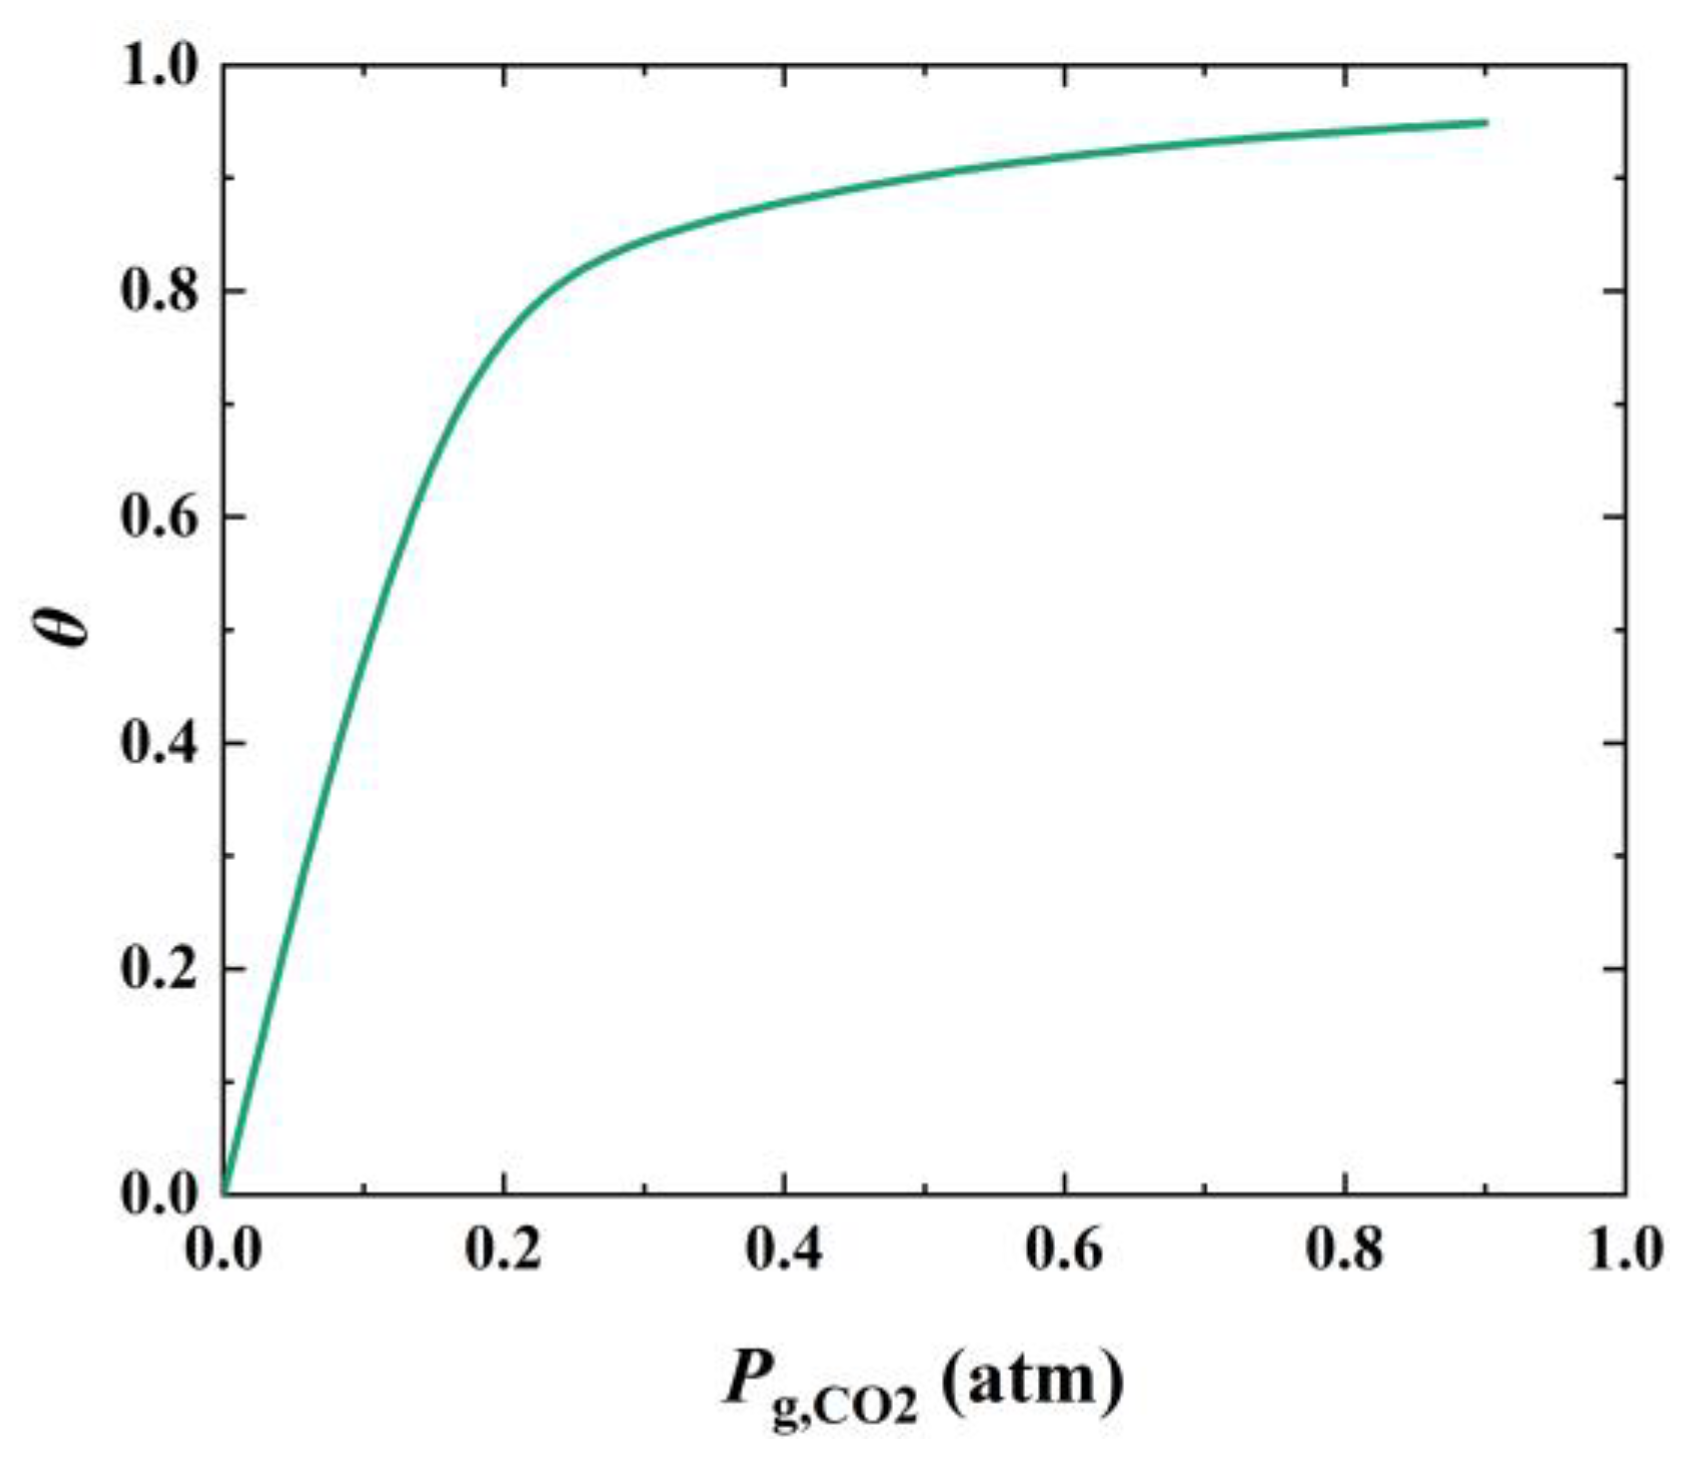
2.3. Effect of CO2 Concentration on the Calcination Kinetics

The effect of CO2 concentration in the gas phase on the limestone calcination is displayed in Figure 3. With the increase of CO2 concentration in the gas phase, the conversion of limestone decreases significantly under a certain temperature. At 900 °C, when the CO2 concentration is 0 vol.%, the particles only require ~11 s to achieve complete conversion, while under 30 vol.% atmosphere, the particle conversion is only 70 wt.% within 80 s. At 920 °C, the particles can be almost completely converted. The calcination rate of limestone under different CO2 concentrations can be well predicted using the kinetic model established in Section 5.
The MFB-TGA experiments are conducted under atmospheric pressure, and thus the volume fraction of CO2 determines the CO2 partial pressure in the gas phase. It can be obtained from Equation (15) that the partial pressure of CO2 has a significant effect on the chemical reaction rate of calcium carbonate calcination. With the increase in CO2 partial pressure Pg in the gas phase from 0 vol.% to 30 vol.% under 900 °C, the comprehensive chemical reaction constant kc decreases dramatically by ~2 orders, which significantly reduces the calcination rate of limestone particles. With the increase in CO2 concentration, the intraparticle diffusion rate of CO2 generated by particle calcination from the reaction surface to the particle surface decreases, especially at the initial stage of the reaction. As the reaction proceeds, the driving force decreases (Pi-Pg), Pi is close to Pg, and the influence of diffusion is no longer significant.

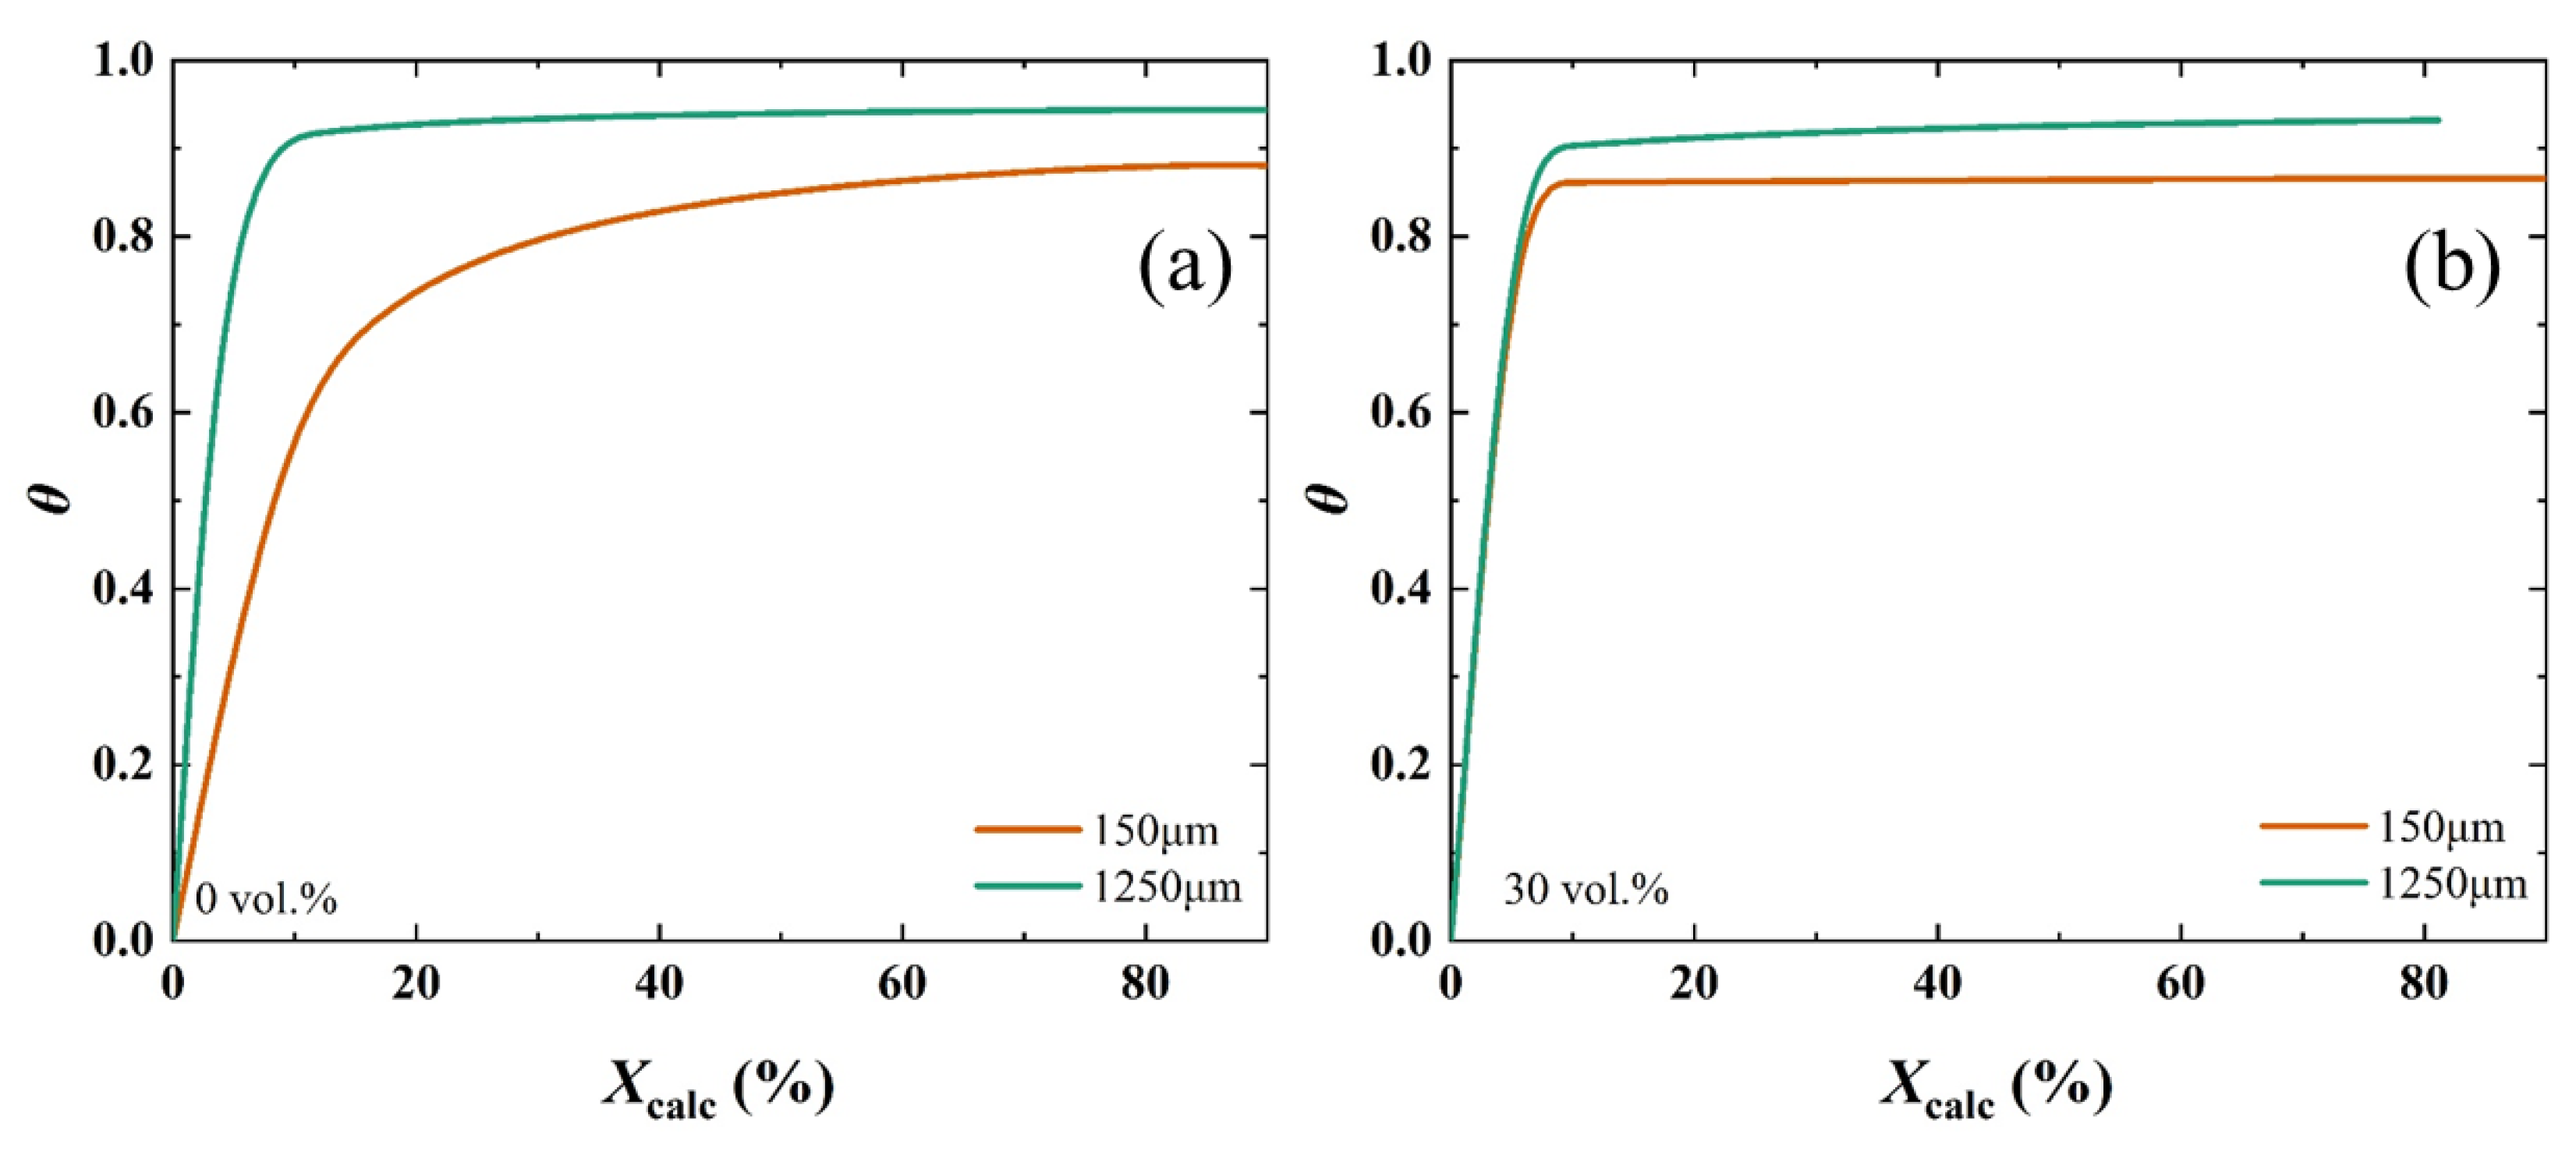
2.4. Effect of Particle Size on the Calcination Kinetics

Particle size is an important factor determining calcination kinetics and generally affects external and intraparticle gas diffusion resistance. Limestone particles of different particle sizes are applied in practice. Thus, it is necessary to investigate the calcination characteristics of particles in different particle size ranges. The calcination process of 150–1250 μm limestone particles under 900 °C and 0 vol.% and 30 vol.% CO2 concentration is explored in this work. As shown in Figure 4, the limestone particles conversion decreases with the particle size from 150 μm to 1250 μm. For the smaller particles of 150 μm, it only takes ~10 s to complete the calcination process, while for the larger particles of 1250 μm, the conversion of the particles is only ~90 wt.% within 80 s. An interesting finding in the work is that when the CO2 concentration in the gas phase increases from 0 vol.% to 30 vol.%, the decrease in the conversion of limestone particles becomes less obvious with the increase of particle size. This indicates that the effect of CO2 concentration in the gas phase on the reduction of the calcination rate of small particle limestone is higher than that of large particle size. Furthermore, it can be seen that the results of the prediction model are in good agreement with the experimental values.
For larger particle sizes, the gas mass transfer resistance is larger both for external and intraparticle diffusion. Thus, the CO2 partial pressure on the particle surface is higher than for smaller particles. With the continuous progress of the chemical reaction, the change of CO2 partial pressure on the particle surface under high CO2 concentration in the gas phase is smaller than that under lower CO2 concentration, which results in the change of particle conversion with particle size no longer being significant at high CO2 concentrations.

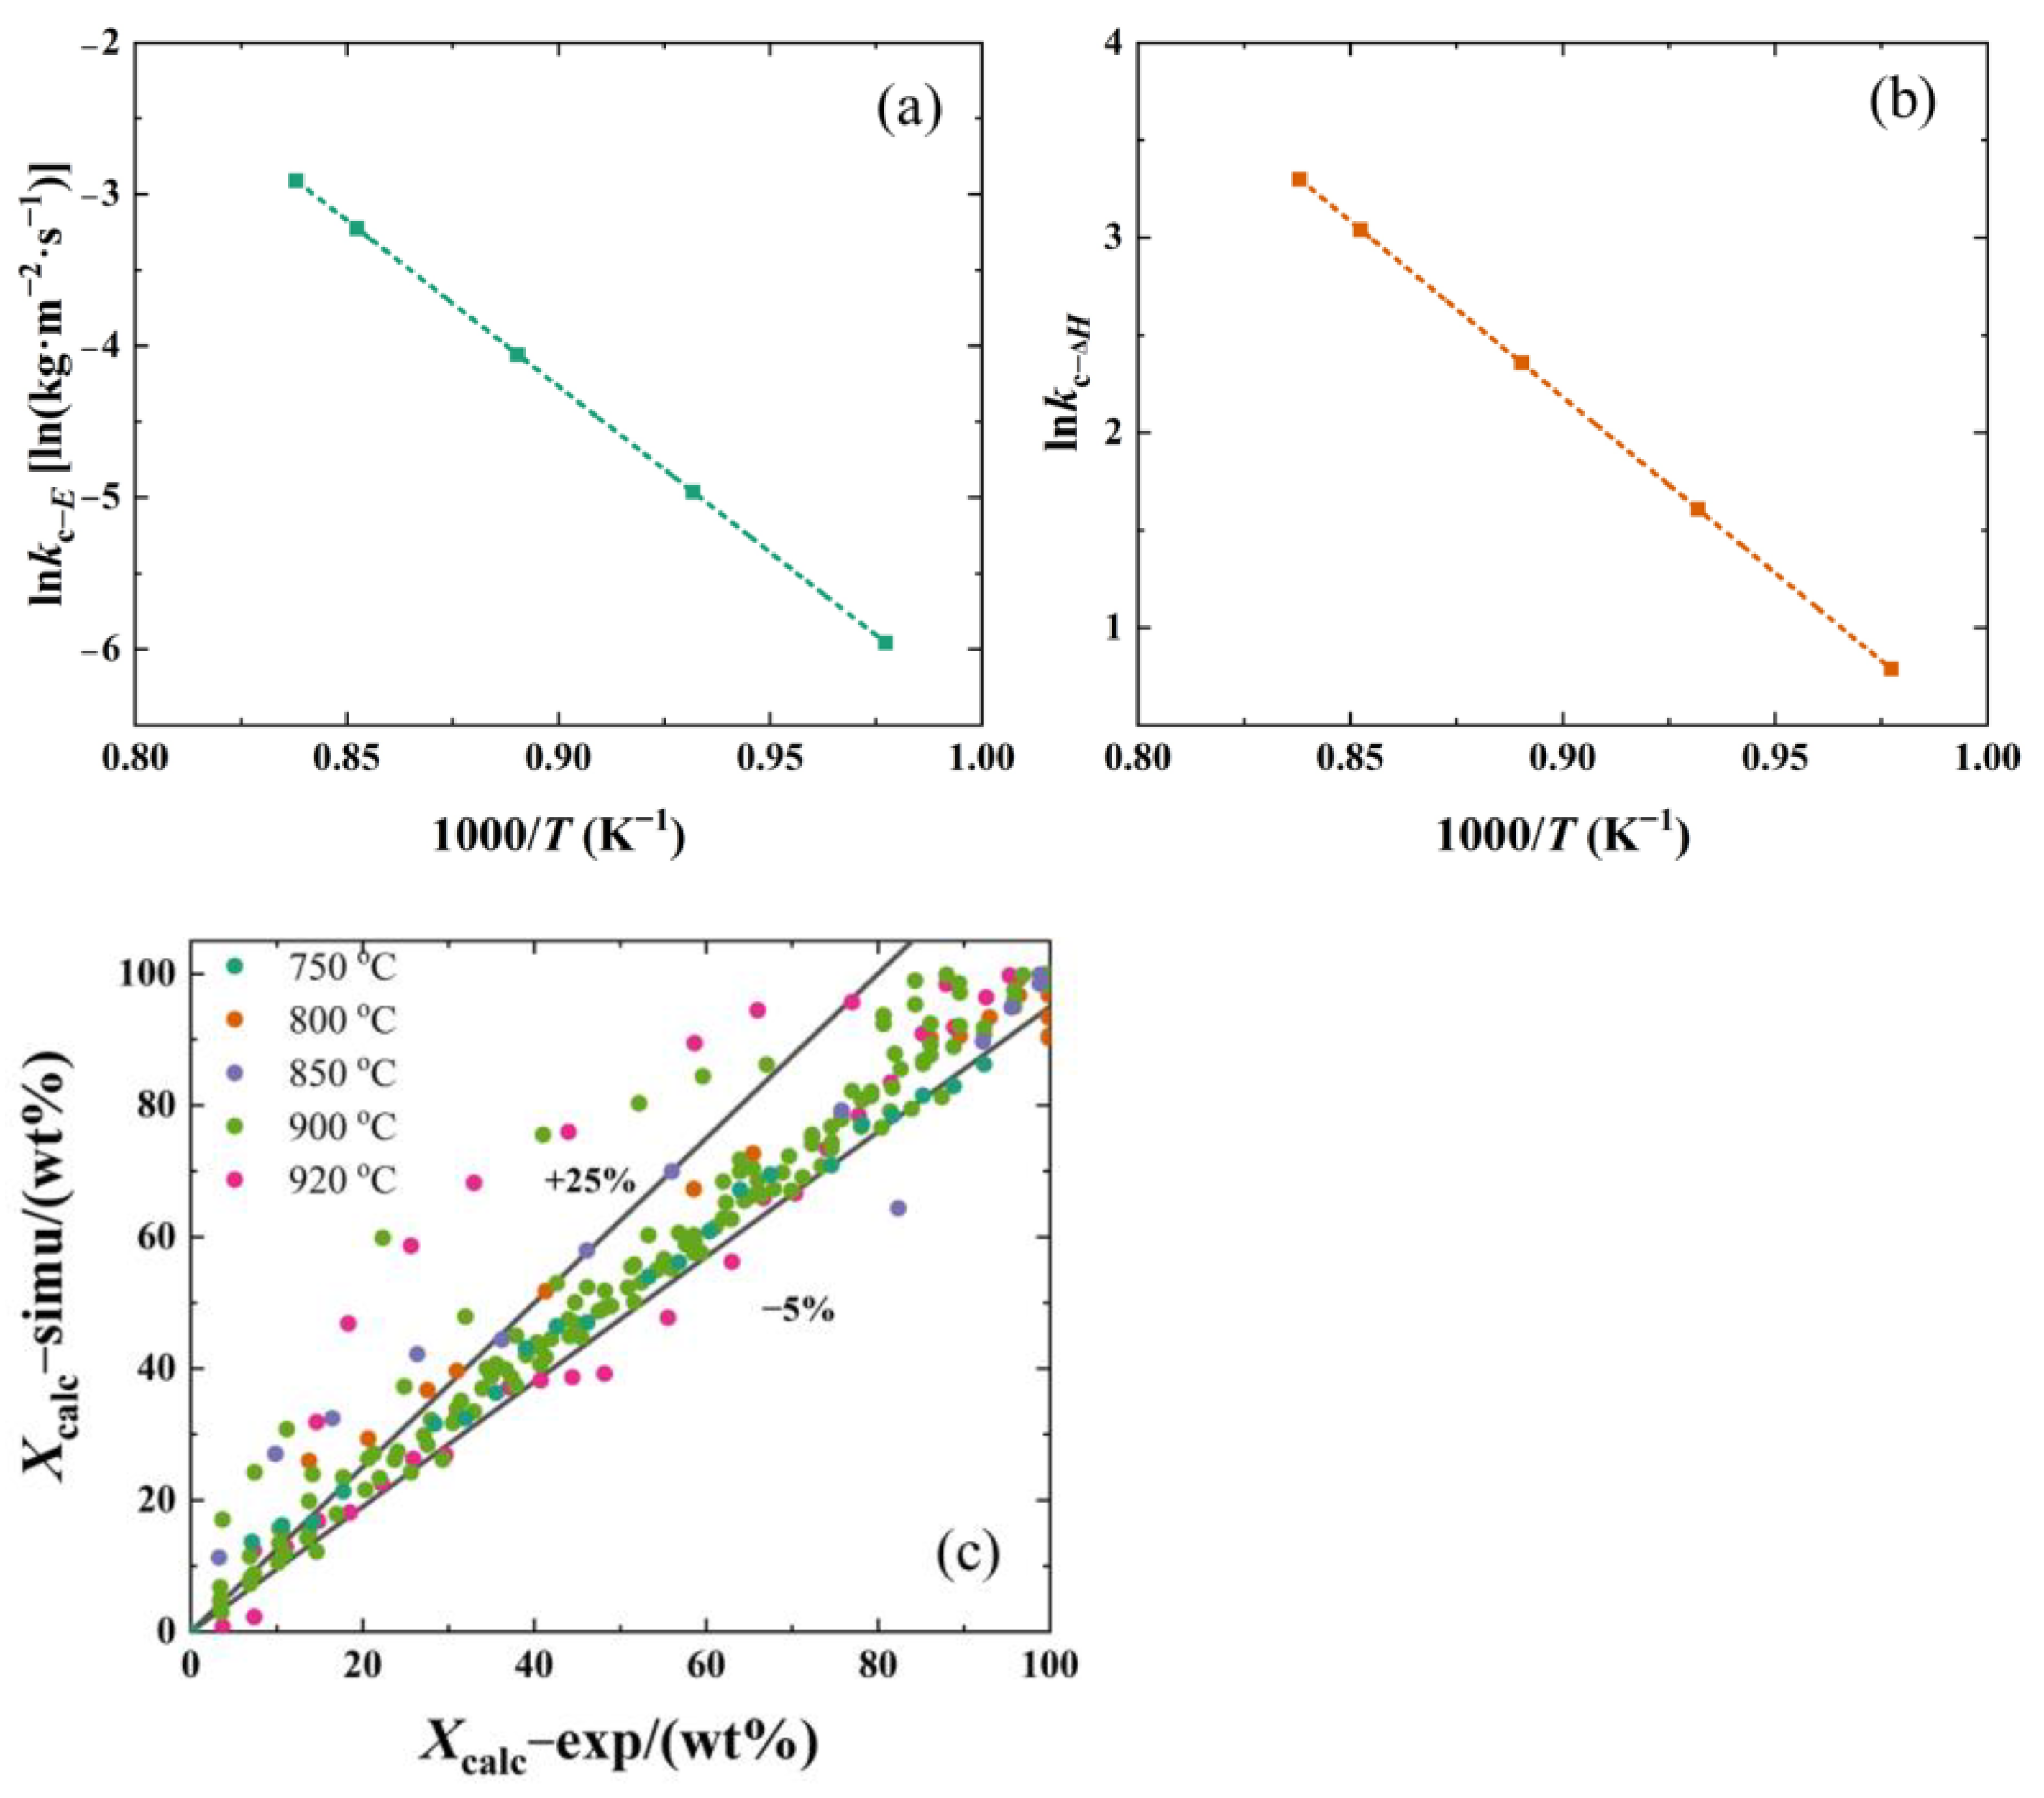
2.5. Determination of Kinetic Parameters

Based on the comparison of the experimental results with the model established in Section 5, the value of the activation energy can be obtained from the slope of the fitted line, and the value of the pre-exponential factor can be obtained from the vertical intercept of the fitted line in Figure 5. The kinetic parameter calculation is summarized in Table 1. The activation energy of the chemical reaction rate constant kf is 182 kJ/mol, which indicates that the temperature has an extremely distinct effect on the value of the chemical reaction rate constant in the range of 750–920 °C. Activation energies have been reported to be in the range of 100–230 kJ/mol depending on the specific calcination conditions and the established model [24]. Escardino et al. [45] obtained an apparent activation energy value of 175 kJ/mol for the direct chemical reaction of thermal calcination. Garcia et al. [19] studied limestone and dolomite, with activation energies ranging from 114–166 kJ/mol. The E values measured in the work are close to those reported by other researchers [19,22,27,29]. The activation energy of the thermodynamic equilibrium constant K1 in the reaction kinetics in this work is 150 kJ/mol, which is consistent with the value reported by Jose et al. [33]. Other parameters in the model are summarized in Table 1.
Figure 5c compares the model results and the experimental data. Most of the errors between the model and experimental results are between −5% and +20%, indicating that the model can reasonably predict the decomposition conversion within the experimentally investigated range.

3. Discussion

Based on Equation (10), the fraction occupied by *CO2 in the adsorbed state on the particle surface, θ, is calculated as:
θ = P i K 2 + P i = P eq K r k c ( P eq P g ) P eq K 1 + P eq K r k c ( P eq P g )
θ represents the fraction of active sites on the surface of the limestone particles occupied by CO2 produced by calcination. The relationship between θ and CO2 partial pressure in the gas phase is displayed in Figure 6. It can be seen that with the increase in CO2 partial pressure, the fraction θ occupied by CO2 on the particle surface gradually increases. That is, the R2 desorption process of the CO2 produced by calcium carbonate from the particle surface through the reaction R1 is limited by the increase of CO2 in the gas phase. Especially in the low CO2 partial pressure stage, θ increases rapidly with the increase of CO2 partial pressure. When the partial pressure of CO2 in the gas phase achieves ~30,000 Pa (~30 vol.% at atmospheric pressure) at 900 °C, the fraction θ occupied by active sites on the particle surface increases from 0 to 0.8. However, when the partial pressure of CO2 in the gas phase is higher than ~60,000 Pa (~60 vol.% at atmospheric pressure), with the increase of the partial pressure of CO2, θ increases slowly. In this case, the desorption process of CO2 from the particle surface becomes very slow and the calcination reaction is limited.
Figure 7 shows the change of the occupied fraction θ of active sites on the particle surface under different particle sizes. It can be found that for larger particles, the fraction θ occupied by adsorbed *CO2 on the particle surface increases with the particle size, indicating that the CO2 desorption rate becomes slower with an increase in particle size. This illustrates that there is a certain correlation between the limestone calcination reaction and particle size, which in turn verifies the limestone calcination model in Section 5. The occupied fraction θ on the particle surface rises rapidly in the initial stage and soon reaches saturation. The variation of particle surface θ with particle size under high CO2 concentration is smaller than that under low CO2 concentration, which also leads to the change in particle conversion with particle size no longer being significant.
Figure 8a shows the effect of the temperature on the reaction-controlling mechanism calculated using the established model in Section 5. It can be seen that for the limestone calcination process, there is an excellent linear relationship between the consumption rate of particles and the temperature from 600–1050 °C. This reveals that the consumption of limestone particles is mainly controlled by a combination of chemical reactions and gas diffusion in the investigated range.
Figure 8b shows the effect of the particle size on the limestone calcination reaction controlling mechanism. It can be seen that the consumption rate of limestone and particle size have clear three-zone characteristics. When the particle size is smaller than ~80 μm, the change of the particle size has less effect on the limestone particle consumption rate. In this case, the particle consumption rate is mainly controlled by chemical reactions, referred to as Zone I. While the particle size is larger than ~450 μm, the particle consumption rate varies significantly with particle size; this is referred to as Zone III. At this time, the calcination reaction is mainly controlled by gas diffusion, including the gas external diffusion step and the intraparticle diffusion step. As the particle size increases, the calcination rate decreases rapidly; that is, the gas diffusion resistance within the particle and the external gas diffusion resistance increase rapidly. In the particle size range of 80–450 μm, that is, Zone II, the gas diffusion resistance and chemical reaction resistance are in the same order of magnitude, and the calcination process is controlled by both gas diffusion and chemical reaction.
The above analysis can guide the optimization of limestone particle calcination conditions at different temperatures and CO2 concentrations in practical applications. The chemical reaction rate, internal diffusion rate and external diffusion rate of the particles are comprehensively considered to determine the appropriate operating temperature and particle size.

4. Experiment

4.1. Microfluidized Bed Thermogravimetric Analysis (MFB-TGA)

A natural limestone from Hubei Province with calcium carbonate content exceeding 99.4% is explored in the work. After crushing and grinding, the limestone is carefully sieved to particle size ranges of 150–200 μm, 450–500 μm, 800–900 μm, and 1250–1410 μm. Each sieving process is repeated three times.
The calcination experiments of limestone are conducted in a microfluidized bed thermogravimetric analysis (MFB-TGA) apparatus, as shown in Figure 9a, which consisted of a quartz reactor, an electric furnace, a gas supply system, and a measurement system [46]. The quartz reactor is designed to be a fluidized bed with an inner diameter of 28 mm, the inner diameter of the top sample inlet of 10 mm, and a porous distribution plate with a thickness of 5 mm to make the air flow evenly into the reactor. The gas supply system consists of mass flow controllers calibrated with a soap bubble flowmeter prior to the experiment, solenoid valves, and gas cylinders. By using a sufficiently thin silicone hose to connect the reactor and the inlet pipe, hard connections can be avoided and interference with the quality signal can be eliminated. The measurement system realizes real-time online monitoring and recording of temperature, pressure and mass signals. The mass signal is the core of the apparatus and is measured with a precise weighing transducer with an accuracy of 1 mg. During the experiment, it is necessary to ensure that no part of the quartz reactor is in contact with the furnace so as not to affect the measurement of the quality signal. The temperature signal is measured with a wireless K-type thermocouple. The pressure difference between the gas inlet and outlet is monitored using a differential pressure sensor to judge the fluidization properties.
A novel experimental method is proposed and implemented to ensure that limestone particles are calcined under isothermal conditions in the work. As shown in Figure 9b, the limestone particles are injected into the hot sands which are fluidized in the high temperature quartz reactor, and the limestone particles are instantly heated to the reaction temperature and decomposed under the set CO2 atmosphere. In a typical experiment, ~16 g of quartz sand with a particle size of 300–355 μm is added to the quartz reactor as the inert bed material (black particles in Figure 9b). The reaction gas is passed into the reactor, and the flow rate is ~3 Umf (Umf is the minimum fluidization speed). This indicates that as the temperature increases, the feed gas flow rate should decrease accordingly. The furnace temperature is raised to 850 °C and stabilized for 30 min. The fluctuation of the mass signal within 120 s is ±1 mg in the steady state, as shown in Figure 10a, indicating that the experimental system is highly stable. After that, the limestone particles (red particles in Figure 9b) are quickly injected into the fluidized bed from the top inlet of the reactor, and the mass increased rapidly by 64 mg within 0.2 s (equal to the mass of injected limestone), as shown in Figure 10b. The limestone particles are blended with the inert bed material in the reactor, heated, and calcined in a fluidizing condition. During the experiment, the mass injected of limestone is 60–70 mg to minimize the effect of mass transfer. Each condition is repeated several times to ensure reproducibility.

4.2. Experimental Condition and Data Evaluation

The calcination characteristics of limestone particles are studied at 750–920 °C in the work. The CO2 concentration is in the range of 0 and 30 vol.%, and N2 is the balance gas. The detailed experimental conditions are displayed in Table 2.
The calculation of the conversion of limestone particles depends on the mass value (limestone mass + quartz reactor mass) from the weighing transducer, and the conversion of limestone XCalc is calculated as Equation (2), where m(t) is the real-time mass during the calcination, m0 is the initial steady mass before limestone particles are added and m1 is the final steady mass after the decomposition’s completion.
X Calc = ( 1 m ( t ) m 0 m 1 m 0 M w , CaO M w , CaCO 3 ) M w , CaCO 3 M w , CO 2 × 100 %
where M w , CaCO 3 , M w , CaO , and M w , CO 2 are the molecular weights of CaCO3, CaO, and CO2, respectively.

5. Models

The limestone particles are considered to be dense and nonporous spherical particles with an initial radius of r0, as displayed in Figure 11. Therefore, a shrinking core model is adopted in the work to describe the limestone calcination process. As shown in Figure 11, when the calcination reaction occurs, the calcium carbonate on the surface of the particles is first decomposed, forming a porous calcium oxide shell evenly covering the outer surface. While the reaction occurs, the calcium carbonate core with radius r2 continues to decompose. It is worth noting that the CO2 generated from the calcination of the limestone core must pass through the pores of the calcium oxide shell to diffuse to the outer surface, known as intraparticle diffusion. Then, the CO2 on the outer surface of the particles is transferred into the gas stream through external diffusion. As the reaction continues, the calcium carbonate core inside the particle gradually shrinks, while the outer calcium oxide shell gradually increases until the inner calcium carbonate core is completely consumed and the reaction is completed.
According to the geometrical relation shown in Figure 11, the conversion of limestone particles Xcalc can be calculated as:
X calc = r 0 3 r 2 3 r 0 3
Then, the conversion rate of the particles is obtained as:
d X calc d t = 3 r 2 2 r 0 3 d r 2 d t
Based on Equation (3), it is deduced that the correlation of the radius r2 of the calcium carbonate core and the initial particle radius r0 is:
r 2 = r 0 ( 1 X calc ) 1 / 3
The consumption rate of limestone particle volume is calculated as:
d V CaCO 3 d t = 4 π r 2 2 d r 2 d t = 4 π r 2 2 Λ V CaCO 3 M R calc
where Rcalc is the chemical reaction rate, 1/s; Λ is the active site density at the interface, mol/m2; and V CaCO 3 M is the molar volume of calcium carbonate, m3/mol.
Combining Equations (4)–(6),the conversion of the limestone particle is expressed as:
d X calc d t = 3 r 0 ( 1 X calc ) 2 / 3 Λ V CaCO 3 M R calc
The decomposition process of calcium carbonate is a typical gas–solid surface reaction. In addition to chemical surface reactions, the diffusion of CO2 through the porous CaO layer and around the particles should be considered in the developed model to reflect the effect of CO2 concentration. Therefore, in the subsequent derivation, we assume that the surface reaction of spherical calcium carbonate particles occurs through the shrinking core model, and the model of intraparticle and external diffusion processes of CO2 is established. Finally, combining the above three steps, the expression of the effective rate constant is derived to describe the detailed calcium carbonate decomposition process.

5.1. Calcination Kinetics

Assume an ideal case of the calcination of an infinite calcium carbonate plane under uniform CO2 partial pressure and temperature conditions. The surface reaction process of calcium carbonate can be described by two steps of chemical calcination and desorption [19,32]. The first step is the chemical calcination of calcium carbonate on the surface, resulting in CO2 molecules being adsorbed on the surface and occupying active sites. The second step is the desorption of CO2 molecules from the active site. The two-step calcination process is characterized by reactions R1 and R2 as follows:
CaCO 3 + * k 1 r k 1 f CaO + * CO 2   1 - θ         θ
* CO 2 k 2 r k 2 f * + CO 2 θ   1 - θ     P i
where k1f, k1r, k2f, and k2r are the forward and reverse reaction rate constants of R1 and R2, respectively. * is an active site on the particle surface; θ is defined as the fraction of the active site on the particle surface occupied by CO2. Pi is the CO2 partial pressure at the interface between CaO and CaCO3 inside the particle.
Based on the microscopic reversibility general principle, when the reaction reaches chemical equilibrium, the forward reaction rate of the elementary reaction equal to reverse reaction rate is obtained:
k 1 f ( 1 θ eq ) = k 1 r θ eq k 2 f θ eq = k 2 r ( 1 θ eq ) P eq
Then, the CO2 partial pressure at equilibrium is obtained as:
P eq = k 1 f k 2 f k 1 r k 2 r = K 1 K 2
where the subscript eq indicates that the reaction is at equilibrium, and K1 and K2 are the thermodynamic equilibrium constants of R1 and R2, respectively.
It is assumed that the adsorbed *CO2 is in a quasi-steady state, and the desorption rate of CO2 is a generally extremely fast progress compared with the chemical calcination rate; that is, the control step of calcium carbonate calcination is the reaction R1, and R2 ≈ 0. Therefore, the fraction occupied θ is calculated as:
R 2 0 θ k 2 r P i k 2 f + k 2 r P i = P i K 2 + P i
The chemical reaction rate of calcium carbonate calcination is also obtained as:
R calc R 1 = k 1 f ( 1 P g P eq ) 1 1 + K 1 P i P eq
It can be seen that the above derivation is based on the ideal case of an infinite calcium carbonate plane, while the limestone is actually spherical particles. Therefore, a modification is introduced in Equation (11) in order to choose the one that provided the best fit with the experimental results and given as:
R calc = k 1 f ( 1 P g P eq ) 1 1 + K 1 P i P eq r ¯ 0 r 0
where r ¯ 0 is the average radius of particles in the investigated range, calculated as 330 μm, and r0 is the particles’ radius.
Combined with Equation (7), the conversion rate of the particles is obtained as:
d X calc d t = 3 r 0 ρ k c ( P eq P g )
k c = k 1 f ρ Λ V CaCO 3 M ( 1 X calc ) 2 / 3 1 P eq + K 1 P i r ¯ 0 r 0
where kc is the comprehensive chemical reaction rate constant. Combining the constant terms in Equation (14), it is obtained that:
k c = k f ( 1 X calc ) 2 / 3 1 P eq + K 1 P i r ¯ 0 r 0
where the reaction rate constant kf is calculated based on the Arrhenius form, and the thermodynamic equilibrium constant K1 is calculated based on the van’t Hoff equation in Equation (15):
k f = k 1 f ρ Λ V CaCO 3 M = A e E R T
K 1 = Δ S R e Δ H R T = a e Δ H R T
where A and E are the pre-exponential factor and activation energy, respectively, of kf. ΔS and ΔH are the standard entropy and enthalpy change of the CaCO3 calcination reaction, and a is the pre-exponential factor of K1. The four kinetic parameters—A, E, a, and ΔH—in the reaction term are parameters to be determined.
The equilibrium concentration of CO2, Peq is obtained based on the work of Hu et al., Pa [47]:
P eq = 1.826 × 10 6 × exp ( 19680 / T p ) × 10 6

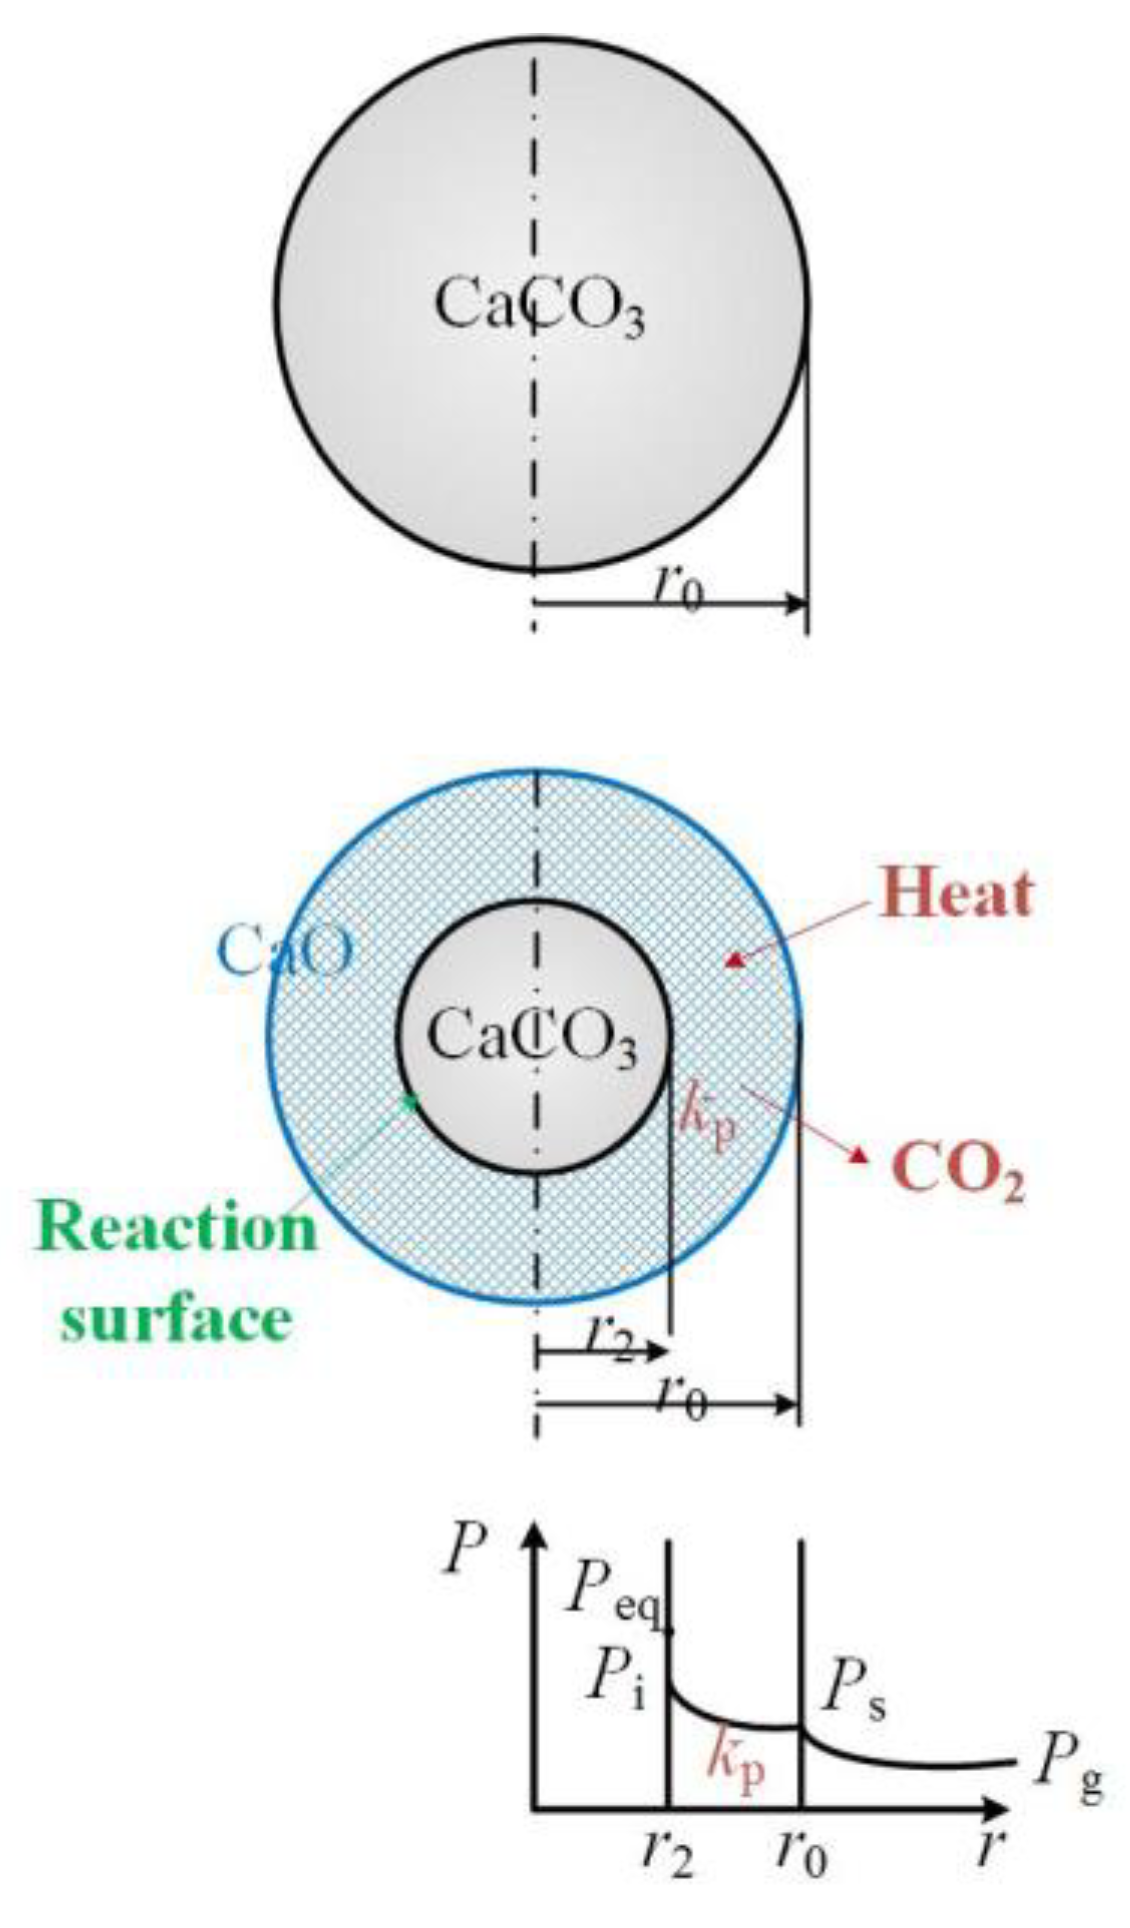
5.2. Intraparticle Diffusion

The diffusion of CO2 through the calcium oxide layer can be described by Fick’s law of diffusion, and the diffusion flow rate of CO2 is given as:
J CO 2 = 4 π r 2 D e d C CO 2 d r
where C CO 2 is the CO2 concentration in the calcium oxide layer and De is the gas diffusion coefficient, which is calculated based on the empirical formula [28]:
D e = 0.00881 T 1 / 2 S 0 1 ε 0 2
where S0 is the initial specific surface area of particles, taken as 22.80 m2/g, and ε0 is the initial porosity of the CaO layer, taken as 0.48 according to the work of Wang et al. [43].
The boundary conditions are that:
{ r = r 2 C CO 2 = C i r = r 0 C CO 2 = C s
Integrate Equation (21) and simplify to obtain:
J CO 2 = 4 π D e ( C i C s ) 1 r 2 1 r 0 = 4 π r 0 2 D e ( C i C s ) r 0 r 2 ( r 0 r 2 )
According to the ideal gas equation of state, combine with Equation (5) to obtain:
J CO 2 = 4 π r 0 2 D e ( P i P s ) r 0 [ 1 ( 1 X calc ) 1 / 3 ] ( 1 X calc ) 1 / 3 R T
Then the conversion rate of the particles is obtained as:
d X calc d t = J CO 2 M w , CaCO 3 m 0 = 3 r 0 ρ k p ( P i P s )
k p = D e M w , CaCO 3 r 0 [ 1 ( 1 X calc ) 1 / 3 ] ( 1 X calc ) 1 / 3 R T
where m0 is the initial mass of the limestone particle and kp is the gas intraparticle diffusion rate constant.

5.3. External Diffusion

The particle conversion rate due to CO2 external diffusion from the surface of limestone particle to the main flow is:
d X calc d t = 3 r 0 ρ k D ( P s P g )
where kD is the diffusion coefficient of CO2 to the bulk atmosphere, which is given based on the work of Field [48] and Graham [49] and related to temperature and particle size:
k O 2 = C 1 [ ( T p + T g ) / 2 ] 0.75 d p
k D = k O 2 M w , O 2 M w , CO 2
where Tp and Tg are the particle temperature and gas temperature, respectively; M w , O 2 and M w , CO 2 are the molecular weights of O2 and CO2, respectively; and C1 is an empirical constant with a value of 5 × 10⁻¹² s·K−0.75.

5.4. Calcination Kinetic Model

The effects of chemical reaction, gas intraparticle and external diffusion during limestone calcination are considered in Section 5.1, Section 5.2 and Section 5.3. In order to eliminate the unknown parameters Pi and Ps in Equations (13) and (24), combing Equations (13), (14), (24), (25), and (26) gives:
1 3 r 0 ρ k c d X calc d t + 1 3 r 0 ρ k p d X calc d t + 1 3 r 0 ρ k D d X calc d t = ( P eq P i ) ( P i P s ) ( P s P g ) = ( P eq P g )
Thus, the conversion rate of the limestone particle is:
d X calc d t = 3 r 0 ρ K r ( P eq P g )
K r = 1 1 k c + 1 k p + 1 k D
where Kr is the comprehensive calcination rate constant of the particle. It is worth noting that in Equation (15), the partial pressure of CO2 at the intraparticle surface of the particle, Pi, is unknown. Thus, Pg is adopted as an approximate substitute in the calculation process.
The flowchart of the calculation algorithm is displayed in Figure 12. The algorithm-solving steps are: (i) initializing the particle parameters, making Xcalc = 0.0001 to avoid meaningless kp calculation, and inputting the constant parameters; (ii) calculating the external diffusion rate constant kD; (iii) calculating the comprehensive chemical reaction rate constant kc; (iv) calculating the intraparticle diffusion rate constant kp; (v) updating the particle conversion Xcalc at time t and then proceeding to the next time step t + Δt.

6. Conclusions

The calcination kinetics of the fluidized limestone particles under rapid heating and isothermal conditions are measured by injecting them into the microfluidized bed thermogravimetric analyzer (MFB-TGA). The calcination characteristics of limestone with different particle sizes are studied in the temperature range of 750–920 °C and the CO2 concentration of 0 and 30 vol.%. A calcination kinetic model considering surface reaction, CO2 partial pressure, particle structure change, and intraparticle and external diffusion is established, and the key parameters of the model are obtained; that is, A = 5.051 × 10⁶ kg·m−2·s−1, E = 182 kJ/mol, a = 9.99 × 10⁷, ΔH = 150 kJ/mol. The results show that it only takes ~10 s to achieve complete conversion at temperatures >900 °C. Increasing the CO2 concentration in the gas phase severely impairs the calcination rate of the particles. An interesting point is that as the partial pressure of CO2 increases, the effect of particle size decreases. In the investigated temperature range, the particle consumption is controlled by both the chemical reaction and gas diffusion. The effect of particle size on limestone calcination kinetics presents three-zone characteristics of the reaction controlling mechanism. In Zone I, the particle size is <~80 μm, the particle size has little effect on the consumption rate, and calcination is mainly controlled by chemical reaction. In Zone III, the particle size is >~450 μm, the calcination process is mainly controlled by gas diffusion, and the effect of particle size is significant. In Zone II, in the particle size range of 80–450 μm, the calcination is controlled by both gas diffusion and chemical reaction. The model prediction results are in good agreement with the experimental data, indicating that the experimental results and the calcination model will provide valuable information for the application of CaL technology.

Author Contributions

Conceptualization, D.L. and Z.L.; methodology, D.L., Y.W. and Z.L.; software, D.L.; validation, D.L., Y.W. and Z.L.; formal analysis, D.L. and Z.L.; investigation, D.L.; resources, Z.L.; data curation, D.L. and Z.L.; writing—original draft preparation, D.L.; writing—review and editing, D.L. and Z.L.; visualization, D.L.; supervision, Z.L.; project administration, Z.L.; funding acquisition, Z.L. All authors have read and agreed to the published version of the manuscript.

Funding

This research was supported by National Natural Science Foundation of China (Grant No. 51876095) and supported by the International Joint Mission On Climate Change and Carbon Neutrality.

Data Availability Statement

The data presented in this study are available in the article.

Conflicts of Interest

The authors declare no conflict of interest.

References

  1. Han, R.; Wang, Y.; Xing, S.; Pang, C.; Hao, Y.; Song, C.; Liu, Q. Progress in reducing calcination reaction temperature of Calcium-Looping CO2 capture technology: A critical review. Chem. Eng. J. 2022, 450, 137952. [Google Scholar] [CrossRef]
  2. Perejón, A.; Romeo, L.M.; Lara, Y.; Lisbona, P.; Martínez, A.; Valverde, J.M. The Calcium-Looping technology for CO2 capture: On the important roles of energy integration and sorbent behavior. Appl. Energy 2016, 162, 787–807. [Google Scholar] [CrossRef] [Green Version]
  3. Rivero, M.A.; Rodrigues, D.; Pinheiro, C.I.; Cardoso, J.P.; Mendes, L.F. Solid-gas reactors driven by concentrated solar energy with potential application to calcium looping: A comparative review. Renew. Sust. Energ. Rev. 2022, 158, 112048. [Google Scholar] [CrossRef]
  4. Qin, C.; He, D.; Zhang, Z.; Tan, L.; Ran, J. The consecutive calcination/sulfation in calcium looping for CO2 capture: Particle modeling and behaviour investigation. Chem. Eng. J. 2018, 334, 2238–2249. [Google Scholar] [CrossRef]
  5. Di Giuliano, A.; Gallucci, K. Sorption enhanced steam methane reforming based on nickel and calcium looping: A review. Chem. Eng. Process. 2018, 130, 240–252. [Google Scholar] [CrossRef]
  6. Blamey, J.; Anthony, E.; Wang, J.; Fennell, P. The calcium looping cycle for large-scale CO2 capture. Prog. Energy Combust. Sci. 2010, 36, 260–279. [Google Scholar] [CrossRef]
  7. Hashemi, S.M.; Sedghkerdar, M.H.; Mahinpey, N. Calcium looping carbon capture: Progress and prospects. Can. J. Chem. Eng. 2022, 100, 2140–2171. [Google Scholar] [CrossRef]
  8. Hornberger, M.; Spörl, R.; Scheffknecht, G. Calcium looping for CO2 capture in cement plants-pilot scale test. Energy Procedia 2017, 114, 6171–6174. [Google Scholar] [CrossRef]
  9. Haaf, M.; Stroh, A.; Hilz, J.; Helbig, M.; Ströhle, J.; Epple, B. Process modelling of the calcium looping process and validation against 1 MWth pilot testing. Energy Procedia 2017, 114, 167–178. [Google Scholar] [CrossRef]
  10. Bui, M.; Adjiman, C.S.; Bardow, A.; Anthony, E.J.; Boston, A.; Brown, S.; Fennell, P.S.; Fuss, S.; Galindo, A.; Hackett, L.A. Carbon capture and storage (CCS): The way forward. Energy Environ. Sci. 2018, 11, 1062–1176. [Google Scholar] [CrossRef]
  11. Li, Z.; Cai, N.; Huang, Y.; Han, H. Synthesis, experimental studies, and analysis of a new calcium-based carbon dioxide absorbent. Energy Fuels 2005, 19, 1447–1452. [Google Scholar] [CrossRef]
  12. Rodriguez, N.; Alonso, M.; Grasa, G.; Abanades, J.C. Heat requirements in a calciner of CaCO3 integrated in a CO2 capture system using CaO. Chem. Eng. J. 2008, 138, 148–154. [Google Scholar] [CrossRef] [Green Version]
  13. Grasa, G.S.; Abanades, J.C. CO2 capture capacity of CaO in long series of carbonation/calcination cycles. Ind. Eng. Chem. Res. 2006, 45, 8846–8851. [Google Scholar] [CrossRef]
  14. Hyatt, E.P.; Cutler, I.B.; Wadsworth, M.E. Calcium carbonate decomposition in carbon dioxide atmosphere. J. Am. Ceram. Soc. 1958, 41, 70–74. [Google Scholar] [CrossRef]
  15. Khinast, J.; Krammer, G.; Brunner, C.; Staudinger, G. Decomposition of limestone: The influence of CO2 and particle size on the reaction rate. Chem. Eng. Sci. 1996, 51, 623–634. [Google Scholar] [CrossRef]
  16. Hills, A. The mechanism of the thermal decomposition of calcium carbonate. Chem. Eng. Sci. 1968, 23, 297–320. [Google Scholar] [CrossRef]
  17. Borgwardt, R.H. Calcination kinetics and surface-area of dispersed limestone particles. AlChE J. 1985, 31, 103–111. [Google Scholar] [CrossRef]
  18. Rajeswara, R. Kinetics of calcium carbonate decomposition. Chem. Eng. Res. Des. 1989, 67, 38–47. [Google Scholar]
  19. Garcıa-Labiano, F.; Abad, A.; De Diego, L.; Gayán, P.; Adánez, J. Calcination of calcium-based sorbents at pressure in a broad range of CO2 concentrations. Chem. Eng. Sci. 2002, 57, 2381–2393. [Google Scholar] [CrossRef] [Green Version]
  20. Ylätalo, J.; Parkkinen, J.; Ritvanen, J.; Tynjälä, T.; Hyppänen, T. Modeling of the oxy-combustion calciner in the post-combustion calcium looping process. Fuel 2013, 113, 770–779. [Google Scholar] [CrossRef] [Green Version]
  21. Szekely, J.; Evans, J. A structural model for gas-solid reactions with a moving boundary. Chem. Eng. Sci. 1970, 25, 1091–1107. [Google Scholar] [CrossRef]
  22. Ar, I.; Dogu, G. Calcination kinetics of high purity limestones. Chem. Eng. J. 2001, 83, 131–137. [Google Scholar] [CrossRef]
  23. Escardino, A.; Garcia-Ten, J.; Feliu, C.; Saburit, A.; Cantavella, V. Kinetic study of the thermal decomposition process of calcite particles in air and CO2 atmosphere. Ind. Eng. Chem. Res. 2013, 19, 886–897. [Google Scholar] [CrossRef] [Green Version]
  24. Galwey, A.K.; Brown, M.E. Application of the Arrhenius equation to solid state kinetics: Can this be justified? Thermochim. Acta 2002, 386, 91–98. [Google Scholar] [CrossRef]
  25. Ramezani, M.; Tremain, P.; Doroodchi, E.; Moghtaderi, B. Determination of carbonation/calcination reaction kinetics of a limestone sorbent in low CO2 partial pressures using TGA experiments. Energy Procedia 2017, 114, 259–270. [Google Scholar] [CrossRef]
  26. Guler, C.; Dollimore, D.; Heal, G. The investigation of the decomposition kinetics of calcium carbonate alone and in the presence of some clays using the rising temperature technique. Thermochim. Acta 1982, 54, 187–199. [Google Scholar] [CrossRef]
  27. Dennis, J.; Hayhurst, A. The effect of CO2 on the kinetics and extent of calcination of limestone and dolomite particles in fluidised beds. Chem. Eng. Sci. 1987, 42, 2361–2372. [Google Scholar] [CrossRef]
  28. Silcox, G.D.; Kramlich, J.C.; Pershing, D.W. A mathematical model for the flash calcination of dispersed calcium carbonate and calcium hydroxide particles. Ind. Eng. Chem. Res. 1989, 28, 155–160. [Google Scholar] [CrossRef]
  29. Rao, T.R. Kinetics of calcium carbonate decomposition. Chem. Eng. Technol. 1996, 19, 373–377. [Google Scholar] [CrossRef]
  30. Fuertes, A.; Marban, G.; Rubiera, F. Kinetics of thermal decomposition of limestone particles in a fluidized bed reactor. Chem. Eng. Re.s Des. 1993, 71, 421–428. [Google Scholar]
  31. Wang, Y.; Lin, S.; Suzuki, Y. Limestone calcination with CO2 capture (II): Decomposition in CO2/steam and CO2/N2 atmospheres. Energy fuels 2008, 22, 2326–2331. [Google Scholar] [CrossRef]
  32. Valverde, J.M.; Sanchez-Jimenez, P.E.; Perez-Maqueda, L.A. Limestone calcination nearby equilibrium: Kinetics, CaO crystal structure, sintering and reactivity. J. Phys. Chem. C 2015, 119, 1623–1641. [Google Scholar] [CrossRef]
  33. Ramon Fernandez, J.; Turrado, S.; Carlos Abanades, J. Calcination kinetics of cement raw meals under various CO2 concentrations. React. Chem. Eng. 2019, 4, 2129–2140. [Google Scholar] [CrossRef] [Green Version]
  34. Barker, R. The reversibility of the reaction CaCO3⇄ CaO+ CO2. J. Chem. Technol. Biotechnol. 1973, 23, 733–742. [Google Scholar] [CrossRef]
  35. Calvo, E.G.; Arranz, M.; Leton, P. Effects of impurities in the kinetics of calcite decomposition. Thermochim. Acta 1990, 170, 7–11. [Google Scholar] [CrossRef]
  36. Valverde, J.M. On the negative activation energy for limestone calcination at high temperatures nearby equilibrium. Chem. Eng. Sci. 2015, 132, 169–177. [Google Scholar] [CrossRef]
  37. Wang, Y.; Lin, S.; Suzuki, Y. Study of limestone calcination with CO2 capture: Decomposition behavior in a CO2 atmosphere. Energy Fuels 2007, 21, 3317–3321. [Google Scholar] [CrossRef]
  38. Scaltsoyiannes, A.; Lemonidou, A. CaCO3 decomposition for calcium-looping applications: Kinetic modeling in a fixed-bed reactor. Chem. Eng. Sci. X 2020, 8, 100071. [Google Scholar] [CrossRef]
  39. Lv, G.; Lu, J.; Cai, L.; Xie, X.; Liu, Z. Experimental study on the dynamic process of NO reduction in a precalciner. Ind. Eng. Chem. Res. 2011, 50, 4366–4372. [Google Scholar]
  40. Khraisha, Y.; Dugwell, D. Coal combustion and limestone calcination in a suspension reactor. Chem. Eng. Sci. 1992, 47, 993–1006. [Google Scholar] [CrossRef]
  41. Li, Y.; Li, Z.; Wang, H.; Cai, N. CaO carbonation kinetics determined using micro-fluidized bed thermogravimetric analysis. Fuel 2020, 264, 116823. [Google Scholar] [CrossRef]
  42. Wang, Y.; Li, Z.; Cai, N. Redox reaction kinetics of a Fe-Cu-based oxygen carrier measured with microfluidized bed thermogravimetric analysis. Energy Fuels 2022, 36, 9672–9686. [Google Scholar] [CrossRef]
  43. Wang, H.; Li, Z.; Li, Y.; Cai, N. Reduced-order model for CaO carbonation kinetics measured using micro-fluidized bed thermogravimetric analysis. Chem. Eng. Sci. 2021, 229, 116039. [Google Scholar] [CrossRef]
  44. Giammaria, G.; Lefferts, L. Catalytic effect of water on calcium carbonate decomposition. J. CO2 Util. 2019, 33, 341–356. [Google Scholar] [CrossRef]
  45. Escardino, A.; Garcia-Ten, J.; Feliu, C. Kinetic study of calcite particle (powder) thermal decomposition: Part I. J. Eur. Ceram. Soc. 2008, 28, 3011–3020. [Google Scholar] [CrossRef]
  46. Li, Y.; Li, Z.; Liu, L.; Cai, N. Measuring the fast oxidation kinetics of a manganese oxygen carrier using microfluidized bed thermogravimetric analysis. Chem. Eng. J. 2020, 385, 123970. [Google Scholar] [CrossRef]
  47. Hu, N.; Scaroni, A.W. Calcination of pulverized limestone particles under furnace injection conditions. Fuel 1996, 75, 177–186. [Google Scholar] [CrossRef]
  48. Field, M.A. Rate of combustion of size-graded fractions of char from a low-rank coal between 1200 K and 2000 K. Combust. Flame 1969, 13, 237–252. [Google Scholar] [CrossRef]
  49. Graham, T. On the law of the diffusion of gases. J. Membr. Sci. 1995, 100, 17–21.sss. [Google Scholar] [CrossRef]
Figure 1. Comparison of MFB-TGA experimental results to TGA (800 °C, 0 vol.% CO2).
Catalysts 12 01661 g001
Figure 2. The effect of temperature: (a) comparison of model results with MFB-TGA experimental data; (b) the relation between CO2 equilibrium partial pressure and temperature.
Catalysts 12 01661 g002
Figure 3. Comparison between the model results and the MFB-TGA experimental data at different CO2 concentrations under (a) 900 °C and (b) 920 °C.
Catalysts 12 01661 g003
Figure 4. Comparison between the model results and the MFB-TGA experimental data at different particle size under (a) 0 vol.%; (b) 30 vol.%.
Catalysts 12 01661 g004
Figure 5. Arrhenius plots to calculate the kinetic parameters: (a) lnkc−E versus 1/T; (b) lnkc−ΔH versus 1/T; (c) comparison of model results to experimental data.
Catalysts 12 01661 g005
Figure 6. The fraction of surface active sites occupied θ under 900 °C.
Catalysts 12 01661 g006
Figure 7. θ on particle surface of different particle sizes under (a) 0 vol.% and (b) 30 vol.%.
Catalysts 12 01661 g007
Figure 8. Calculated results of the effect on the limestone calcination reaction controlling mechanism at Xcalc = 0.5: (a) temperature; (b) particle size. (r is the calcination consumption rate of particles).
Catalysts 12 01661 g008
Figure 9. Schematic diagrams of (a) the MFB-TGA apparatus and (b) the limestone particles being injected into the reactor.
Catalysts 12 01661 g009
Figure 10. The mass signal of the weighing transducer: (a) the initial steady mass before limestone particles are injected; (b) real-time mass signal of limestone particles being injected.
Catalysts 12 01661 g010
Figure 11. Schematic diagram of the shrinking core model describing the calcination of limestone particles.
Catalysts 12 01661 g011
Figure 12. Flowchart of the calculation algorithm.
Catalysts 12 01661 g012
Table 1. Kinetic parameters in the model calculation.
A (kg/m2/s)E (kJ/mol)a (/)ΔH (kJ/mol)C1 (s/K0.75)S0 (m2/kg)ε0 (/) r ¯ 0 ( μ m )
5.051 × 1061829.99 × 1071505 × 10−1222.800.48330
Table 2. Experiment condition.
Sample Mass/mgParticle Size/μmTemperature/°CCO2/%Superficial Velocity
60–70150/450/800/1250750–9200/30~3 Umf
Publisher’s Note: MDPI stays neutral with regard to jurisdictional claims in published maps and institutional affiliations.

