Article

Emission Spectroscopy of CH4/CO2 Mixtures Processed in a Non-Thermal Plasma Augmented Burner

Laboratory of Combustion Processes, Lithuanian Energy Institute, Breslaujos Str. 3, LT-44403 Kaunas, Lithuania
*
Author to whom correspondence should be addressed.
Catalysts 2022, 12(12), 1540; https://doi.org/10.3390/catal12121540
Submission received: 3 November 2022 / Revised: 25 November 2022 / Accepted: 28 November 2022 / Published: 30 November 2022

Abstract

:
The need for energy resources that do not belong to the group of fossil fuels and a wide availability of various low-calorific gases leads humanity to search for solutions to adapt external sources of force that would allow for the use of these resources. One of such solutions is the usage of non-thermal plasma applications for pre-ignition stage, ignition, and, finally, combustion. Plasma assistance is a promising technology for improving processes of ignition and flame stabilization, as well as propagating flame speed. This study focuses on influence of the non-thermal plasma on both for CH4, CO2 gases, and their mixture in pre-ignition stage by performing emission spectroscopy, and determining tendency of excited species at different frequency rates for optimal plasma parameters to reduce NO formation and increase efficiency during combustion. The results obtained exhibit a non-linear dependence of radical’s emission from the frequency of plasma. As an example of possible profits from correctly choosing plasma parameters, the calorific value of gases increased from 2.86 times for BG25/75 to 4.78 times for BG30/70. However, the decomposition on higher frequencies causes higher rates of nitrogen-bands emissions, which would increase NOx emissions in the combustion process.

1. Introduction

Fossil-fuel replacement is needed due to global climate change and more attention is being paid to alternative fuels [1]. One of the possible variants of the partial replacement of the fossil group is usage of biomethane, biogas and low-calorific value gases, which were not taken into account by the industry earlier due to the wide list of problems connected with ignition and clean and safe combustions of those flammable solutions. Most of them are or highly ballasted with non-flammable gases, (e.g., the waste biogases contain up to 80% of CO2), the other gases, which are counted as the gases from the replacement group, like NH3 contain nitrogen, leads to the NOx formation and also provides poor combustion performance without being additionally processed [2]. Because of that, the possibility to use such gases is highly limited. As one of the possible technologies that could be used as the problem solver for the task of combustion of different gases that requires special treatment before being used, plasma-assisted combustion (PAC) could be utilized. Plasma-assisted combustion enables gases to proceed with the electrical field. With the help of the energy that this field is carrying by thermal or kinetic mechanism, larger molecules can be cracked down into the smaller species, which require a lower amount of energy needed for their oxidation and usage in the combustion process [3]. At the same time, there is the possibility of plasma to produce exited forms of radicals that could intensify [4,5] all the combustion processes dramatically or increase the level of pollutants (e.g., by the emission of additional NOx, due to Fenimore or Zeldovich mechanisms). Mao et al. [6] also recently demonstrated the specific conditions and pathways for radical generation process via the discharge influence, their further influence on calorific value of produced gas, and they explained the role of N2 in the processes of H2 generation in CH4 containing mixtures. In the mixtures, based on n-dodecane/O2/N2, Zhong et al. [7] showed that N2(A) and N2(a’) accelerate the oxidation of dodecane by dissociative quenching of N2 *, with O2 forming O, O(1D), and O(1S), and that plasma-assisted NO reaction pathways significantly modifies fuel oxidation at low temperatures. As it was reported in [8] and [9], emission spectroscopy confirms the combustion-like reaction mechanism revealing OH and CH emissions arising during the Atomic- Layer-Deposition process while O-species are consumed. Next to combustion-like reaction products, CH2O and CH3OH are also identified, which may originate both at the surface and in the plasma, which shows the usability of the optical emission spectroscopy (OES) method for such applications. In the [10] optical-emission spectroscopy, other methods were used to fully investigate processes going in the dielectric-barrier-discharge, plasma-assisted combustion units. With the help of OES, vibrational-temperatures-discharge regions and representative spectra intensities were determined. Nevertheless, plasma looks like a possible solution for the problem of usage slightly combustible (in normal conditions) gases. In [11], authors used the method of the emission spectroscopy to determine the influence of gliding ark plasma on the enhancement of the NH3 flame, trying to make it usable for real application with low emission and without a need to combust side gases, because combusting pilot gases does not help avoid carbon emission, which is declared in European Green Deal [12] to be one of the most important energy production issues nowadays. The OES of the ammonia flame shown that atomic spectra of O*, Hβ, and the molecular spectras of the NH* and OH* components dominate and significantly promote ammonia-combustion performance, including combustion limitation and NO emission. In [13], OES was used for diagnostics with the matter of Duo-Plasmaline surface-wave discharge investigation. Emission specters were recorded in order to perform plasma-density calculations and electron temperature in the Argon environment. Based on collected data, it is assumed that processes involving metastable-excited states have a large contribution in population dynamics. Metastable contribution via electron excitation and radiative trapping has to be added to a collisional-radiative model (CRM) in order to calculate more accurately the electron density ne and the electron temperature Te. Metastable-state densities were found to be larger than resonant-state densities. Other authors in [14] used OES for low-frequency (1 kHz) plasma-parameters diagnostics in the process of dry-methane reforming, and the fundamental diagnostic method of plasma parameters for kinetic research of plasma-assisted dry-reforming process of the methane is provided. According to [15], OES was used to gain a deeper understanding of the plasma-enhanced electrospinnability of Polylactic- acid solutions. The spectroscopy is widely used to investigate the chemical and physico-chemical changes in the proceeding solution, and to gain insights into the plasma-generated species in the Polylactic-acid solutions as well as in the solvent mixture. Though OES is used not only for gas analysis or energy application. Authors in [16] establish the distribution of the radicals according to the geometry of their column-type reactor, providing the field of radical intensities in different spots and distances from the electron, which can be used for mathematical modeling of the emission processes for gliding arc in atmospheric pressure. In this particular work, the researchers used a non-thermal plasma [17], premix-type, tangential-augmented burner and the gliding-arc type of plasma was constructed to be used as the gas-processing element.
The main aim of this work was to expand knowledge on emission specters of CH4, CO2, N2, and their mixtures, and the influence of changing frequency parameters of the plasma on the decomposition rate for both individual elements and a gas composition with different flammable compounds, in order to determine the tendency of emission change, as well as the optimum plasma parameters for gliding arc reactor for further processing in flame and to make assumptions about impact on other combustion processes that use processed gas as a fuel.

2. Results and Discussions

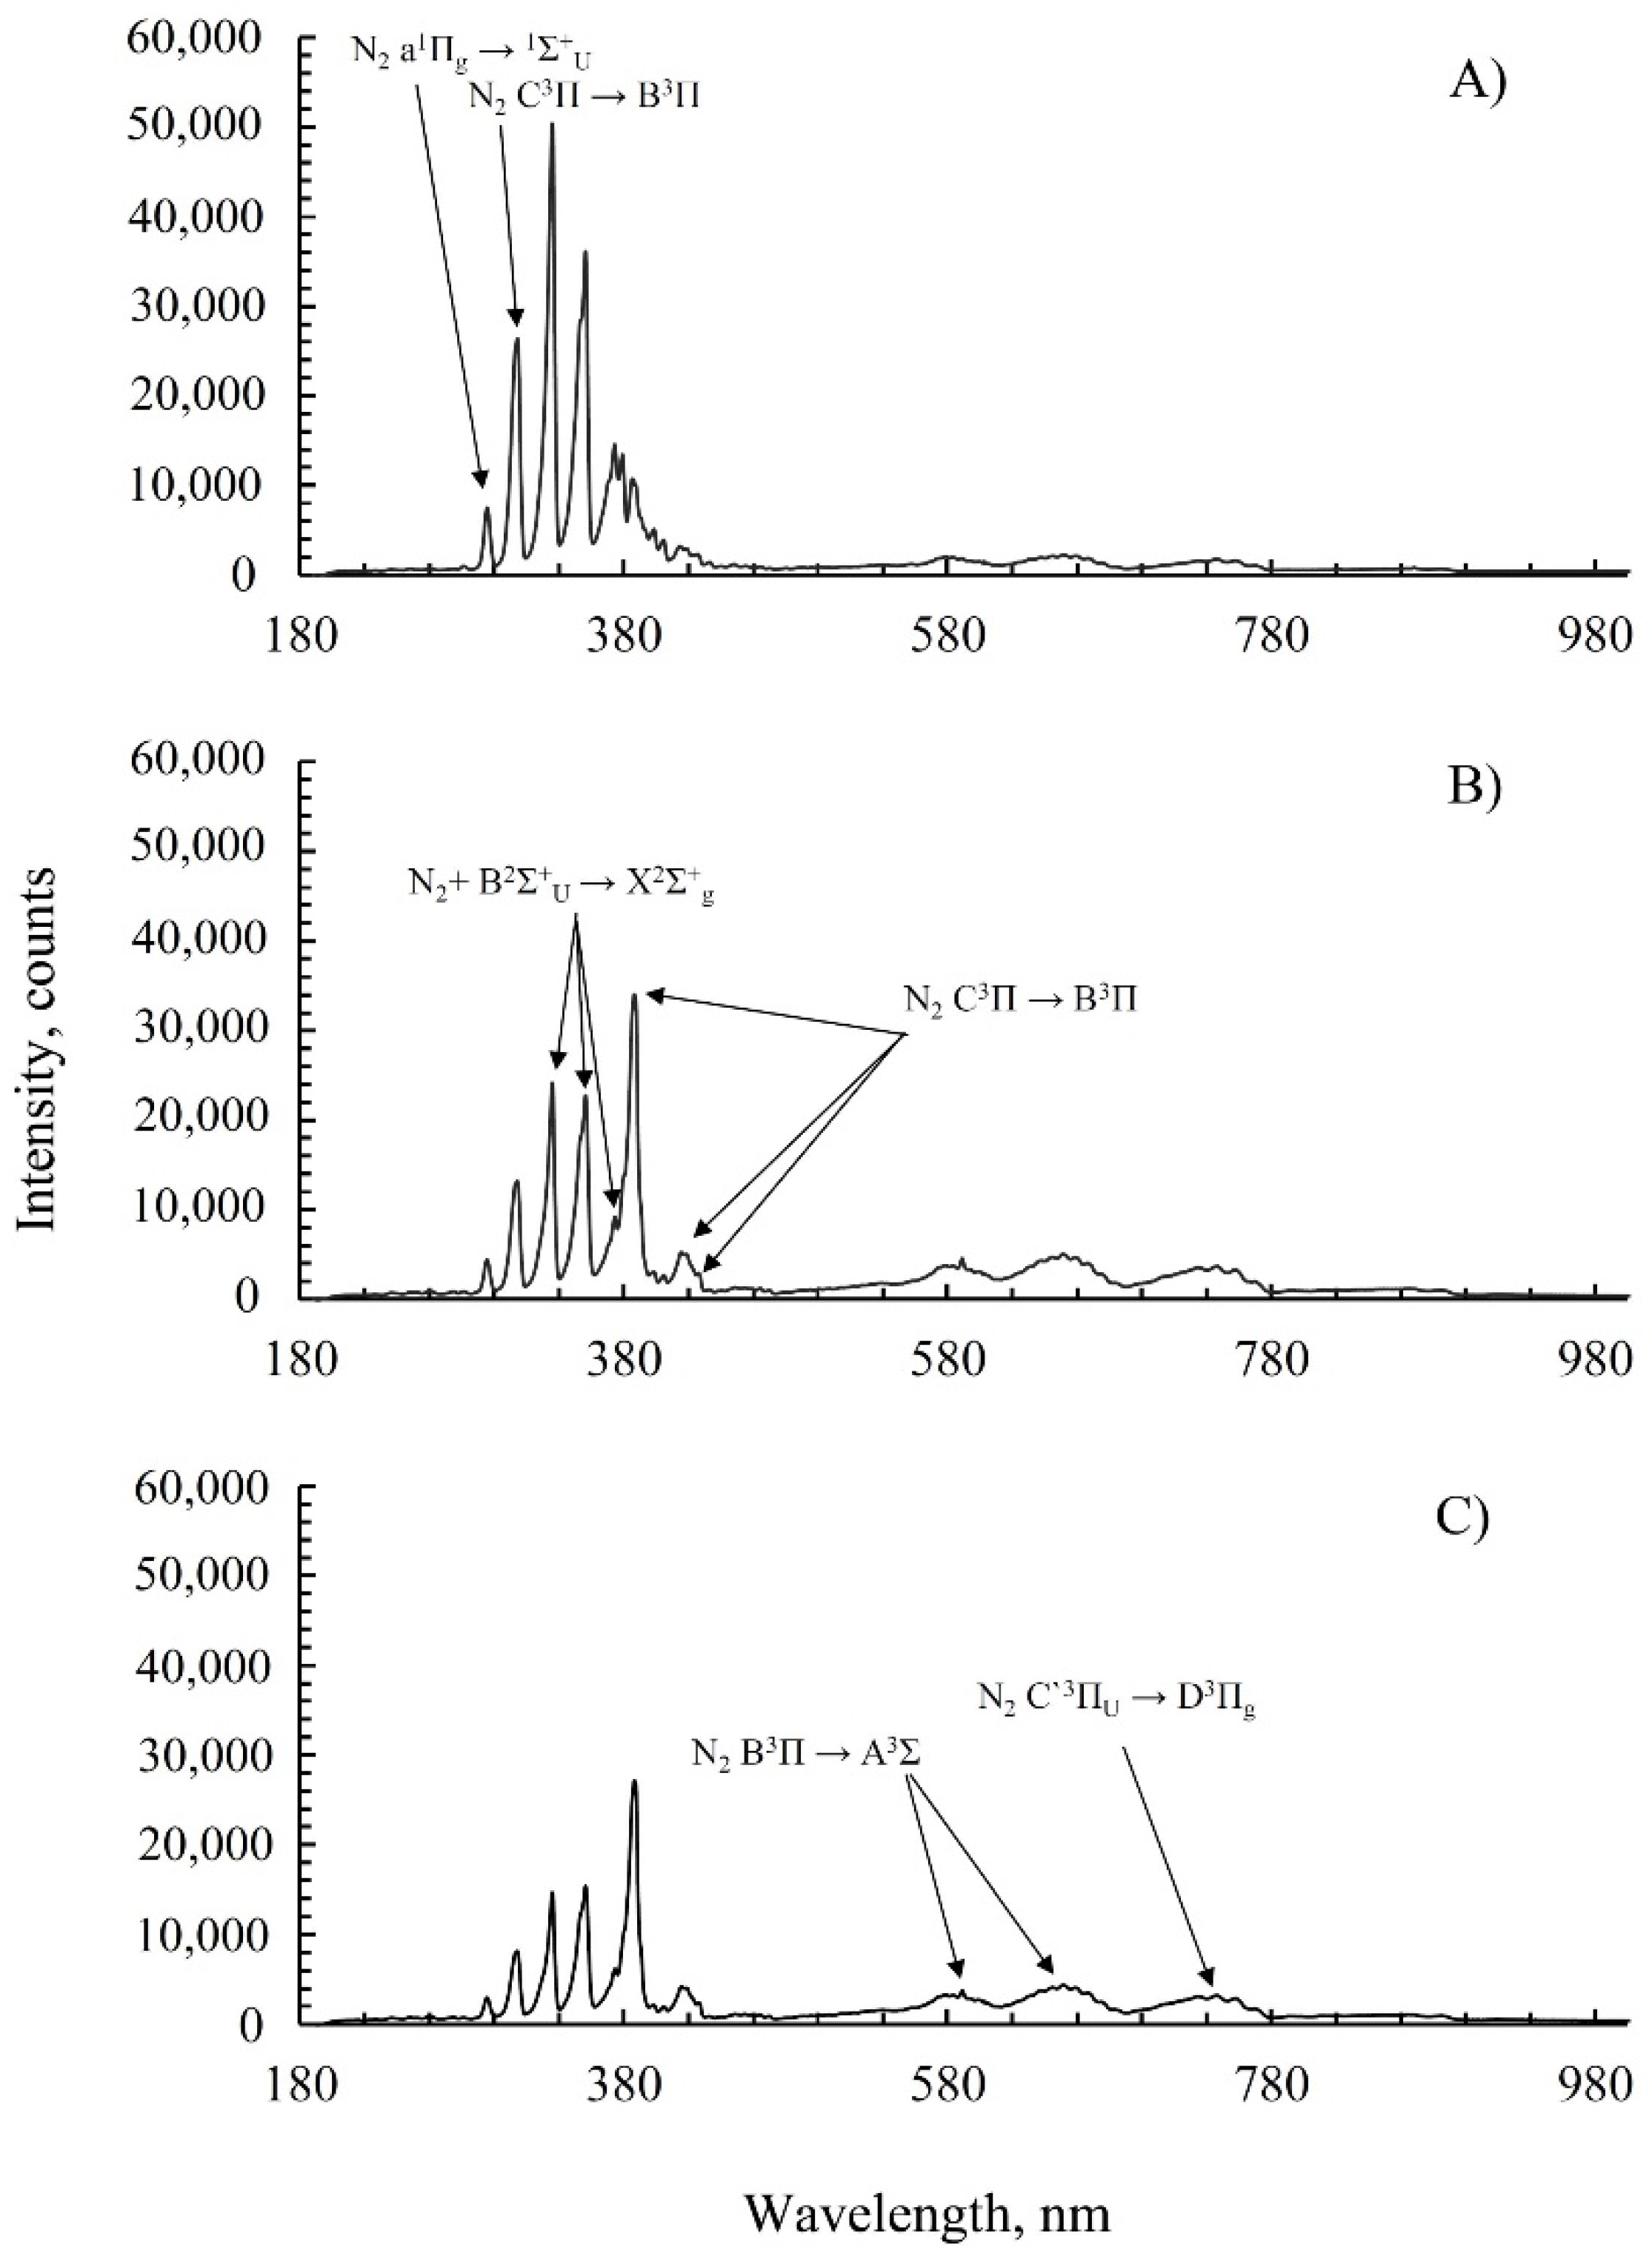
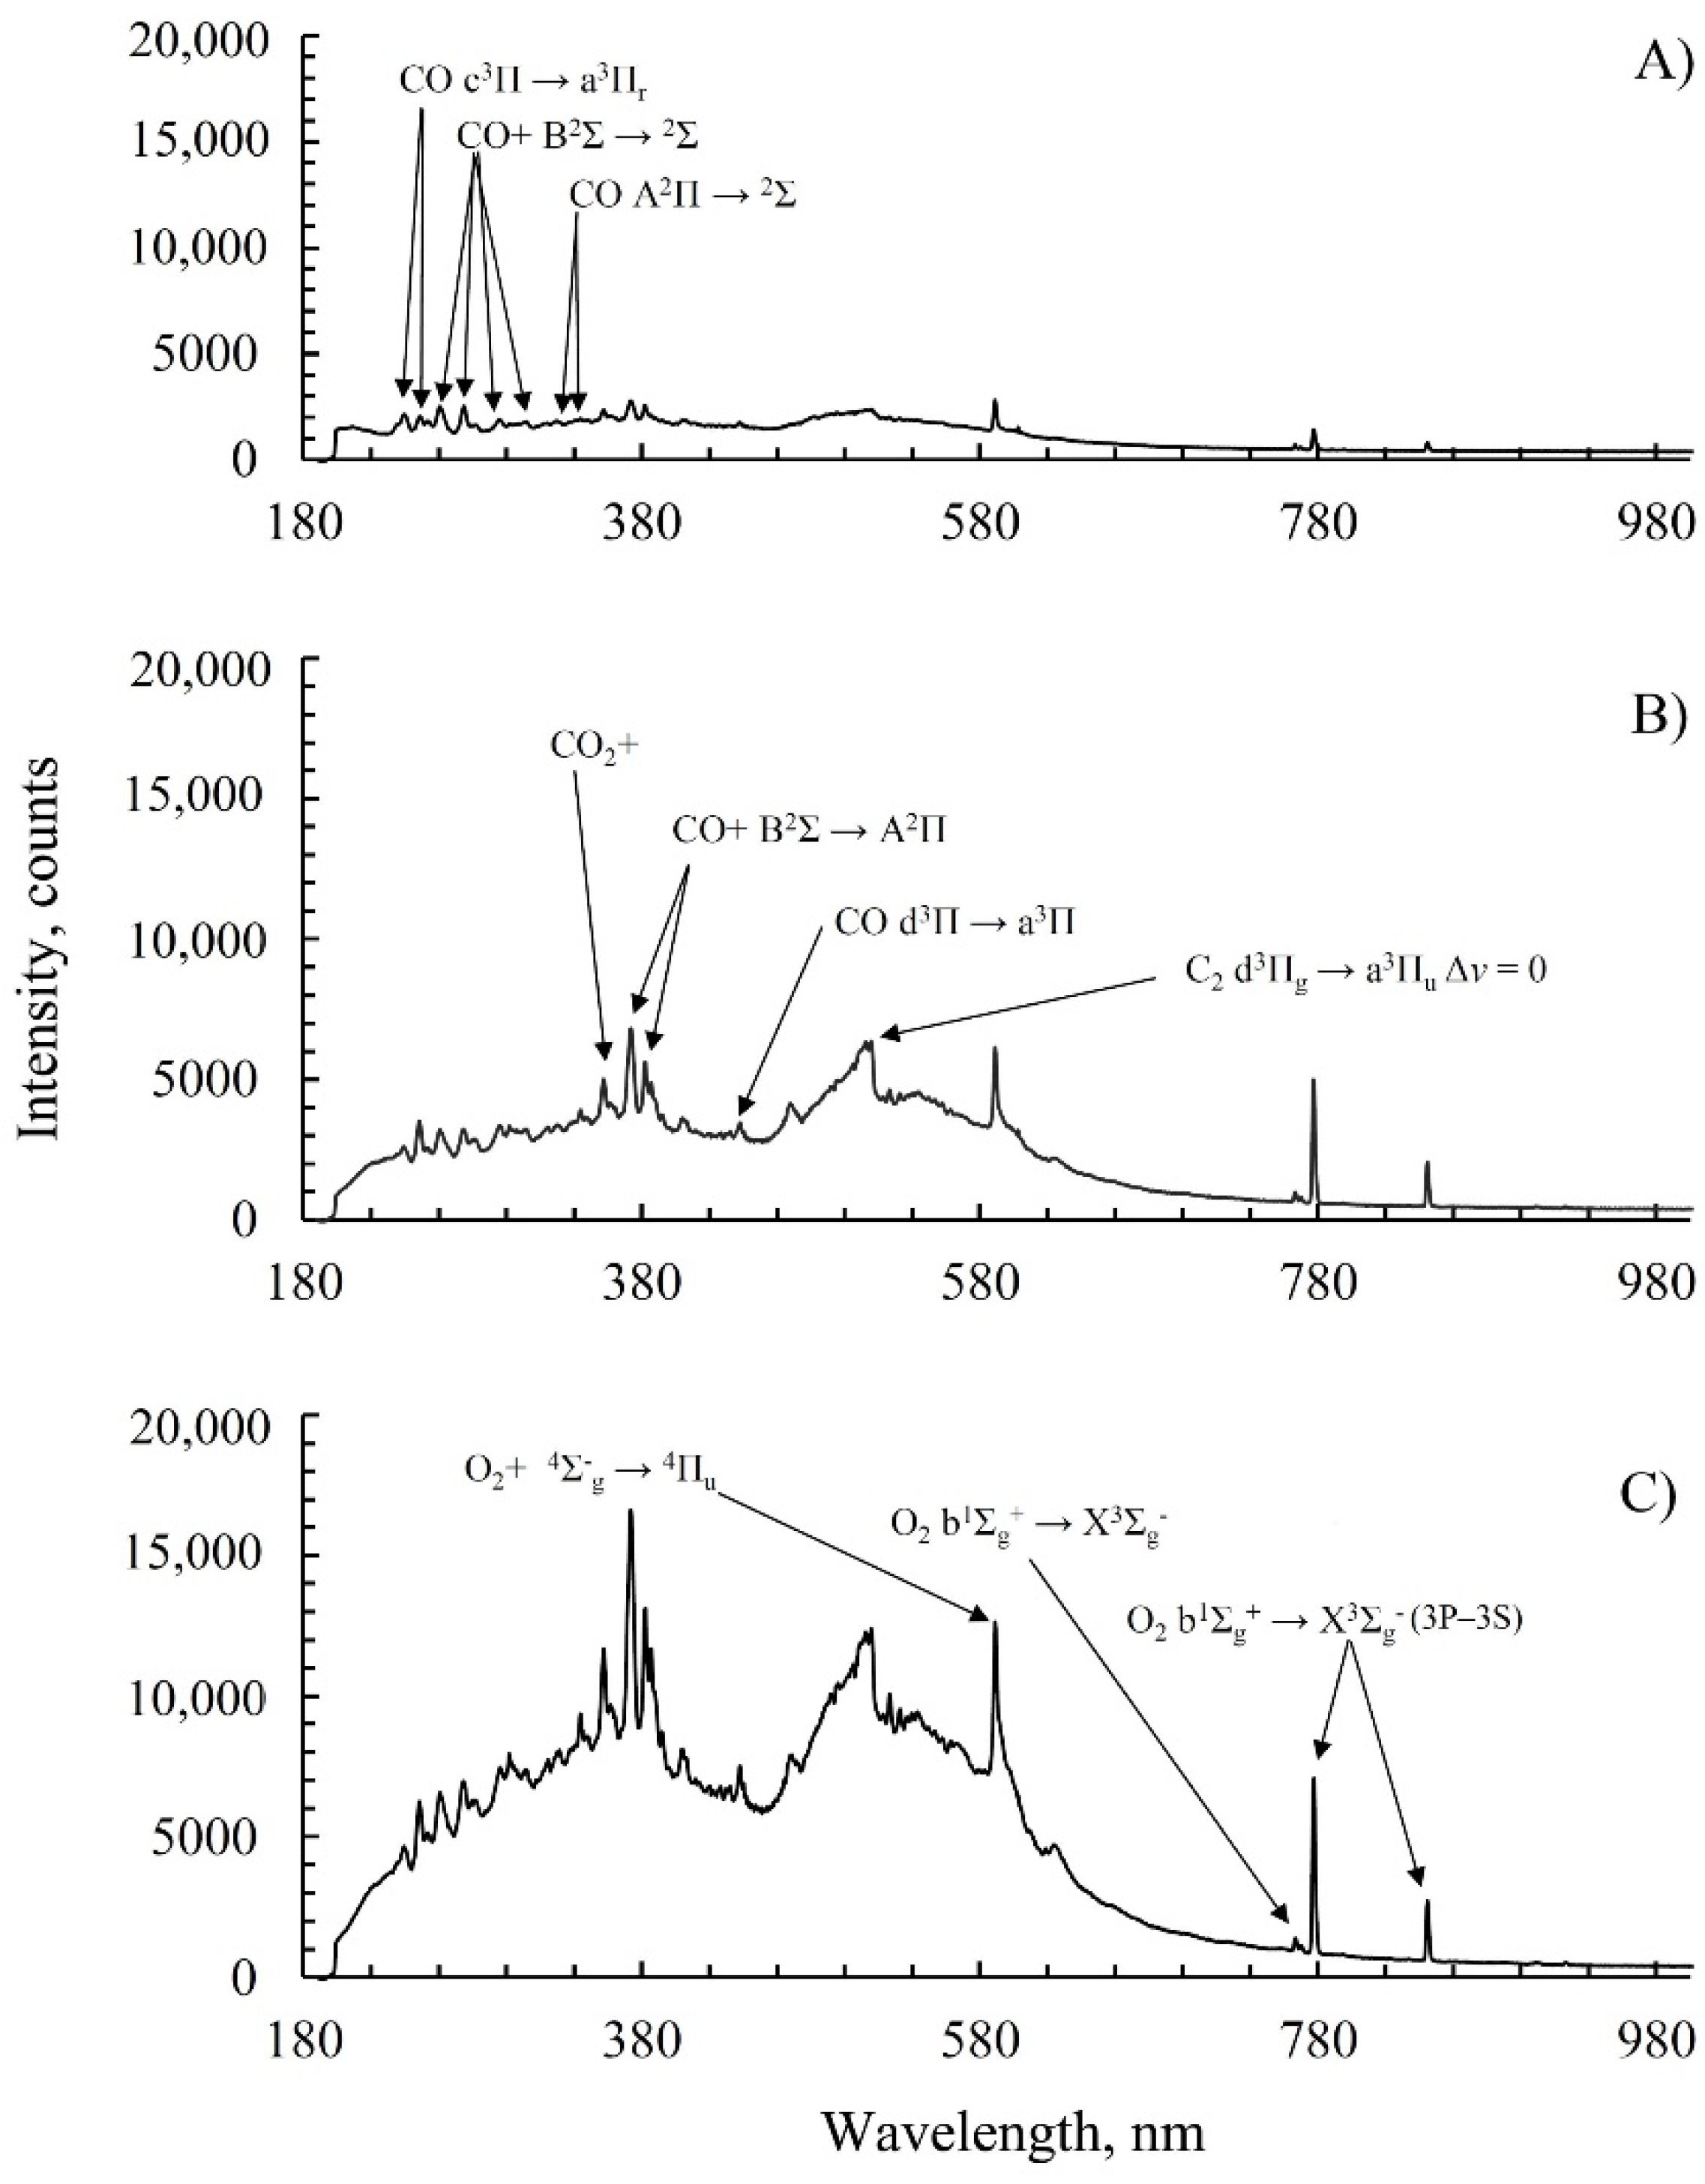
2.1. Emission Spectroscopy of Air during Plasma Discharge

In order to determine main exited radicals from various gases (O2, N2, CO2) which influence the negative effect of plasma-assisted combustion in terms of NOx, the emissions spectres were acquired during plasma-discharge. The emissions spectra of air (P = atmospheric, U = 8300 V, F = 60/180/250 kHz) are presented on the Figure 1A–C. The latest approaches are based on the fact that atoms and molecules in the exited state could react with other particles in a much faster way than usual non-exited versions [4,5], and also the method of excitement could be counted as more energy-efficient in a term of producing different atoms. For example, to excite the lower vibrational state of an oxygen molecule would require 0.193 eV; at the same time, the excitation of the lower singlet electron would need 0.98 eV, but the generation of a single oxygen atom from an oxygen molecule while they are staying in the ground state would need 5.1 eV. [18]. Moreover, based on [19], exited states of the oxygen like and could work as a reducer of the ignition temperature and induction time, which propagates the combustion process where it would appear.
Analyzing the graph of emission intensity of the air proceeded by plasma (Figure 1) could distinguish a couple of wavelengths that have the biggest impact on the processes. The first one is a peak at 777 nm, which corresponds to O (5P) O (5S) [9,10]. The second important emission peak is at 652 nm, which is attributed to O2 (a1Δg) [20,21]. The radical O2 (a1Δg) is considered as a long-lived one, because its radiation lifetime is very long, up to 3500 s. This allows this active species to safely escape from the pre-combustion zone of the gas proceeding and travel with the gas flow to the core of the flame. Meanwhile, O2 (b1Σ+g) is a short-lived radical with a lifetime of up to 16 s [22], but while the treatment zone is located directly under the combustion, it reaches the combustion zone and exerts influence on the processes going there. Based on [20], the experiments show that the presence on the O2 (a1Δg) radicals in the flow (with the mole fraction of 0.04) led to massive reduction (up to 66%) of the induction zone length and the flame-covered zone increased approximately twice. Further, based on reaction mechanism developed in [23], the fuel-air combustible mixture containing 2–5% of O2 (a1Δg) not only showed a shortage of the self-ignition distance point, but also indicated a decrease in the temperature-initial-ignition parameters. It was reported that even with a mole fraction of O2 (a1Δg) or O2 (b1Σ+g) equals to 0.01, shortening of the length of the ignition zone could be up to 2 times. It could be seen (Figure 1) that O2 (a1Δg) and O2 (b1Σ+g) radical-emission intensities are under the influence of impact of the frequency of the plasma generator. It was determined that the intensity of O2 (a1Δg) at the lowest parameters was not intense and only reached about 900 counts (Figure 1A). After switching to the higher-frequency parameters (180 and 220 kHz, Figure 1B,C), it was observed that the level of a1Δg was raised to the levels of 3700 and 3800 counts, respectively. O (5P–5S) radical had not shown a rapid change of its emission intensity, changing from 1800 units (777 nm peak) at 60 kHz rate to 1500 and 1600 units at 180 and 220 kHz, respectively. It should be noted that it also increased the levels of other oxygen radicals, but so far, they were not reported to provoke or detain combustion rates or ignition limits. The intensity of nitrogen-radical emission dramatically increased; it could be seen that bands on 235 nm, 245 nm, and 373 nm raised from 1100, 1500, and 11,000 counts, to 9200, 10,200, and 14,800 counts, respectively (Figure 1A–C).

2.2. Emission Spectroscopy of Nitrogen during Plasma Discharge

The obtained emission spectra from nitrogen in plasma discharges, which is shown in Figure 2A–C, could be used for determination of the dependency of the plasma parameters (frequency) on the emission intensity. It can also be used to study the typical radicals-emission picture with a particular experimental setup for further investigations about the ability of non-thermal plasma to decrease the intensity of pollutants generation during the plasma-assisted gas reformation process (without taking into account the oxidational pathway of NOx formation). The NOx reduction reactions can generally be divided into two groups: NOx removal reactions and NO–NO2 conversion reactions [24].
The first group consists of the list of the following reactions [25,26,27], denoted by Equations (1)–(6):
N 2 + e   N + N + e
NO + N     N 2   + O
N 2 + e     e + N 2 ( A )
N 2 ( A ) + NO     N 2   + N + O
N 2 ( A ) + N 2 O     2 N 2   + O
N 2 O + N     N 2   + O 2
The second pathway, the so-called “oxidational”, consists of further reactions, denoted by Equations (7)–(10):
O 2   + e     O + O + e  
NO + O     NO 2
O 2   + O     O 3
NO + O 3     NO 2   + O 2  
Under these conditions, the reactions that are mostly going in the burner are (1) and (2), formatting exited atoms N(2D) and N(2P) as a result of molecule dissociation of the electron impact and, based on [26], almost completely converting themselves into NO. Because of the fact that effectiveness of (1) in version N2 + e N(4S) + N(4S) + e is low, and the oxidation pathway is mostly not possible; it could be assumed that, while concentrations of the N(4S) and NO can not differ dramatically, the further pathway is N(4S) + O2 => NO + O and N(4S) + NO => N2 + O, which guides to full disappearance of nitrogen particles and fractional decrease of NO concentration. Exited states of a nitrogen, N(2A) and N(2D), have much higher numbers of generated species through this pathway; moreover, their interaction with oxygen could double the concentration of nitrogen oxide produced per one-discharge cycle. It is important to note that every interaction leads to the process of the formation of two molecules of NO. It could be explained by the fact that N(2D) briefly connects to the molecular oxygen, generating other NO species, (N2(A) + O2 => N2O + O). If, however, a mixture of gases consisting of nitrogen and oxygen is considered, the observed emission of radicals will occur somewhat differently. Firstly, it needs to be mentioned that the energy of dissociation of the oxygen molecule is lower than the nitrogen one [28], and if the concentration of oxygen is 5% or more, a significant portion of energy dissipates in oxygen dissociation, O(3P) + NO + M NO2 + M. Also important to note is that nitrogen in N(2D) form could increase the amount of generated undesired particles of nitrogen oxide, if the source of O2 particles, N(2D) + O2  NO + O, is near the place of its generation. Based on the emission graphs (Figure 2), it could be seen that in most cases, the intensity of the nitrogen emissions is decreasing when the number of oxygen molecules is small. In the low-plasma-parameters case, the emission intensity on the wavelength 313 nm, 335 nm, and 356 nm is 25,300, 50,300, and 35,500 counts, respectively. After increasing the plasma frequency, the intensity drops to 7500, 13,900, and 14,600, respectively, but at the same time, the N2 band on 386 nm dramatically increases from 10,000 to 27,000 counts. That could be explained by an oxy-less mechanism of nitrogen-molecule dissipation, and the fact that the radicals that correspond to the 386 nm band could not oxidize due to the lack of oxidizer (Figure 2C).

2.3. Emission Spectroscopy of Carbon Dioxide during Plasma Discharge

One of the main problems connected with CO2 plasma processing is the high stability of the carbon-dioxide molecule, which requires not less than 5.5 eV/molecule to break intermolecular connections [29]. All reactions that are going with CO2 could be divided into two groups [30]:
The reactions of direct production of CO and O2,
CO 2 + e     CO + O + e
CO 2 + e     C + + O 2 + 2 e
And reactions that require some intermediate processes to be finished, like:
CO + + O     CO + O +
CO + + CO 2     CO + CO 2 +
Based on [31], CO is one of the main influencers of flame ignition. It is noted that without CO, the ignition temperature increases by 65 K, which makes carbon monoxide the second biggest ignition influencer after hydrogen. Emission specters of carbon dioxide are shown on Figure 3A–C. It could be easily seen that the most massive reaction on the influence of frequency change occurs at 373, 512, 589, 777, and 844 nm. The emission intensity of those species increases from 2600 to 16,600 units in the case of CO+B2Σ A2Π, from 2300 to 12,000 in the case of C2d3Πg  a3Πu, Δυ = 0, and from 2600 to 12,600 units in the case of O2+g  4Πu (Figure 3A–C) which is involved in the CO2 recombination process, O2+ + CO2 + e CO2 + O2 (15). Besides, the influence on the production of the highly-active oxygen radical, emitted on 777 and 844 nm wavelengths, should be mentioned. The emission intensity of O2(b1Σ+g) raises from 1400 to 6800 counts, which is considered as an increase in the content of the species.

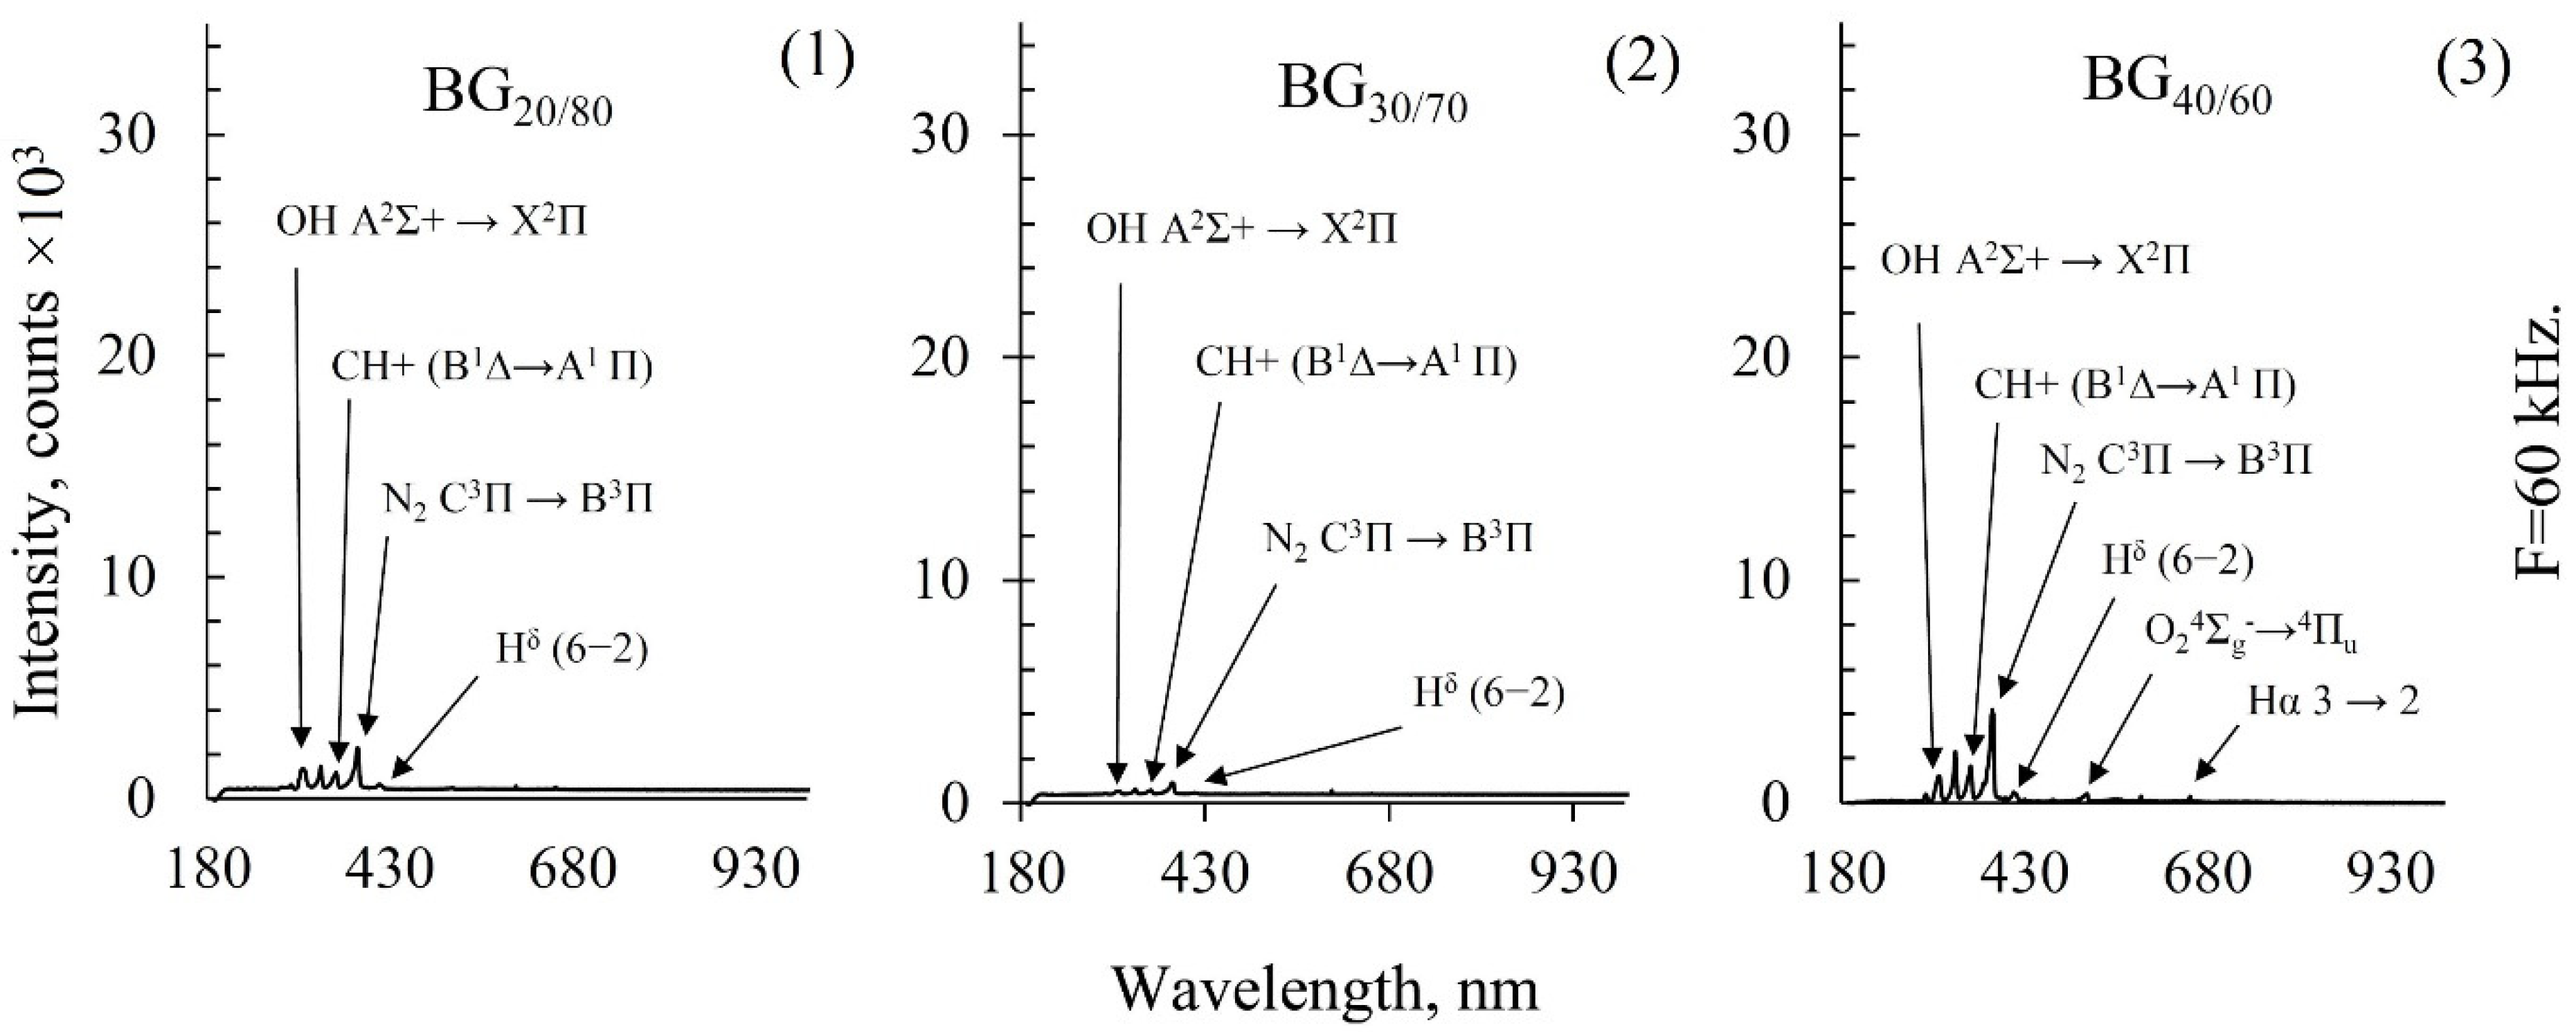
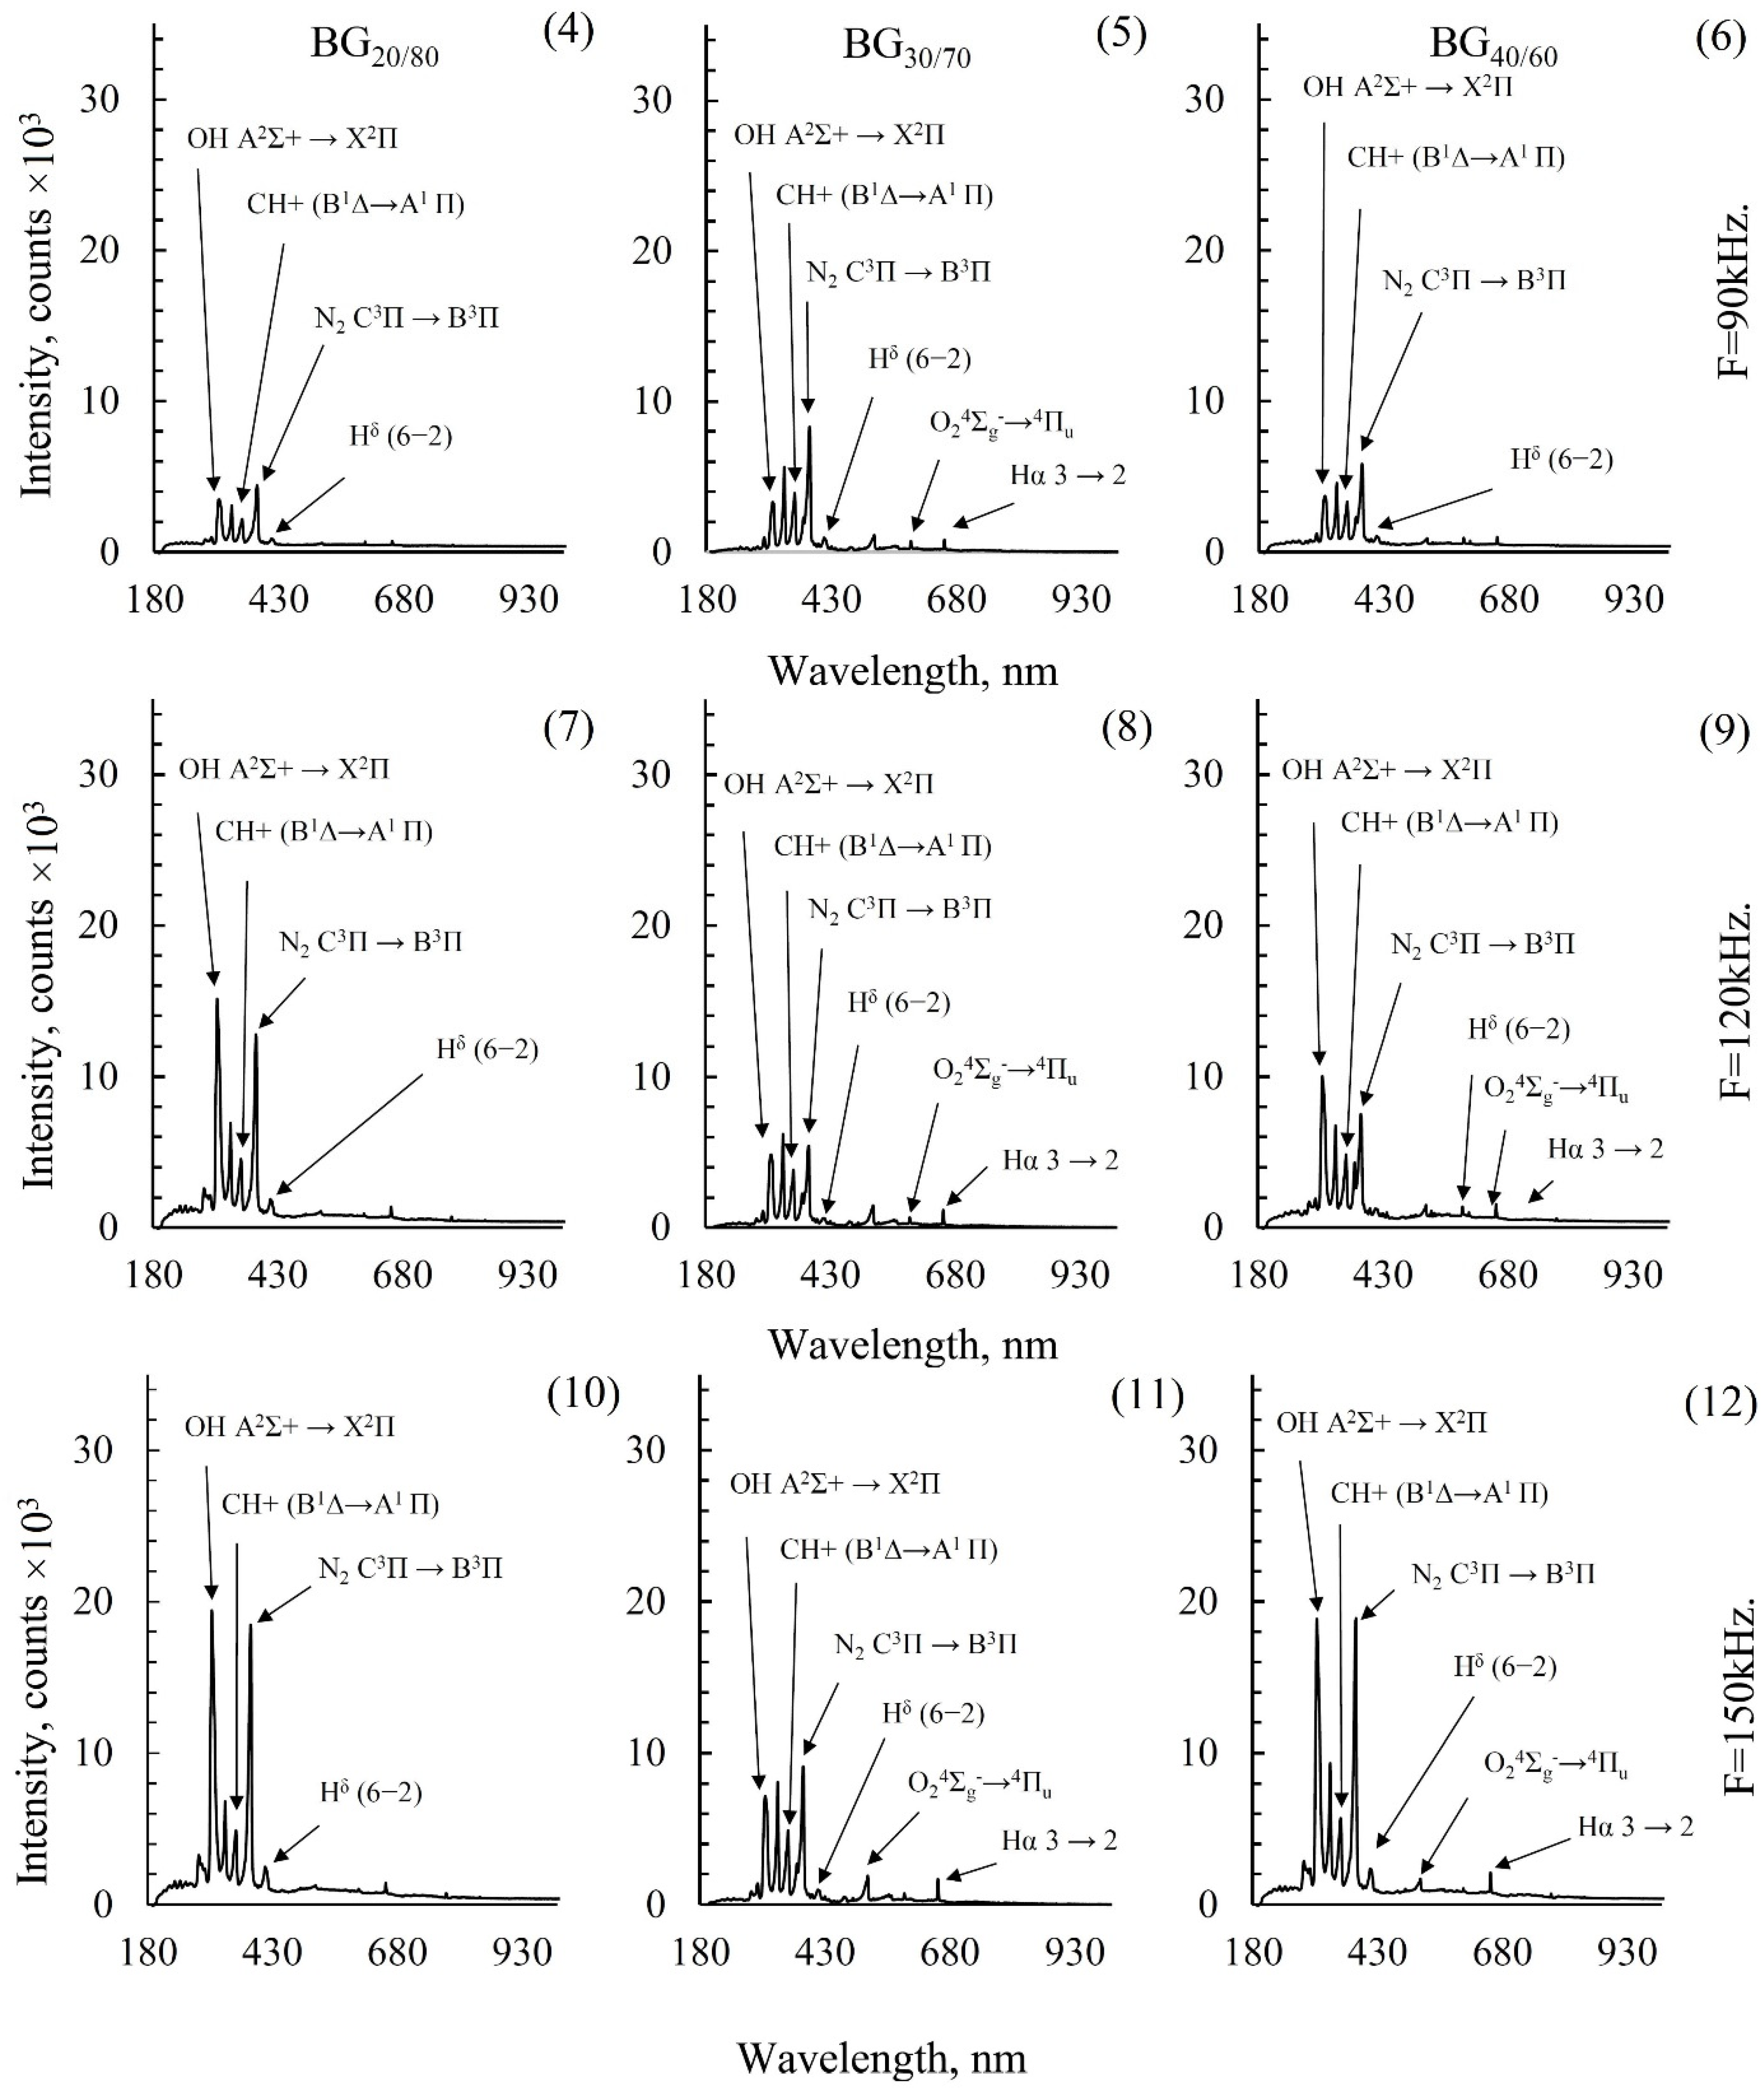
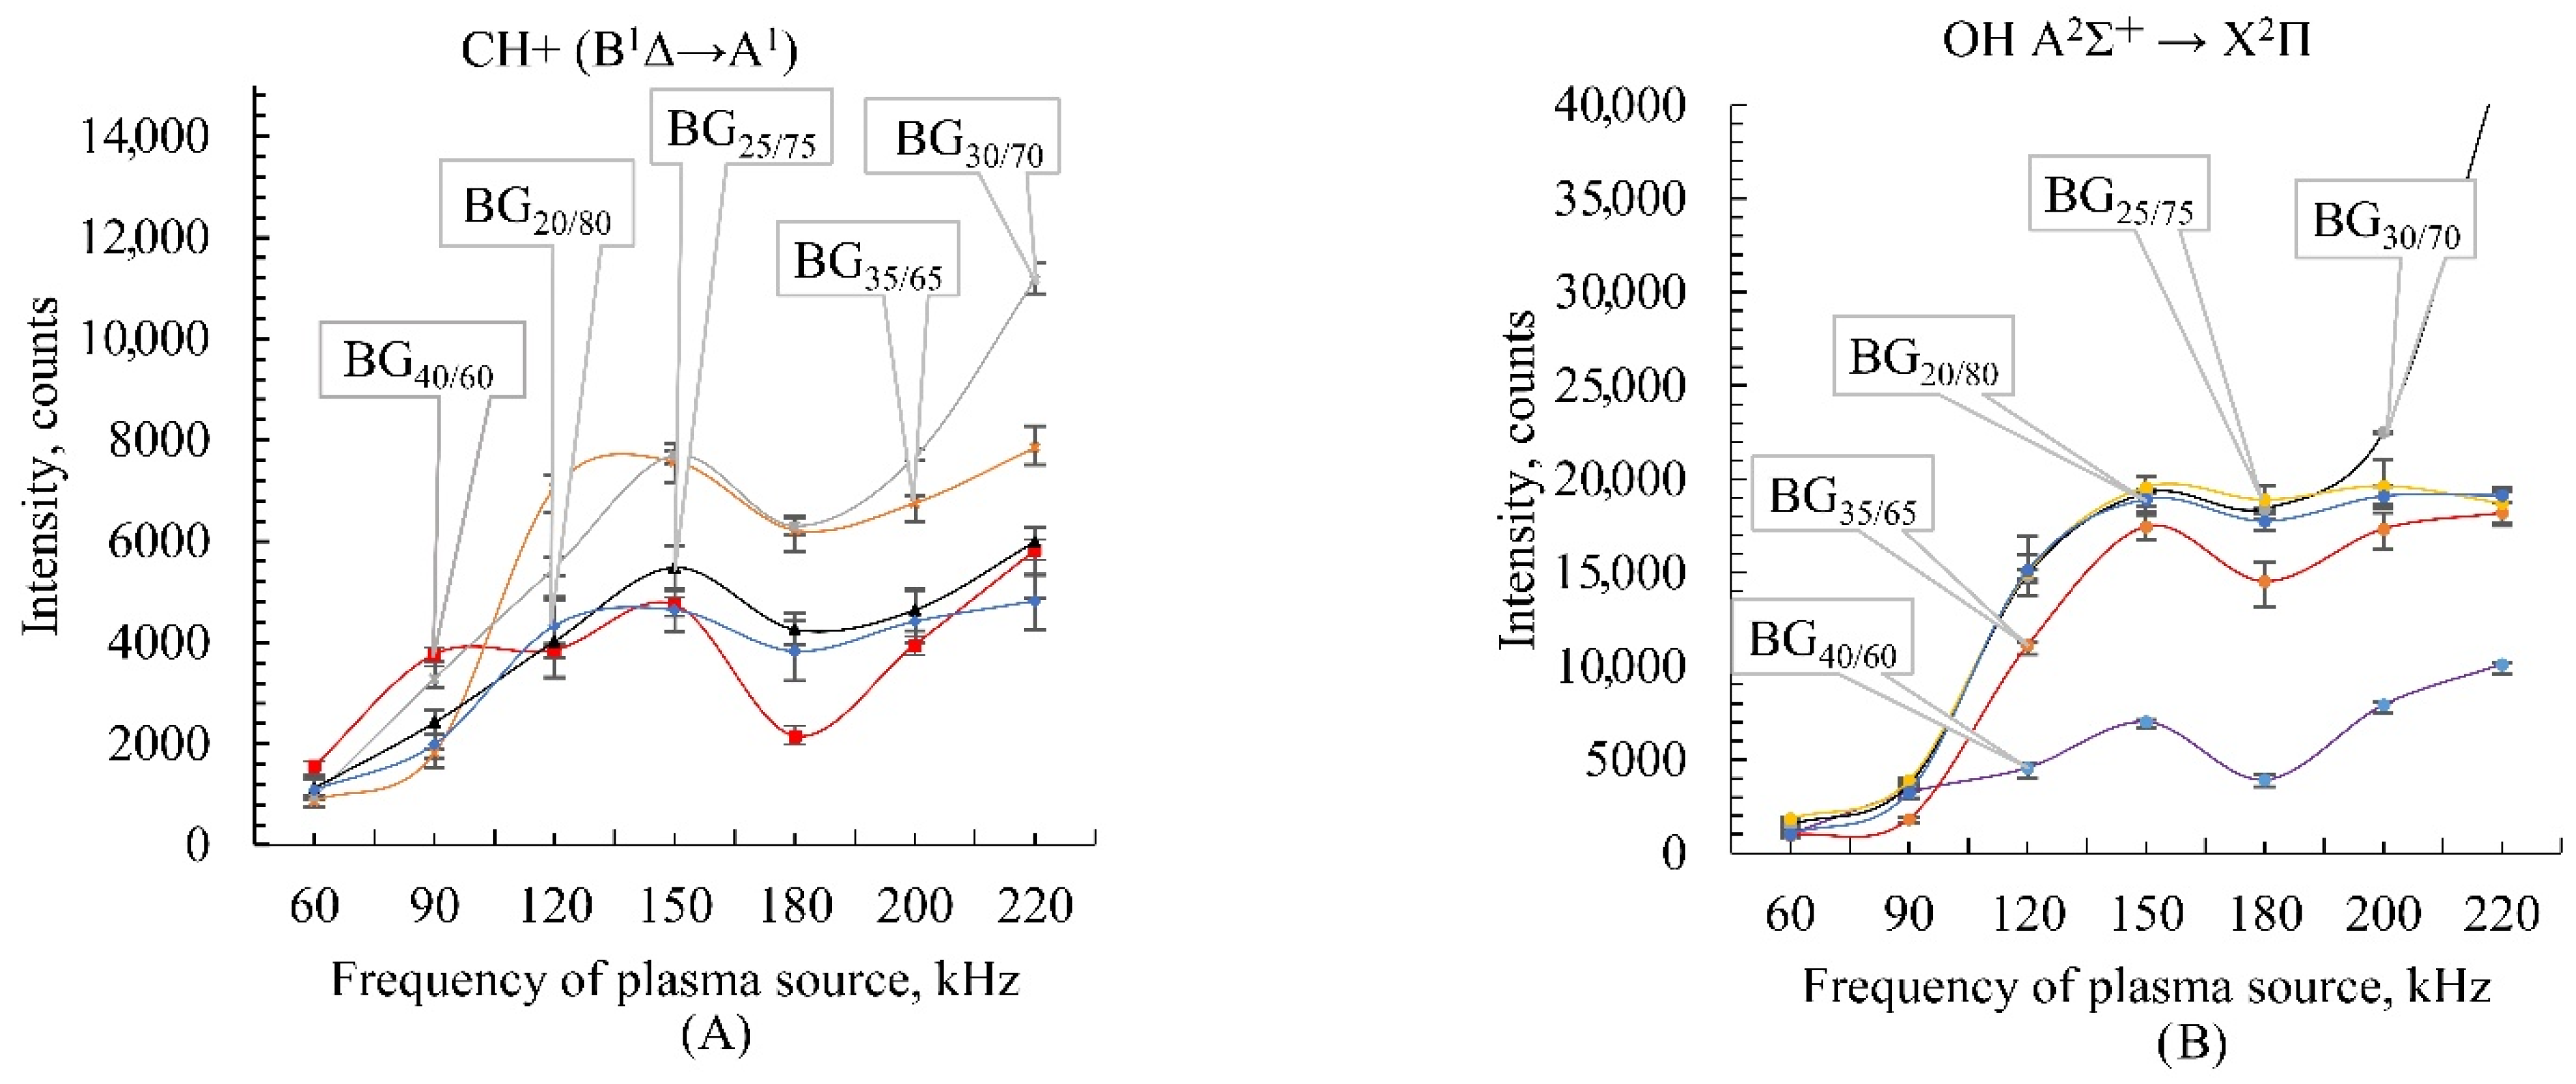
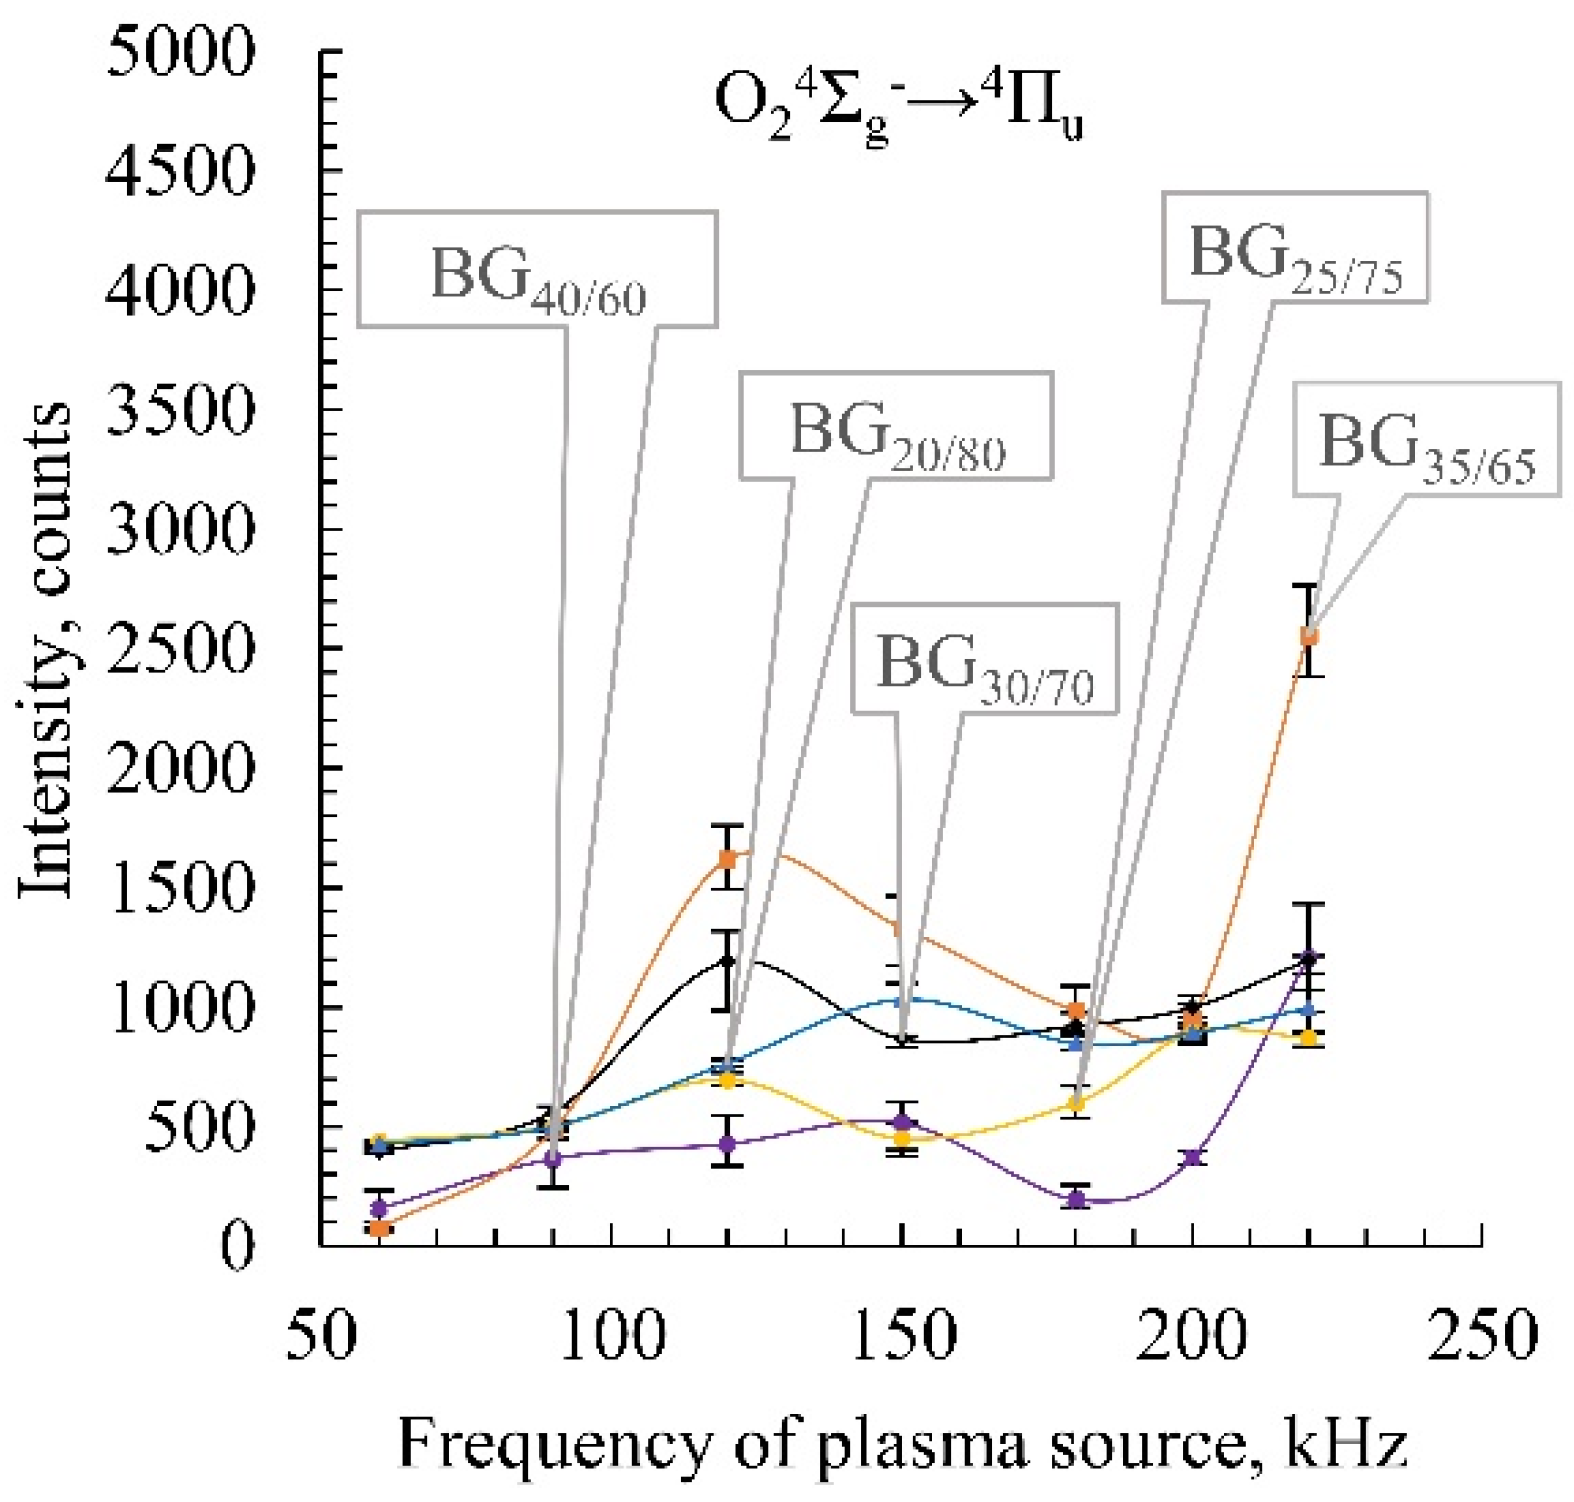
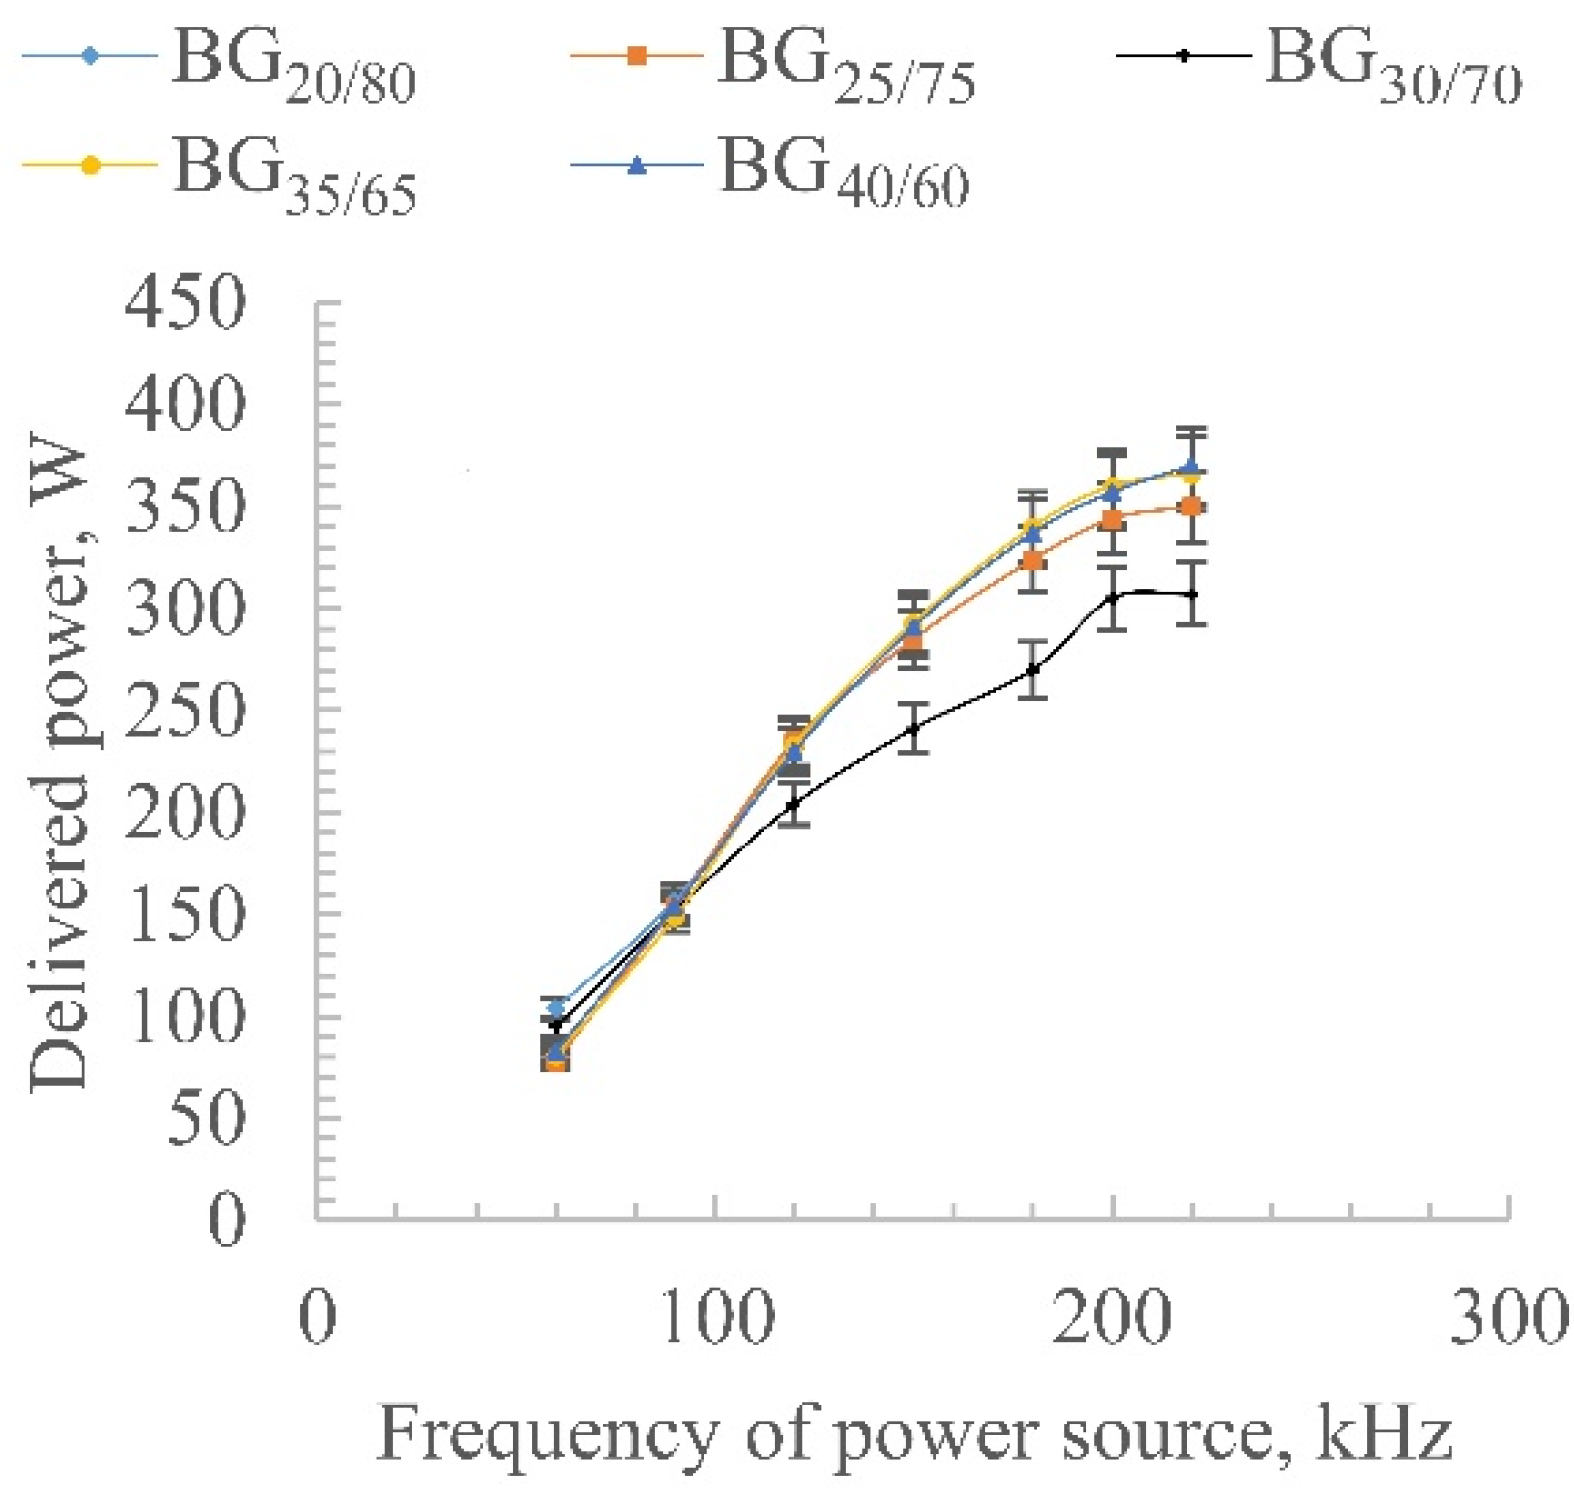
2.4. Emission Spectroscopy of Biogas

Particularly, biogas is used with different concentrations of CO2 and CH4 for the experiments carried out using five different compositions of waste biogases, which are formed during the upgrade process to biomethane: (BG20/80, which contains 20% CH4 and 80% CO2; BG25/75, BG30/70, BG35/65, and BG40/60,,which contains 25% CH4 and 75% CO2; 30% CH4 and 70% CO2; 35% with CH4 and 65% CO2; 40% CH4 and 60% CO2, respectively). In Table 1, the component flow for each concentration can be seen. The overall flow is sated at 10 l/m, according to calculations to simulate conditions if there was a flame.
Nitrogen in this experiment is used as a gas to simulate air flow and to ensure that the gas composition of methane and CO2 would not be flammable after being processed by the plasma. As planned, the experiment tests seven frequencies: 60, 90, 120, 150, 180, 200, and 220 kHz to see the impact of that parameter on the overall picture of radical generation and determine the frequency tendency on formed radicals during plasma discharges. Figure 4, Figure 5 and Figure 6 show tables with emission-specters graphs for each studied frequency.
The OES intensity and profiles can give a plausible qualitative picture of the appearance and disappearance of particles in an excited state. As it could be seen, a typical emission specter contains OH A2Σ+  X2Π [32], CH+ (B1 A1Π) [13], N2 C3Π B3Π and Hδ (6−2).
Peaks that are unmatched (graphs 1–21) are for CO+ and N2+. In the variants of a biogas with the higher concentration of CH4 (Figure 6, graphs 3,5,6,8,9,11,12,14,15,18,18,20,21), there is the observed appearance of O24Σg  4Πu and Hα 3 2 [13].
In the ultraviolet region, a CO (B3Σ B3Π) spectrum (graphs 7–21) is observed at 283.3 nm (unmarked), which could be counted as proof of intense production of CO. From the graphs, it can be seen that it reaches up to 3000 counts for BG20/80 composition (graph 19). The diatomic-molecular bands of CH corresponding to the B1 A1Π transition are identified at 350 nm (graphs 1–21). Some bands of CO+ are found (graphs 4–21) near 290 nm and in 373 nm, which are caused by the transition of B2Σ  2Σ and B3Σ+  A2Π, respectively. Only one band of oxygen is observed in the experiment that is, O24Σg  4Πu at 588 nm (graphs 5, 6, 8, 9, 11, 12, 14, 15, 17, 18, 20, and 21). Hydrogen Balmer lines Hα (n’ = 3 n = 2, 656.3 nm) and Hβ (n’ = 6 n = 2, 410 nm) are also found (graphs 1–21) [33]. For further possibility of correct adjustment of burners and deduction of tendency, it is important to consider the behavior of individual radicals to change the frequency of the plasma generator. Figure 7A,B and Figure 8 show patterns of intensity change of some radicals.
The graphs show that the function has a couple of local extremums, first of which is in the 130–160 kHz range. After reaching this extremum in the production of the radicals, a huge drop of the intensity lines is observed, which could be explained by the fact that the intensity of spectral lines decreases while moving up the energy scale (or frequency scale) because there are fewer excited atoms at high energies that decay directly to the ground state. After reaching the local minimum, with the specific energy being enough for re-reforming the already existing radical complexes, it contains the needed subparticles that are partially proceed, and pushes species that are already in lower levels of excitation toward the higher states; due to that fact and further-going energy provision increases, the second peak is observed (Figure 7A,B). Figure 8 shows the same tendency of the graph for other detected radicals, but the intensity of line growth till the first peak is much slower, compared to the CH+ and OH radical graphs. This could be explained by the fact that part of the produced oxygen radicals plays a sufficient role in continuing the oxidational process; a substantial part of them, after being generated, get involved in the process. Because of the important role that this radical plays in the overall combustion process, it needs to be carefully studied to identify parameters of its best production for each gas composition. The energy consumption graph can be seen in Figure 9. It could be seen that power consumption rises up in a nearly logarithmical form for all studied biogas compositions. The largest change in consumption occurs in the 60–150 kHz area, after which the increase in consumption per unit of frequency decreases, which is clearly visible from the changed angle of the graph.
It needs to be mentioned that this graph is showing the amount of energy transpired to the high-voltage transformer of the source, but not the direct energy supplied to the plasma by discharge. This is why lower energy in the graph (e.g., for BG30/70) would not necessary mean lower energy transferred to the plasma. The energy transferred to the plasma should be calculated by integrating Lissajous figures, where curves with higher values could mean a lower area in the graph and, as a conclusion, a lower transfer of plasma energy.

2.5. Gas Chromatography Analysis of Biogas

For further investigation of the plasma influence, the calorific value of the proceeded gases is obtained from the experiments with the help of a gas-chromatography unit. Gases are captured from the chamber to tedlar bags and are analyzed using the GC. The obtained chromatograms are processed and the percent concentration of each gas is found. The determined calorific values of proceeded and non-proceeded gases are presented in Table 2.
The graphical dependence of the calorific value from the variant of biogas mixture is shown on Figure 10. In the graph, it could be seen that, for all frequencies, the overall tendency of change looks similar, with the only exception that not every local minimum and local maximum frequency would sit on the same place. For example, the extremum in the graph describes the attitude of the calorific value of the gas that proceeds with the plasma under the 120 kHz frequency parameters; the value is at the point of BG30/70. At the same time, the gas processed under 180 kHz plasma achieves the highest calorific value on BG35/75. This could be explained by the fact that the intensity of radicals generation decreases while moving up the energy scale (or frequency scale), because there are fewer excited atoms at high energies that decay directly to the ground state. The observed local maximum appears when the ability of the energy, transferred by plasma, to process the gas covers the maximal percentage of raw gas supplied in every portion. After reaching the local minimum, the specific energy start is enough for re-reforming the existing radical complexes that contain the needed subparticles that are partially proceeded to push the species that are already in lower levels of excitation toward the higher states; as a result, as the continuous energy provision increases, the second peak is observed.

3. Materials and Methods

3.1. Experimental Setup

The experimental setup consisted of a plasma-assisted burner ( developed by laboratory) that was working in a fuel-decomposition regime without combustion, a power-supply unit, flow controllers, and an emission-spectroscopy system (purchased from Ocean Insight, Orlando, FL, USA), and is schematically shown in Figure 11.
The plasma-assisted burner (Figure 12) consists of a cone-shaped inner electrode with a diameter of 14 mm, which is connected to a high voltage line. As for the ground electrode, it has a cylindrical body with an external diameter of Ø = 28 mm; a length of body of 25 mm, and a main internal channel Ø = 16 mm. Both electrodes are made from carbon steel 45C. Gas guiding systems, which contain an inlet nozzle and guide vanes, consist of four tangential channels, made by milling in PTFE solid cylinder that goes into the internal cavity of the burner.
The flows of fuel and oxidizer are connected by the method of oncoming channels to ensure better miscibility of gases. Because of the effect of the swirling flow that moves through the internal channel of the burner until it reaches the minimal gap cross-section, the flow interacts with the spark, formatted by the plasma and forcing it to spin, producing not only a self-standing spark, but a whole front of dependently spinning discharges that cover the cross-section of the gas-exhausting channel. Thus, a rotating and gliding arc plasma is generated. The upper part of burner is covered with quartz glass to ensure impermeability which makes it possible to observe plasma generation and to provide the possibility to perform the optical-emission-spectrometry measurements. The experimental setup is installed on the table with a bracket system that allows it to be held in one particular place, the upper cap, which covers the glass cylinder made from plastic, and consists three-threaded holes to hold the exhaust-gas line, the upper optical port for spectrometer fiber, and the gas-sampling line for sample- bag connection of flow-gas analysis.
Commercial pure-grade gases (methane, carbon dioxide and nitrogen) were used for the preparation of combustible mixtures containing biogas, in which all the needed air was changed to nitrogen to prevent possible ignition of the processed solution. Flow rates of gas were controlled using Brooks Instruments MFC controlling unit (Brooks 0254) (purchased from Brooks Instruments, Hatfield, PA, USA) and three mass-flow controllers (SLA 5800) (purchased from Brooks Instruments, Hatfield, PA, USA) The flow was set permanent (10 L/min), and was directly supplied to the lower part of the burner through flexible channels.
To create plasma discharge, a high-voltage plasma generator, G2000 (purchased from Redline Technologies, Germany), with a maximum voltage of 10 kV, frequency range 0–500 kHz, and output power up to 500 W was used. The experiments were performed with a locked voltage of 8.33 kV and with seven stages of frequency to observe the emission spectras, which can be seen in the Table 3

3.2. Emission Spectroscopy and Gas Chromatography

The gliding-arc discharge influence on various gases was determined using a flame- emission spectrometer, Flame UV-VIS (purchased from Ocean Insight, Orlando, FL, USA), with a wavelength range of 200–850 nm. The integration time was settled at 0.05 s and thenumber of scans to average was set to 35.
For gas analysis, the method of gas chromatography was used. As an analyzing unit, Agilent Technologies Gas Chromatographer model 7890A (purchased from anta Clara, CA, USA) was used, which was operated with the help of a dual-channel, thermal-conductivity detector and a valve system. For the front channel, pure He-carrying gas with stable flow rate of 10 mL/min was used. This channel was used for separation such gases as: O2, CO, CO2, CH4, C2H2, C2H6, and C3H8. At the same time, H2 was separated through a molecular-sieve packed column of the back channel operating on an N2-carrier (30 mL/min).

4. Conclusions

The experiments demonstrated the influence of plasma parameters on the emission intensities, the actuality and influence of some exited particles on the decomposition rates and the pathways by which processes are going. The obtained results could be summarized:
Air: Emission of species with high-oxidation abilities, such as O2 (a1Δg), increased by 4 times, which could exert a great influence on the combustion process because of the shortage of the self-ignition distance point as well as the decrease in the temperature-initial-ignition parameters. It was reported that even with a mole fraction of O2 (a1Δg) or O2 (b1Σ+g) that was equal to 0.01, the shortening of the length of the ignition zone could be up to 2 times. At the same time, O+2g  4Πu, which plays a substantial role in the recombination process of carbon dioxide, increased by 4.8 times.
Carbon dioxide: Analogical pictures could be seen with the emissions of carbon dioxides, where the overall level of CO+ radicals-emission intensity increased by 6.64 times with high plasma frequency, which could also influence the generation of hydrocarbon radicals in the combustion process. Investigations of the influence of plasma- source parameters on the process of plasma-gas conversion have shown a non-linear dependence of emission production, meaning a non-linear dependence of particles generation and conversion.
Nitrogen: It needs to be mentioned that the energy of dissociation of the oxygen molecule is lower than the nitrogen one [28], and if the concentration of oxygen is 5% or more, a significant portion of energy dissipates in the oxygen dissociation, O(3P) + NO + M NO2 + M. Equally important is that nitrogen in the N(2D) form can increase the amount of undesired particles of nitrogen oxide generated if the source of the O2 particles, N(2D) + O2  NO + O, is near the place of its generation.
OH and CH: As one of the most important radicals for the improvement of the combustion process, radicals of OH and CH+ have shown their high ability to react to changes in plasma parameters, such as frequency. In the graphs (Figure 7), it could be determined that the biggest influence on their production makes a shift from 90 to 150 kHz repetition rate. After reaching a local maximum, production intensity obeys the same rule as the rest of the radicals and goes down, reaching a local minimum at ~170–180 kHz. After passing this minimum and further increasing the frequency, the graph shows a trend towards an increase in the number of generated radicals.
Biogas: Presented graphs and tendencies are showing a huge reaction of the biogas on the plasma treatment. Calorific value, after the gas was processed, increased by 3–6 times, which shows that, after treatment and with additional oxygen radicals that are enhancing combustion process, overall combustion can achieve a much higher efficiency.
The emission graphs show that, through the frequency table production of species, it would have some local maximums and minimums. However, at the same time, the graph of the power consumption by the plasma generator had a much more expected pattern of smoothly ramping function, which could lead us to the assumption that for producing industrial-scale plasma-assisted device, there would be a need to find and adjust the frequency and voltage of every device to ensure its best productivity, while the power consumption would be as low as possible. The experiments conducted to determine the calorific value after plasma-processing gases showed a significant effect even on low energies provided by the plasma source. Increase in the calorific value of gases varies from a 2.45 time increase in the worst case observed, to 5.09 time increase in the best case. These studies are applied, which means that they could be implemented into the newly designed plasma-assisted burners, which could be used as part of the process of reconstruction of old and already existing facilities, such as steam generators or water-heating boilers. Such modification, if done correctly and responsibly, could take minimal effort and does not require rebuilding the whole firebox or changing the layout of pipelines inside the firebox. The results of this study show that the graphical dependence of the radical emission in correlation with the frequency of a plasma could be used for further investigations for reducing ignition-delay length. At the same time, by comparing graphs of emission for each specific radical at different points, it would be not hard to regulate the burner for current needs, e.g., for lower pollutants emission or for maximum thrust, when the number of generated O2 (a1Δg), CH, and OH radicals would be maximal, which would lead to more flexible control of the combustion process. Moreover, this technology is promising due to the fact that it could lower the emissions of nitrogen oxides, which are one of major parts in the pollutant roadmap. This would open the possibility to use gases, such as, NH3, which is a great carrier of hydrogen and is a so-called «green fuel», but is found inside nitrogen molecule; this makes it a lessapplicable gas for combustion because of its extreme pollutant emission level.

Author Contributions

Conceptualization, E.B. and R.P.; data curation, E.B. and N.S.; formal analysis, E.B.; investigation, E.B.; methodology, E.B. and R.P.; validation, E.B. and N.S.; resources, N.S.; software, N.S. and R.P.; writing—original draft preparation, E.B.; writing—review and editing, N.S. and R.P.; visualization, E.B. and R.P.; supervision, R.P. All authors have read and agreed to the published version of the manuscript.

Funding

This research received no external funding.

Data Availability Statement

Not applicable.

Conflicts of Interest

The authors declare no conflict of interest.

References

  1. Bhan, C.; Verma, L.; Singh, J. Alternative Fuels for Sustainable Development Environmental Concerns and Sustainable Development; Springer: Berlin/Heidelberg, Germany, 2020; pp. 317–331. [Google Scholar]
  2. Beychok, M.R. NOX emission from fuel combustion controlled. Oil Gas J. 1973, 1, 53–56. [Google Scholar]
  3. Starikovskaia, S.M.; Kukaev, E.N.; Kuksin, A.Y.; Nudnova, M.M.; Starikovskii, A.Y. Analysis of the spatial uniformity of the combustion of a gaseous mixture initiated by a nanosecond discharge Combust. Flame 2004, 139, 177–187. [Google Scholar]
  4. Cupitt, L.T.; Takacs, G.A.; Glass, G.P. Reaction of hydrogen atoms and O2(a 1g). Int. J. Chem. Kinet. 1982, 14, 487–497. [Google Scholar]
  5. Light, G.C. The effect of vibrational excitation on the reaction of O(3P) with H2 and the distribution of vibrational energy in the product OH. J. Chem. Phys. 1978, 68, 2831–2843. [Google Scholar] [CrossRef]
  6. Mao, X.; Chen, Q.; Guo, C. Methane pyrolysis with N2/Ar/He diluents in a repetitively-pulsed nanosecond discharge: Kinetics development for plasma assisted combustion and fuel reforming. Energy Convers. Manag. 2019, 200, 112018. [Google Scholar] [CrossRef]
  7. Zhong, H.; Mao, X.; Rousso, A.C.; Patrick, C.L.; Yan, C.; Xu, W.; Chen, Q.; Wysocki, G.; Ju, Y. Numerical modelling of ignition enhancement of CH4/O2/He mixtures using a hybrid repetitive nanosecond and DC discharge. Proc. Combust. Inst. 2019, 37, 5545–5552. [Google Scholar]
  8. Mione, M.A.; Engeln, R.; Vandalon, V.; Kessels, W.M.; Roozeboom, F. Infrared and optical emission spectroscopy study of atmospheric pressure plasma-enhanced spatial ALD of Al2O3. Appl. Phys. Lett. 2019, 115, 083101. [Google Scholar] [CrossRef]
  9. Mione, M.A.; Mameli, A.; Vandalon, V.; Kessels, W.M.M.; Roozeboom, F. Atmospheric-Pressure Plasma-Enhanced Spatial ALD of SiO 2 Studied by Gas-Phase Infrared and Optical Emission Spectroscopy. Appl. Phys. Lett. 2021, 115, 083101. [Google Scholar] [CrossRef]
  10. Liu, P.; He, L.; Zhao, B. Discharge and Optical Emission Spectrum Characteristics of a Coaxial Dielectric Barrier Discharge Plasma-Assisted Combustion Actuator. J. Spectrosc. 2020, 2020, 6034848. [Google Scholar] [CrossRef]
  11. Lin, Q.; Jiang, Y.; Liu, C.; Chen, L. Controllable NO emission and high flame performance of ammonia combustion assisted by non-equilibrium plasma. J. Fuel 2022, 319, 123818. [Google Scholar] [CrossRef]
  12. Communication from the Commission to the European Parliament, the European Council, the Council, the European Economic and Social Committee and the Committee of the Regions The European Green Deal. Available online: https://eur-lex.europa.eu/legal-content/EN/TXT/?uri=COM%3A2019%3A640%3AFIN (accessed on 15 June 2022).
  13. Rachdi, L.; Sushkov, V.; Hofmann, M. Optical emission spectroscopy diagnostics for plasma parameters investigation in a Duo-Plasmaline surface-wave sustained discharge. Spectrochim. Acta Part B At. Spectrosc. 2022, 19, 106432. [Google Scholar] [CrossRef]
  14. Zhang, S.; Zeng, X.; Bai, H.; Zhang, C.; Shao, T. Optical emission spectroscopy measurement of plasma parameters in a nanosecond pulsed spark discharge for CO2/CH4 dry reforming. Spectrochim. Acta Part A Mol. Biomol. Spectrosc. 2022, 267, 120590. [Google Scholar] [CrossRef] [PubMed]
  15. Rezaei, F.; Gorbanev, Y.; Chys, M.; Nikiforov, A.; Van Hulle, S.W.; Cos, P.; Bogaerts, A.; De Geyter, N. Investigation of plasma-induced chemistry in organic solutions for enhanced electrospun PLA nanofibers. Plasma Processes Polym. 2018, 15, 1700226. [Google Scholar] [CrossRef]
  16. Zhu, J.; Kusano, Y.; Li, Z. Optical diagnostics of a gliding arc discharge at atmospheric pressure. In Atmospheric Pressure Plasmas: Processes, Technology and Applications; Nova Science Publishers: New York, NY, USA, 2016. [Google Scholar]
  17. Matveev, I. Plasma Assisted Combustion Gasification and Pollution Control: Volume 1. Methods of Plasma Generation for Pac; Outskirts: Denver, CO, USA, 2013; 540p, ISBN 9781432786885. [Google Scholar]
  18. Smirnov, V.V.; Stelmakh, O.M.; Fabelinsky, V.I.; Kozlov, D.N.; Starik, A.M.; Titova, N.S. On the influence of electronically excited oxygen molecules on combustion of hydrogen–oxygen mixture. J. Phys. D Appl. Phys. 2008, 41, 192001. [Google Scholar] [CrossRef]
  19. Starik, A.M.; Lukhovitskii, B.I.; Naumov, V.V.; Titova, N.S. On combustion intensification mechanisms in the case of electrical-discharge-excited oxygen molecules. Tech. Phys. 2007, 52, 1281–1290. [Google Scholar] [CrossRef]
  20. Dieke, G.H.; Babcock, H.D. The Structure of the Atmospheric Absorption Bands of Oxygen. Proc. Nat. Acad. Sci. USA 1927, 13, 670. [Google Scholar] [CrossRef] [Green Version]
  21. Hornbeck, G.A.; Hopfield, H.S. Spectroscopic Investigation of the Carbon Monoxide-Oxygen Reaction. J. Chem. Phys. 1949, 17, 982. [Google Scholar] [CrossRef]
  22. Yankovsky, V.; Vorobeva, E.; Manuilova, R. New techniques for retrieving the [O(3P)], [O3] and [CO2] altitude profiles from dayglow oxygen emissions: Uncertainty analysis by the Monte Carlo method. Adv. Space Res. 2019, 64, 1948–1967. [Google Scholar] [CrossRef]
  23. Starik, A.M.; Titova, N.S. Kinetics of detonation initiation in the supersonic flow of the H2 + O2 (air) mixture in O2 molecule excitation by resonance laser radiation. Kinet. Catal. 2003, 44, 28–39. [Google Scholar] [CrossRef]
  24. Talebizadeh, P.; Babaie, M.; Brown, R.; Rahimzadeh, H.; Ristovski, Z.; Arai, M. The role of non-thermal plasma technique in NOx treatment: A review Renew. Sustain. Energy Rev. 2014, 40, 886–901. [Google Scholar] [CrossRef] [Green Version]
  25. Atkinson, R.; Baulch, D.L.; Cox, R.A.; Hampson, J.R.F.; Kerr, J.A.; Troe, J. Evaluated kinetic and photochemical data for atmospheric chemistry. J. Phys. Chem. Ref. 1989, 18, S881–S1097. [Google Scholar]
  26. Kossyi, I.A.; Kostinsky, A.Y.; Matveyev, A.A.; Silakov, V.P. Kinetic scheme of the non-equilibrium discharge in nitrogen–oxygen mixtures. Plasma Sources Sci. Technol. 1992, 1, 207–220. [Google Scholar] [CrossRef]
  27. Sathiamoorthy, G.; Kalyana, S.; Finney, W.C.; Clark, R.J.; Locke, B.R. Chemical reaction kinetics and reactor modelling of NOx removal in a pulsed streamer corona discharge reactor. Ind. Eng. Chem. Res. 1999, 38, 1844–1855. [Google Scholar] [CrossRef]
  28. Sabu, T.; Miran, M.; Uroš, C.; Petrm, Š.; Praveen, K. Non-Thermal Plasma Technology for Polymeric Materials, 1st ed.; Elsevier: Amsterdam, The Netherlands, 2019; ISBN 978-0-12-813152-7. [Google Scholar]
  29. Fridman, A. Plasma Chemistry; Cambridge University Press: New York, NY, USA, 2008. [Google Scholar]
  30. Eliasson, B. Nonequilibrium volume plasma chemical processing. IEEE Trans. Plasma Sci. 1991, 19, 1063–1077. [Google Scholar] [CrossRef]
  31. Kim, W.; Godfrey, M.; Cappelli, M. The role of in situ reforming in plasma enhanced ultra-lean premixed methane/air flames. Combust Flame 2010, 157, 374–383. [Google Scholar] [CrossRef]
  32. Zaplotnik, R.; Primc, G.; Vesel, A. Optical Emission Spectroscopy as a Diagnostic Tool for Characterization of Atmospheric Plasma Jets. Appl. Sci. 2021, 11, 2275. [Google Scholar] [CrossRef]
  33. Dang, J.; Chung, K.; Hwang, Y.S. A simple spectroscopic method to determine the degree of dissociation in hydrogen plasmas with wide-range spectrometer. Rev. Sci. Instrum. 2016, 87, 053503. [Google Scholar] [CrossRef]
Figure 1. Emission spectrometry of air under different frequencies with the stable voltage U = 8300 V: (A) F = 60 kHz; (B) F = 180 kHz; (C) F = 220 kHz.
Catalysts 12 01540 g001
Figure 2. Emission spectrometry of nitrogen under different frequencies with the stable voltage U = 8300 V: (A) F = 60 kHz; (B) F = 180 kHz; (C) F = 220 kHz.
Catalysts 12 01540 g002
Figure 3. Emission spectrometry of carbon dioxide under different frequencies with the stable voltage U = 8300 V: (A) F = 60 kHz; (B) F = 180 kHz; (C) F = 220 kHz.
Catalysts 12 01540 g003
Figure 4. Emission spectrometry of biogas. U = 8300 V, F = 60 kHz, (1)—BG20/80, (2)—BG30/70, (3)—BG40/60.
Catalysts 12 01540 g004
Figure 5. Emission spectrometry of biogas. U = 8300 V, F = 90–150 kHz, (4), (7), (10)—BG20/80, (5), (8), (11)—BG30/70, (6), (9), (12)—BG40/60.
Catalysts 12 01540 g005
Figure 6. Emission spectrometry of biogas. U = 8300 V, F = 180–220 kHz.
Catalysts 12 01540 g006
Figure 7. Graphs of intensity deviation according to frequency: (A) for CH+ radical; (B) for OH radical.
Catalysts 12 01540 g007
Figure 8. Graphs of intensity deviation according to frequency for O2 radical.
Catalysts 12 01540 g008
Figure 9. Graph of the energy consumption in accordance to the plasma frequency and BG concentration.
Catalysts 12 01540 g009
Figure 10. Graphs of the calorific value in dependence of the frequency and mixture variant.
Catalysts 12 01540 g010
Figure 11. Scheme of the experimental setup.
Catalysts 12 01540 g011
Figure 12. Schematic view of the gliding arc plasma-assisted burner. (a) an overall view of the burner. (b,c) cross-sections of the burner.
Catalysts 12 01540 g012
Table 1. Flows of the gas components of different biogas variants.
Type of Biogas CH4 L/minCO2 L/min N2 L/min
BG20/800.692.766.57
BG25/750.742.227.05
BG30/700.781.827.43
BG35/650.811.57.71
BG40/600.841.268.0
Table 2. Calorific value of proceeded gases of different biogas variants.
FrequencyBG20/80, MJ/m3BG25/75, MJ/m3BG30/70, MJ/m3BG35/65, MJ/m3BG40/60, MJ/m3
No plasma2.242.492.712.912.99
606.686.1110.588.4212.82
907.718.0811.0210.912.98
1208.448.2913.8011.5613.45
1507.729.1512.2411.4612.51
1806.567.5011.7113.3710.59
2007.767.8812.5512.1612.05
2207.518.069.4513.2513.46
Table 3. Frequencies at which experiments were carried out.
Voltage of Plasma SourceFrequency of Plasma Source
8.33 kV60 kHz
90 kHz
120 kHz
150 kHz
180 kHz
200 kHz
220 kHz
Publisher’s Note: MDPI stays neutral with regard to jurisdictional claims in published maps and institutional affiliations.

