Abstract
Metalloporphyrins have been studied as biomimetic catalysts for more than 120 years and have accumulated a large amount of data, which provides a solid foundation for deep learning to discover chemical trends and structure–function relationships. In this study, key components of deep learning of metalloporphyrins, including databases, molecular representations, and model architectures, were systematically investigated. A protocol to construct canonical SMILES for metalloporphyrins was proposed, which was then used to represent the two-dimensional structures of over 10,000 metalloporphyrins in an existing computational database. Subsequently, several state-of-the-art chemical deep learning models, including graph neural network-based models and natural language processing-based models, were employed to predict the energy gaps of metalloporphyrins. Two models showed satisfactory predictive performance (R2 0.94) with canonical SMILES as the only source of structural information. In addition, an unsupervised visualization algorithm was used to interpret the molecular features learned by the deep learning models.
1. Introduction
Metalloporphyrins are coordination compounds of metal ions and porphyrins or porphyrin derivatives, derived from the core structure of cytochrome P450 enzymes [1,2,3,4]. As a recognized class of biomimetic catalysts, metalloporphyrins can catalyze different types of chemical reactions, mainly reduction and oxidation [1,5,6,7,8]. Since the earliest study in 1979 [9,10], experimental chemists have synthesized a variety of metalloporphyrins and explored their functions in catalysis [11,12,13,14,15]. Meanwhile, computational chemists have explored the mechanisms of metalloporphyrin-catalyzed reactions using quantum mechanical atomistic simulation methods, mostly density functional theory (DFT) [16,17,18]. While continued research using either computational or experimental approaches is necessary, it is also essential to develop a method that can learn the chemical trends and structure–function relationships of metalloporphyrins from the available data.
Recently, deep learning has emerged as an effective technique for molecular property prediction, such as reactivity, synthesizability, solubility, binding affinity, and biological activity [19,20,21,22,23,24,25]. Unlike quantum mechanical methods based on solving Schrödinger’s equation, deep learning extracts features from a large amount of data generalizes them and then maps the learned features to labels carried by the data. While quantum mechanical methods are good at explaining organic chemistry mechanisms on a case-by-case basis, deep learning models extract the overall trends and relationships from large amounts of data. In addition, the overall computational cost of deep learning is lower than that of DFT computations. While it may take hours to days to train deep learning models, once the models are trained properly, they can make predictions in seconds.
Currently, there are two main challenges in using deep learning models to study metalloporphyrins. First, although recognized public small molecule databases such as PubChem [26], ChemBL [27,28], DSSTox [29], MoleculeNet [30], and ZINC [31] have adopted the canonical SMILES as one of the representations of molecular 2D structure, there is no such general molecular representation for metalloporphyrins, which makes it more difficult to index, merge, read, and process the data. Furthermore, although one of our previous works showed the possibility of using deep learning models to predict the properties of molecular complexes, such as solute–solvent pairs [32], metalloporphyrins have significantly larger structures than “drug-like” small molecule complexes and contain additional inorganic components (i.e., center metal ions), which may increase the difficulty for deep learning.
In this study, we first proposed a protocol for assembling the canonical SMILES for a recognized computational database of metalloporphyrins. Afterward, state-of-the-art deep learning models, including three graphical neural network models (hereinafter referred to as molecular graph-based model) and two attention-based natural language processing models (hereinafter referred to as string-based model), were trained on this database and tested for energy gap (E gap) prediction. In addition, the molecular features extracted by these models were visualized using a big data-based visualization algorithm for better interpretability. The overall workflow of this study is shown in Figure 1.
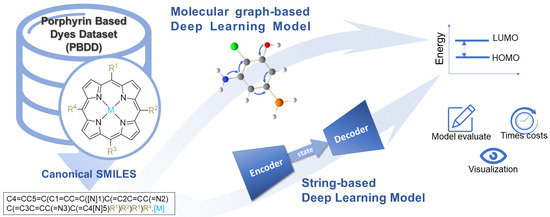
Figure 1.
The workflow of this study.
2. Results
2.1. Establishing Canonical SMILES for Porphyrins and Metalloporphyrins
To the best of our knowledge, no canonical SMILES rules have been established for porphyrins or metalloporphyrins prior to our study, probably due to their more complex structures compared to “drug-like” small molecules. Most small molecule databases, such as ZINC, PubChem, and ChemBL, provide canonical SMILES representing the two-dimensional (2D) structure of molecules, while the Porphyrin Based Dyes Database (PBDD) provides the molecular formula (e.g., ZnC56H46N4O11), the short name of side groups (e.g., TMP), and the metal center (e.g., ZnP). The establishment of canonical SMILES for porphyrins and metalloporphyrins not only facilitates the use of existing databases (e.g., PBDD) for deep learning studies, but also encourages the entire research community to store existing and newly designed porphyrin and metalloporphyrin structures in a big-data format.
Therefore, we implemented a framework that allows the assembly of canonical SMILES for molecules in PBDD (Figure 2). First, translations from short names of side groups as well as metal centers to their corresponding SMILES fragments were established (e.g., FPh to C1(=C(C(=C(C(=C1[F])[F])[F])[F])[F]), ZnP to [Zn]) (Figure 2, top). Next, these SMILES fragments were concatenated to the SMILES of the porphyrin backbone in a predetermined order to produce the final canonical SMILES for the entire molecule (Figure 2, lower). We designed the concatenation following the pattern of a limited number of examples of metalloporphyrins in PubChem, including porphyrin (CID 66868), Porphyrin Fe(Iii) (CID 73154880), meso-Tetra(4-carboxyphenyl)porphine (CID 86278368), and Mn-TCPP (CID 23789711). All of the established canonical SMILES built for PBDD have been validated by RDKit [33,34].
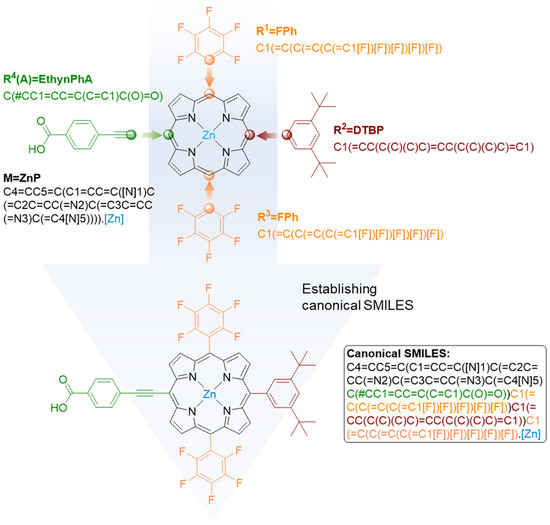
Figure 2.
Procedures of assembling a canonical SMILES for a porphyrin/metalloporphyrin molecule.
2.2. Comparing the Performance of Deep Learning Models
Using the SMILES representation of the molecular structure as a feature and E gap as a target, PBDD was used to train several deep learning models. The data were randomly split into a training set and a test set with a split ratio of 8:2. These models were trained with the default hyperparameters of their original architectures. For each model, the distance between the predicted and computed E gap was visualized and presented as a scatter plot of the linear regression fit (e.g., Figure 3 left column). In addition, the overlap of the distributions of the predicted and the computed E gap was also shown as a histogram (e.g., Figure 3 right column). To ensure the reproducibility of the models, the training and test of the models were repeated 10 times, and the averaged results are provided in the Supplementary Materials Figure S4.
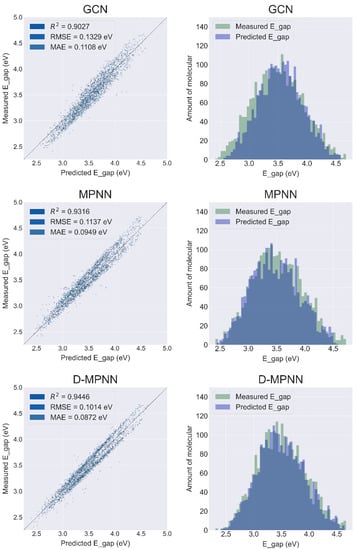
Figure 3.
Results of the prediction sets for the models GCN, MPNN, and D-MPNN in the direction of the graph structure. The left column shows the regression plot of the model predictions, and the right column shows the distribution plot of the model prediction data and the data stored in the database. The larger area of the overlap in the data distribution plot on the right indicates better performance of the model prediction.
2.3. Molecular Graph-Based Model Results
As shown in Figure 3 (left column), as the molecular graph-based models evolve from the earliest GCN to MPNN to D-MPNN, the prediction and generalization ability of these models for metalloporphyrins improves. From the GCN to MPNN, the R2 of the test set improved from 0.9027 to 0.9316, while the RMSE and MAE decreased from 0.1329 eV and 0.1108 eV to 0.1137 eV and 0.0949 eV, respectively. The results of D-MPNN show a similar improvement compared to MPNN, with R2 improving from 0.9316 to 0.9446 and RMSE and MAE decreasing from 0.1137 eV and 0.0949 eV to 0.1014 eV and 0.0872 eV, respectively. Meanwhile, the overlap between the measured data and the data predicted from GCN, MPNN, and D-MPNN showed a steady increase, reflecting their improved predictive power from a different perspective (Figure 3, right column).
Compared to GCN, MPNN has a modularized message passing stage, which makes the model construction more suitable for molecular graph algorithms [19] and possibly leads to its better performance than GCN in metalloporphyrin E gap prediction. On the other hand, GCN and MPNN pass atom-centric information, whereas D-MPNN passes information across the molecule centering on directed bonds [22], which may lead to prediction with higher R2, less error, and more significant overlap with true results.
2.4. String-Based Model Results
Based on the regression plots (Figure 4, left column), the performance of the BERT model (R2 = 0.9371, RMSE = 0.1117 eV, MAE = 0.0951 eV) is significantly better than the Transformer (R2 = 0.7111, RMSE = 0.2344 eV, MAE = 0.1812 eV). At the same time, the overlap of measured data and the BERT predicted data is significantly larger than that of the Transformer.
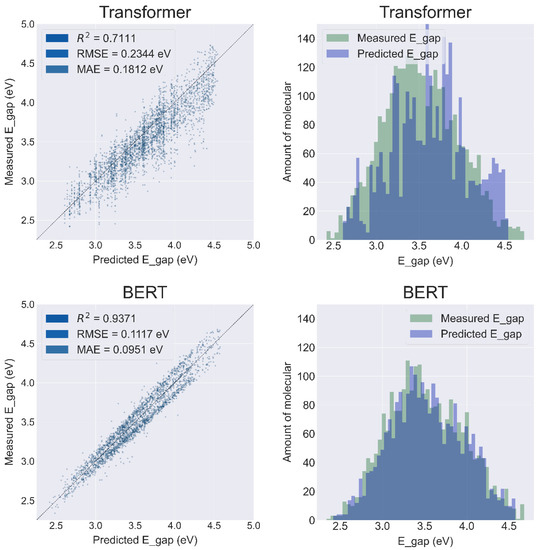
Figure 4.
Results of the prediction sets for the Transformer and BERT Models.
2.5. Transfer Learning Results
Transfer learning strategies were used to further improve the performance of the String-based models. The transfer learning of the Transformer is implemented directly on the ChemBERTa [35] architecture. The model was first pretrained using the data collected from PubChem and ZINC15 and then fine-tuned with the PBDD database.
The best pre-trained model named ‘PubChem10M_SMILES_BPE_396_250′ was selected from the ChemBERTa (detailed comparison results are provided in the Supplementary Materials Figure S5). Compared to the model without transfer learning, the R2 of Transformer was improved to 0.8010, and the RMSE and MAE were reduced to 0.1965 eV and 0.1524 eV, respectively (Figure 5).
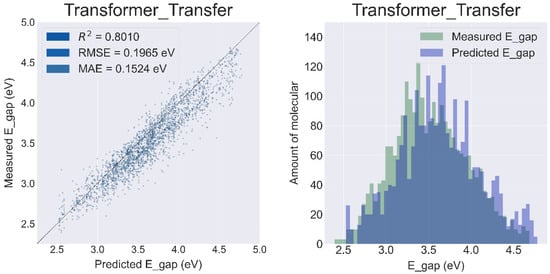
Figure 5.
Results of the prediction sets for the Transformer Model with transfer learning.
The data used for pretraining BERT consisted of 1,000,000 molecules randomly selected from the ZINC15 database. Fine-tuning the pretrained BERT model with PBDD improved the R2 to 0.9372 and decreased the RMSE and MAE to 0.1114 eV and 0.0919 eV, respectively (Figure 6). It is worth noting that the pretraining phase of BERT is unsupervised learning, i.e., the pretraining only extracts structural information from the input SMILES. Although the molecules of ZINC15 are small, metal-free organic molecules with structures significantly different from metalloporphyrins, the BERT model still learns features from these small molecules, which significantly improves its predictive power.
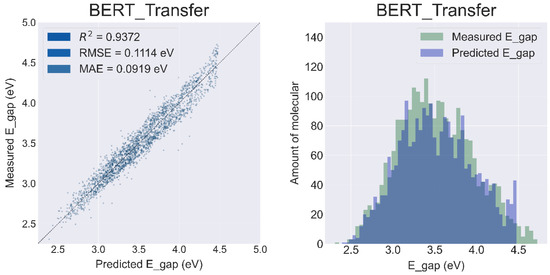
Figure 6.
Results of the prediction sets for the BERT Model with transfer learning.
2.6. Comparing the Computational Costs of Different Models
To understand the computational cost of the deep learning models in this study, the runtime of each model, including data reading, feature extraction, and model training, was recorded on an NVIDIA GeForce RTX 3060 Lite Hash Rate platform, as well as the epochs to achieve the above performance. Table 1 shows that the models without transfer learning need fewer than 1000 s to complete the training, while fine-tuning training on pretrained models consumes even less time (210 s).

Table 1.
Training time and epochs for each model.
2.7. Mapping the Chemical Space of the Porphyrin Database under the D-MPNN Model and BERT Model
We used the TMAP algorithm and the Faerun visualization library [36] to visualize the chemical space of PBDD with the features extracted by the D-MPNN model (Figure 7a,b) and BERT model (Figure 7c,d), the final output of the high-dimensional feature vectors from the feature extraction layers of each model. The color bars in the upper panels (a and c) depend on the value of the energy gap (red indicates a higher value and blue indicates a lower value), while in the lower panels (b and d) the color shows the classifications of center metal. Figure 7 shows that the clustering and trends observed on the TMAP of the features extracted by D-MPNN are more correlated with the energy gap, while the features extracted by BERT are more correlated with the structure of molecules. This difference coincides with the structural difference between the two models—the feature extraction layers of BERT are trained mainly in the unsupervised training stage, which relies only on the structure of molecules, while D-MPNN follows traditional supervised learning, where the weights of feature extraction layers are adjusted according to the target.
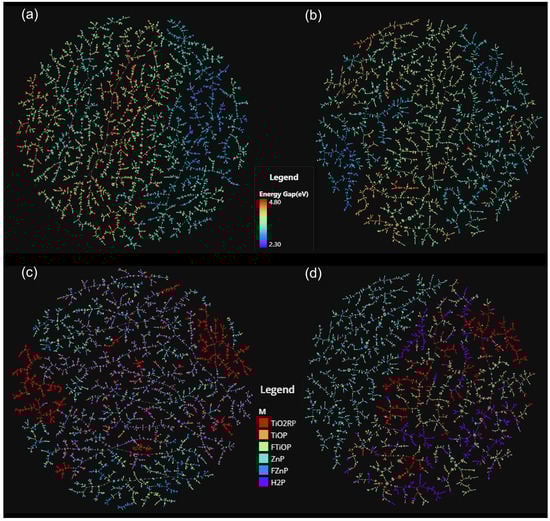
Figure 7.
The visualization of chemical space based on the molecular features extracted by the D-MPNN model and BERT model using the TMAP algorithm: (a) D-MPNN model, color according to the value of energy gap; (b) BERT model, color according to the value of energy gap; (c) D-MPNN model, color according to the center metal; (d) BERT model, color according to the center metal.
3. Discussion
Databases, molecular representations, and model architectures are the three key components of deep learning for chemistry. The protocol presented in this study for assembling canonical SMILES of metalloporphyrins fills the gap between traditional metalloporphyrin databases such as PBDD (which do not have SMILES) and the state-of-the-art chemical deep learning models (which typically use SMILES as input). We encourage scientists in the metalloporphyrin research community to use canonical SMILES to represent the 2D structures of metalloporphyrins, not only for deep learning, but also for easier data indexing, searching, and curation.
Excitingly, both D-MPNN and BERT achieved satisfactory performance in predicting the E gap of metalloporphyrin with canonical SMILES as the only source of structural information. Although it is difficult to assess the results by comparing them with the performance of these models on small molecules, the distribution of predicted results and computed results (Figure 3 and Figure 4) shows clear overlaps.
Furthermore, we must emphasize that all the deep learning models tested in this study do not require any feature engineering (i.e., manually selection of molecular features to be provided to the models). Moreover, these models read structural information directly from the SMILES without the need to compute molecular descriptors or fingerprints. This is in contrast to an earlier study by Li, et al. which used traditional physicochemical descriptors as molecular representations and traditional machine learning algorithms (such as Lasso, kernel ridge regression (KRR), support vector machine (SVM), and feedforward artificial neural networks (ANNs)) as models [37]. The performance of our approach in energy gap prediction is comparable to the work of Li, et al. Considering the computational and labor resources saved from feature engineering and descriptor computation, our method is more efficient and economical.
Furthermore, both molecular graph-based and string-based deep learning models have been successfully used to predict forward reaction outcomes, retrosynthesis planning, and reaction condition recommendations [19,38,39,40,41,42,43,44,45], using SMILES-based graphical representations or reaction SMILES as input to the model instead of molecular descriptors and fingerprints. Therefore, one of our future works will combine the high-throughput DFT computation and the deep learning models to study the relationships of metalloporphyrin structures and selectivity in the catalysis of reduction and oxidation reactions.
4. Materials and Methods
4.1. Database
4.1.1. Porphyrin-Based Dyes Database
To the best of our knowledge, the Porphyrin-based Dyes Database (PBDD) [46,47] at the Computational Materials Repository (https://cmrdb.fysik.dtu.dk/dssc/ (accessed on 12 November 2022)) is the largest computational database of porphyrins/metalloporphyrins published online. PBDD contains 12,096 porphyrin structures—10,080 of them are metalloporphyrins and the rest are porphyrins without any central metal. In addition, 4032 molecules have hydrogen substituted by fluorine at the β-position. Each porphyrin molecule contains three aromatic side groups and an anchoring group that serves as an anchor point for the semiconductor carrier.
The properties of porphyrins in PBDD include frontline orbital energy levels (HOMO and LUMO), an optical gap, and an energy gap. Among these properties, the energy gap is often chosen to represent the ability of metalloporphyrins to act as reduction catalysts [48]. The energy gap data in the database shows a normal distribution without any significant data imbalance or outliers (Figure 8).
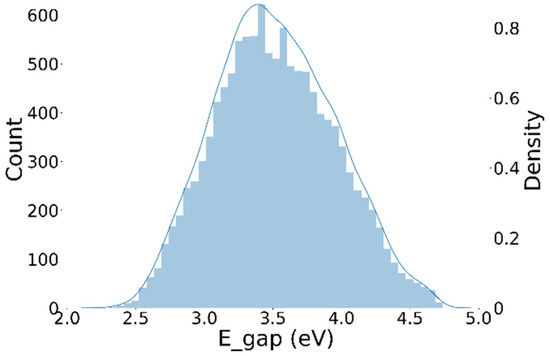
Figure 8.
Distribution of energy gap data from the Porphyrin Based Dyes Database.
4.1.2. Databases for Transfer Learning
Two databases from ZINC15 and PubChem were selected as pretraining databases for transfer learning. The goal of transfer learning is to familiarize the model with the basics of chemical structure, such as atoms, bonds, and function groups. ZINC15 is a publicly accessible database containing more than 230 million purchasable compounds in 3D formats for virtual screening [31] (https://zinc15.docking.org/ (accessed on 16 November 2022)). In this study, a randomly selected subset of 1 million molecules from ZINC15 was used as a dataset for pretraining. PubChem [26] is the world’s largest free repository of chemical information, which records the structural information, activity data, and other relevant information for 112 million compounds. We selected a subset of 10 million molecules of PubChem compounds as another pretraining dataset.
4.2. Structural Representation
We use the simplified molecular-input line-entry system (SMILES) [49] to describe the structure of a molecule. For example, a porphyrin molecule without any substituents or central metal is shown as ‘C1=CC2=CC3=CC=C(N3)C=C4C=CC(=N4)C=C5C=CC(=N5)C=C1N2′.
4.3. Model Names and Architecture
The models used in this study are from the two most commonly used chemical deep learning classes, namely graph neural networks based on graph structure and attention-based natural language processing models. Depending on the form of molecular representation data desired by the model, it will be referred to as molecular graph-based model and string-based model. A brief description of each model is given below, and detailed information can be retrieved in the Supplementary Materials.
4.3.1. Graph Convolutional Neural Network (GCN)
A graph neural network propagates information about nodes and edges in a non-Euclidean graph, and then compares the results of multiple propagations with existing results to update parameters in the model for training purposes. A graph structure model that contains convolutional layer(s) is called a graph convolutional neural network (GCN). In this study, we used the GCN model architecture [50] and corresponding featurizer [51] implemented by DeepChem [52].
4.3.2. Message Passing Neural Network (MPNN)
MPNN is obtained by modularizing the convolution operation in the graph convolutional neural network into two parts—a message passing stage and a state update stage. In this study, we implemented an MPNN model following the tutorial of Keras [53] (https://keras.io/ (accessed on 12 November 2022)). Meanwhile, RDKit was used (https://www.rdkit.org/ (accessed on 12 November 2022)) to extract the molecular features including the symbol (element), the number of valence electrons, the number of hydrogen bonds, orbital hybridization, bond type, and conjugation.
4.3.3. Directed Message Passing Neural Network (D-MPNN)
D-MPNN is a further update of MPNN. D-MPNN uses messages associated with directed edges (bonds) instead of using messages associated with vertices (atoms). In contrast to atom-based message passing methods such as MPNN, bond-based message passing methods such as D-MPNN allow fixed message passing directions, thus avoiding unnecessary loops in the message passing trajectory [54]. We used the model architecture developed by Yang et al. [22], which reads both the atomic and chemical bonding information of the molecules as well as the molecular descriptors.
4.3.4. Transformer
Transformer [55] is a relatively new class of NLP models based entirely on attention mechanisms [56], which show a powerful ability in modeling sequential data [57]. The underlying structure of Transformer models consists of a multi-layer encoder-decoder architecture like the seq2seq model, where a multi-headed attention mechanism is used in each encoder and decoder. A previous study used the Transformer model to make predictions about molecular properties [35]. We used the Transformer architecture provided by Simple Transformers [58] (https://simpletransformers.ai/ (accessed on 16 November 2022)). When transfer learning is performed, Transformer's pre-trained model is called via hug-gingface [59].
4.3.5. Bidirectional Encoder Representation from Transformers (BERT)
The BERT model is a pre-trained language representation model based on the transformer model [60]. A new masked language model (MLM) was employed so that deep bidirectional language representations can be created. In this study, we use the BERT model architecture rxnfp built by Schwaller et al. [43], which has been adapted for chemical reaction yield prediction [38,41] and molecular property prediction [32].
4.3.6. Tree MAP (TMAP)
TMAP (http://tmap.gdb.tools (accessed on 16 November 2022)) is an algorithm that visualizes high-dimensionality data as a two-dimensional tree, preserving global and local features with a sufficient level of detail for human inspection and interpretation [36]. In this work, the TMAP algorithm was applied to visualize the molecular features of metalloporphyrins extracted by the deep learning models.
5. Conclusions
In this study, deep learning of metalloporphyrins was investigated from three important perspectives: database, molecular representations, and model. A protocol for assembling canonical SMILES was developed to make the open-source metalloporphyrin database PBDD available for the training of state-of-the-art deep learning models. Both the D-MPNN and the BERT models trained on PBDD had R2 above 0.93 in terms of energy gap prediction. It is worth mentioning that we only used data from one database because other data on metalloporphyrins are scattered in various papers and difficult to collect in a short time. Therefore, in the future, we plan to use deep learning-assisted automatic literature data extraction methods [61,62] to curate another metalloporphyrin database containing data with more diverse structures. In parallel, we are preparing to publish another study to develop a high-throughput DFT method to compute the energy gaps of metalloporphyrins that have appeared in literature in recent years, with a wider variety of central metals, since only Ti and Zn are available in PBDD. On the other hand, we are also extending the SMILES representation of metalloporphyrin molecules to metalloporphyrin-catalyzed reactions in order to use deep learning models for reaction prediction to study the catalysis of metalloporphyrin. Furthermore, we are studying metalloporphyrins using Graphormer, an advanced Transformer model that combines the advantages of graph representation with the power of Transformer and shows better performance than message passing-based GNNs [53,57,58].
Supplementary Materials
The following are available online at https://www.mdpi.com/article/10.3390/catal12111485/s1, Figure S1: Display of side groups and their code names. Figure S2: Anchor group and its code display. Figure S3 The code name of the key M and its corresponding structure. Figure S4: Comparison of evaluation results of all model test sets. Figure S5: Comparison of results of ChemBERTa pre-trained models.
Author Contributions
Conceptualization, Y.-B.S.; Methodology, A.S.; Software, C.Z.; Validation, C.Z.; Formal analysis, A.S.; Investigation, C.Z. and Y.-F.Y.; Resources, Y.-B.S. and Y.-F.Y.; Data curation, C.Z.; Writing—original draft, C.Z.; Writing—review editing, A.S.; Supervision, A.S.; Project administration, A.S. and Y.-F.Y.; Funding acquisition, A.S., Y.-B.S. and Y.-F.Y. All authors have read and agreed to the published version of the manuscript.
Funding
This research was funded by the National Natural Science Foundation of China (Nos. 22108252 and 21978272) and the Fundamental Research Funds for the Provincial Universities of Zhejiang (RF-C2022006) for financial support.
Data Availability Statement
Data and processing scripts for this paper and the code for the model can be found at figshare with https://doi.org/10.6084/m9.figshare.21229496.v1 (accessed on 12 November 2022).
Conflicts of Interest
The authors declare no conflict of interest.
References
- Hiroto, S.; Miyake, Y.; Shinokubo, H. Synthesis and Functionalization of Porphyrins through Organometallic Methodologies. Chem. Rev. 2017, 117, 2910–3043. [Google Scholar] [CrossRef] [PubMed]
- Chen, Y.; Ma, S. Biomimetic catalysis of metal–organic frameworks. Dalton Trans. 2016, 45, 9744–9753. [Google Scholar] [CrossRef] [PubMed]
- Marchetti, L.; Levine, M. Biomimetic Catalysis. ACS Catal. 2011, 1, 1090–1118. [Google Scholar] [CrossRef]
- Zhang, W.; Lai, W.; Cao, R. Energy-Related Small Molecule Activation Reactions: Oxygen Reduction and Hydrogen and Oxygen Evolution Reactions Catalyzed by Porphyrin- and Corrole-Based Systems. Chem. Rev. 2017, 117, 3717–3797. [Google Scholar] [CrossRef] [PubMed]
- Zhang, X.; Wasson, M.C.; Shayan, M.; Berdichevsky, E.K.; Ricardo-Noordberg, J.; Singh, Z.; Papazyan, E.K.; Castro, A.J.; Marino, P.; Ajoyan, Z.; et al. A historical perspective on porphyrin-based metal–organic frameworks and their applications. Coord. Chem. Rev. 2021, 429, 213615. [Google Scholar] [CrossRef]
- Zhao, M.; Ou, S.; Wu, C.-D. Porous Metal–Organic Frameworks for Heterogeneous Biomimetic Catalysis. Acc. Chem. Res. 2014, 47, 1199–1207. [Google Scholar] [CrossRef]
- Liang, Z.; Wang, H.-Y.; Zheng, H.; Zhang, W.; Cao, R. Porphyrin-based frameworks for oxygen electrocatalysis and catalytic reduction of carbon dioxide. Chem. Soc. Rev. 2021, 50, 2540–2581. [Google Scholar] [CrossRef]
- Qin, Y.; Zhu, L.; Luo, S. Organocatalysis in Inert C–H Bond Functionalization. Chem. Rev. 2017, 117, 9433–9520. [Google Scholar] [CrossRef]
- Groves, J.T.; Haushalter, R.C.; Nakamura, M.; Nemo, T.E.; Evans, B.J. High-valent iron-porphyrin complexes related to peroxidase and cytochrome P-450. J. Am. Chem. Soc. 1981, 103, 2884–2886. [Google Scholar] [CrossRef]
- Groves, J.T.; Nemo, T.E.; Myers, R.S. Hydroxylation and epoxidation catalyzed by iron-porphine complexes. Oxygen transfer from iodosylbenzene. J. Am. Chem. Soc. 1979, 101, 1032–1033. [Google Scholar] [CrossRef]
- Tanaka, T.; Osuka, A. Conjugated porphyrin arrays: Synthesis, properties and applications for functional materials. Chem. Soc. Rev. 2015, 44, 943–969. [Google Scholar] [CrossRef]
- Suijkerbuijk, B.M.J.M.; Klein Gebbink, R.J.M. Merging Porphyrins with Organometallics: Synthesis and Applications. Angew. Chem. Int. Ed. 2008, 47, 7396–7421. [Google Scholar] [CrossRef]
- Senge, M.O.; Sergeeva, N.N.; Hale, K.J. Classic highlights in porphyrin and porphyrinoid total synthesis and biosynthesis. Chem. Soc. Rev. 2021, 50, 4730–4789. [Google Scholar] [CrossRef]
- Birel, Ö.; Nadeem, S.; Duman, H. Porphyrin-Based Dye-Sensitized Solar Cells (DSSCs): A Review. J. Fluoresc. 2017, 27, 1075–1085. [Google Scholar] [CrossRef]
- Biesaga, M.; Pyrzyńska, K.; Trojanowicz, M. Porphyrins in analytical chemistry. A review. Talanta 2000, 51, 209–224. [Google Scholar] [CrossRef]
- Shaik, S.; Cohen, S.; Wang, Y.; Chen, H.; Kumar, D.; Thiel, W. P450 Enzymes: Their Structure, Reactivity, and Selectivity—Modeled by QM/MM Calculations. Chem. Rev. 2010, 110, 949–1017. [Google Scholar] [CrossRef]
- Huang, X.; Groves, J.T. Oxygen Activation and Radical Transformations in Heme Proteins and Metalloporphyrins. Chem. Rev. 2018, 118, 2491–2553. [Google Scholar] [CrossRef]
- Blomberg, M.R.A.; Borowski, T.; Himo, F.; Liao, R.-Z.; Siegbahn, P.E.M. Quantum Chemical Studies of Mechanisms for Metalloenzymes. Chem. Rev. 2014, 114, 3601–3658. [Google Scholar] [CrossRef]
- Gilmer, J.; Schoenholz, S.S.; Riley, P.F.; Vinyals, O.; Dahl, G.E. Neural Message Passing for Quantum Chemistry. In Proceedings of the 34th International Conference on Machine Learning, Sydney, NSW, Australia, 6 August 2017; pp. 1263–1272. [Google Scholar]
- Duvenaudt, D.; Maclaurin, D.; Aguilera-Iparraguirre, J.; Gomez-Bombarelli, R.; Hirzel, T.; Aspuru-Guzik, A.; Adams, R.P. Convolutional Networks on Graphs for Learning Molecular Fingerprints. In Proceedings of the 29th Annual Conference on Neural Information Processing Systems (NIPS), Montreal, QC, Canada, 7–12 December 2015. [Google Scholar]
- Gómez-Bombarelli, R.; Wei, J.N.; Duvenaud, D.; Hernández-Lobato, J.M.; Sánchez-Lengeling, B.; Sheberla, D.; Aguilera-Iparraguirre, J.; Hirzel, T.D.; Adams, R.P.; Aspuru-Guzik, A. Automatic Chemical Design Using a Data-Driven Continuous Representation of Molecules. ACS Cent. Sci. 2018, 4, 268–276. [Google Scholar] [CrossRef]
- Yang, K.; Swanson, K.; Jin, W.; Coley, C.; Eiden, P.; Gao, H.; Guzman-Perez, A.; Hopper, T.; Kelley, B.; Mathea, M.; et al. Analyzing Learned Molecular Representations for Property Prediction. J. Chem. Inf. Model. 2019, 59, 3370–3388. [Google Scholar] [CrossRef]
- Walters, W.P.; Barzilay, R. Applications of Deep Learning in Molecule Generation and Molecular Property Prediction. Acc. Chem. Res. 2021, 54, 263–270. [Google Scholar] [CrossRef] [PubMed]
- Stokes, J.M.; Yang, K.; Swanson, K.; Jin, W.; Cubillos-Ruiz, A.; Donghia, N.M.; Macnair, C.R.; French, S.; Carfrae, L.A.; Bloom-Ackermann, Z.; et al. A Deep Learning Approach to Antibiotic Discovery. Cell 2020, 180, 688–702.e613. [Google Scholar] [CrossRef] [PubMed]
- Li, X.; Zhang, S.Q.; Xu, L.C.; Hong, X. Predicting Regioselectivity in Radical C-H Functionalization of Heterocycles through Machine Learning. Angew. Chem.-Int. Ed. 2020, 59, 13253–13259. [Google Scholar] [CrossRef] [PubMed]
- Kim, S.; Chen, J.; Cheng, T.; Gindulyte, A.; He, J.; He, S.; Li, Q.; Shoemaker, B.A.; Thiessen, P.A.; Yu, B.; et al. PubChem in 2021: New data content and improved web interfaces. Nucleic Acids Res. 2020, 49, D1388–D1395. [Google Scholar] [CrossRef] [PubMed]
- Davies, M.; Nowotka, M.; Papadatos, G.; Dedman, N.; Gaulton, A.; Atkinson, F.; Bellis, L.; Overington, J.P. ChEMBL web services: Streamlining access to drug discovery data and utilities. Nucleic Acids Res. 2015, 43, W612–W620. [Google Scholar] [CrossRef]
- Mendez, D.; Gaulton, A.; Bento, A.P.; Chambers, J.; De Veij, M.; Félix, E.; Magariños, M.P.; Mosquera, J.F.; Mutowo, P.; Nowotka, M.; et al. ChEMBL: Towards direct deposition of bioassay data. Nucleic Acids Res. 2018, 47, D930–D940. [Google Scholar] [CrossRef]
- Richard, A.M.; Williams, C.R. Distributed structure-searchable toxicity (DSSTox) public database network: A proposal. Mutat. Res. Fundam. Mol. Mech. Mutagen. 2002, 499, 27–52. [Google Scholar] [CrossRef]
- Wu, Z.Q.; Ramsundar, B.; Feinberg, E.N.; Gomes, J.; Geniesse, C.; Pappu, A.S.; Leswing, K.; Pande, V. MoleculeNet: A benchmark for molecular machine learning. Chem. Sci. 2018, 9, 513–530. [Google Scholar] [CrossRef]
- Sterling, T.; Irwin, J.J. ZINC 15—Ligand Discovery for Everyone. J. Chem. Inf. Model. 2015, 55, 2324–2337. [Google Scholar] [CrossRef]
- Yu, J.; Zhang, C.; Cheng, Y.; Yang, Y.-F.; She, Y.-B.; Liu, F.; Su, W.; Su, A. SolvBERT for solvation free energy and solubility prediction: A demonstration of an NLP model for predicting the properties of molecular complexes. ChemRxiv 2022. [Google Scholar] [CrossRef]
- Landrum, G. RDKit: Open-Source Cheminformatics. Available online: http://www.rdkit.org (accessed on 13 November 2022).
- Landrum, G.; Tosco, P.; Kelley, B.; Ric; sriniker; gedeck; Vianello, P.; NadineSchneider; Kawashima, E.; Dalke, A.; et al. Rdkit/Rdkit: 2022_03_4 (Q1 2022) Release; Zenodo: Genève, Switzerland, 2022. [Google Scholar]
- Chithrananda, S.; Grand, G.; Ramsundar, B. Chemberta: Large-scale self-supervised pretraining for molecular property prediction. arXiv 2020, arXiv:2010.09885. [Google Scholar]
- Probst, D.; Reymond, J.-L. Visualization of very large high-dimensional data sets as minimum spanning trees. J. Cheminform. 2020, 12, 12. [Google Scholar] [CrossRef]
- Li, Z.; Omidvar, N.; Chin, W.S.; Robb, E.; Morris, A.; Achenie, L.; Xin, H.L. Machine-Learning Energy Gaps of Porphyrins with Molecular Graph Representations. J. Phys. Chem. A 2018, 122, 4571–4578. [Google Scholar] [CrossRef]
- Schwaller, P.; Vaucher, A.C.; Laino, T.; Reymond, J.-L. Prediction of chemical reaction yields using deep learning. Mach. Learn. Sci. Technol. 2021, 2, 015016. [Google Scholar] [CrossRef]
- Coley, C.W.; Jin, W.G.; Rogers, L.; Jamison, T.F.; Jaakkola, T.S.; Green, W.H.; Barzilay, R.; Jensen, K.F. A graph-convolutional neural network model for the prediction of chemical reactivity. Chem. Sci. 2019, 10, 370–377. [Google Scholar] [CrossRef]
- Jin, W.; Coley, C.W.; Barzilay, R.; Jaakkola, T. Predicting Organic Reaction Outcomes with Weisfeiler-Lehman Network. arXiv 2017, arXiv:1709.04555. [Google Scholar]
- Schwaller, P.; Vaucher, A.C.; Laino, T.; Reymond, J.-L. Data augmentation strategies to improve reaction yield predictions and estimate uncertainty. ChemRxiv 2020. [Google Scholar] [CrossRef]
- Öztürk, H.; Özgür, A.; Schwaller, P.; Laino, T.; Ozkirimli, E. Exploring chemical space using natural language processing methodologies for drug discovery. Drug Discov. Today 2020, 25, 689–705. [Google Scholar] [CrossRef]
- Schwaller, P.; Probst, D.; Vaucher, A.C.; Nair, V.H.; Kreutter, D.; Laino, T.; Reymond, J.-L. Mapping the space of chemical reactions using attention-based neural networks. Nat. Mach. Intell. 2021, 3, 144–152. [Google Scholar] [CrossRef]
- Schwaller, P.; Laino, T.; Gaudin, T.; Bolgar, P.; Hunter, C.A.; Bekas, C.; Lee, A.A. Molecular Transformer: A Model for Uncertainty-Calibrated Chemical Reaction Prediction. ACS Cent. Sci. 2019, 5, 1572–1583. [Google Scholar] [CrossRef]
- Mo, Y.; Guan, Y.; Verma, P.; Guo, J.; Fortunato, M.E.; Lu, Z.; Coley, C.W.; Jensen, K.F. Evaluating and clustering retrosynthesis pathways with learned strategy. Chem. Sci. 2021, 12, 1469–1478. [Google Scholar] [CrossRef] [PubMed]
- Ornso, K.B.; Garcia-Lastra, J.M.; Thygesen, K.S. Computational screening of functionalized zinc porphyrins for dye sensitized solar cells. Phys. Chem. Chem. Phys. 2013, 15, 19478–19486. [Google Scholar] [CrossRef] [PubMed]
- Ornso, K.B.; Pedersen, C.S.; Garcia-Lastra, J.M.; Thygesen, K.S. Optimizing porphyrins for dye sensitized solar cells using large-scale ab initio calculations. Phys. Chem. Chem. Phys. 2014, 16, 16246–16254. [Google Scholar] [CrossRef] [PubMed]
- Guo, X.; Liu, L.; Xiao, Y.; Qi, Y.; Duan, C.; Zhang, F. Band gap engineering of metal-organic frameworks for solar fuel productions. Coord. Chem. Rev. 2021, 435, 213785. [Google Scholar] [CrossRef]
- Weininger, D. SMILES, a chemical language and information system. 1. Introduction to methodology and encoding rules. J. Chem. Inf. Comput. Sci. 1988, 28, 31–35. [Google Scholar] [CrossRef]
- Kipf, T.N.; Welling, M. Semi-Supervised Classification with Graph Convolutional Networks. arXiv 2016, arXiv:1609.02907. [Google Scholar]
- Kearnes, S.; McCloskey, K.; Berndl, M.; Pande, V.; Riley, P. Molecular graph convolutions: Moving beyond fingerprints. J. Comput. Aided Mol. Des. 2016, 30, 595–608. [Google Scholar] [CrossRef]
- Eastman, B.R.P. Deep Learning for the Life Sciences, 1st ed.; O’Reilly Media, Inc.: Sebastopol, CA, USA, 2019. [Google Scholar]
- Chollet, F. Keras. Available online: https://keras.io (accessed on 13 November 2022).
- Koller, D.; Friedman, N. Probabilistic Graphical Models: Principles and Techniques; MIT Press: Cambridge, MA, USA, 2009. [Google Scholar]
- Vaswani, A.; Shazeer, N.; Parmar, N.; Uszkoreit, J.; Jones, L.; Gomez, A.N.; Kaiser, L.; Polosukhin, I. Attention Is All You Need. arXiv 2017, arXiv:1706.03762. [Google Scholar]
- Bahdanau, D.; Cho, K.; Bengio, Y. Neural machine translation by jointly learning to align and translate. arXiv 2014, arXiv:1409.0473. [Google Scholar]
- Ying, C.; Cai, T.; Luo, S.; Zheng, S.; Ke, G.; He, D.; Shen, Y.; Liu, T.-Y. Do transformers really perform badly for graph representation? Adv. Neural Inf. Process. Syst. 2021, 34, 28877–28888. [Google Scholar]
- Rajapakse, T.C. Simple Transformers. Available online: https://github.com/ThilinaRajapakse/simpletransformers (accessed on 13 November 2022).
- Wolf, T.; Debut, L.; Sanh, V.; Chaumond, J.; Delangue, C.; Moi, A.; Cistac, P.; Rault, T.; Louf, R.; Funtowicz, M. Huggingface’s transformers: State-of-the-art natural language processing. In arXiv; 2019. [Google Scholar]
- Devlin, J.; Chang, M.-W.; Lee, K.; Toutanova, K. Bert: Pre-training of deep bidirectional transformers for language understanding. arXiv 2018, arXiv:1810.04805. [Google Scholar]
- Jensen, Z.; Kim, E.; Kwon, S.; Gani, T.Z.H.; Román-Leshkov, Y.; Moliner, M.; Corma, A.; Olivetti, E. A Machine Learning Approach to Zeolite Synthesis Enabled by Automatic Literature Data Extraction. ACS Cent. Sci. 2019, 5, 892–899. [Google Scholar] [CrossRef]
- Tshitoyan, V.; Dagdelen, J.; Weston, L.; Dunn, A.; Rong, Z.; Kononova, O.; Persson, K.A.; Ceder, G.; Jain, A. Unsupervised word embeddings capture latent knowledge from materials science literature. Nature 2019, 571, 95–98. [Google Scholar] [CrossRef]
Publisher’s Note: MDPI stays neutral with regard to jurisdictional claims in published maps and institutional affiliations. |
© 2022 by the authors. Licensee MDPI, Basel, Switzerland. This article is an open access article distributed under the terms and conditions of the Creative Commons Attribution (CC BY) license (https://creativecommons.org/licenses/by/4.0/).