Article

Catalytic Performance of Alumina-Supported Cobalt Carbide Catalysts for Low-Temperature Fischer–Tropsch Synthesis

1
ORLEN UniCRE, a.s., 436 70 Litvínov, Czech Republic
2
New Technologies-Research Centre, University of West Bohemia, 301 00 Plzeň, Czech Republic
*
Author to whom correspondence should be addressed.
Catalysts 2022, 12(10), 1222; https://doi.org/10.3390/catal12101222
Submission received: 27 September 2022 / Revised: 8 October 2022 / Accepted: 10 October 2022 / Published: 12 October 2022
(This article belongs to the Special Issue Recent Trends in Catalysis for Syngas Production and Conversion)

Abstract

:
The determination of the catalyst’s active phase helps improve the catalytic performance of the Fischer–Tropsch (FT) synthesis. Different phases of cobalt, including cobalt oxide, carbide, and metal, exist during the reaction. The content of each phase can affect the catalytic performance and product distribution. In this study, a series of cobalt carbide catalysts were synthesized by exposure of Co/Al2O3 catalyst to CH4 at different temperatures from 300 °C to 800 °C. The physicochemical properties of the carbide catalysts (CoCx/Al2O3) were evaluated by different characterization methods. The catalytic performances of the catalysts were investigated in an autoclave reactor to determine the role of cobalt carbides on the CO conversion and product distribution during the reaction. XRD and XPS analysis confirmed the presence of Co2C in the prepared catalysts. The higher carbidation temperature resulted in the decomposition of methane into hydrogen and carbon, and the presence of graphitic carbon was confirmed by XRD, XPS, SEM, and Raman analysis. The Co2C also decomposed to metallic cobalt and carbon, and the content of cobalt carbide decreased at higher carbidation temperatures. Higher content of Co2C resulted in a lower CO conversion and higher selectivity to light alkanes, mainly methane. The higher carbidation temperature resulted in the decomposition of Co2C to metallic cobalt with higher activity in the FT reaction. The CO conversion increased by increasing the carbidation temperature from 300 °C to 800 °C, due to the higher content of metallic cobalt. In the presence of pure hydrogen, the Co2C could be converted mainly into hexagonal, close-packed (hcp) Co with higher activity for dissociative adsorption of CO, which resulted in higher catalyst activity and selectivity to heavier hydrocarbons.

1. Introduction

Fischer–Tropsch (FT) synthesis is a well-known catalytic process for the production of sulfur and aromatic-free fuels and other value-added chemicals from syngas. Through FT synthesis, which is a catalytic polymerization reaction, syngas is converted to a wide range of products, such as paraffins, olefins, and alcohols. The catalytic performance and product distribution are directly affected by the type of catalyst and its chemical composition and structure. The elements of groups 8–10 of the periodic table with good ability for adsorption and dissociation of CO and H2 are reported as active metals for the FT reaction, whereas iron and cobalt are the most commonly used catalysts for this reaction [1,2,3,4]. Cobalt-based catalysts with higher stability, more resistance to deactivation, lower water–gas shift activity, and high hydrocarbon productivity were considered the ideal choice for synthesizing long-chain hydrocarbons at moderate temperatures and pressures [5,6].
During the FT reaction over CO-based catalysts (which typically proceeds at 220–250 °C, 20 bar, and an H2/CO ratio of two), the chain growth and propagation of hydrocarbons mainly occurred on cobalt metal sites. Cobalt oxide and cobalt carbide, which are formed by re-oxidation and carburization of the metal catalyst during the FT synthesis, are known as inactive cobalt components in FT synthesis, and they are often considered deactivation signs [2,5,7,8]. However, some other groups reported that cobalt carbides could enhance the selectivity to lower olefins [9,10,11]; they also act as an active site for a water–gas shift reaction and oxygenates production [12,13,14] or act as an intermediate reacts with hydrogen to form methylene, acting as a chain-growth monomer for the formation of long-chain hydrocarbons [15]. However, unlike the cobalt catalysts, during the FT synthesis over iron-based catalysts, the Hägg carbide (χ-Fe5C2), as the real active phase, plays the main role in catalytic performances [8,16]. The presence of cobalt carbide phases during the FT synthesis could affect the CO conversion and product selectivity [17].
However, Co2C is often known as an inactive component in FT synthesis via Co-based catalysts, but Co2C content, their different morphologies, and the form of the Co2C phase could have different effects on the catalytic performance of Co-based catalysts during the FT reaction. The Co2C(111) facet is ascribed to the nanosphere-like particles with lower activity and higher methane selectivity under mild FT reaction conditions [10,13,18]. Co2C nanoprisms with specific exposed facets of (101) and (020), as the FTO active phase, showed a higher intrinsic activity for CO hydrogenation and a lower methane selectivity [9,10,18]. The presence of Co0 resulted in a lower CO2 and methane selectivity and higher selectivity to longer-chain hydrocarbons. The Co2C was reported to be relatively stable under FT reaction conditions [5,19]. At the same time, it was reported that the cobalt carbides appear to be unstable and can be decomposed to metallic cobalt and carbon during the FT reaction, especially at higher reaction temperatures and lower H2/CO ratio [1,3,20].
In the present study, a series of CoCx/Al2O3 catalysts were synthesized by carbidation of Co/Al2O3 catalysts using methane at different temperatures from 300 °C to 800 °C. The properties of these catalysts changed according to their carbidation temperatures. Changing the carbidation temperature could result in the formation of different content and types of cobalt phases, which can alter their catalyst activity and product selectivity during the FT reaction. The physicochemical properties of the catalysts were investigated by different characterization methods, including scanning electron microscopy (SEM), X-ray diffraction (XRD), X-ray photoelectron spectroscopy (XPS), and Raman analysis. The catalytic performances of the catalysts were evaluated in an autoclave reactor to determine the role of cobalt carbides on the CO conversion and product distribution during the reaction.

2. Results and Discussion

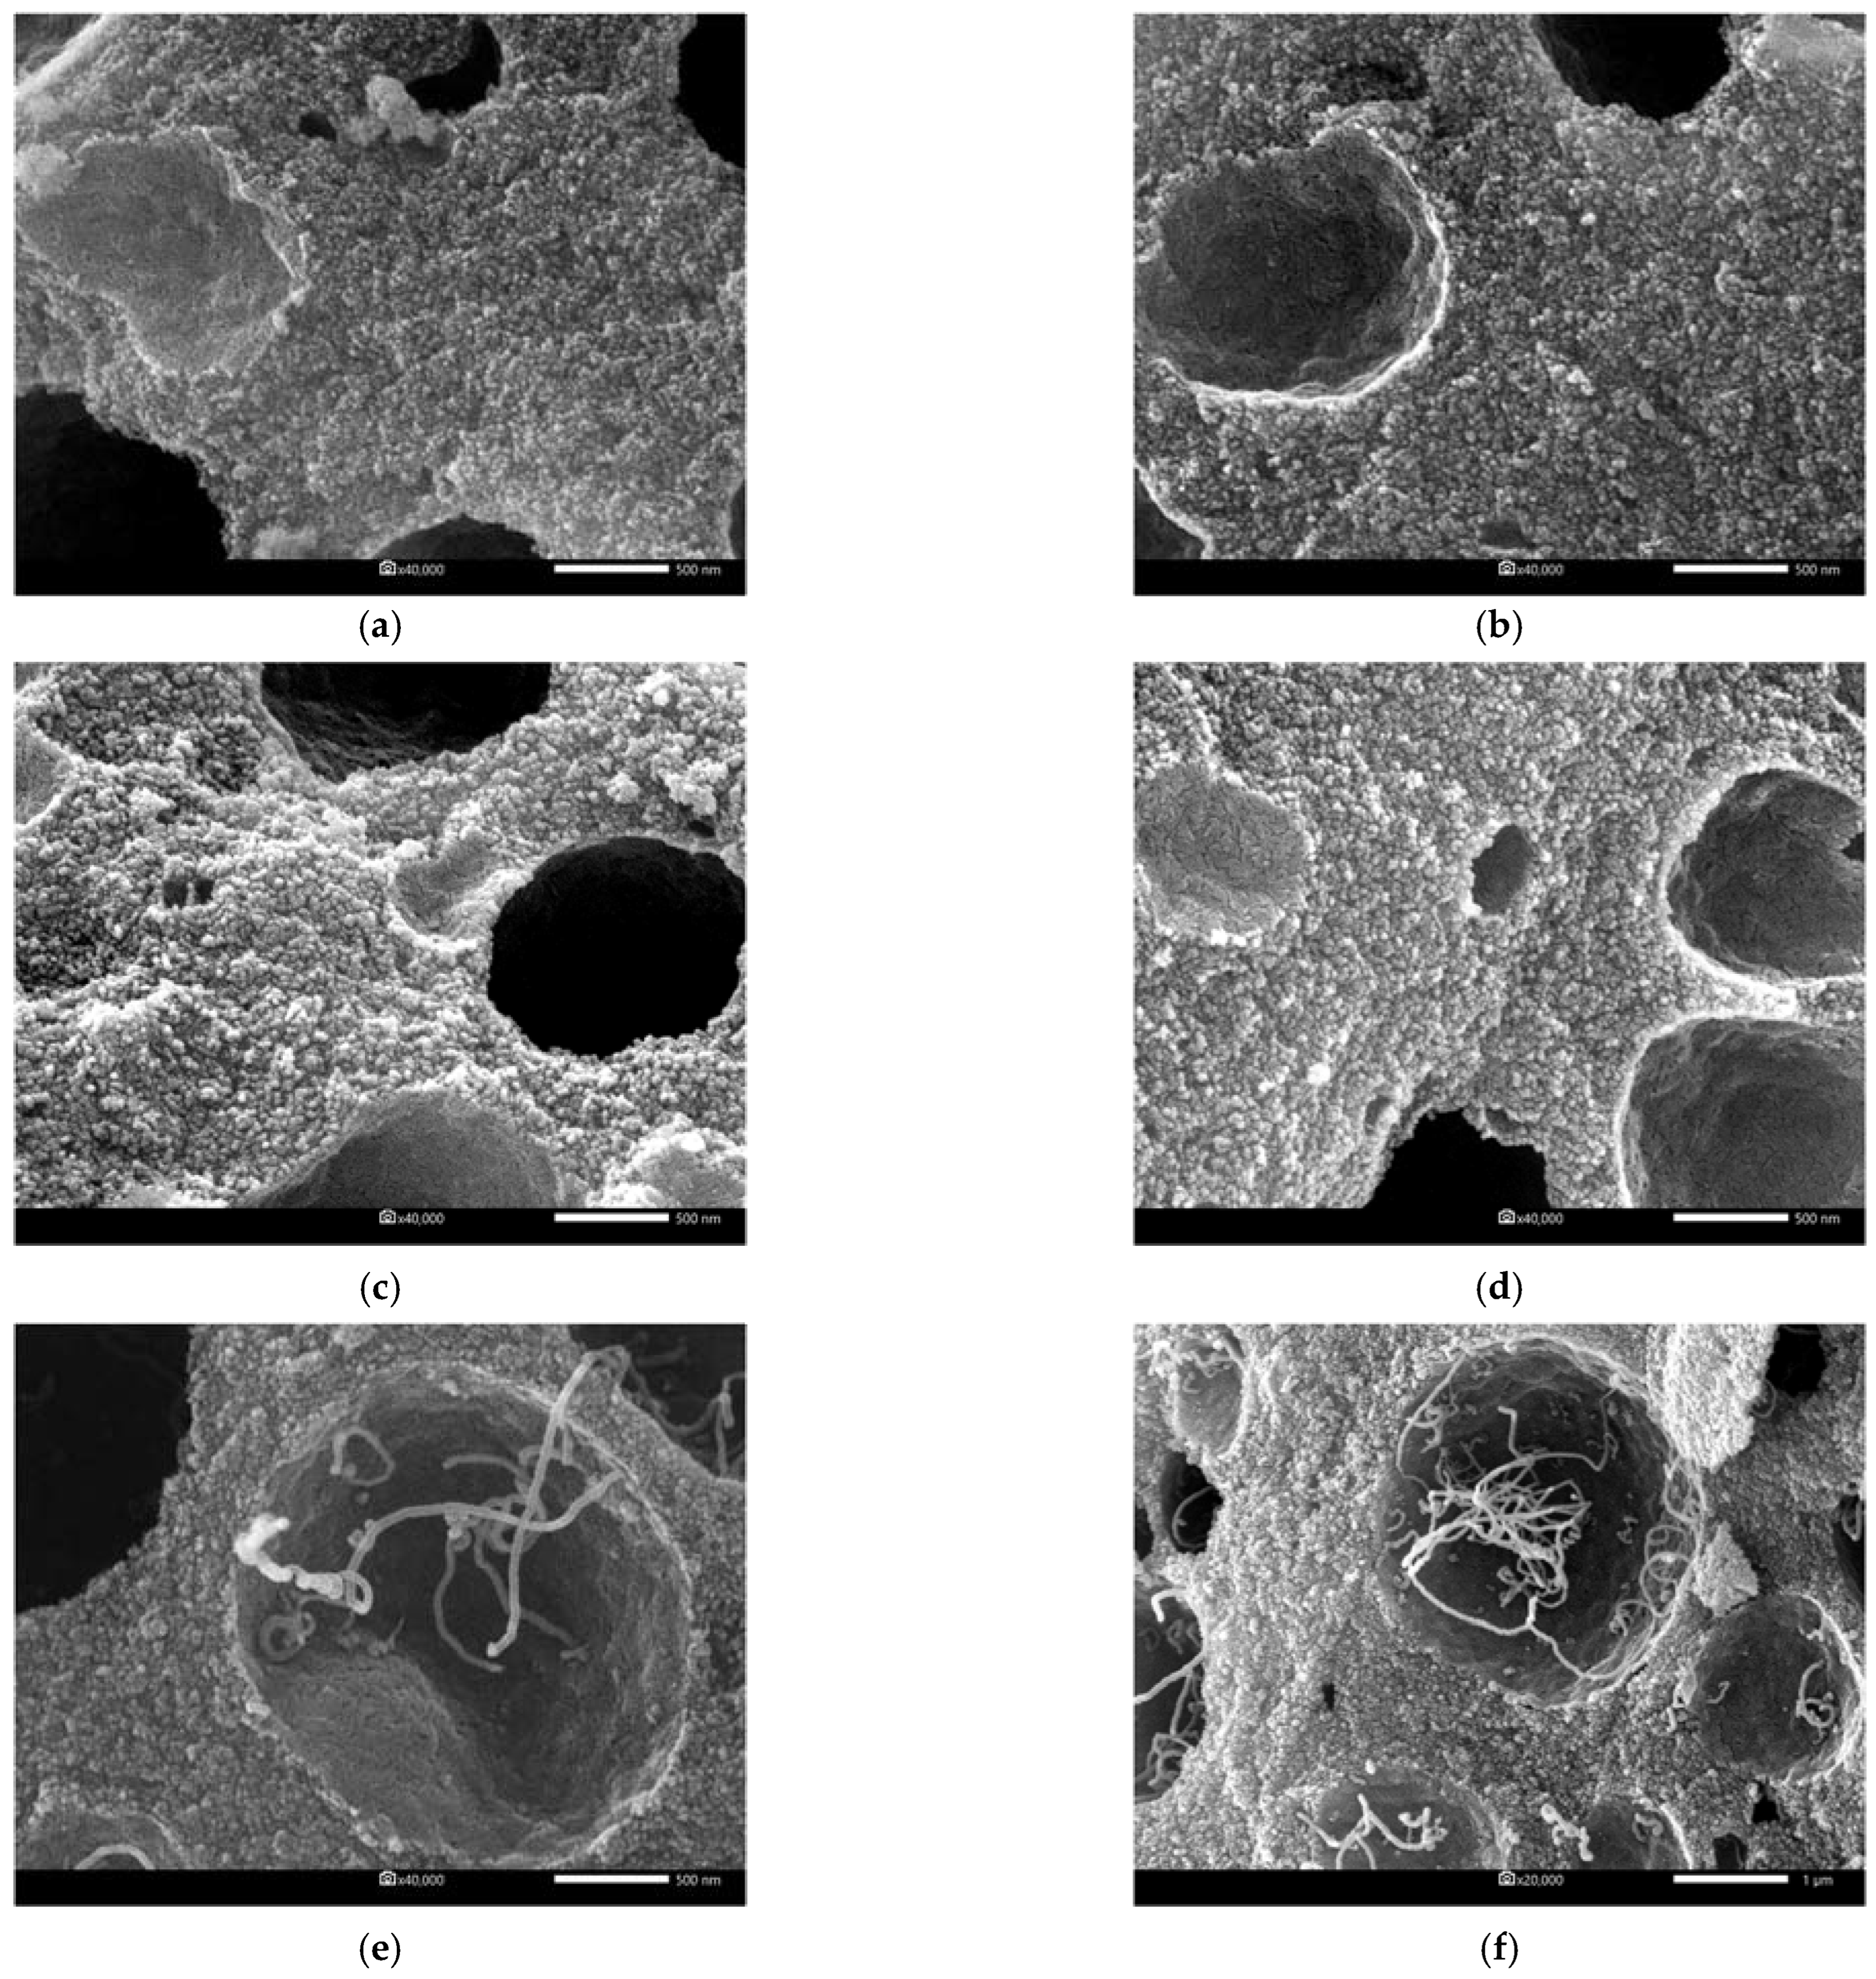
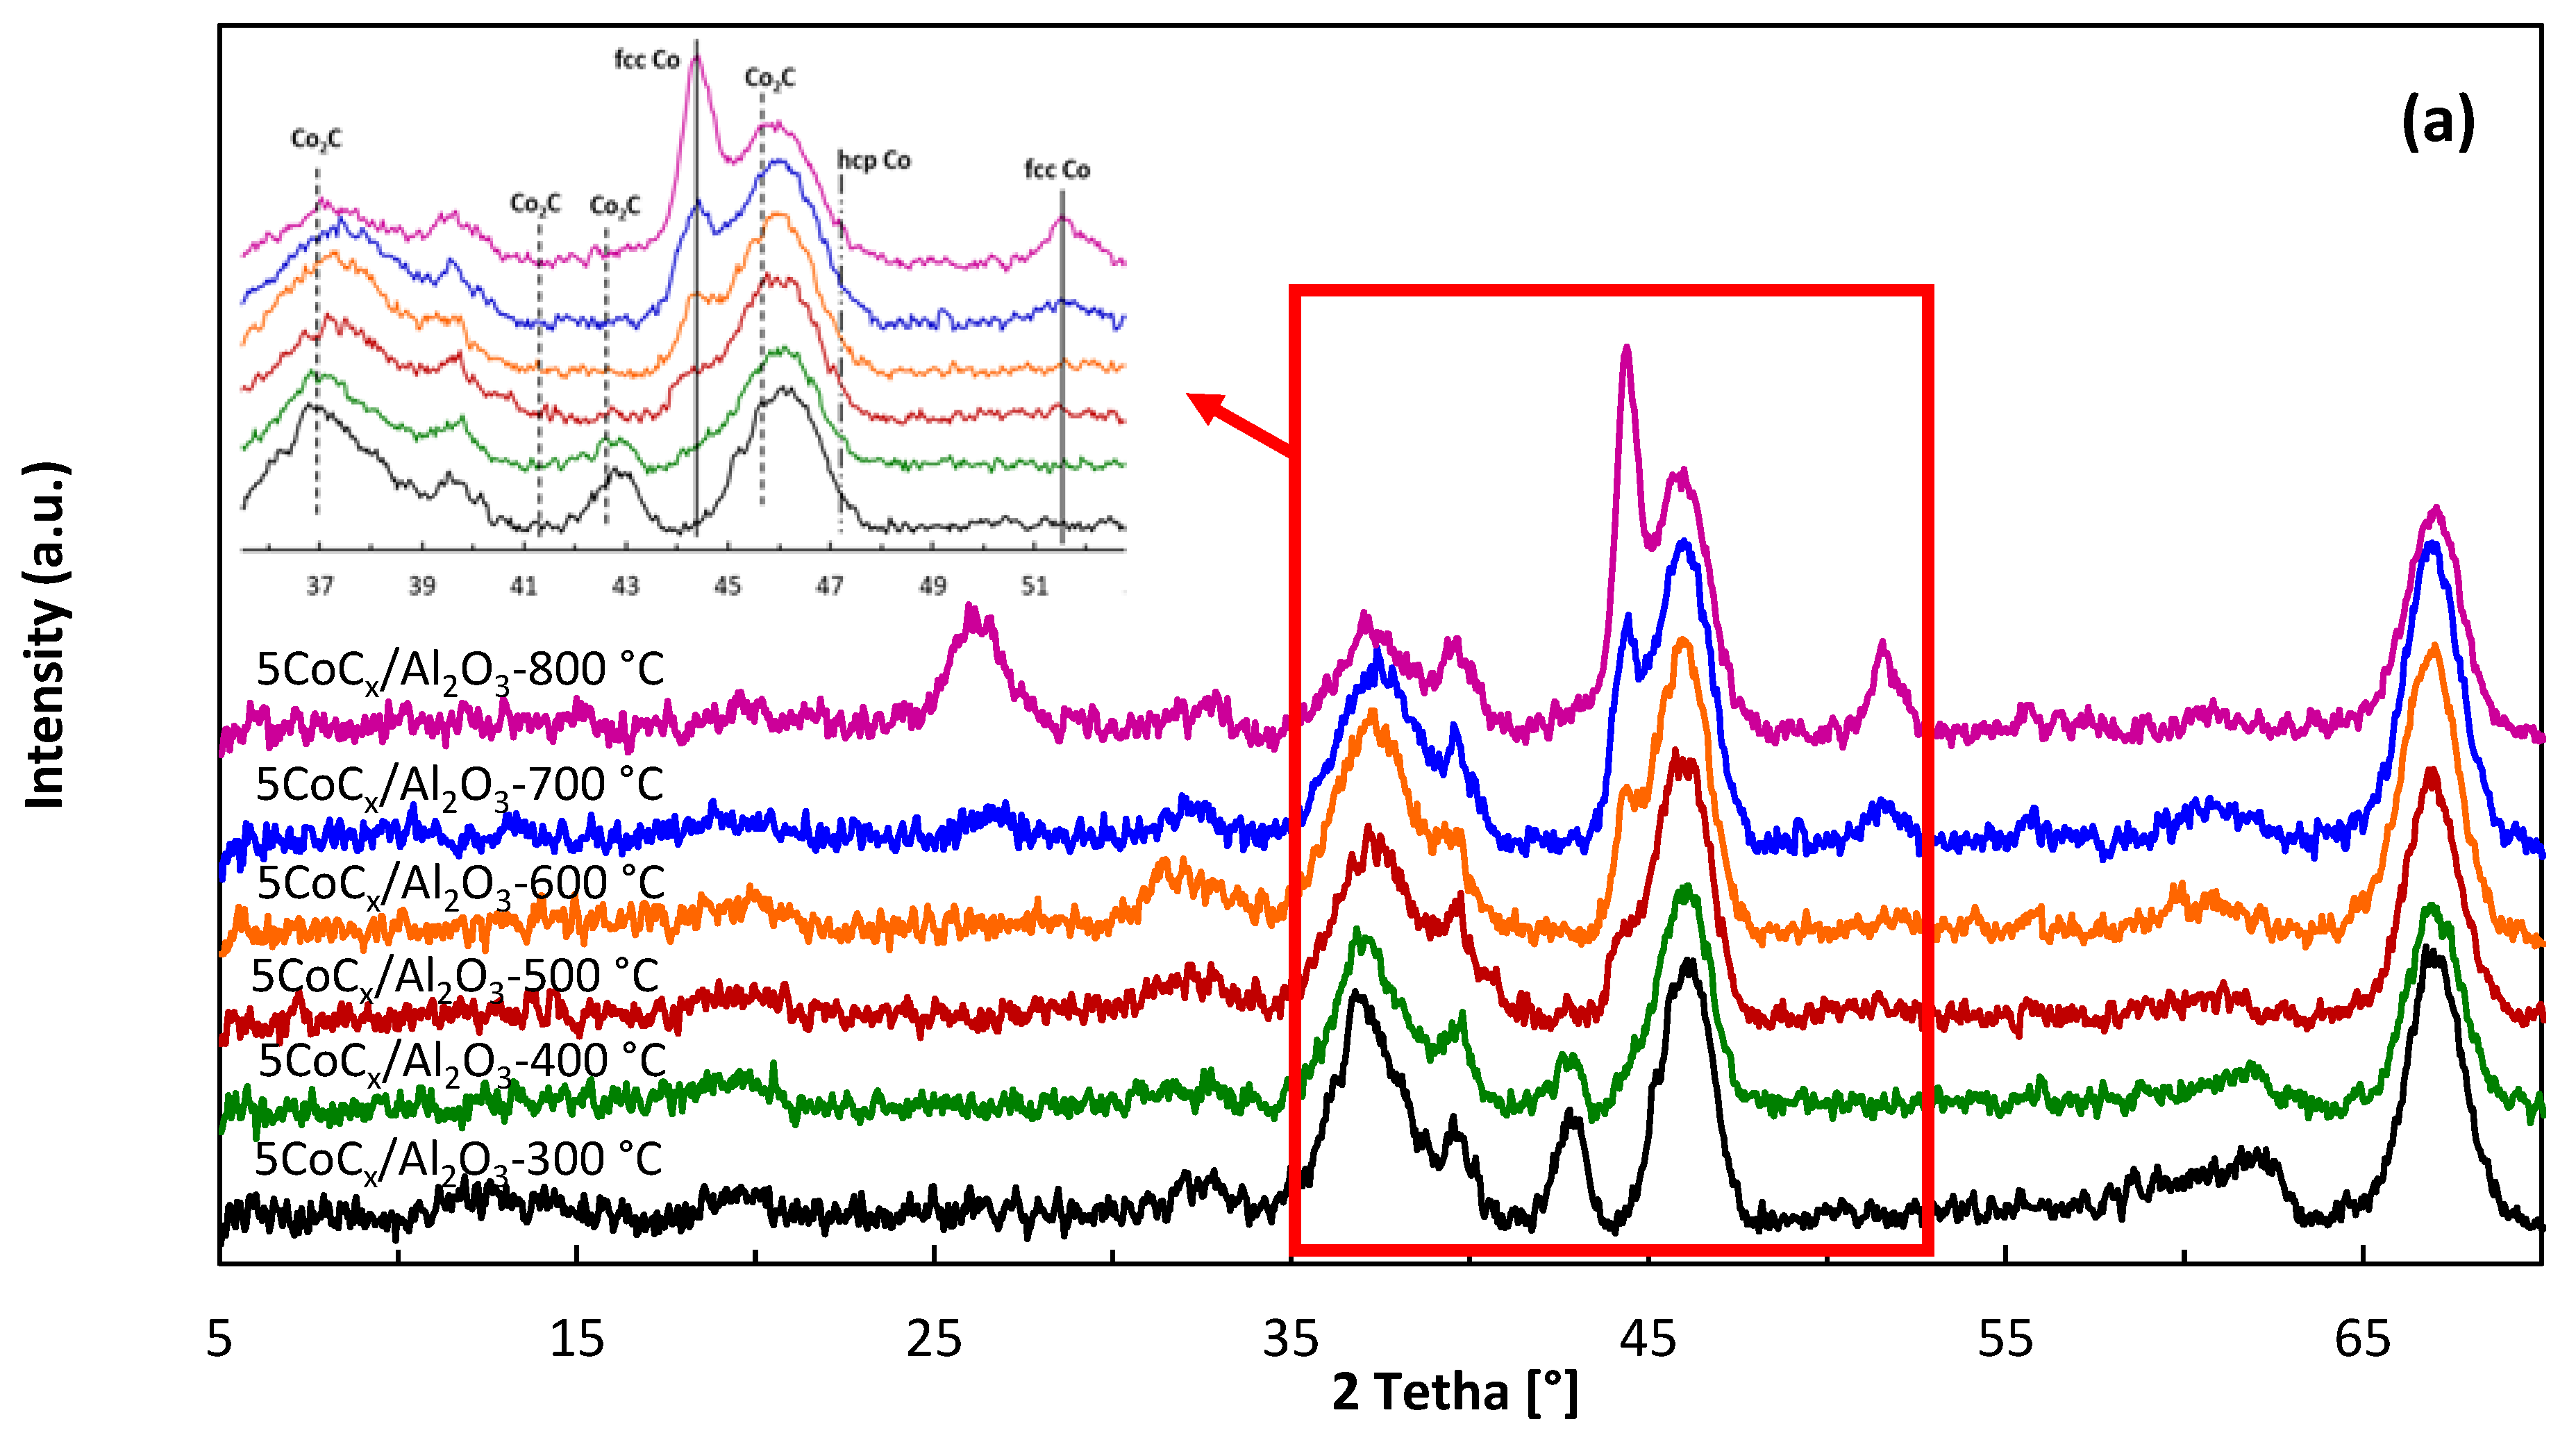
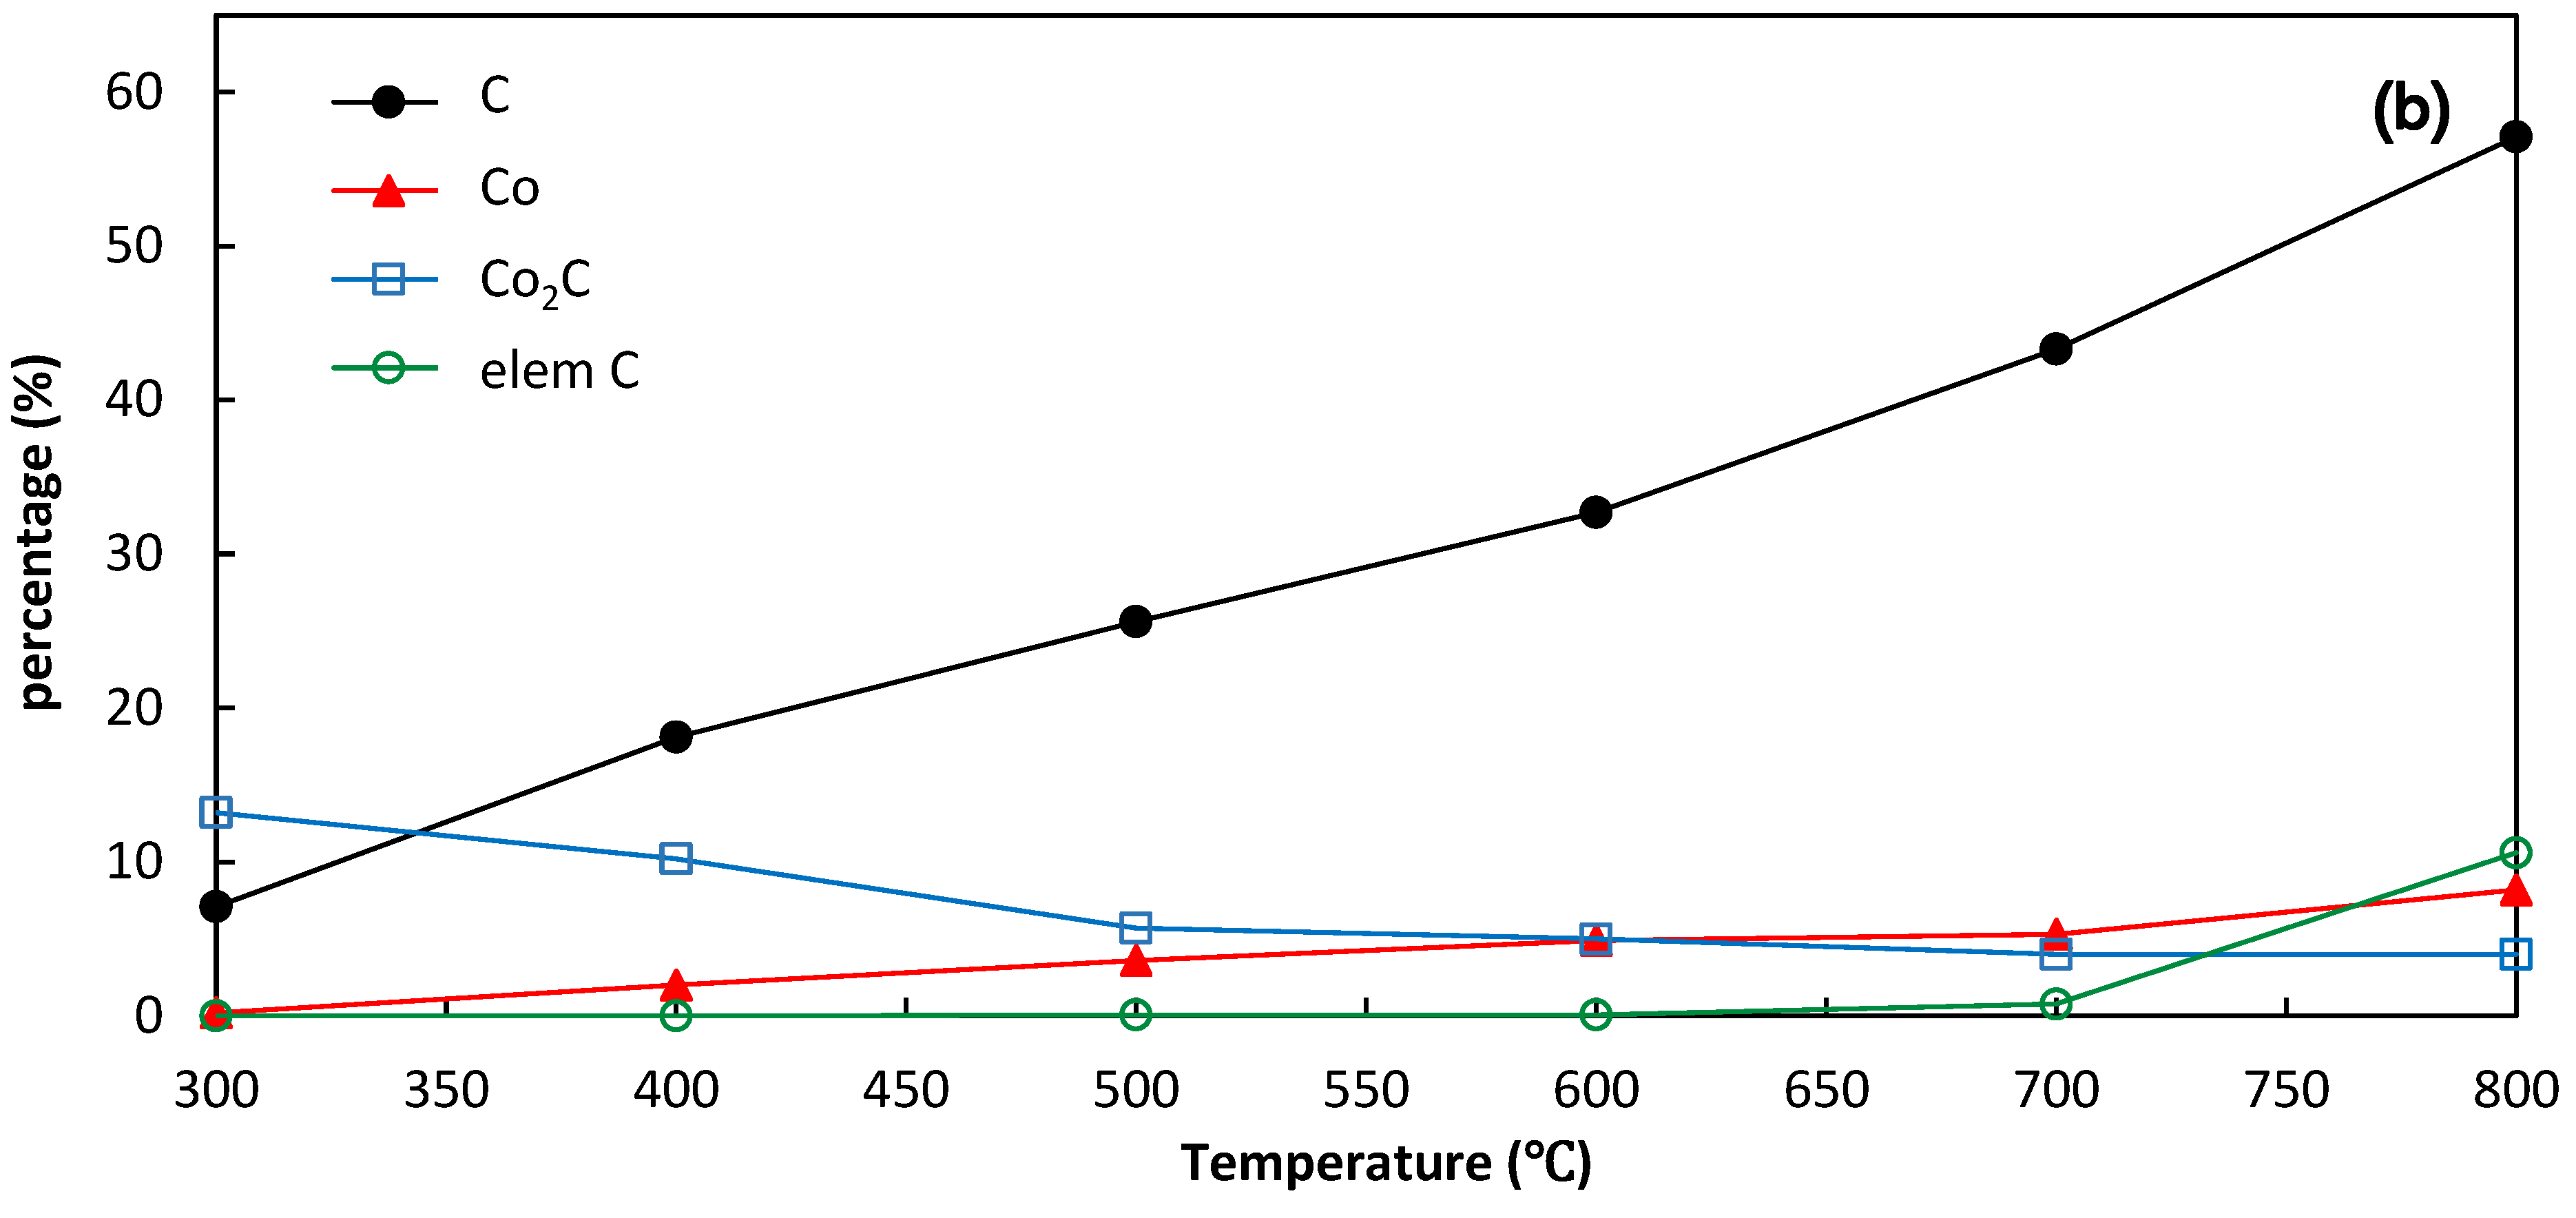
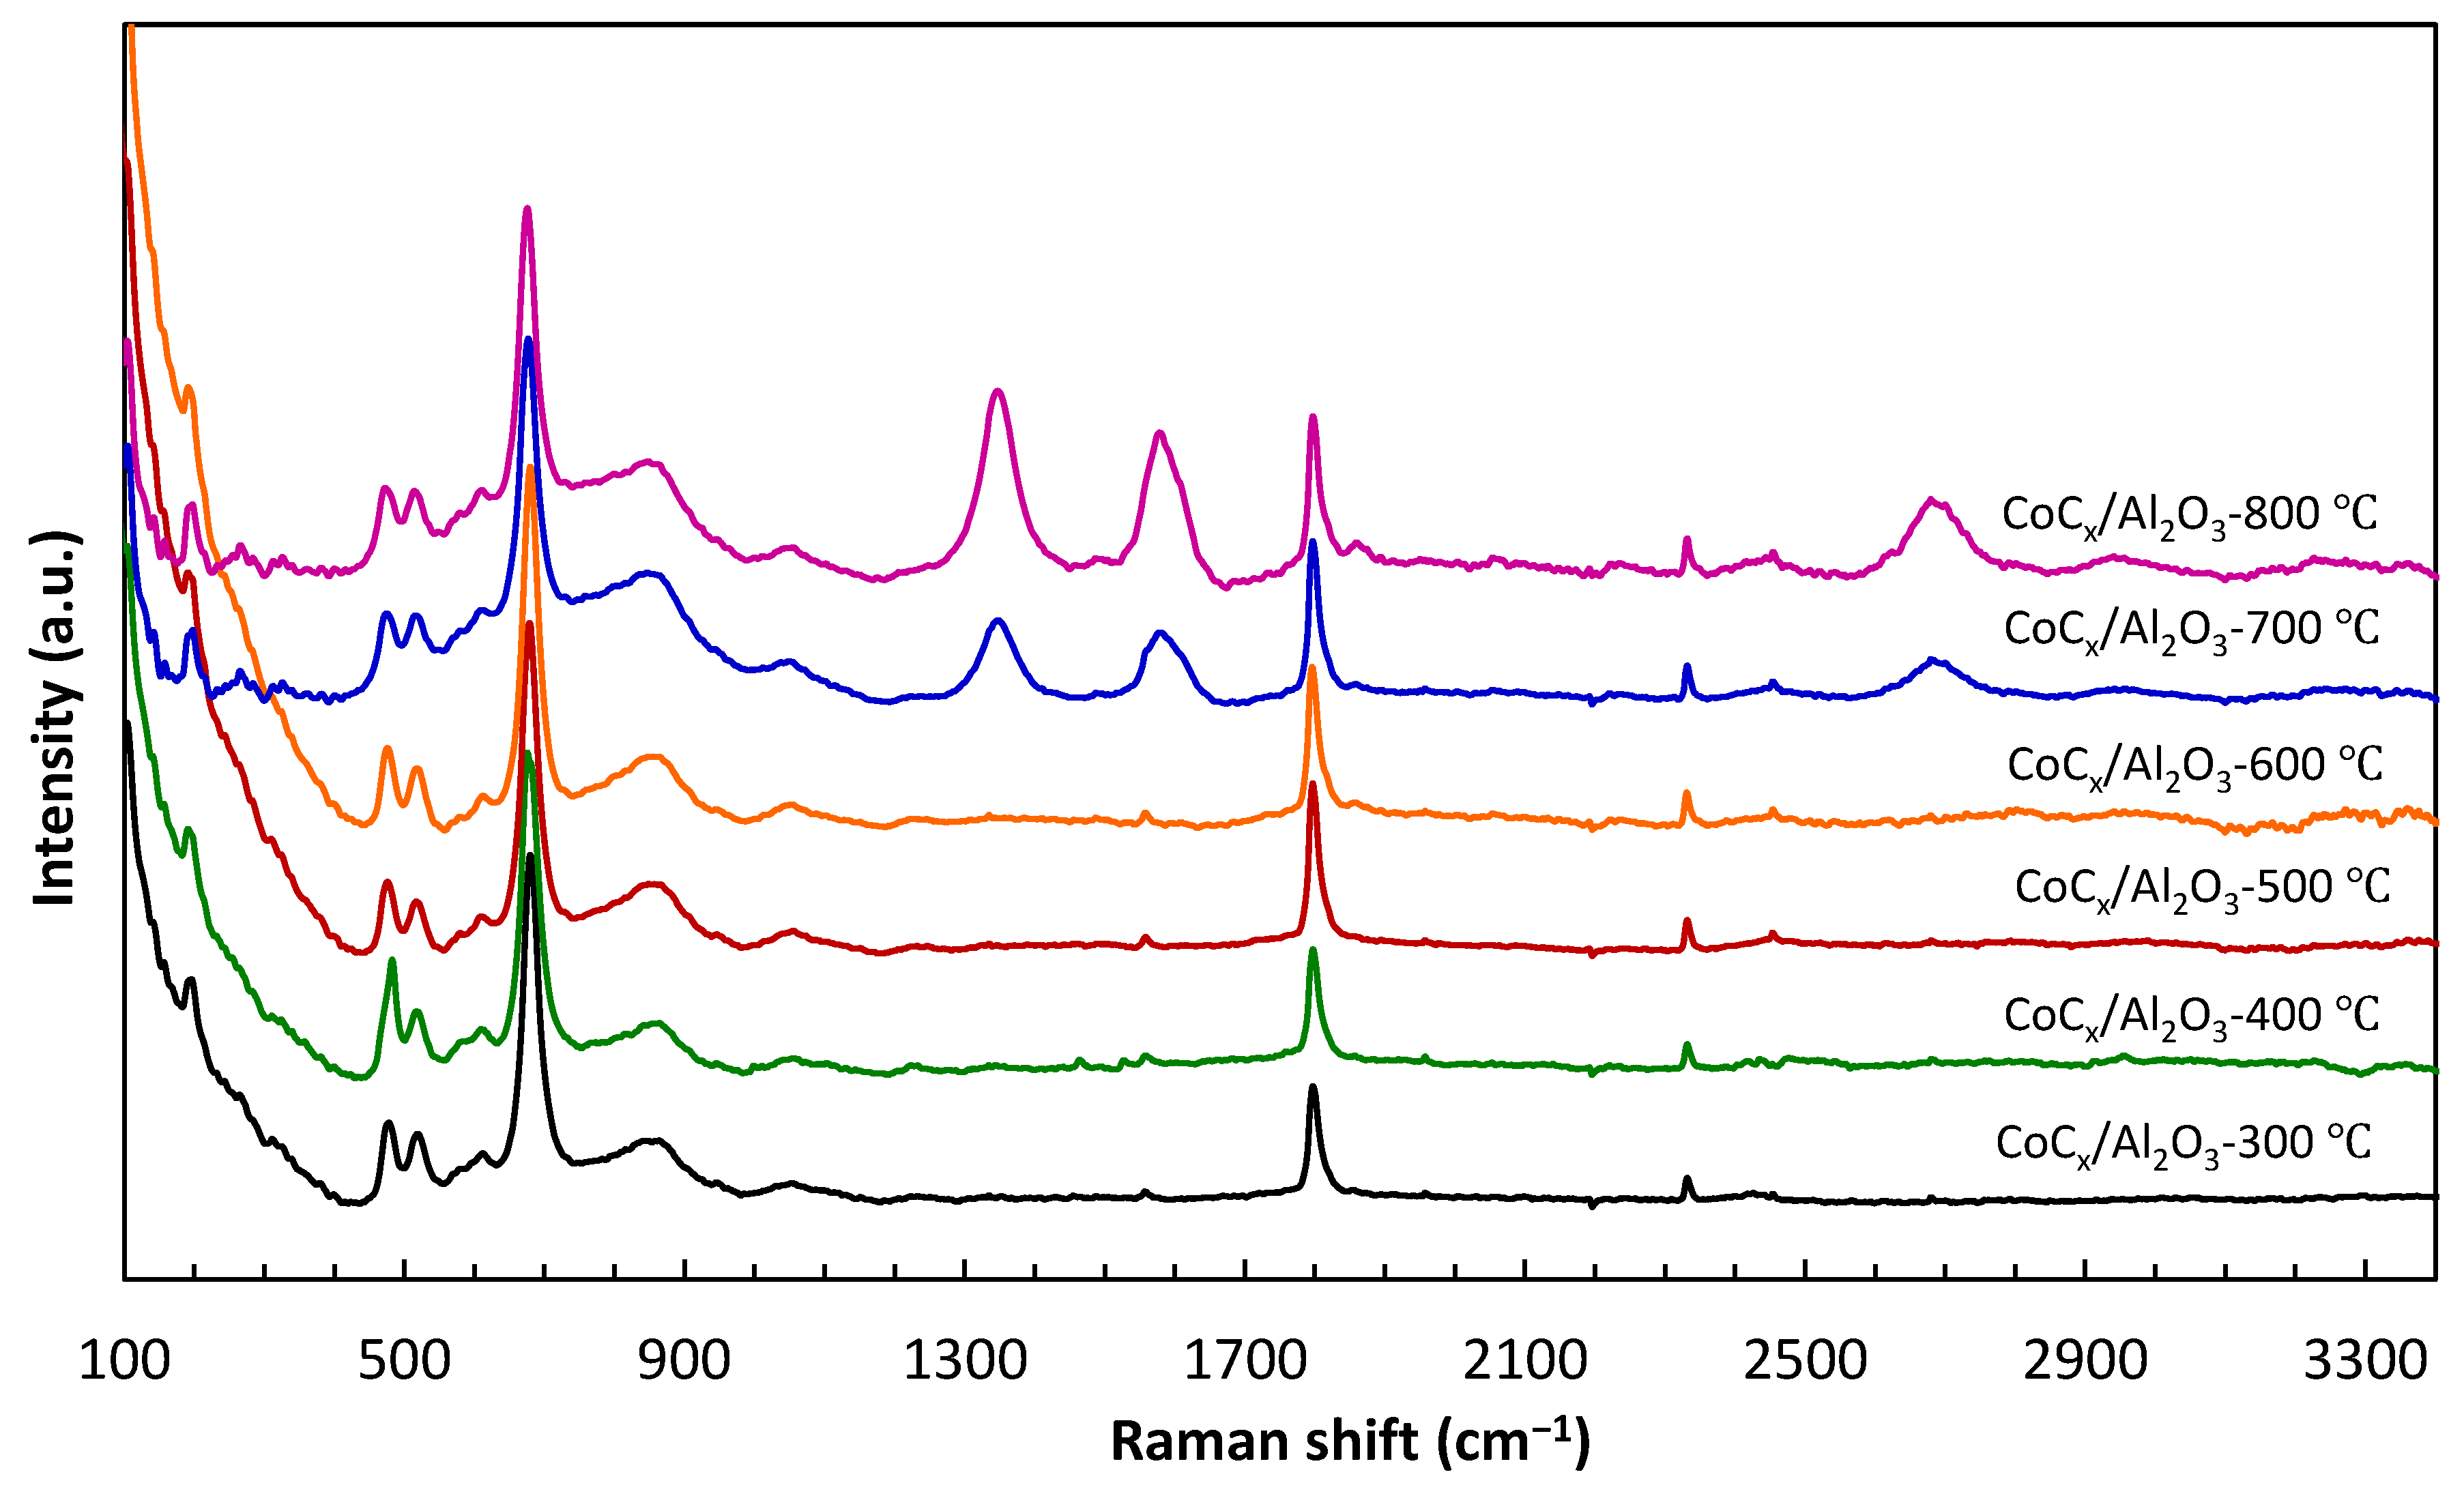
2.1. Catalyst Characterization

SEM images (Figure 1) of the prepared CoCx/Al2O3 catalysts at different temperatures confirmed the formation of carbon fibers on the surface after the decomposition of methane at higher temperatures. The formation of carbon at lower temperatures was not detected in SEM images, but the carbon fibers can be seen on the surface of catalysts at high temperatures of 700 °C and 800 °C, which was in good accordance with the obtained results in XRD and elemental analysis results.
The peaks belonging to Al2O3 at ~37.5°, 46.1°, 56°, and 67° (JCPDS 10-0425) were observed in the XRD patterns of all prepared catalysts (Figure 2a) [21,22,23,24]. The peaks at 37.0°, 41.3°, 42.5°, 45.7°, and 56.6° can be assigned to the Co2C crystalline plane (110), (002), (111), (021), and (112), (JCPDS 65-1457) [3,9,10,19,25,26] respectively. However, the peak at 56.6° was not very visible in the XRD patterns shown in Figure 1a. The cobalt carbide decomposition to graphitic carbon and metallic cobalt (Co2C     Co + C) was started at temperatures above 275 °C [5,27,28], and it could be the reason for gradually decreasing the cobalt carbide and increasing the metallic cobalt by increasing the temperature. In addition, in the presence of Co/Al2O3 catalyst, methane also can be decomposed directly to hydrogen and carbon (CH4     2H2 + C) [29,30,31,32,33]. At high temperatures (above 600 °C), due to the decomposition of methane, the concentration of graphitic carbon also significantly increased, as shown by the XRD spectra of the catalysts. Decomposition of methane on cobalt catalysts led to the formation of fcc cobalt [34]. The peak at 26.3° (graphite, JCPDS 41-1478) and 51.5° (fcc Co, JCPDS 1-1255) [35,36] were observed only in the sample prepared at a temperature above 600 °C. The peak at 44.3° was very weak for the samples prepared at low temperatures, and the peak’s intensity increased by increasing the temperature. These peaks can belong to both fcc Co (111) (JCPDS 1-1255) and graphitic carbon (JCPDS 41-1478) [3,9,36], which could be formed due to the reduction of cobalt oxide to Co (fcc) during the catalysts’ carbidation in the presence of 20%CH4 in H2. By increasing the carbidation temperature, the intensity of fcc Co increased, whereas the intensity of the Co2C(111) facet (at 2θ of 42.5°) decreased. The Co2C(111) facet is responsible for lower CO hydrogenation and higher CH4 selectivity during the FT synthesis under mild reaction conditions.
The contents of phases of C (carbon), Co (cobalt), and Co2C (cobalt carbide) were detected from the XRD results and semi-quantitative (SQ) evaluation, and the carbon content (elemental C) of the prepared samples was also measured using elemental analysis (Figure 2b). Decomposition of methane at higher temperatures increased the carbon content on the surface of the prepared catalysts. By increasing the temperature, the formed Co2C became unstable and decomposed to C and metallic Co, and its content decreased [5,27,28]. Decomposition of cobalt carbide to graphitic carbon and hydrogen is started at temperatures above 275 °C; however, in the presence of hydrogen, it could happen at lower temperatures [5,27,37]. The XRD pattern (Figure 2a) showed that the intensity of the peaks belonging to the Co2C decreased gradually by increasing the temperature from 300 °C to 800 °C [19]. Elemental analysis of the carbon (Figure 2b) also confirmed that an increase in the temperature led to the formation of more carbon. Cobalt carbides were unstable at high temperatures; they decomposed to metallic cobalt and carbon at high temperatures. However, due to the overlapping of the carbon and cobalt peaks, with the similar cubic structure, it was difficult to accurately distinguish between the two phases in XRD patterns. XPS analysis was performed for further investigation and evaluation of the active phases of the catalysts.
XPS analysis was used to investigate the chemical composition and elemental oxidation states of the catalysts. The survey scan of carbide catalysts is shown in Figure S1, which confirmed the existence of C, O, Co, and Al in these prepared catalysts. The intensity of C 1s peaks increased by increasing the temperature, whereas the intensity of Co 2p peaks decreased. The strong C 1s peak observed at about 284.6 eV was ascribed to sp2 elemental carbon (C-C), such as carbon fibers or carbon nanotubes [38]. The high intensity of this peak in the C 1s spectra (Figure 3a) of the catalysts prepared at higher temperatures (800 °C and 700 °C) was due to the presence of graphitic carbon, as confirmed by SEM, XRD, and Raman analysis. The Co-C peak at around 283.1 eV followed the reverse trend. By increasing the temperature of carbidation, the content of Co-C decreased. In addition to the C-C and Co-C bonds, other bonds at 286.5 eV and 288.5 eV were attributed to the O-C-O and O=C-O bonds, respectively. The π     π * shake-up satellite peak was also observed at about 291.2 eV. The obtained results are in good agreement with the reported results where the Co-C bonds were C-Co bonds; these were detected, confirming the presence of Co2C in the prepared catalysts [39,40].
XPS spectra of Co 2p (Figure 3b) showed that the bond at about 778.6 eV was attributed to the Co2+ of carbidic Co of the prepared catalysts. The intensity of the Co-C bond decreased by the carbidation temperature, whereas the intensity of peaks belonging to metallic cobalt (Co0) (at around 782.3 eV) increased at higher temperatures. These findings are in good agreement with the XRD analysis of the catalysts, where the Co2C content decreased at higher temperatures, and metallic cobalt peaks were detected at higher temperatures. However, by increasing the temperature to above 600 °C and formation of more graphitic carbon on the surface of the catalysts, the intensity of the Co peaks in Co 2p spectra decreased, which is in good accordance with the C 1s spectra of these catalysts, where the content of graphitic carbon increased significantly at high temperatures.
As mentioned earlier, the decomposition of cobalt carbide to cobalt and graphitic carbon started at temperatures above 275 °C [5,27], and this could be the reason for the increase in the Co0/Co-C and C-C/Co0 ratios when the carbidation temperature increased (Table 1). However, for the catalyst with the carbidation temperature of 800 °C, the Co0/Co-C ratios decreased compared with that of 700 °C, which could be due to the deposition of graphitic carbon on the catalyst’s surface and blockage of metallic cobalt on the surface. The sharp increase in the C-C/Co0 at 800 °C was in good agreement with this finding. The XPS analysis of cobalt carbide nanoparticles and nanosheets performed by other research groups also showed similar patterns for cobalt carbides, and the peaks attributed to cobalt carbides were observed at about 283 eV (C 1s) and 778.5 eV (Co 2p 3/2) [26,41,42].
Raman spectroscopy analysis could be beneficial for the investigation of the materials’ properties and could provide information about molecular vibrations. Raman spectra of the Co/Al2O3 catalysts at different carbidation temperatures are shown in Figure 4. The D and G bands belonging to carbon were not clearly observed for the catalysts prepared at the carbidation temperatures in the range of 300 °C to 600 °C. The D and G bands were clearly detected for the catalysts prepared at 700 °C and 800 °C The peaks at around 1340 cm−1 and 1573 cm−1 were typical for D and G bands, respectively. The D and G bands of the carbon materials could be observed if amorphous carbon or nanocrystalline graphite existed in a metal carbide matrix [43,44].
The D mode is caused by the disordered structure of graphene, and it originates from the A1g breathing vibrations of the sixfold carbon rings involving phonons near the K zone boundary (Figure S2). The G band, which lies in the range of 1500–1600 cm−1, is ascribed to the graphitic carbon with E2g symmetry that involves the in-plane bond-stretching vibration of sp2 carbon sites. This mode does not require the presence of sixfold rings, so it occurs at all sp2 sites, not only those in the rings [45,46]. It is worth mentioning that the G mode is due to the relative motion of sp2 carbon atoms and can also be found in chains.
As mentioned above, the G peak could be observed in the range of 1500–1600 cm−1. By changing the structure of crystallized graphite to nanocrystalline graphite, the peak shifts to 1600 cm−1, and the peak shifts to 1500 cm−1 for amorphous carbon when a loss of aromatic bonding appears. Thus, it can be confirmed that the G band positions (1573 cm−1) of the catalysts are close to that of nanocrystalline graphite of nanometer-sized clusters [47]. The degree of crystallinity and graphitization formed carbon on the surface of catalysts after carbidation at 700 °C and 800 °C can be measured by the intensity ratio of ID/IG. The higher crystallinity could be observed in catalysts with a lower ID/IG ratio (Table 2). In this study, the ID/IG decreased from 1.18 to 1.28 by increasing the carbidation temperature from 700 °C to 800 °C, which is not clearly confirming the higher crystallinity of the deposited carbon on the surface of the catalyst prepared at the higher temperature. However, the higher intensities in the catalysts prepared at 800 °C could confirm the higher content of the deposited carbon on the catalyst’s surface.
All kinds of sp2 carbon materials exhibited a peak in the range 2500–2800 cm–1 in the Raman spectra. The G′ band (or 2D band) was also observed at 2677 cm−1. The intensity of the G′ band in the prepared catalysts increased by increasing the carbidation temperature. The G′ band usually helps discriminate the differences between the layers and loading order of the multi-layer graphene system [48]. The single-layer graphene shows a G′ band with high intensity. By increasing the graphite layers, the peak becomes broader. In the catalyst prepared at 800 °C, the intensity of the G′ band at around 2677 cm−1 peak increased due to the higher amount of carbon on the catalyst’s surface. The catalysts prepared at lower carbidation temperatures (≤600 °C) did not show any peak belonging to graphitic carbon.
The Raman peaks below 700 cm−1 are attributed to the Co-Co stretching mode. The observed peaks for cobalt are very similar to those reported in the Raman spectra of cobalt oxide nanoparticles [49,50,51,52,53,54,55,56]. Five (A1g + Eg + 3 F2g) Raman-active modes were observed and identified. The band at around 187 cm−1 was ascribed to the tetrahedral sites’ (CoO4) characteristics with the F2g mode (Figure. 3b). The bands at 470, 510, and 607 are attributed to the Eg, F2g, and F2g symmetry, respectively. Generally, the Eg and F2g modes were related to the combined vibrations of the tetrahedral site and octahedral oxygen motions. The band at 671 cm−1 with A1g symmetry was attributed to the characteristics of the octahedral sites (CoO6) [49,50,51,52,53,54]. D’Ippolito and Andreozzi [56] also reported that the Raman vibrational modes of spinel oxides are generally observed in the range of 100–800 cm−1. Diallo et al. [49], Rashad et al. [50], Jiang and Li [51], and Hadjiev et al. [52] also observed the same Raman bands for the Co3O4 nanoparticles. The intensity of the bands in the range of 100–800 cm−1 belonging to Co3O4 nanoparticles decreased gradually with increasing carbidation temperature. This phenomenon was more evident in the samples with carbidation temperature above 600 °C, which could be due to the coverage of the surface by deposited carbon. The weak band at around 2330 cm−1, observed in all spectra, could be attributed to the characteristic line of nitrogen from the air [57,58,59]. The peak at around 1790 cm−1 was ascribed to the carbonyl (C=O) stretch bands [60,61,62,63], which could be formed after the passivation of the catalyst under oxygen after carbidation.

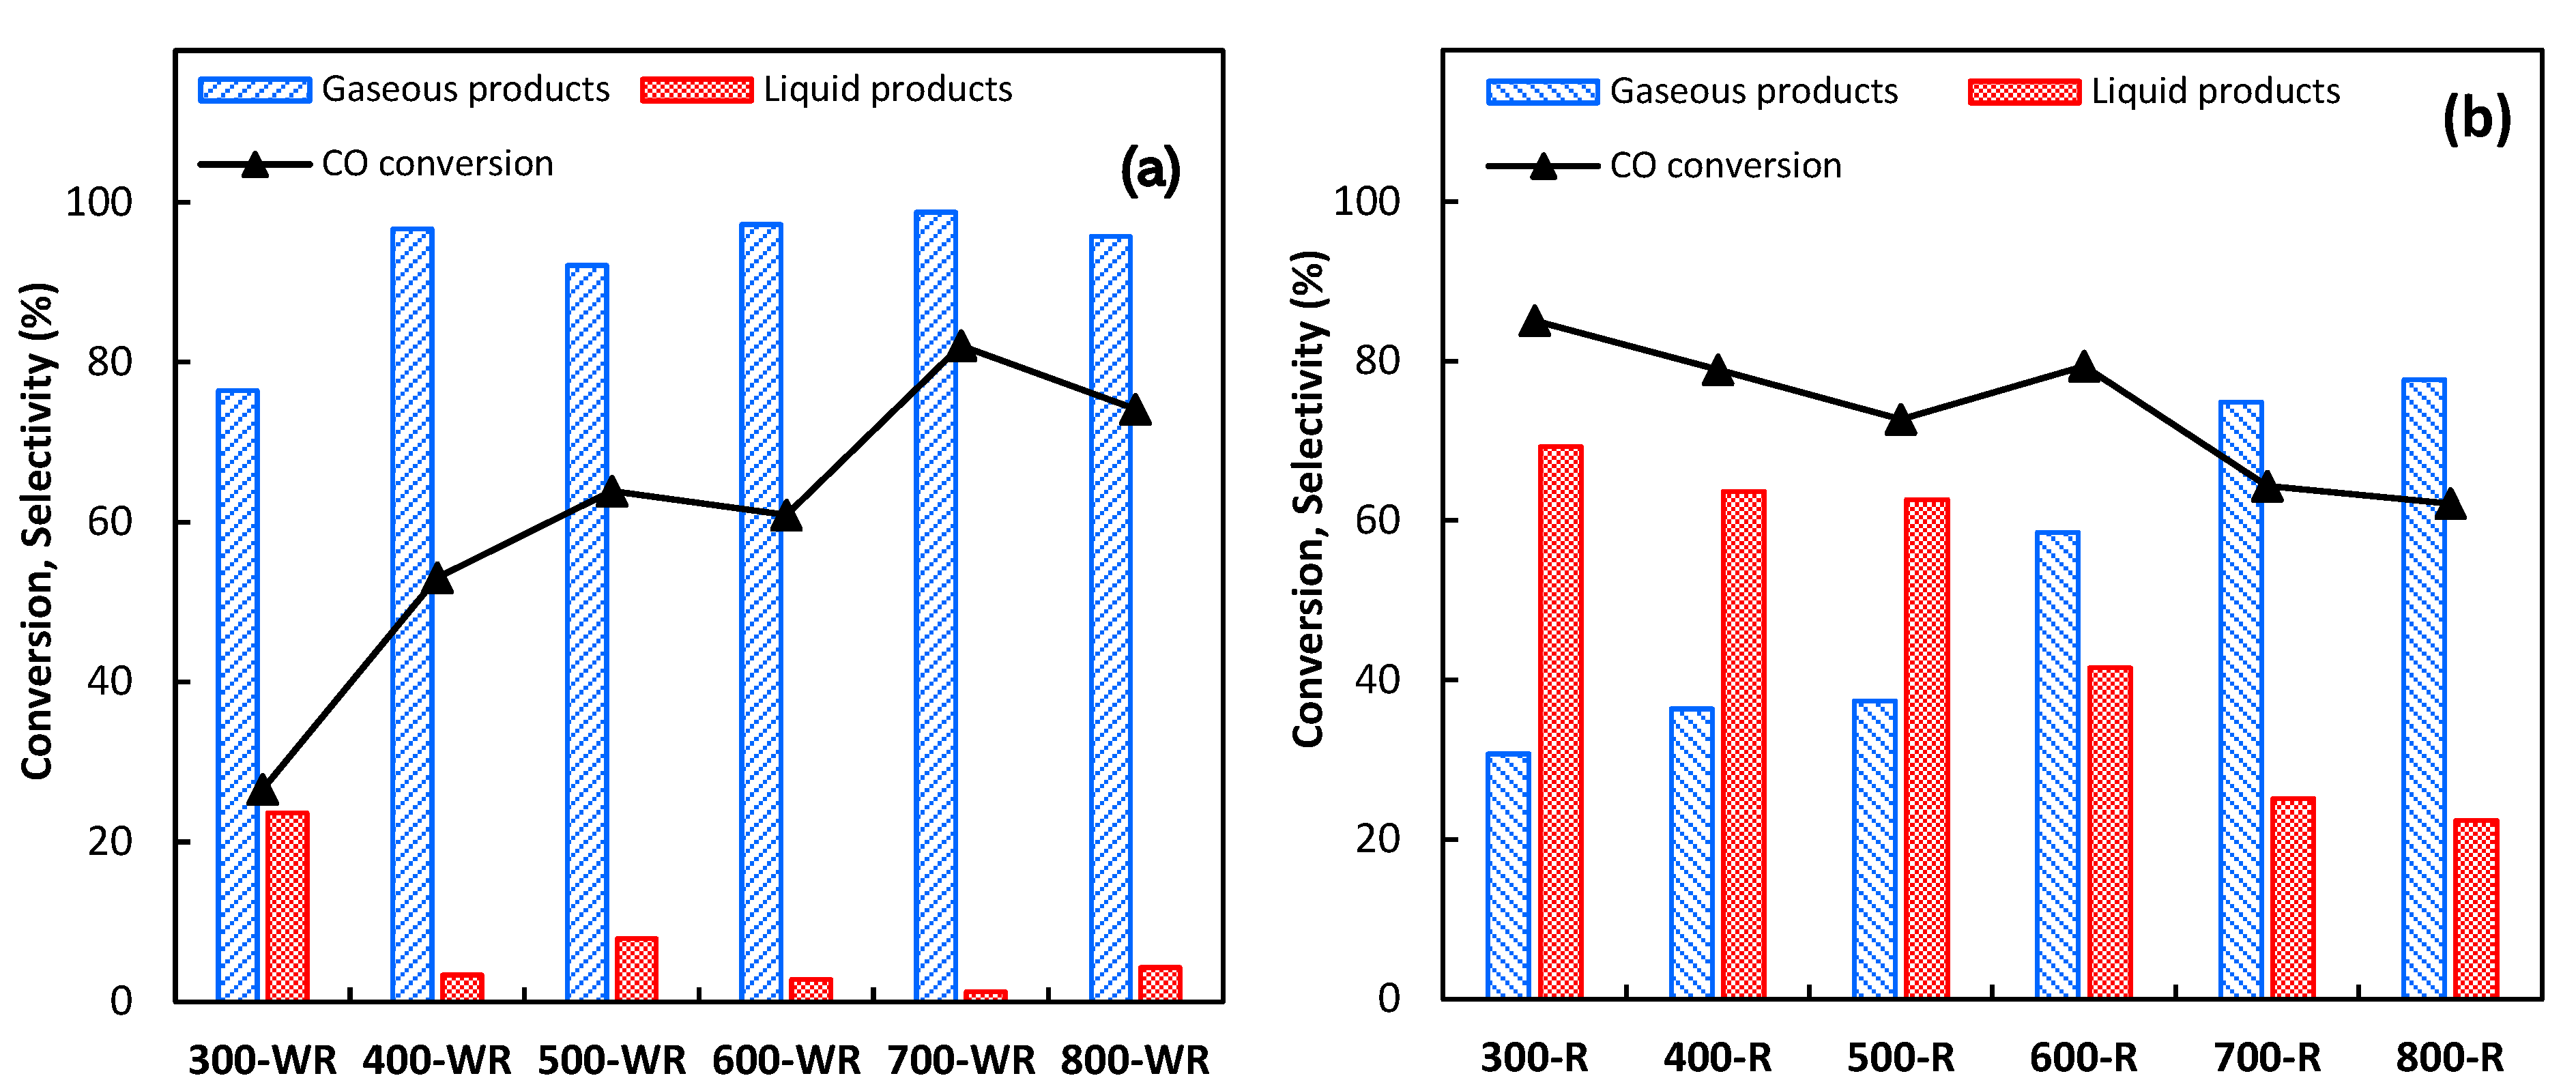
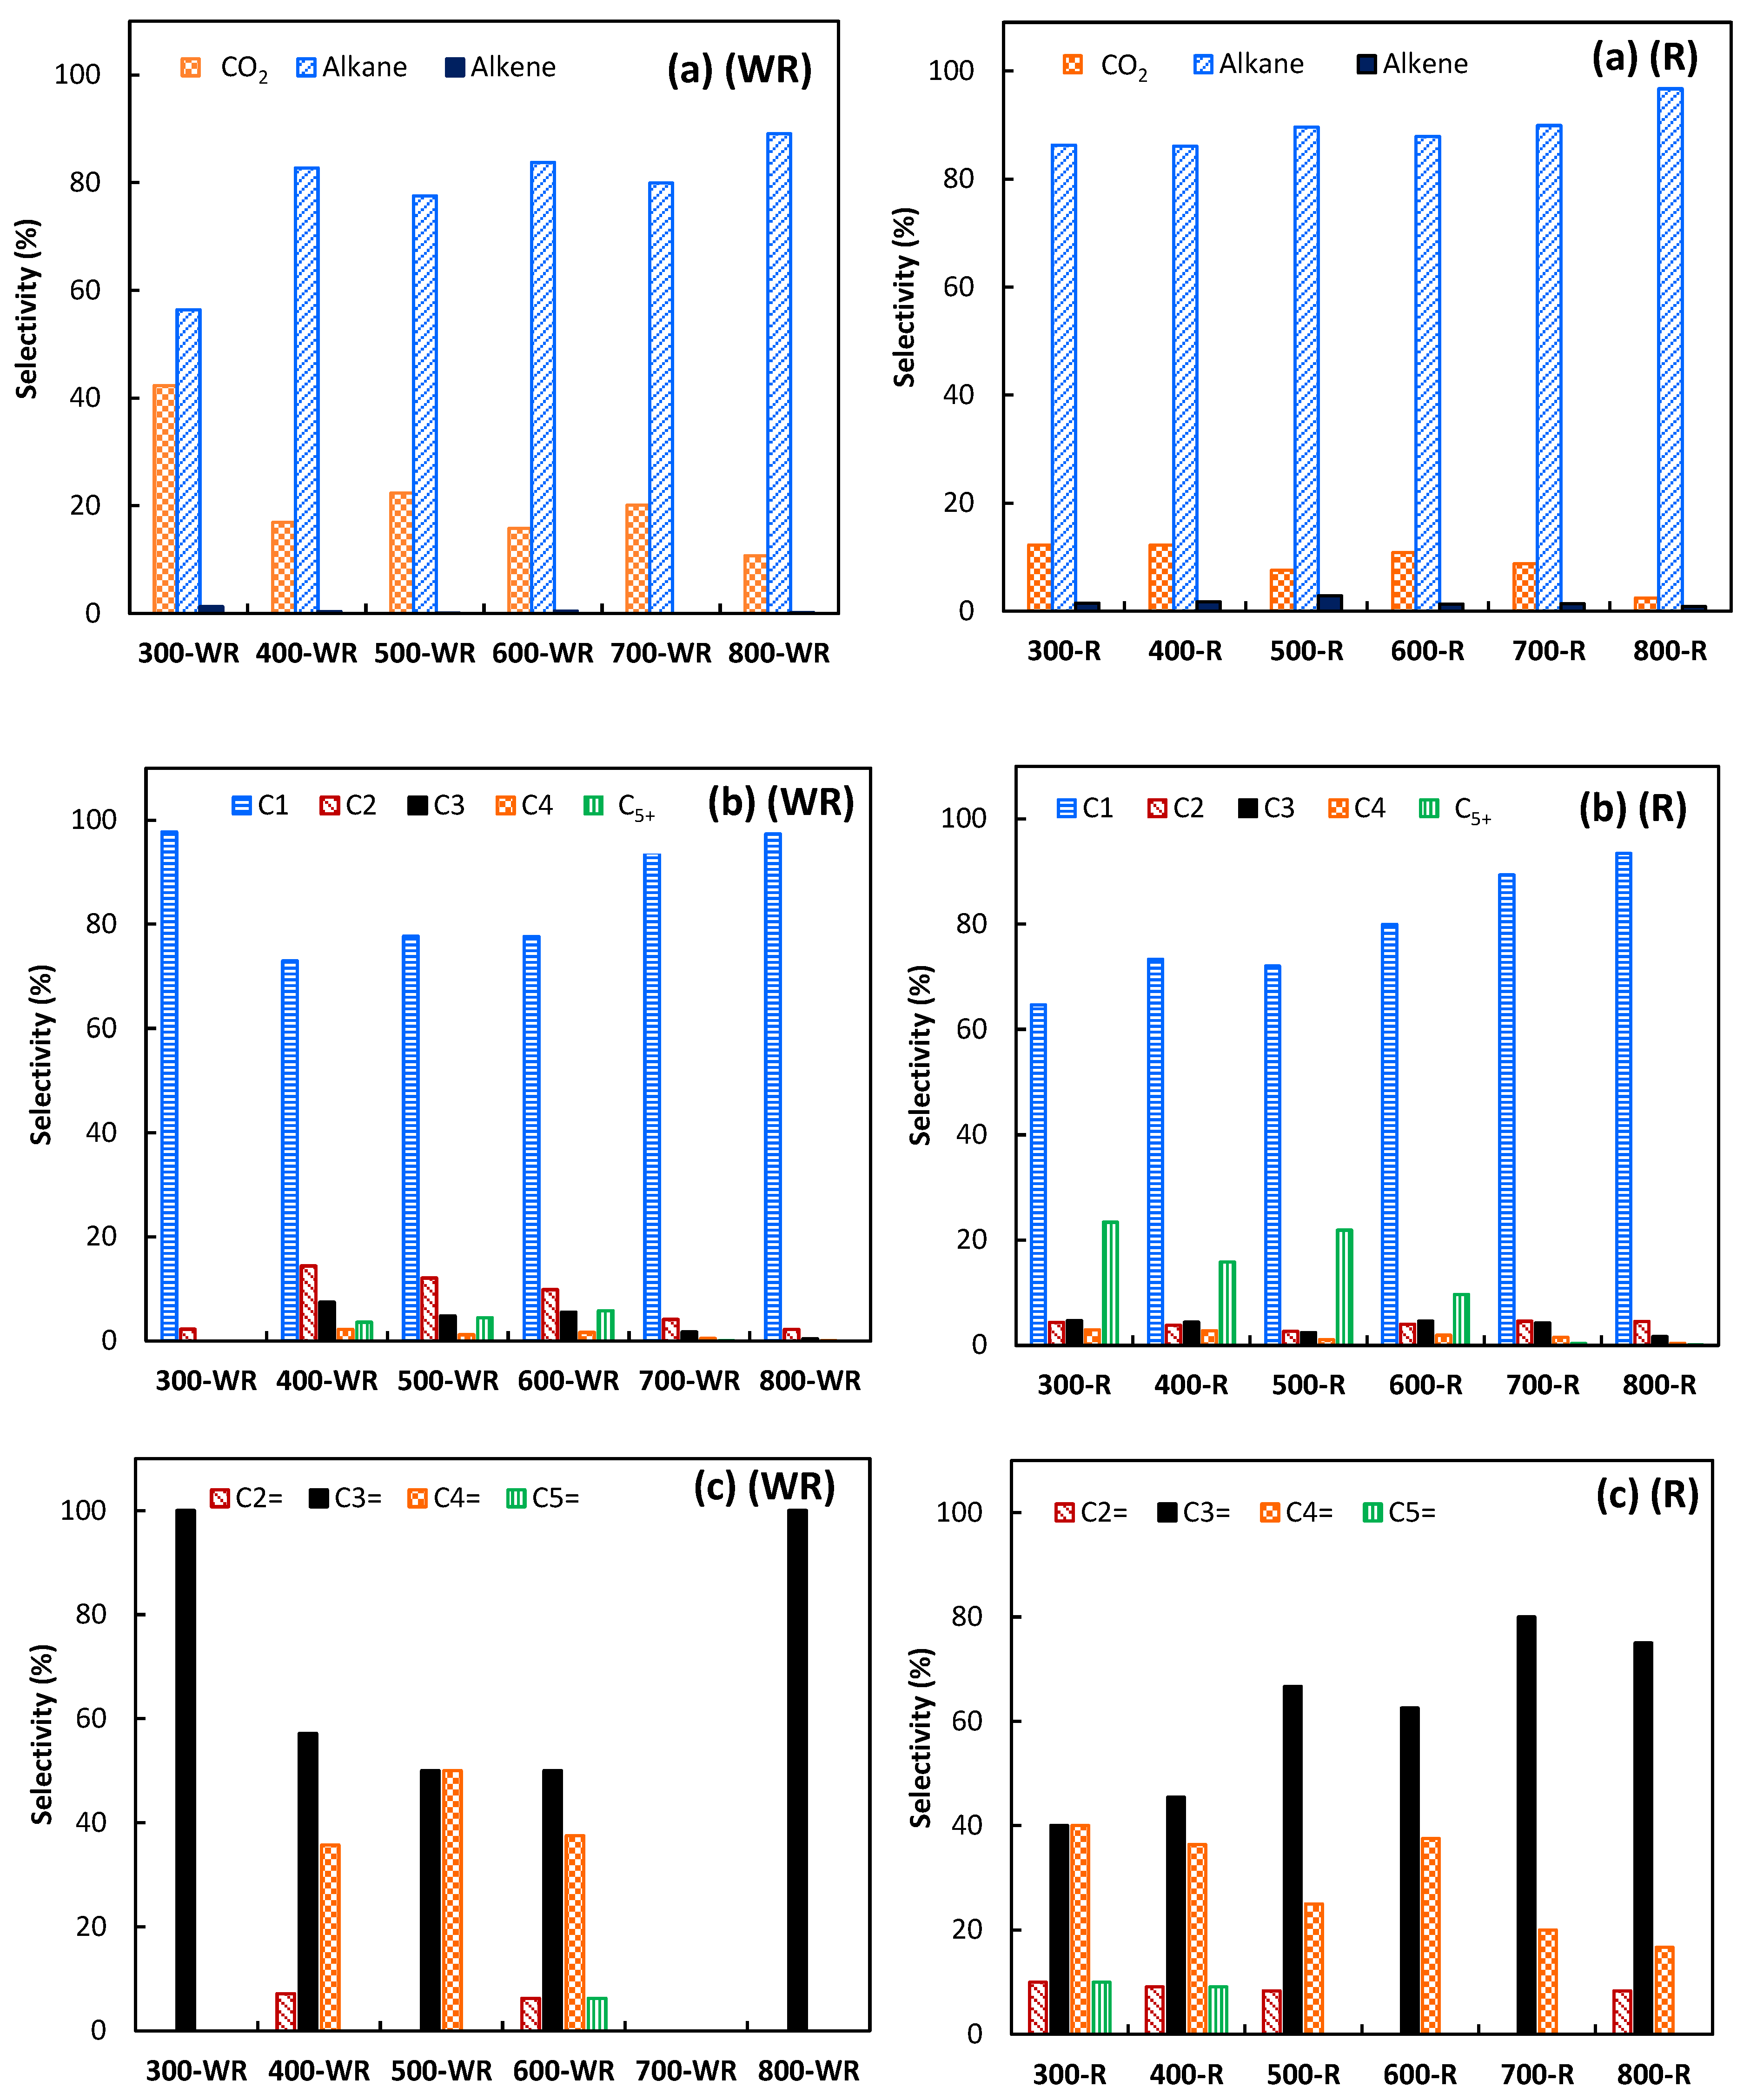
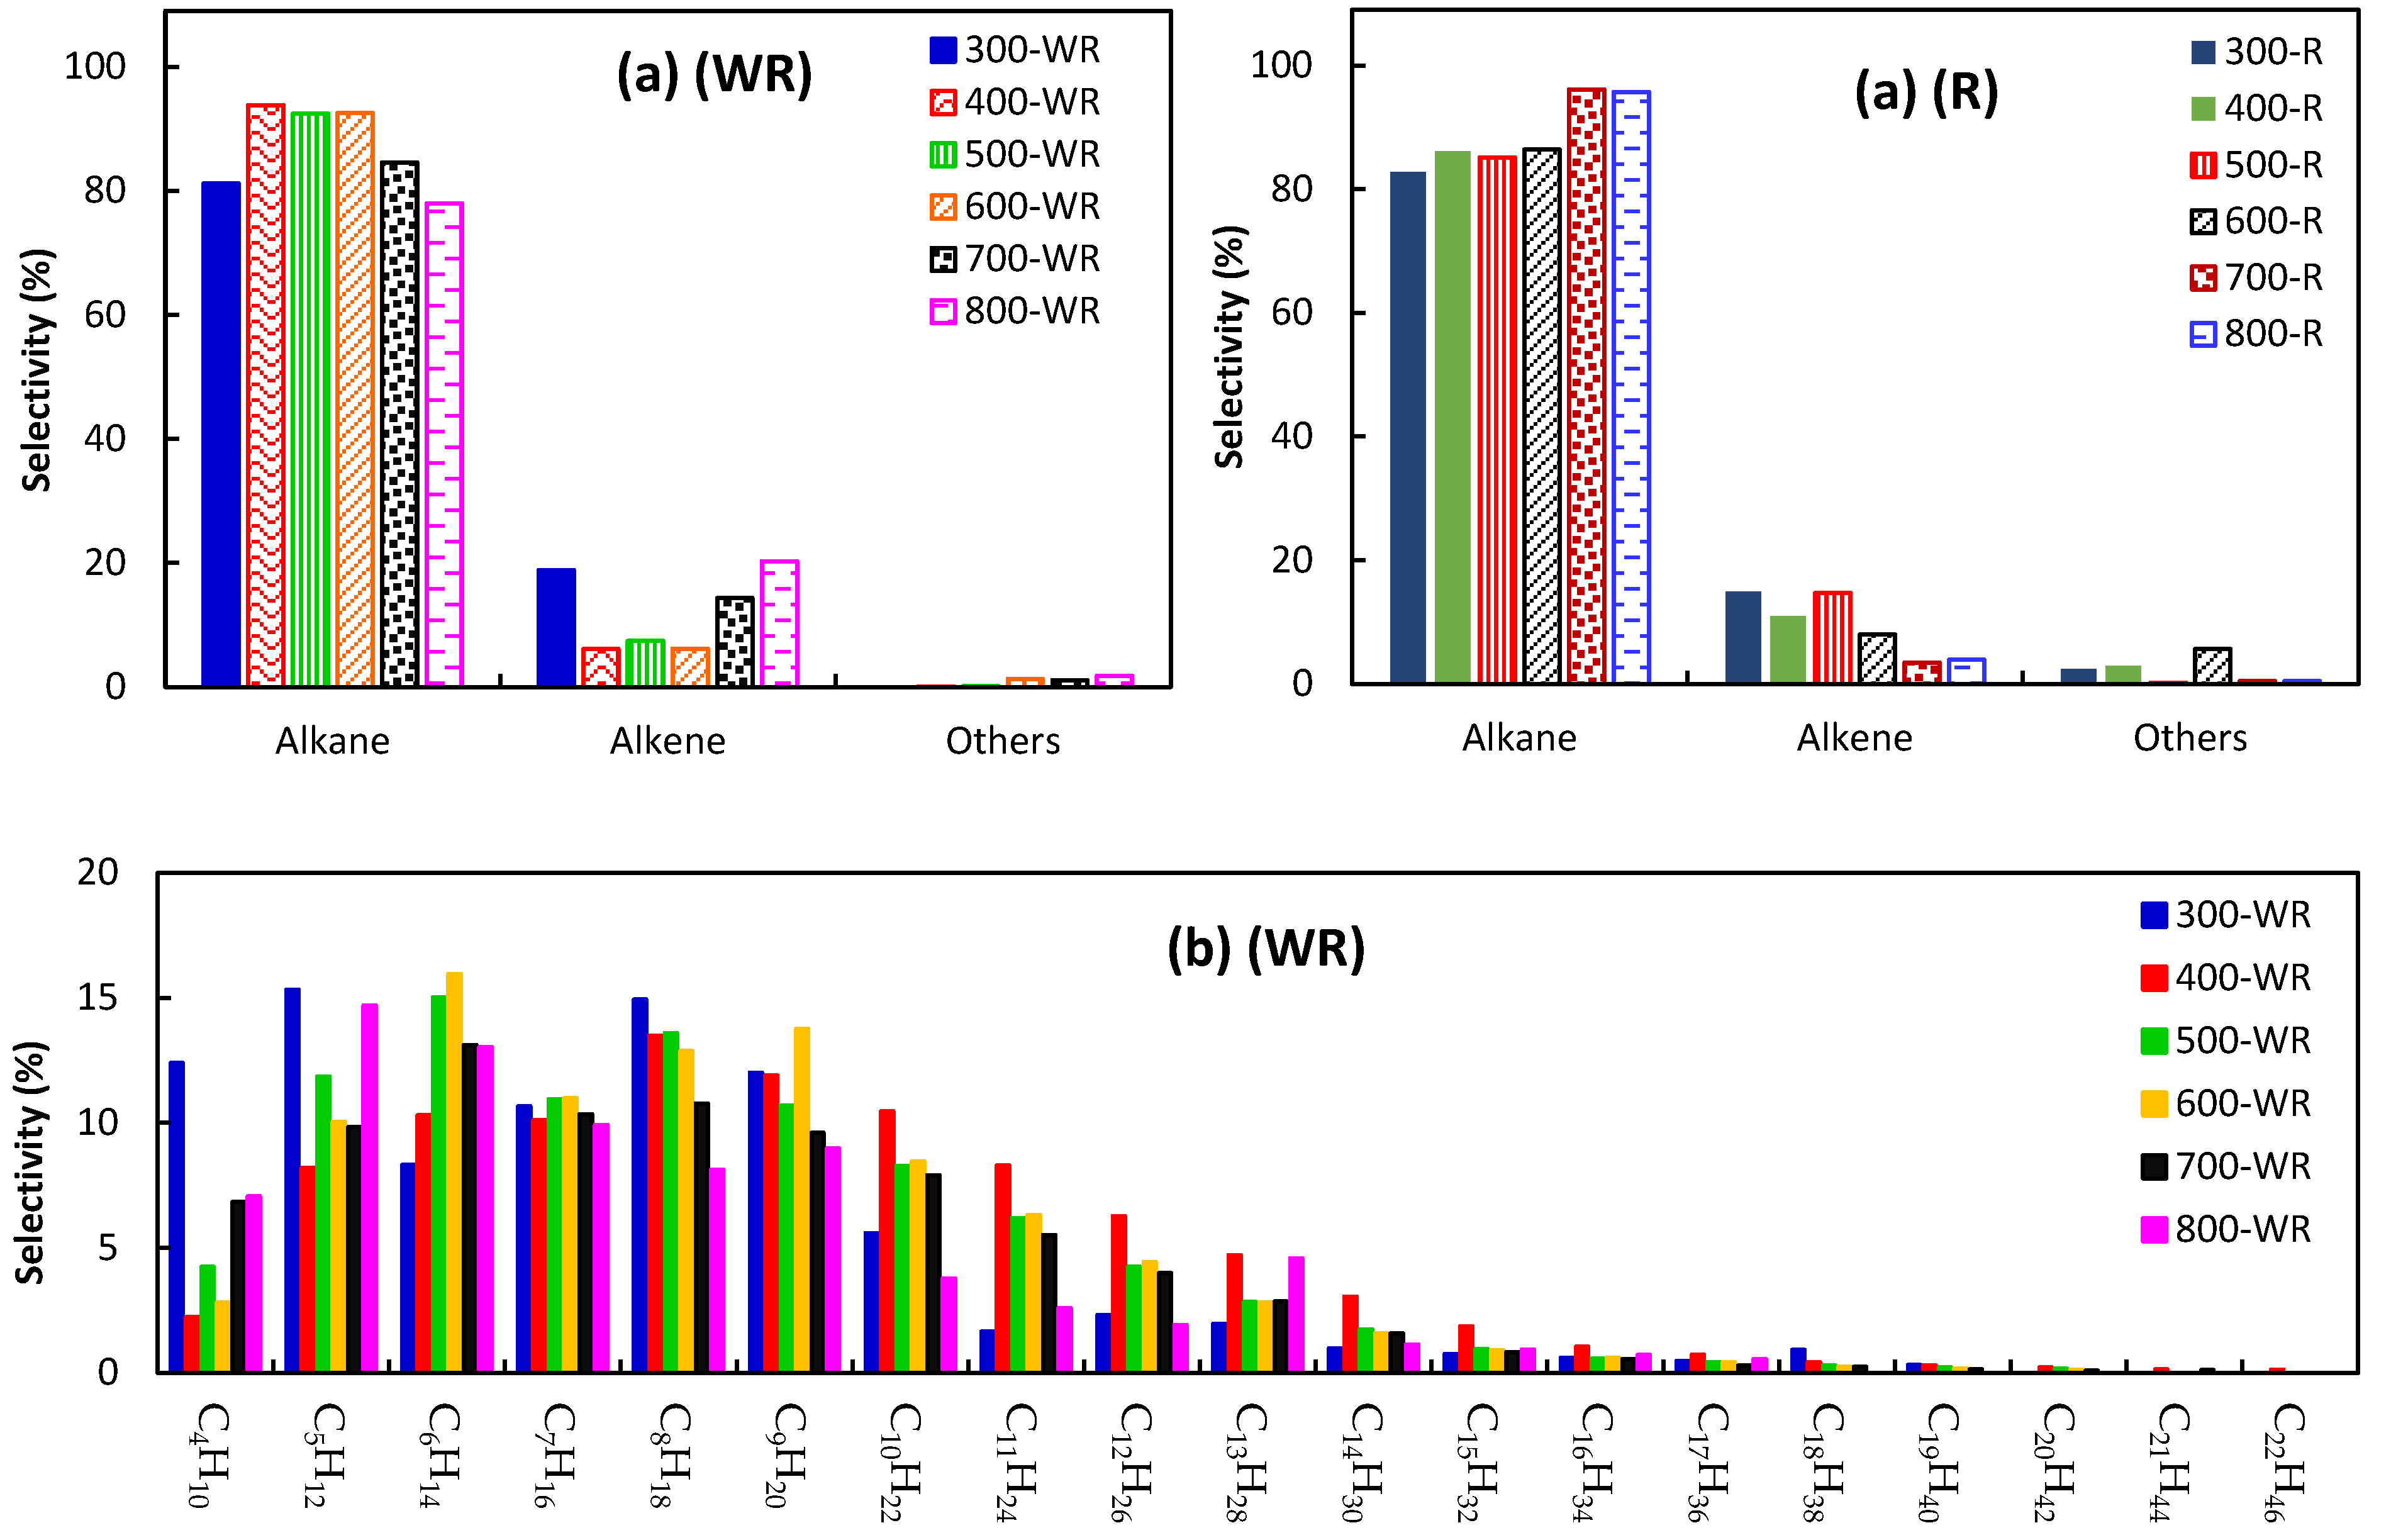
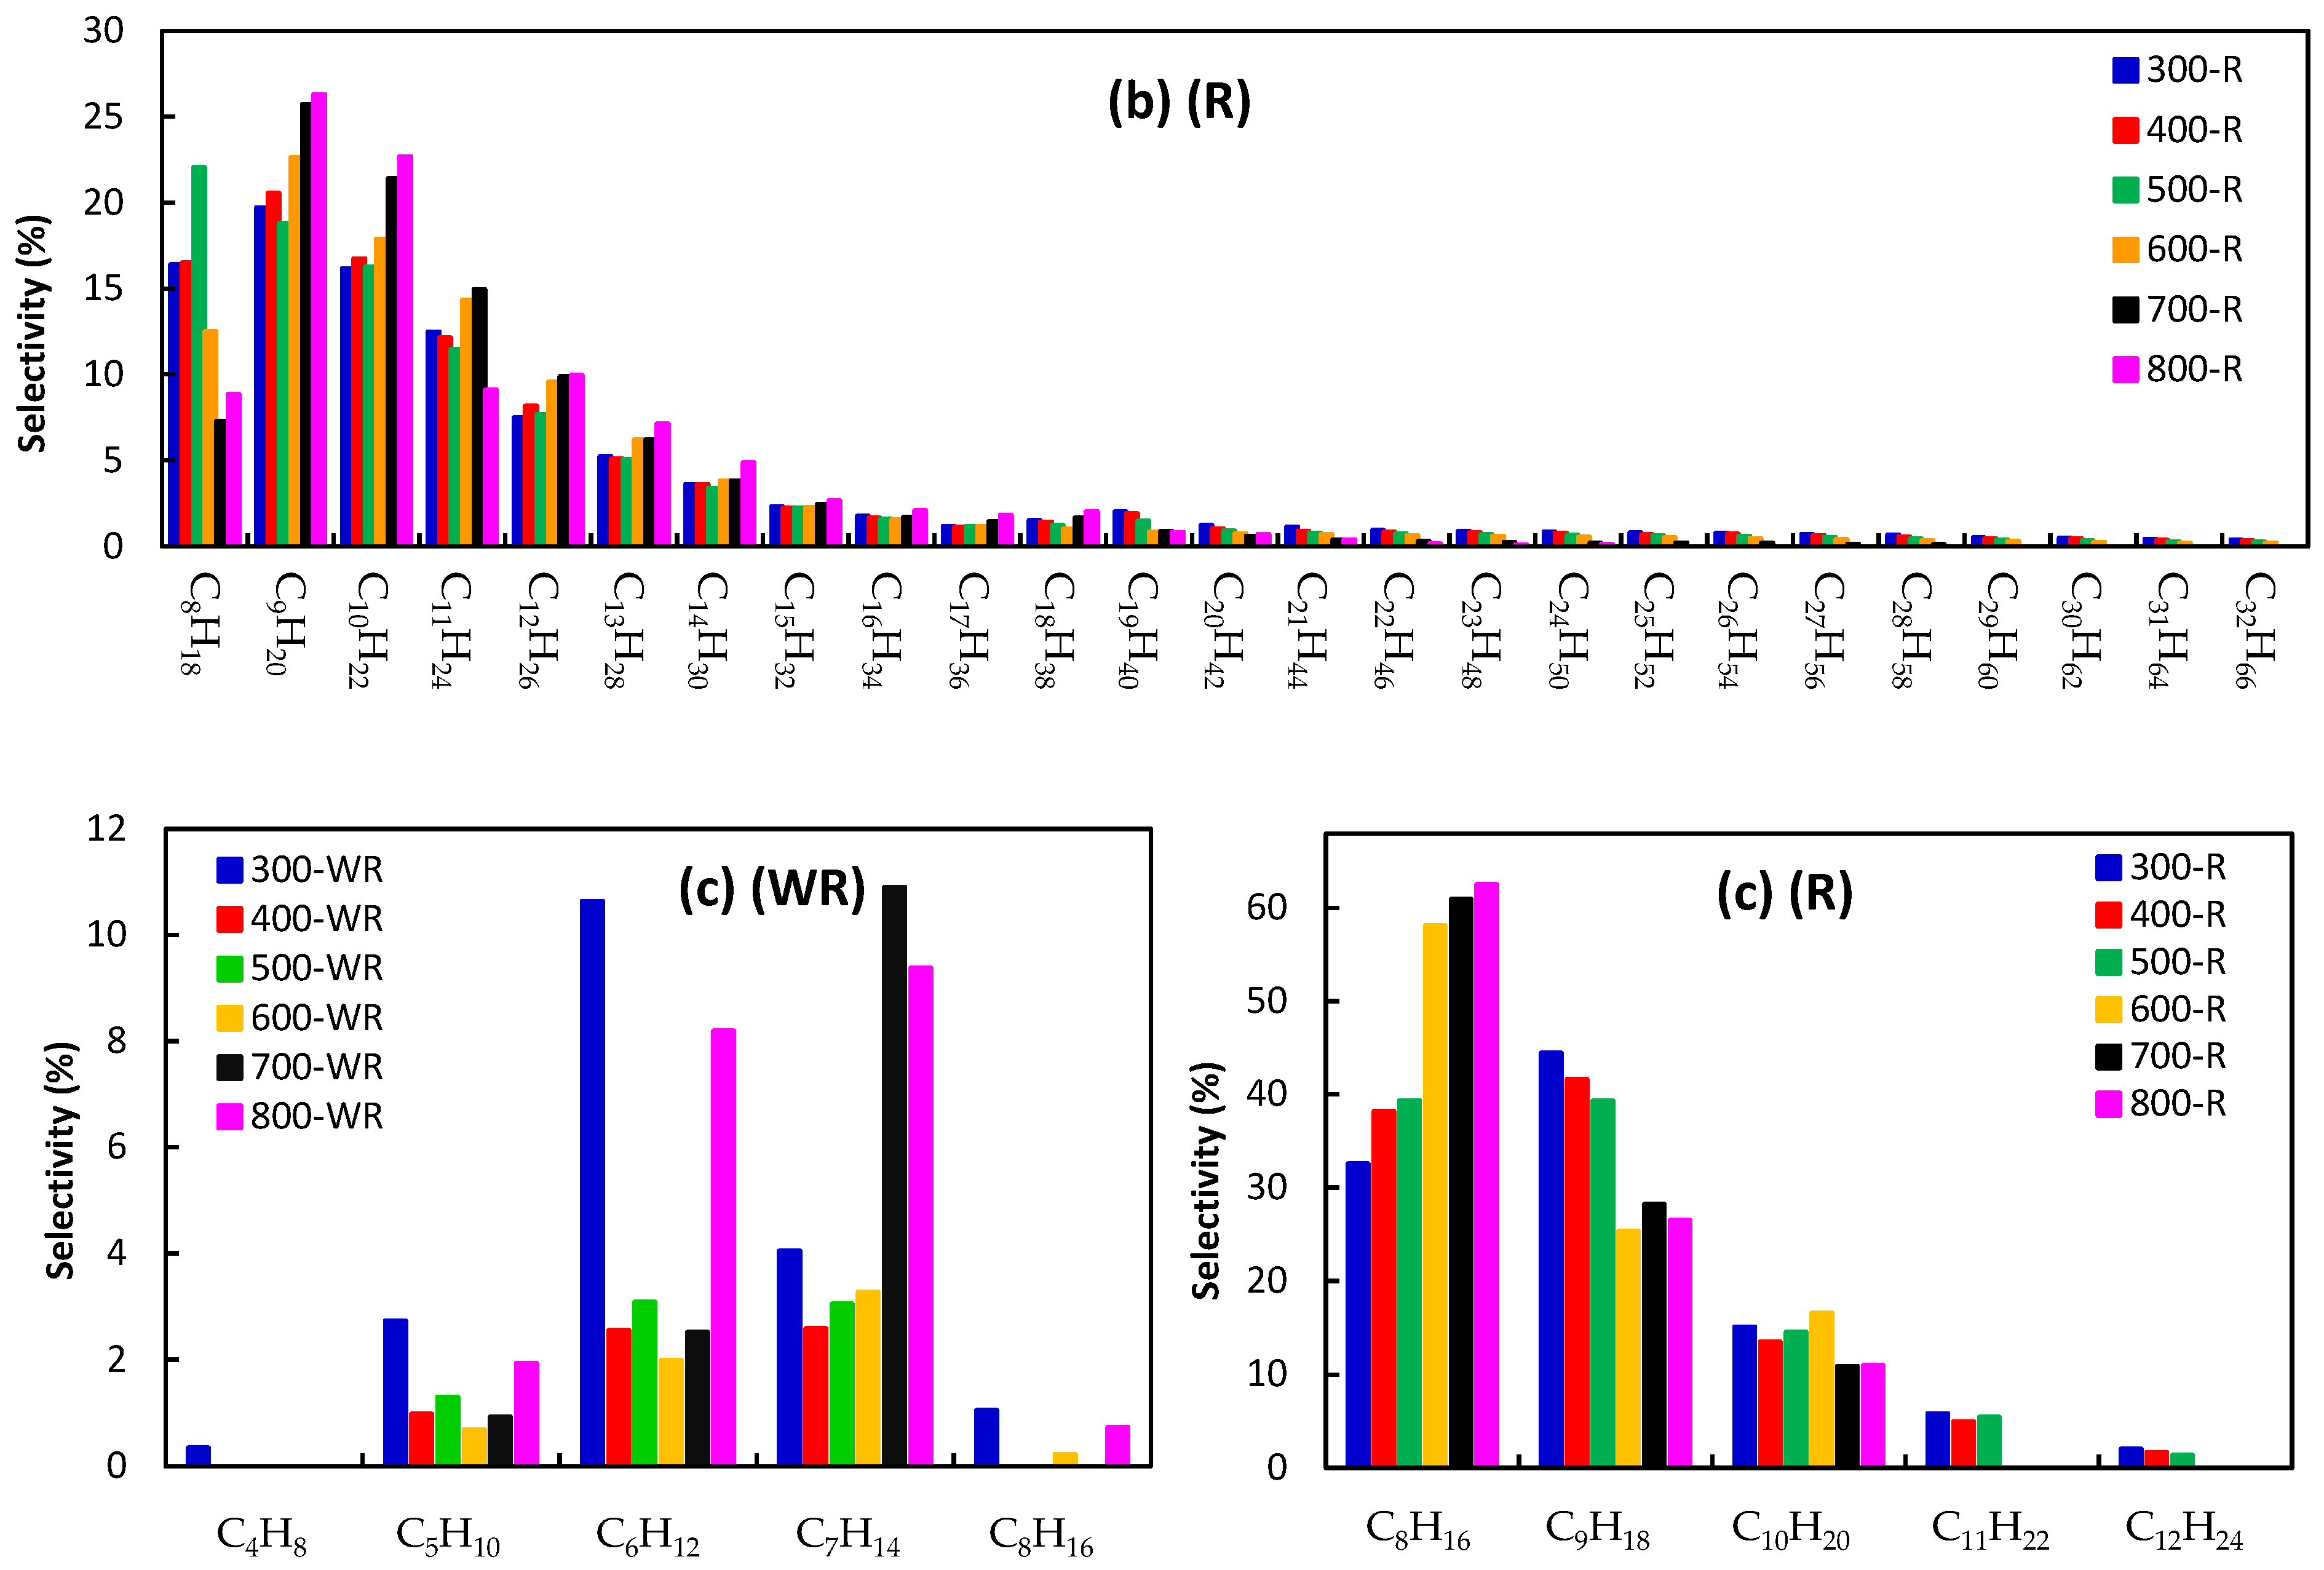
2.2. Catalyst Evaluation

The results of the FT reaction in the autoclave reactor are shown in Figure 5 and Figure 6. The FT reactions were first performed using the carbide catalysts without prior reduction (WR) by hydrogen (Figure 5a). The catalyst with higher Co2C content (300-WR, the catalyst prepared at the carbidation temperature of 300 °C and used in FT without prior reduction with H2) showed the lowest CO conversion of about 26%. By increasing the carbidation temperature, the catalyst activity also increased to 74% for the catalyst prepared at 800 °C. As was described earlier, increasing the carbidation temperature resulted in the formation of more metallic cobalt and lower cobalt carbide. Higher content of metallic cobalt could increase the CO conversion. In addition to the cobalt carbide, carbon fibers were also deposited on the catalyst’s surface due to the decomposition of methane at higher carbidation temperatures. Deposited carbon could block the active sites and reduce the contact possibility between the reactant gas and the active sites, thus leading to a lower conversion. By increasing the carbidation temperature from 300 °C to 800 °C, the content of products in the form of liquid decreased from 23% to 4%. It seems that the cobalt carbides were acting as an intermediate and reacting with hydrogen to form methylene as a chain-growth monomer for the formation of long-chain hydrocarbons. Therefore, the catalysts with higher cobalt carbide content had a higher selectivity for the heavier hydrocarbons (liquid products) (Figure 5a).
During the FT reaction over non-reduced catalysts, the content of formed light alkenes was very low and negligible (maximum 1.3% over 300-WR catalyst), whereas alkanes (56.4%) and CO2 (42.3%) were the main products of the reaction (Figure 6a-WR). The slightly higher alkene formation for the catalysts with lower carbidation temperature could be attributed to the presence of more Co2C on the surface of the catalysts [9,64]. By increasing the carbidation temperature, the selectivity to CO2 decreased and reached 10.7% over the 800-WR catalyst, and alkanes selectivity increased to 89%. Methane was the main produced alkane with the selectivity of 97% for the 300-WR. It was decreased to 73% for 400-WR, then again increased gradually to 97% for the 800-WR catalyst (Figure 6b-WR). Formed alkenes are negligible, and propylene was the main formed alkene in gaseous products of the reaction (Figure 6c-WR). Co2C with (111) facet and nanosphere-like particles could lead to lower activity and higher methane selectivity [10,13,18]. Moreover, during the FT reaction, some portion of deposited graphitic carbon could also be converted to methane through a hydrogenation reaction. This could be the reason for the increase in the methane content in the catalysts with higher graphitic carbon on their surface. The catalysts prepared at 300 °C and 400 °C with the higher content of Co2C(111) showed lower CO conversion, whereas increasing the Co0 content at the catalysts prepared at higher temperatures resulted in a lower CO2 and alkane (mainly methane) selectivity.
In the presence of hydrogen, cobalt carbides could be transformed into the face centered-cubic (fcc) and hexagonal close-packed (hcp) Co0, which are more efficient for the dissociative adsorption of CO during the FT reaction, and hcp cobalt nanoparticles reported to have higher activity compared with fcc cobalt in the FT reaction [65,66,67]. The reaction route is also reported to be different over these two different Co crystallographic structures, and the direct dissociation of CO (CO* + H → C* + O* + H*) is preferred over hcp Co, whereas H-assisted dissociation (CO* + H* → CHO* → CH* + O*) is the main mechanism over fcc cobalt [67]. In order to investigate the stability of the cobalt carbides in the presence of hydrogen and evaluation of the catalytic performances of catalysts after reduction with hydrogen, the FT reactions in an autoclave reactor were repeated, while the catalysts were first reduced under H2 at 300 °C for 5 h. Then, the FT reaction was performed at 230 °C for 6 h (Figure 5 and Figure 6). Results of the FT reaction in an autoclave reactor revealed that CO and H2 conversions gradually decreased by increasing the catalyst carbidation temperature. The distribution of gaseous and liquid products is shown in Figure 5b.
Over the reduced catalysts, the products shifted from heavier hydrocarbons to lighter hydrocarbons by increasing the carbidation temperature, which was attributed to the content of metallic cobalt in these catalysts. The higher catalytic activity over the 300-R catalyst (which means the catalyst was prepared at the carbidation temperature of 300 °C and used in the FT reaction after reducing with H2) could be due to the formation of more metallic cobalt during the reduction step. This provided more active sites for CO dissociation and the production of heavier hydrocarbons. The content of the products in the form of liquid was higher for the FT reaction over the 300-R catalyst. The catalyst activity and production of heavier hydrocarbons in the liquid phase decreased gradually by increasing the carbidation temperature. Compared with the FT reaction without the reduction step, the FT reactions over the reduced catalysts resulted in the formation of a lower amount of CO2 and methane (Figure 6a-R).
The formation of methane gradually increased from 64% to 93% by increasing the carbidation temperature from 300 °C to 800 °C, and at the same time, the selectivity to C5+ in the gaseous phase decreased (Figure 6b-R). The presence of more cobalt carbides in the catalysts with lower carbidation temperatures resulted in the formation of more metallic cobalt during reduction by hydrogen, which can enhance the CO dissociation and result in higher activity and selectivity to heavier hydrocarbons. Like the non-reduced catalyst, the main formed alkene was propylene over the reduced catalysts, and its content increased by increasing the carbidation temperature (Figure 6c-R). The Co0 could be carburized in the presence of pure CO and produce Co2C [68]. However, during the FT reaction, in the presence of CO and H2, both Co0 and Co2C were found to exist. Therefore, both of them can affect the reaction. During the initial reaction stage, the presence of Co0 in the reduced catalyst led to a higher selectivity for heavier hydrocarbons and a lower CH4 and CO2 selectivity. It has been reported that the higher Co2C content leads to a high methane selectivity and a lower CO conversion [1,69]. Zhong et al. [10] prepared the Co2C nanospheres to evaluate their activity for the FT reaction. The CO conversion over the Co2C nanoparticles was about 10%. High selectivity to methane (~80%), C2-C4 alkanes of ~18%, and the C2-C4 alkenes selectivity of about 2% were obtained during the reaction at 250 °C, 1 bar, and H2/CO = 2. During the FT reaction over the CoMn catalyst, Co0 was transformed to Co2C, and the CoMn, which initially existed as CoxMn1−xO, was segregated into Co2C and MnO. The Co2C formed during the reaction resulted in higher activity and more light olefins formation. As the reaction proceeded, the formation of C5+ and oxygenates decreased.
The evaluation of the liquid phase products for both series of FT reactions (without and with reduction step) showed that the products were a combination of alkanes, alkenes, and a negligible amount of other products such as toluene, and ethylbenzene and propylbenzene were the main products of the FT reaction without the reduction step (Figure 7). The liquid product of the FT reaction with the reduction step consisted of a slightly higher amount of other products (including some oxygenates such as diphenyl ether, acetic anhydride, and dicyclohexyl). The formation of oxygenates was not observed over the catalysts without the reduction step. A small amount of the cyclic products could be due to the reaction of cyclohexane, which was used as the solvent for the FT reaction in the autoclave reactor. The nondissociative adsorption of CO and its insertion into hydrocarbons could result in the formation of oxygenates, which can be converted to alcohol by going through the further hydrogenation process. The FT reaction over carbide catalysts without reduction resulted in the formation of alkanes in the range of C4-C22, and the lower carbidation temperature led to the formation of slightly lighter hydrocarbons.
By increasing the carbidation temperature, products shifted slightly to heavier hydrocarbons. As expected, the FT reaction over the reduced catalysts resulted in the formation of heavier hydrocarbons in the range of C8–C32, which could be due to the presence of more active metallic cobalt with higher activity and selectivity to heavy hydrocarbons. The formed alkenes were in the range of C4–C8 over carbide catalysts without reduction, whereas heavier alkenes (C8–C12) were formed over the reaction of reduced catalysts. According to the density functional theory calculations, the active sites for the CO nondissociative adsorption are provided by Co2C. Co0 provides the active sites for CO dissociative adsorption; the insertion of CO to hydrocarbon for oxygenates at the interface of Co and Co2C is facilitated [19]. In the presence of pure H2, Co2C could preserve its activity until 150 °C, whereas at higher temperatures, it starts to decompose to the fcc and hcp Co0 and C. At temperatures above 300 °C, Co2C is completely decomposed [19]. Due to the presence of both H2 and CO during the FT reaction, cobalt in the form of both Co0 and Co2C existed in the catalyst. The presence of Co0 could be beneficial for the production of heavier hydrocarbons. The FT reaction over the reduced catalysts prepared at lower carbidation temperature (with more carbides and less carbon formed on the surface) showed a higher selectivity to heavier hydrocarbons.

3. Materials and Methods

3.1. Catalyst Preparation

The 5%Co/Al2O3, 5%Fe/Al2O3, and 2.5%Fe2.5%Co/Al2O3 as precursors were prepared in advance using the incipient wetness impregnation (IWI) method. First, the required amount of cobalt nitrate hexahydrate (Lech-Ner s.r.o., p.a. purity) was dissolved in deionized water. Then, this solution was added dropwise to the Al2O3 support (SASOL, alumina balls with 2.5 mm diameter) at room temperature and under continuous stirring for 1 h. The mixture was then dried at 120 °C overnight. The dried samples were used as precursors in the carbidation step. Prior to the carbidation step, the precursors were preheated at 200 °C for 12 h under N2 atmosphere (75 cm3/min). For the preparation of carbide catalysts, 4 g of the prepared precursor was exposed to a gas containing 20% CH4 in H2 with the flow rate of 300 cm3/min for 3 h at different temperatures in the range of 300 °C to 800 °C. After the carbidation step, catalysts were purged with N2 for 30 min and passivated for 2 h under 1% O2 in Ar with a flow rate of 75 cm3/h.

3.2. Catalyst Characterizations

The scanning electron microscope (SEM) (JEOL JSM-IT500HR; JEOL Ltd., Tokyo, Japan) was used to study the surface morphology of the prepared catalysts. Representative backscattered electron or secondary electron images of microstructures were taken in high vacuum mode, using an accelerating voltage of 15 kV. An inductively coupled plasma-optical emission spectrometer (ICP-OES; Agilent 725/Agilent Technologies Inc., Santa Clara, CA, USA) was used for the determination of the bulk metal content in the prepared catalysts. X-ray diffraction (XRD) was used to determine the type of phases and crystallinity of the catalysts using a D8 Advance ECO (Bruker AXC GmbH, Karlsruhe, Germany) with CuKα radiation (λ = 1.5406 Å). The step time of 0.5 s and the step size of 0.02° in a 2θ angle ranging from 10° to 70° were used for XRD analysis. X-ray photoelectron spectroscopy (XPS) spectra of the samples were obtained using the XPS instrument in a high-vacuum chamber, which was equipped with a source SPECS X-ray XR50 (SPECS Surface Nano Analysis GmbH, Germany), where an Al anode (1486.6 eV) and a Mg anode (1253.6 eV) were used, and with a hemispherical analyzer SPECS PHOIBOS 100 with a five-channel detector. Thermo Scientific™ Avantage Software was used for XPS data processing. The Raman analysis for the samples was performed using a DXR (Thermo Fischer Scientific, Waltham, MA, USA) Raman microscope. The laser beam was focused onto the catalyst surface using an optical microscope with a magnification of 10×. A 532 nm laser with an exposure time of 7 s and a power of 9 mW was used for sample excitation. Analyses were performed in the area of 100–3400 cm−1.

3.3. Catalyst Evaluation

The FT reaction was performed in a 1 L stainless steel autoclave reactor (Parr instruments). In a typical experiment, 1.5 g of catalyst and 35 mL of cyclohexane as a solvent were added to the reactor vessel. The reactor temperature was increased to 230 °C (3 °C/min) and pressurized to 5 MPa with syngas (H2/CO = 2). The reaction was conducted in batch mode for 6 h under constant stirring of 800 rpm to eliminate the diffusion control region. The conversion rate was measured according to the decrease in pressure during the reaction and the composition of the reactant gas before and after the reaction. For the FT reaction with the in situ catalyst reduction, the reactor was heated to 300 °C (3 °C/min) and then pressurized with H2 to 5 MPa for 5 h. After reduction, the reactor system was cooled to room temperature, and the gas was switched to syngas (H2/CO = 2). The FT reaction was performed at 230 °C and 5 MPa for 6 h. After the termination of the reaction, the gaseous and liquid products were analyzed using different chromatographic procedures. The resultant gas sample was transferred to a gas bag and analyzed with a gas chromatograph, the Agilent 7890A, with three parallel channels that collected data simultaneously. The channels are equipped with two thermal conductivity detectors (TCD), CO, H2, N2, and CO2 gases, and a flame ionization detector (FID) to detect hydrocarbons. The liquid samples were analyzed using Thermo Scientific ITQ Series GC/MS Ion Trap Mass Spectrometers.

4. Conclusions

Cobalt-based catalysts with high activity and selectivity to long-chain hydrocarbons are widely used for this reaction. Identification of the active phase could be beneficial in enhancing the product yield of the FT reaction. A series of FT reactions were performed in an autoclave reactor to evaluate the catalytic activity of cobalt carbide catalysts and their role in the product distribution during the FT reaction. CoCx/Al2O3 catalysts were prepared by carbidation of Co/Al2O3 catalysts at different temperatures and over 20% CH4 in an H2 gas stream. Different characterization methods confirmed the presence of Co2C. By increasing the carbidation temperature, the content of Co2C decreased, whereas the Co0 content increased by temperature. The Co/Al2O3 catalyst was also active for the methane decomposition to hydrogen and graphitic carbon at higher carbidation temperatures. Cobalt carbides were unstable in the presence of hydrogen at high temperatures and decomposed to metallic cobalt and carbon, which resulted in the increase of metallic cobalt’s content. The catalysts with higher cobalt carbide had the lowest CO conversion of 26%, which then increased to 74% for the catalyst with lower Co2C content prepared at 800 °C. The main products were light alkanes in the range of C1–C5 (mainly methane), and the heavier hydrocarbons (in the range of C4–C22) decreased from 23% to 4%. By increasing the carbidation temperature, the Co2C content decreased, and the metallic cobalt content increased, which resulted in higher catalytic activity. At the same time, the selectivity to CO2 decreased. The Co2C(111) facet with the nanosphere-like particles showed a lower activity and higher methane selectivity under mild FT reaction conditions. The formation of alkenes was negligible over these carbide catalysts, which could be due to the lower content of Co2C nanoprisms with specific exposed facets of (101) and (020); these are known as the FTO active phase, with higher activity for CO hydrogenation and lower methane selectivity. In addition, a series of FT reactions were performed over the carbide catalyst with a prior reduction step using pure hydrogen at 300 °C. These reduced catalysts showed a different catalytic performance. The main products were the heavier hydrocarbons (C8–C32) with 69%. By increasing the carbidation temperature to 800 °C, the content of liquid products decreased to 22%, whereas the light hydrocarbons content increased to 78%. The Co conversion decreased by increasing the carbidation temperature in the reduced catalysts. For the catalysts prepared at higher temperatures, the presence of lower Co2C, which is transformed into hcp cobalt during the reduction with hydrogen, as well as the presence of lower metallic fcc cobalt, resulted in lower CO conversion and less heavy hydrocarbons.

Supplementary Materials

The following supporting information can be downloaded at: https://www.mdpi.com/article/10.3390/catal12101222/s1, Figure S1: Survey XPS spectra scan of carbide catalysts, Figure S2: Carbon motions in the D and G modes [45].

Author Contributions

Conceptualization, Z.G. and Z.T.; methodology, Z.G.; validation, Z.G., Z.T. and F.G.; formal analysis, Z.G., Z.T., E.S., I.H., N.S.; investigation, Z.G., Z.T., E.S., I.H., N.S. and F.G.; data curation, Z.G., Z.T., E.S., I.H., N.S.; writing—original draft preparation, Z.G., Z.T., F.G.; writing—review and editing, Z.G., Z.T., F.G.; visualization, Z.G.; supervision, Z.G., Z.T. All authors have read and agreed to the published version of the manuscript.

Funding

The publication is a result of the project which was carried out within the financial support of the Ministry of Industry and Trade of the Czech Republic with institutional support for long-term conceptual development of research organization. The result was achieved using the infrastructure included in the project Efficient Use of Energy Resources Using Catalytic Processes (LM2018119), which has been financially supported by MEYS within the targeted support of large infrastructures.

Data Availability Statement

MDPI Research Data Policies.

Conflicts of Interest

The authors declare no conflict of interest. The funders had no role in the design of the study; in the collection, analyses, or interpretation of data; in the writing of the manuscript, or in the decision to publish the results.

References

  1. Mohandas, J.C.; Gnanamani, M.K.; Jacobs, G.; Ma, W.; Ji, Y.; Khalid, S.; Davis, B.H. Fischer–Tropsch synthesis: Characterization and reaction testing of cobalt carbide. ACS Catal. 2011, 1, 1581–1588. [Google Scholar] [CrossRef]
  2. Kwak, G.; Woo, M.H.; Kang, S.C.; Park, H.-G.; Lee, Y.-J.; Jun, K.-W.; Ha, K.-S. In situ monitoring during the transition of cobalt carbide to metal state and its application as Fischer–Tropsch catalyst in slurry phase. J. Catal. 2013, 307, 27–36. [Google Scholar] [CrossRef]
  3. Lin, Q.; Liu, B.; Jiang, F.; Fang, X.; Xu, Y.; Liu, X. Assessing the formation of cobalt carbide and its catalytic performance under realistic reaction conditions and tuning product selectivity in a cobalt-based FTS reaction. Catal. Sci. Technol. 2019, 9, 3238–3258. [Google Scholar] [CrossRef]
  4. Gholami, Z.; Tišler, Z.; Rubáš, V. Recent advances in Fischer-Tropsch synthesis using cobalt-based catalysts: A review on supports, promoters, and reactors. Catal. Rev. 2021, 63, 512–595. [Google Scholar] [CrossRef]
  5. Claeys, M.; Dry, M.E.; van Steen, E.; du Plessis, E.; van Berge, P.J.; Saib, A.M.; Moodley, D.J. In situ magnetometer study on the formation and stability of cobalt carbide in Fischer–Tropsch synthesis. J. Catal. 2014, 318, 193–202. [Google Scholar] [CrossRef]
  6. Yang, X.; Yang, J.; Zhao, T.; Qian, W.; Wang, Y.; Holmen, A.; Jiang, W.; Chen, D.; Ben, H. Kinetic insights into the effect of promoters on Co/Al2O3 for Fischer-Tropsch synthesis. Chem. Eng. J. 2022, 445, 136655. [Google Scholar] [CrossRef]
  7. Karaca, H.; Safonova, O.V.; Chambrey, S.; Fongarland, P.; Roussel, P.; Griboval-Constant, A.; Lacroix, M.; Khodakov, A.Y. Structure and catalytic performance of Pt-promoted alumina-supported cobalt catalysts under realistic conditions of Fischer–Tropsch synthesis. J. Catal. 2011, 277, 14–26. [Google Scholar] [CrossRef]
  8. Cheng, J.; Hu, P.; Ellis, P.; French, S.; Kelly, G.; Lok, C.M. Density functional theory study of iron and cobalt carbides for Fischer-Tropsch synthesis. J. Phys. Chem. C 2010, 114, 1085–1093. [Google Scholar] [CrossRef]
  9. Li, Z.; Zhong, L.; Yu, F.; An, Y.; Dai, Y.; Yang, Y.; Lin, T.; Li, S.; Wang, H.; Gao, P.; et al. Effects of sodium on the catalytic performance of CoMn catalysts for Fischer–Tropsch to olefin reactions. ACS Catal. 2017, 7, 3622–3631. [Google Scholar] [CrossRef]
  10. Zhong, L.; Yu, F.; An, Y.; Zhao, Y.; Sun, Y.; Li, Z.; Lin, T.; Lin, Y.; Qi, X.; Dai, Y.; et al. Cobalt carbide nanoprisms for direct production of lower olefins from syngas. Nature 2016, 538, 84–87. [Google Scholar] [CrossRef]
  11. Xiang, Y.; Kruse, N. Tuning the catalytic CO hydrogenation to straight- and long-chain aldehydes/alcohols and olefins/paraffins. Nat. Commun. 2016, 7, 13058. [Google Scholar] [CrossRef] [PubMed] [Green Version]
  12. Gnanamani, M.K.; Jacobs, G.; Shafer, W.D.; Sparks, D.E.; Hopps, S.; Thomas, G.A.; Davis, B.H. Low temperature water–gas shift reaction over alkali metal promoted cobalt carbide catalysts. Top. Catal. 2014, 57, 612–618. [Google Scholar] [CrossRef]
  13. Lin, T.; Yu, F.; An, Y.; Qin, T.; Li, L.; Gong, K.; Zhong, L.; Sun, Y. Cobalt carbide nanocatalysts for efficient syngas conversion to value-added chemicals with high selectivity. Acc. Chem. Res. 2021, 54, 1961–1971. [Google Scholar] [CrossRef] [PubMed]
  14. Lin, T.; Qi, X.; Wang, X.; Xia, L.; Wang, C.; Yu, F.; Wang, H.; Li, S.; Zhong, L.; Sun, Y. Direct production of higher oxygenates by syngas conversion over a multifunctional catalyst. Angew. Chem. Int. Ed. 2019, 58, 4627–4631. [Google Scholar] [CrossRef] [PubMed]
  15. Chen, W.; Filot, I.A.W.; Pestman, R.; Hensen, E.J.M. Mechanism of cobalt-catalyzed CO hydrogenation: 2. Fischer–Tropsch synthesis. ACS Catal. 2017, 7, 8061–8071. [Google Scholar] [CrossRef]
  16. Gholami, Z.; Gholami, F.; Tišler, Z.; Hubáček, J.; Tomas, M.; Bačiak, M.; Vakili, M. Production of light olefins via Fischer-Tropsch process using iron-based catalysts: A review. Catalysts 2022, 12, 174. [Google Scholar] [CrossRef]
  17. Davis, B.H.; Occelli, M.L. Advances in Fischer-Tropsch Synthesis, Catalysts, and Catalysis, 1st ed.; CRC press: Boca, Raton, 2009. [Google Scholar] [CrossRef]
  18. Xiao, Y.; Sun, P.; Cao, M. Core–Shell bimetallic carbide nanoparticles confined in a three-dimensional N-doped carbon conductive network for efficient lithium storage. ACS Nano 2014, 8, 7846–7857. [Google Scholar] [CrossRef]
  19. Pei, Y.-P.; Liu, J.-X.; Zhao, Y.-H.; Ding, Y.-J.; Liu, T.; Dong, W.-D.; Zhu, H.-J.; Su, H.-Y.; Yan, L.; Li, J.-L.; et al. High alcohols synthesis via Fischer–Tropsch reaction at cobalt metal/carbide interface. ACS Catal. 2015, 5, 3620–3624. [Google Scholar] [CrossRef]
  20. Moya-Cancino, J.G.; Honkanen, A.-P.; van der Eerden, A.M.J.; Oord, R.; Monai, M.; ten Have, I.; Sahle, C.J.; Meirer, F.; Weckhuysen, B.M.; de Groot, F.M.F.; et al. In Situ X-ray Raman scattering spectroscopy of the formation of cobalt carbides in a Co/TiO2 Fischer–Tropsch synthesis catalyst. ACS Catal. 2021, 11, 809–819. [Google Scholar] [CrossRef]
  21. Osa, A.R.; Lucas, A.; Valverde, J.; Romero, A.; Monteagudo, I.; Coca, P.; Sánchez, P. Influence of alkali promoters on synthetic diesel production over Co catalyst. Catal. Today 2011, 167, 96–106. [Google Scholar] [CrossRef]
  22. Lu, M.; Fatah, N.; Khodakov, A.Y. Optimization of solvent-free mechanochemical synthesis of Co/Al2O3 catalysts using low- and high-energy processes. J. Mater. Sci. 2017, 52, 12031–12043. [Google Scholar] [CrossRef]
  23. Peña, D.; Griboval-Constant, A.; Lecocq, V.; Diehl, F.; Khodakov, A.Y. Influence of operating conditions in a continuously stirred tank reactor on the formation of carbon species on alumina supported cobalt Fischer–Tropsch catalysts. Catal. Today 2013, 215, 43–51. [Google Scholar] [CrossRef]
  24. Yi, J.-H.; Sun, Y.-Y.; Gao, J.-F.; Xu, C.-Y. Synthesis of crystalline γ-Al2O3 with high purity. Trans. Nonferrous Met. Soc. China 2009, 19, 1237–1242. [Google Scholar] [CrossRef]
  25. Choi, Y.I.; Yang, J.H.; Park, S.J.; Sohn, Y. Energy storage and CO2 reduction performances of Co/Co2C/C prepared by an anaerobic ethanol oxidation reaction using sacrificial SnO2. Catalysts 2020, 10, 1116. [Google Scholar] [CrossRef]
  26. Xia, S.-G.; Zhang, Z.; Wu, J.-N.; Wang, Y.; Sun, M.-J.; Cui, Y.; Zhao, C.-L.; Zhong, J.-Y.; Cao, W.; Wang, H.; et al. Cobalt carbide nanosheets as effective catalysts toward photothermal degradation of mustard-gas simulants under solar light. Appl. Catal. B Environ. 2021, 284, 119703. [Google Scholar] [CrossRef]
  27. Petersen, A.P.; Claeys, M.; Kooyman, P.J.; van Steen, E. Cobalt-based Fischer–Tropsch synthesis: A kinetic evaluation of metal–support interactions using an inverse model system. Catalysts 2019, 9, 794. [Google Scholar] [CrossRef] [Green Version]
  28. van Ravenhorst, I.K.; Hoffman, A.S.; Vogt, C.; Boubnov, A.; Patra, N.; Oord, R.; Akatay, C.; Meirer, F.; Bare, S.R.; Weckhuysen, B.M. On the cobalt carbide formation in a Co/TiO2 Fischer–Tropsch synthesis catalyst as studied by high-pressure, long-term operando X-ray absorption and diffraction. ACS Catal. 2021, 11, 2956–2967. [Google Scholar] [CrossRef]
  29. Nuernberg, G.B.; Fajardo, H.V.; Mezalira, D.Z.; Casarin, T.J.; Probst, L.F.D.; Carreño, N.L.V. Preparation and evaluation of Co/Al2O3 catalysts in the production of hydrogen from thermo-catalytic decomposition of methane: Influence of operating conditions on catalyst performance. Fuel 2008, 87, 1698–1704. [Google Scholar] [CrossRef] [Green Version]
  30. Gao, B.; Wang, I.W.; Ren, L.; Haines, T.; Hu, J. Catalytic performance and reproducibility of Ni/Al2O3 and Co/Al2O3 mesoporous aerogel catalysts for methane decomposition. Ind. Eng. Chem. Res. 2019, 58, 798–807. [Google Scholar] [CrossRef]
  31. Fakeeha, A.H.; Ibrahim, A.A.; Khan, W.U.; Abasaeed, A.E.; Al-Fatesh, A.S. Hydrogen production by catalytic methane decomposition over Ni, Co, and Ni-Co/Al2O3 catalyst. Pet. Sci. Technol. 2016, 34, 1617–1623. [Google Scholar] [CrossRef]
  32. Saraswat, S.K.; Pant, K. Progressive loading effect of Co Over SiO2/Al2O3 catalyst for COx free hydrogen and carbon nanotubes production via catalytic decomposition of methane. Int. J. Chem. Mol. Eng. 2015, 9, 485–489. [Google Scholar] [CrossRef]
  33. Koerts, T.; Deelen, M.J.A.G.; van Santen, R.A. Hydrocarbon formation from methane by a low-temperature two-step reaction sequence. J. Catal. 1992, 138, 101–114. [Google Scholar] [CrossRef] [Green Version]
  34. Narkiewicz, U.; Podsiadły, M.; Jędrzejewski, R.; Pełech, I. Catalytic decomposition of hydrocarbons on cobalt, nickel and iron catalysts to obtain carbon nanomaterials. Appl. Catal. A Gen. 2010, 384, 27–35. [Google Scholar] [CrossRef]
  35. Pang, H.; Wang, X.; Zhang, G.; Chen, H.; Lv, G.; Yang, S. Characterization of diamond-like carbon films by SEM, XRD and Raman spectroscopy. Appl. Surf. Sci. 2010, 256, 6403–6407. [Google Scholar] [CrossRef]
  36. Matveev, V.V.; Baranov, D.A.; Yurkov, G.Y.; Akatiev, N.G.; Dotsenko, I.P.; Gubin, S.P. Cobalt nanoparticles with preferential hcp structure: A confirmation by X-ray diffraction and NMR. Chem. Phys. Lett. 2006, 422, 402–405. [Google Scholar] [CrossRef]
  37. Paterson, J.; Peacock, M.; Ferguson, E.; Purves, R.; Ojeda, M. In situ diffraction of Fischer–Tropsch catalysts: Cobalt reduction and carbide formation. Chem. Cat. Chem. 2017, 9, 3463–3469. [Google Scholar] [CrossRef]
  38. Kumar, C.V.; Pattammattel, A. Chapter 3-Characterization techniques for graphene. In Introduction to Graphene; Kumar, C.V., Pattammattel, A., Eds.; Elsevier: Amsterdam, The Netherlands, 2017; pp. 45–74. [Google Scholar]
  39. Fang, H.; Huang, T.; Sun, Y.; Kang, B.; Liang, D.; Yao, S.; Yu, J.; Dinesh, M.M.; Wu, S.; Lee, J.Y.; et al. Metal-organic framework-derived core-shell-structured nitrogen-doped CoCx/FeCo@C hybrid supported by reduced graphene oxide sheets as high performance bifunctional electrocatalysts for ORR and OER. J. Catal. 2019, 371, 185–195. [Google Scholar] [CrossRef]
  40. Xiong, J.; Ding, Y.; Wang, T.; Yan, L.; Chen, W.; Zhu, H.; Lu, Y. The formation of Co2C species in activated carbon supported cobalt-based catalysts and its impact on Fischer–Tropsch reaction. Catal. Lett. 2005, 102, 265–269. [Google Scholar] [CrossRef]
  41. Li, S.; Yang, C.; Yin, Z.; Yang, H.; Chen, Y.; Lin, L.; Li, M.; Li, W.; Hu, G.; Ma, D. Wet-chemistry synthesis of cobalt carbide nanoparticles as highly active and stable electrocatalyst for hydrogen evolution reaction. Nano Res. 2017, 10, 1322–1328. [Google Scholar] [CrossRef]
  42. Zhang, T.; Wu, J.; Xu, Y.; Wang, X.; Ni, J.; Li, Y.; Niemantsverdriet, J.W. Cobalt and cobalt carbide on alumina/NiAl(110) as model catalysts. Catal. Sci. Technol. 2017, 7, 5893–5899. [Google Scholar] [CrossRef]
  43. Bayer, B.C.; Bosworth, D.A.; Michaelis, F.B.; Blume, R.; Habler, G.; Abart, R.; Weatherup, R.S.; Kidambi, P.R.; Baumberg, J.J.; Knop-Gericke, A.; et al. In situ observations of phase transitions in metastable nickel (carbide)/carbon nanocomposites. J. Phys. Chem. C 2016, 120, 22571–22584. [Google Scholar] [CrossRef] [PubMed] [Green Version]
  44. Sarr, M.; Bahlawane, N.; Arl, D.; Dossot, M.; McRae, E.; Lenoble, D. Tailoring the properties of atomic layer deposited nickel and nickel carbide thin films via chain-length control of the alcohol reducing agents. J. Phys. Chem. C 2014, 118, 23385–23392. [Google Scholar] [CrossRef]
  45. Ferrari, A.C.; Robertson, J. Interpretation of Raman spectra of disordered and amorphous carbon. Phys. Rev. B 2000, 61, 14095. [Google Scholar] [CrossRef] [Green Version]
  46. Sfyris, D.; Sfyris, G.; Galiotis, C. Stress intrepretation of graphene E-2g and A-1g vibrational modes: Theoretical analysis. arXiv 2017, arXiv:1706.04465. [Google Scholar] [CrossRef]
  47. Tembre, A.; Hénocque, J.; Clin, M. Infrared and Raman spectroscopic study of carbon-cobalt composites. Int. J. Spectrosc. 2011, 2011, 186471. [Google Scholar] [CrossRef] [Green Version]
  48. Issi, J.-P.; Araujo, P.T.; Dresselhaus, M.S. Electron and phonon transport in graphene in and out of the bulk. In Physics of Graphene; Aoki, H., Dresselhaus, M.S., Eds.; Springer International Publishing: Cham, Switzerland, 2014; pp. 65–112. [Google Scholar] [CrossRef]
  49. Diallo, A.; Beye, A.C.; Doyle, T.B.; Park, E.; Maaza, M. Green synthesis of Co3O4 nanoparticles via Aspalathus linearis: Physical properties. Green Chem. Lett. Rev. 2015, 8, 30–36. [Google Scholar] [CrossRef] [Green Version]
  50. Rashad, M.; Rüsing, M.; Berth, G.; Lischka, K.; Pawlis, A. CuO and Co3O4 nanoparticles: Synthesis, characterizations, and Raman spectroscopy. J. Nanomater. 2013, 2013. [Google Scholar] [CrossRef] [Green Version]
  51. Jiang, J.; Li, L. Synthesis of sphere-like Co3O4 nanocrystals via a simple polyol route. Mater. Lett. 2007, 61, 4894–4896. [Google Scholar] [CrossRef]
  52. Hadjiev, V.G.; Iliev, M.N.; Vergilov, I.V. The Raman spectra of Co3O4. J. Phys. C Solid State Phys. 1988, 21, L199–L201. [Google Scholar] [CrossRef]
  53. Maaz, K. Cobalt; IntechOpen: London, UK, 2017; Available online: https://www.intechopen.com/books/6133 (accesses on 21 July 2022). [Google Scholar]
  54. Rivas-Murias, B.; Salgueiriño, V. Thermodynamic CoO-Co3O4 crossover using Raman spectroscopy in magnetic octahedron-shaped nanocrystals. J. Raman Spectrosc. 2017, 48, 837–841. [Google Scholar] [CrossRef]
  55. Xiao, T.-C.; York, A.P.E.; Al-Megren, H.; Williams, C.V.; Wang, H.-T.; Green, M.L.H. Preparation and characterisation of bimetallic cobalt and molybdenum carbides. J. Catal. 2001, 202, 100–109. [Google Scholar] [CrossRef]
  56. D’Ippolito, V.; Andreozzi, G.B. Linking crystal chemistry and physical properties of natural and synthetic spinels: An UV-VIS-NIR and Raman study. Ph.D. Thesis, Sapienza Universita di Roma, Rome, Italy, 2013. [Google Scholar]
  57. Mashkovtsev, R.I.; Thomas, V.G. Nitrogen atoms encased in cavities within the beryl structure as candidates for qubits. Appl. Magn. Reson. 2005, 28, 401–409. [Google Scholar] [CrossRef]
  58. Zhao, Y.; Yamaguchi, Y.; Liu, C.; Sekine, S.; Dou, X. Quantitative detection of ethanol/acetone in complex solutions using Raman spectroscopy based on headspace gas analysis. Appl. Spectrosc. 2018, 72, 280–287. [Google Scholar] [CrossRef] [PubMed]
  59. Hoekstra, J.; Beale, A.M.; Soulimani, F.; Versluijs-Helder, M.; Geus, J.W.; Jenneskens, L.W. Base metal catalyzed graphitization of cellulose: A combined Raman spectroscopy, Temperature-Dependent X-ray Diffraction and High-Resolution Transmission Electron Microscopy Study. J. Phys. Chem. C 2015, 119, 10653–10661. [Google Scholar] [CrossRef]
  60. Armenta, S.; Garrigues, S.; de la Guardia, M. Determination of iprodione in agrochemicals by infrared and Raman spectrometry. Anal. Bioanal. Chem. 2007, 387, 2887–2894. [Google Scholar] [CrossRef]
  61. Perelygin, I.S.; Itkulov, I.G. Spontaneous raman spectroscopic study of the association of liquid γ-butyrolactone molecules. J. Struct. Chem. 1996, 37, 928–932. [Google Scholar] [CrossRef]
  62. Ostrovskii, D.; Edvardsson, M.; Jacobsson, P. Weak polymer–electrolyte interaction revealed by Fermi resonance perturbed Raman bands. J. Raman Spectrosc. 2003, 34, 40–49. [Google Scholar] [CrossRef]
  63. Thombare, J.V.; Lohar, G.M.; Shinde, S.K.; Dhasade, S.S.; Rath, M.C.; Fulari, V.J. Synthesis, characterization and surface wettability study of polypyrrole films: Effect of applied constant current density. Electron. Mater. Lett. 2015, 11, 266–270. [Google Scholar] [CrossRef]
  64. Dai, Y.; Zhao, Y.; Lin, T.; Li, S.; Yu, F.; An, Y.; Wang, X.; Xiao, K.; Sun, F.; Jiang, Z.; et al. Particle size effects of cobalt carbide for Fischer–Tropsch to olefins. ACS Catal. 2019, 9, 798–809. [Google Scholar] [CrossRef]
  65. ten Have, I.C.; Weckhuysen, B.M. The active phase in cobalt-based Fischer-Tropsch synthesis. Chem. Catal. 2021, 1, 339–363. [Google Scholar] [CrossRef]
  66. Lyu, S.; Wang, L.; Zhang, J.; Liu, C.; Sun, J.; Peng, B.; Wang, Y.; Rappé, K.G.; Zhang, Y.; Li, J.; et al. Role of active phase in Fischer–Tropsch synthesis: Experimental evidence of CO activation over single-phase cobalt catalysts. ACS Catal. 2018, 8, 7787–7798. [Google Scholar] [CrossRef]
  67. Liu, J.-X.; Su, H.-Y.; Sun, D.-P.; Zhang, B.-Y.; Li, W.-X. Crystallographic dependence of CO activation on cobalt catalysts: HCP versus FCC. J. Am. Chem. Soc. 2013, 135, 16284–16287. [Google Scholar] [CrossRef] [PubMed]
  68. Chen, P.-P.; Liu, J.-X.; Li, W.-X. Carbon monoxide activation on cobalt carbide for Fischer–Tropsch synthesis from first-principles theory. ACS Catal. 2019, 9, 8093–8103. [Google Scholar] [CrossRef]
  69. Weller, S.; Hofer, L.J.E.; Anderson, R.B. The role of bulk cobalt carbide in the Fischer–Tropsch synthesis. J. Am. Chem. Soc. 1948, 70, 799–801. [Google Scholar] [CrossRef]
Figure 1. SEM images of the 5CoCx/Al2O3 catalysts prepared at different temperatures, (a) 300 °C, (b) 400 °C, (c) 500 °C, (d) 600 °C, (e) 700 °C, (f) 800 °C.
Catalysts 12 01222 g001
Figure 2. (a) XRD patterns of 5CoCx/Al2O3 and catalysts prepared at different temperatures, (b) Content of individual phases according to SQ performed from XRD spectra (C-carbon, Co-cobalt, Co2C-carbide) and carbon content determined by elemental analysis (elemC).
Catalysts 12 01222 g002aCatalysts 12 01222 g002b
Figure 3. (a) C 1s spectra, and (b) Co 2p spectra of CoCx/Al2O3 catalysts prepared at different temperatures.
Catalysts 12 01222 g003
Figure 4. Raman spectrum of the catalysts prepared at different carbidation temperatures.
Catalysts 12 01222 g004
Figure 5. The gaseous and liquid product distributions after FT reaction at 230 °C and 6 h of reaction (a) without reduction with H2, (b) reduced with H2 (WR: without reduction step, R: with reduction step).
Catalysts 12 01222 g005
Figure 6. Gaseous product distribution in the FT reaction carbide catalysts: (a) hydrocarbon distribution, (b) alkanes distribution, and (c) alkenes distribution (WR: without reduction step, R: with reduction step).
Catalysts 12 01222 g006
Figure 7. (a) Product distribution in liquid phase products, (b) distribution of n-alkanes, and (c) alkenes in the liquid phase products (WR: without reduction step, R: with reduction step).
Catalysts 12 01222 g007aCatalysts 12 01222 g007b
Table 1. XPS data analysis of C 1s and Co2p peaks of CoCx/Al2O3 catalysts.
C 1sCo 2p
Co-C
Peak BE (eV)
C-C
Peak BE (eV)
C-C/Co-CCo-C
Peak BE (eV)
Co0/Co-C
CoCx/Al2O3-300 °C283.2284.70.63778.5 (2p3/2)
796.3 (2p1/2)
1.68
CoCx/Al2O3-400 °C283.3284.71.49778.6 (2p3/2)
796.4 (2p1/2)
2.08
CoCx/Al2O3-500 °C283.1284.50.99778.7 (2p3/2)
796.3 (2p1/2)
2.85
CoCx/Al2O3-600 °C283.2284.82.36778.7 (2p3/2)
796.4 (2p1/2)
2.67
CoCx/Al2O3-700 °C283.3284.66.10778.5 (2p3/2)
796.7 (2p1/2)
2.70
CoCx/Al2O3-800 °C283.3284.414.26778.6 (2p3/2)
796.0 (2p1/2)
1.49
Table 2. Raman spectra for carbonaceous materials observed in the prepared catalysts.
CatalystDGG′ID/IG
Peak Position
(cm−1)
IntensityPeak Position
(cm−1)
IntensityPeak Position
(cm−1)
Intensity
CoCx/Al2O3-300 °C
CoCx/Al2O3-400 °C
CoCx/Al2O3-500 °C
CoCx/Al2O3-600 °C
CoCx/Al2O3-700 °C134018.8157316.0267711.11.18
CoCx/Al2O3-800 °C134145.0157335.1267719.11.28
Publisher’s Note: MDPI stays neutral with regard to jurisdictional claims in published maps and institutional affiliations.

