Article

Decorating Zirconium on Graphene Oxide to Design a Multifunctional Nanozyme for Eco-Friendly Detection of Hydrogen Peroxide

by
Ayesha Saleem Siddiqui
1,2,
Muhammad Ashfaq Ahmad
1,
Mian Hasnain Nawaz
2,
Akhtar Hayat
2,* and
Muhammad Nasir
2,*
1
Department of Physics, COMSATS University Islamabad, Lahore Campus, 1.5 km Defence Road, Off Raiwind Road, Lahore 54000, Pakistan
2
Interdisciplinary Research Centre in Biomedical Materials, COMSATS University Islamabad, Lahore Campus, 15 km Defence Road, Off Raiwind Road, Lahore 54000, Pakistan
*
Authors to whom correspondence should be addressed.
Catalysts 2022, 12(10), 1105; https://doi.org/10.3390/catal12101105
Submission received: 1 September 2022 / Revised: 19 September 2022 / Accepted: 22 September 2022 / Published: 25 September 2022
(This article belongs to the Special Issue Hybrid Nanozymes: From Concept to Biomedical Applications)

Abstract

:
Peroxidase enzymes are crucial in analytical chemistry owing to significant peroxide analytes and their key role in hydrogen peroxide (H2O2) detection. Therefore, exploiting appropriate catalysts for the peroxidase like reactions has become crucial for achieving desired analytical performance. Zirconium (Zr) has attracted growing interest, as a safe and stable potential eco-friendly catalyst for various organic transformations that address increasing environmental challenges. Hence, aiming at fast, sensitive and selective optical detection of H2O2, a colorimetric platform is presented here, based on the excellent peroxidase enzyme-like activity of Zr decorated on graphene oxide (GO). The synergistic effect achieved due to intimate contact between an enzyme like Zr and the high surface area 0f GO ensures efficient electron transfer that increases the chemical and catalytic activity of the composite and advances the decomposition of H2O2 into hydroxyl radicals. The designed probe, thus, efficiently catalyzes the oxidation of 3,3′,5,5′-tetramethylbenzidine (TMB), via hydroxyl radicals, thereby transforming the colorless TMB into blue oxidized TMB within 2 min. The catalytic mechanism of the Zr-GO enzyme mimic is proposed herein and verified using a fluorescent probe terephthalic acid (TA) and other scavenger experiments. The multifunctional optical probe allows sensitive and highly selective recognition of H2O2 in a linear range from 100 to 1000 µM with a low detection limit of 0.57 µM. Essentially, the direct accessibility of Zr prevents having to use the complicated preparation and purification procedures mostly practiced for conventional biozymes and nanozymes. The devised method offers several gains, including being green and an inexpensive catalyst, having lower LOD, being fast, cost-effective and sensitive, and having selective work-up procedures.

Graphical Abstract

1. Introduction

Hydrogen peroxide (H2O2) is a vital product and signal molecule in a variety of biochemical reactions and conditions, such as cancer, senescence, apoptosis and heart attack [1,2]. Its characteristics bestow H2O2 with indispensable applications in numerous industries, including chemical synthesis, health care, clinical diagnosis, pharmaceuticals, catering, textiles, mining and the environment [1,2,3,4]. Besides being an essential byproduct and mediator in biochemical systems [4,5], it is a crucial reactive oxygen species, and intracellular H2O2 levels are important to distinguish between normal and cancerous cells [1]. Therefore, rapid and sensitive detection of H2O2 is critical for academic and practical research purposes [3,5]. Current H2O2 measurement techniques include fluorescence spectrometry, colorimetry, chemiluminescence and electrochemistry. Among these techniques, colorimetric strategies are an attractive choice, due to their simplicity, cost effectiveness, facile operation, on-site analysis and less reliance on expensive equipment and trained personnel [1,3,4].
Peroxidase enzymes, employed in several industries, are useful for colorimetric H2O2 determination, owing to their high efficiency and specificity [2]. However, despite their salient features, the application of peroxidases are strictly confined, due to their harsh application environments, poor stability, time-consuming preparation, tedious purification processes and high synthesis costs [1,2,6,7]. Thus, enzyme mimics or nano-enzymes are the new frontier for H2O2 determination and are accounted as strong substitutes to natural enzymes [8], due to their high stability and sensitivity, cost-effectiveness, adaptable catalytic activities and application conditions [2,6,7]. As yet, a succession of metallic and bi-metallic nanoparticles, carbon nanomaterials, metal chalcogenides, noble metal nanomaterials and nanocomposites have been applied as peroxidase mimics [2,4]. However, due to the boosted scientific and industrial demand, the development of innovative catalysts and nanozymes for efficient colorimetric detection of H2O2 [9,10] with simple synthesis methods, higher efficiency, sensitivity and affinity is still needed and essential [11,12,13].
Recently, zirconium chemistry has garnered intensive research interest due to zirconium’s intrinsic catalytic properties. Zirconium (Zr) is less costly and readily available since its compounds are abundant in the Earth’s crust [14]. Among the various Zr compounds, the distinctive properties and merits of Zirconium chloride (ZrCl4) and Zirconyl chloride (ZrOCl2) have gained particular attention [15]. ZrCl4 has a tendency to hydrolyze in aqueous systems, because of its high positive valence and relatively small atomic radii [16]. When dissolved in water, it undergoes an immediate hydrolysis producing ZrOCl2 and hydrochloric acid (HCl) [16,17]. ZrOCl2 is a highly water-tolerant compound and serves as a convenient medium, as well as a green Lewis acid in solvents [14,15,17]. Hence, its availability, low cost, low toxicity, safe catalytic activity, and good general stability makes Zr a potential environment-friendly catalyst for different chemical reactions that entertain growing environmental concerns [14,15,18].
An efficient means of analyte detection is the designing of novel sensing materials, based on the synergistic effects of multiple composites. Graphene oxide (GO), is the foremost choice of researchers these days in this regard [19,20]. Its unique 2-D honeycomb structure with superb optical, electronic, thermal, and physiochemical properties, such as large surface area, chemically active sites, ease of modification etc., has established it as a substantial platform to develop customized composites [21,22] for desired sensing applications [22,23,24].
In view of all these facts, we designed an eco-friendly colorimetric platform for fast and specific visual recognition of H2O2, utilizing the excellent peroxidase-like activity of Zirconium decorated graphene oxide (Zr-GO). In this work, Zr has been loaded on GO to attain the successful synergistic effect of both materials, particularly the intrinsic enzyme-like features of Zr and the remarkable physiochemical features of GO. The brilliant enzyme mimicking properties of Zr are herein demonstrated, for the first time, and applied for the non-enzymatic colorimetric detection of the target analyte, H2O2, by a simple blend-and-detect approach. Hydrolysis of the green catalyst ZrCl4 in DI water consequently produces Zr moieties. This facile approach with Zr allows its direct application for H2O2 assay without any complicated and time-consuming procedures. The adsorption of the potential catalyst Zr on the large surface areas of GO sheets offers enhanced electron transfer and chemically active catalytic sites, thereby increasing the surface reactivity of the composite. The synergistic effect of Zr-GO can effectively trigger the peroxidase reaction within 2 min, by breaking H2O2 into hydroxyl radicals that rapidly oxidize colorless TMB to give a blue color, indicating the commencement of the reaction. This system works well at room temperature and in a neutral water medium. The color change of the system is quite visible, even at very low concentrations, and shifts from light blue to greenish blue to greenish yellow and, finally, yellow as the concentration of Zr increases gradually. The catalytic mechanism of the Zr-GO composite is explained and verified using a fluorescent probe terephthalic acid (TA) and other scavenger experiments. The proposed high efficiency Zr-GO enzyme mimic offers phenomenal selectivity and sensitivity towards H2O2, with a low detection limit of 0.57 µM, owing to its enhanced electron mobility and catalytic activity. The suggested method, using a green and inexpensive catalyst, is clean, environmentally benign and offers several advantages, including no tedious sample preparation, lower limit of detection (LOD), low cost and easy analytical operation. We anticipate that the superiorities of the developed system endow this facile and green colorimetric platform with great potential in the fields of non-enzymatic biosensing and clean environmental monitoring.

2. Results and discussion

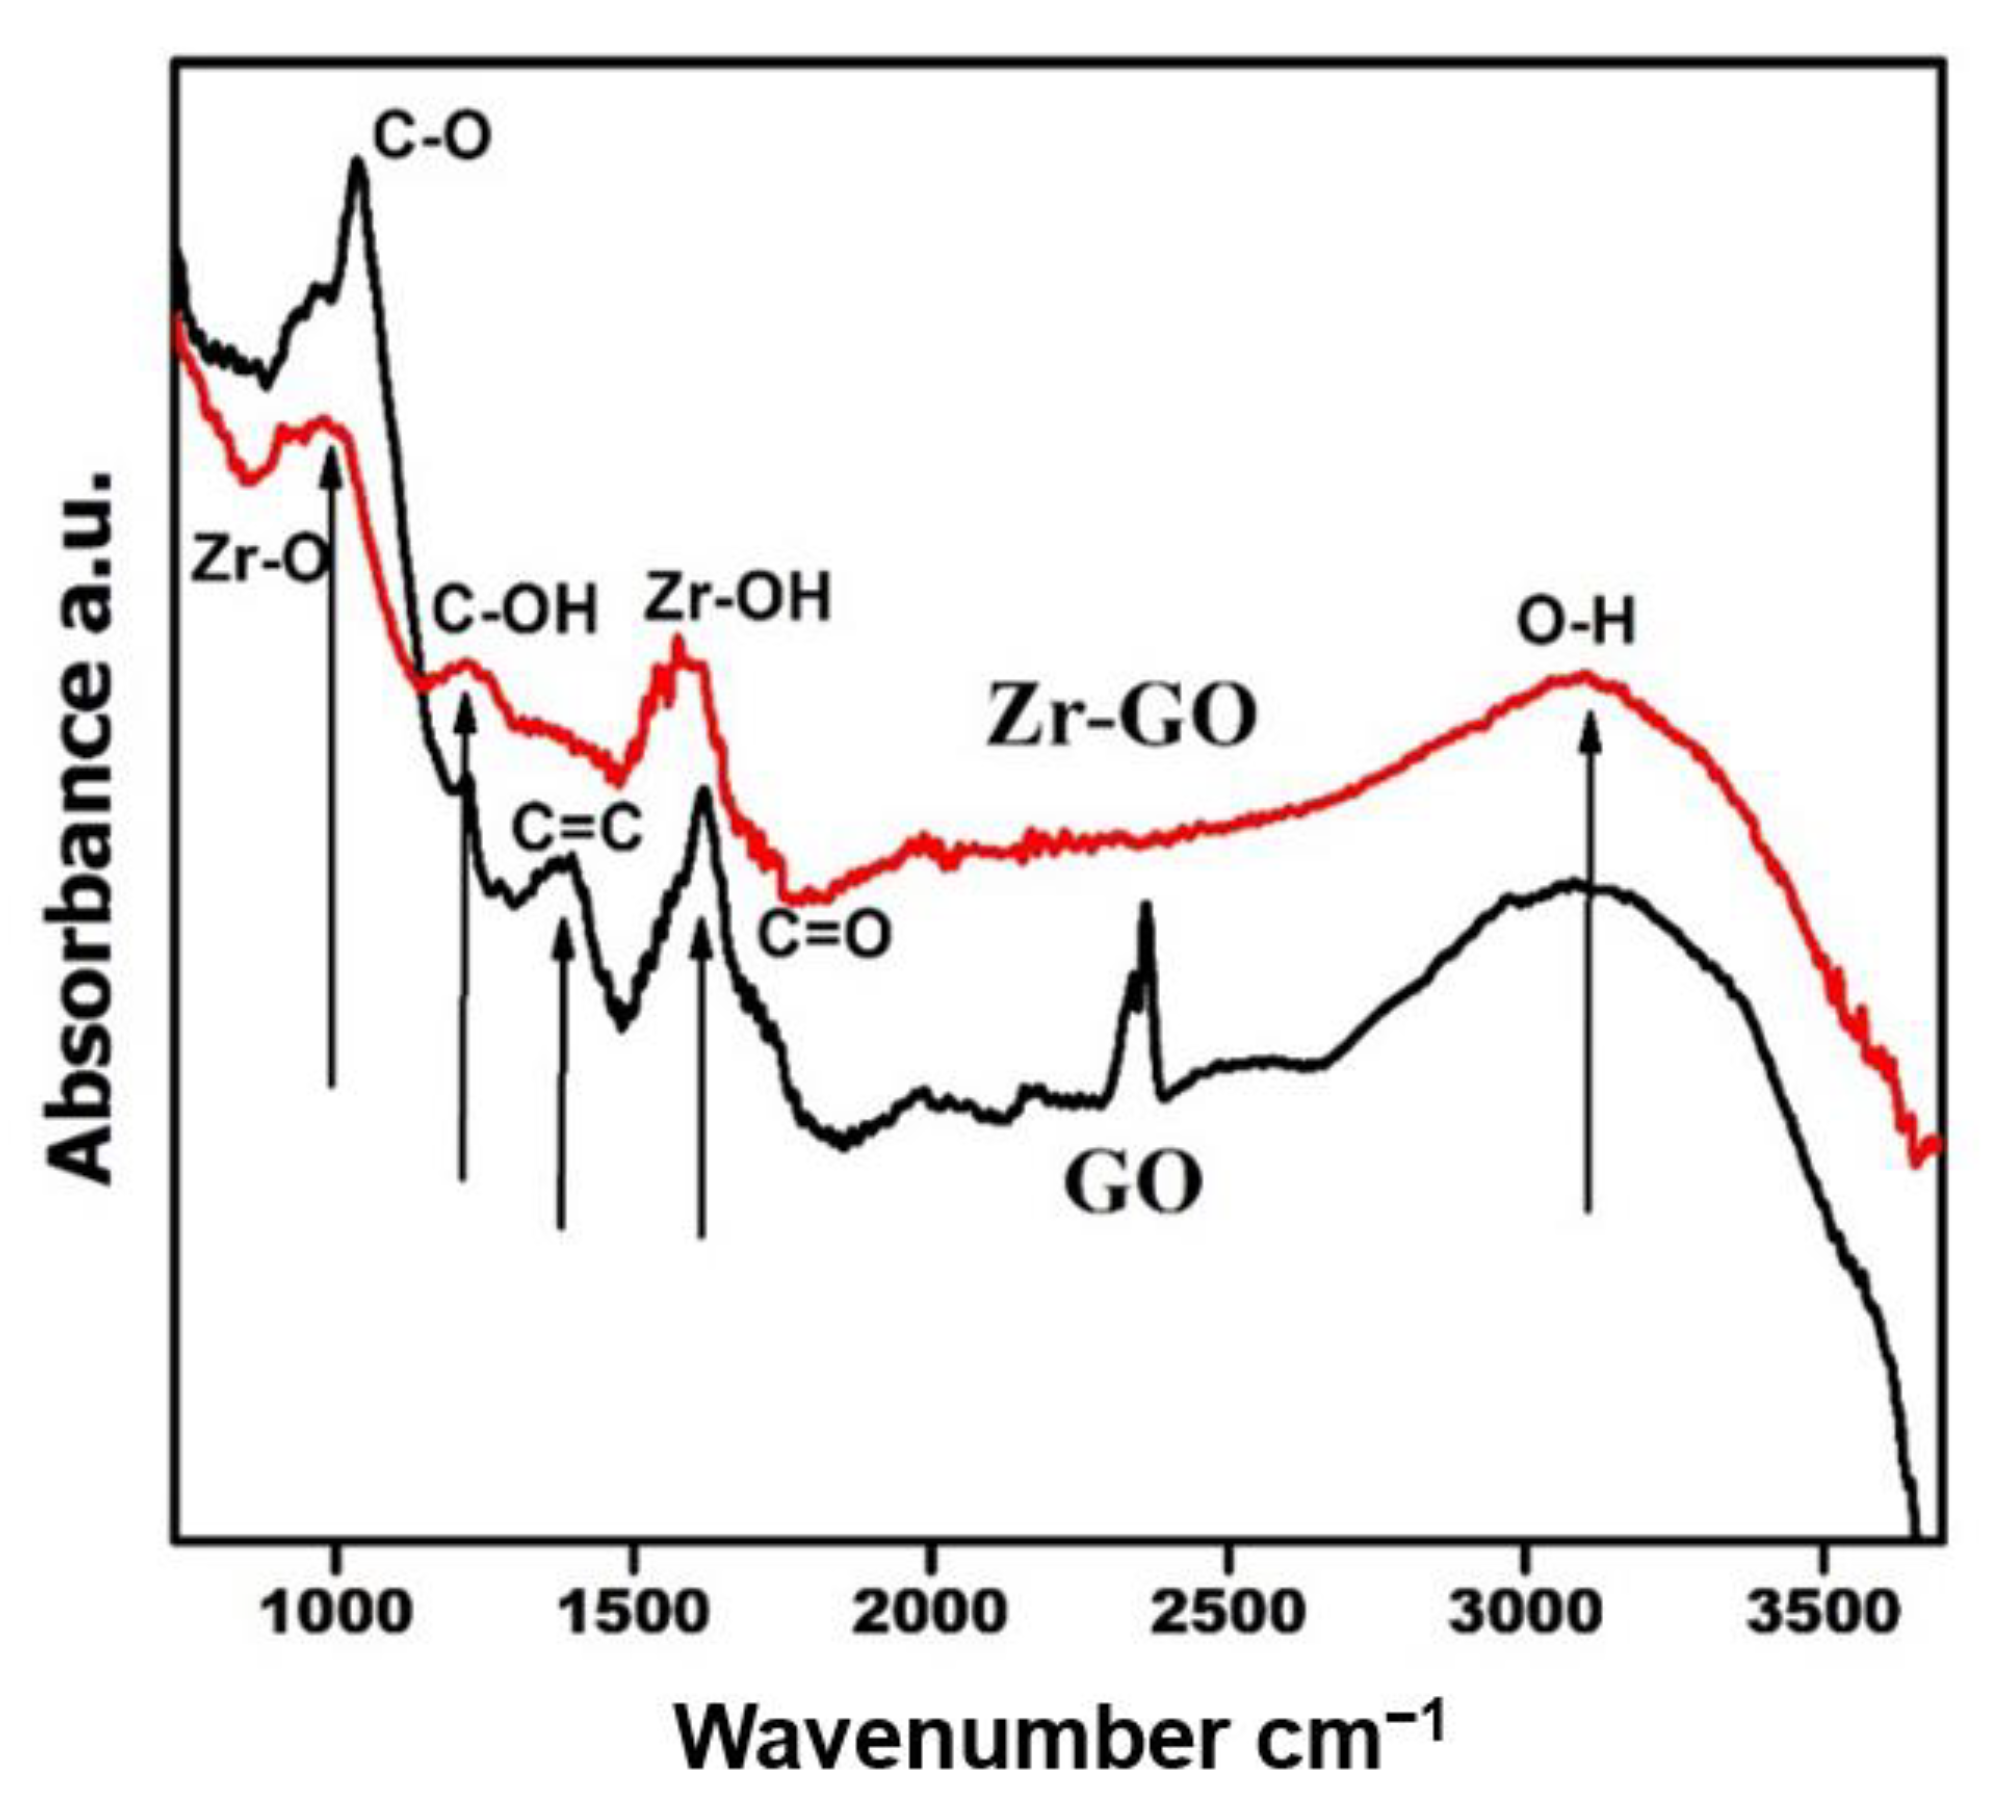
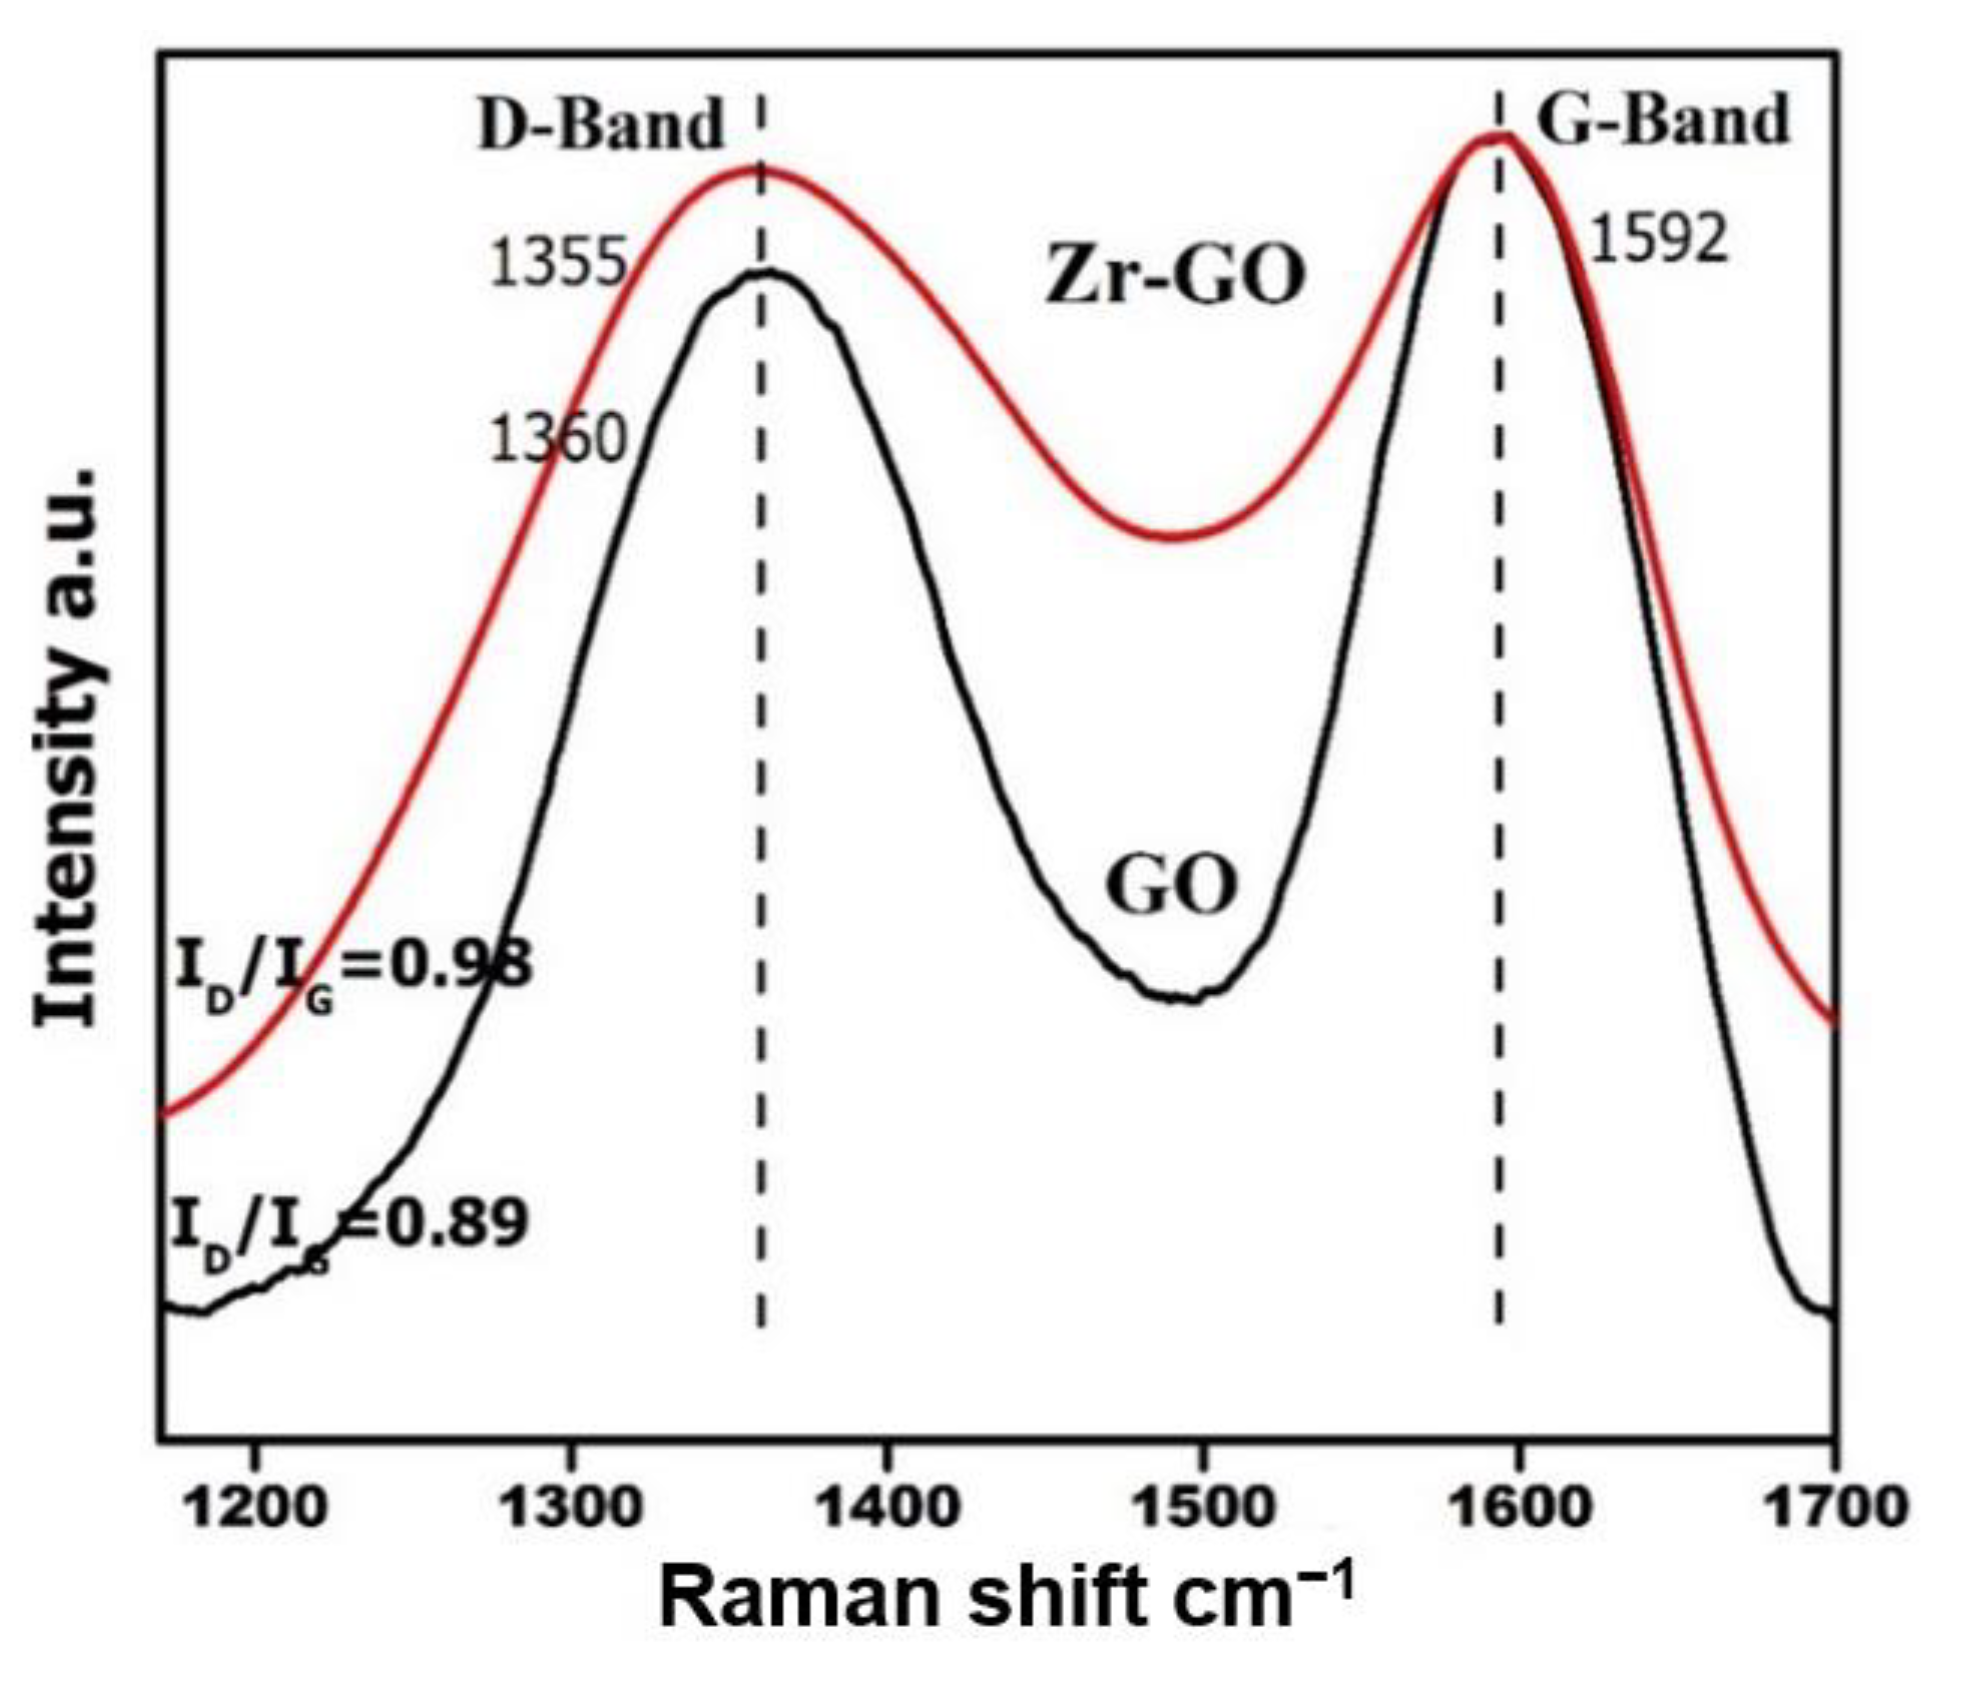
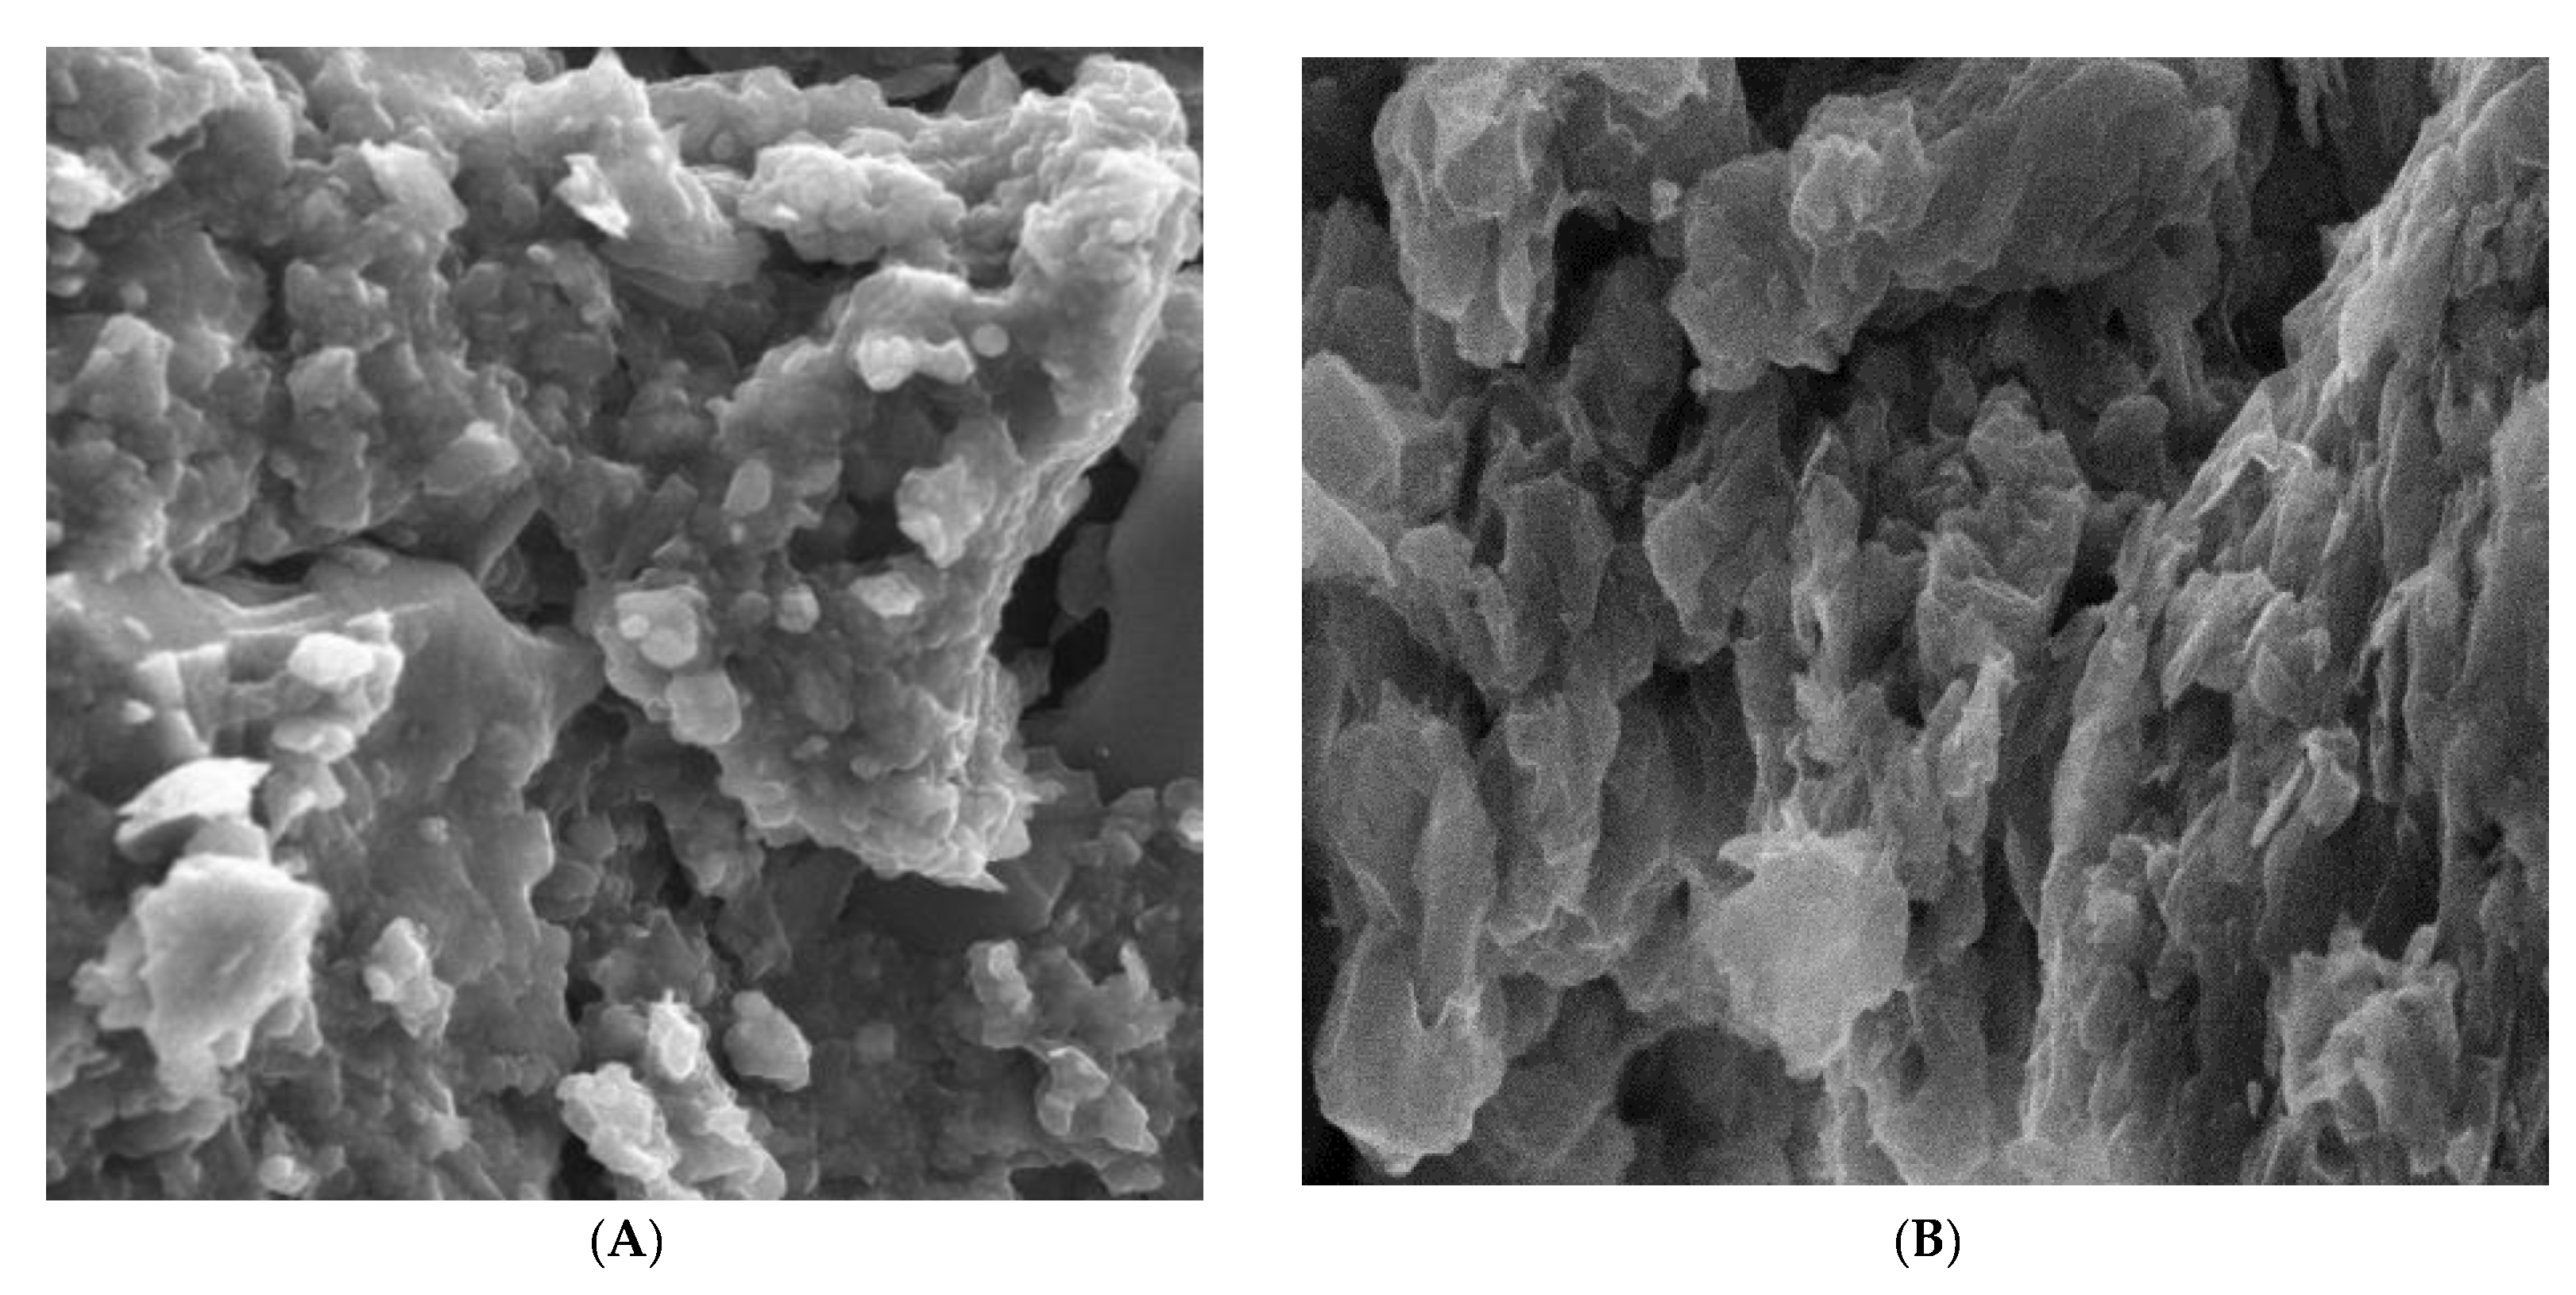
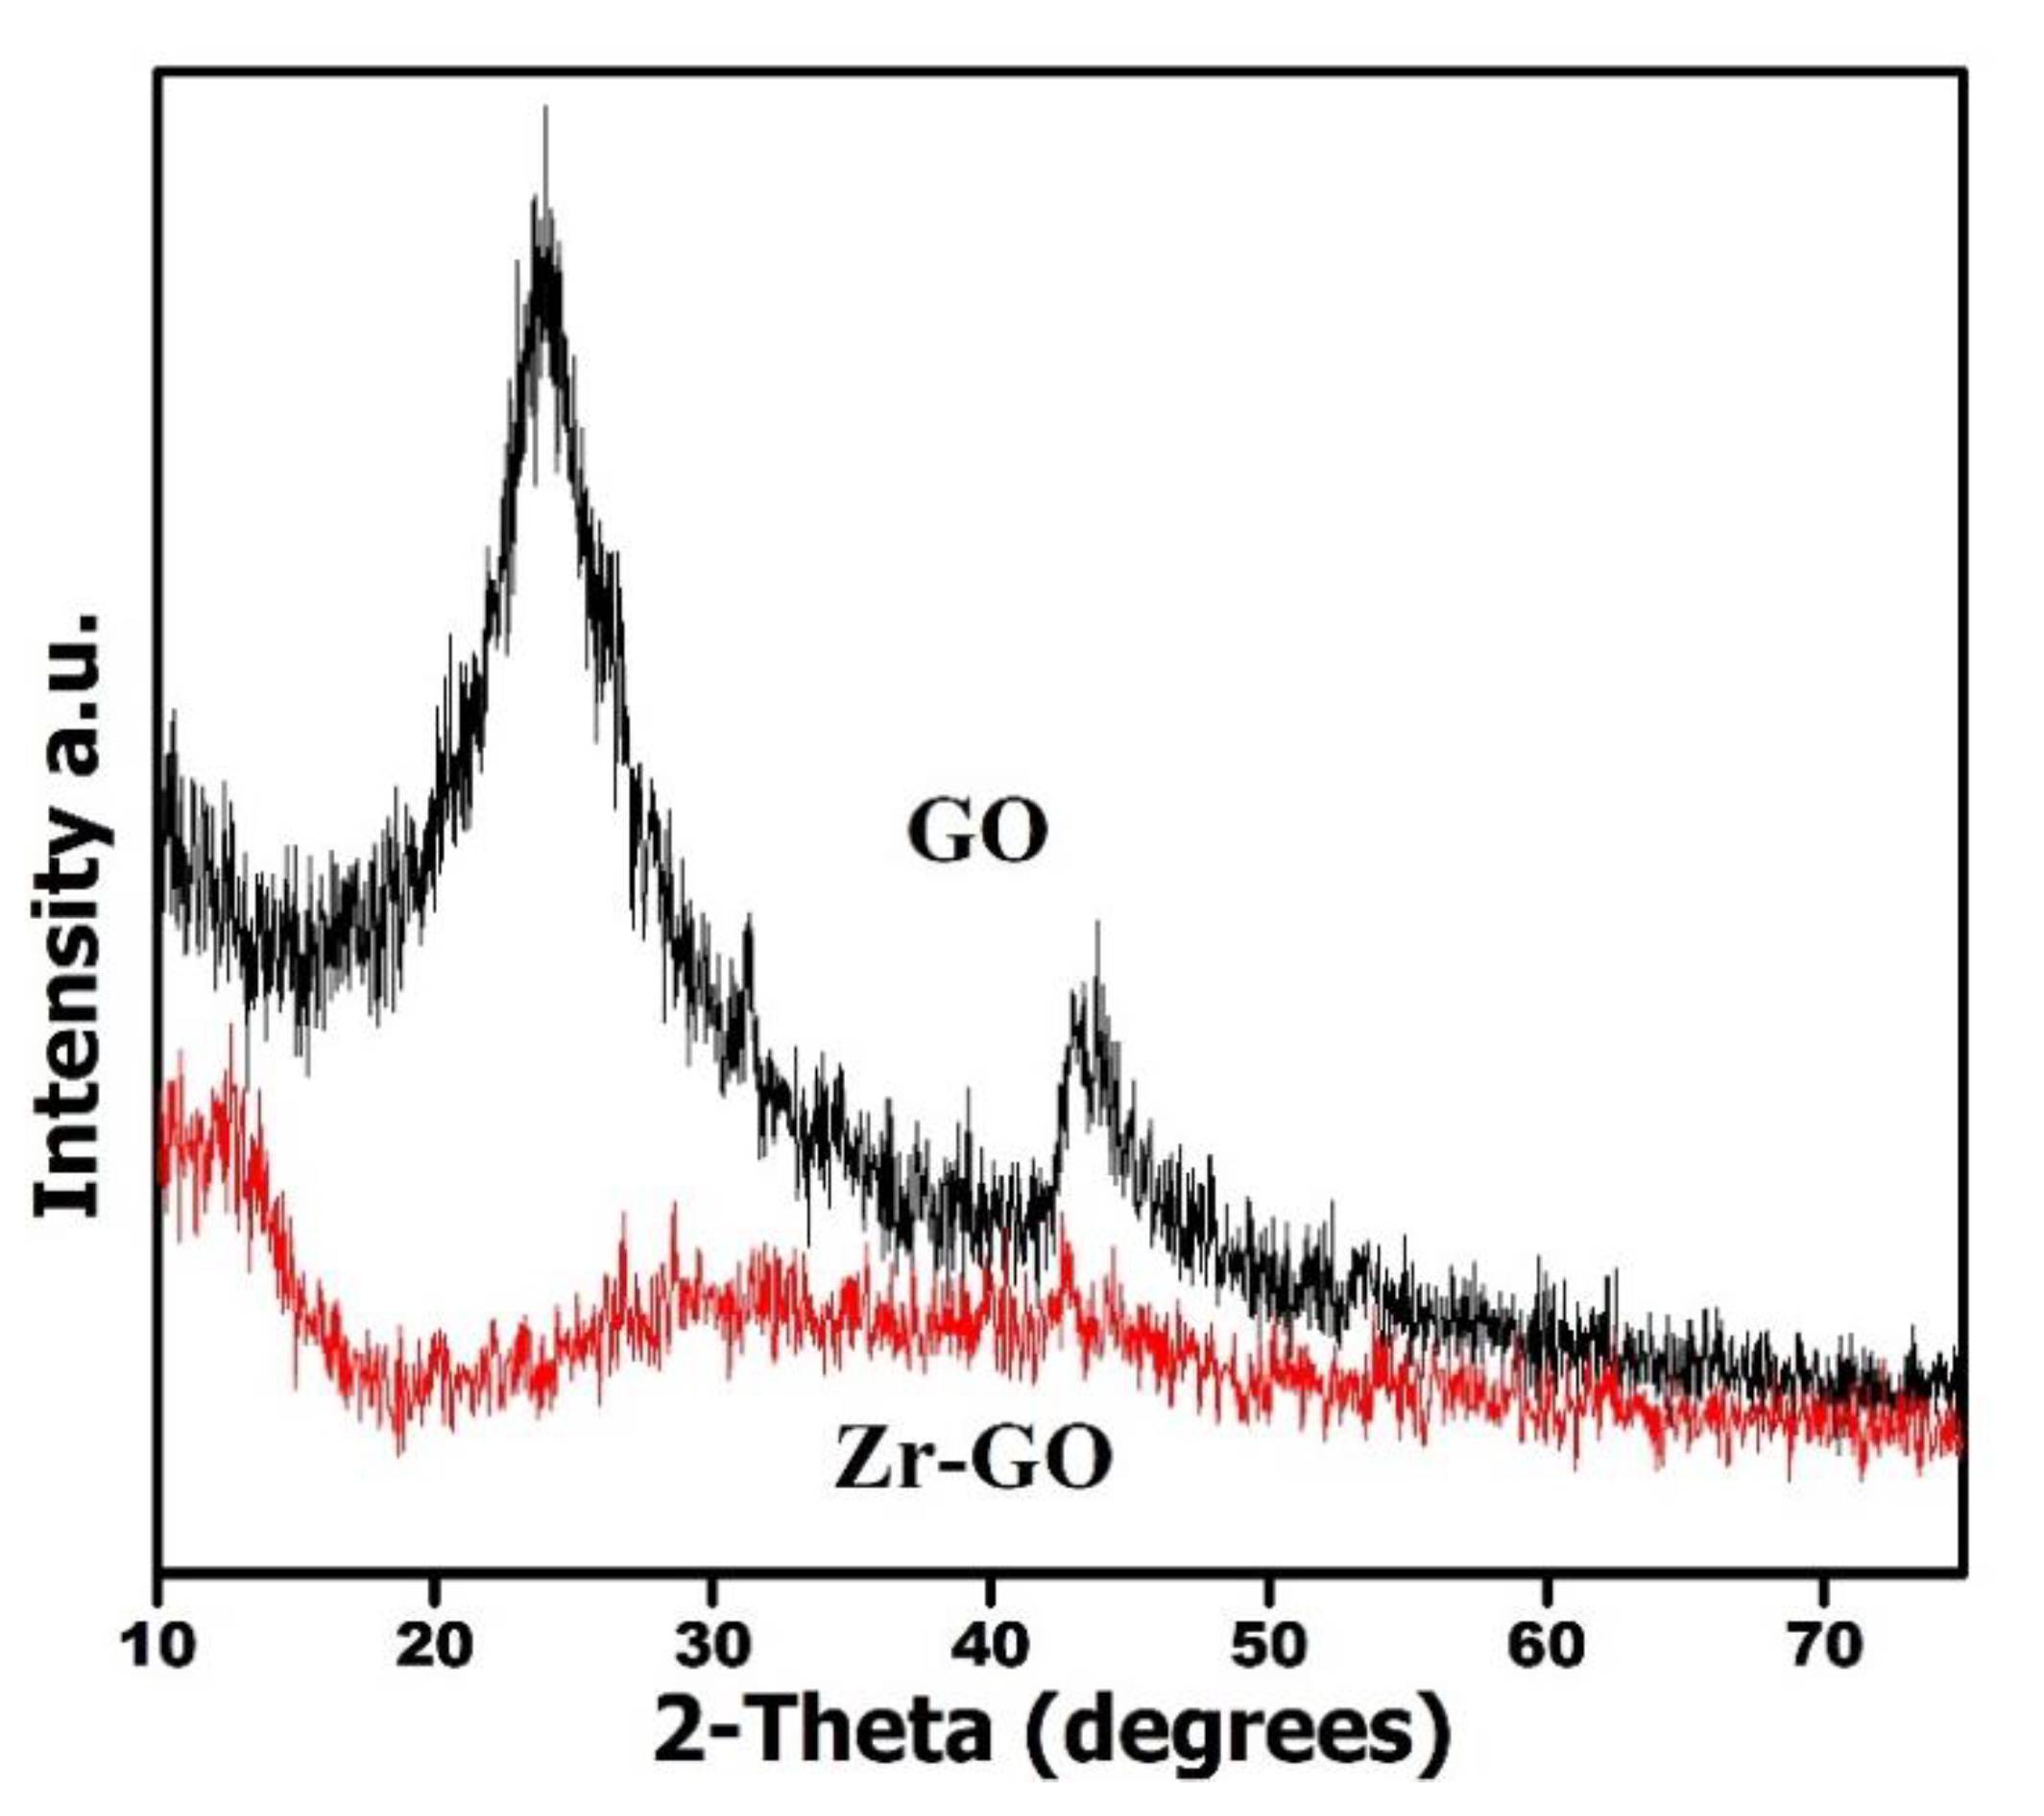
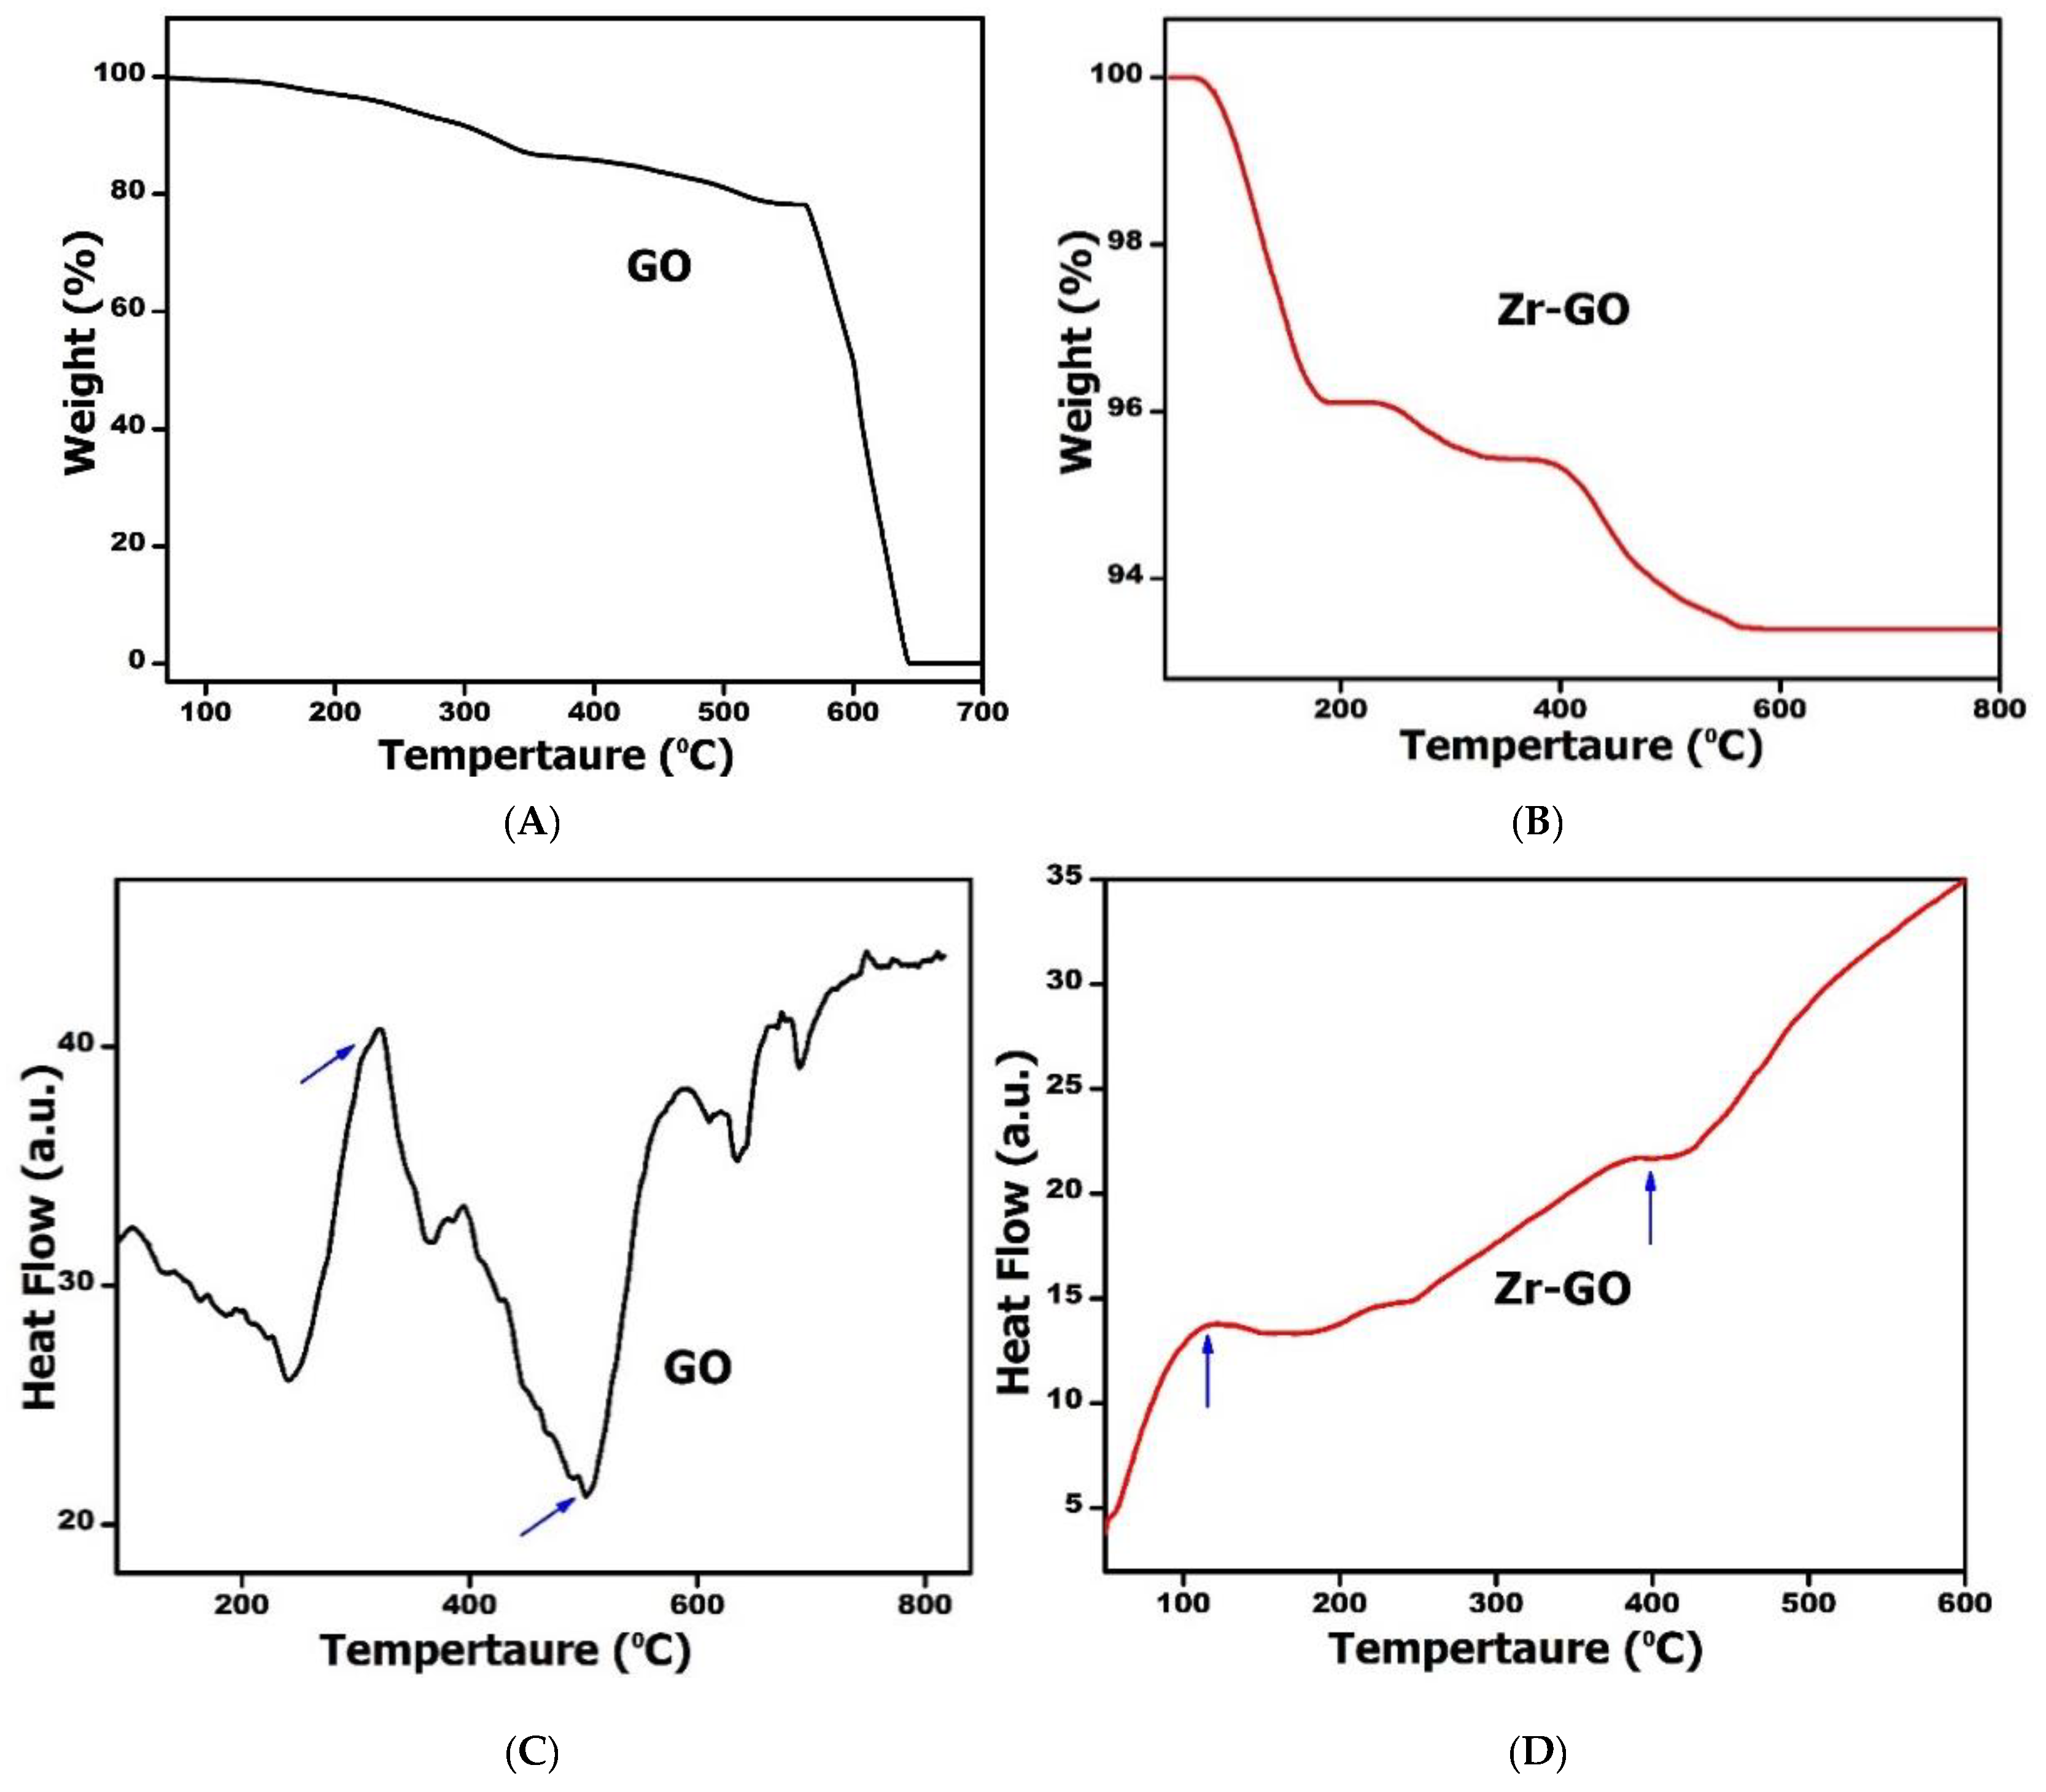
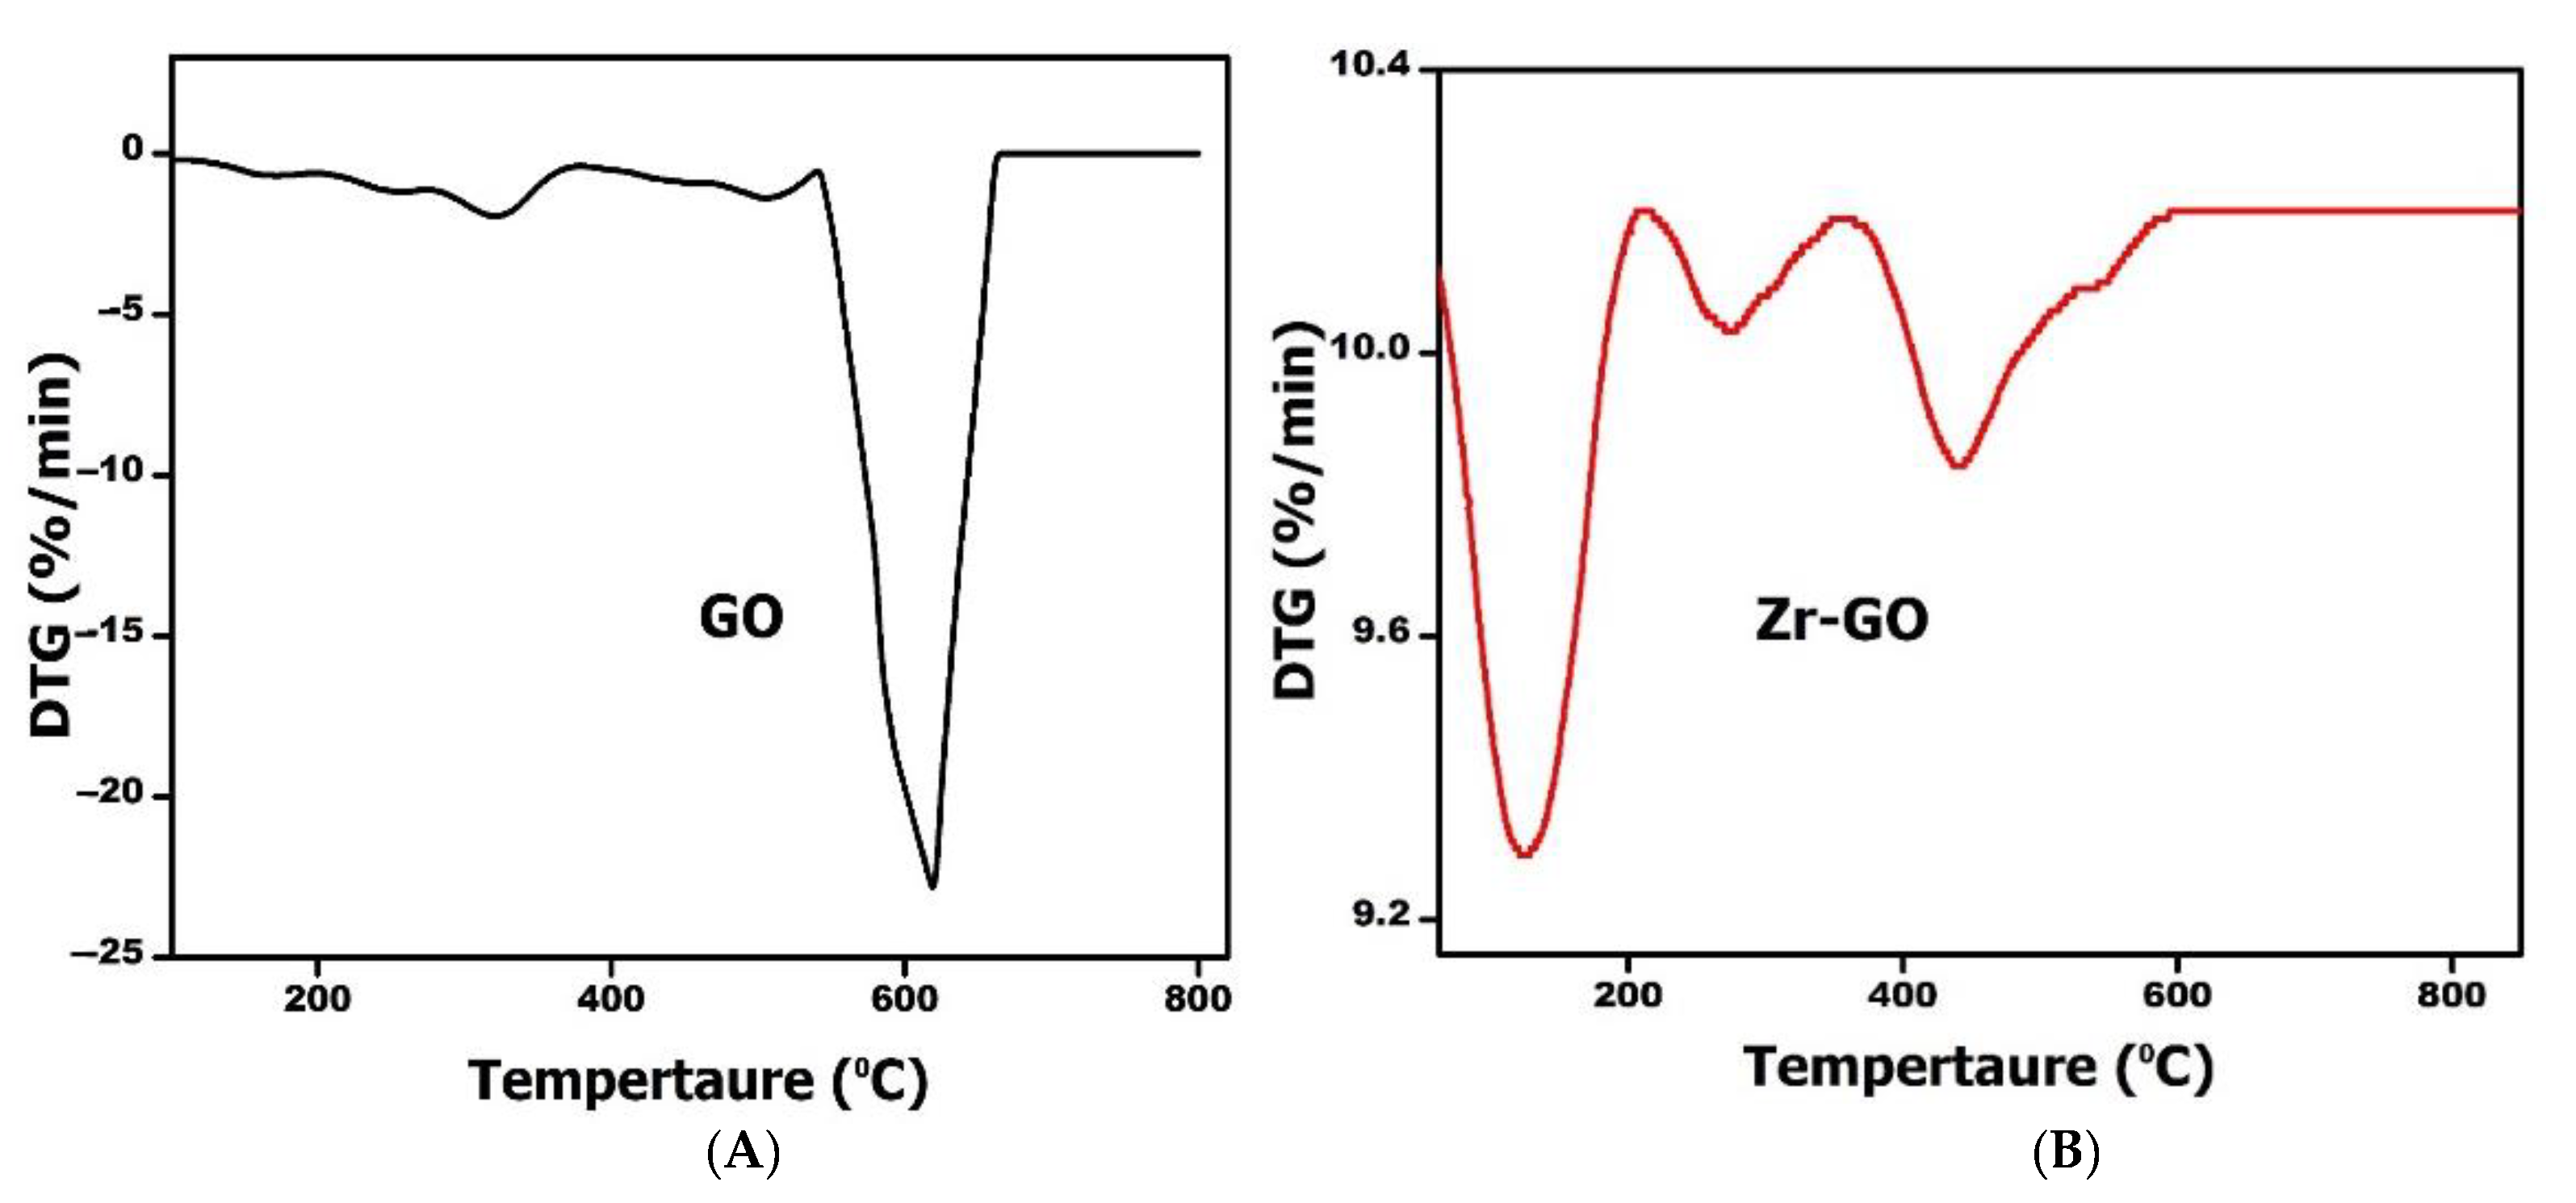
2.1. Characterization

The absorption spectra of GO display its characteristic peak at 230 nm (Figure 1A). In the UV-Vis spectrum of Zr-GO, there was an increase in the absorbance and width of characteristic peak of GO at 230 nm, which might have been attributed to the interactions between Zr and GO. Another notable peak also appeared at ~280 nm (Figure 1B), which affirmed the presence and adsorption of Zr onto the surface of GO, which probably stabilized the surface of the Zr-GO composite.
Fourier transform infra-red spectroscopy was deployed to fingerprint the identified elements existing in the sample. Figure 2 represents the FTIR spectra of GO and of the Zr-GO composite. In the GO spectrum, a broad absorption band established at around 3200 cm−1 was assigned to the stretching vibration of OH, which likely contributed to the water adsorbed on the GO surface [25]. Some absorptions were noticed at 1620 cm−l (C=O), 1386 cm−l (C=C), 1222 cm−l (COOH), and 1040 cm−1 (C-O-C), evidencing the oxidation of graphite into GO [26]. As for the spectrum of Zr-GO, the peak at 3200 cm-l corresponded to stretching vibration of OH which corresponded to the presence of water molecules formed in accordance with hydrogen bond formation [27]. The peak at 1575 cm−1 could be attributed to deformation vibrations of Zr-OH. The peak at 987 cm−1 could probably be ascribed to the presence of ZrO bending vibrations [2,26]. The concentration of ZrCl4 was kept high in the GO solution (~80:20) to get enough Zr moieties on the GO matrix. These Zr moieties possibly removed some of the oxygen from the GO sheets to sit on those sites. This removal could be evidenced by the significant reduction of typical intensities of some of the oxygen-containing GO peaks in the Zr-GO spectrum [27]. These findings illustrated the successful furnishing of the GO surface with Zr, and confirmed that the Zr-GO composite had indeed been obtained.
Raman spectroscopy provides a characteristic spectrum for materials reliant on the vibrational modes of their molecules. The analysis was utilized as an efficient means to ascertain the composition of the Zr-GO. The appearance of the two D and G bands (Figure 3) at 1360 and 1592 cm−1 was the main characteristic of a Raman spectrum of graphene, indicating the presence of carbon [28]. Carbon, owing to its excellent electrical conductivity, enhances the photoelectron transfer mechanism in the Zr-GO composite [29]. The Raman spectra acquired for the composite at room temperature reaffirmed the existence of the two well-defined and distinct D and G bands. The broad carbon peaks originating from Zr insertions in the GO matrix at around 1355 and 1592 cm−1, along with a shift to the left of the D band from 1360 to 1355 cm− 1, indicated poor crystallization which was comparable to amorphous sp2 bonded carbon [30,31,32].
The first band (D-band) occurring around 1355 cm−1 was related to defects in the sample. The origination of this band involved an optical transverse phonon that propagated in the material plane, due to inelastic scattering, and defects due to elastic scattering [31]. The high intensity of the D-band observed in the spectrum of Zr-GO might be related to the fact that the material used in this work was supported on amorphous activated carbon, with a wide range of defects in its structure. This significantly altered the vibration of the Raman spectrum and increased the contribution of the D band [31].
The second and more characteristic band of graphene, occurring at 1592 cm−1 (G-band), was associated with optical phonons between two different atoms of a unit cell and corresponded to the in-plane vibrations of C–C bonds on the sp2 plane of the carbon atoms [31]. This meant that the developed Zr-GO structure contained some level of impurities and carbon vacancies in the composite structure that interfered with the local symmetry, allowing the defect-induced Raman scattering to be detected.
Scanning electron microscopy (SEM) was applied for the characterization of the Zr-GO composite from the viewpoint of morphology and structural analysis. Figure 4 displays the representative SEM images of GO and the Zr-GO. It can be seen from Figure 4A that GO had a slightly wrinkled layered structure with a relatively smooth surface. In the case of Zr-GO, the deposition of the particles of Zr on the GO sheet was unnoticeable. However, the highly rough and wrinkled surface of the composite evidenced the destruction of the flat and layered structure of GO and, hence, the incorporation of Zr into the GO structure [33]. The aggregated and much rougher surface of Zr-GO could, therefore, provide more active sites to enhance the adsorption and catalytic activity of the prepared composite.
XRD analysis was employed to determine the crystalline structure and phase geometry of the prepared composite. The XRD patterns of GO and the Zr-GO composite are presented in Figure 5. The GO pattern was dominated by intense broad peaks at 2θ = 23° and 2θ = 44°, indicating the characteristic peaks of graphite planes [31]. The XRD signals of the Zr-GO composite were very wide and weak about 30° and 40°, without showing any characteristic diffraction peaks of GO. The only prominent peak, around 12°, could be attributed to the average interlayer distance between GO sheets [2]. The decrease in peak intensity and increase in peak width advocated the amorphous nature of the Zr-GO composite, owing to the distortion of the crystal structure of GO upon adsorption and dispersion of Zr moieties [2].
The surface area, average pore diameter and pore volume of GO and Zr-GO was obtained by Brunauer-Emmett-Teller (BET) and Barrett-Joyner-Halenda (BJH) methods. The obtained results are summarized in Table 1. In GO, the mesoporous regions in the structure enhanced the surface area, pore diameter and pore volume. As can be seen in Table 1, the Zr-GO composite had reduced surface area (14.57 m2 g−1), lower pore volume (0.001 cm3 g−1) and average pore diameter (2.13 nm), as compared to pristine GO. The reason behind reduction of surface area, pore diameter and pore volume, due to the addition of Zr, could be the adsorption of Zr onto the pores of GO, thereby decreasing the surface area and pore size of Zr-GO. The decrease in material specific surface area allowed greater photoelectron transfer between the interface, due to which interaction of TMB with composite surface was expected to increase, which further enhanced the degradation of H2O2 [34,35].
Thermal stabilities of GO and Zr-GO were examined by TGA (Figure 6A,B). TGA shows the decomposition of a material with temperature. Figure 6A concerns GO and shows a 6% weight loss below 100 °C as a result of the evaporation of absorbed water in its mesoporous structure, and a further 13% weight loss from 100 to 340 °C, which was attributed to chemical decomposition, i.e., removal of the oxygen-containing functional groups that yield CO, CO2 or water. The weight loss of GO at 650 °C was about 90%. In the case of Zr-GO (Figure 6B), the composite exhibited a reduced total weight loss compared to GO (total 7% weight loss). These results indicated decrease in the amount of oxygen-containing functional groups by Zr loading. Weight loss of 4% occurred up to 182 °C, as compared to GO (13%). A further 1% weight loss occurred at the temperature range from 180 to 400 °C. A weight loss of 7% was observed in Zr decorated GO at 600 °C, with no further decrease in weight with temperature. Thus, from the TGA analysis it was observed that Zr-GO had less %weight loss than GO, which confirmed the Zr content in the Zr-GO composite, which made Zr-GO more stable. The higher Zr content was useful to achieve higher peroxidase activity [36,37,38].
DSC for GO and Zr-GO are shown in Figure 6C,D In Figure 6C, a wide and sharp endothermic peak was found at about 300 °C for GO, which was attributed to the evolution of water. While another sharp exothermic peak was found at around 500 °C, roughly indicating a dramatic mass loss due to the degassing of CO, H2O, and CO2. In Figure 6D, the DSC scan for Zr-GO had exothermic peaks at ~125 °C and ~400 °C that were associated with the hydrolysis of ZrCl4 in water giving out Zr moieties, HCl and heat. This acidic medium then helped in the adsorption of Zr on the GO sheets [39,40,41], making it more stable and reactive.
The derivative thermogravimetry (DTG) technique was used to determine the decomposition temperature of the samples. The DTG technique evaluates the ability of a sample to withstand elevated temperatures until it is decomposed. Figure 7 shows the DTG thermograms of GO and Zr-GO. The DTG curve for GO in Figure 7A, demonstrated that a major mass loss step occurred at 620 °C. The low intensity peaks below 600 °C could be attributed to water elimination, removal of oxygen functional groups and oxidative pyrolysis of carbon framework [33]. The peak at 620 °C might have been due to the destruction of the carbon skeleton, indicating the thermal degradation of GO at this temperature, which was in accordance with the TGA results. In the case of Zr-GO (Figure 7B), three distinguished DTG peaks, corresponding to three mass loss events, could be observed. The sharp peak at degradation temperature 120 °C could be attributed to the external heat energy required by Zr to overcome the strong bonding within the carbon lattice structure. Moreover, the peak of GO at 620 °C disappeared in the Zr-GO composite thermogram, representing the disordered and flexible carbon skeleton, which incorporated Zr, during the composite process. This demonstrated that the thermal stability of GO sheets increased due to adsorption of Zr on its surface [42,43,44].

2.2. Peroxidase-Mimicking Activity of Zr

An enzyme or a peroxidase mimic facilitates the oxidation of TMB in the presence of H2O2, to form a blue colored complex [13,45,46]. In this work, the peroxidase-like activity of Zr towards oxidation of TMB was investigated. It is a well-known fact that ZrCl4 is immediately hydrolyzed when water is added, thereby producing zirconyl chloride. Since a stock solution of ZrCl4 was prepared in DI water, so, most probably, the solution now contained ZrOCl2 which consequently gave HCl and Zr (probably in the form of oxidized zirconium moieties). The formation of Zr moieties in the solution could be expressed by the following reaction mechanism:
ZrCl4 + H2O → ZrOCl2
ZrOCl2 + e → ZrOCl + Cl
ZrOCl + H2O → Zr + HCl + H2
The presence of HCl turns Zr solution into an acidic medium which further favors the attachment of Zr moieties onto GO sheets. The hydroxyl and carboxylic functional groups at the edges endow the GO sheets with negative charge due to deprotonation. A strong adsorption of Zr onto the GO surface is, therefore, expected, owing to the positive surface charge of Zr, probably due to the protonation of Zr bounded OH groups to OH2+ (hydroxyl dication). Whereas, in the case of a basic medium, a decline of surface positive charge is expected because of the oxidation of the surface bound Zr, which might result in gradual release of Zr from the GO surface [47].
Six different experimental groups were designed to study the peroxidase-mimic activity of the Zr through catalytic oxidation of TMB in the presence of H2O2 and the respective absorption spectra were monitored at 652 nm. The UV-vis spectra of the catalytic solution of TMB, Zr-GO, H2O2 in DI water were compared with control solutions. Figure 8A compares the UV-Vis spectra of (a) TMB + H2O2 + Zr-GO, (b) TMB + H2O2 + Zr (c) TMB + H2O2 + GO (d) TMB + Zr, (e) TMB + H2O2, and (f) H2O2 + Zr systems. The insertion in Figure 8A is a representative picture of the six different reaction systems (a–f).
It can be seen from the Figure 8A inset, that no color was generated in any of the control experiments including (c) TMB and GO with H2O2 (TMB + H2O2 + GO), (d) TMB with Zr in the absence of H2O2 (TMB + Zr), (e) TMB with H2O2 in the absence of Zr (TMB + H2O2) and (f) H2O2 with Zr in the absence of TMB (H2O2 + Zr), advocating that all three, Zr, TMB and H2O2, were together required for the peroxidase reaction to occur.
The Figure 8A(b) inset indicates that the interaction of TMB and H2O2 with Zr (TMB + H2O2 + Zr) led to the generation of a light blue color, for which the corresponding absorbance spectrum at 652 nm was lower as compared to that in (a). Figure 8A (a) depicts that the interaction of TMB with Zr-GO in the presence of H2O2 (TMB + H2O2 + Zr-GO) resulted in a strong absorption peak at 652 nm, along with the formation of a deep blue colored product, as seen in Figure 8A inset [13], signifying that the presence of GO enhanced the peroxidase reaction. The higher absorption of the Zr-GO composite as compared to GO or Zr alone, could be attributed to the synergistic effect between Zr and GO. The intimate contact between Zr and the high surface area GO ensured efficient electron transfer that intensified the catalytic effect. Here, it is noteworthy that, in general, peroxidase-like activity is governed by ·OH radicals which leads to the oxidation of TMB [48], under weakly acidic conditions [8,47]. This result suggested that the mild Lewis acid property of Zr and exceptional catalytic feature of GO could drastically advance the oxidation of TMB in the presence of H2O2, consequently giving the blue color. Thus, the Zr-GO catalyzed oxidation of TMB was consistent with the reports for the oxidation of TMB.
The interesting peroxidase-like activity of the Zr-GO composite was further confirmed by the time-dependent absorbance changes in Figure 8B. In the absence of either TMB, H2O2, or Zr, there was negligible increase in absorbance at 652 nm with respect to time. A significant proceeding in absorbance was observed with the reaction time, upon blending the three species. This result manifested the Horse Radish Peroxidase enzyme-like role [13] of Zr-GO to escalate the oxidation of TMB in the presence of H2O2, indicating the successful construction of a facile colorimetric sensing platform.

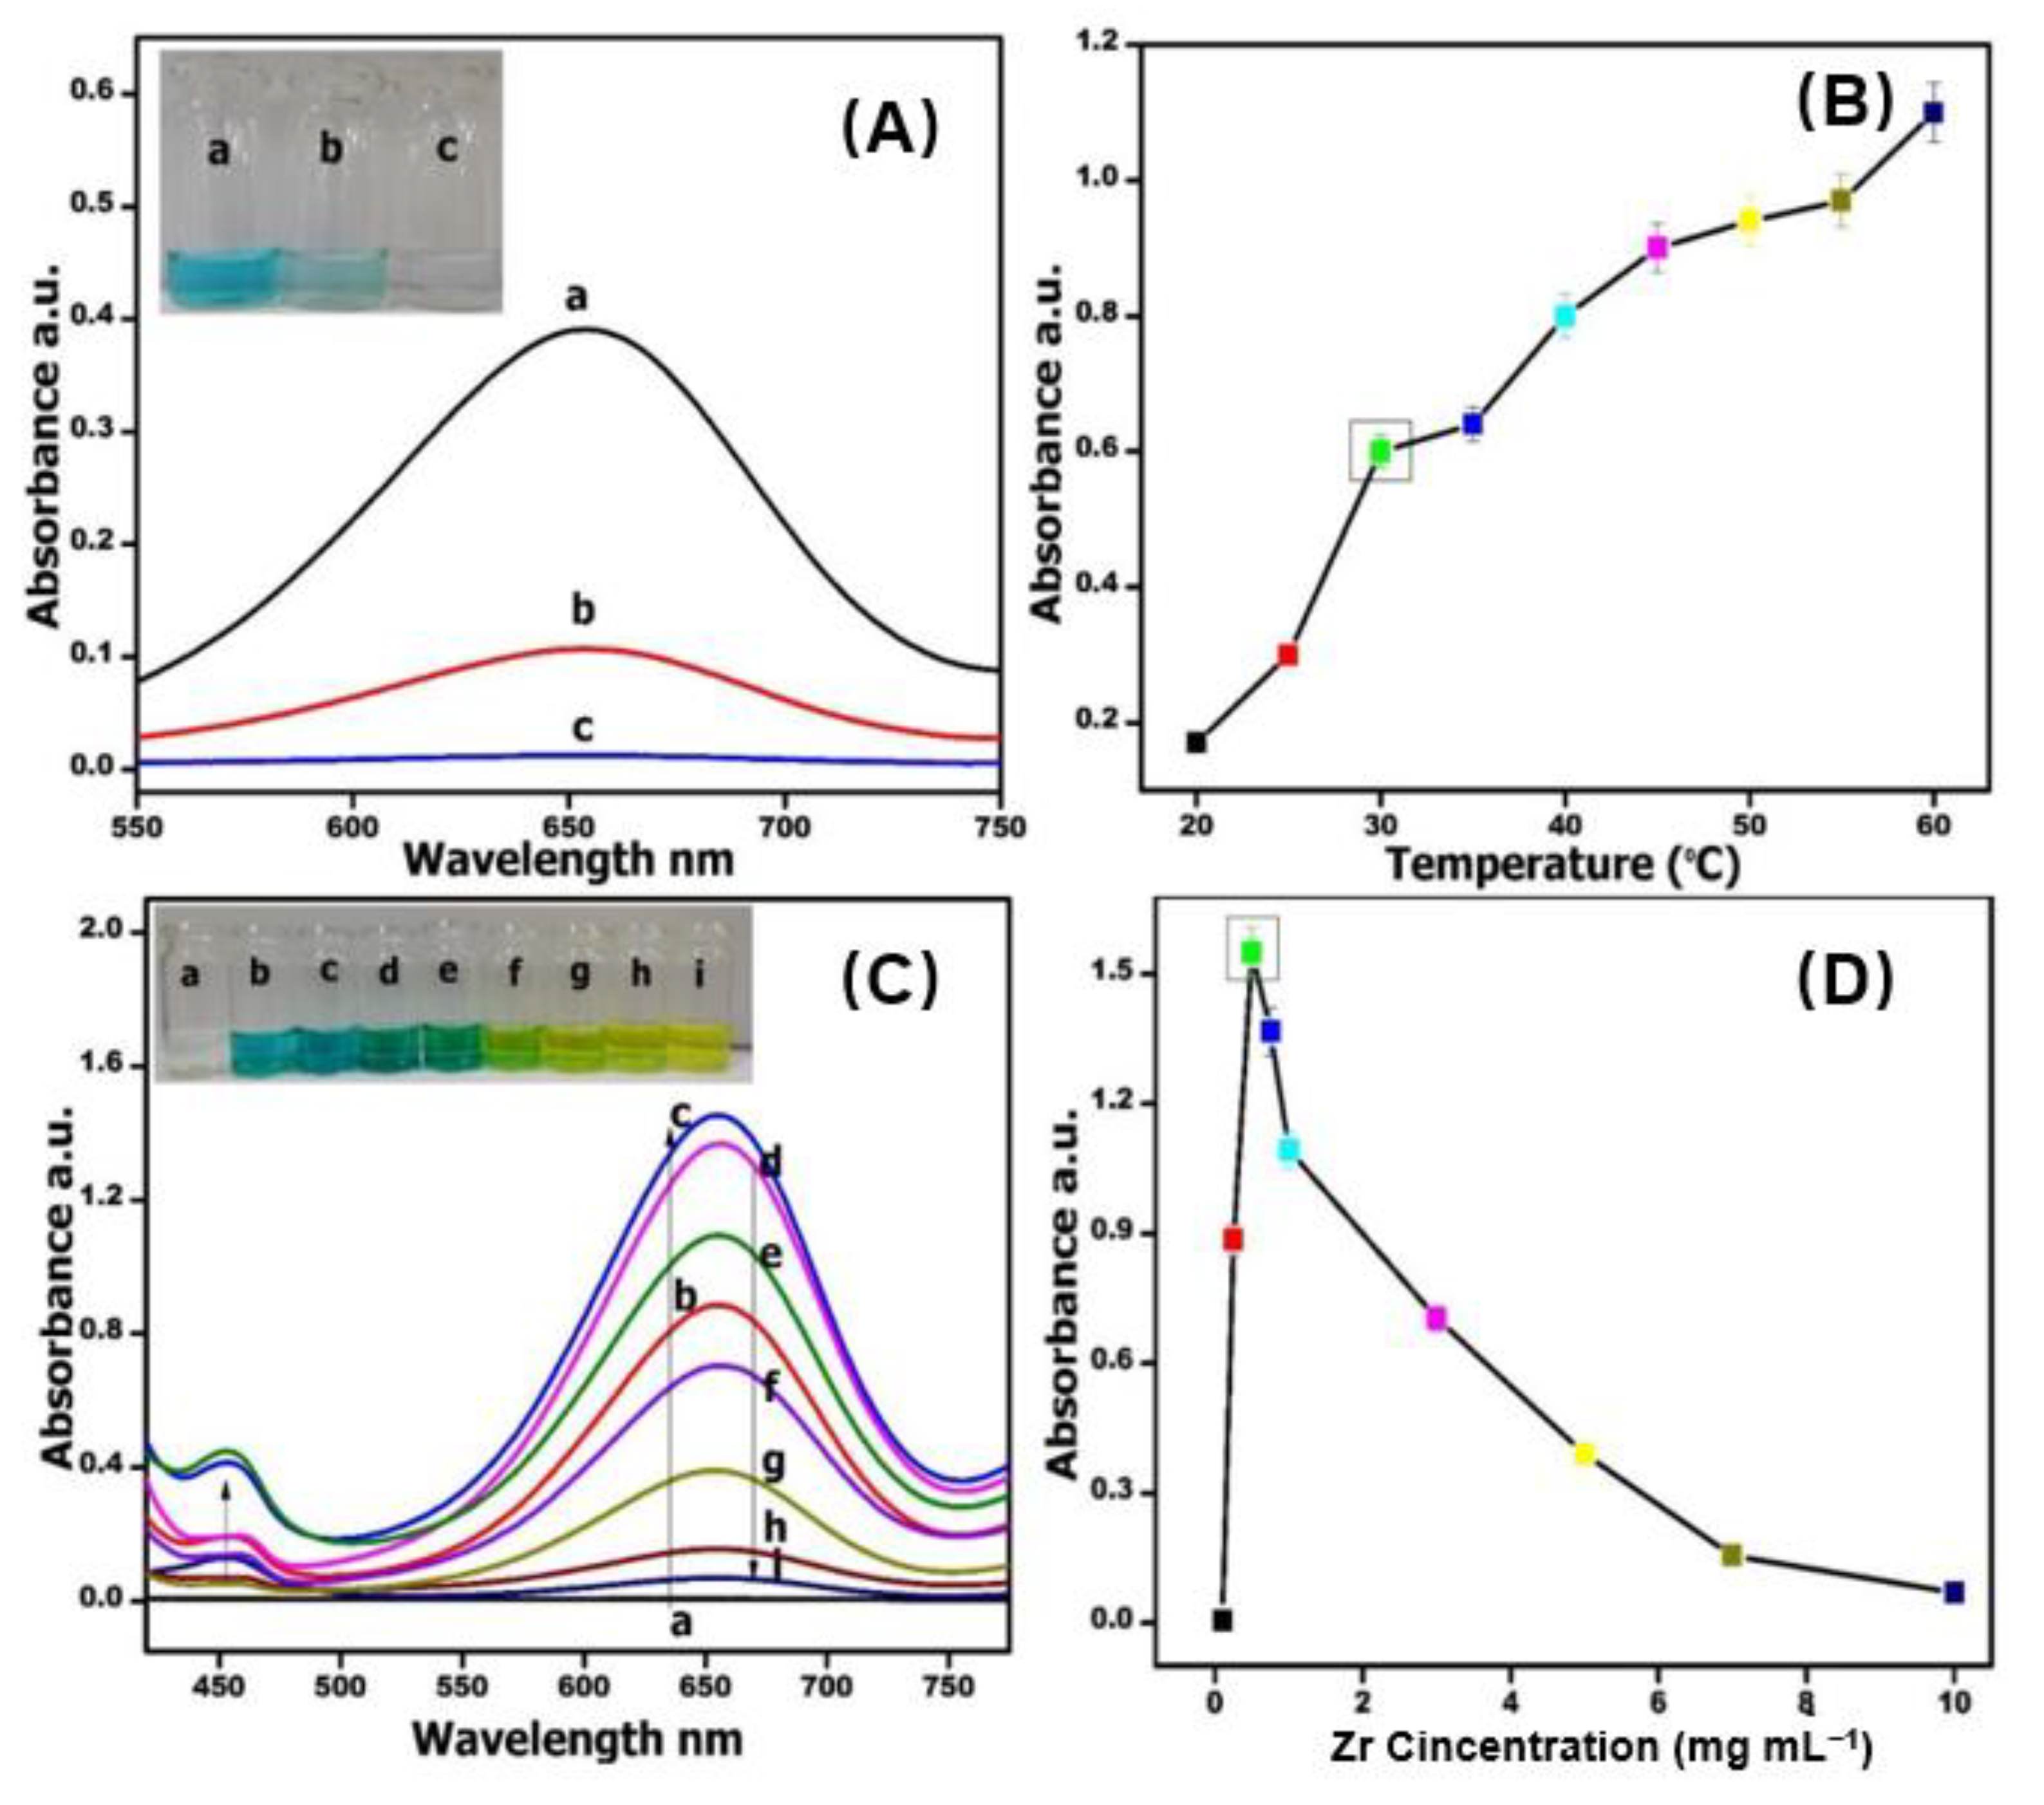
2.3. Optimization of Reaction Parameters

Optimization of reaction parameters was carried out to study the role of the peroxidase-like activity of Zr towards TMB oxidation. The peroxidase-mimicking activity of Zr was evaluated with different mediums, incubation temperature (20 to 60 °C) and varying concentrations of Zr solution (0.1 to 10 mg mL−1).
  • Effect of Medium:
Catalytic activity of Zr-GO towards TMB oxidation was observed in three different mediums: (a) DI water (neutral pH 7), (b) Phosphate Buffer Saline (PBS-pH 7.4) and (c) Sodium Acetate (NaAc-pH 5.5), as shown in Figure 9A. Zr-GO showed higher activity towards TMB oxidation in DI water i.e., a neutral medium, as shown in Figure 9A (a). The difference in catalytic activity in different mediums might be attributed to the hydrolyzed ZrCl4 solution, containing ZrOCl2 and HCl. The pH of the hydrolyzed solution was dependent on the ZrCl4 concentration. Due to the Lewis acid property of the Zr catalyst, the amino group of TMB protonated in this mildly acidic environment, and favorably attracted the negatively charged hydroxyl ions. This, therefore, suggested that, unlike most of the reported nanomaterials, Zr favorably extended the pH for TMB oxidation towards physiologically significant pH, which could encourage in vivo probing of target analytes. Therefore, the subsequent reactions were performed in DI water.
  • Effect of Temperature:
The incubation dependent temperature response curve is shown in Figure 9B. The catalytic activity of Zr-GO composite greatly increased as the incubation temperature increased from 20 to 40 °C. Further increase in temperature resulted in a decrease in catalytic activity, indicating the inactivation of Zr-GO at high temperature. The H2O2 tended to decompose into H2O and O2 at high temperatures. In contrast, very low temperatures would also limit the rate of electron transfer. Therefore, for convenience, room temperature (30 °C) and DI water were taken as the optimum conditions.
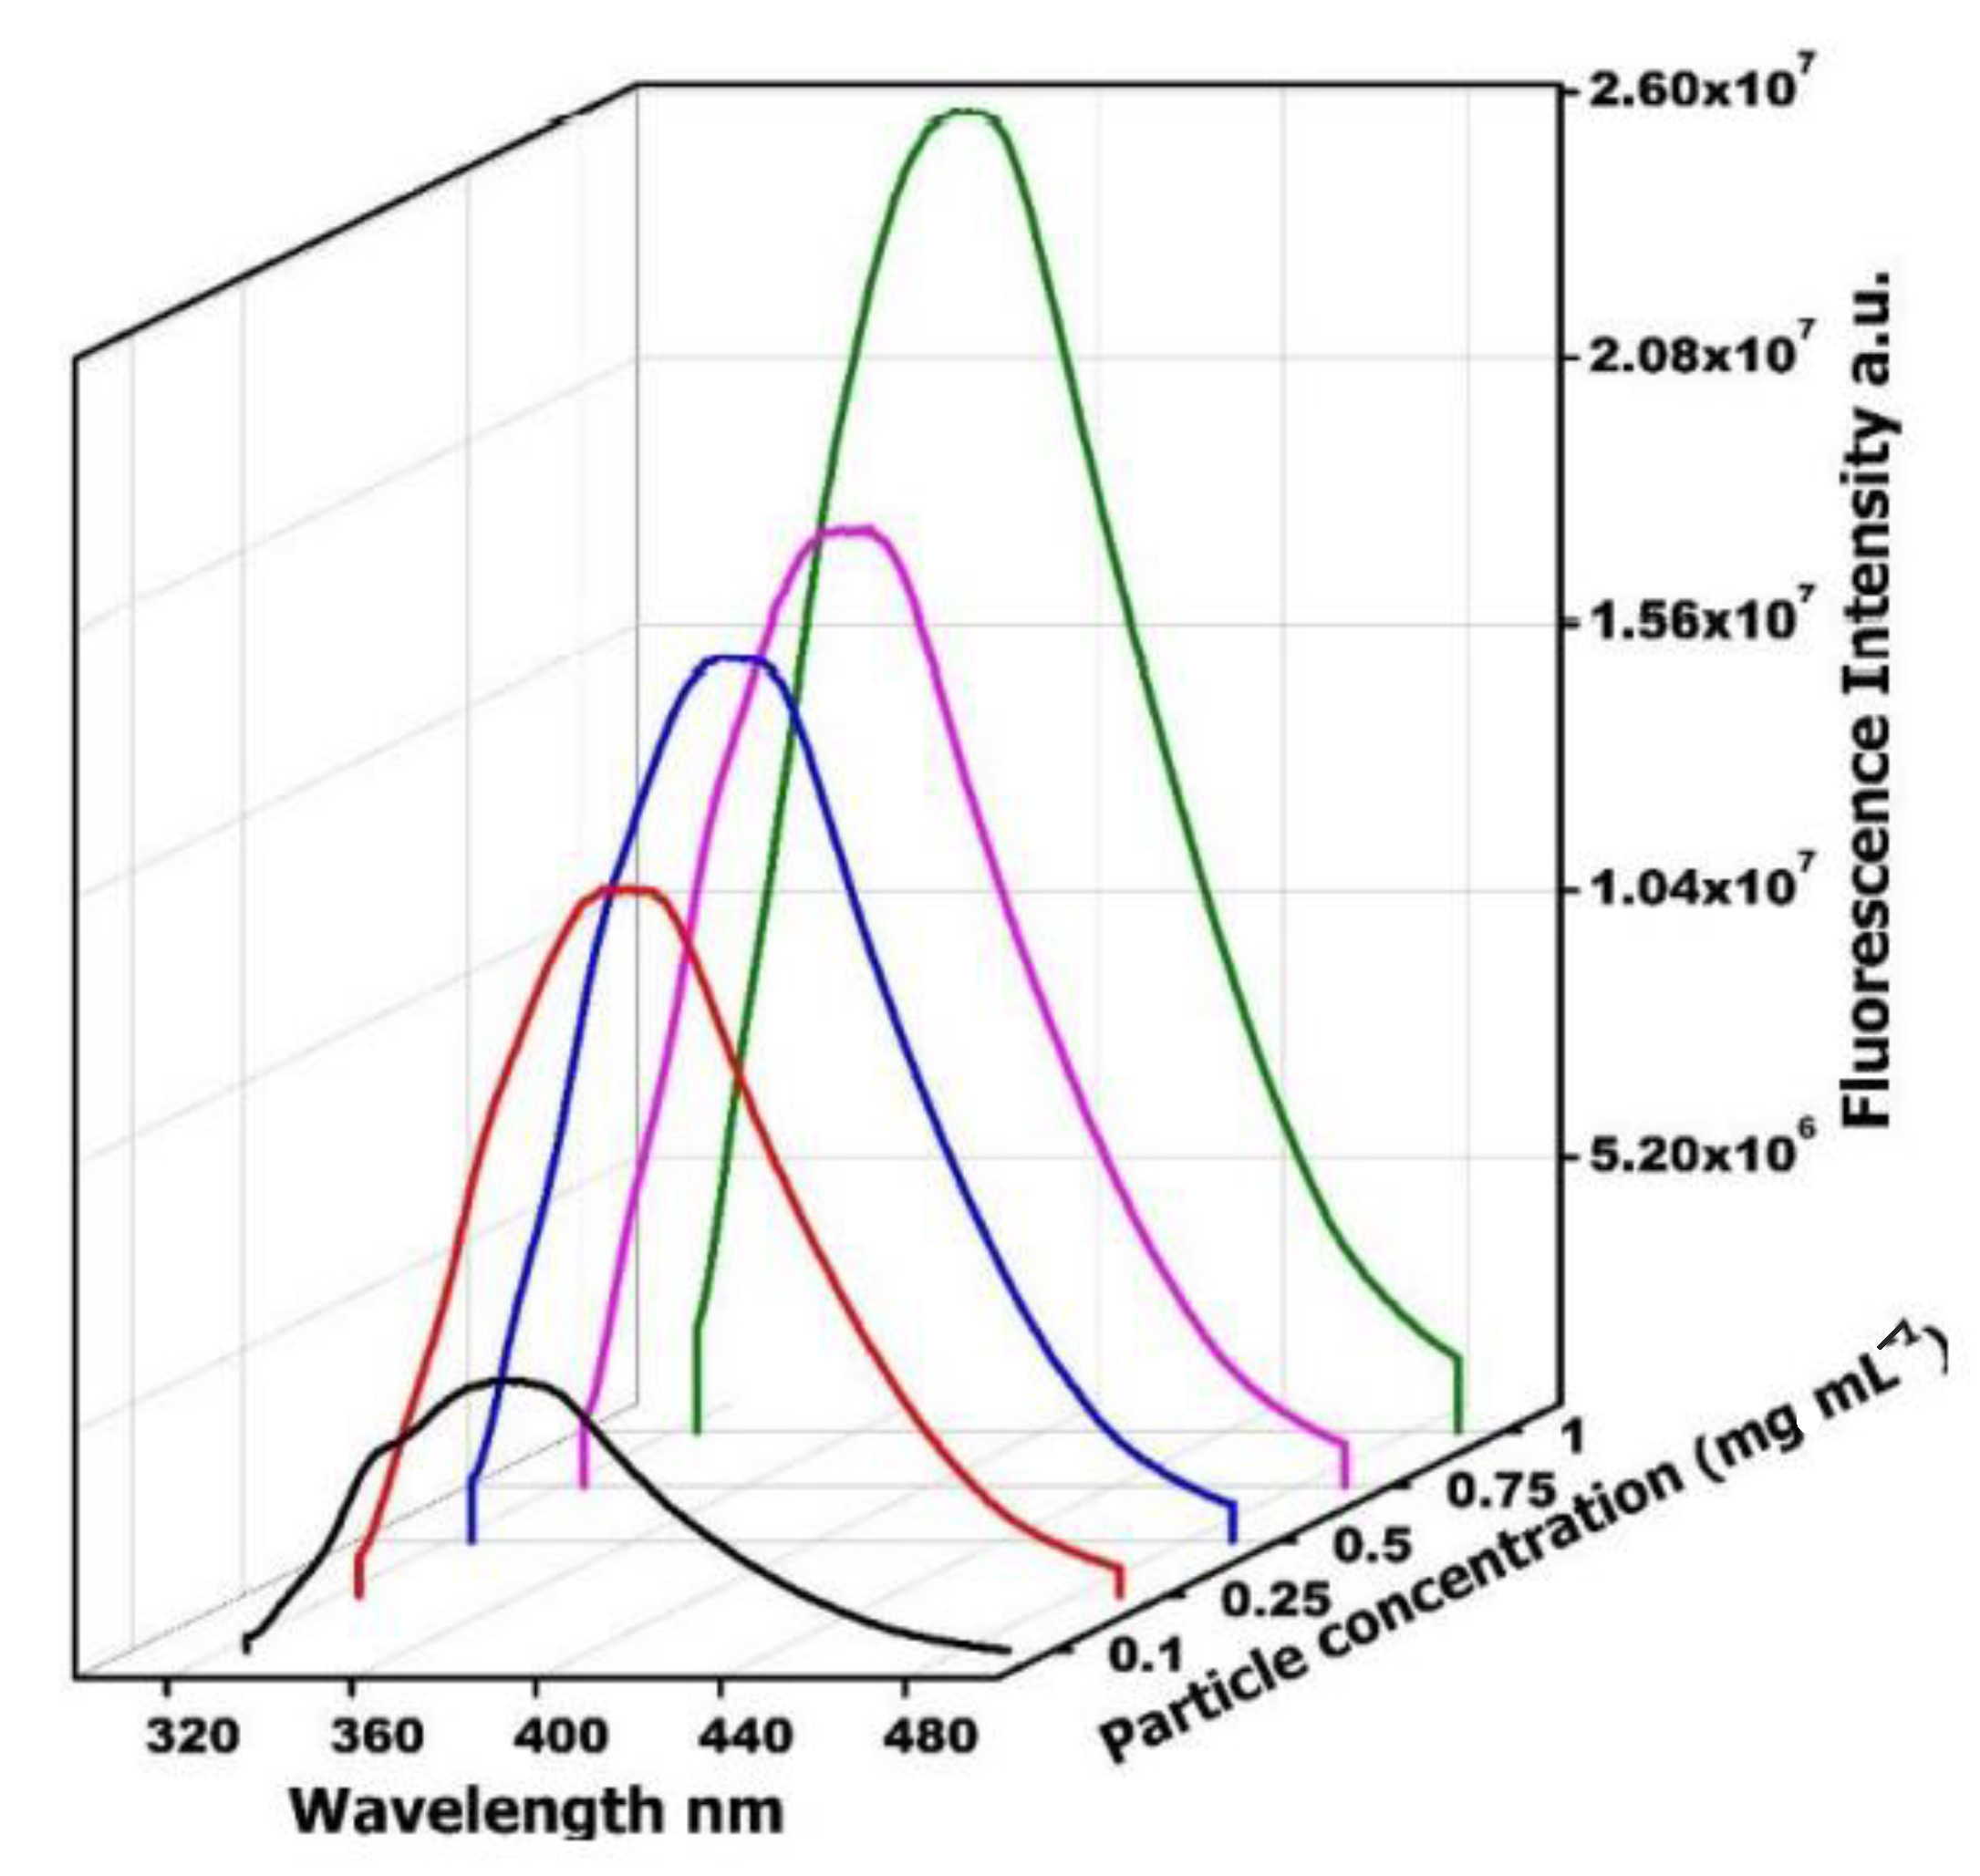
  • Concentration of GO:
It was observed that GO alone with TMB and H2O2 did not give any color, due to its inactivity in a neutral medium. The addition of GO to Zr and TMB in the presence of H2O2, enhanced the intensity of color and the absorbance in the spectra (Figure 8A). Therefore, the concentration of GO added to the reaction system was also optimized from 1 to 10 µg mL−1. It was observed that 5 µg mL−1 of GO was enough to display significant color change. Beyond this value, due to the black color of GO the solution started to turn black with increasing concentrations of GO, thereby dominating the blue color of the required reaction.
  • Concentration of Zr:
From Figure 9C, it was observed that absorbance at 652 nm gradually increased with 5 µg mL−1 of GO and increasing amounts of Zr solution from 0.1 to 10 mg mL−1. Maximum absorbance at 652 nm was observed for 0.5 mg mL−1 of Zr solution (c). Beyond this value, increase in concentrations of Zr to 10 mg mL−1 led to reduction in the absorption and intensity at 652 nm. The inset in Figure 9C shows the change in color with increasing Zr concentration from colorless to blue, to bluish green, to greenish yellow and, finally, yellow, which might be attributed to the fact that the solution was becoming more and more acidic with increasing concentrations of Zr. It is established in literature that sulfuric acid is used in tests to stop the peroxidase reaction, which turns the oxidized TMB (oxTMB) solution from blue to yellow [48,49,50]. In this case, the reason behind the yellow color might be attributed to the higher concentrations of ZrCl4 which possibly made the system more acidic, thereby stopping the peroxidase reaction. Higher concentrations of ZrCl4 advanced the hydrolysis process, eventually producing more Zr moieties and HCl acid in the solution. Hence, 0.5 mg mL−1 of Zr solution was used for subsequent experiments.
  • Concentration of TMB:
The absorbance at 652 nm was found to successively amplify directly proportional to the concentration of TMB in the range of 0–5 mM (Figure 10). Therefore, a moderate concentration of 2.5 mM TMB was used for further experiments.

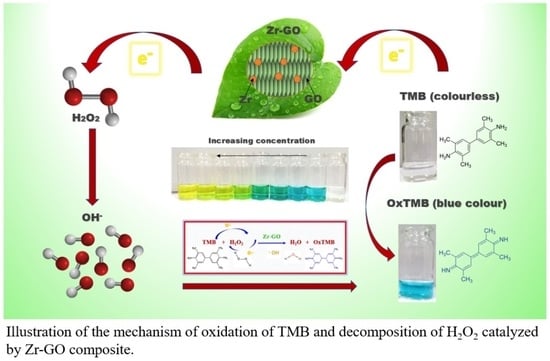
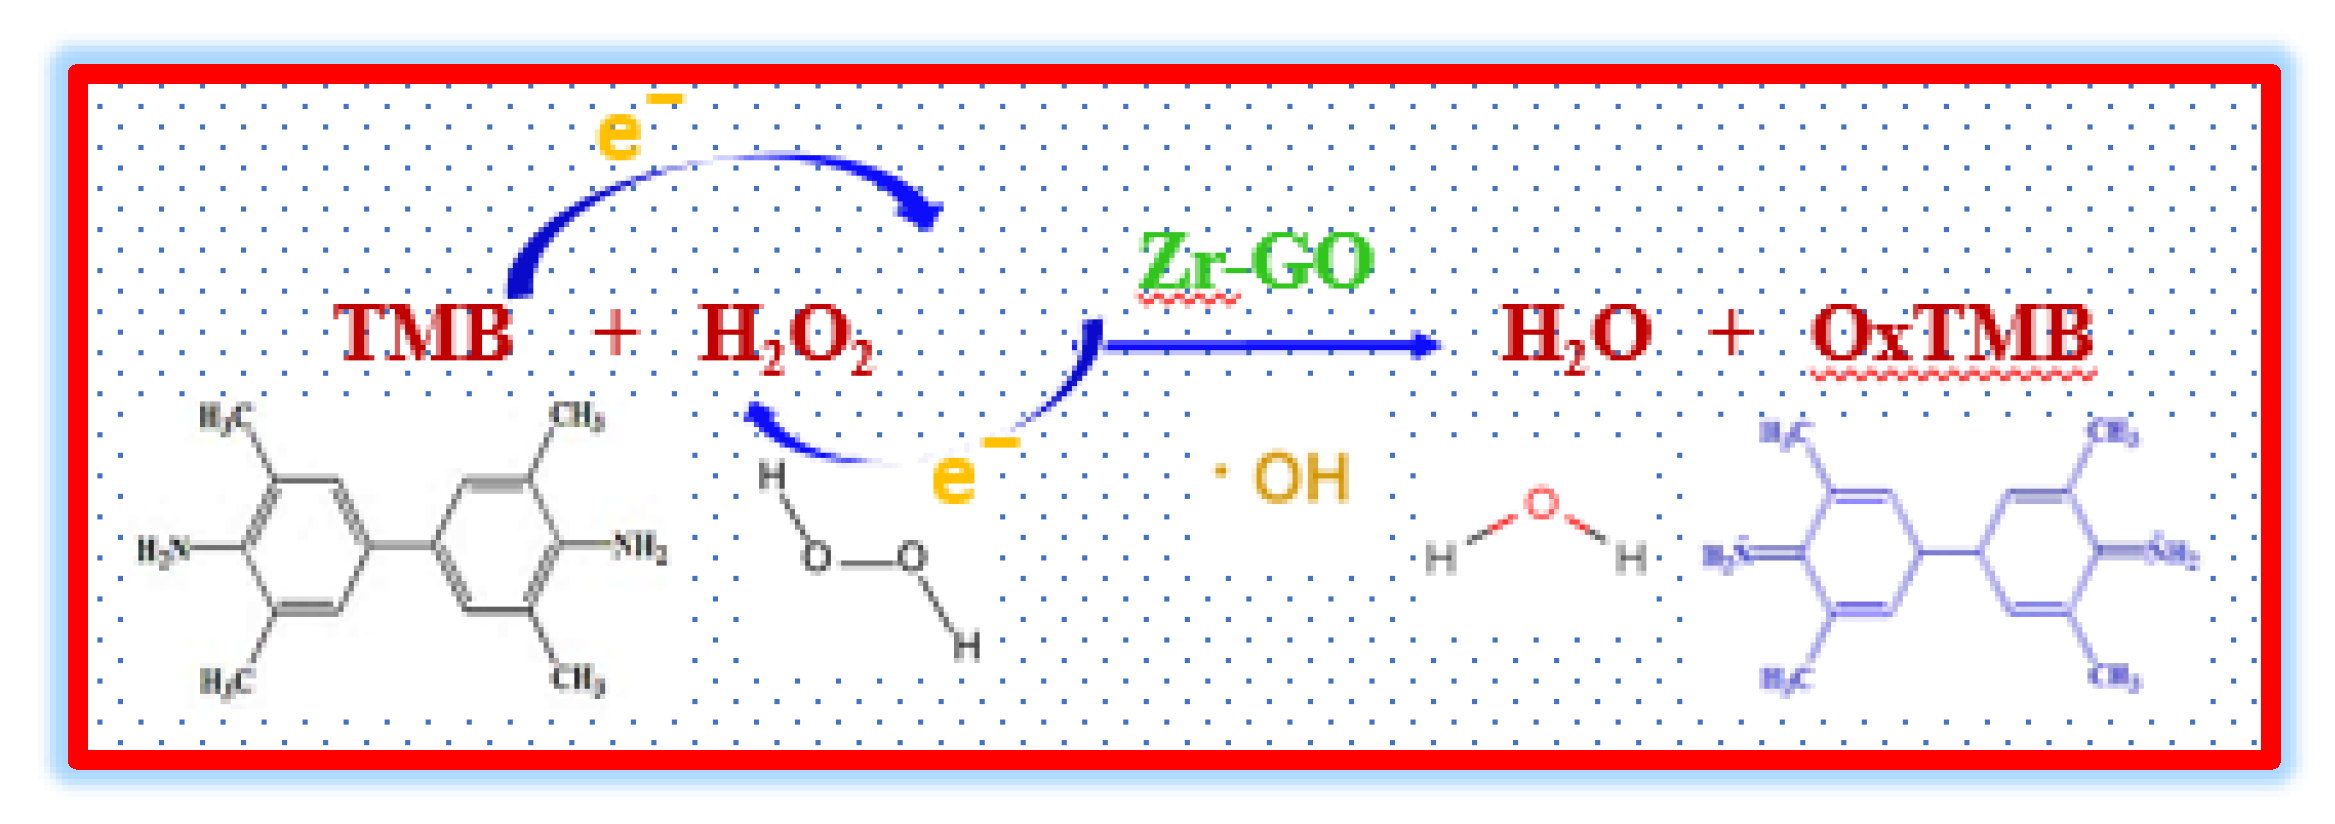
2.4. Catalytic Mechanism of the Peroxidase Mimicking Zr

In general, the catalytic pathway of peroxidases and their mimics can be categorized into the production of hydroxyl radicals and the electron transfer mechanism [13,51]. Initially, H2O2 is reduced to hydroxyl radicals, and these radicals oxidize the electron donor AH2 to A. The electrons are then transferred from AH2 to H2O2 facilitated by the peroxidase [13,23] and further proceeding the catalysis.
H2O2 + AH2 Catalysts 12 01105 i0012H2O+A
This vital biochemical reaction is widely utilized in various chemical and biosensing systems indicating the significance of H2O2 detection in enzyme systems [11,13].
The reaction mechanism of peroxidase mimetic Zr-GO catalyzing the oxidation of chromogenic substrate TMB in the presence of H2O2 is illustrated in Figure 11.
The catalytic mechanism was explored using fluorescent probe terephthalic acid (TA) to capture ·OH generated due to decomposition of H2O2. TA conveniently interacts with ·OH to form 2-hydroxy terephthalic acid with intense fluorescence emission [1,2,7,45,51]. A fluorescence spectrophotometer was used to evaluate the fluorescence intensity of the detection system, with λex = 315 nm, displayed in Figure 12. The experiment was performed using 2 mM TA, 500 µM H2O2, 5 µg mL−1 of GO and ZrCl4 with different concentrations (0.1, 0.25, 0.5, 0.75, 1 mg mL−1) (containing Zr) incubated in DI water at the optimal reaction temperature (30 °C) for 2 min. Clearly, from Figure 12, the presence of Zr-GO greatly enhanced the fluorescence of TA solution, thereby confirming the production of ·OH by H2O2 reduction, and its pivotal role in the peroxidase-like activity of the Zr-GO system [12].
This result was consistent with the catalytic pathways extensively reported in literature [12,13,51]. In the catalytic reaction, mediated by the peroxidase-mimic Zr, H2O2 and TMB act as the electron acceptor and donor, respectively. The Zr-GO composite facilitates the hydroxyl radical (·OH) generation and electron transfer between TMB and H2O2 for the rapid oxidation of TMB. Visible light can cause the electrons to transfer from the Lowest Unoccupied Molecular Orbital (LUMO) of Zr to GO, which inhibits the direct recombination of photo-induced electron–hole pairs. The electrons present on the Zr-GO interface are very active and efficiently break H2O2 into reactive species (·OH) and H2O [7,52]. The generated (·OH) radicals readily oxidize the TMB, which then loses electrons [23]. In the electron transfer process, the ox-TMB donates lone-pair electrons from the amino groups (–NH2) to the composite [1], consequently increasing the electron density and mobility in Zr-GO. This expedites the electron transfer [1] from Zr-GO to H2O2, abiding by the electron transfer mechanism. The above results affirmed that the catalytic mechanism of the Zr-GO composite may be attributed to ·OH radical generation and the electron transfer mechanism.
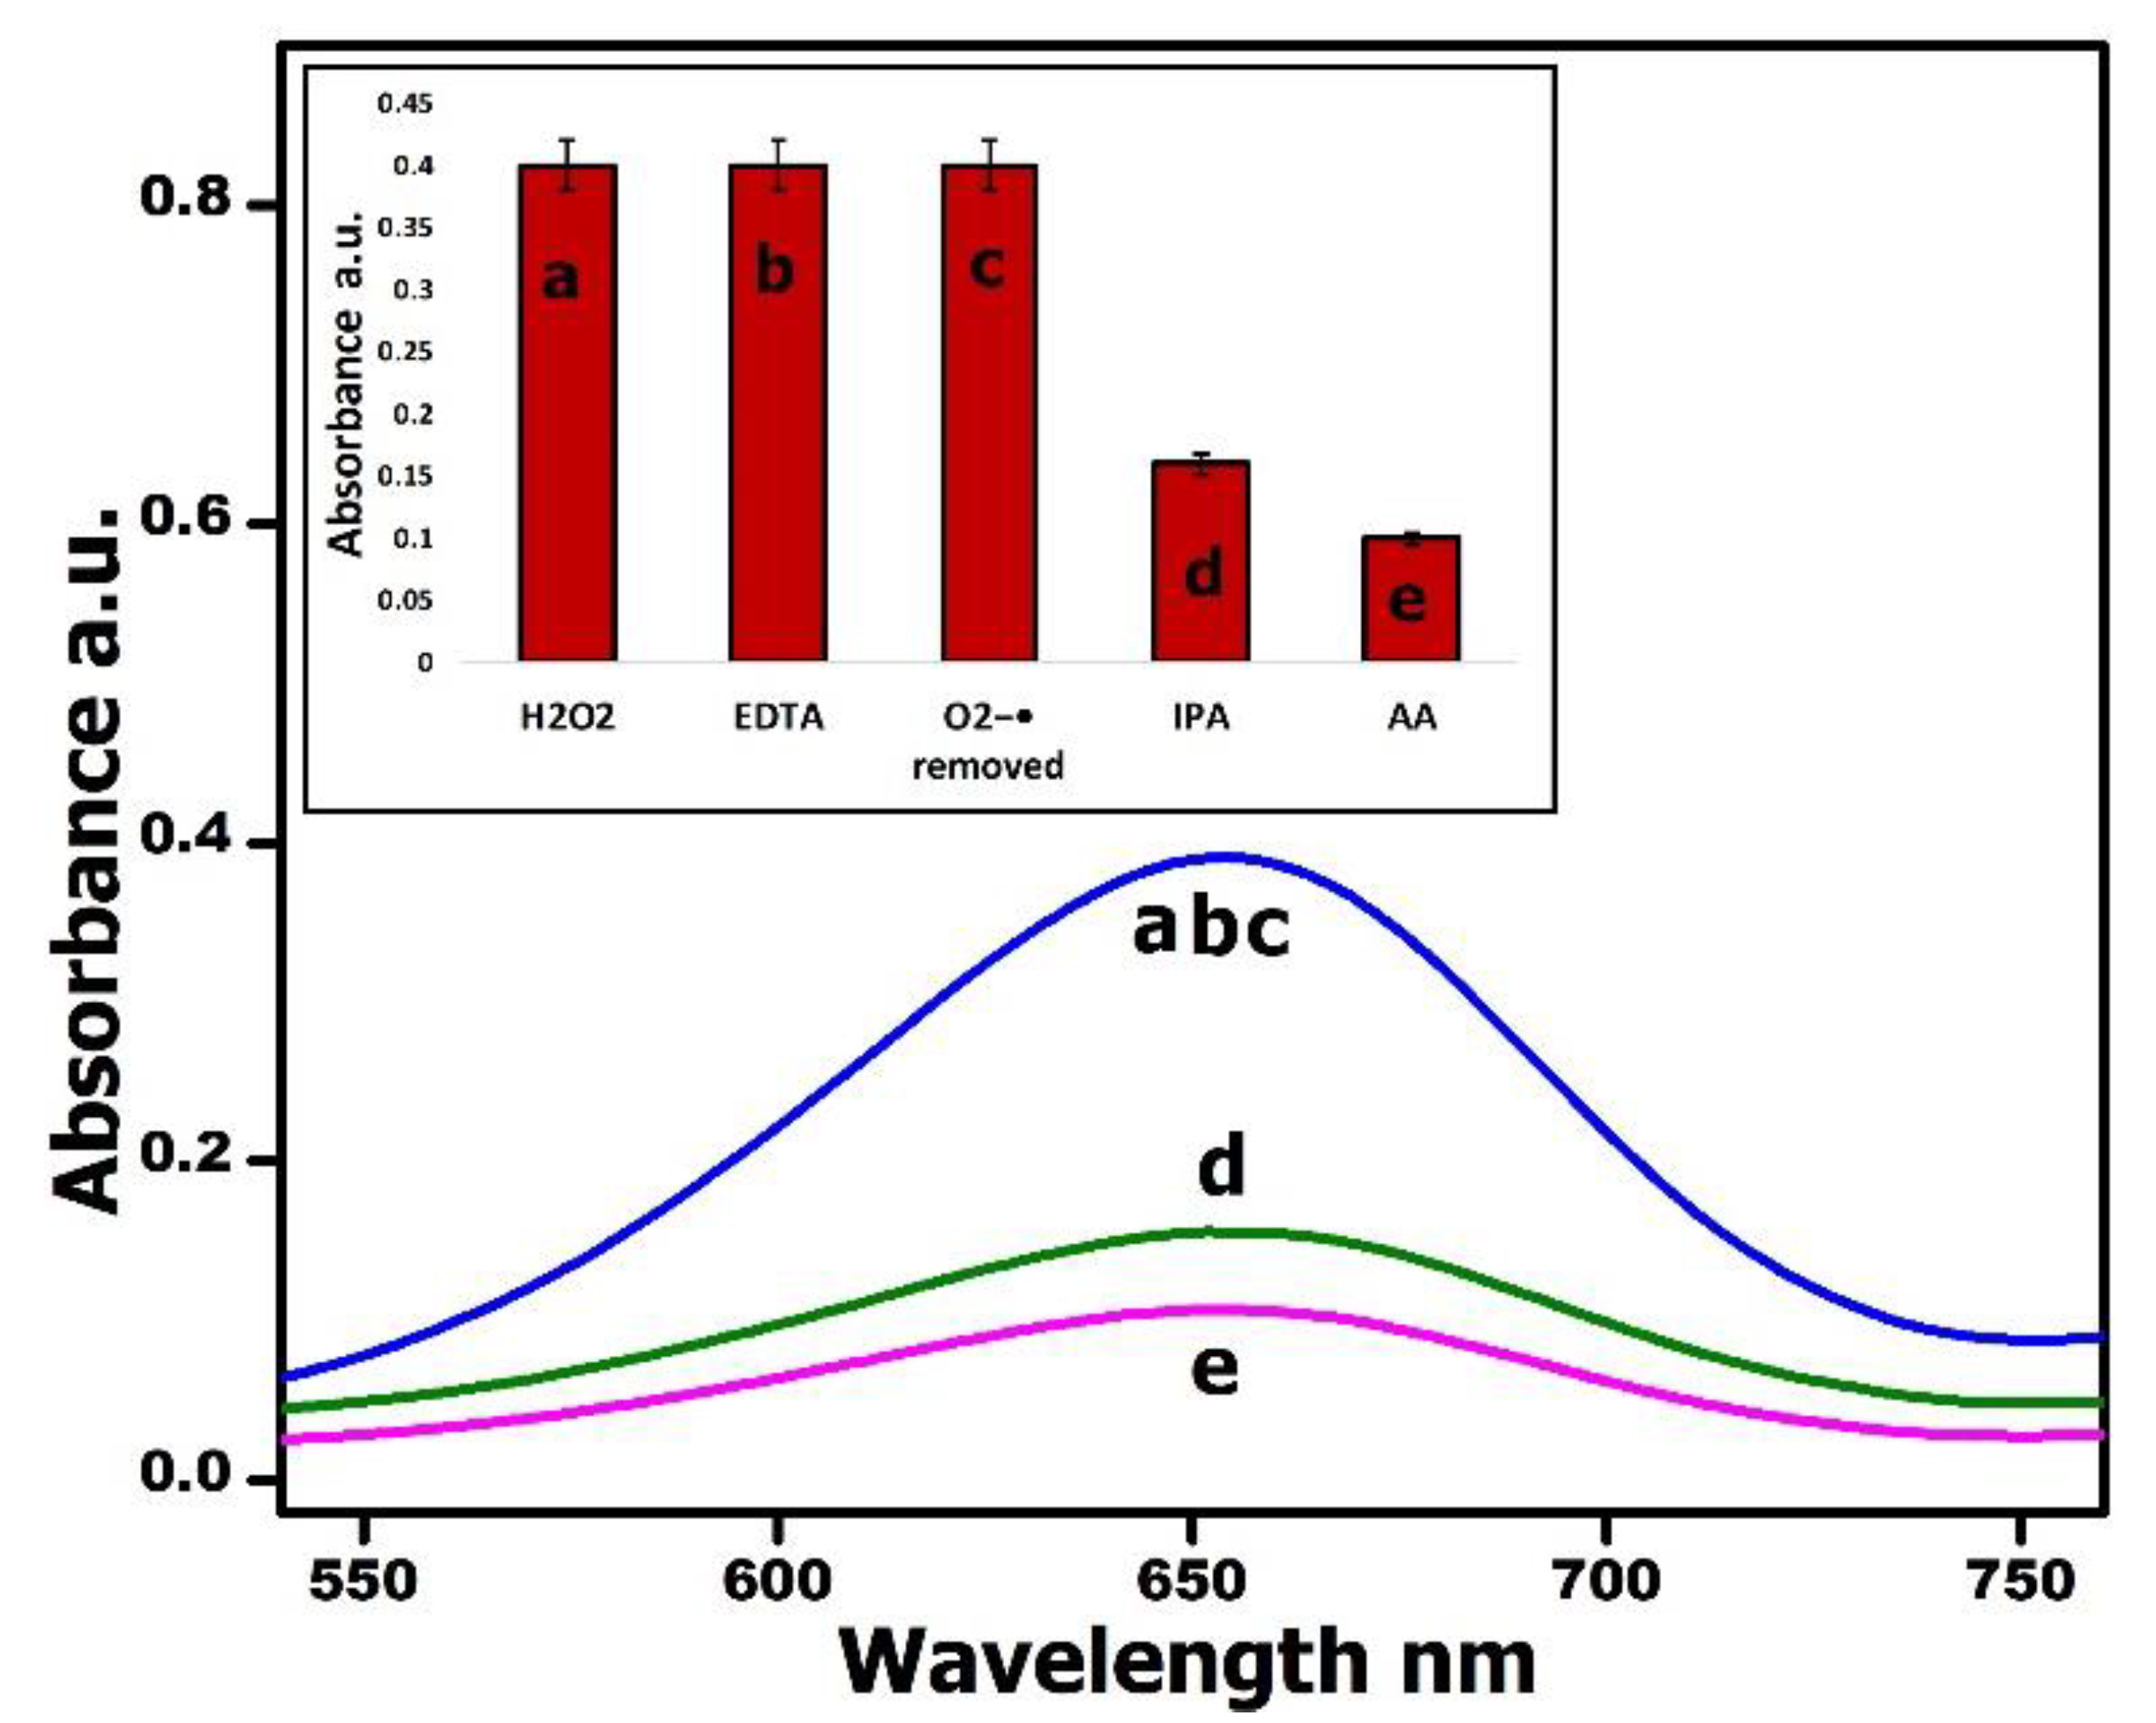
  • Scavenger Experiments
The effect of different quenchers on the Zr-GO+H2O2+TMB reaction system was studied in order to further explore the catalytic mechanism of Zr. Electron hole pairs (h+), hydroxyl radicals (·OH) and superoxide anion radicals (O2−·) are the possible intermediate reactive species produced in the catalytic reaction. The existence of h+ species is widely demonstrated using Ethylenediaminetetraacetic acid disodium salt (EDTA) [53]. The addition of EDTA did not produce any change in the absorbance of the reaction system at 652 nm (Figure 13) (b). Additionally, after removing oxygen in the reaction system there was no change in absorbance, confirming that O2−· had no effect on the catalysis (c) [53]. Isopropanol (IPA) is commonly deployed as a trapping agent for ·OH, to effectively eliminate ·OH from the system [54]. The absorbance of the reaction system decreased upon addition of IPA, evidencing that the ·OH was the prime active species involved in the catalytic reaction (d). Furthermore, the inhibitory effect of the natural antioxidant Ascorbic acid (AA) was used to study the peroxidase activity [51,52]. As expected, in contrast to the control, the oxidation rate of TMB was significantly reduced by the addition of AA (e). This study evidenced that the peroxidase-like activity of Zr-GO was driven by the ·OH radicals that were crucial for the oxidation of TMB.

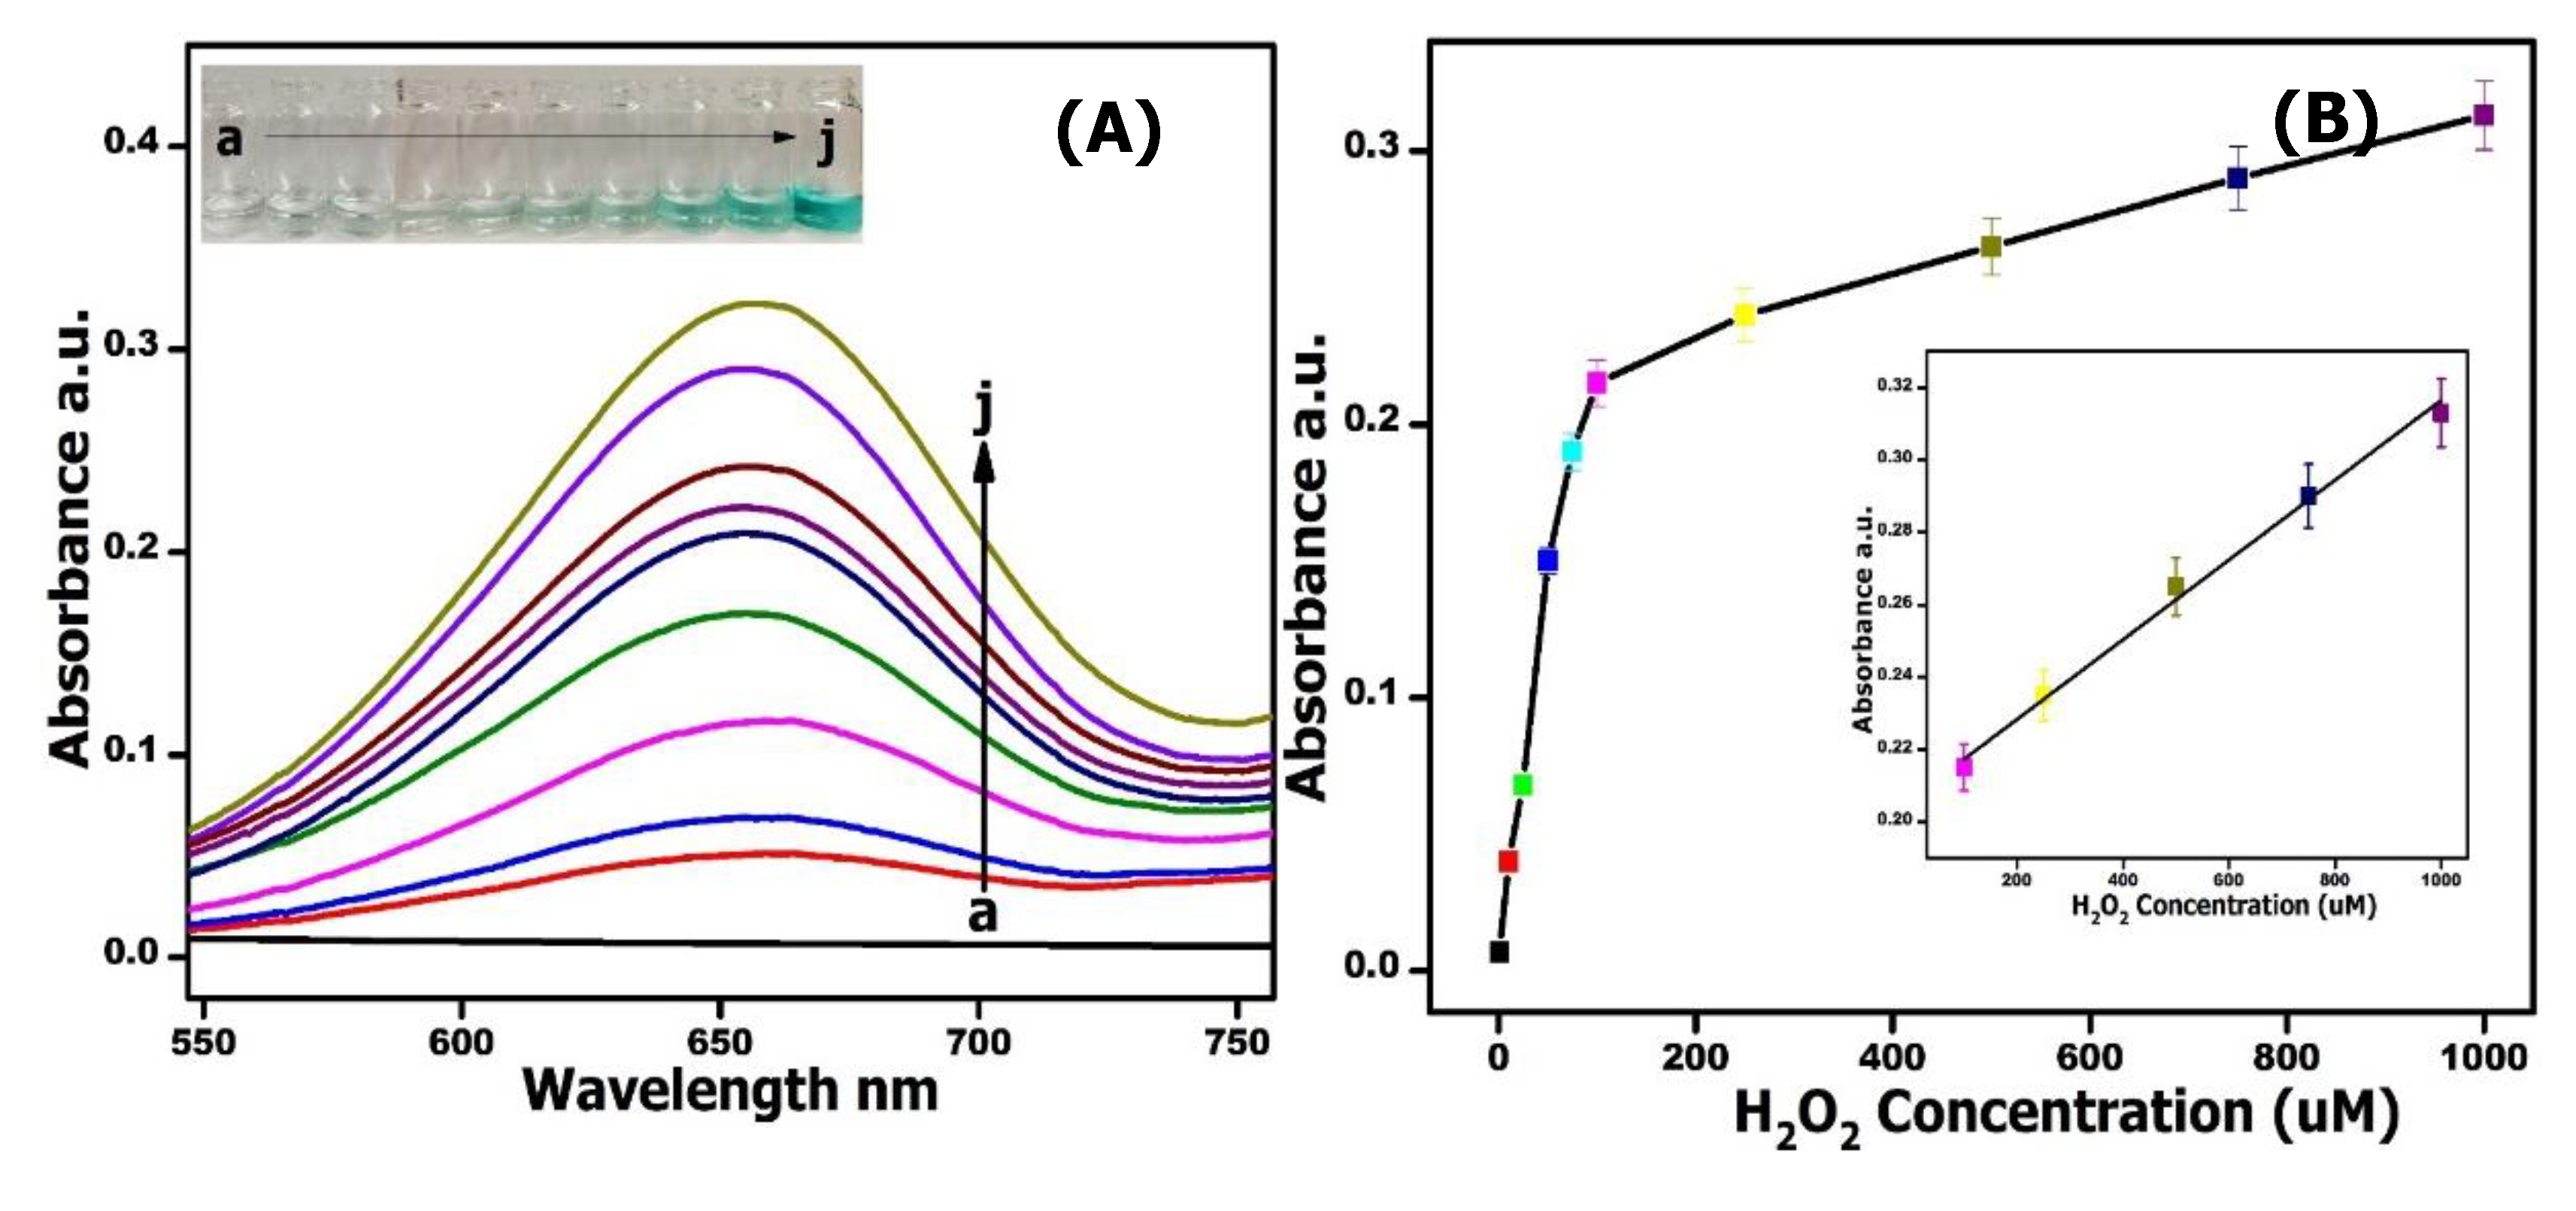
2.5. Colorimetric Detection of H2O2

The sensitivity of the constructed system was tested by evaluating the analytical performance of the peroxidase-like catalytic activity of Zr with GO, TMB and DI water spectrophotometrically, in the presence of varying concentrations (1 μM–1000 μM) of H2O2 [54]. The absorbance observed at 652 nm was directly proportional to the amount of H2O2 in the detection system, suggesting higher sensitivity of the system [55] due to the higher oxidation of TMB with increasing concentration of H2O2 (Figure 14A). The increase in absorbance might be ascribed to the formation of more hydroxyl ions and free radicals from the breakdown of increasing H2O2. Consequently, the increased radicals oxidized the TMB, giving a deeper blue color. As the concentration of H2O2 increased, the color of the system changed from colorless to deep blue (inset of Figure 14A). In this work, the colorimetric test of H2O2 could be finished within 2 min, thus Zr-GO nanozyme can be regarded as a talented candidate for sensitive visual detection of H2O2.
The inset of Figure 14B displays good sensitivity and linear relationship obtained between the absorbance signal and H2O2 concentration ranging from 100 μM–1000 μM from the linear regression equation (Table 2). The sensitivity of the Zr-GO based H2O2 sensor in terms of limit of detection (LOD) was found to be 0.57 μM calculated using the relation 3σ/s, [56,57], where σ is the standard deviation of the blank and s is the slope of the calibration plot.
In Table 3, the analytical performance of the developed sensing system is compared with the reported ones. As depicted in Table 3, the devised method had higher detection sensitivity with a wider linear range and lower LOD, superior to many previously reported traditional enzyme mimetic platforms. Though the LOD of our sensing system was not the lowest, it provided a non-enzymatic substitutional method for the selective detection of H2O2 in a rapid and bio friendly manner, by a simple blend-and-detect method, without the use of complicated materials, unlike conventional approaches that require tedious and time-consuming preparation of probes.

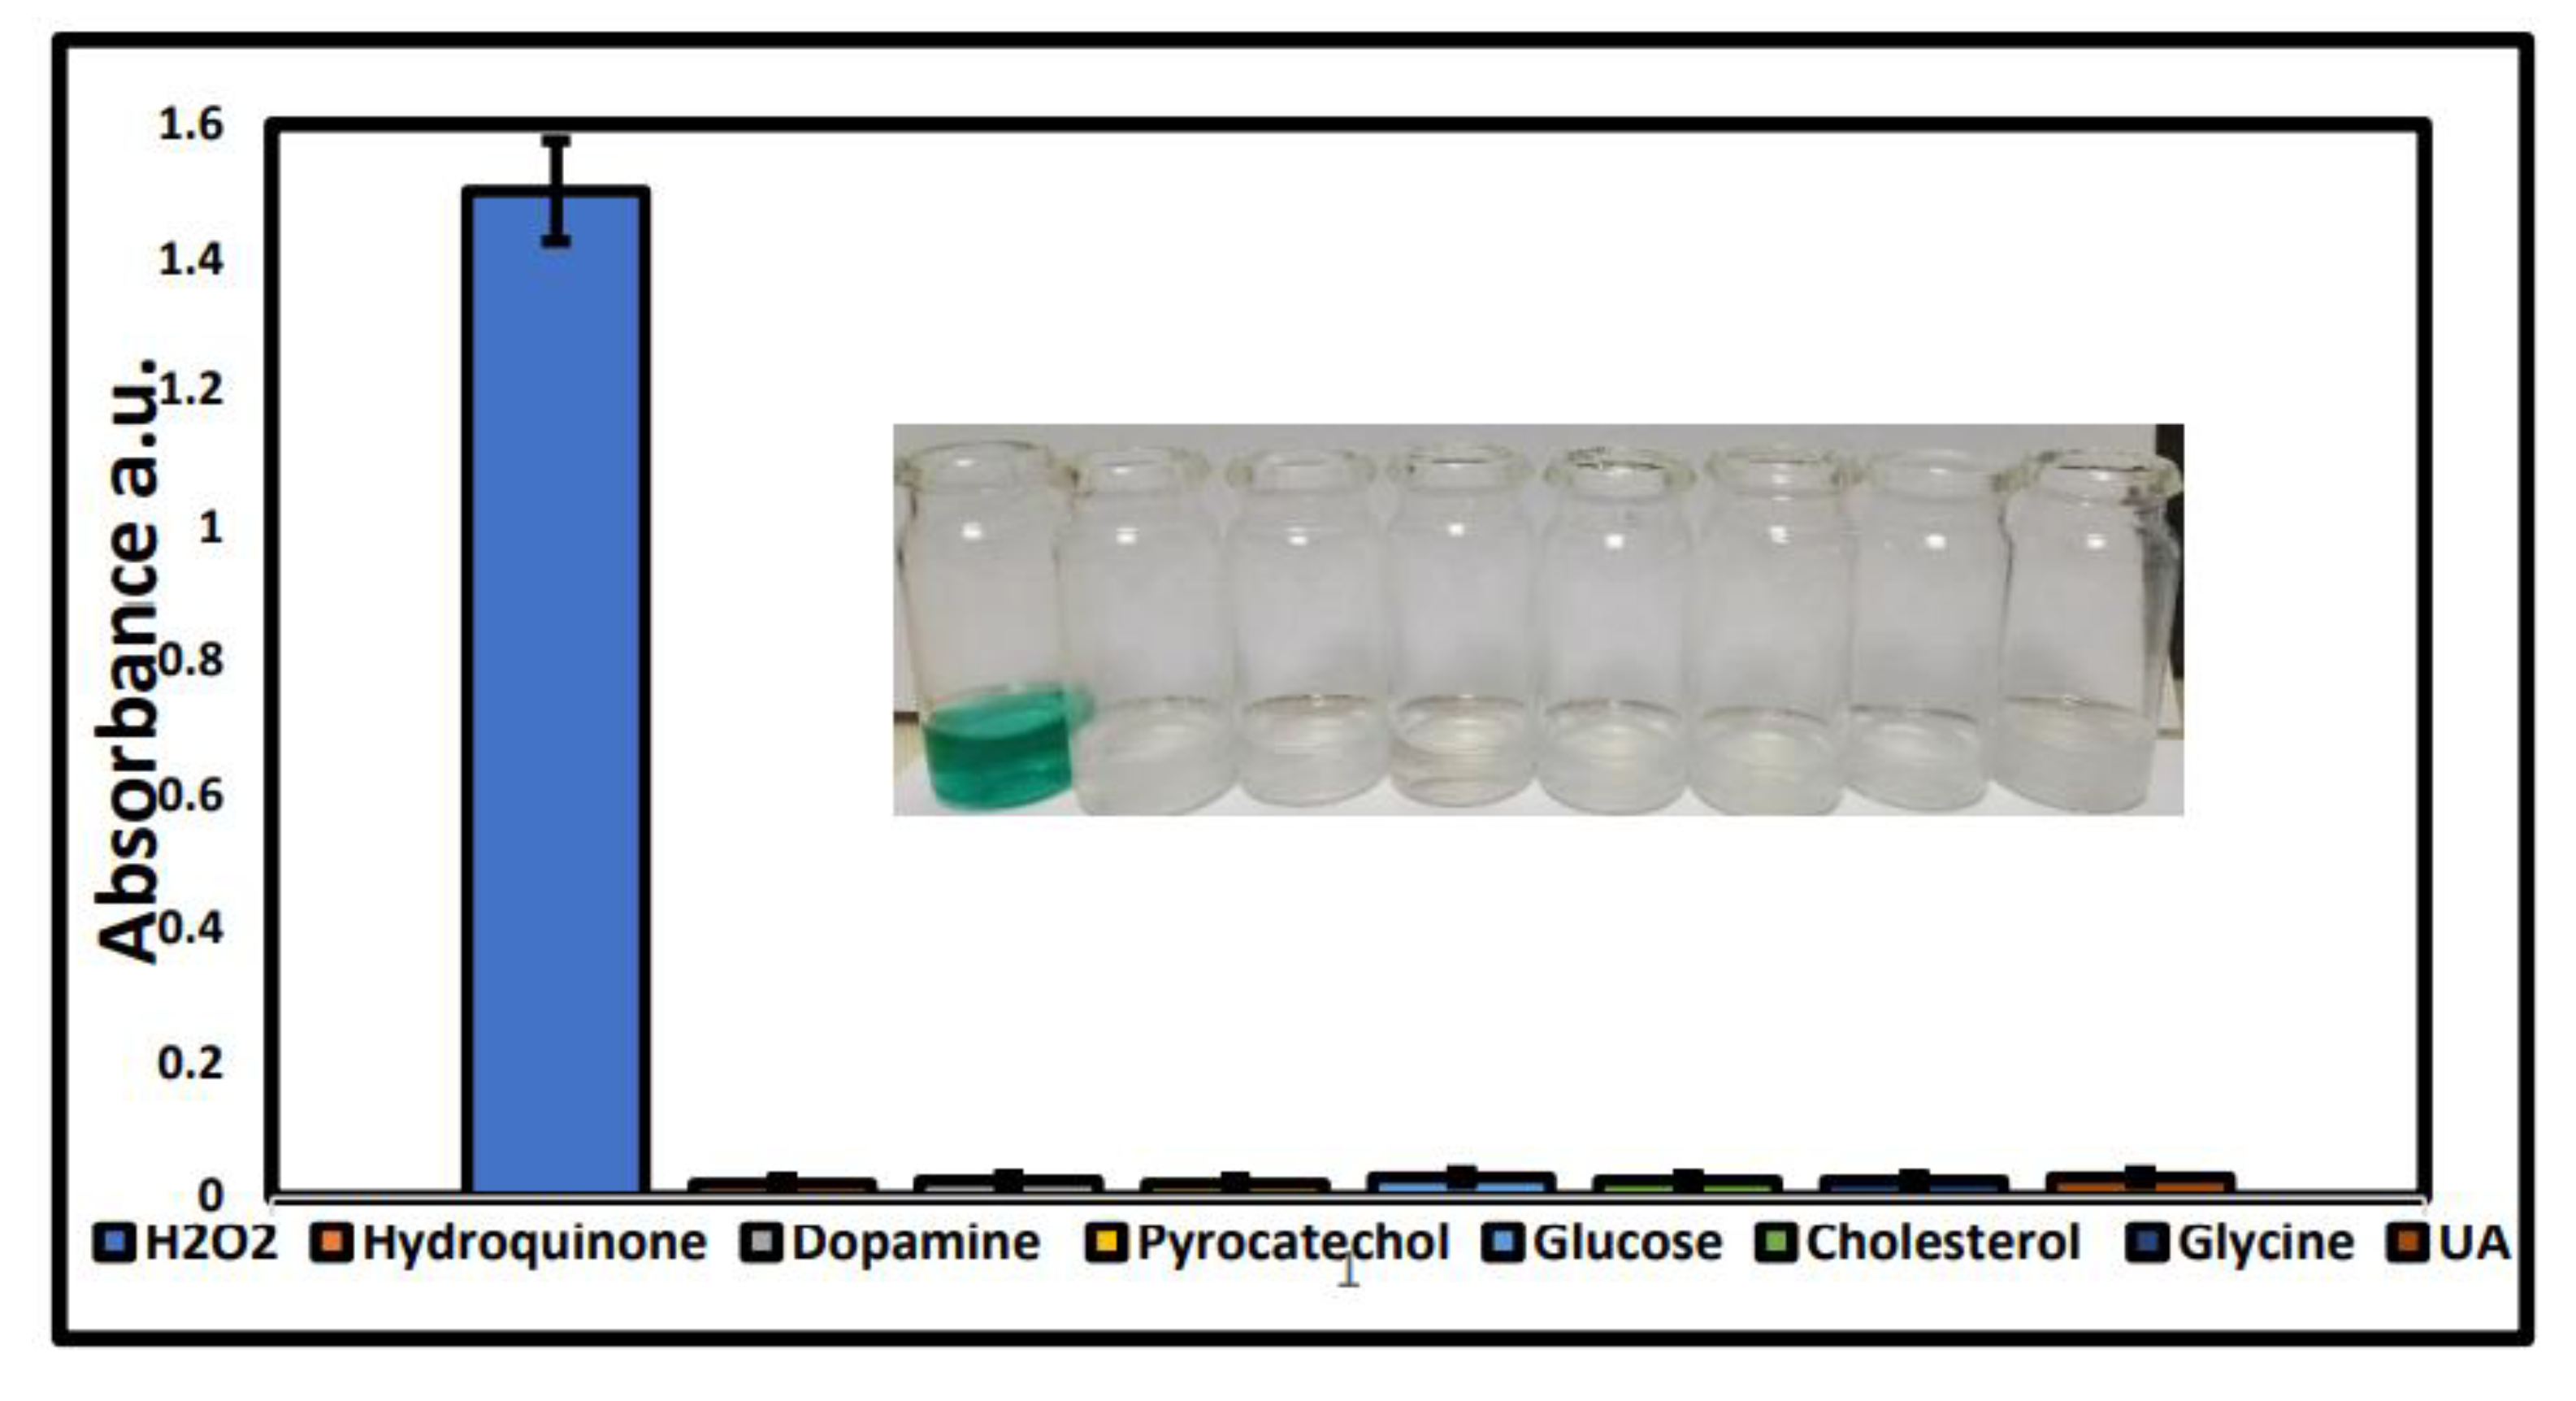
2.6. Interference Experiments

Selectivity is a major concern for gauging sensor action. In order to evaluate the selectivity of the said H2O2 assay, the following potential interfering substances were used in aqueous solution at a concentration of 250 µM: Hydroquinone, Dopamine hydrochloride (Dopamine), Pyrocatechol, Glucose, Cholesterol, Glycine and Uric acid (UA). As observed in Figure 15, only the addition of H2O2 induced an obvious color change (Figure 15 inset) and a dramatic change in absorbance, whereas negligible changes were observed with other interference substances. The results clearly suggested that the commonly existing interferences were inert to the developed H2O2 assay, hinting towards the high selectivity of the green catalyst towards H2O2 sensing. Therefore, the proposed colorimetric analysis method could be used for the efficient and highly selective detection of H2O2.

3. Materials and Methods

3.1. Chemicals and Reagents

Zirconium Chloride (ZrCl4) was purchased from UNI-Chem. 3,3′,5,5′-tetramethylbenzidine (TMB) was bought from Tokyo Chemical Industries (TCI, Tokyo, Japan). Hydrogen peroxide (29.32% in H2O2) was obtained from Merck (Dermstadt, Germany). Potassium permanganate (KMnO4) and Sulfuric acid (H2SO4) (95.0–98.0%) was bought from Sigma Aldrich (Louis, MO, USA). Hydrochloric acid (HCl) 98% was from Analar (Radnor,Pa.,USA). Graphite, Sodium hydroxide (NaOH) and Dimethyl sulfoxide (DMSO) were received from DAEJUNG (Busan, South Korea). Deionized water (DI) was obtained from Elga PureLab Ultra Water Deionizer (England, UK), and was used in all the experiments. All other chemicals used were of analytical grade and purchased from local suppliers.

3.2. Instruments

The elemental analysis, shape, and surface morphology of the Zr-GO composite was examined using the Scanning Electron Microscope (SEM, Vega 3, LMU, Tescan, Brno, Czech). Fourier transform Infrared (FTIR) spectra were recorded using Thermo Fisher Scientific (Nicolet 6700, Waltham, MA, USA) spectrometer with resolution 8 cm−1 and scan range 4000–600 cm−1 at the Attenuated Total Reflectance (ATR) mode, for the determination of functional groups present in the samples. Absorbance measurements were estimated by UV-Visible Spectrophotometer Lambda-25 (UV-25, Perkin Elmer, Waltham, MA, USA) with a bandwidth setting of 1 nm at a scan speed of 960 nm min−1 between the wavelength range of 200–800 nm. Raman spectroscopy was used (In-Via Raman Microscope (Raman & PL setup, Renishaw, Kingswood, UK) to probe the effect of composite in our experiment. The structure and crystalline phase of the composite was explored by X-Ray diffractometry (XRD) using Bruker D8 Advanced machine (Bellirica, USA) at an excitation wavelength of 1.5406 Å. The Brunauer–Emmett–Teller (BET) analysis was carried out for assessment of the surface area and pore volume of the fabricated samples using Autosorb iQ (Quantachrome, Boynton Beach, FL, USA), with nitrogen adsorption–desorption tests at 77 K. The thermal properties: Thermometric Gravimetric Analysis (TGA) and Differential Scanning Calorimetry (DSC); of the samples were analyzed by BAXIT Thermal analyzer BXT-DSC-TGA-1250 (Shanghai, China).

3.3. Synthesis of Graphene Oxide

Graphene oxide was synthesized via oxidization of graphite powder using the Modified Hummer’s method. Briefly, graphite powder (2.0 g) was added into H2SO4 (100 mL) and the mixture was stirred at 5 °C for 30 min. KMnO4 (8.0 g) was gradually added under stirring, such that the temperature of the mixture remained less than 10 °C. An amount of 100 mL DI water was added into the mixture and further diluted up to 300 mL. Finally, 30% H2O2 was added to the mixture. The resultant residue was washed several times with 5% HCl aqueous solution and then with DI water till the pH reached 6. The product was dried at 45 °C for 24 h, then dispersed in water and sonicated to exfoliate oxidized graphene.

3.4. Preparation of Zr-GO Composite

The composite was prepared by a simple blending method. A stock solution of Zr was prepared by adding 1 mg of ZrCl4 in 1 mL DI water. Similarly, a stock solution of 1 mg mL−1 GO was prepared in DI water and sonicated for 30 min, till a uniform dispersion was obtained. Then, 0.5 mg mL−1 of Zr solution and 5 µg mL−1 of GO dispersion was added and all were mixed well under magnetic stirring for half an hour at room temperature. The thus prepared aqueous solution of Zr-GO composite was utilized for further experiments.

3.5. Peroxidase-Like Activity Measurements

To investigate the capability of Zr as nanozyme towards the oxidation of TMB, a total reaction solution of 4 mL containing DI water (neutral pH), 2.5 mM TMB (dissolved in DMSO), 250 µM H2O2, and 0.5 mg mL−1 Zr-GO composite was prepared. In a typical test, 900 μL DI water, 100 μL H2O2 (250 µM), 1000 μL TMB (2.5 mM), and 2000 μL from the aqueous solution of Zr-GO composite were mixed in a glass vial. All the reactions were surveyed by a UV-Vis spectrophotometer at 652 nm.

3.6. Investigation of Catalytic Mechanism

In order to study the peroxidase-like enzymatic mechanism of Zr-GO, terephthalic acid (TA) was acquired as a fluorescent probe, specifically to capture the generated hydroxyl radicals (·OH). Typically, DI water, 150 μL H2O2 (500 µM), 600 μL TA (2 mM, dissolved in a NaOH solution), 20 μL GO (5 µg. mL−1) and varying concentrations of ZrCl4 (0.1, 0.25, 0.5, 0.75, 1 mg mL−1) (containing Zr) were mixed in a 3 mL cuvette and incubated at room temperature for 30 min. The fluorescence spectra were obtained on a Fluorolog-3 fluorimeter at λex = 315 nm.
Scavenger experiments: To investigate the role of radicals (·OH) in the catalytic mechanism, experiments were carried out in the presence of 0.5 mg mL−1 Zr-GO, 2.5 mM TMB, 250 µM H2O2 and Ethylenediaminetetraacetic acid disodium (EDTA), isopropyl alcohol (IPA), ascorbic acid (AA) (1 mM each) in DI water at room temperature. The absorbance was read at 652 nm after 30 min of incubation.

3.7. Colorimetric Detection of H2O2

After confirming the function of this system, the effects of temperature (20–60 °C), TMB concentration (1–5 mM), Zr concentration (0.1–10 mg mL−1) and GO concentration (1–10 µg mL−1) were optimized before carrying out the detection of H2O2. In a typical experiment, 0.5 mg mL−1 Zr-GO, 2.5 mM TMB and H2O2 with different concentrations (1 µM-1 mM) were added to DI water in an orderly manner. The mixture was incubated at room temperature for 3 min. Then, UV-Vis absorbance spectroscopy was performed to measure the changes in absorbance at 652 nm with varying concentrations of H2O2.

3.8. Determination of Selectivity

The selectivity of the developed sensing system was determined by adding potential interfering substances to the reaction system (uric acid, glucose, catechol, dopamine, cholesterol, glycine, hydroquinone) instead of H2O2 in a similar fashion. The final concentration of all the interfering substances was 250 µM.

4. Conclusions

In this work, remarkable intrinsic peroxidase-like activity of Zirconium (Zr) is introduced. This green catalyst, combined with the outstanding features of graphene oxide (GO), can rapidly oxidize the optically active substrate 3,3′,5,5′-tetramethylbenzidine (TMB) in the presence of hydrogen peroxide (H2O2). Compared to traditional bio-enzymes and nanozymes, Zr-GO composite exhibits excellent activity to trigger the oxidation of colorless TMB into a blue oxidized TMB (oxTMB), distinguishable with the naked eyes. A facile colorimetric method for H2O2 detection is, thus, developed by employing Zr loaded GO enzyme mimic as the sensing platform. Zr can adsorb on the surface of GO by electrostatic force and donate its electrons to GO. The electrons on the composite interface efficiently decompose H2O2 into ·OH. The oxidation of TMB is greatly enhanced, as more ·OH radicals are generated by the surface of the Zr-GO probe, making it more sensitive towards the target H2O2. This work aimed to elucidate the chemical regulation of the catalytic mechanism based on the Zr-GO composite. The effects of experimental parameters, including reaction medium and its pH, reaction temperature, and concentration of zirconium chloride (ZrCl4), on the catalytic activity of Zr-GO were investigated spectrophotometrically at 652 nm. The significant absorbance, owing to the catalytic effect of Zr-GO composite, offered accurate detection of H2O2 in the range of 100–1000 μM, with a detection limit of 0.57 μM. Compared to other absorbance-based strategies, this multifunctional detection system displayed high selectivity and sensitivity in a neutral medium at room temperature. However, the response time of the system was a bit longer than others (i.e., 2 min). Nevertheless, with some careful modifications, the response time of the developed system could be made quicker in future studies. Real sample analysis extends the prospects of a sensing system in biosensing and biomedical applications. This analysis can be done in future to enhance the productivity of this work. Overall, it is anticipated that the merits of the developed system, including having an eco-friendly catalyst, no complex sample preparation procedures, low cost and easy analytical operation in a neutral medium and at room temperature, endow this green colorimetric platform with great potential in the fields of sensors, synthetic chemistry, food safety, environmental monitoring, pharmaceuticals and bioanalytical assays.

Author Contributions

Conceptualization, A.S.S.; formal analysis, A.H.; investigation, A.S.S.; methodology, A.S.S. and M.N.; supervision, A.H. and M.N.; writing—original draft, A.S.S.; writing—review and editing, M.A.A., M.H.N. and M.N. All authors have read and agreed to the published version of the manuscript.

Funding

We appreciate the funding from Pakistan Science Foundation through its PSF-NSFC funded project (Project No. PSF/NSFC-II/Eng/P-COMSATS-Lhr (07)) and The World Academy of Sciences through its COMSTECH-TWAS individual grants have project No. 17-224 RG/MSN/AS_C–FR3240300073.

Data Availability Statement

The data presented in this study are available on request from the corresponding author. The data are not publicly available due to privacy reasons.

Conflicts of Interest

The authors declare no conflict of interest.

References

  1. Hu, Z.; Dai, Z.; Hu, X.; Chen, K.; Gao, C.; Zheng, X.; Yu, Y. Synthesis of PB@ FePt hybrid nanoparticles with peroxidase-mimicking activity for colorimetric determination of hydrogen peroxide in living cells. Anal. Methods 2019, 11, 677–683. [Google Scholar] [CrossRef]
  2. Zhang, J.; Kong, Y.; Yang, Y.; Chen, N.; Feng, C.; Huang, X.; Yu, C. Fast Capture of Fluoride by Anion-Exchange Zirconium–Graphene Hybrid Adsorbent. Langmuir 2019, 35, 6861–6869. [Google Scholar] [CrossRef] [PubMed]
  3. Gul, U.; Kanwal, S.; Tabassum, S.; Gilani, M.A.; Rahim, A. Microwave-assisted synthesis of carbon dots as reductant and stabilizer for silver nanoparticles with enhanced-peroxidase like activity for colorimetric determination of hydrogen peroxide and glucose. Microchim. Acta 2020, 187, 135. [Google Scholar] [CrossRef] [PubMed]
  4. Rauf, S.; Ali, N.; Tayyab, Z.; Shah, M.Y.; Yang, C.P.; Hu, J.; Kong, W.; Huang, Q.; Hayat, A.; Muhammad, N. Ionic liquid coated zerovalent manganese nanoparticles with stabilized and enhanced peroxidase-like catalytic activity for colorimetric detection of hydrogen peroxide. Mater. Res. Express 2020, 7, 035018. [Google Scholar] [CrossRef]
  5. Liu, M.-M.; Li, S.-H.; Huang, D.-D.; Xu, Z.-W.; Wu, Y.-W.; Lei, Y.; Liu, A.-L. MoOx quantum dots with peroxidase-like activity on microfluidic paper-based analytical device for rapid colorimetric detection of H2O2 released from PC12 cells. Sens. Actuators B Chem. 2020, 305, 127512. [Google Scholar] [CrossRef]
  6. Singh, S. Nanomaterials exhibiting enzyme-like properties (Nanozymes): Current advances and future perspectives. Front. Chem. 2019, 7, 46. [Google Scholar] [CrossRef]
  7. Zhao, X.; Wu, K.; Lyu, H.; Zhang, X.; Liu, Z.; Fan, G.; Zhang, X.; Zhu, X.; Liu, Q. Porphyrin functionalized Co(OH) 2/GO nanocomposites as an excellent peroxidase mimic for colorimetric biosensing. Analyst 2019, 144, 5284–5291. [Google Scholar] [CrossRef]
  8. Dong, W.; Huang, Y. CeO2/C nanowire derived from a cerium (III) based organic framework as a peroxidase mimic for colorimetric sensing of hydrogen peroxide and for enzymatic sensing of glucose. Microchim. Acta 2020, 187, 11. [Google Scholar] [CrossRef]
  9. Ai, Y.; Hu, Z.; Liang, X.; Sun, H.; Xin, H.; Liang, Q. Recent advances in Nanozymes: From matters to bioapplications. Adv. Funct. Mater. 2022, 32, 2110432. [Google Scholar] [CrossRef]
  10. Lee, J.; Liao, H.; Wang, Q.; Han, J.; Han, J.-H.; Shin, H.; Ge, M.; Park, W.; Li, F. Exploration of nanozymes in viral diagnosis and therapy. In Exploration; Wiley Online Library: Hoboken, NJ, USA, 2022. [Google Scholar]
  11. Deng, H.-H.; Luo, B.-Y.; He, S.-B.; Chen, R.-T.; Lin, Z.; Peng, H.-P.; Xia, X.-H.; Chen, W. Redox recycling-triggered peroxidase-like activity enhancement of bare gold nanoparticles for ultrasensitive colorimetric detection of rare-earth Ce3+ ion. Anal. Chem. 2019, 91, 4039–4046. [Google Scholar] [CrossRef]
  12. Song, C.; Ding, W.; Zhao, W.; Liu, H.; Wang, J.; Yao, Y.; Yao, C. High peroxidase-like activity realized by facile synthesis of FeS2 nanoparticles for sensitive colorimetric detection of H2O2 and glutathione. Biosens. Bioelectron. 2020, 151, 111983. [Google Scholar] [CrossRef] [PubMed]
  13. Wang, Y.; Xu, L.; Xie, W. Rapid and sensitive colorimetric sensor for H2O2 and Hg2+ detection based on homogeneous iodide with high peroxidase-mimicking activity. Microchem. J. 2019, 147, 75–82. [Google Scholar] [CrossRef]
  14. Nikoofar, K.; Khademi, Z. A review on green Lewis acids: Zirconium (IV) oxydichloride octahydrate (ZrOCl2 8H2O) and zirconium (IV) tetrachloride (ZrCl4) in organic chemistry. Res. Chem. Intermed. 2016, 42, 3929–3977. [Google Scholar] [CrossRef]
  15. Moghaddam, F.M.; Ismaili, H.; Bardajee, G.R. Zirconium (IV) oxide chloride and anhydrous copper (II) sulfate mediated synthesis of 2-substituted benzothiazoles. Heteroat. Chem. Int. J. Main Group Elem. 2006, 17, 136–141. [Google Scholar]
  16. Nielsen, R.H.; Schlewitz, J.H.; Neilson, H. Zirconium and zirconium compounds. Kirk-Othmer Encycl. Chem. Technol. 2000, 1–46. [Google Scholar] [CrossRef]
  17. Abdollahi-Alibeik, M.; Shabani, E. Synthesis of 2,3-dihydroquinazolin-4(1H)-ones catalyzed by zirconium (IV) chloride as a mild and efficient catalyst. Chin. Chem. Lett. 2011, 22, 1163–1166. [Google Scholar] [CrossRef]
  18. Zhang, G.; Yu, K.; Zhou, B.; Wang, J.; Zheng, C.; Qu, L.; Chai, H.; Zhang, X. Magnetic zirconium-based Prussian blue analog nanozyme: Enhanced peroxidase-mimicking activity and colorimetric sensing of phosphate ion. Microchim. Acta 2022, 189, 220. [Google Scholar] [CrossRef]
  19. Yang, J.; Dai, H.; Sun, Y.; Wang, L.; Qin, G.; Zhou, J.; Chen, Q.; Sun, G. 2D material–based peroxidase-mimicking nanozymes: Catalytic mechanisms and bioapplications. Anal. Bioanal. Chem. 2022, 414, 2971–2989. [Google Scholar] [CrossRef]
  20. Menon, S.; Sam, S.; Keerthi, K.; Kumar, K.G. Carbon nanomaterial-based sensors: Emerging trends, markets, and concerns. Carbon Nanomater.-Based Sens. 2022, 347–379. [Google Scholar] [CrossRef]
  21. Chen, W.; Zhang, X.; Li, J.; Chen, L.; Wang, N.; Yu, S.; Li, G.; Xiong, L.; Ju, H. Colorimetric Detection of Nucleic Acids through Triplex-Hybridization Chain Reaction and DNA Controlled Growth of Platinum Nanoparticles on Graphene Oxide. Anal. Chem. 2020, 92, 2714–2721. [Google Scholar] [CrossRef]
  22. Youssef, K.; Hashim, A.; Roberto, S.; Hamed, S.F.; Abd Elsalam, K. Graphene-based nanocomposites: Synthesis, characterizations, and their agri-food applications. In Carbon Nanomaterials for Agri-Food and Environmental Applications; Elsevier: Amsterdam, The Netherlands, 2020; pp. 33–57. [Google Scholar]
  23. Qi, Y.; Chen, Y.; He, J.; Gao, X. Highly sensitive and simple colorimetric assay of hydrogen peroxide and glucose in human serum via the smart synergistic catalytic mechanism. Spectrochim. Acta Part A Mol. Biomol. Spectrosc. 2020, 234, 118233. [Google Scholar] [CrossRef] [PubMed]
  24. Qiu, N.; Liu, Y.; Guo, R. Electrodeposition-assisted Rapid Preparation of Pt Nanocluster/3D Graphene Hybrid Nanozyme with Outstanding Multiple Oxidase-Like Activity for Distinguishing Colorimetric Determination of Dihydroxybenzene Isomers. ACS Appl. Mater. Interfaces 2020, 12, 15553–15561. [Google Scholar] [CrossRef] [PubMed]
  25. Wu, Z.; Zhang, L.; Guan, Q.; Ning, P.; Ye, D. Preparation of α-zirconium phosphate-pillared reduced graphene oxide with increased adsorption towards methylene blue. Chem. Eng. J. 2014, 258, 77–84. [Google Scholar] [CrossRef]
  26. Nataraj, N. An Efficient Electrochemical Sensor Based on Zirconium Molybdate Decorated Reduced Graphene Oxide for the Detection of Hydroquinone. Int. J. Electrochem. Sci. 2020, 15, 8321–8335. [Google Scholar] [CrossRef]
  27. Wang, Z.; Huang, Z.; Li, X.; Zhou, J. A nano graphene oxide/α-zirconium phosphate hybrid for rigid polyvinyl chloride foams with simultaneously improved mechanical strengths, smoke suppression, flame retardancy and thermal stability. Compos. Part A Appl. Sci. Manuf. 2019, 121, 180–188. [Google Scholar] [CrossRef]
  28. Ye, K.; Li, Y.; Yang, H.; Li, M.; Huang, Y.; Zhang, S.; Ji, H. An ultrathin carbon layer activated CeO2 heterojunction nanorods for photocatalytic degradation of organic pollutants. Appl. Catal. B Environ. 2019, 259, 118085. [Google Scholar] [CrossRef]
  29. Li, Y.; Xia, Y.; Liu, K.; Ye, K.; Wang, Q.; Zhang, S.; Huang, Y.; Liu, H. Constructing Fe-MOF-derived Z-scheme photocatalysts with enhanced charge transport: Nanointerface and carbon sheath synergistic effect. ACS Appl. Mater. Interfaces 2020, 12, 25494–25502. [Google Scholar] [CrossRef]
  30. Biira, S.; Hlatshwayo, T.T.; Crouse, P.L.; Bissett, H.; Thabethe, T.T.; Mlambo, M.; Malherbe, J.B. Effect of the ZrCl4 static vaporiser system and deposition time on growth characteristics of chemical vapour deposited zirconium carbide layers. Appl. Phys. A 2019, 125, 185. [Google Scholar] [CrossRef]
  31. Marin, P.; Módenes, A.N.; Bergamasco, R.; Paraíso, P.R.; Hamoudi, S. Synthesis, characterization and application of ZrCl4-graphene composite supported on activated carbon for efficient removal of fluoride to obtain drinking water. Water Air Soil Pollut. 2016, 227, 479. [Google Scholar] [CrossRef]
  32. Wang, Y.; Chen, D.; Zhang, J.; Balogun, M.T.; Wang, P.; Tong, Y.; Huang, Y. Charge Relays via Dual Carbon-Actions on Nanostructured BiVO4 for High Performance Photoelectrochemical Water Splitting. Adv. Funct. Mater. 2022, 32, 2112738. [Google Scholar] [CrossRef]
  33. Pourbeyram, S. Effective removal of heavy metals from aqueous solutions by graphene oxide–zirconium phosphate (GO–Zr-P) nanocomposite. Ind. Eng. Chem. Res. 2016, 55, 5608–5617. [Google Scholar] [CrossRef]
  34. Hosseinzadeh, H.; Ramin, S. Effective removal of copper from aqueous solutions by modified magnetic chitosan/graphene oxide nanocomposites. Int. J. Biol. Macromol. 2018, 113, 859–868. [Google Scholar] [CrossRef] [PubMed]
  35. Jang, J.; Lee, D.S. Three-dimensional barium-sulfate-impregnated reduced graphene oxide aerogel for removal of strontium from aqueous solutions. J. Nucl. Mater. 2018, 504, 206–214. [Google Scholar] [CrossRef]
  36. Vu, T.H.T.; Tran, T.T.T.; Le, H.N.T.; Nguyen, P.H.T.; Bui, N.Q.; Essayem, N. A new green approach for the reduction of graphene oxide nanosheets using caffeine. Bull. Mater. Sci. 2015, 38, 667–671. [Google Scholar]
  37. Kumar, R.; Singh, R.; Gurjar, A.; Kashyap, R.; Kumar, M.; Kumar, D. Study the thermal stability of functionalized graphene oxide. In AIP Conference Proceedings; AIP Publishing LLC: Melville, NY, USA, 2019. [Google Scholar]
  38. Du, R.; Shi, Z.; Yu, C.; Rao, W.; Xu, C.; Wang, J. Synthesis of graphene oxide/sulfur composites for advanced lithium-sulfur batteries. Ionics 2021, 27, 4269–4279. [Google Scholar] [CrossRef]
  39. Cui, S.; Suo, H.; Jing, F.; Yu, S.; Xue, J.; Shen, X.; Lin, B.; Jiang, S.; Liu, Y. Facile preparation of ZrCO composite aerogel with high specific surface area and low thermal conductivity. J. Sol-Gel Sci. Technol. 2018, 86, 383–390. [Google Scholar] [CrossRef]
  40. Hussein, A.; Sarkar, S.; Oh, D.; Lee, K.; Kim, B. Epoxy/p-phenylenediamine functionalized graphene oxide composites and evaluation of their fracture toughness and tensile properties. J. Appl. Polym. Sci. 2016, 133, 43821. [Google Scholar] [CrossRef]
  41. Hussein, A.; Sarkar, S.; Kim, B. Low temperature reduction of graphene oxide using hot-plate for nanocomposites applications. J. Mater. Sci. Technol. 2016, 32, 411–418. [Google Scholar] [CrossRef]
  42. Farivar, F.; Yap, P.L.; Karunagaran, R.; Losic, D. Thermogravimetric analysis (TGA) of graphene materials: Effect of particle size of graphene, graphene oxide and graphite on thermal parameters. J. Carbon Res. 2021, 7, 41. [Google Scholar] [CrossRef]
  43. Fares, M.M.; Al-Rub, F.A.A.; Mohammad, A.R. Ultimate eradication of the ciprofloxacin antibiotic from the ecosystem by nanohybrid GO/O-CNTs. ACS Omega 2020, 5, 4457–4468. [Google Scholar] [CrossRef]
  44. Elganzory, H.H.; Hassan, S.; Aly, S.A.; Abdalla, E.M. Synthesis, Characterization, PXRD Studies, Theoretical Calculation, and Antitumor Potency Studies of a Novel N, O-Multidentate Chelating Ligand and Its Zr (IV), V (IV), Ru (III), and Cd (II) Complexes. Bioinorg. Chem. Appl. 2022, 2022, 2006451. [Google Scholar] [CrossRef]
  45. Zhang, X.; Wang, C.; Gao, Y. Cerium (III)-doped MoS2 nanosheets with expanded interlayer spacing and peroxidase-mimicking properties for colorimetric determination of hydrogen peroxide. Microchim. Acta 2020, 187, 111. [Google Scholar] [CrossRef] [PubMed]
  46. Li, M.; Lv, J.; Wang, S.; Wang, J.; Lin, Y. Expanded mesoporous silica-encapsulated ultrasmall Pt nanoclusters as artificial enzymes for tracking hydrogen peroxide secretion from live cells. Anal. Chim. Acta 2020, 1104, 180–187. [Google Scholar] [CrossRef] [PubMed]
  47. Pourbeyram, S.; Alizadeh, S.; Gholizadeh, S. Simultaneous removal of arsenate and arsenite from aqueous solutions by graphene oxide-zirconium (GO-Zr) nanocomposite. J. Environ. Chem. Eng. 2016, 4, 4366–4373. [Google Scholar] [CrossRef]
  48. Pidenko, P.S.; Pidenko, S.A.; Skibina, Y.S.; Zacharevich, A.M.; Drozd, D.; Goryacheva, I.Y.; Burmistrova, N.A. Molecularly imprinted polyaniline for detection of horseradish peroxidase. Anal. Bioanal. Chem. 2020, 412, 6509–6517. [Google Scholar] [CrossRef]
  49. Harpaz, D.; Eltzov, E.; Ng, T.S.E.; Marks, R.S.; Tok, A.I.Y. Enhanced Colorimetric Signal for Accurate Signal Detection in Paper-Based Biosensors. Diagnostics 2020, 10, 28. [Google Scholar] [CrossRef]
  50. Oloketuyi, S.; Annovi, G.; de Marco, A. Peroxidase zymograms obtained by agarose native gel electrophoresis have unmet resolution and completeness. Int. J. Biol. Macromol. 2020, 156, 869–873. [Google Scholar] [CrossRef]
  51. Li, Z.; Liu, X.; Liang, X.-H.; Zhong, J.; Guo, L.; Fu, F. Colorimetric determination of xanthine in urine based on peroxidase-like activity of WO3 nanosheets. Talanta 2019, 204, 278–284. [Google Scholar] [CrossRef]
  52. Ragavan, K.; Ahmed, S.R.; Weng, X.; Neethirajan, S. Chitosan as a peroxidase mimic: Paper based sensor for the detection of hydrogen peroxide. Sens. Actuators B Chem. 2018, 272, 8–13. [Google Scholar] [CrossRef]
  53. Fu, B.; Liu, T.; Chen, J.; Li, K. CaF2 nanoparticles as peroxidase mimics for rapid and sensitive detection of aldosterone. Anal. Chim. Acta 2019, 1078, 119–124. [Google Scholar] [CrossRef]
  54. Liu, Y.; Cao, Y.; Zhang, C.; Ye, C.; Bian, Q.; Cheng, X.; Xia, H.; Zheng, J.; Liu, H. A novel colorimetric method for H2O2 sensing and its application: Fe2+-catalyzed H2O2 prevents aggregation of AuNPs by oxidizing cysteine (FeHOAuC). Anal. Chim. Acta 2022, 1207, 339840. [Google Scholar] [CrossRef] [PubMed]
  55. Zhou, Y.; Dong, H.; Liu, L.; Li, M.; Xiao, K.; Xu, M. Selective and sensitive colorimetric sensor of mercury (II) based on gold nanoparticles and 4-mercaptophenylboronic acid. Sens. Actuators B Chem. 2014, 196, 106–111. [Google Scholar] [CrossRef]
  56. Ilyas, Q.; Waseem, M.T.; Junaid, H.M.; Khan, Z.A.; Munir, F.; Shaikh, A.J.; Shahzad, S.A. Fluorescein based fluorescent and colorimetric sensors for sensitive detection of TNP explosive in aqueous medium: Application of logic gate. Spectrochim. Acta Part A Mol. Biomol. Spectrosc. 2022, 272, 120994. [Google Scholar] [CrossRef]
  57. Rasheed, Q.; Ajab, H.; Farooq, M.; Shahzad, S.A.; Yaqub, A. Fabrication of colorimetric sensor using Fe3O4@ Musa paradisiaca L. nanoparticles for detecting hydrogen peroxide: An application in environmental and biological samples. Appl. Nanosci. 2022, 12, 1–15. [Google Scholar] [CrossRef]
  58. Rathinam, R.; Singh, D.P.; Dutta, A.; Rudresha, S.; Ali, S.R.; Chatterjee, P. TiO2 Nanoparticles Based Peroxidase Mimics for Colorimetric Sensing of Cholesterol and Hydrogen Peroxide. In Advances in Science and Technology; Trans Tech Publication: Bäch SZ, Switzerland, 2022; Volume 117. [Google Scholar]
  59. Abd El-Salam, F.H.; Taher, F.A.; Shaban, S. Synthesis of Silver Decorated Magnetic Fe3o4/Alginate Polymeric Surfactant with Controllable Catalytic and Enzymatic-Mimic Activity for Solid-Colorimetric H2O2 Detection. SSRN Soc. Sci. Res. Netw. 2022. [Google Scholar] [CrossRef]
  60. Wang, D.; Dang, X.; Tan, B.; Zhan, Q.; Zhao, H. 3D V2O5-MoS2/rGO nanocomposites with enhanced peroxidase mimicking activity for sensitive colorimetric determination of H2O2 and glucose. Spectrochim. Acta Part A Mol. Biomol. Spectrosc. 2022, 269, 120750. [Google Scholar] [CrossRef]
  61. Ye, H.; Ding, Y.; Liu, T.; Li, J.; Wang, Q.; Li, Y.; Gu, J.; Zhang, Z.; Wang, X. Colorimetric assay based on NiCo2S4@ N, S-rGO nanozyme for sensitive detection of H2O2 and glucose in serum and urine samples. RSC Adv. 2022, 12, 20838–20849. [Google Scholar] [CrossRef]
  62. Wei, X.; Li, Y.; Qi, S.; Chen, Y.; Yin, M.; Zhang, L.; Tian, X.; Gong, S.; Wang, F.; Zhu, Y.; et al. Ce-MOF Nanosphere as Colorimetric Sensor with High Oxidase Mimicking Activity for Sensitive Detection of H2O2. J. Inorg. Organomet. Polym. Mater. 2022, 32, 1–6. [Google Scholar] [CrossRef]
  63. Wang, S.; Hu, Z.; Wei, Q.; Zhang, H.; Tang, Y.; Sun, Y.; Duan, H.; Dai, Z.; Liu, Q.; Zheng, X. Diatomic active sites nanozymes: Enhanced peroxidase-like activity for dopamine and intracellular H2O2 detection. Nano Res. 2022, 15, 4266–4273. [Google Scholar] [CrossRef]
  64. Wang, J.; Zhou, Y.; Zeng, M.; Zhao, Y.; Zuo, X.; Meng, F.; Lv, F.; Lu, Y. Zr (IV)-based metal-organic framework nanocomposites with enhanced peroxidase-like activity as a colorimetric sensing platform for sensitive detection of hydrogen peroxide and phenol. Environ. Res. 2022, 203, 111818. [Google Scholar] [CrossRef]
  65. Tan, E.; Kahyaoğlu, İ.M.; Karakuş, S. A sensitive and smartphone colorimetric assay for the detection of hydrogen peroxide based on antibacterial and antifungal matcha extract silver nanoparticles enriched with polyphenol. Polym. Bull. 2022, 79, 7363–7389. [Google Scholar] [CrossRef] [PubMed]
  66. Yang, Z.; Rong, Q.; Bao, T.; Jiao, M.; Mao, L.; Xue, X.; Wen, W.; Wu, Z.; Zhang, X.; Wang, S. Synthesis of dual-functional CuO nanotubes for high-efficiently photoelectrochemical and colorimetric sensing of H2O2. Anal. Chim. Acta 2022, 1199, 339598. [Google Scholar] [CrossRef] [PubMed]
Figure 1. UV-Visible spectra of (A) Zr and (B) Zr-GO composite in aqueous solution.
Catalysts 12 01105 g001
Figure 2. FTIR spectrum of GO and Zr-GO.
Catalysts 12 01105 g002
Figure 3. Raman spectrum of GO and Zr-GO.
Catalysts 12 01105 g003
Figure 4. SEM images of GO (A) and Zr-GO (B).
Catalysts 12 01105 g004
Figure 5. XRD pattern of GO and Zr-GO.
Catalysts 12 01105 g005
Figure 6. TGA and DSC curves for GO (A) and Zr-GO (B) composite and DSC curves for GO (C) and Zr-GO (D) composite.
Catalysts 12 01105 g006
Figure 7. DTG thermogram for GO (A) and Zr-GO (B).
Catalysts 12 01105 g007
Figure 8. (A) displays the UV-Vis spectra of different reaction systems, and the inset shows the corresponding photograph. The UV-Visible absorption spectra of (a) catalytic reaction volume containing DI water (neutral pH) + TMB (2.5 mM) + H2O2 (2.5 µM) + GO dispersion (5 µg mL−1) + ZrCl4 (0.5 mg mL−1). The mixture was blended and incubated at room temperature for 5 min. (b) TMB+H2O2+Zr, (c) TMB+H2O2+GO (d) TMB+Zr (d) TMB+H2O2 (e) TMB+H2O2 (f) H2O2+Zr. (B) The time-dependent absorbance responses of different systems.
Catalysts 12 01105 g008
Figure 9. Optimization of different parameters on TMB oxidation. Investigation of (A) the effect of different mediums: (a) DI water, (b) PBS (pH-7.4), (c) NaAc (pH-5.5), (B) effect of the increase in temperatures (20 °C, 25 °C, 30 °C, 35 °C, 40 °C, 4 5°C, 50 °C, 55 °C, 60 °C) (C) effect of increasing concentrations of Zr from (a) 0 mg. mL−1 (b) 0.1 mg. mL−1 (c) 0.25 mg. mL−1 (d) 0.5 mg. mL−1 (e) 0.75 mg. mL−1 (f) 1 mg. mL−1 (g) 3 mg. mL−1 (h) 5 mg. mL−1 (i) 10 mg. mL−1 respectively on Zr-GO catalyzed TMB oxidation. (D) Calibration plot of varying concentrations of Zr from (a) 0.1 to (i) 10 mg. mL−1. Error bars show the standard deviation from three parallel measurements.
Catalysts 12 01105 g009
Figure 10. (A) Optimization of varying concentrations of TMB: (a) 1 mM (b) 1.5 mM (c) 2 mM (d) 2.5 mM (e) 3 mM (f) 3.5 mM (g) 4 mM (h) 4.5 mM (i) 5 mM (B) calibration plot of varying concentrations of TMB from (a) to (i). Error bars show the standard deviation from three parallel measurements.
Catalysts 12 01105 g010
Figure 11. The reaction mechanism of Zr-GO peroxidase mimic-catalyzed oxidation TMB in the presence of H2O2.
Catalysts 12 01105 g011
Figure 12. The influence of Zr-GO composite on fluorescence intensity of TA; Reaction conditions: 2 mM TA, 500 µM H2O2, 5 µg mL−1 of GO and ZrCl4 with different concentrations (0.1, 0.25, 0.5, 0.75, 1 mg mL−1) in DI water incubated for 30 min.
Catalysts 12 01105 g012
Figure 13. UV spectrum of different scavengers: (a) H2O2 (b) EDTA (c) O2 (d) IPA (e) AA added to the Zr-GO + H2O2 + TMB reaction system. Inset shows the corresponding absorbance response. Error bars show the standard deviation from three parallel measurements.
Catalysts 12 01105 g013
Figure 14. (A) records the UV–Vis spectra of the TMB + H2O2 + Zr-GO system with different concentrations of H2O2 (a) 1 μM (b) 10 μM (c) 25 μM (d) 50 μM (e) 75 μM (f) 100 μM (g) 250 μM (h) 500 μM (i) 750 μM (j) 1000 μM, (B) depicts the calibration curve for different H2O2 concentrations (a–j), (9B inset) shows the linear relationship between the absorbance at 652 nm and the H2O2 concentration (a) 1 μM to (f) 100 μM.
Catalysts 12 01105 g014
Figure 15. Absorbance response of the colorimetric sensing system in the presence of some interfering substances. The concentration and volume of all reagents were the same (250 μM). Error bars indicate the standard deviation from three equivalent tests.
Catalysts 12 01105 g015
Table 1. Summary of surface area, pore volume and average pore diameter of GO and Zr-GO.
SampleSurface Area (m2 g−1)Average Pore Diameter (nm)Pore Volume (cm3 g−1)
GO37.223.520.017
Zr-GO14.572.130.001
Table 2. Analytical performance of the Colorimetric assay for H2O2 based on Zr-GO enzyme mimic.
AnalyteLinear RangeRegression
Equation Slope
InterceptCorrection
Co-Efficient
LOD
(µM)(µM)
H2O210–10000.0020.0050.9960.57
Table 3. Comparison of H2O2 detection based on different assays using peroxidase mimics.
NanomaterialLinear Range (μM)Detection Limit (μM)References
TiO2 Nanoparticles100 to 50,00061[58]
Ag@Amalg12 @ Fe3O40 to 125014[59]
V2o5-MoS2/Rgo20 to 80012.4[60]
NiCo2S4@N,S-Rgo 40 to 50,00012[61]
Ce-Mof Nanosphere 4000 to 16,00010[62]
Fen3/Ptn4-Single-Atom Nanozymes (Sazyme)10 to 10007.97[63]
Zr-Mof-Pvp Nanocomposites10 to 8002.76[64]
Me-Ag Nps0.05 to 200.82[65]
CuO Nanotubes2 to 1500.62[66]
Zr-GO10 to 10000.57Present study
Publisher’s Note: MDPI stays neutral with regard to jurisdictional claims in published maps and institutional affiliations.

