Article

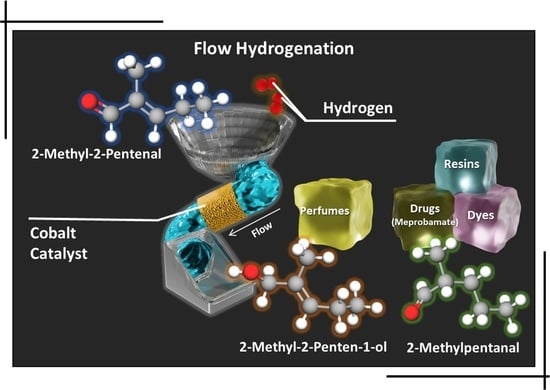
Co Loading Adjustment for the Effective Obtention of a Sedative Drug Precursor through Efficient Continuous-Flow Chemoselective Hydrogenation of 2-Methyl-2-Pentenal

by
Antonio Jesús Fernández-Ropero
1,*,
Bartosz Zawadzki
1,
Krzysztof Matus
2,
Wojciech Patkowski
3,
Mirosław Krawczyk
1,
Dmytro Lisovytskiy
1,
Wioletta Raróg-Pilecka
3 and
Anna Śrębowata
1,*
1
Institute of Physical Chemistry, Polish Academy of Sciences, ul. Kasprzaka 44/52, PL-01224 Warsaw, Poland
2
Materials Research Laboratory, Silesian University of Technology, ul. Konarskiego 18A, PL-44100 Gliwice, Poland
3
Faculty of Chemistry, Warsaw University of Technology, ul. Noakowskiego 3, PL-00664 Warsaw, Poland
*
Authors to whom correspondence should be addressed.
Catalysts 2022, 12(1), 19; https://doi.org/10.3390/catal12010019
Submission received: 30 November 2021 / Revised: 20 December 2021 / Accepted: 22 December 2021 / Published: 25 December 2021
(This article belongs to the Special Issue Transition Metal Catalysis)

Abstract

:
This work presents the effect of Co loading on the performance of CNR115 carbon-supported catalysts in the continuous-flow chemoselective hydrogenation of 2-methyl-2-pentenal for the obtention of 2-methylpentanal, an intermediate in the synthesis of the sedative drug meprobamate. The Co loading catalysts (2, 6, 10, and 14 wt.%) were characterized by Brunauer–Emmett–Teller (BET) surface area analysis, transmission electron microscopy (TEM), H2 temperature-programmed reduction (H2-TPR), temperature-programmed desorption of hydrogen (H2-TPD) analysis, X-ray diffraction (XRD), and X-ray photoelectron spectroscopy for selected samples, and have been studied as hydrogenation catalysts at different pressure and temperature ranges. The results reveal that a certain amount of Co is necessary to achieve significant conversion values. However, excessive loading affects the morphological parameters, such as the surface area available for hydrogen adsorption and the particle size, preventing an increase in conversion, despite the increased presence of Co. Moreover, the larger particle size, caused by increasing the loading, alters the chemoselectivity, favouring the formation of 2-methyl-2-pentenol and, thus, decreasing the selectivity towards the desired product. The 6 wt.% Co-loaded material demonstrates the best catalytic performance, which is related to the formation of NPs with optimum size. Almost 100% selectivity towards 2-methylpentanal was obtained for the catalysts with lower Co loading (2 and 6 wt.%).

Graphical Abstract

1. Introduction

In the last years, batch chemical processing has been moving towards continuous-flow systems [1]. Continuous flow is the performance of chemical reactions in a flowing stream instead of a traditional batch. Safer operations can be achieved due to the lower reaction volumes, better temperature control, and the ability to accommodate higher pressures without risk. Faster reactions can be carried out, as it is much easier to pressurize flow chemistry systems than batch chemistry systems. Improved selectivity can be obtained without additives, thanks to more efficient heat transfer and mixing. As a consequence of these advantages, this system has a small footprint and can offer an accelerated scale-up route from proof-of-concept studies to large-scale manufacture [1,2].
Indeed, the benefit of continuous flow can be applied to heterogeneous catalytic hydrogenation. This reaction is highly relevant in pharmaceutical, agrochemical, food, and fragrances industries [3].
Catalytic hydrogenation usually relies on noble metals, such as Pd or Pt. However, their hydrogenation properties lead to a loss of effectiveness when semi-hydrogenation or chemoselectivity are required. This fact, along with the high cost of noble metals, makes finding suitable alternatives necessary for sustainable development [4].
These alternatives could come from earth/abundant metals, such as Co, Fe, Cu, or Ni [5,6]. They usually require higher pressure and temperature for satisfactory results. However, the continuous-flow method could improve their catalytic properties, necessitating softer reaction conditions [7]. Moreover, the continuous flow would allow safer handling of the high pressures.
An important pharmaceutical intermediate obtained by the chemoselective catalytic hydrogenation of 2-methyl-2-pentenal (MPEA) is 2-methylpentanal (MPAA). This compound is used as a flavouring agent, and is an essential intermediate for dyes, resins, and drugs [8]. One of these drugs is meprobamate, belonging to sedative hypnotics [9].
It is difficult to find academic literature focused on MPAA synthesis from MPEA hydrogenation in the liquid phase; for instance, in a batch system, a Raney cobalt catalyst was investigated, but to obtain the unsaturated alcohol 2-methyl-2-pentenol (MPEO) [10]. The main use of MPEO is in the perfume industry [11]. In this case, to reach a selectivity of 99% towards MPEO, the addition of ferrous chloride to the batch system was required. More recently, Hu et al. demonstrated the importance of defect engineering in preparing a Pd/NiCo2O4−x catalyst to favor C=C vs. C=O hydrogenation on several α,β-unsaturated carbonyl compounds—MPEA being among them [12]. Selectivity close to 100% in MPAA production can be achieved thanks to the oxygen deficiency of the NiCO2O4−x spinel. After interaction with the support, the electron deficiency generated in the Pd enhances the selectivity towards C=C hydrogenation. In addition, the oxygen deficiency in the spinel leads to the subsequent adsorption of the C=O bond and the prevention of alcohol formation.
The hydrogenation of 2-methyl-2-pentenal in the gas phase has been investigated on Pt, Pd, and Cu catalysts supported on precipitated silica by Pham et al. [13]. Pt and Pd show greater preference towards the formation of MPAA, with some production of n-pentane and CO with increasing temperature. Cu catalyses both C=C and C=O bonds. However, over long periods of contact, both products are hydrogenated to 2-methylpentanol (MPAO). At high temperatures, the hydrogenolysis of MPEO and MPAO occurs to give rise to 2-methylpentane and H2O [13] (Scheme 1).
To the best of our knowledge, Co has not been studied for this substrate conversion under liquid-phase continuous-flow conditions. Therefore, this work focused on the catalytic performance of Co as an efficient catalyst for 2-methyl-2-pentenal hydrogenation. The influence of four different Co loadings supported on commercial active carbon Norit CNR115 was analysed for the C=C chemoselective hydrogenation of an MPEA solution to produce MPAA. The morphological differences are explained here to elucidate the divergent behaviour observed for their activity and selectivity to the desired MPAA.

2. Results and Discussion

2.1. N2 Physisorption Results

Nitrogen physisorption experiments were performed to examine the differences in the textural properties of the catalysts with different Co loadings. The specific surface area, total pore volume, and pore size can be observed in Table 1.
There is an evident decrease in the specific surface area when increasing the metal loading, as expected for the deposition of Co particles. It should be noted that the differences are minimal between 6 wt.% and 10 wt.% Co/CNR115. Nevertheless, in the case of Co loading at the extremes (2 and 14 wt.%), there is a 33% reduction in the exposed area.
The total pore volume experiences a linear drop as the amount of Co increases up to 10 wt.%. Once here, similar values are found for 10 and 14 wt.% Co/CNR115. The pore size slightly increases with the Co loading, from 2 to 10 wt.%, due to the first blocking of the smallest pores. For 14 wt.% Co/CNR115, the pore size is 3 Å lower than the other catalysts, which implies that bigger pores start to accumulate metal inside.
In short, increasing the Co loading leads to pore blockage and gradual agglomeration of Co nanoparticles, which eventually leads to a decrease in the BET surface area and total pore volume [14].

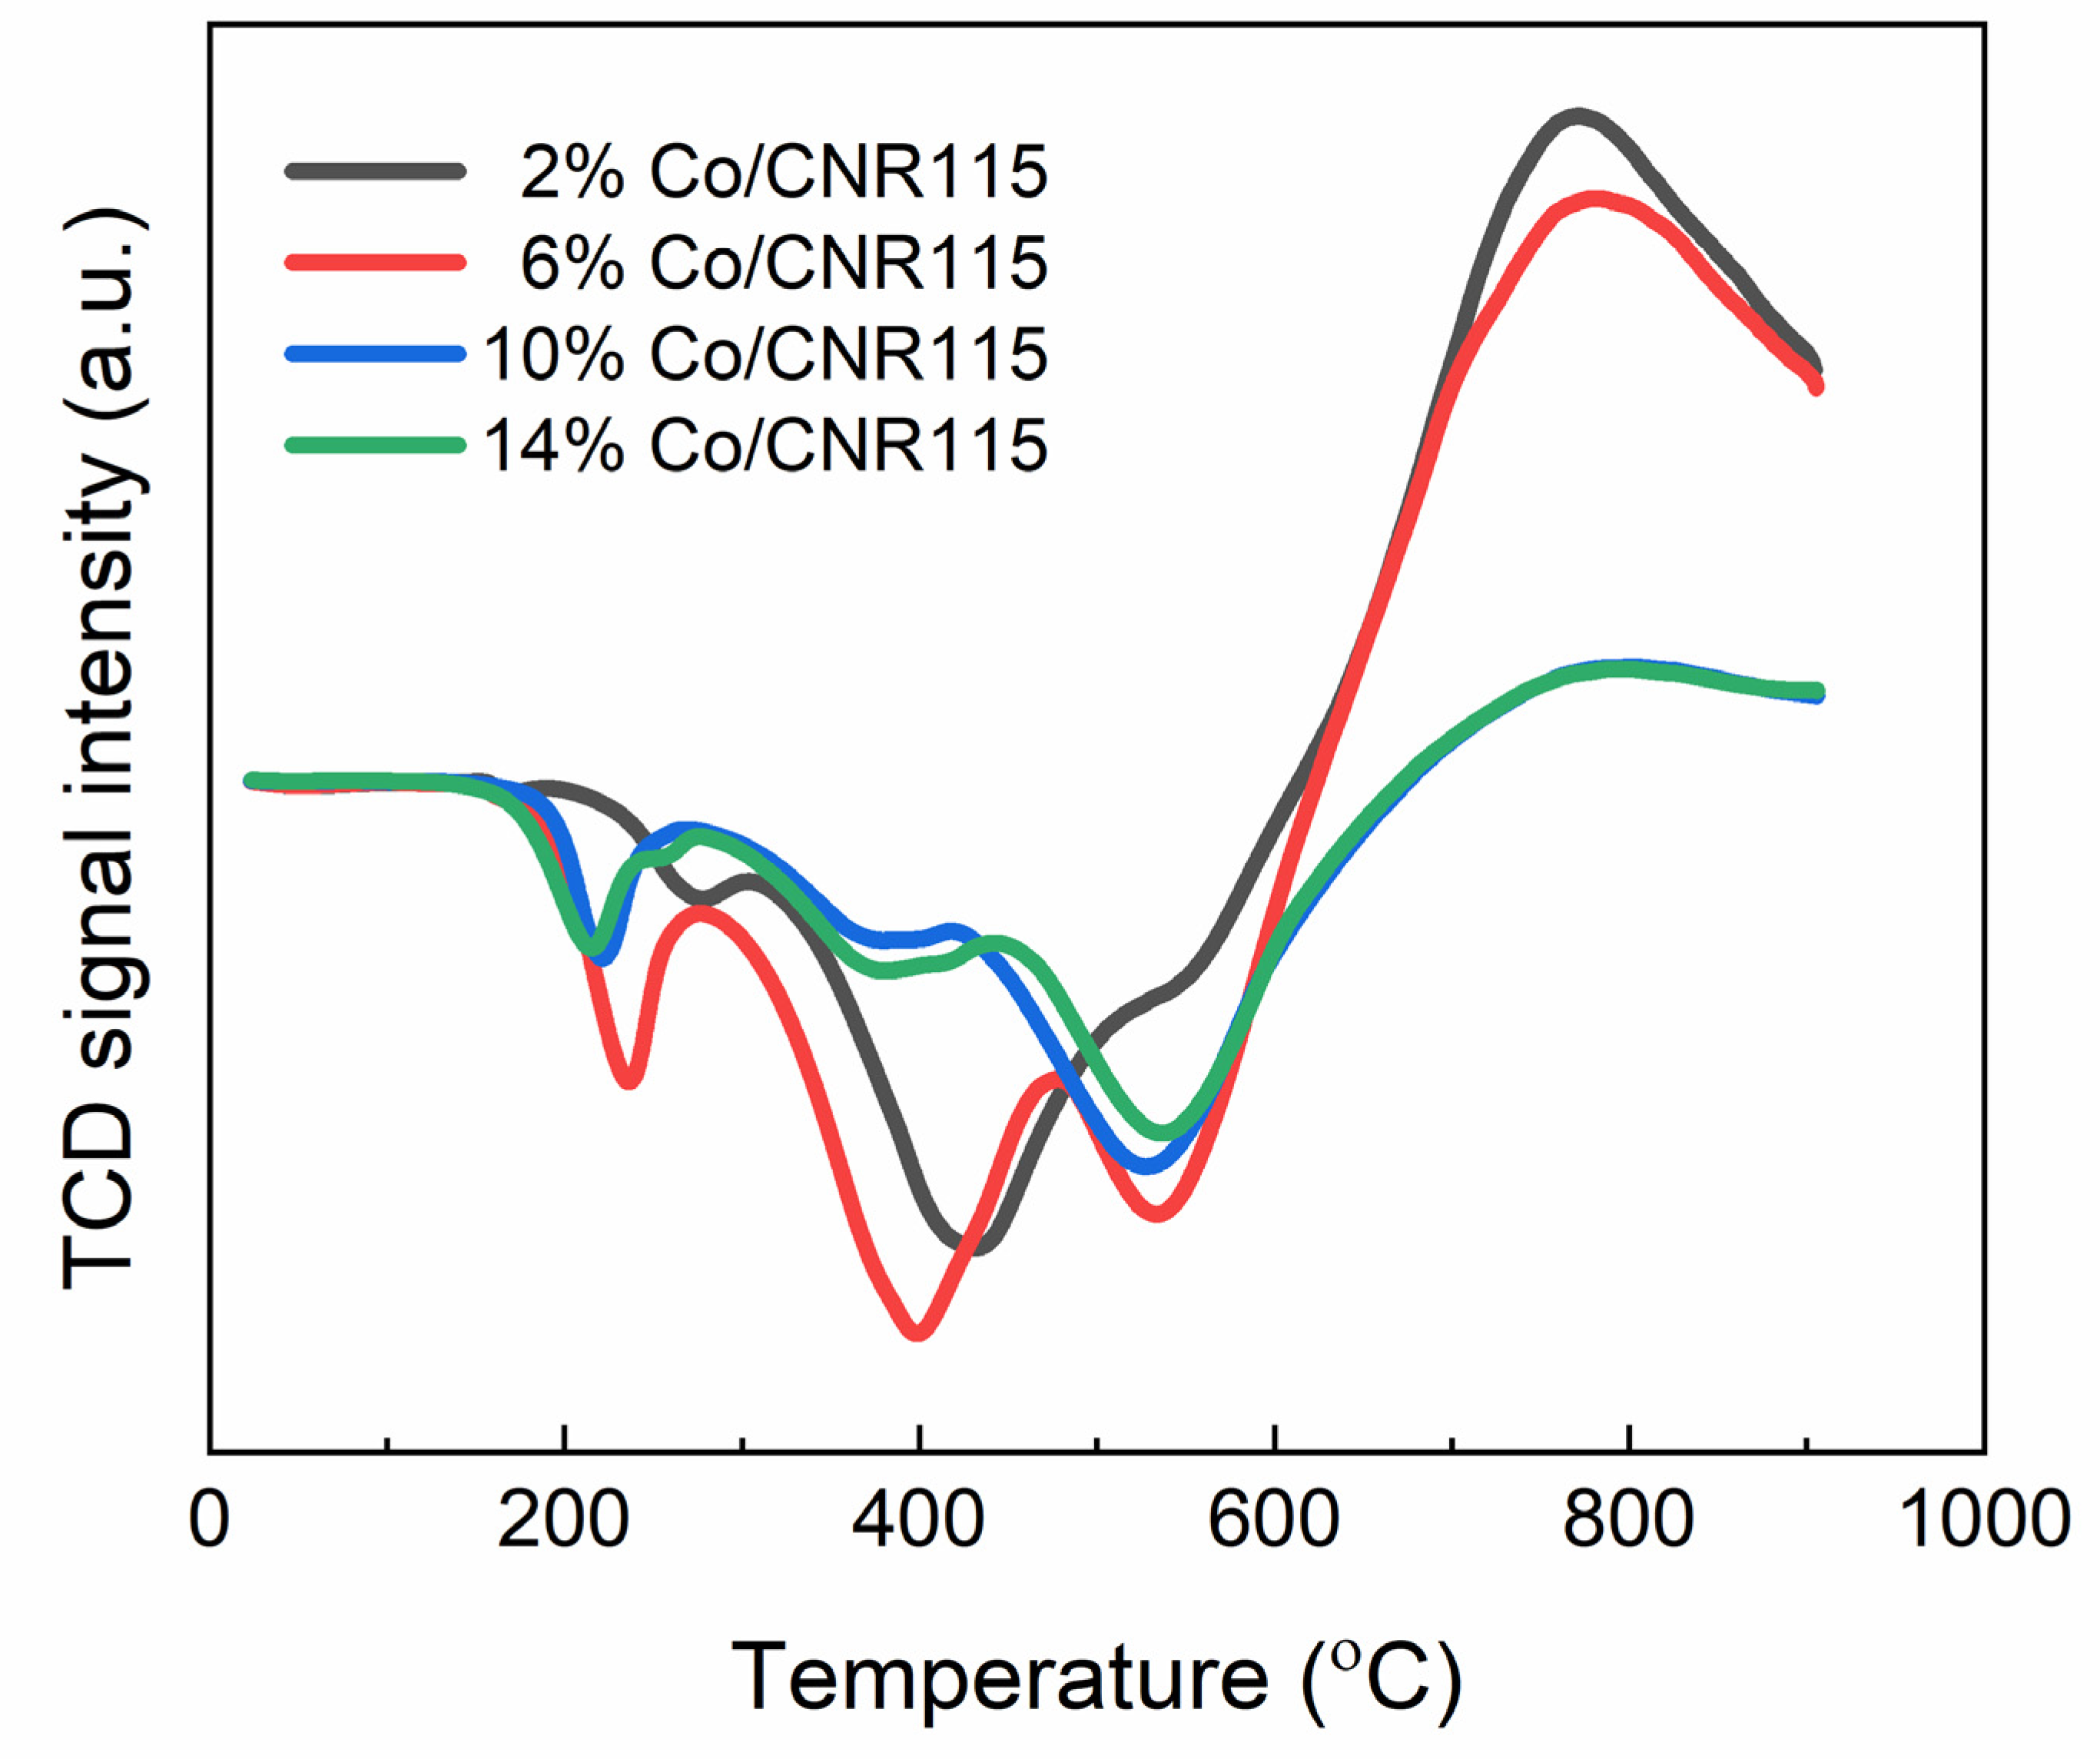
2.2. Temperature-Programmed Reduction Studies (H2-TPR)

The temperature-programmed reduction (H2-TPR) of the four catalysts after incipient wetness impregnation synthesis was carried out to determine the pretreatment conditions. Generally, the H2-TPR profile can significantly vary for the precursor [15], the preparation method [16], and the calcination conditions if this step exists [16,17].
In this case, the profile—especially for the highest metal loadings—resembles that obtained by Lue et al. for 20 wt.% Co supported on commercial active carbon, also prepared by incipient wetness impregnation, with Co nitrate as the precursor [17].
In Figure 1, a first peak for all the samples, between 200 and 300 °C, can be observed, which can be attributable to reductive nitrate decomposition [18]. Afterwards, a broad peak, from 300 °C to 700 °C, unfolded in two semi-overlapped processes, is detected. The process at the lowest temperature would correspond to Co3O4 reduction towards CoO, and at the highest temperature, to CoO towards Co0 [19,20]. Although no calcination step has taken place, there are two sources of cobalt oxide. On the one hand, a significant amount of the precursor salt may have been transformed into a mixture of oxides during the drying step at 100 °C [21,22]. On the other hand, during the temperature-programmed reduction, Co3O4 is formed by the reaction of CoOx and NO, which were produced in the previous reductive decomposition of Co(NO3)2 [18].
However, it cannot be ruled out that the different peaks observed are an effect of the size of the cobalt particles and not the result of the various cobalt oxides. 2 and 6 wt.% Co/CNR115 present low intensity for the peak at the high temperature corresponding to CoO to Co reduction compared to the peak corresponding to Co3O4 to CoO formation. This implies that there is greater difficulty in performing total reduction to metallic Co for particles with a smaller size [23]. A more hindered CoO to Co reduction for small particles is already known, while the size does not influence the reduction from Co3O4 to CoO [24,25]. H2O formed upon CoO reduction prevents the formation of superparamagnetic cobalt particles located predominantly in the narrow pores of the support. Because of the high water partial pressure in the support pores, the equilibrium in the reaction CoO + H2 = Co + H2O shifts towards cobalt oxide and hydrogen [26].
The reverse peaks, which make the baseline curved after the reduction processes, correspond to the partial methanization of the carbon support, which may occur at higher temperatures [27,28].

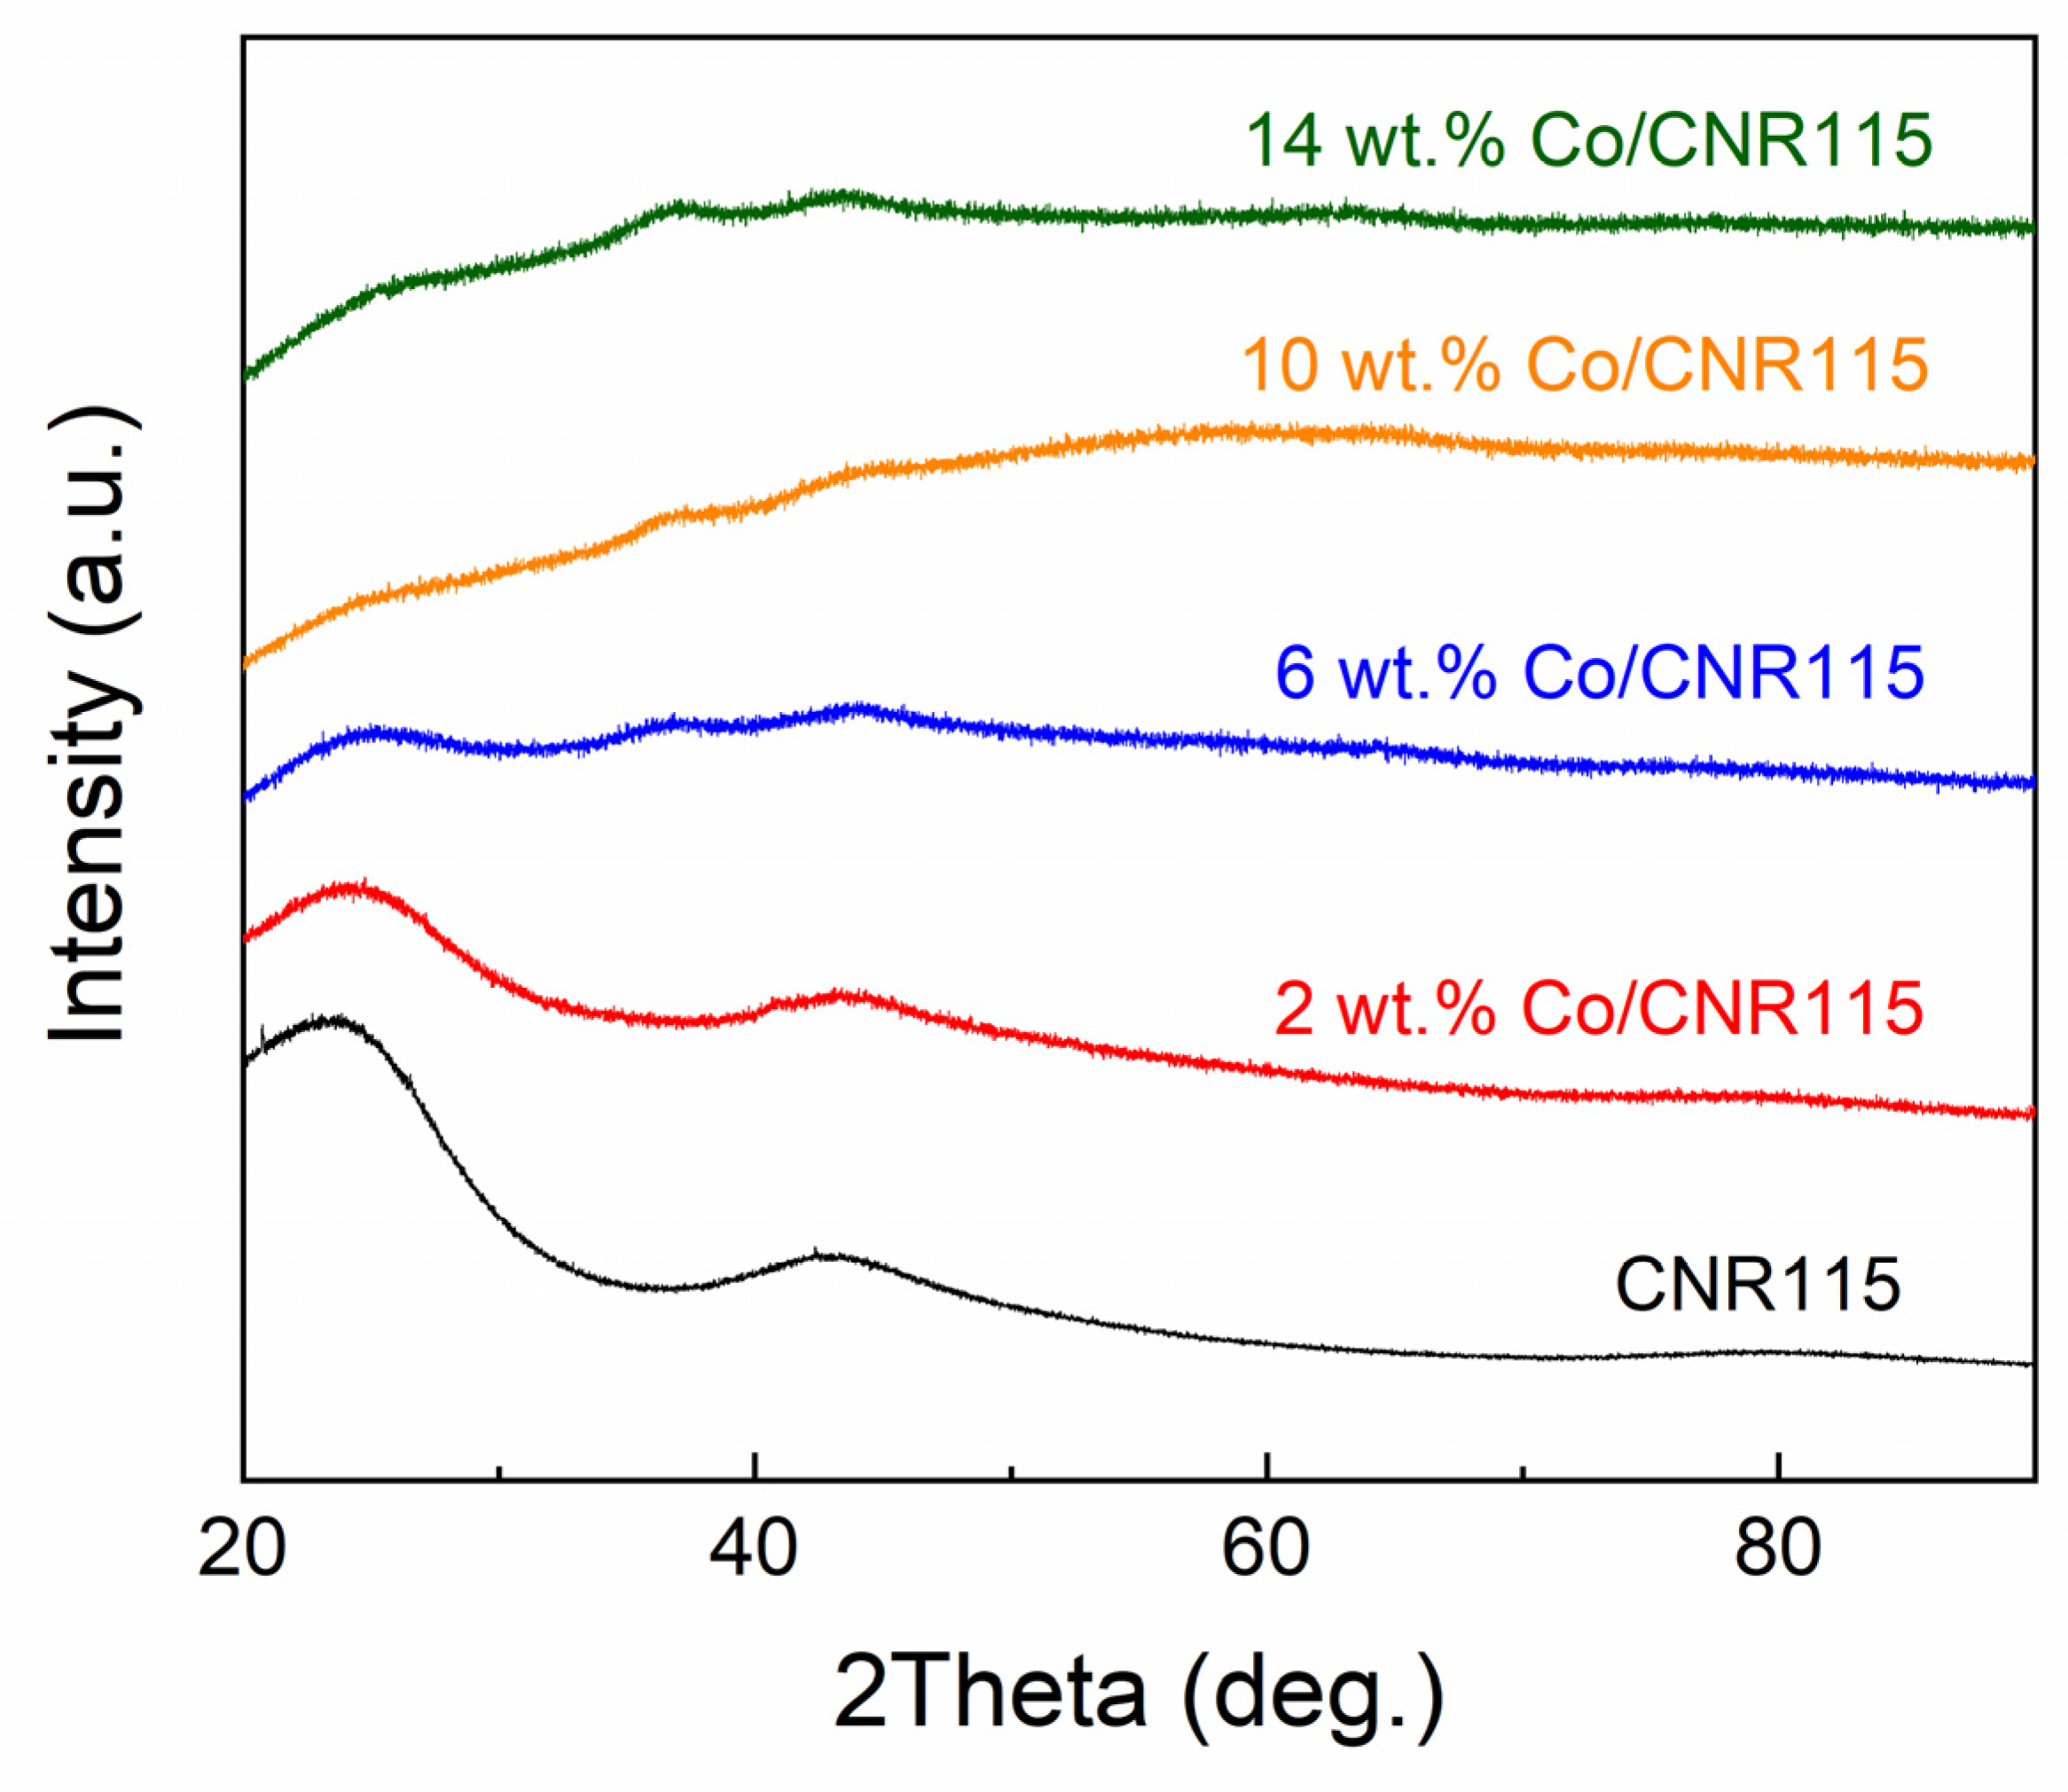
2.3. X-ray Diffraction Results (XRD)

The main signal observed in the X-ray diffractograms of the four catalysts corresponds to that of CNR 115 carbon (Figure 2). For 6, 10 and 14 wt.% Co/CNR115, two broad peaks appear at approximately 36.8 and 43.6°, suggesting CoO and Co presence. The coexistence of Cofcc and Cohcp cannot be determined from the present data.
In the case of 2 wt.% Co/CNR115, only the signal corresponding to the support is observed. The lower loading, the fact that most of the Co is inside the pores, and the high particle dispersion would explain the undetectability in this sample [29]. The morphological differences between 2 wt.% Co/CNR115 and the other catalysts are best confirmed by TEM and H2-TPD experiments.

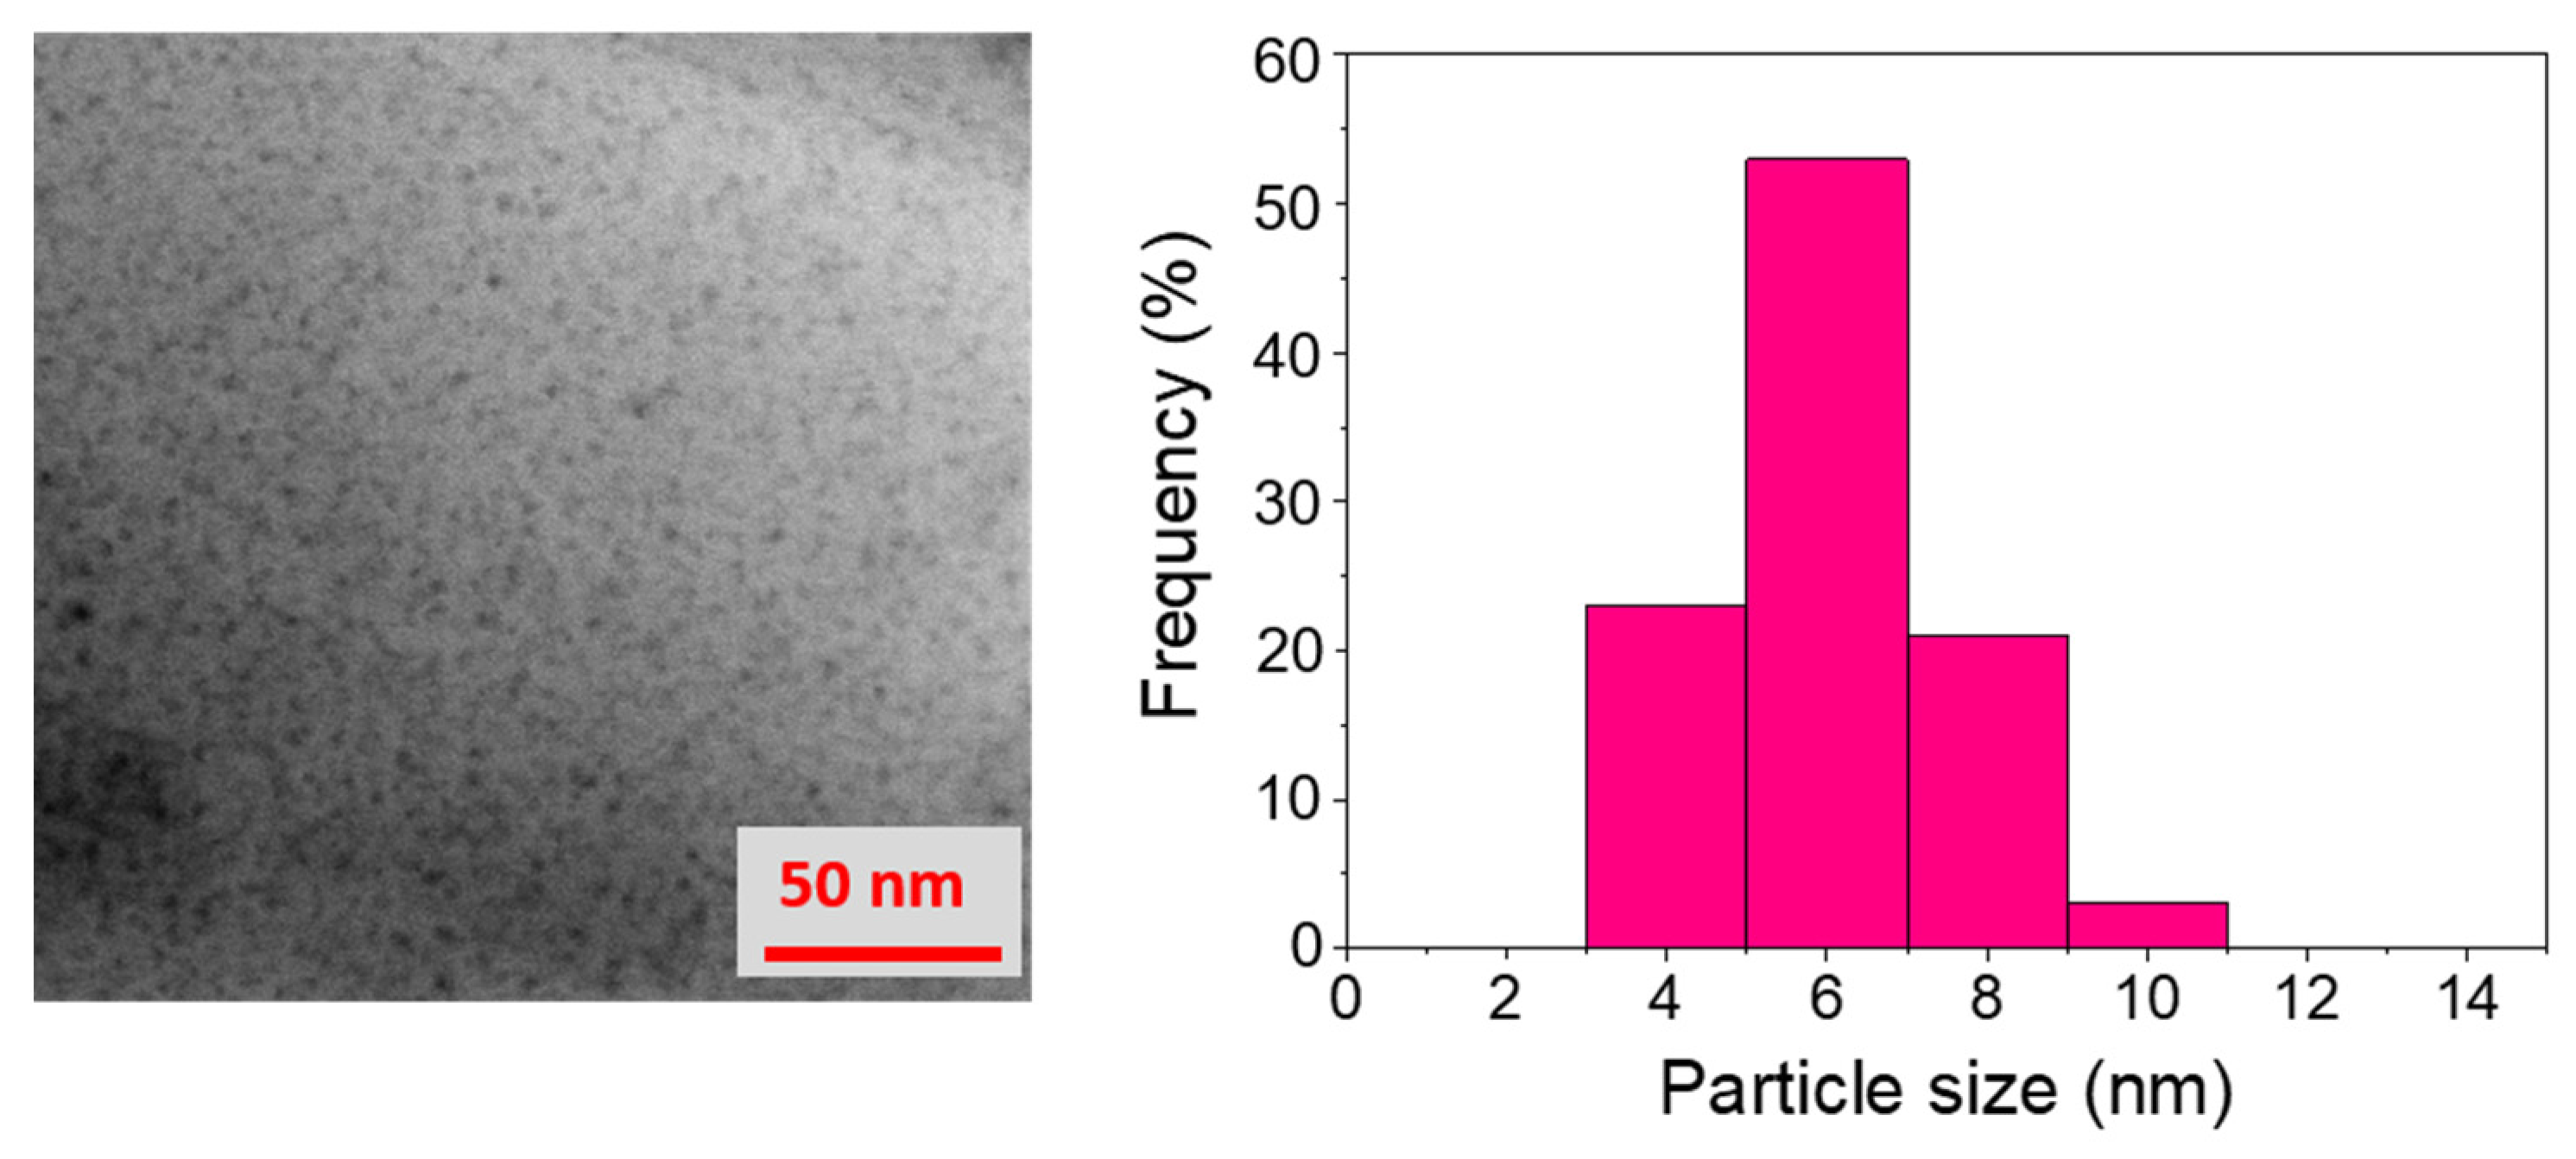
2.4. Transmission Electron Microscopy (TEM) Results

Figure 3 shows the TEM images obtained for each catalyst and the corresponding average particle size distribution. For 2 wt.% Co/CNR115, they are separate, with the appearance of rounded balls. Above 2 wt.% Co, agglomerates and a tangled structure are formed.
As the Co loading increases, the size of the particles increases. Although, this last statement is not so obvious when comparing 6 wt.% Co/CNR115 and 10 wt.% Co/CNR115. The average particle size was 6, 8, 7, and 9 nm for 2, 6, 10, and 14 wt.% Co/CNR115, respectively. The obtained values are similar to those reported by Akbarzadeh et al. [14] for different Co loadings supported on carbon nanotubes. They also observed agglomeration and lower dispersion of nanoparticles when increasing the loading.

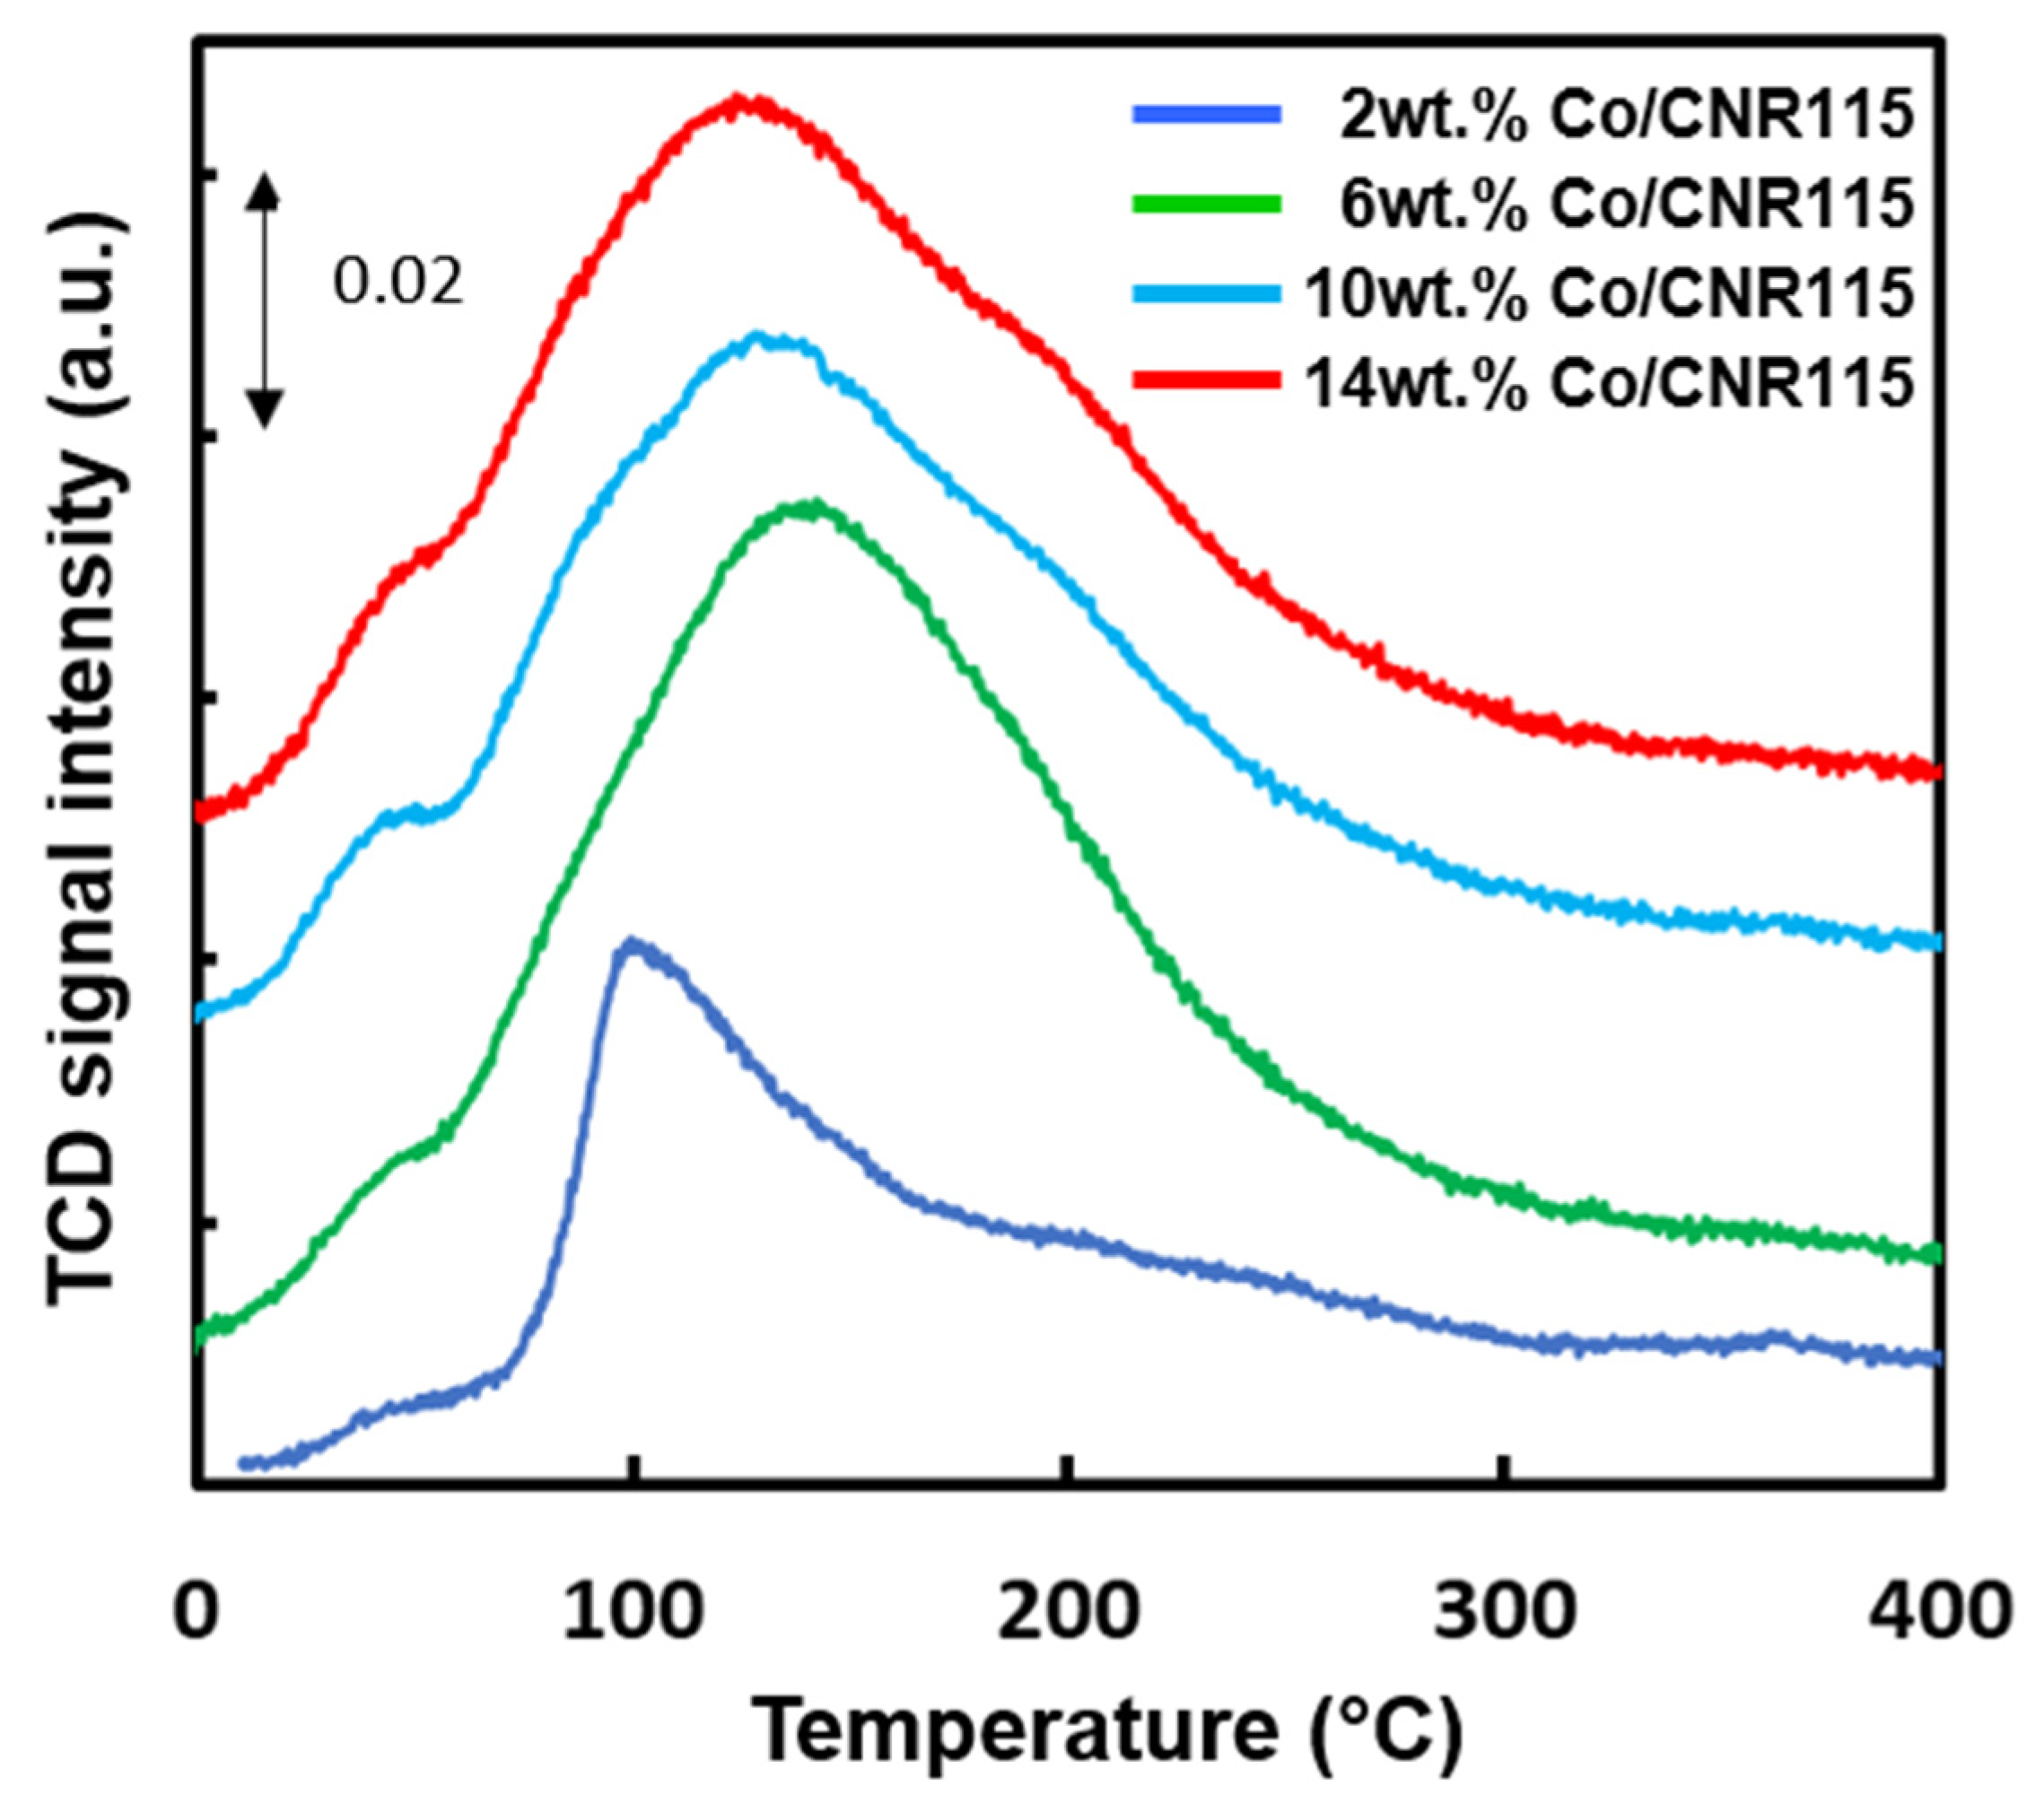
2.5. Temperature-Programmed Desorption of Hydrogen (H2-TPD)

The temperature-programmed hydrogen desorption measurements (H2-TPD) were conducted in order to estimate the active phase dispersion, average cobalt particle size, and to evaluate the strength of the hydrogen binding sites on the catalyst surface.
Table 2 shows the hydrogen adsorption surface area, Co dispersion, and Co particle size, calculated using the temperature-programmed desorption of hydrogen. Co dispersion decreases linearly with increasing metal loading. The resulting increment in the particle size, and the decrease in the adsorption surface, is expected, since these values are dispersion-based and result from particle geometry assumptions. Although the average cobalt particle size, estimated by H2 chemisorption, is bigger than that obtained from TEM, the general trend has been preserved. This phenomenon has already been observed in the literature [30], where it was shown that the divergence of Co average size, determined by hydrogen chemisorption and TEM, is definitely higher in the case of small cobalt NPs (e.g., 4–5 nm) than that in the case of larger nanoparticles (≥12 nm). In our case, however, this relation is reversed, i.e., the size of the small particles was estimated quite accurately, while for the larger particles, the discrepancy between the TEM and chemisorption-based size increases. The differences may result from underestimation of the adsorbate volume, caused by several reasons. First, the cobalt particle’s surface may be obstructed by support species, partially suppressing H2 adsorption [23,29]. Second, the adsorption sites may be blocked by the CHx post-reduction residual species (as was observed, e.g., for the carbon-supported ruthenium catalysts for ammonia synthesis [31,32]). Third, the adsorbate amount estimations may be lowered by the inability to include strongly adsorbed hydrogen, desorbing at high temperatures (above 400 °C) and forming strongly binding sites on the cobalt surface. Their amount may vary depending on the cobalt particle structure (e.g., ratio of Cofcc-to-Cohcp) and size. Larger particles could display a higher number of such sites, thus increasing the measured adsorbate amounts in their case.
Analysis of the H2-TPD profiles (Figure 4) shows similarity for all of the Co samples, with the provision that there is an increase in signal intensity with an increase in cobalt loading (a greater amount of H2 adsorbed), and a slight shift in the maximum temperature towards higher temperatures. On all the profiles, except the main maximum, some local maximums can be observed at approx. 50 °C (left shoulder of the main peak), which could be related to the presence of a small number of sites with very low hydrogen binding and/or the desorption of physically absorbed hydrogen. The slightly different shaped peak recorded for 2 wt.% Co/CNR115 may suggest that the structure of the active sites on the surface is different to the other samples, e.g., due to the highest metal dispersion (Table 2).

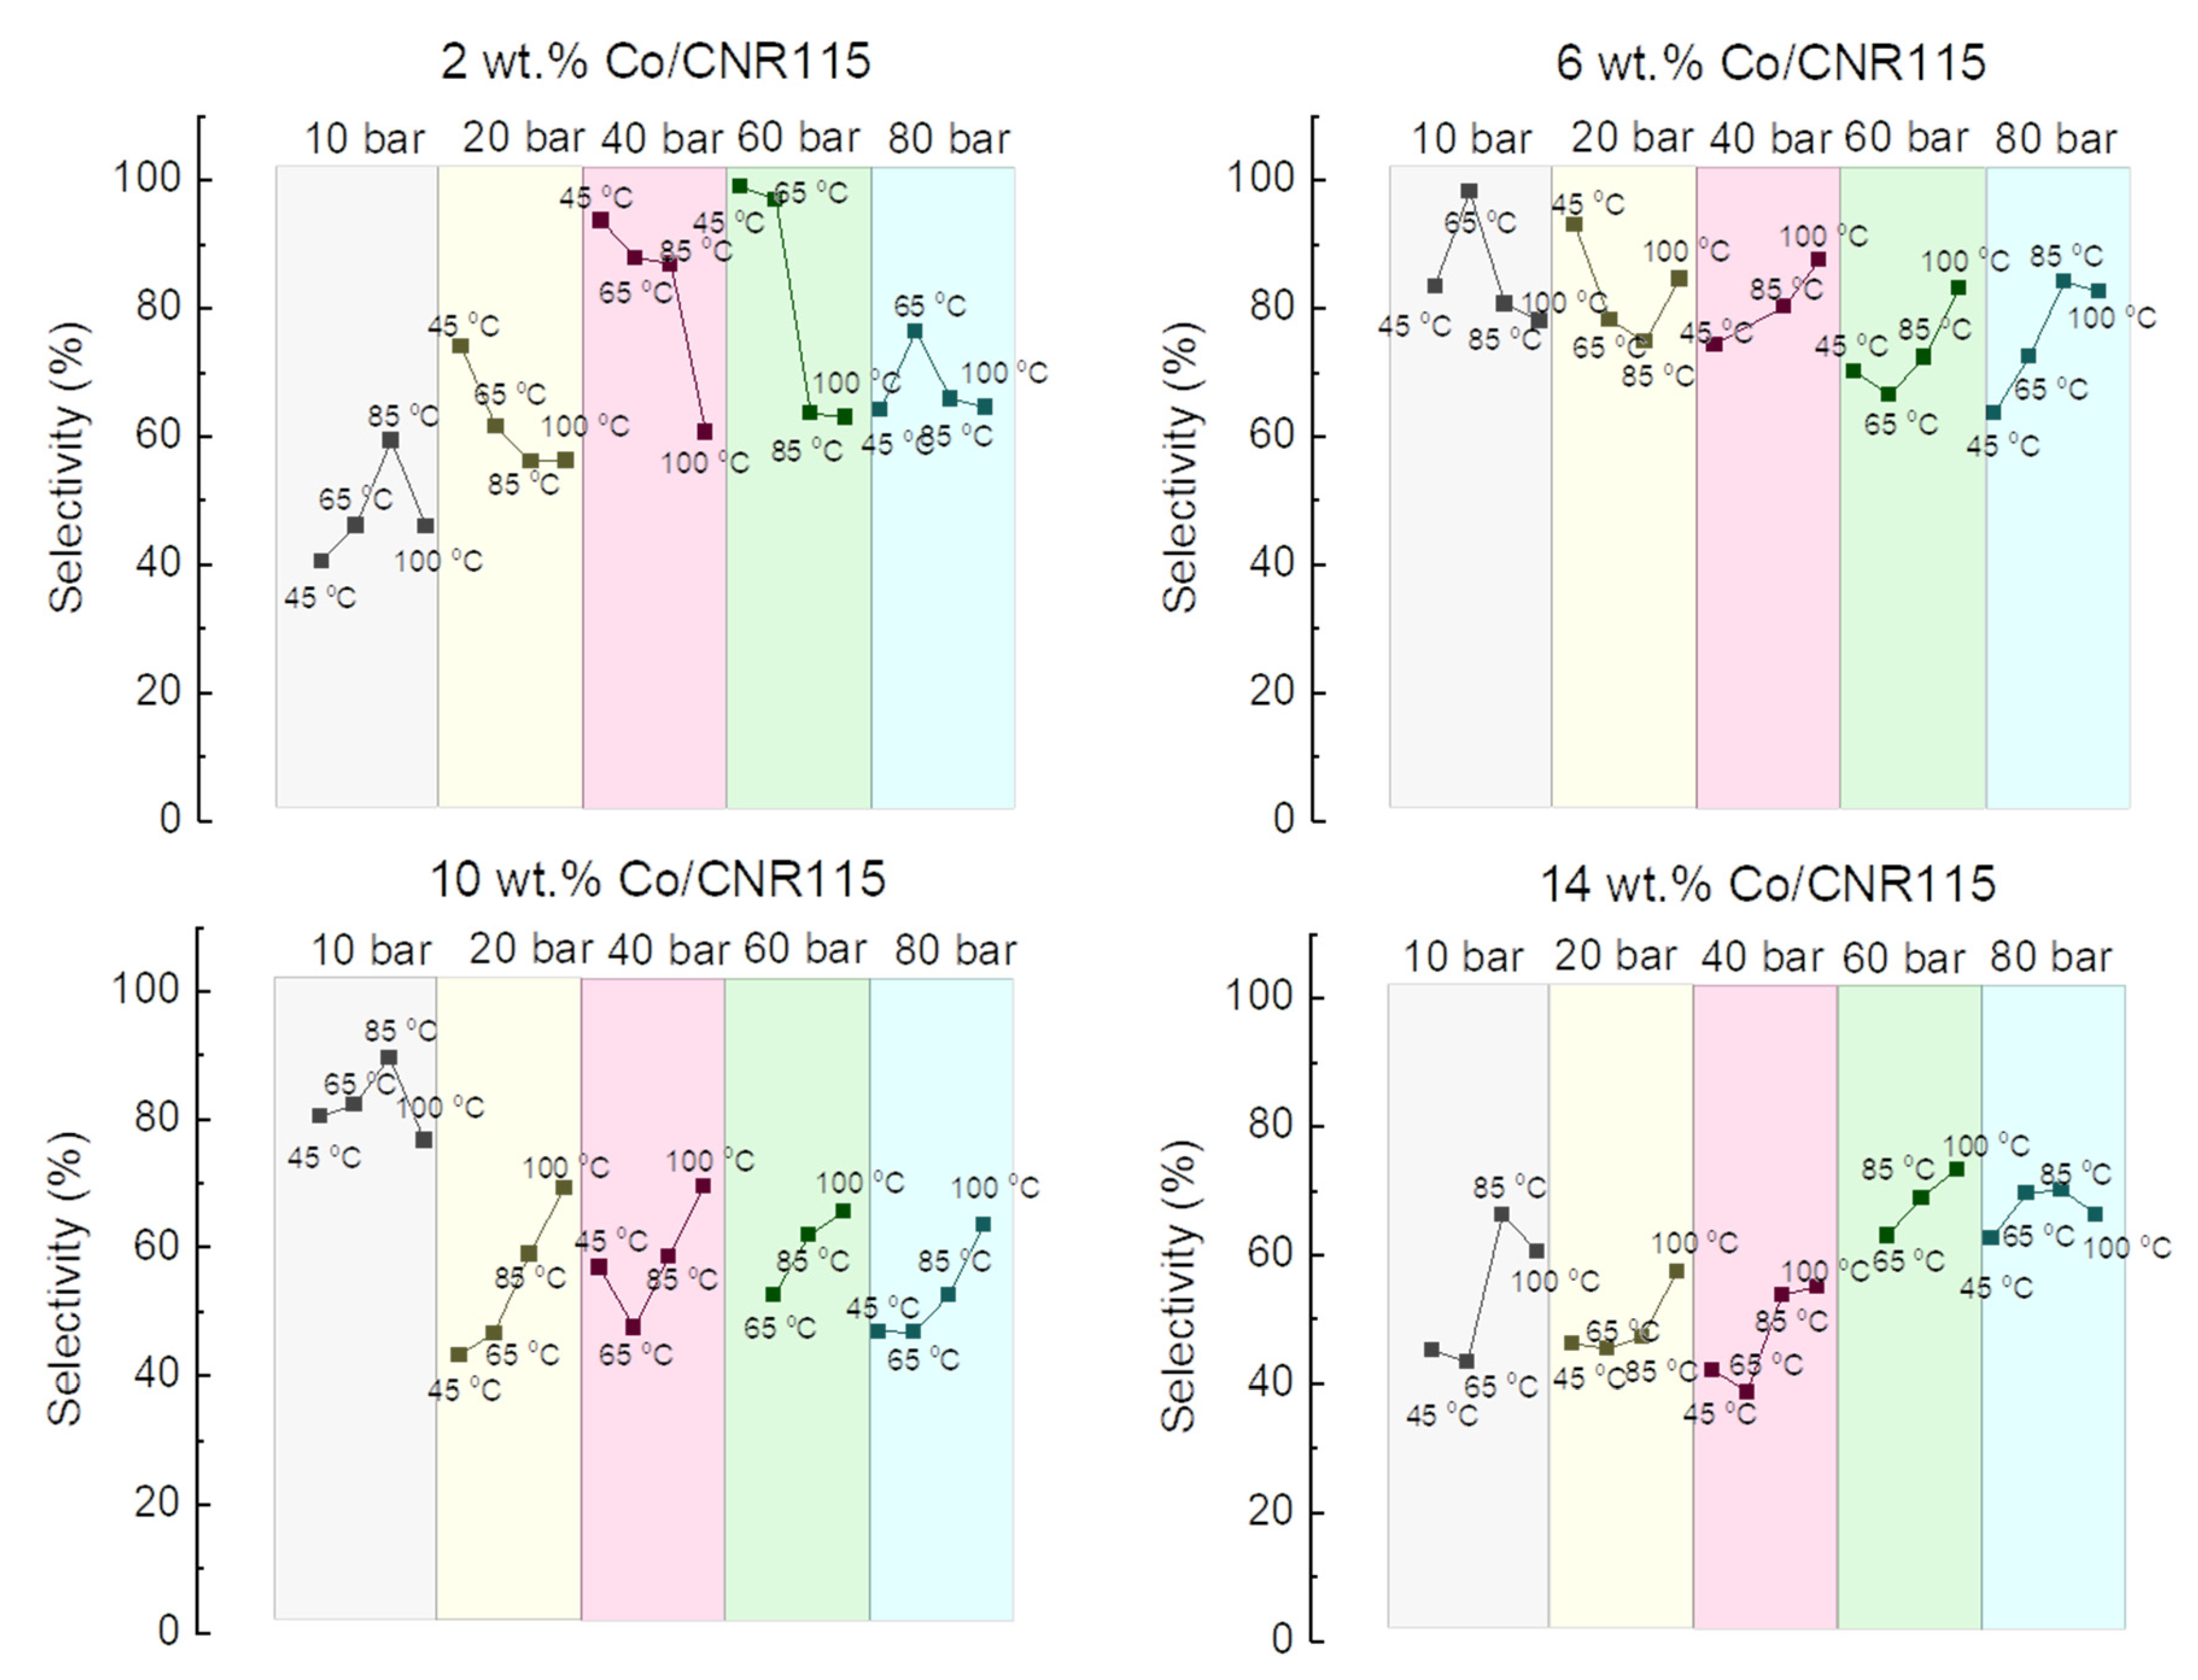
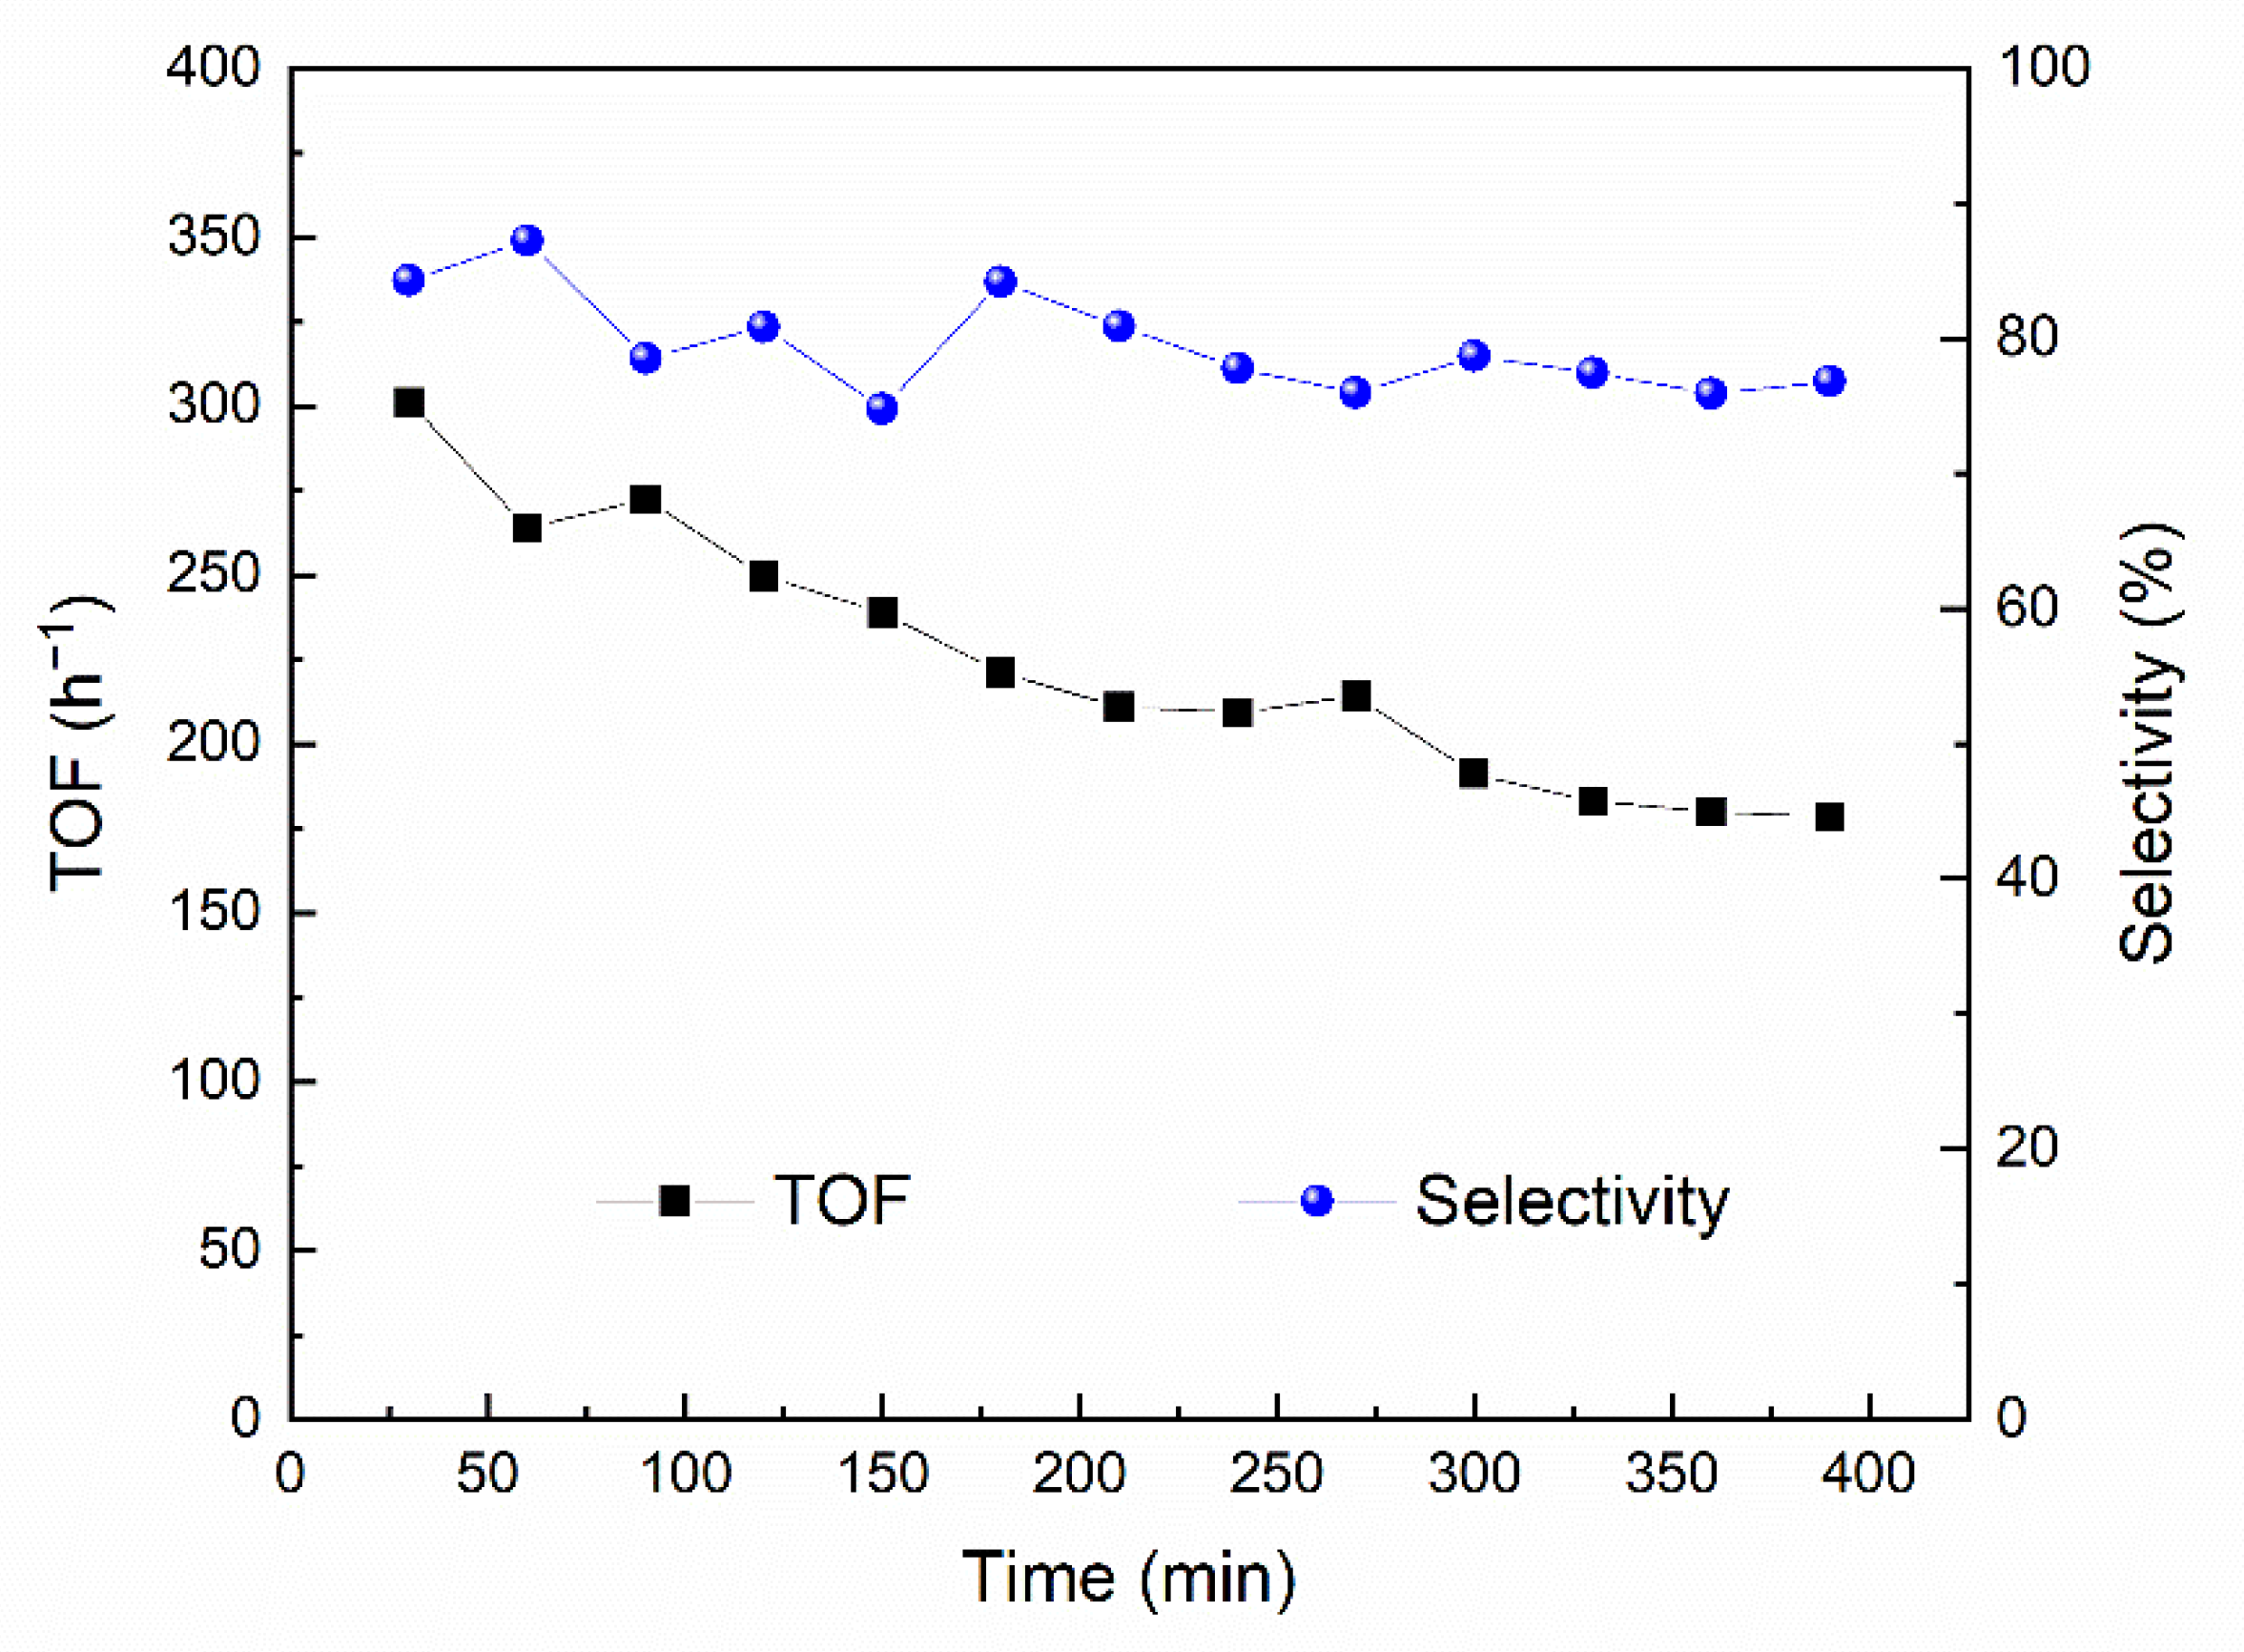
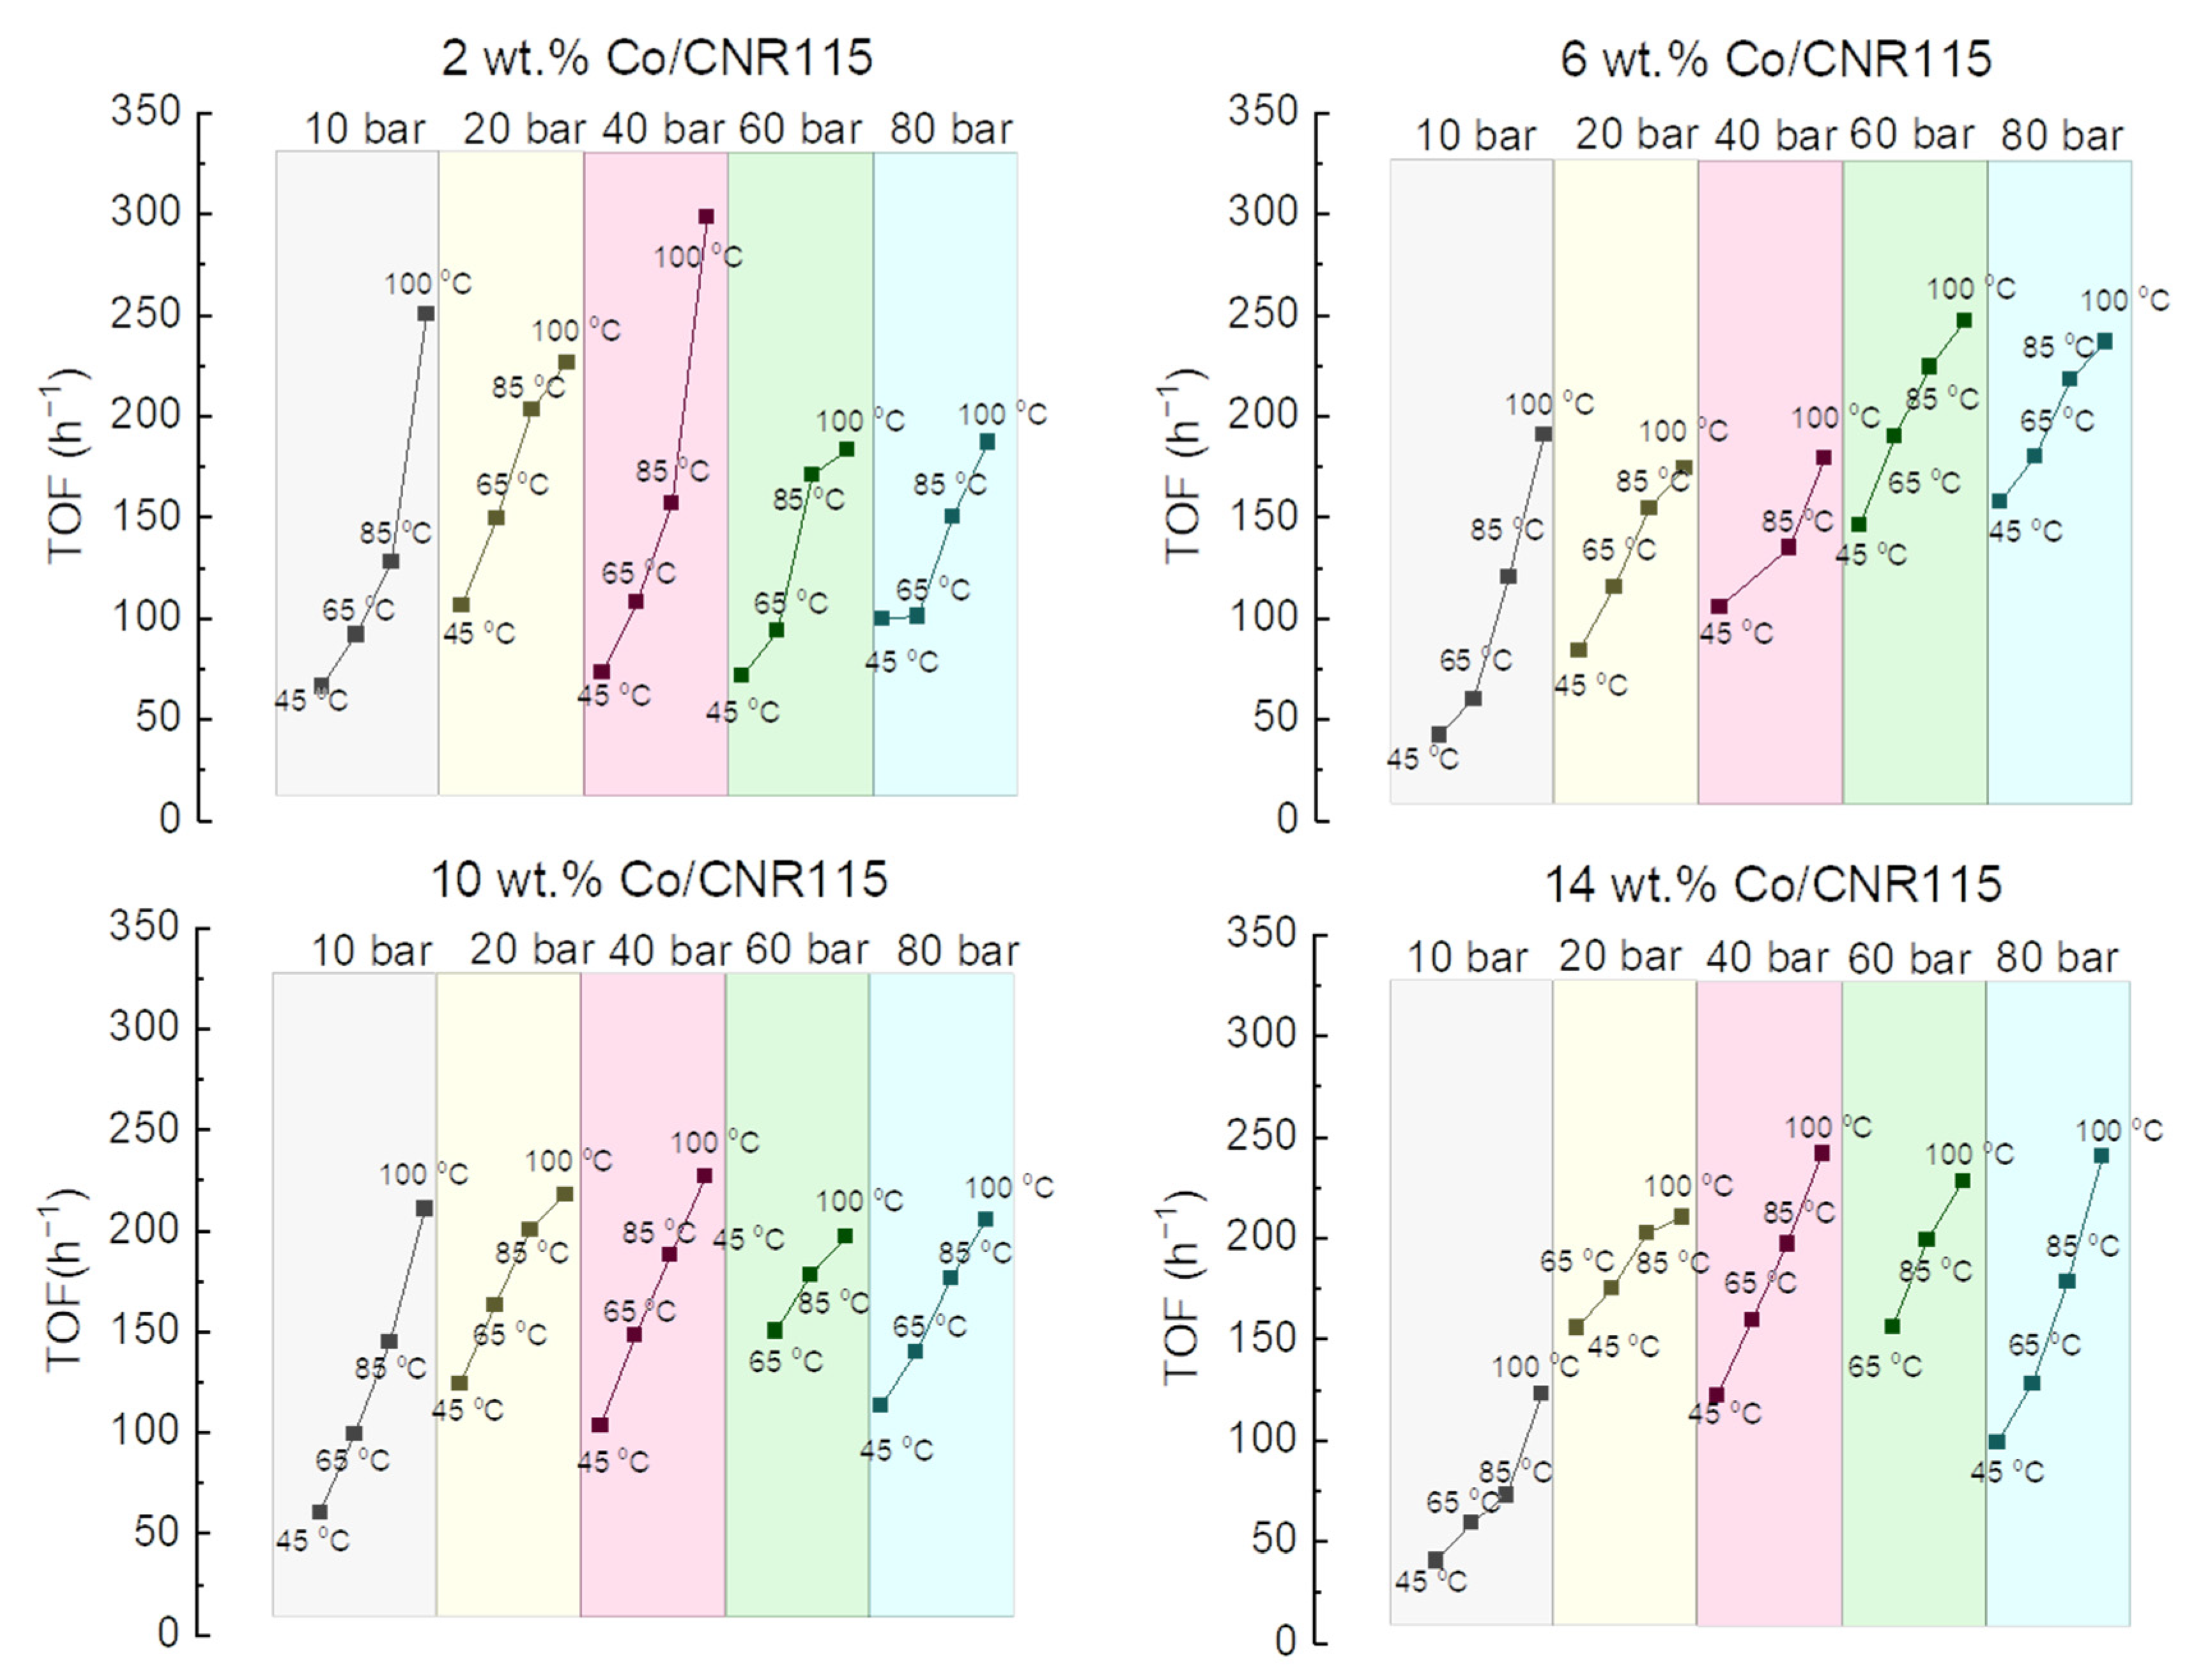
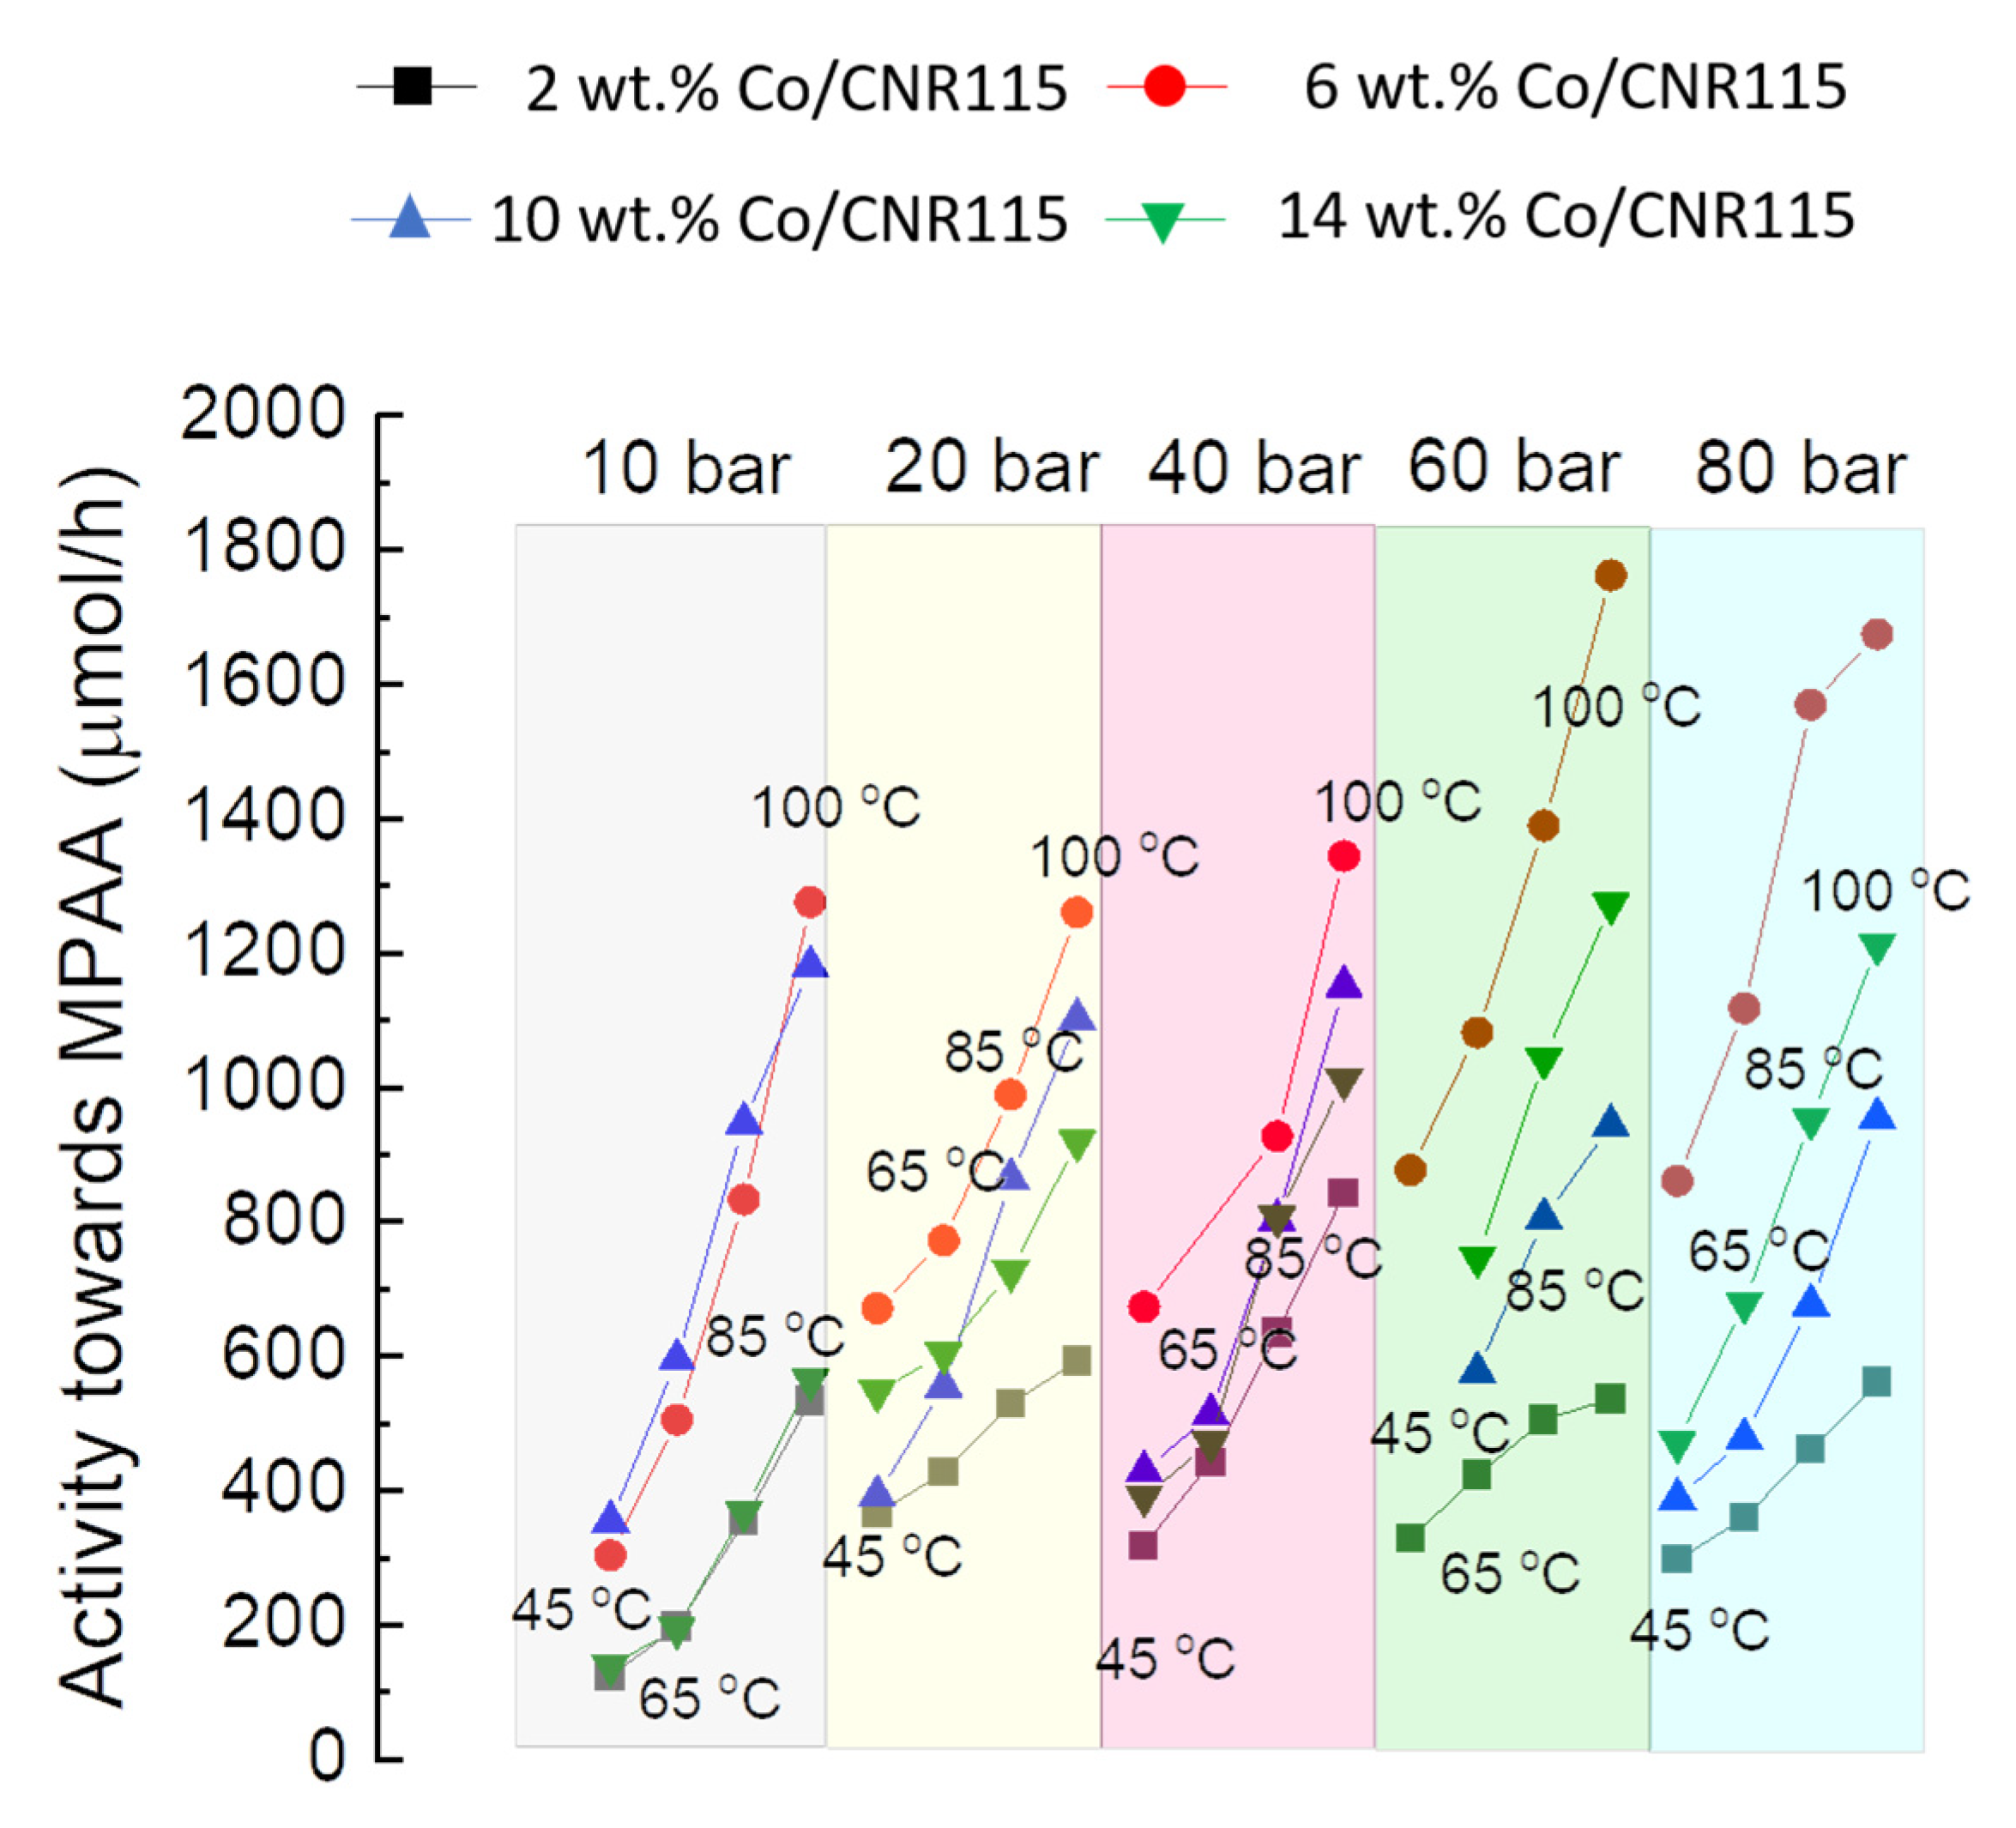
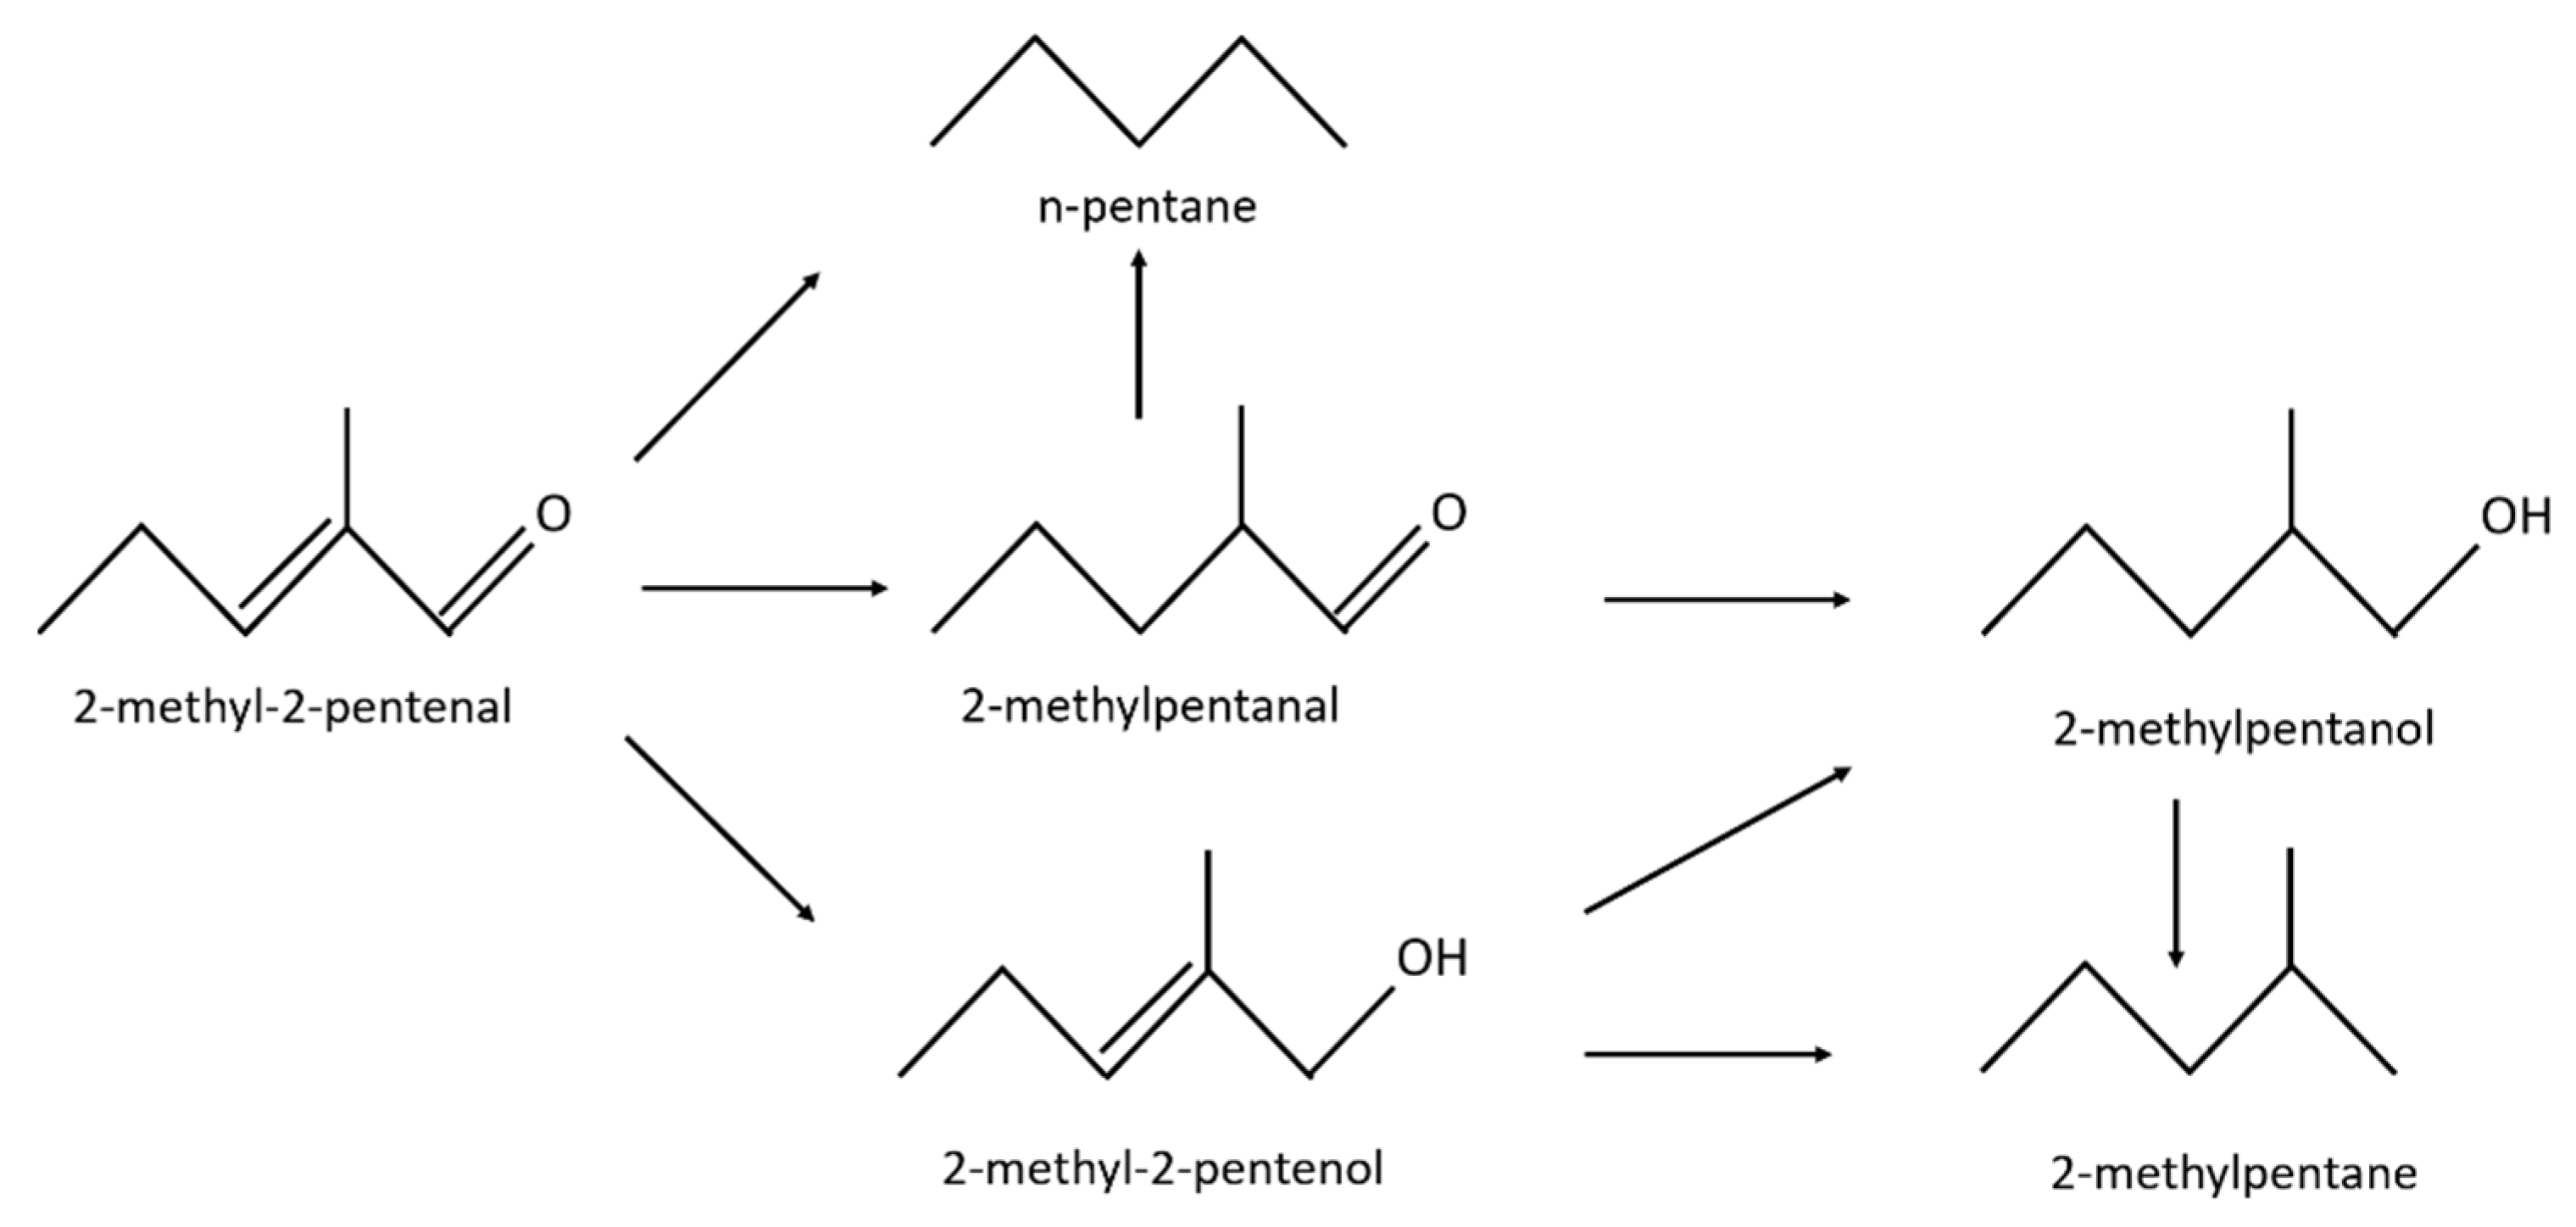
2.6. Catalytic Tests Results

Figure 5 and Figure 6 represent the activity as TOF and the selectivity values towards MPAA for 2, 6, 10, and 14 wt.% Co/CNR115 under different pressure and temperature conditions. Generally, inside the same pressure range, increasing the temperature results in higher activity. On the other hand, a non-linear relation is found between pressure and the activity of the catalysts. Only in the case of 6 wt.% Co/CNR115 is there an increase in the TOF value with the increase in the pressure range.
Moreover, the highest TOF values are reached for the lowest Co loadings (2 and 6 wt.%). A further increase provides no profit. This could be related to metal particle agglomeration and a decrease in particle dispersion (Table 2) and the amount of available active sites, as has been observed in Fischer–Tropsch reactions, where, at the beginning, increasing the particle size improved the activity, but after a particular value, it was detrimental [14,23]. Furthermore, the lower activity could also be related to a decrease in the BET surface area by pore blockage after Co deposition on the support.
At first glance, higher selectivity is observed for 2 and 6 wt.% Co/CNR115 than for 10 and 14 wt.% Co/CNR115 (Figure 6). Values of ≥99% are achieved for 2 and 6 wt.% Co/CNR115, the catalysts with the highest metal dispersion, at 45 °C and 60 bar, and at 65 °C and 10 bar, respectively. While, for 10 wt.% Co, the maximum selectivity reached is 90% at 10 bar and 85 °C, and for 14 wt.% Co/CNR115, only 75% at 60 bar and 100 °C.
Different responses to the reaction conditions were found in the selectivity towards MPAA and the following other two main products: the unsaturated alcohol—2-methyl-2-pentenol (MPEO); the saturated alcohol—2-methylpentanol (MPAO).
In the case of 2 wt.% Co/CNR115, with an average size of Co NPs of 9 nm, increasing the temperature at a given pressure (20, 40 and 60 bar) led to an increase in the activity and selectivity towards the unsaturated alcohol (2-methyl-2-pentenol) at the expense of MPAA selectivity. The exception is the trend at 10 bar; although the activity grows with temperature, similarly to other pressures, it is accompanied by an increase in the selectivity towards MPAA at the temperature range 45–85 °C.
MPEO was also formed as the second desired product for 6, 10 and 14 wt.% Co at 45 and 65 °C. However, small amounts of saturated alcohol (MPAO) appear at 85 °C and 100 °C for the three catalysts. Nevertheless, the amount of fully saturated product is not larger for the highest loadings. This implies an increase in selectivity towards MPEO for 10 and 14 wt.%, in detriment of MPAA creation. This phenomenon is in agreement with earlier studies, where the increase in metal nanoparticles and pressure favoured C=O over C=C hydrogenation [33].
The change in chemoselectivity could come from a change in the morphology of the main active sites with increasing Co loading. Therefore, for the catalysts with smaller Co NPs and larger numbers of open planes, the edge/defect sites containing coordinately unsaturated atoms [34] could be prone to hydrogenation of the C=C bond instead of the C=O bond. In contrast, the surfaces of larger NPs primarily expose low-index facets, with fewer edge or defect sites [35], and would have a stronger preference towards C=O hydrogenation. Moreover, we cannot rule out that the differences in chemoselectivity of the cobalt catalysts could be due to steric hindrance caused by the NPs size [36] and the metal–support interaction [12,37].
The interaction with the support can cause an electronic deficiency on the surface of the metal particles, favoring the adsorption of the C=C bond and its subsequent hydrogenation [12]. The influence of the support should be more significant in smaller particles than for those in which the bulk would be further away from a possible interaction.
It should be mentioned that the high selectivity towards MPAA observed for 2 and 6 wt.% Co/CNR115 occurred along with low TOF (Figure 5 and Figure 6). Therefore, the activity towards the desired product (Figure 7), which would take into account both parameters, i.e., the activity and selectivity, is a better gauge for comparing the catalysts from an industrial point of view.
In summary, the best compromise of the activity and selectivity is attained for the 6 wt.% Co loading. A lower loading, despite the high selectivity, does not provide enough metal for satisfactory activity. Higher Co loadings do not improve the activity, probably because of the lower specific surface area. In addition, increasing the particle size seems to modify the sites, decreasing the selectivity towards the desired MPAA. When increasing the temperature, the activity towards MPAA increases. The highest values are obtained for 6 wt.%, reaching the optimum at 60 bar and 100 °C.
Therefore, stability tests were performed for 6 wt.% Co/CNR115 under these optimal conditions for 2-methylpentanal production, at 60 bar and 100 °C (Figure 8). The slight loss of catalyst activity does not affect the high selectivity towards the desired product. Because the XRF analysis did not show the presence of Co in the postreaction mixture, this phenomenon could be related to the formation of the carbon deposit and partial blockage of the active phase in the cobalt catalysts.
Moreover, the change in the NPs size that occurred under the reaction conditions (Figure 9) could affect the activity. The TEM results obtained for the 6 wt.% Co sample (Figure 9) demonstrate the changes in the nanoparticle size distribution in comparison to the fresh sample (Figure 2), and the decrease in the average particle size. This could suggest the effect of the redispersion of the larger NPs under the reaction conditions, and, at the same time, could be the reason for the catalyst’s deactivation. The small fluctuations in both TOF and selectivity could be related to the coverage variations and/or spatiotemporal heterogeneities [38,39]. Furthermore, the error associated with the gas chromatograph device should not be completely ruled out.
Moreover, very interesting results were provided by the XPS measurements for a selected sample (2 wt.% Co/CNR115) before and after the reaction. The investigation and interpretation of the XPS results were in accordance with the literature data and XPS electronic databases [40,41,42]. The catalyst surface before the reaction contains Co—0.2, O—4.8, and C—95, and after the reaction, it contains Co—0.3, O—13.9, and C—85.9, estimated in at.%.
Therefore, similar amounts of Co are observed, confirming the XRF results that rule out metal leaching. However, before the reaction, the following two types of Co2+ coexist according to the Co 2p analysis (Figure 10): characteristical of Co oxides (2p 3/2 at 778.6 and 781.1 eV, and the characteristic satellite at 789.1 eV) and typical of Co(OH)2 compounds (2p 3/2 at 783 eV).
While, after the reaction, two 2p 3/2 signals are detected at 782 and 784 eV, corresponding uniquely to Co(OH)2 compounds—also confirmed by the 2p1/2 satellite at 804.6 eV.
In addition, a three-time increase in surface oxygen after the reaction and a 10 at.% decrease in surface carbon were observed. This can be related to the decomposition of the solvent and/or substrate on the surface, which could be the reason for the formation of cobalt hydroxide. The formation of Co(OH)2 may be responsible for the decrease in particle size observed by TEM after the reaction (Figure 9). Ultimately, this modification of the surface could be the cause of the catalytic activity loss.

3. Materials and Methods

3.1. Catalysts Preparation

Four different Co-loaded catalysts (2, 6, 10 and 14 wt.%) were prepared by incipient wetness impregnation. NORIT® CNR115 (supplied by Cabot Corporation, Boston, MA, USA) was used as a support and aqueous solution of Co(NO3)2·6H2O (supplied by Chempur, Piekary Śląskie, Poland) as a metal precursor. Impregnation was carried out using a rotary beaker with simultaneous heating (with a standard 200 W infrared lamp) for 24 h until complete evaporation of the solvent.
Afterwards, the catalysts were dried overnight at 100 °C and reduced with 10% H2/Ar in the flow reactor at 527 °C for 5 h. The obtained catalysts were labelled sequentially as 2 wt.% Co/CNR115, 6 wt.% Co/CNR115, 10 wt.% Co/CNR115 and 14 wt.% Co/CNR115.

3.2. Catalysts Characterization

3.2.1. N2 Physisorption

The surface area and porosity of our catalysts were measured with ASAP 2020 Chem. Instrument from Micromeritics (Norcross, GA, USA). BET (Brunauer–Emmett–Teller) and BJH (Barret–Joyner–Halenda) methods were used with N2 as the adsorbate. The surface area was determined by BET and total micropore volume and pore size by BJH. The catalysts were kept at 300 °C for 3 h in vacuum conditions to clean their surfaces before measurement of the adsorption isotherm at −196 °C.

3.2.2. Temperature-Programmed Reduction

Temperature-programmed reduction (H2-TPR) was run in a glass flow system in an atmosphere of a mixture of 10% H2/Ar. Prior to reduction, the catalysts were dried overnight at 100 °C. A Gow-Mac thermal conductivity detector (Bethlehem, PA, USA) was used with negative polarity. The catalyst precursors were heated with a 10 °C/min ramp, starting from room temperature. Injections of known amounts of hydrogen into the flow system were provided for calibration.

3.2.3. X-ray Diffraction

X-ray diffraction (XRD) measurements were performed with a Rigaku-Denki instrument (Tokyo, Japan) equipped with Ni-filtered copper lamp Cu Kα. Diffraction profiles were scanned in the range of 2θ = 20–90°, step size of 0.008°, and counting time 60 s/step.

3.2.4. TEM Measurements

Transmission electron microscopy investigations were performed with a JEOL JEM-100CXII electron microscope (Tokyo, Japan) operated at an acceleration voltage of 100 keV. At least 100 particles were employed to compose the size distribution histograms. Before TEM measurements, the samples were dispersed in pure alcohol using an ultrasonic cleaner and putting a drop of this suspension onto carbon films on copper grids.

3.2.5. Temperature-Programmed Desorption of Hydrogen

Measurements were carried out using AutoChem 2920 Chemisorption Analyzer (Micromeritics Instruments Co. Norcross, GA, USA) supplied with high-purity (≥99.9999 vol%) gases. Each catalyst sample of 0.40 g mass was placed in a U-shaped quartz reactor and subjected to the following measurement procedure. At all times the total gas flow rate equaled 40 cm3∙min−1. First, the sample was reduced at 527 °C for 5 h in pure hydrogen flow. At the next stage the sample was rinsed with Ar at 620 °C for 1 h in order to eliminate any hydrogen remaining adsorbed on the surface after the reduction process. Then, the system was cooled and H2 was adsorbed onto the surface of the reduced catalysts at 150 °C for 15 min and at 0 °C for 15 min. Subsequently, the sample was rinsed with Ar for 1 h at 0 °C to remove physisorbed H2 from its surface. Then, the saturated sample was heated up to 873 K at a rate of 10 °C∙min-1 in Ar flow, with the desorbing hydrogen concentration in the outlet gas being monitored by the TCD. Signal recording was continued for 30 min under nominal conditions and during cooling to ambient temperature. The obtained CH2(T) dependencies were used to estimate the total amount of hydrogen desorbed from the catalyst surface, and assuming H/Co = 1 adsorption stoichiometry [43] the dispersion and average particle size were calculated [44].

3.2.6. Energy-Dispersive X-ray Fluorescence Analysis (EDXRF)

Energy-dispersive X-ray fluorescence analysis (EDXRF) was carried out using MiniPal 4 equipment from PANalytical Co. (Malvern, United Kingdom), with an Rh tube and silicon drift detector (resolution 145 eV). EDXRF method was used to gain information on the elemental composition of liquid samples after catalytic experiments.

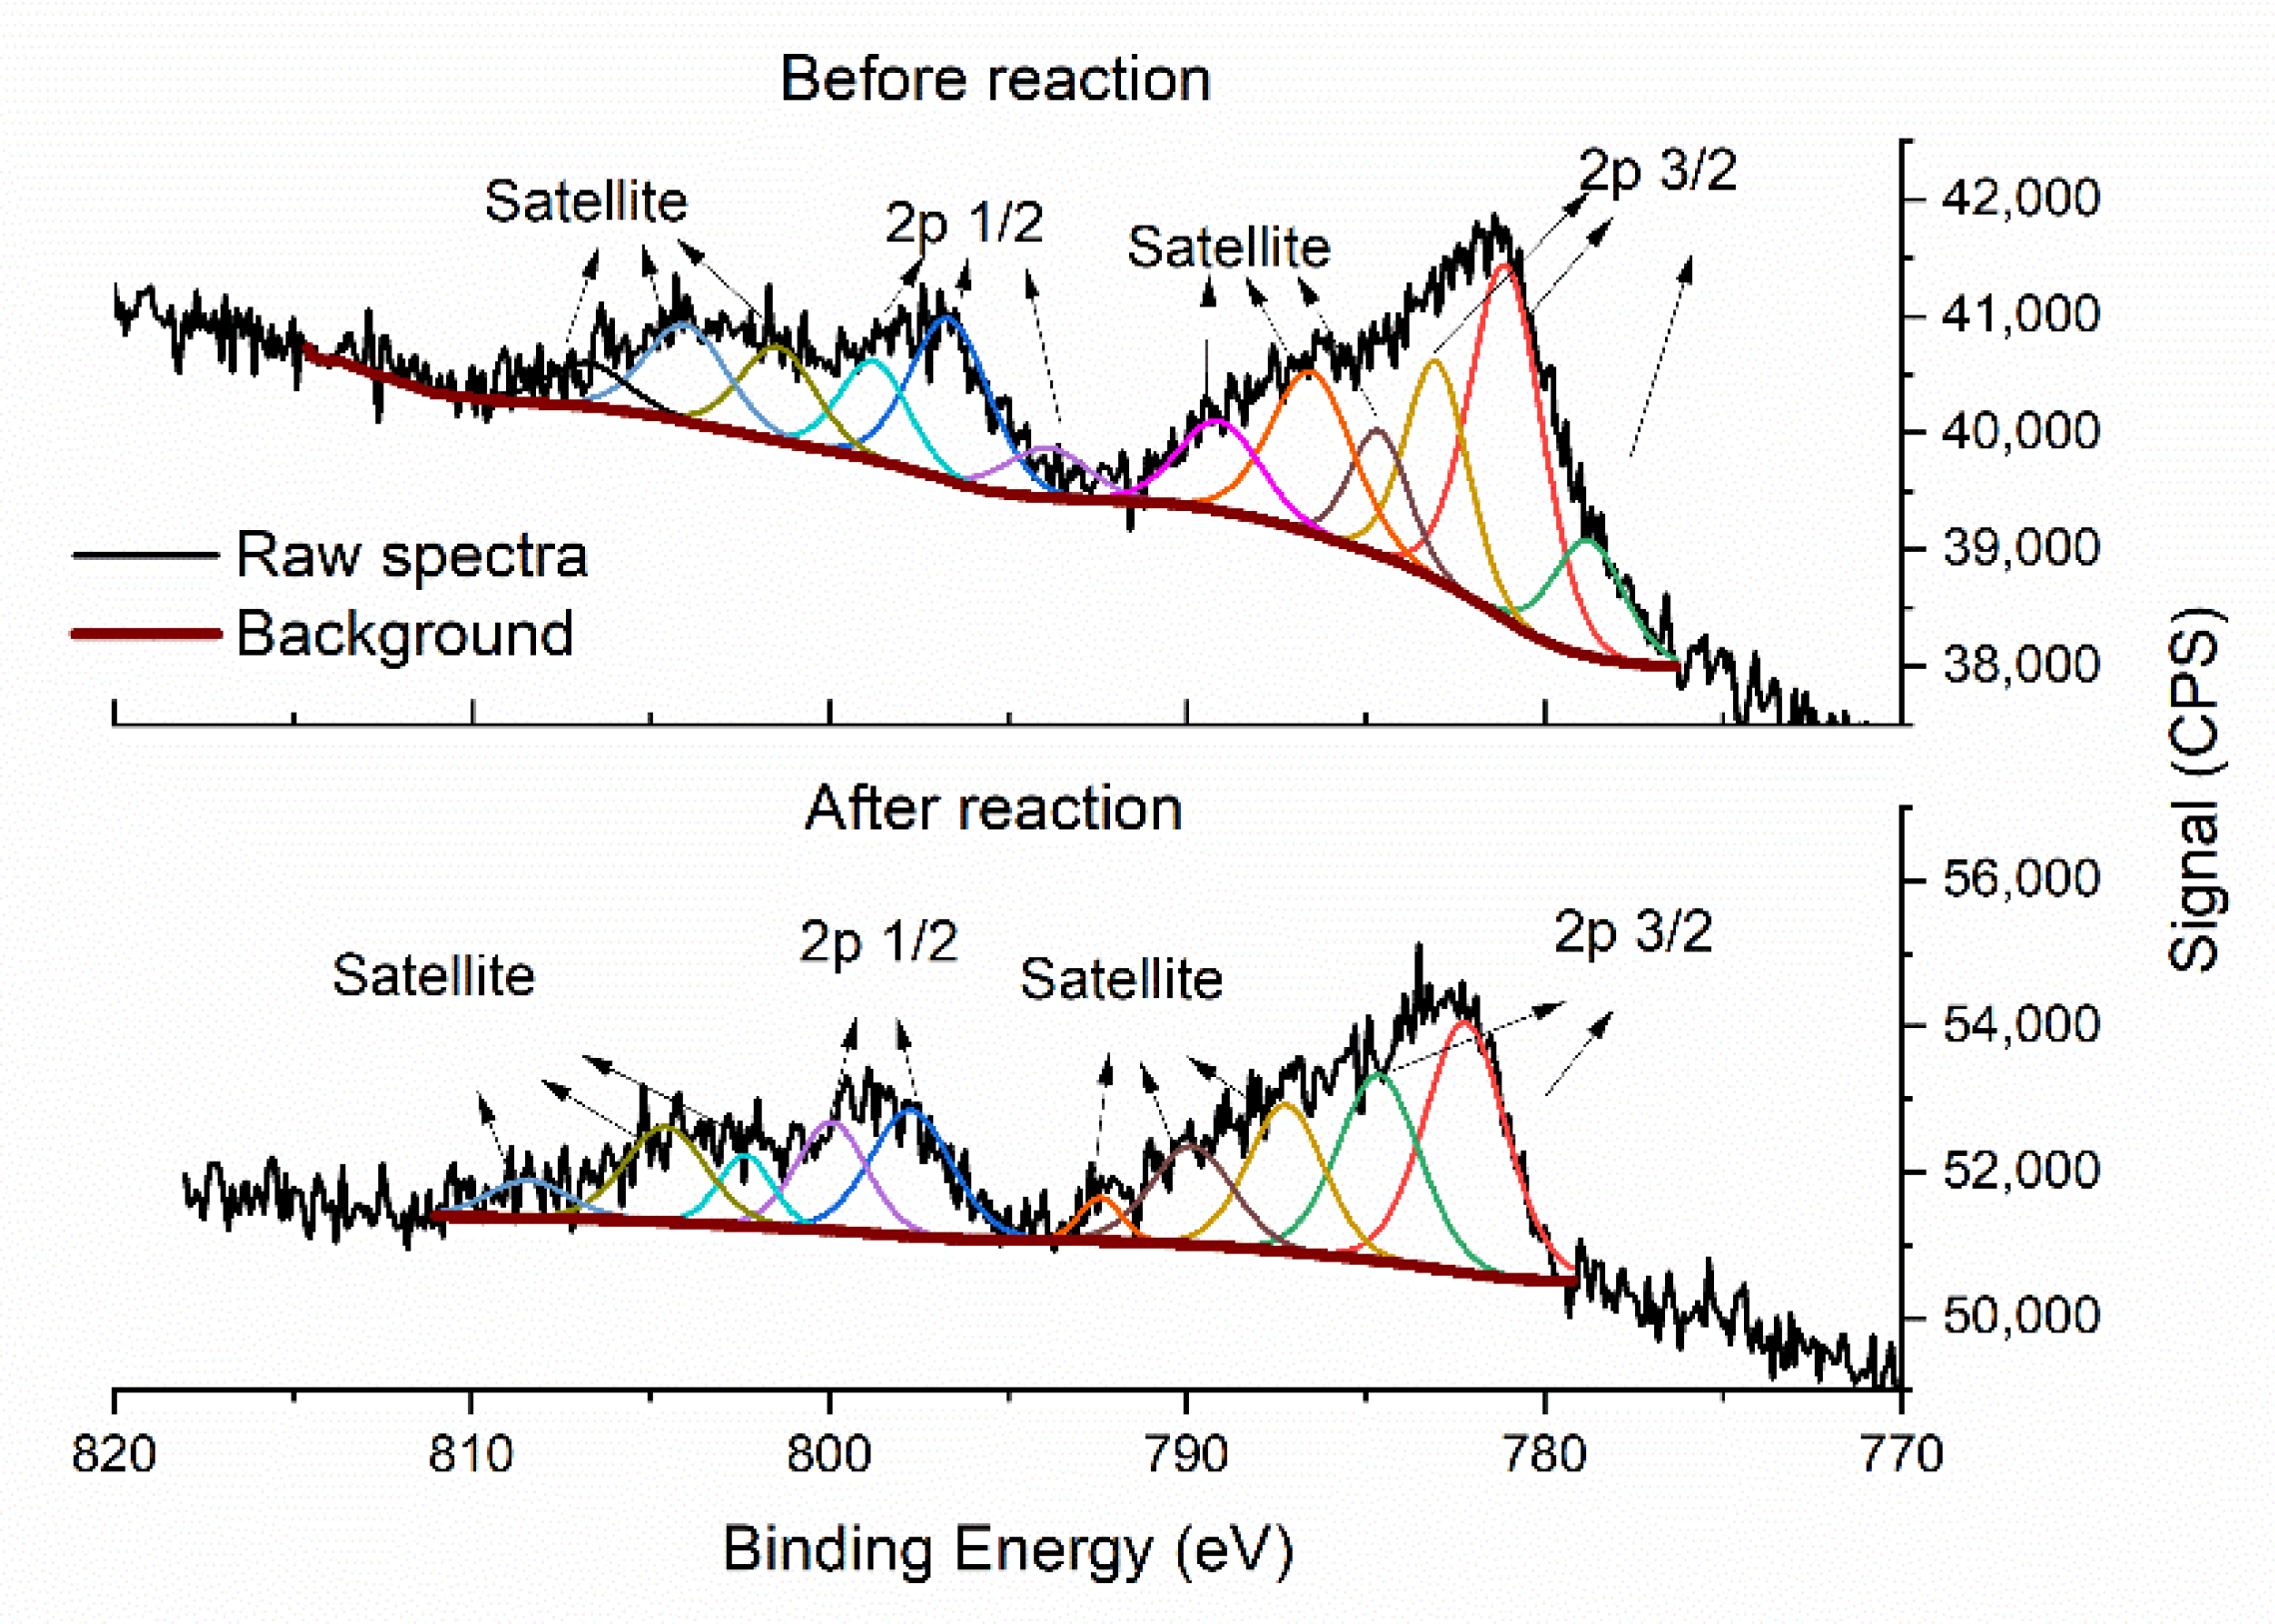
3.2.7. X-ray Photoelectron Spectroscopy (XPS)

The XPS spectra were measured with a Microlab 350 spectrometer (Thermo Scientific, Waltham, MA, USA) with a spherical sector analyzer at 300 W non-monochromatic Al Kα radiation and 1486.6 eV energy. The survey and high-resolution (HR) spectra of Co 2p, C 1s and O 1s photoelectrons were collected at constant pass energies of 100.0 and 40.0 eV, respectively. The spectra were quantified using the software Avantage (ver. 4.88, Thermo Fisher Scientific Inc., Waltham, MA, USA). The deconvolution of all the HR XPS spectra was performed using a smart-type background and a Gaussian peak shape with a 35% Lorentzian character. The measured binding energies (BE) for individual elements were corrected in relation to the C 1s carbon peak at 284.2 eV.

3.2.8. Catalytic Tests

Hydrogenation of 2-methyl-2-pentenal (MPEA) (97% pure from Sigma-Aldrich, Darmstadt, Germany) was performed in flow mode in a ThalesNano H-Cube device (Budapest, Hungary). In this system, hydrogen is generated in situ via electrolysis of water, and then dried and mixed with the substrate solution (1 wt.% MPEA in ethanol (99.8% pure from Avantor Performance Materials, Gliwice, Poland)). An HPLC pump provides the circulation of the reactants, and their pressure is established by the automatic system conjugated with multiple pressure sensors. The catalyst was placed in a 70-mm-long stainless-steel cartridge (CatCart®30) with an inner diameter of 4 mm. The free space in the catalyst was filled with glass balls 2 mm in diameter.
Each experiment was performed using 0.1 g of the catalyst and a flow rate of 0.5 mL of solution per min (0.04 mmol MPEA/min) and H2 flow of 35 mL/min. Different conditions for pressure (10, 20, 40, 60 and 80 bar) and temperature (45, 65, 85 and 100 °C) were investigated.
The obtained samples were analyzed in a gas chromatographic system (Bruker 456-GC with FID detector, Billerica, MA, USA) equipped with BP5 column (30 m, 0.25 mm and 0.25 µm). A satisfactory carbon balance (within ~97%) was found for GC analyses. The reproducibility of results was fair (±10% (total activity)) or good (±2% (products selectivity)).

4. Conclusions

The liquid-phase selective hydrogenation of 2-methyl-2-pentenal to 2-methylpentanal over active carbon-supported Co nanoparticles strongly depends upon the physicochemical properties of the catalysts and the reaction conditions. High selectivity towards the desired product—saturated aldehyde (MPAA)—requires smaller cobalt ensembles, which favor C=C versus C=O hydrogenation. It is found that 2 and 6 wt.% Co/CNR115 show the highest values of chemoselectivity towards the hydrogenation of the C=C bond, generating MPAA. They reach values close to 100%.
However, the highest selectivity values are accompanied by lower TOF values. In the case of 2 wt.%, the amount of Co seems to be insufficient to achieve remarkable activity for MPAA production. Nevertheless, the results clearly show that the optimum Co loading value, among those studied, is 6 wt.% (with an average particle size of 15 nm).
Co loadings higher than 6 wt.%, such as 10 and 14 wt.%, significantly decrease the surface area available for hydrogen adsorption, not increasing the conversion. In addition, larger particles show lower selectivity towards the C=C bond and higher selectivity towards the C=O bond.
Therefore, due to the higher conversion and selectivity, the highest activity values towards the desired product are achieved for 6 wt.%. The activity towards MPAA increases with temperature, with the best result being obtained at 100 °C and 60 bar.

Author Contributions

Conceptualization, A.Ś.; Methodology, A.Ś., K.M., M.K., D.L., W.P. and W.R.-P.; Formal Analysis, A.Ś.; Investigation, A.J.F.-R., B.Z., K.M., M.K., D.L., W.P. and W.R.-P.; Data Curation, A.Ś.; Writing—original draft preparation, A.J.F.-R. and A.Ś.; Writing—review and editing, A.J.F.-R. and A.Ś.; Supervision, A.Ś.; Project Administration, A.Ś.; Funding Acquisition, A.Ś. All authors have read and agreed to the published version of the manuscript.

Funding

This research was funded by National Science Centre in Poland within OPUS 17 Project No. 2019/33/B/ST5/01271.

Conflicts of Interest

The authors declare no conflict of interest.

References

  1. Baumann, M.; Moody, T.S.; Smyth, M.; Wharry, S. A Perspective on Continuous Flow Chemistry in the Pharmaceutical Industry. Org. Process Res. Dev. 2020, 24, 1802–1813. [Google Scholar] [CrossRef]
  2. Andrew Mansfield Why Perform Your Chemistry in Continuous Flow? Available online: https://blog.syrris.com/2018/05/15/why-perform-your-chemistry-in-continuous-flow/ (accessed on 1 November 2021).
  3. Pollak, P. The Industry and the Business, 2nd ed.; John Wiley & Sons, Inc.: Hoboken, NJ, USA, 2011; ISBN 978-0-470-62767-9. [Google Scholar]
  4. Moreno-Marrodan, C.; Liguori, F.; Barbaro, P. Continuous-Flow Processes for the Catalytic Partial Hydrogenation Reaction of Alkynes. Beilstein J. Org. Chem. 2017, 13, 734–754. [Google Scholar] [CrossRef] [PubMed] [Green Version]
  5. Park, B.Y.; Lim, T.; Han, M.S. A Simple and Efficient in Situ Generated Copper Nanocatalyst for Stereoselective Semihydrogenation of Alkynes. Chem. Commun. 2021, 57, 6891–6894. [Google Scholar] [CrossRef]
  6. Faust Akl, D.; Ruiz-Ferrando, A.; Fako, E.; Hauert, R.; Safonova, O.; Mitchell, S.; López, N.; Pérez-Ramírez, J. Precursor Nuclearity and Ligand Effects in Atomically-Dispersed Heterogeneous Iron Catalysts for Alkyne Semi-Hydrogenation. ChemCatChem 2021, 13, 3247–3256. [Google Scholar] [CrossRef]
  7. Ricciardi, R.; Huskens, J.; Verboom, W. Nanocatalysis in Flow. ChemSusChem 2015, 8, 2586–2605. [Google Scholar] [CrossRef] [PubMed]
  8. Larrã, M.D.; Lewis, R.J.; Robert, S.; Lewis, A. Hawley’s Condensed Chemical Dictionary, 6th ed.; John Wiley & Sons: New York, NY, USA, 2016. [Google Scholar] [CrossRef]
  9. Ramchandani, D.; López-Muñoz, F.; Alamo, C. Meprobamate–Tranquilizer or Anxiolytic? A Historical Perspective. Psychiatr. Q. 2006, 77, 43–53. [Google Scholar] [CrossRef]
  10. Hotta, K.; Kubomatsu, T. Liquid-Phase Selective Hydrogenation of an Aliphatic α,β-Unsaturated Aldehyde over Raney Cobalt Catalyst Modified with Ferrous Chloride. Bull. Chem. Soc. Jpn. 1969, 42, 1447–1449. [Google Scholar] [CrossRef] [Green Version]
  11. National Center for Biotechnology Information. PubChem Patent Summary for EP-3286290-B1, Osmanthus Odorant. Available online: https://pubchem.ncbi.nlm.nih.gov/patent/EP-3286290-B1 (accessed on 1 November 2021).
  12. Hu, T.; Zhang, L.; Wang, Y.; Yue, Z.; Li, Y.; Ma, J.; Xiao, H.; Chen, W.; Zhao, M.; Zheng, Z.; et al. Defect Engineering in Pd/NiCo2O4−x for Selective Hydrogenation of α,β-Unsaturated Carbonyl Compounds under Ambient Conditions. ACS Sustain. Chem. Eng. 2020, 8, 7851–7859. [Google Scholar] [CrossRef]
  13. Pham, T.T.; Lobban, L.L.; Resasco, D.E.; Mallinson, R.G. Hydrogenation and Hydrodeoxygenation of 2-Methyl-2-Pentenal on Supported Metal Catalysts. J. Catal. 2009, 266, 9–14. [Google Scholar] [CrossRef]
  14. Akbarzadeh, O.; Mohd Zabidi, N.; Abdul Wahab, Y.; Hamizi, N.; Chowdhury, Z.; Aljunid Merican, Z.; Ab Rahman, M.; Akhter, S.; Shalauddin, M.; Johan, M. Effects of Cobalt Loading, Particle Size, and Calcination Condition on Co/CNT Catalyst Performance in Fischer–Tropsch Reactions. Symmetry (Basel) 2018, 11, 7. [Google Scholar] [CrossRef] [Green Version]
  15. Liu, X.; Jia, W.; Xu, G.; Zhang, Y.; Fu, Y. Selective Hydrodeoxygenation of Lignin-Derived Phenols to Cyclohexanols over Co-Based Catalysts. ACS Sustain. Chem. Eng. 2017, 5, 8594–8601. [Google Scholar] [CrossRef]
  16. Jozwiak, W.K.; Szubiakiewicz, E.; Góralski, J.; Klonkowski, A.; Paryjczak, T. Physico-Chemical and Catalytic Study of the Co/SiO2 Catalysts. Kinet. Catal. 2004, 45, 247–255. [Google Scholar] [CrossRef]
  17. Luo, Q.-X.; Guo, L.-P.; Yao, S.-Y.; Bao, J.; Liu, Z.-T.; Liu, Z.-W. Cobalt Nanoparticles Confined in Carbon Matrix for Probing the Size Dependence in Fischer-Tropsch Synthesis. J. Catal. 2019, 369, 143–156. [Google Scholar] [CrossRef]
  18. Mehrbod, M.; Martinelli, M.; Castro, J.D.; Alhraki, N.; Cronauer, D.C.; Kropf, A.J.; Marshall, C.L.; Jacobs, G. Fischer-Tropsch Synthesis: Direct Cobalt Nitrate Reduction of Promoted Co/Al2O3 Catalysts. Catal. Today 2021, 369, 129–143. [Google Scholar] [CrossRef]
  19. Ren, Y.; Bruce, P.G.; Ma, Z. Solid-Solid Conversion of Ordered Crystalline Mesoporous Metal Oxides under Reducing Atmosphere. J. Mater. Chem. 2011, 21, 9312–9318. [Google Scholar] [CrossRef]
  20. Olusola, O.J.; Sudip, M. Temperature Programme Reduction (TPR) Studies of Cobalt Phases in -Alumina Supported Cobalt Catalysts. J. Pet. Technol. Altern. Fuels 2016, 7, 1–12. [Google Scholar] [CrossRef] [Green Version]
  21. Stern, K.H. High Temperature Properties and Decomposition of Inorganic Salts Part 3, Nitrates and Nitrites. J. Phys. Chem. Ref. Data 1972, 1, 747–772. [Google Scholar] [CrossRef] [Green Version]
  22. Díaz, J.A.; Akhavan, H.; Romero, A.; Garcia-Minguillan, A.M.; Romero, R.; Giroir-Fendler, A.; Valverde, J.L. Cobalt and Iron Supported on Carbon Nanofibers as Catalysts for Fischer–Tropsch Synthesis. Fuel Process. Technol. 2014, 128, 417–424. [Google Scholar] [CrossRef]
  23. Park, J.-Y.; Lee, Y.-J.; Karandikar, P.R.; Jun, K.-W.; Ha, K.-S.; Park, H.-G. Fischer–Tropsch Catalysts Deposited with Size-Controlled Co3O4 Nanocrystals: Effect of Co Particle Size on Catalytic Activity and Stability. Appl. Catal. A Gen. 2012, 411–412, 15–23. [Google Scholar] [CrossRef]
  24. Chotiwan, S.; Tomiga, H.; Katagiri, M.; Yamamoto, Y.; Yamashita, S.; Katayama, M.; Inada, Y. Particle Size Effect of Redox Reactions for Co Species Supported on Silica. J. Solid State Chem. 2016, 241, 212–218. [Google Scholar] [CrossRef]
  25. Castner, D.G.; Watson, P.R.; Chan, I.Y. X-ray Absorption Spectroscopy, x-Ray Photoelectron Spectroscopy, and Analytical Electron Microscopy Studies of Cobalt Catalysts. 2. Hydrogen Reduction Properties. J. Phys. Chem. 2002, 94, 819–828. [Google Scholar] [CrossRef]
  26. Chernavskii, P.A.; Pankina, G.V.; Lermontov, A.S.; Lunin, V. V Size Distribution of Cobalt Particles in Catalysts for the Fischer-Tropsch Synthesis. Kinet. Catal. 2003, 44, 657–661. [Google Scholar] [CrossRef]
  27. Goring, G.E.; Curran, G.P.; Tarbox, R.P.; Gorin, E. Kinetics of Carbon Gasification by Steam. Effect of High Temperature Pretreatment on Reactivity of Low Temperature Char to Steam and Carbon Dioxide. Ind. Eng. Chem. 1952, 44, 1051–1057. [Google Scholar] [CrossRef]
  28. Feldkirchner, H.L.; Huebler, J. Reaction of Coal with Steam-Hydrogen Mixtures at High Temperatures and Pressures. Ind. Eng. Chem. Process Des. Dev. 1965, 4, 134–142. [Google Scholar] [CrossRef]
  29. Tsai, Y.-T.; Mo, X.; Campos, A.; Goodwin, J.G.; Spivey, J.J. Hydrotalcite Supported Co Catalysts for CO Hydrogenation. Appl. Catal. A Gen. 2011, 396, 91–100. [Google Scholar] [CrossRef]
  30. Słowik, G.; Gawryszuk-Rżysko, A.; Greluk, M.; Machocki, A. Estimation of Average Crystallites Size of Active Phase in Ceria-Supported Cobalt-Based Catalysts by Hydrogen Chemisorption vs TEM and XRD Methods. Catal. Lett. 2016, 146, 2173–2184. [Google Scholar] [CrossRef] [Green Version]
  31. Kowalczyk, Z.; Jodzis, S.; Raróg, W.; Zieliński, J.; Pielaszek, J.; Presz, A. Carbon-Supported Ruthenium Catalyst for the Synthesis of Ammonia. The Effect of the Carbon Support and Barium Promoter on the Performance. Appl. Catal. A Gen. 1999, 184, 95–102. [Google Scholar] [CrossRef]
  32. Hansen, T.W.; Hansen, P.L.; Dahl, S.; Jacobsen, C.J.H. Support Effect and Active Sites on Promoted Ruthenium Catalysts for Ammonia Synthesis. Catal. Lett. 2002, 84, 7–12. [Google Scholar] [CrossRef]
  33. Durndell, L.J.; Parlett, C.M.A.; Hondow, N.S.; Isaacs, M.A.; Wilson, K.; Lee, A.F. Selectivity Control in Pt-Catalyzed Cinnamaldehyde Hydrogenation. Sci. Rep. 2015, 5, 9425. [Google Scholar] [CrossRef] [Green Version]
  34. Natesakhawat, S.; Lekse, J.W.; Baltrus, J.P.; Ohodnicki, P.R.; Howard, B.H.; Deng, X.; Matranga, C. Active Sites and Structure-Activity Relationships of Copper-Based Catalysts for Carbon Dioxide Hydrogenation to Methanol. ACS Catal. 2012, 2, 1667–1676. [Google Scholar] [CrossRef]
  35. Rioux, R.M.; Song, H.; Hoefelmeyer, J.D.; Yang, P.; Somorjai, G.A. High-Surface-Area Catalyst Design: Synthesis, Characterization, and Reaction Studies of Platinum Nanoparticles in Mesoporous SBA-15 Silica†. J. Phys. Chem. B 2004, 109, 2192–2202. [Google Scholar] [CrossRef]
  36. Gallezot, P.; Richard, D. Selective Hydrogenation of α,β-Unsaturated Aldehydes. Catal. Rev. 2006, 40, 81–126. [Google Scholar] [CrossRef]
  37. Ghogia, A.C.; Nzihou, A.; Serp, P.; Soulantica, K.; Pham Minh, D. Cobalt Catalysts on Carbon-Based Materials for Fischer-Tropsch Synthesis: A Review. Appl. Catal. A Gen. 2021, 609, 117906. [Google Scholar] [CrossRef]
  38. Kim, M.; Bertram, M.; Pollmann, M.; Von Oertzen, A.; Mikhailov, A.S.; Rotermund, H.H.; Ertl, G. Controlling Chemical Turbulence by Global Delayed Feedback: Pattern Formation in Catalytic CO Oxidation on Pt(110). Science 2001, 292, 1357–1360. [Google Scholar] [CrossRef] [PubMed] [Green Version]
  39. Lin, Y.-C.; Kim, W.K.; Dzubiella, J. Coverage Fluctuations and Correlations in Nanoparticle-Catalyzed Diffusion-Influenced Bimolecular Reactions. J. Phys. Chem. C 2020, 124, 24204–24214. [Google Scholar] [CrossRef]
  40. Moulder, J.F.; Stickle, W.F.; Sobol, P.E.; Bomben, K.D. Handbook of X-ray Photoelectron Spectroscopy; Chastain, J., King, R.C., Jr., Eds.; Physical Electronics, Inc.: Chanhassen, MN, USA, 1995. [Google Scholar]
  41. NIST X-ray Photoelectron Spectroscopy Database 20, Version 4.1. Available online: http://srdata.nist.gov/xps/ (accessed on 1 November 2021).
  42. Beamson, G.; Brighs, D. High Resolution XPS of Organic Polymers: The Scienta ESCA300 Database; John Wiley & Sons, Ltd.: Chichester, UK, 1992. [Google Scholar]
  43. Reuel, R.C.; Bartholomew, C.H. The Stoichiometries of H2 and CO Adsorptions on Cobalt: Effects of Support and Preparation. J. Catal. 1984, 85, 63–77. [Google Scholar] [CrossRef]
  44. Borodziński, A.; Bonarowska, M. Relation between Crystallite Size and Dispersion on Supported Metal Catalysts. Langmuir 1997, 13, 5613–5620. [Google Scholar] [CrossRef]
Scheme 1. Possible pathways of 2-methyl-2-pentanal hydrogenation [13].
Catalysts 12 00019 sch001
Figure 1. Temperature-programmed reduction of 2, 6, 10 and 14 wt.% Co/CNR115 after incipient wetness impregnation.
Catalysts 12 00019 g001
Figure 2. X-ray diffraction (XRD) pattern for CNR115 support and the four catalysts, 2, 6, 10 and 14 wt.% Co/CNR115, after reduction process.
Catalysts 12 00019 g002
Figure 3. Transmission electron microscopy (TEM) images and Co particle size distribution of (a) 2 wt.% Co/CNR115, (b) 6 wt.% Co/CNR115, (c) 10 wt.% Co/CNR115, and (d) 14 wt.% Co/CNR115.
Catalysts 12 00019 g003
Figure 4. Temperature-programmed desorption of hydrogen (H2-TPD) profiles for catalysts with different cobalt loading.
Catalysts 12 00019 g004
Figure 5. Turnover frequency for 2, 6, 10 and 14 wt.% Co/CNR115 at different values of pressure and temperature.
Catalysts 12 00019 g005
Figure 6. Selectivity towards 2-methylpentanal for 2, 6, 10 and 14 wt.% Co/CNR115 at different values of pressure and temperature.
Catalysts 12 00019 g006
Figure 7. Activity towards 2-methylpentanal in hydrogenation of 2-methyl-2pentenal at different values of pressure and temperature for 2, 6, 10 and 14 wt.% Co/CNR115.
Catalysts 12 00019 g007
Figure 8. Stability test of 2-methyl-2-pentenal hydrogenation with 6 wt.% Co/CNR115 at 60 bar and 100 °C.
Catalysts 12 00019 g008
Figure 9. Transmission electron microscopy (TEM) image and NPs size distribution of spent 6 wt.% Co/CNR115.
Catalysts 12 00019 g009
Figure 10. Co 2p X-ray photoelectron spectroscopy (XPS) region of 2 wt.% Co/CNR115 catalyst before and after reaction.
Catalysts 12 00019 g010
Table 1. Specific surface area, total pore volume and pore size estimated from N2 physisorption experiments.
SamplesSpecific Surface Area (m2 g−1)Total Pore Volume (cm3 g−1)Pore Size (Å)
2 wt.% Co/CNR1151585± 10.40.3427.8
6 wt.% Co/CNR1151417 ± 9.00.3228.2
10 wt.% Co/CNR1151367± 9.10.3128.4
14 wt.% Co/CNR1151064 ± 5.90.3124.9
Table 2. Active phase parameters estimated on the basis of H2-TPD measurements.
CatalystCo Dispersion [%]dCo [nm]SH2 [m2∙gCo−1]
2 wt.% Co/CNR11513.7973
6 wt.% Co/CNR1158.41545
10 wt.% Co/CNR1154.32523
14 wt.% Co/CNR1153.24017
Publisher’s Note: MDPI stays neutral with regard to jurisdictional claims in published maps and institutional affiliations.

