Review

Fundamentals and Principles of Solid-State Electrochemical Sensors for High Temperature Gas Detection

by
Elena Gorbova
1,2,3,
Fotini Tzorbatzoglou
1,
Costas Molochas
1,
Dimitris Chloros
1,
Anatoly Demin
2,3,* and
Panagiotis Tsiakaras
1,2,3,*
1
Laboratory of Alternative Energy Conversion Systems, Department of Mechanical Engineering, School of Engineering, University of Thessaly, 1 Sekeri Str., Pedion Areos, 38834 Volos, Greece
2
Laboratory of Materials and Devices for Electrochemical Power Engineering, Institute of Chemical Engineering, Ural Federal University, 620002 Yekaterinburg, Russia
3
Laboratory of Electrochemical Devices Based on Solid Oxide Proton Electrolytes, Institute of High Temperature Electrochemistry Russian Academy of Science, 620990 Yekaterinburg, Russia
*
Authors to whom correspondence should be addressed.
Catalysts 2022, 12(1), 1; https://doi.org/10.3390/catal12010001
Submission received: 10 November 2021 / Revised: 2 December 2021 / Accepted: 7 December 2021 / Published: 21 December 2021

Abstract

:
The rapid development of science, technology, and engineering in the 21st century has offered a remarkable rise in our living standards. However, at the same time, serious environmental issues have emerged, such as acid rain and the greenhouse effect, which are associated with the ever-increasing need for energy consumption, 85% of which comes from fossil fuels combustion. From this combustion process, except for energy, the main greenhouse gases-carbon dioxide and steam-are produced. Moreover, during industrial processes, many hazardous gases are emitted. For this reason, gas-detecting devices, such as electrochemical gas sensors able to analyze the composition of a target atmosphere in real time, are important for further improving our living quality. Such devices can help address environmental issues and inform us about the presence of dangerous gases. Furthermore, as non-renewable energy sources run out, there is a need for energy saving. By analyzing the composition of combustion emissions of automobiles or industries, combustion processes can be optimized. This review deals with electrochemical gas sensors based on solid oxide electrolytes, which are employed for the detection of hazardous gasses at high temperatures and aggressive environments. The fundamentals, the principle of operation, and the configuration of potentiometric, amperometric, combined (amperometric-potentiometric), and mixed-potential gas sensors are presented. Moreover, the results of previous studies on carbon oxides (COx), nitrogen oxides (NOx), hydrogen (H2), oxygen (O2), ammonia (NH3), and humidity (steam) electrochemical sensors are reported and discussed. Emphasis is given to sensors based on oxygen ion and proton-conducting electrolytes.

Graphical Abstract

1. Introduction

In many industrial fields, such as metallurgy, nuclear or thermal power plants, and the petrochemical industry, high temperatures are required. By analyzing/measuring the emissions, it is possible to reduce the released hazardous gases and optimize the combustion process. This analysis can be applied by using sensors able to withstand operating conditions and operate effectively under them. Moreover, electrochemical sensing technologies are used for the online detection of gases. Electrochemical gas sensors (EGSs) can provide information about the concentration of a wide range of gases by using redox reactions. Their technology dominates over other technologies, as they provide real-time information with good selectivity, accuracy, simple design, and low cost. Ideally, the response of an EGS is directly related to the concentration of a specific chemical species [1].
EGSs based on solid oxide electrolytes are employed in various applications, such as environmental control, chemical processing, laboratory analysis, etc. EGSs, among other gas sensing technologies, seem to be the most promising technology, offering simple design and operation, high sensitivity, real-time response, and the possibility of miniaturization even in really difficult environments. The output of these sensors is an electrical signal that directly provides information about the measured chemical compounds. These advantages render these sensors an attractive and promising technology to address emission-related problems. Independently of the target gas or their design, most EGSs have the same or very similar principles of operation. Based on their operation, these sensors are classified into two categories. The first includes active sensors, where the sensing signal is the voltage between two electrodes. This includes equilibrium potentiometric sensors (EPSs) and mixed potential sensors (MPSs). The second are passive sensors, where an externally applied voltage is required, and the output current is the sensing signal. This includes amperometric sensors. Regardless of the type, in EGS, system functionality is based mainly on the solid oxide electrolyte separating the two electrodes and offering the required ionic conductivity, combined with thermal, mechanical, and thermodynamic stability in harsh operating environments.
Conductivity in solids was reported for the first time more than a century ago. In 1883, Michael Faraday first discovered electrical conductivity in Ag2S. Similar behavior was reported for PbF2. Hittorf studied conductivity in AgS and Cu2S and stated that a conduction mechanism in these materials is different from conduction in metals. Warburg in 1884 proved that sodium ions could flow through the solid. This result changed the Arrhenius claim that pure salt and pure water could not be conductors such as salt dissolved in water [2].
One of the earliest applications of solid ceramic electrolytes was Nernst’s lamp. In 1897, Nernst discovered that ceramic based on oxides mixture could exhibit conduction at high temperatures. In 1943, Wagner explained the conduction mechanisms in solid electrolytes [3]. Later, many solid oxides with good ionic conductivity at increased temperatures, such as the particularly favorable compositions of 85 mass% zirconia and 15 mass% yttria (YSZ), were identified.
In 1957, Kiukkola and Wagner performed thermodynamic investigations, using CaO-stabilized ZrO2 as a solid electrolyte [4]. These studies were the first step for many applications in solid-state electrochemistry in which ZrO2-based solid electrolytes dominated over other ceramic electrolytes. For example, in 1961, Weissbart and Ruka described a ZrO2-based galvanic cell for the detection of oxygen in named high-temperature oxygen gauge [5]. Many families of materials were identified as ion conductors relative to different kinds of ions; some of the most important include β and β’’ aluminas, polymers, cerates, and zirconates [6].
Herein, we provide the principle of operation and the configuration of the types (potentiometric, amperometric, combined, and mixed potential) of solid oxide gas sensors, followed by a discussion on the results of previous studies dealing with the detection of several gasses (H2, O2, COx, NOx, NH3, and steam) at high temperatures and harsh operating environments. Our presentation focuses on sensors based on proton-conducting and oxygen ion electrolytes.

2. Theory

Based on their principle of operation, EGSs are classified as potentiometric, amperometric, combined (amperometric-potentiometric), and impedance-based gas sensors [7].

2.1. Equilibrium Potentiometric Gas Sensors

A potentiometric sensor consists of an electrolyte, usually in the form of a one-end closed tube, covered with two electrodes on the internal (reference electrode, RE) and external (sensing electrode, SE) sides of the electrolyte. During the operation of a potentiometric sensor, an equilibrium potential is established at the SE. This potential depends on the concentration of the gas of interest (target gas). A standard potential is established at the RE. The potential of the SE is measured against this standard potential. Electrodes are coated with a catalyst, usually a noble metal such as platinum, to increase reaction speed and, thus, improve the performance of the sensor [8].
The principle of operation of potentiometric sensors is based on open-circuit voltage (OCV) measurements, where no electrical current flows through the sensor. The sensor operates as a concentration cell, with different chemical potentials of ionic species on each side. The open-circuit voltage can be calculated by Equation (1), known as the Nernst Equation:
E = t i R     T z     F ln p gas p gas
where R is the ideal gas constant, T the absolute temperature, F the Faraday constant, z the number of the involved electrons in the electrochemical reaction at the sensor electrodes, ti the ion transference number, and pgas the partial pressure of the electrochemically active gas on each side of the sensor; here and below, single prime (′) stands for inside atmosphere and double prime (″) stands for outside atmosphere. If the operating conditions are known (the concentration of the electroactive gas in the reference atmosphere and the experimental OCV, i.e., the electromotive force (EMF) established between the SE and RE), the composition of the target atmosphere can be analyzed. Most equilibrium potentiometric sensors follow this principle [9]. For example, for an oxygen sensor with an oxygen ion conductor with tO = 1, Equation (1) is transformed into the following.
E = R     T 4     F ln p O 2 p O 2
here, z is equal to 4, and po2 is the oxygen partial pressure. A well-known potentiometric oxygen sensor with a solid oxide electrolyte (YSZ) is the lambda sensor displayed in Figure 1A, usually employed for the detection of oxygen in exhaust gases [10].

2.2. Mixed Potential Gas Sensors

The design and the principle of operation of mixed-potential gas sensors are similar to that of potentiometric gas sensors described above. In an equilibrium potentiometric sensor, oxidation and reduction reactions occur between electrodes and gas until a steady potential is established. However, in mixed potential sensors, more than one reaction takes place at the SE (sensing electrode). As a result, no equilibrium is established and a mixed-potential is observed. This behavior is known as non-Nernstian. As this mixed potential provides information about the gas of interest, these sensors are employed for the detection of non-equilibrium gas mixtures containing H2, CO, CO2, hydrocarbons, SO2, NOx, NH3, and H2S [9,11,12,13]. Okamoto et al. first introduced the concept of mixed potential sensors [14]. In Figure 1B, a typical CO mixed-potential sensor based on an YSZ electrolyte and Pt-electrodes is schematically represented. During the operation of this sensor, two reactions take place at the SE: reaction (3) generates oxygen anions, which then are involved in an anodic reaction (4) with the target gas (in this example with CO).
O 2 + 4 e 2 O 2
CO + O 2 CO 2 + 2 e
Reaction (3) also takes place at the RE (reference electrode), exposed to the reference gas or in some designs relative to the analyzed gas, if the RE is inactive to reaction (4), resulting in an equilibrium potential at the RE that is determined by the reaction occurring there. Note that this potential depends only on the oxygen concentration. Thus, between the SE and RE, a potential difference is observed, which is mainly affected by the kinetics of reactions (3) and (4) on the SE; thus, for the efficiency and the performance of the sensor, it is important to choose a suitable SE [15].

2.3. Amperometric Gas Sensors

Amperometric sensors work by applying an external voltage. This applied voltage drives certain reactions at the electrodes. Amperometric sensors are designed in such a manner that the gas supply to one of the electrodes is limited by diffusion. This electrode can be in an inner chamber, or it can represent a porous media. In order for the gas to reach the electrode, it must be diffused through the porous or capillary barrier [7]. In Figure 1C,D, schemes of typical amperometric sensors are displayed. When the sensor is placed in the tested atmosphere, the chamber (porous electrode) is filled with ambient gas. Then, an external voltage is applied between the electrodes, and the reaction of the target gas at the cathode begins. In the case of the oxygen amperometric sensor, this reaction is (3).
In this manner, a dynamic balance is established between the amount of the target gas, electrochemically pumped out from the chamber (porous layer), and the amount of the target gas that diffuses through the diffusion barrier. According to Faraday’s law, the generated electrical current relates to the diffusion flow of the target gas as follows:
J ( gas ) = I n     F
where I is the observed current, F the Faraday’s constant, and n is the number of electrons involved in the reaction. By increasing applied voltage, the reaction rate increases until a certain value, where the concentration of the target gas inside the sensor is negligible. At this point, the diffusion flow of the target gas through the capillary barrier reaches the maximum value. Under this condition, a further increase in applied voltage does not affect current response. The corresponding current is denoted by Usui et al. [19] as the limiting current, described by Equation (6):
I lim = z     F     D gas     P     A R     T     L ln ( 1 X gas )
here, Ilim is the limiting current, Dgas the diffusion coefficient, A and L the area and length of the diffusion barrier, respectively, P is the absolute pressure, Xgas the mole fraction of the target gas, and z is the number of electrons transferred. In the case of low gas concentration (<20%), Equation (6) is simplified to Equation (7).
I lim = z     F     D gas     P     A   R     T     L X gas
The diffusion coefficient depends on the operating conditions according to Equation (8), known from Chapman–Enskog theory:
D = D 0 ( T T 0 ) m P 0 P
where D0, T0, and P0 are the diffusion coefficient, temperature, and pressure at standard conditions (25 °C and 1 atm), P and T are the pressure and temperature at operating conditions, and m is a coefficient depending on the composition and kind of gas mixtures, ranging from 1.5 to 1.9 [19].
Amperometric sensors seem to provide more advantages over the potentiometric ones as they can operate without a reference atmosphere. The establishment of a reference atmosphere for the proper operation of a hydrogen potentiometric sensor can be really problematic due to the environment of operation of these sensors; their working temperature is usually above 600 °C to achieve a stable reference potential. Another advantage of amperometric sensors is that the limiting current is linearly related to the gas concentration, as described by Equations (6) and (7), making amperometric sensors more precise for medium and high target gas concentrations. On the contrary, potentiometric sensors are less sensitive at such concentrations because the sensing signal is logarithmically related to gas concentration. By employing many different materials and geometries, amperometric sensors can identify many different gases, such as O2, H2, CO, NOx, CHs, and NH3 [7].

2.4. Combined Gas Sensors (Amperometric-Potentiometric)

Apart from purely potentiometric or amperometric cells, there are more sophisticated devices that combine both cells. Combined sensors consist of two electrochemical cells: one operates as an amperometric sensor and the other as a potentiometric one. The joints between the cells, or between the cells and the capillary barrier, are sealed with a high-temperature glass sealant. The principle of operation of these devices is more complex compared to single amperometric or potentiometric sensors. During their operation, the first cell pumps target gas in or out of the sensor chamber, and the limiting current is measured. The other cell measures the EMF and provides information about the concentration of the target gas or the proper operation of the amperometric sensor. Therefore, the ability of the combined sensor to measure simultaneously the limiting current in the target gas pump and the EMF in the potentiometric cell increases the sensor’s reliability [8]. A detailed description of the operation of combined sensors is presented in Section 4.1.2 and Section 4.3.1.

2.5. Impedance-Based Gas Sensors

The impedance metric gas sensors employ a different approach for detecting the gas of interest. The design of impedance-based sensors is similar to that of mixed-potential sensors. For their operation, a sinusoidal voltage is applied, and the current response is measured. By knowing the applied voltage and the current response, the impedance is calculated. Impedance-based techniques are applied to semiconductor-based and solid oxide-based sensors [20]. There are reports of YSZ-based impedancemetric sensors for detecting steam (H2O), NOx, and CO [7,21,22,23,24].

3. Materials for Electrochemical Gas Sensors

An electrochemical sensor consists of at least two electrodes, the electrolyte, the wires connecting the electrodes, the necessary sealants, and the shell that houses all components. It is always important to carefully choose the employed materials for the electrodes and the electrolyte, while seriously considering the operating temperature, the environment, and the occurring reactions.

3.1. Electrolytes

In electrochemical devices, the electrolyte is the most important component. In electrolytes, the electric current is transported by ions, while in metals it is transported by electrons. During the last three decades, several solid materials were developed that exhibit significant ionic conductivity, presenting almost negligible electronic conductivity. Solid electrolytes are applied in many electrochemical devices (fuel cells, batteries, supercapacitors, and electrochemical gas sensors). Solid electrolytes, in order to be applied in these devices, must meet a set of properties, including thermal, mechanical, ionic-transport characteristics, and long-term thermodynamic and chemical stability in the operating environment. The main two groups of materials discussed herein are oxygen ion-conducting and proton-conducting electrolytes.
The fluorite family includes ZrO2-based materials stabilized with Y, Yb, and Sc oxides or their mixture [25] and CeO2-based materials doped with lanthanides [26]. ZrO2-based electrolytes have oxygen ion conductivity in a wide range of oxygen partial pressures and are utilized in sensors for measuring oxygen activity in atmospheres with free or bonded oxygen (H2O + H2 or CO2 + CO mixtures). CeO2-based electrolytes become mixed ionic-electronic conductors at low oxygen concentration [27]; therefore, they can be used in the sensors for measuring the concentration of free oxygen.
Among the perovskite family materials, lanthanum gallate (LaGaO3)-based ones were the only proved suitable for application as electrolytes. Ishihara et al. [28,29,30] first developed optimized materials of general stoichiometry La1-xSrxGa1-yMgyO3-δ (LSGM). LSGM exhibits higher conductivity at intermediate temperatures than the ZrO2-based electrolytes and slightly lower conductivity than CeO2-based electrolytes, and it is a promising electrolyte for application in sensors operating at lower temperatures. Another family of oxide-ion conductors is BIMEVOX. They are Bi2O3-based ionic conductors, doped with a transition metal (such as Cu or Mg) and vanadium (V), showing ionic conductivity close to 0.1 S·cm−1 at 600 °C [31,32].
Among the newly discovered electrolytes, proton conductors are the most promising for future electrochemical devices. Iwahara et al. first discovered the proton-conducting properties of LaYO3 and SrZrO3 [33]. Following their findings, Maiti and Vikar reported that pure BaCeO3 and yttria-doped BaCeO3 behave as proton conductors at pO2 < 10−6 and 600–1000 °C [34]. In 1987, Mitsui et al. [35] proved proton conduction in BaCe0.95Yb0.05O3-δ and BaZr0.95Yb0.05O3-δ. Among these discoveries, the highest conductivity, close to 10−2 S·cm−1 at 600 °C, was achieved by BaCeO3-based materials [36,37]. Moreover, materials belonging to the alkali earth family, such as MCeO3 (where M = Sr, Ca, Ba), were investigated for their proton-conducting properties.
In the beginning of 1990s, only zirconates were known for their protonic conductivity; later, in 1993, Liang and Nowick proposed a mixed perovskite with formula A2(B1+xC1-x)O6-δ, where A = Sr2+, Ba2+, B = Ga3+, Gd3+, and Nd3+ and C = Nb5+ and Ta5+, while x ranges from 0 to 0.2 [38,39]. The most investigated materials, in terms of their proton-conducting properties, are oxides based on BaCeO3 and BaZrO3. In addition to those materials, other protonic conductors, such as LaNbO4, Ba2In2O5, and LaYO3, were used in solid oxide electrochemical hydrogen sensors even if they exhibit lower proton conductivity [40]. Among them, LaYO3 was the first oxide material in which Iwahara and Takahashi observed proton-conducting properties.

3.2. Electrodes

The electrodes used in EGSs must exhibit excellent sensitivity to the target gas. However, apart sensitivity, long-term and porous structure stability is also required. It is common to use a noble metal electrode because EGSs based on solid oxide electrolytes usually have a small size; thus, the cost of the utilized noble metal is not high. The most favorable materials for potentiometric and amperometric sensors are mainly noble metals. This group includes platinum (Pt), rhodium (Rh), ruthenium (Ru), palladium (Pd), gold (Au), iridium (Ir), and silver (Ag) [41].
In the first equilibrium potentiometric sensors, atmospheric air was supplied to RE because oxygen concentration in air is known. On the other hand, hydrogen or inert gas with a standard concentration of hydrogen was used as the reference gas in equilibrium potentiometric sensors based on proton-conducting solid electrolytes [42]. However, as already discussed, the constant supply of the reference gas is problematic; thus, other solutions were suggested as alternatives. One solution seems to be the utilization of a Metal/Metal Ox system as the reference electrode [9].
There is a wide range of materials for sensing electrodes (SE) in mixed-potential sensors. At first, metals such as Au, Pt, and Mo or binary systems with Ag, Au, Ni, and Cu based on Pt were mainly employed [15]. However, recent investigations proposed materials based on NiO, WO3 [43], ZnO, and ZnO/CuO [15,44].

4. Solid Electrolyte-Based Electrochemical Gas Sensors (EGSs)

The materials, design, and principle of operation of EGSs employed for the detection of combustible gases, such as carbon oxides, hydrocarbons, and hydrogen, are initially discussed. Then, EGSs for the detection of nitrogen oxides and ammonia are presented. Finally, oxygen and humidity electrochemical sensors are also described. Different sensors are reported, operating in a wide range of temperatures from 300 °C to 1000 °C, based on different electrolyte and electrode materials.

4.1. Detection of Combustible Gasses

4.1.1. Detection of COx (CO, CO2) and CnH2n+2 Hydrocarbons (HCs)

Nowadays, concerns about flammable and toxic gases are increasing. Toxic gases appear in both industrial and domestic environments, causing severe, life-threatening, and harmful environmental issues. Solid-state oxygen sensors are a well-known technology for the regulation of internal combustion engines emissions. However, the control of more stringent pollutant emissions requires the development of electrochemical sensors able to detect CO and HCs. Future emission control strategies and onboard diagnostic systems require sensors to detect the above gases at very low concentrations, usually a few ppm, at temperatures between 800 and 1000 °C. During internal combustion, CO is generated from HCs’ incomplete combustion. The control of CO is important because it is harmful to the environment and humans, while from its concentration levels, we can obtain information about combustion efficiency. For direct on-board diagnostic strategies, solid-state electrochemical sensors capable of operating at high temperatures and detecting those combustible gases are employed downstream of a three-way catalytic converter [7]. As previously mentioned, the most common and well-established sensor for the control of exhaust emissions is the lambda sensor. This sensor is based on YSZ electrolyte and operates under the potentiometric regime. It is the most reliable technology, as it is employed in gasoline-based vehicles since 1990. Among the advantages of YSZ electrolyte include the great mechanical and chemical stability over a long period of time and good oxygen–anion conductivity.

Mixed Potential Combustible Gas Sensors

Usually, solid-state EGSs employed for detecting hydrocarbons and CO operate under the potentiometric regime. The signal in these sensors is given from the electromotive force developed between the two electrodes. As is known, the most popular solid electrolyte is YSZ, and Pt is the noble metal most widely used for the electrodes. Ce0.8Ga0.2O1.9 (CGO) [45] or β’’-aluminas [46] are also suggested as electrolytes. The main requirement to be fulfilled for a suitable mixed-potential sensor is the facilitation of the reaction kinetics at the three-phase boundary. These sensors are suitable at temperatures between 500 and 600 °C as they operate in non-equilibrium conditions. At higher temperatures, the system approaches equilibrium resulting in a decrease in response signal [47]. The investigations on mixed potential sensors for combustible gases were mainly devoted to finding new materials for electrode applications. WO3 [48], Nb2O5, Ga2O3, and In2O3 [49] are some of the most popular electrode materials for CO and HCs electrochemical sensors, operating between 500 and 700 °C. Furthermore, doped-oxides and perovskites have also been investigated as materials for sensing electrodes. However, mixed potential sensors suffer from poor selectivity because of their detection mechanism. Moreover, they exhibit high cross-sensitivity as both HCs and CO react with oxygen [7].

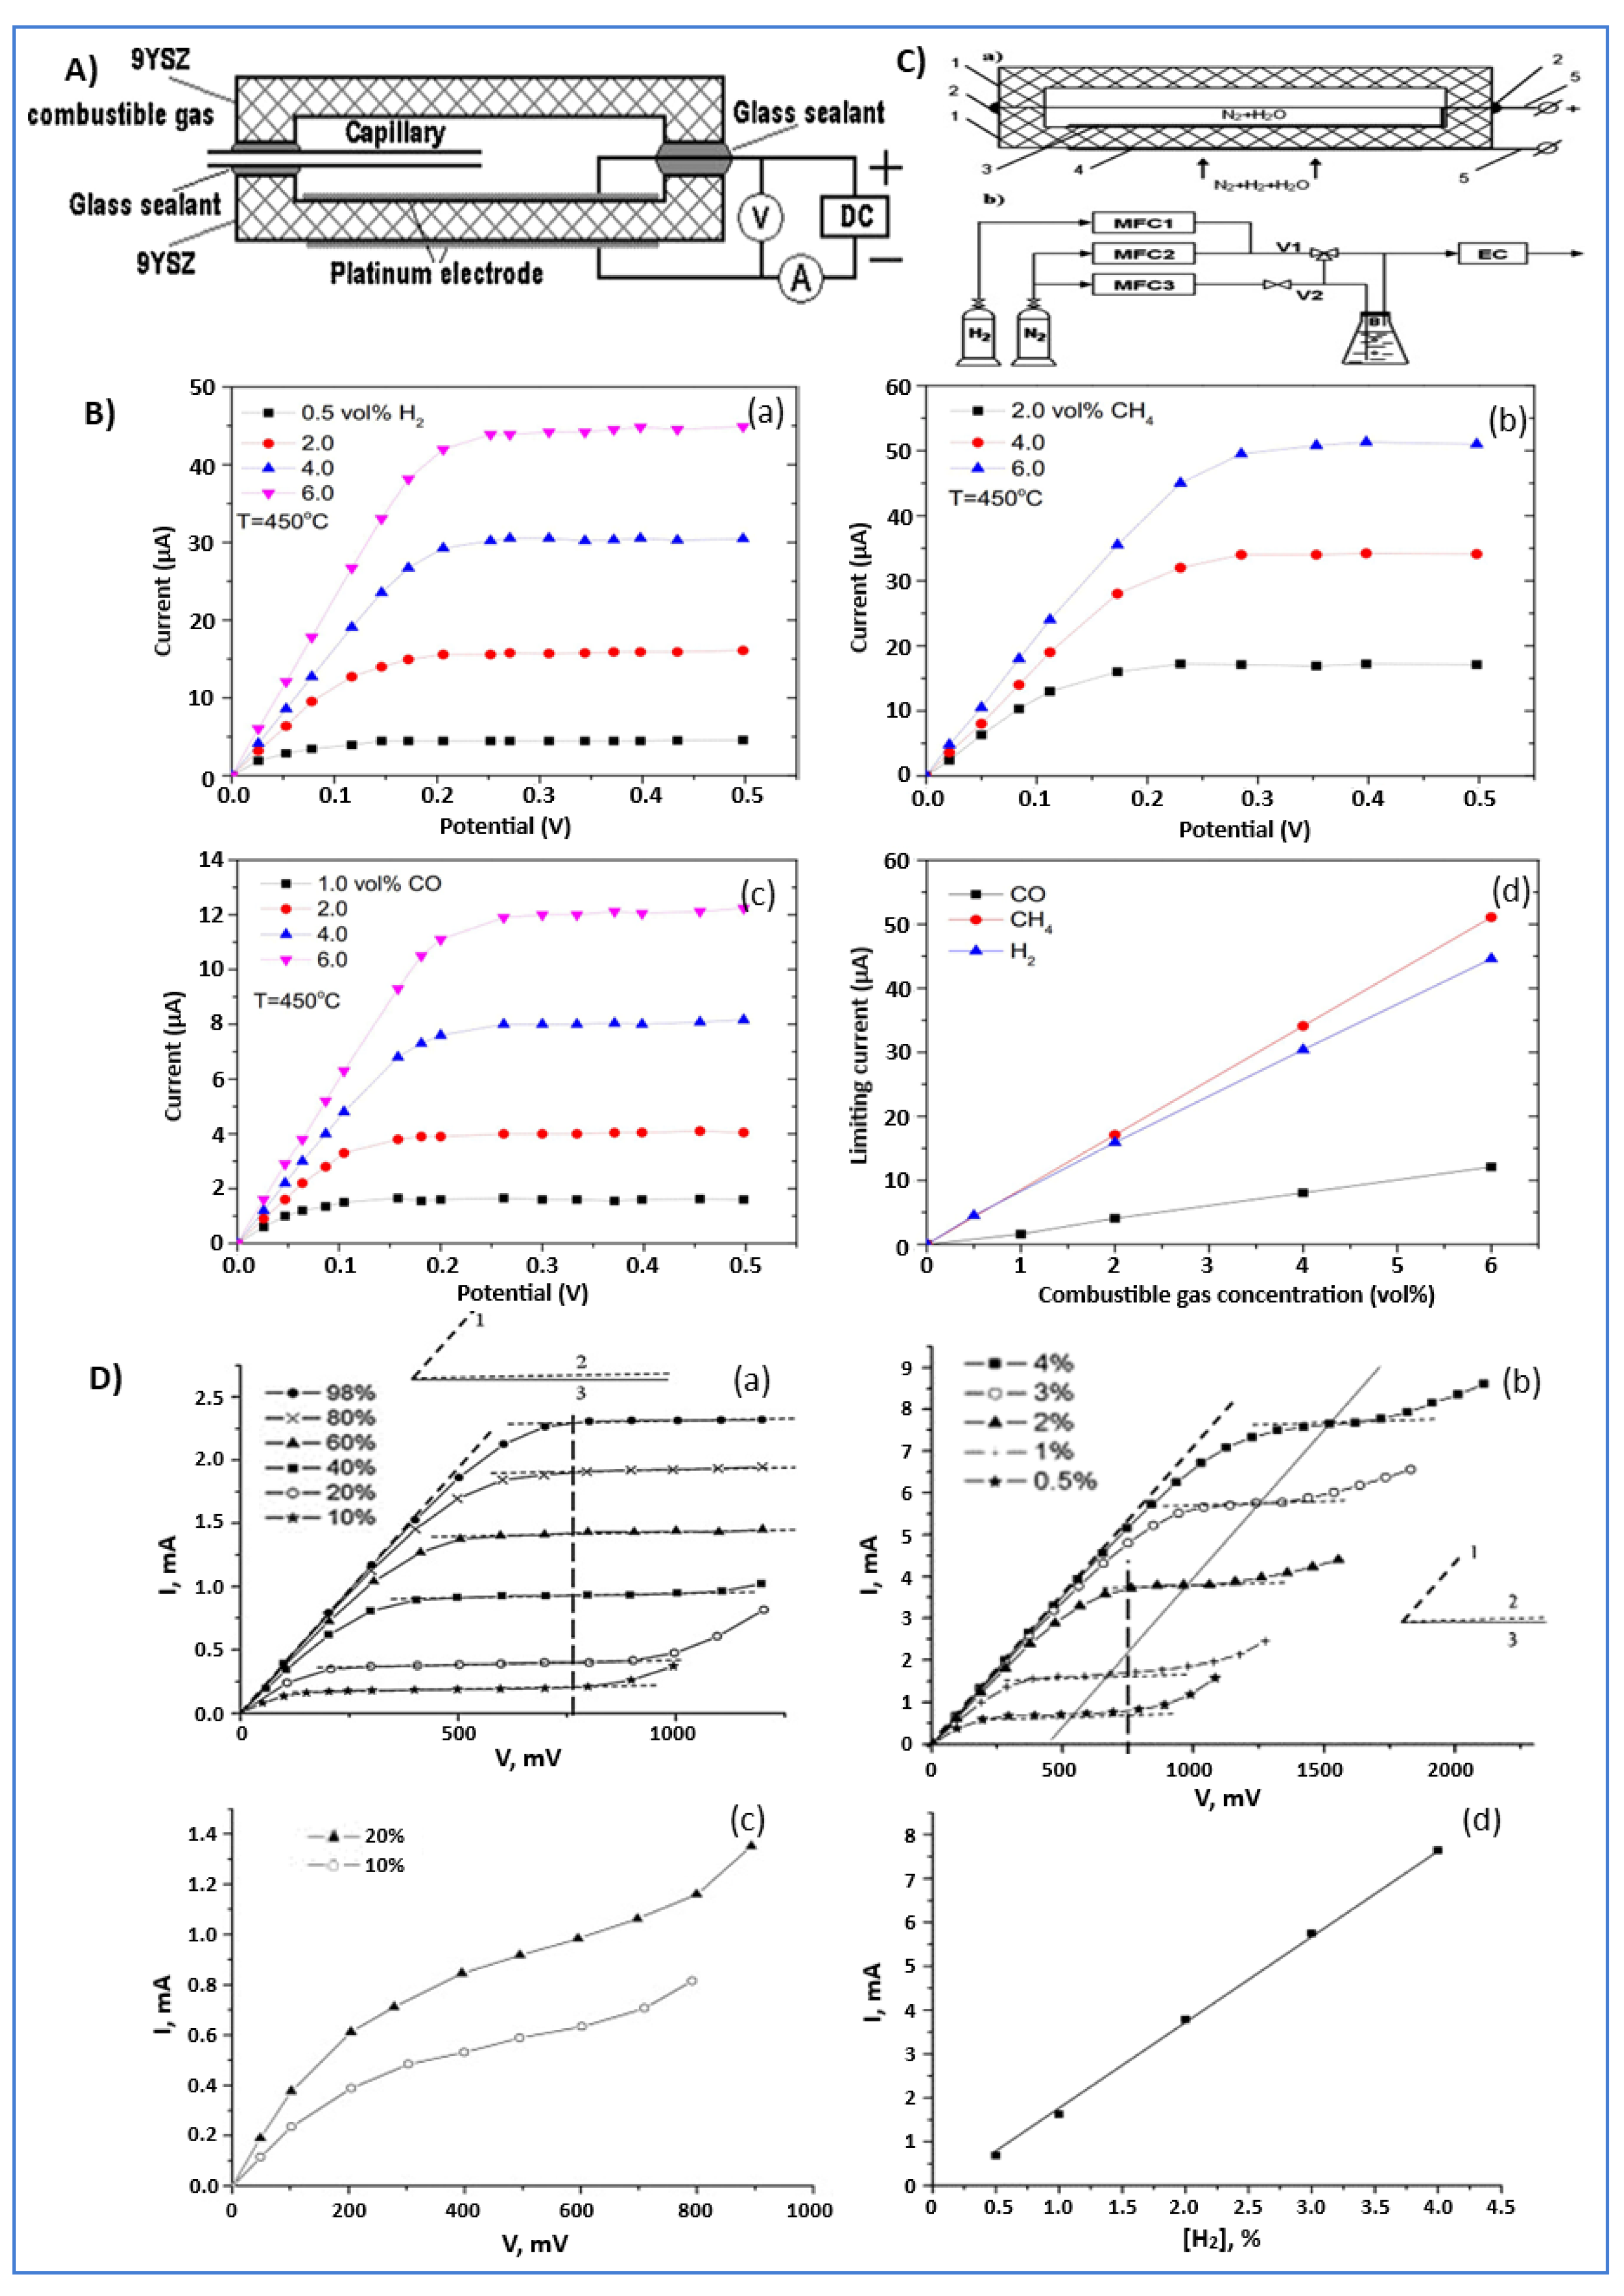
Amperometric Combustible Gas Sensors

Apart from YSZ-based electrochemical potentiometric sensors, amperometric sensors have also been proposed for combustible gas analysis. They present several advantages, including the operation without the need for a reference gas and the establishment of an equilibrium potential. Although amperometric sensors have some advantages over potentiometric ones, there are not many reports about their employment for the detection of combustible gases. Additionally, the detection of combustible gases in mixtures of combustible gas+N2 is interesting from a practical point of view, because most thermal-catalytic analyzers cannot effectively detect combustible gases in oxygen-free atmospheres. Recently, Fadeyev et al. [50] fabricated an amperometric sensor for the detection of H2, CO, and CH4 in nitrogen for intermediate temperatures (450 °C). As observed from Figure 2A, the abovementioned sensor consists of two cells based on 9YSZ (0.91Zr + 0.09Y2O3). The cells are sealed with glass sealant, forming an internal chamber between them. This chamber is connected through a metal capillary with the environment. At the opposite sides of one of the cells are deposited Pt electrodes with current wire leads.
The operation principle of the amperometric sensors has already been discussed. A positive potential is applied to the inner electrode. Due to the applied potential, steam reacts at the outer electrode according to the following reaction.
H 2 O + 2 e H 2 + O 2
Steam decomposition occurs because some residual humidity (10 ppm) exists in nitrogen and so at the analyzed gas. The oxygen anions generated from reaction (9) move through YSZ to the inner electrode and react with the H2, CO, and CH4 in the chamber according to the following reactions.
H 2 + O 2 H 2 O + 2 e
CO + O 2 CO 2 + 2 e
CH 4 + 4 O 2 CO 2 + 2 H 2 O + 8 e
Due to the reactions, the concentration of the combustible component inside the chamber decreases. The diffusion flux of the combustible gas through the capillary reaches a maximum value when its concentration inside the chamber is zero. Equation (7) for the limiting current can be written as follows:
I lim , k = z k     F     D k     P     A R     T     L X k
where k represents the target gas (k = H2, CO or CH4) and Xk represents the mole fraction of the target gas; zk = 2 for H2 and CO, and zk = 8 for CH4. By solving Equation (13), it is possible to obtain the following Equation for the diffusion coefficient.
D k = I lim , k     R     T     L z k     X k     P     A     F
The tests were carried out in different mixtures of combustible gas + N2 at 450 °C. In Figure 2B, the relation between the applied voltage and the current response of the sensor is shown. The plateau region is observed when the limiting current is reached. Figure 2B(a) shows the I-V curves for N2 + H2 mixtures, at 0.5, 2, 4, and 6 vol% H2. As observed, all curves reach a plateau at 0.2–0.25 V.
From Figure 2B(a), for the mixture of N2 + 6%H2 at 450 °C, the total resistance (the slope of the region before the plateau) of the sensor is about 4 kΩ, of which about 12.5% is the resistance of the electrolyte (0.5 kΩ), and the rest is the polarization resistance of the electrodes. In Figure 2B(b), the curves for the N2 + CH4 mixture at different CH4 concentrations are displayed. Similarly to N2 + H2 mixtures, all curves for the CH4 + N2 mixtures reach the plateau between 0.2 and 0.25 V.
The total resistance of the sensor, for the N2 + 6%CH4 mixture, is about 5 kΩ, close to the value obtained for the N2 + 6%H2 mixture. In Figure 2B(c), the I-V curves for N2 + CO mixtures with different CO concentrations (1–6 vol.%) are depicted. As noted, the current response is considerably lower than that observed for N2 + CH4 and N2 + H2 mixtures. The main reason is the considerably lower diffusion rate of CO in N2 compared to that of CH4 and H2.
Furthermore, due to the higher polarization resistance of the electrode, the total resistance of the sensor for N2 + 6%CO is about 16 kΩ. In all the tested combustible gases, the limiting current is linearly proportional to the concentration, as seen in Figure 2B(d) [50]. From Equation (14), the diffusion coefficient for each tested gas is calculated. The calculated diffusion coefficients for H2, CH4, and CO were 3.54 ± 0.6, 1.02 ± 0.5, and 0.952 ± 0.5 cm2/s, respectively.

4.1.2. Hydrogen (H2) Sensors

A well-known electrolyte for these sensors is YSZ, which is stable and effective with good ionic conductivity at elevated temperatures. Although there are many investigations about hydrogen detection sensors based on oxygen-conducting electrolytes using the mixed-potential principle, they are not yet suitable for well-measuring hydrogen. Consequently, for the development of electrochemical hydrogen sensors, the use of solid oxide proton conductors (SOPCs) is reported.

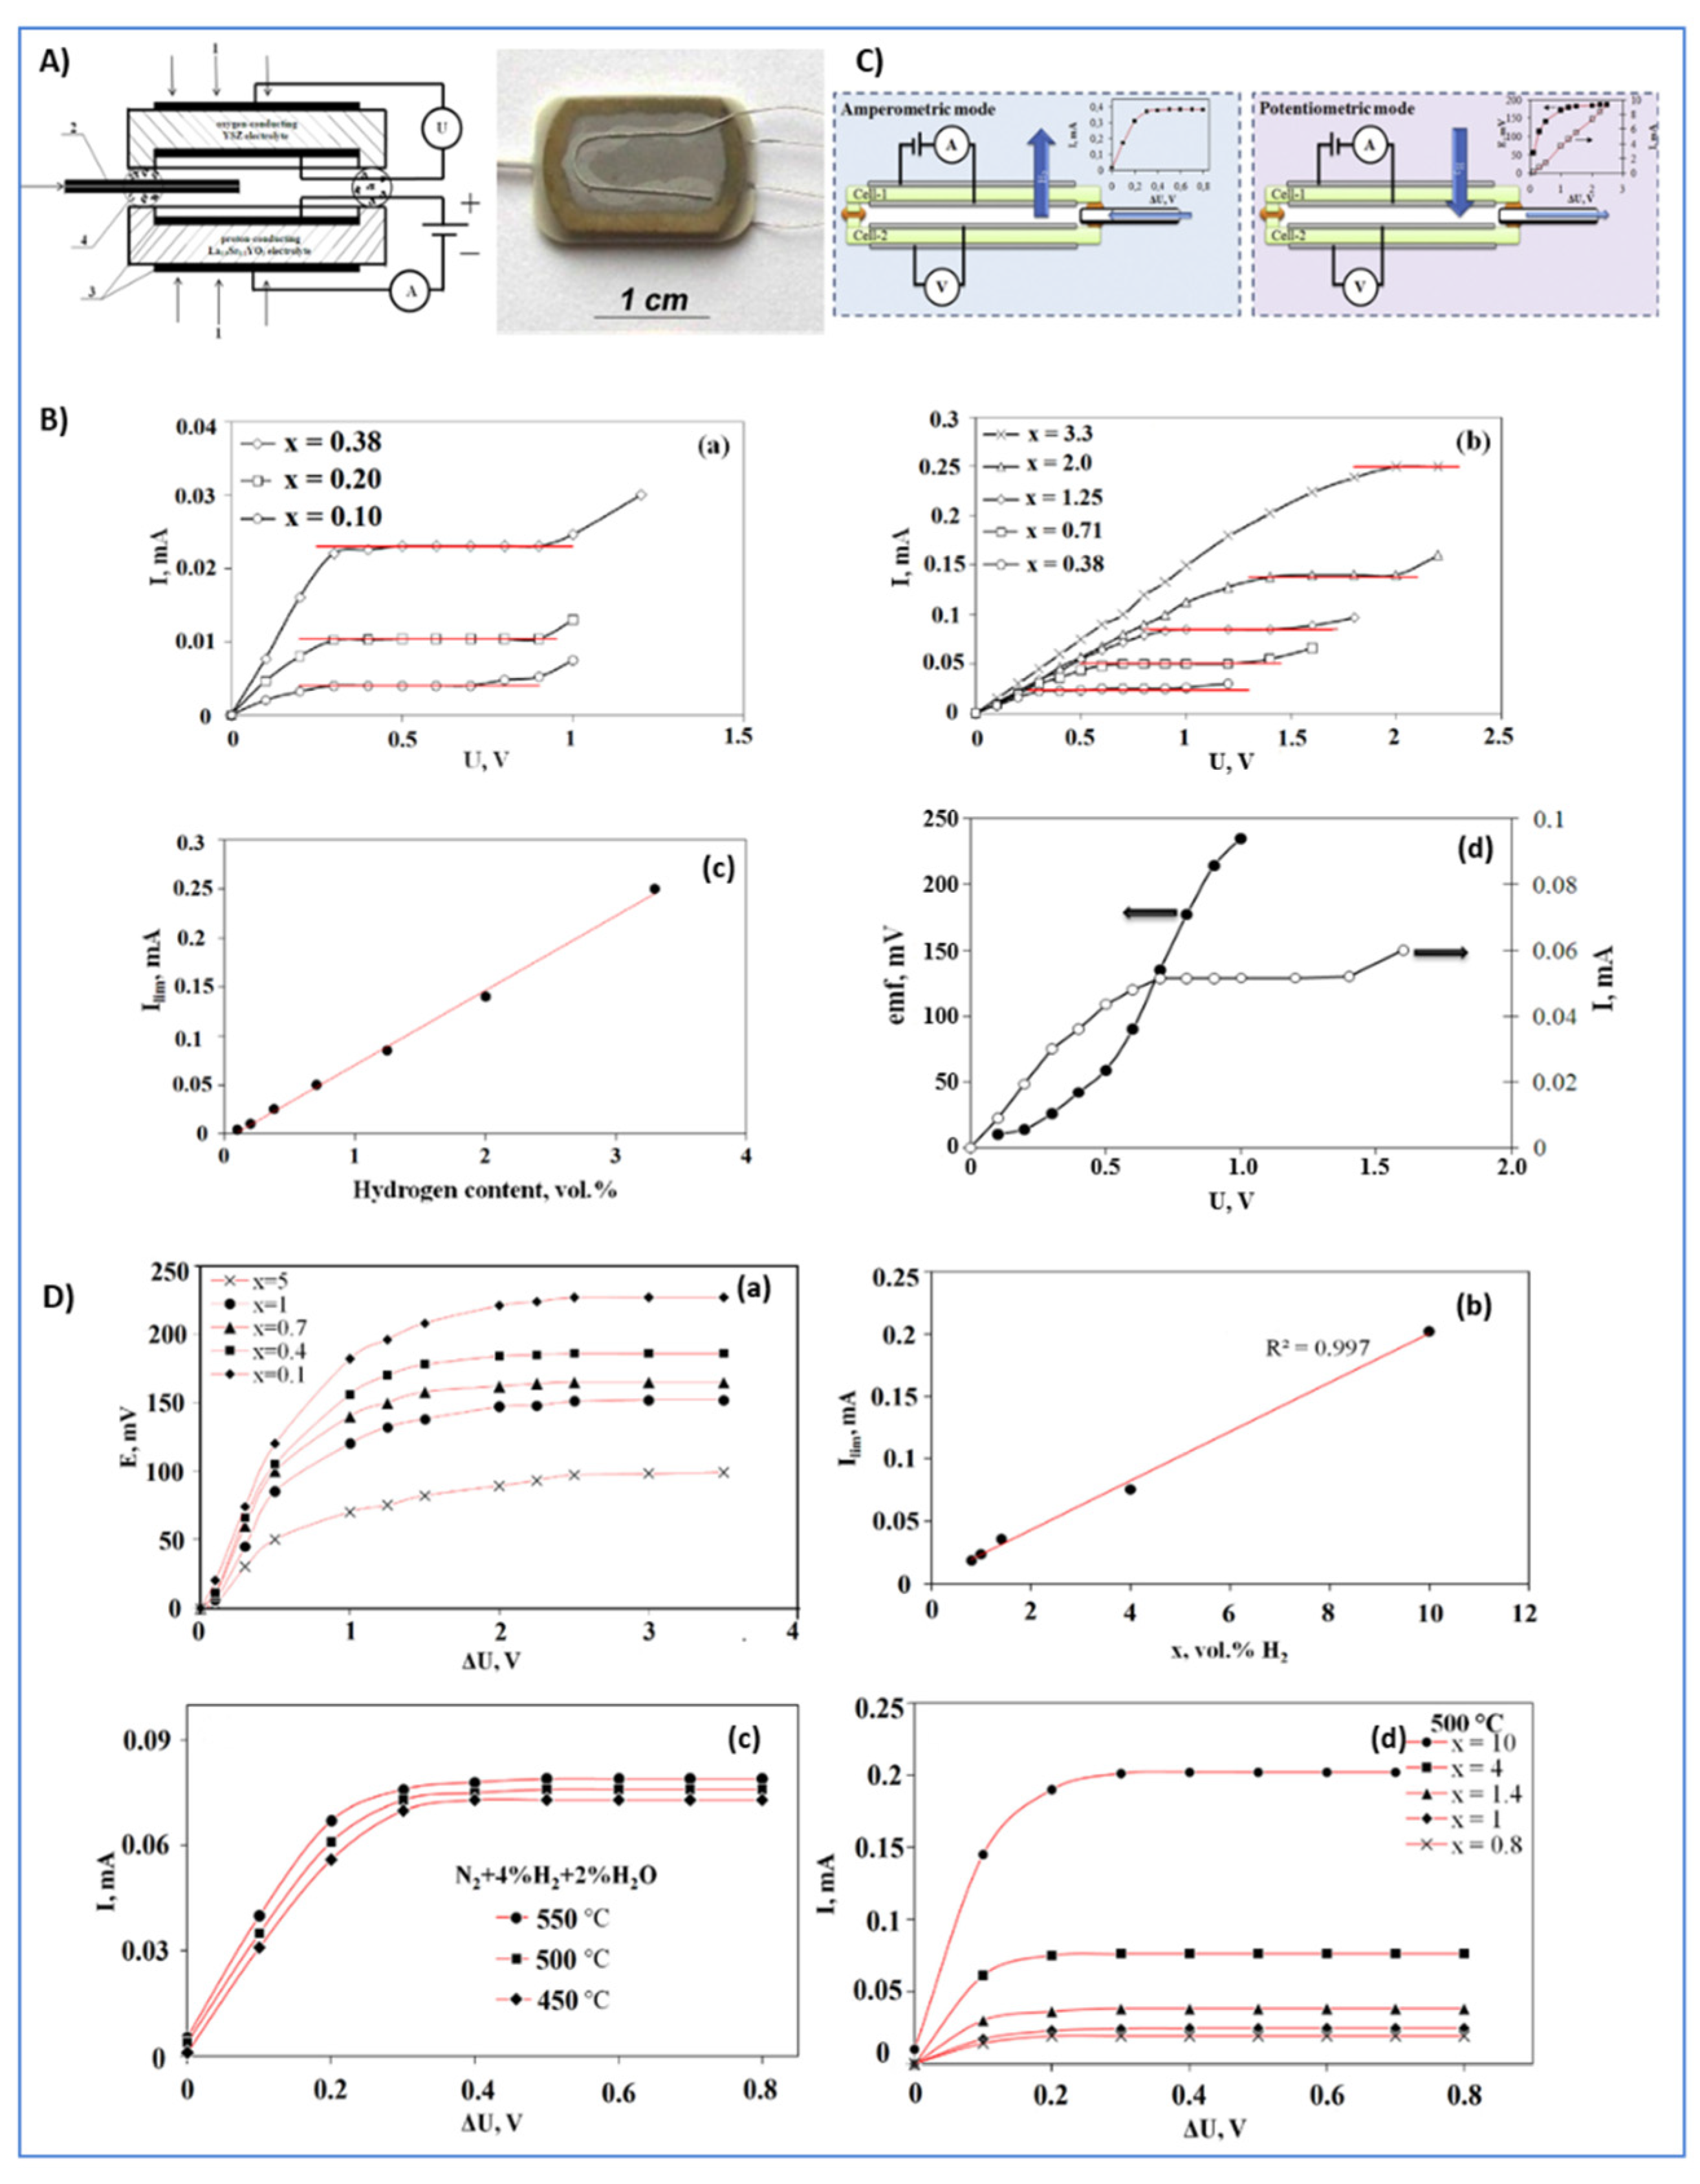
Amperometric H2 Sensors

Hydrogen amperometric sensors were fabricated using La0.95Sr0.05YO3, CaZr0.90Sc0.1O3, and CaTi0.95Sc0.05O3 proton-conducting solid electrolytes, synthesized and tested by Kalyakin et al. [51] in H2 + N2 + H2O gas atmospheres at 800 °C. The configuration of the three sensors was similar. Two parts of the solid electrolyte were sealed together using a glass sealant to form an empty chamber between the two plates. Two Pt electrodes were placed at the opposite sides of one of the plates. The sensor is schematically represented in Figure 2C.
In these sensors, the leakage between the sealed parts and through the porous solid electrolyte plays the role of the diffusion barrier. In order to test the three sensors, they were placed into a furnace to reach the needed temperature at around 800 °C. A direct current (DC) voltage is applied to the electrodes for the electrochemical pumping of hydrogen out of the chamber. Under these conditions, hydrogen generates protons and electrons at the internal electrode. Protons move through the proton conductor to the external electrode and meet with the electrons to form hydrogen molecules again. The electrochemical pumping-out of hydrogen is described by the following equations.
Internal   electrode :   H 2 2 H + + 2 e
External   electrode :   2 H + + 2 e H 2
The current–voltage curves of the sensor were obtained. The ohmic resistance of the solid electrolyte and the electrode polarization resistance affect the slope of the I-V curves, while the limiting current depends on the characteristics of the diffusion barrier and the composition of the fed gas. The I-V curves of the sensors #1, 2, and 3, based on La0.95Sr0.05YO3, CaZr0.90Sc0.1O3, and CaTi0.95Sc0.05O3, respectively, are presented in Figure 2D(a–c). In the sensors based on La0.95 Sr0.05YO3 and CaZr0.90Sc0.1O3, three regions can be distinguished. Sensor #1 was tested at hydrogen concentrations between 10 and 98%, while sensor #2 was tested at significantly lower hydrogen concentrations (<10%). Finally, as observed, for sensor #3 based on CaTi0.95Sc0.05O3 electrolyte, the I-V curves never reach a plateau, a fact attributed to the presence of a significant electronic conductivity in the electrolyte. Consequently, this electrolyte is not suitable for hydrogen sensors. As observed in Figure 2D(d), the relation between limiting current and H2 content for sensor #1 is strictly linear. Therefore, the La0.95Sr0.05YO3 electrolyte can be used for the detection of high hydrogen concentration in mixtures with N2 at elevated temperatures. From Figure 2D(b), it is observed that the dependence of limiting current and H2 content is also linear. Sensor #2 made with CaZr0.90Sc0.1O3 can be used for the detection of low H2 concentrations (<5%) in a mixture with N2 [51].

Combined (Amperometric-Potentiometric) H2 Sensors

A combined H2 sensor is applied for measuring hydrogen content in N2 + H2 mixtures containing also some amount of steam, usually less than 0.1% [18]. The sensor is composed of two cells: The first one is based on a solid proton-conducting electrolyte, La0.9Sr0.1YO3-δ (LSY), while the other one is based on an oxygen ion-conducting electrolyte, YSZ. Both cells are rectangular plates with a recess on one side. The cells have Pt electrodes on the opposite sides. The two cells form a chamber between them that connects with the ambient gas through a ceramic capillary. The principal scheme and the used experimental cell of an amperometric sensor are displayed in Figure 3A.
By applying a positive potential to the inner electrode of the LSY plate, hydrogen is electrochemically pumped out of the sensor chamber due to the transfer of protons through the La0.9Sr0.1YO3-δ electrolyte. When the hydrogen concentration inside the sensor chamber is negligible, a limiting current is observed. The latter for the hydrogen sensor is calculated through Equation (7), where gas = H2 and z = 2.
I lim = 2   ·   F   ·   D H 2 · P   ·   A R   ·   T   ·   L X H 2
The YSZ-based cell operates as a potentiometric sensor. The generated OCV obeys Nernst Equation (2). In both cell atmospheres, oxygen is bonded, and its partial pressure is determined by the following Equation:
p O 2 = ( K   ·   p H 2 O p H 2 ) 2
where K is the equilibrium constant of reaction (19).
H 2 O K H 2 + 0.5 O 2
Taking into account that the steam partial pressure in the analyzed gas mixture and inside the sensor chamber is practically the same, Equation (2) after substitution of pO2 from Equation (18) is written as follows.
E = R   ·   T 2   ·   F ln ( p H 2 p H 2 )
In fact, the cell with the YSZ electrolyte continuously monitors hydrogen content inside the sensor as the hydrogen pumping continues. The I-V curves of the sensor for different H2 concentrations in N2 + H2 mixtures at different operating temperatures are shown in Figure 3B(a,b). Three regions are observed on the curves for each H2 concentration. At the first region, the current is proportional to the applied voltage until the limiting current is reached and a plateau is observed. At the plateau region, the current remains constant under the rising voltage. The current starts increasing again at higher voltage values. The observed rise is due to the appearance of electronic conductivity in the solid electrolyte.
As seen in Figure 3B(c), a linear relationship between the limiting current and the H2 concentration is observed. This is an important condition concerning the amperometric sensor suitability for the target gas detection [18]. Figure 3B(d) shows the dependence of the current and the measured OCV on the applied voltage. The curves were obtained at 550 °C for 0.7 vol.% hydrogen in the H2 + N2 mixture. As observed, the current increases with the increase in applied voltage up to 0.7 V. The limiting current plateau lasts until the voltage reaches ~1.4 V. At the same time, the OCV value, measured using the YSZ-based cell, increases smoothly at the beginning as the applied voltage increases. However, when the concentration of hydrogen inside the sensor tends to zero, there is a sharp increase in the OCV value. At the plateau region, the hydrogen concentration is not more than 8 ppm.
BaCe0.7Zr0.1Y0.2O3-δ (BZCY) was employed in a combined amperometric–potentiometric sensor for detecting hydrogen in wet (2% H2O) N2 + H2 mixtures at temperatures between 450 and 550 °C [52]. This sensor is made of two Pt|BZCY|Pt electrochemical cells, with an empty chamber between them. The chamber is connected with the environment through a capillary. The joints between the cells and between the cell and the capillary were sealed with a high-temperature glass sealant. The configuration of the sensor is presented in Figure 3C. Cell-1 operates under an amperometric regime as an electrochemical pump, while cell-2 operates as a hydrogen potentiometric sensor. Depending on the applied voltage to the cell-1, the sensor operates either in potentiometric, Figure 3C(a), or amperometric mode, Figure 3C(b).
In the potentiometric mode, a DC voltage is applied to cell-1 for hydrogen pumping inside the sensor chamber. The electrochemical pumping-in of hydrogen is described by the following equations.
External   electrode :   H 2 2 H + + 2 e
Internal   electrode :   2 H + + 2 e H 2  
The H2 gradually replaces N2 inside the chamber, and a pure hydrogen atmosphere is created. The second electrochemical cell (cell-2) measures the potential difference generated between its internal and external electrodes due to the difference in hydrogen concentration. This potential is described by Nernst’s Equation (20). Note that inside the sensor, there is a pure hydrogen atmosphere; therefore, p H 2 in = 1 atm. From the measured EMF, hydrogen’s concentration in the surrounding gas is calculated. The generated potential difference at the electrodes enables the tested potentiometric cell to effectively measure low hydrogen concentrations in N2 + H2 gas mixtures. Consequently, the potentiometric mode is suitable for detecting hydrogen at the operating conditions.
Figure 3D(a) presents the typical EMF-V curves for cell-2. As the applied voltage at cell-1 increases, the rate of hydrogen pumping inside the chamber also increases. As observed, EMF grows initially with the applied voltage (first stage) and then tends to a constant value (second stage), when U reaches 2–2.5 V. The first stage is explained by the partial displacement of nitrogen by the pumped hydrogen and, as a result, the growth of difference in the hydrogen partial pressure between the opposite sides. Whereas, at the second stage, there is a pure hydrogen atmosphere inside the sensor; thus, the pressure difference in the opposite sides reaches its maximum value. The E-U curves obtained in this experiment for different hydrogen concentrations are displayed in Figure 3D(a).
At the amperometric mode, Figure 3C(b), a DC voltage is applied between the electrodes of cell-1 in such a manner that hydrogen in the form of protons flows from the chamber to the outside of the sensor. The reactions on the electrodes are opposite to reactions (21) and (22).
The limiting current for a hydrogen sensor based on a solid protonic conductor is calculated by using Equation (17). Figure 3D(c) displays the I-V curves for the mixture of N2 + 2%H2O + 4%H2 for different temperatures. As it is observed, the highest limiting current is observed at the highest temperature of operation because the diffusion coefficient is proportional to temperature. Figure 3D(d) shows the I-V curves for different H2 content at an operating temperature of 500 °C. The plateau region is observed between 0.2 and 0.3 V of the applied voltage. The ability of this sensor to operate in either potentiometric or amperometric mode enables the sensor to effectively detect hydrogen in either low or high hydrogen concentrations in mixtures of N2 + H2O + H2. The dependence of the limiting current on the hydrogen concentration is presented in Figure 3D(b). As observed, a linear behavior between the limiting current and H2 content is obtained. In conclusion, apart from the potentiometric mode, this sensor is suitable for the detection of hydrogen when operating at the amperometric mode [52].

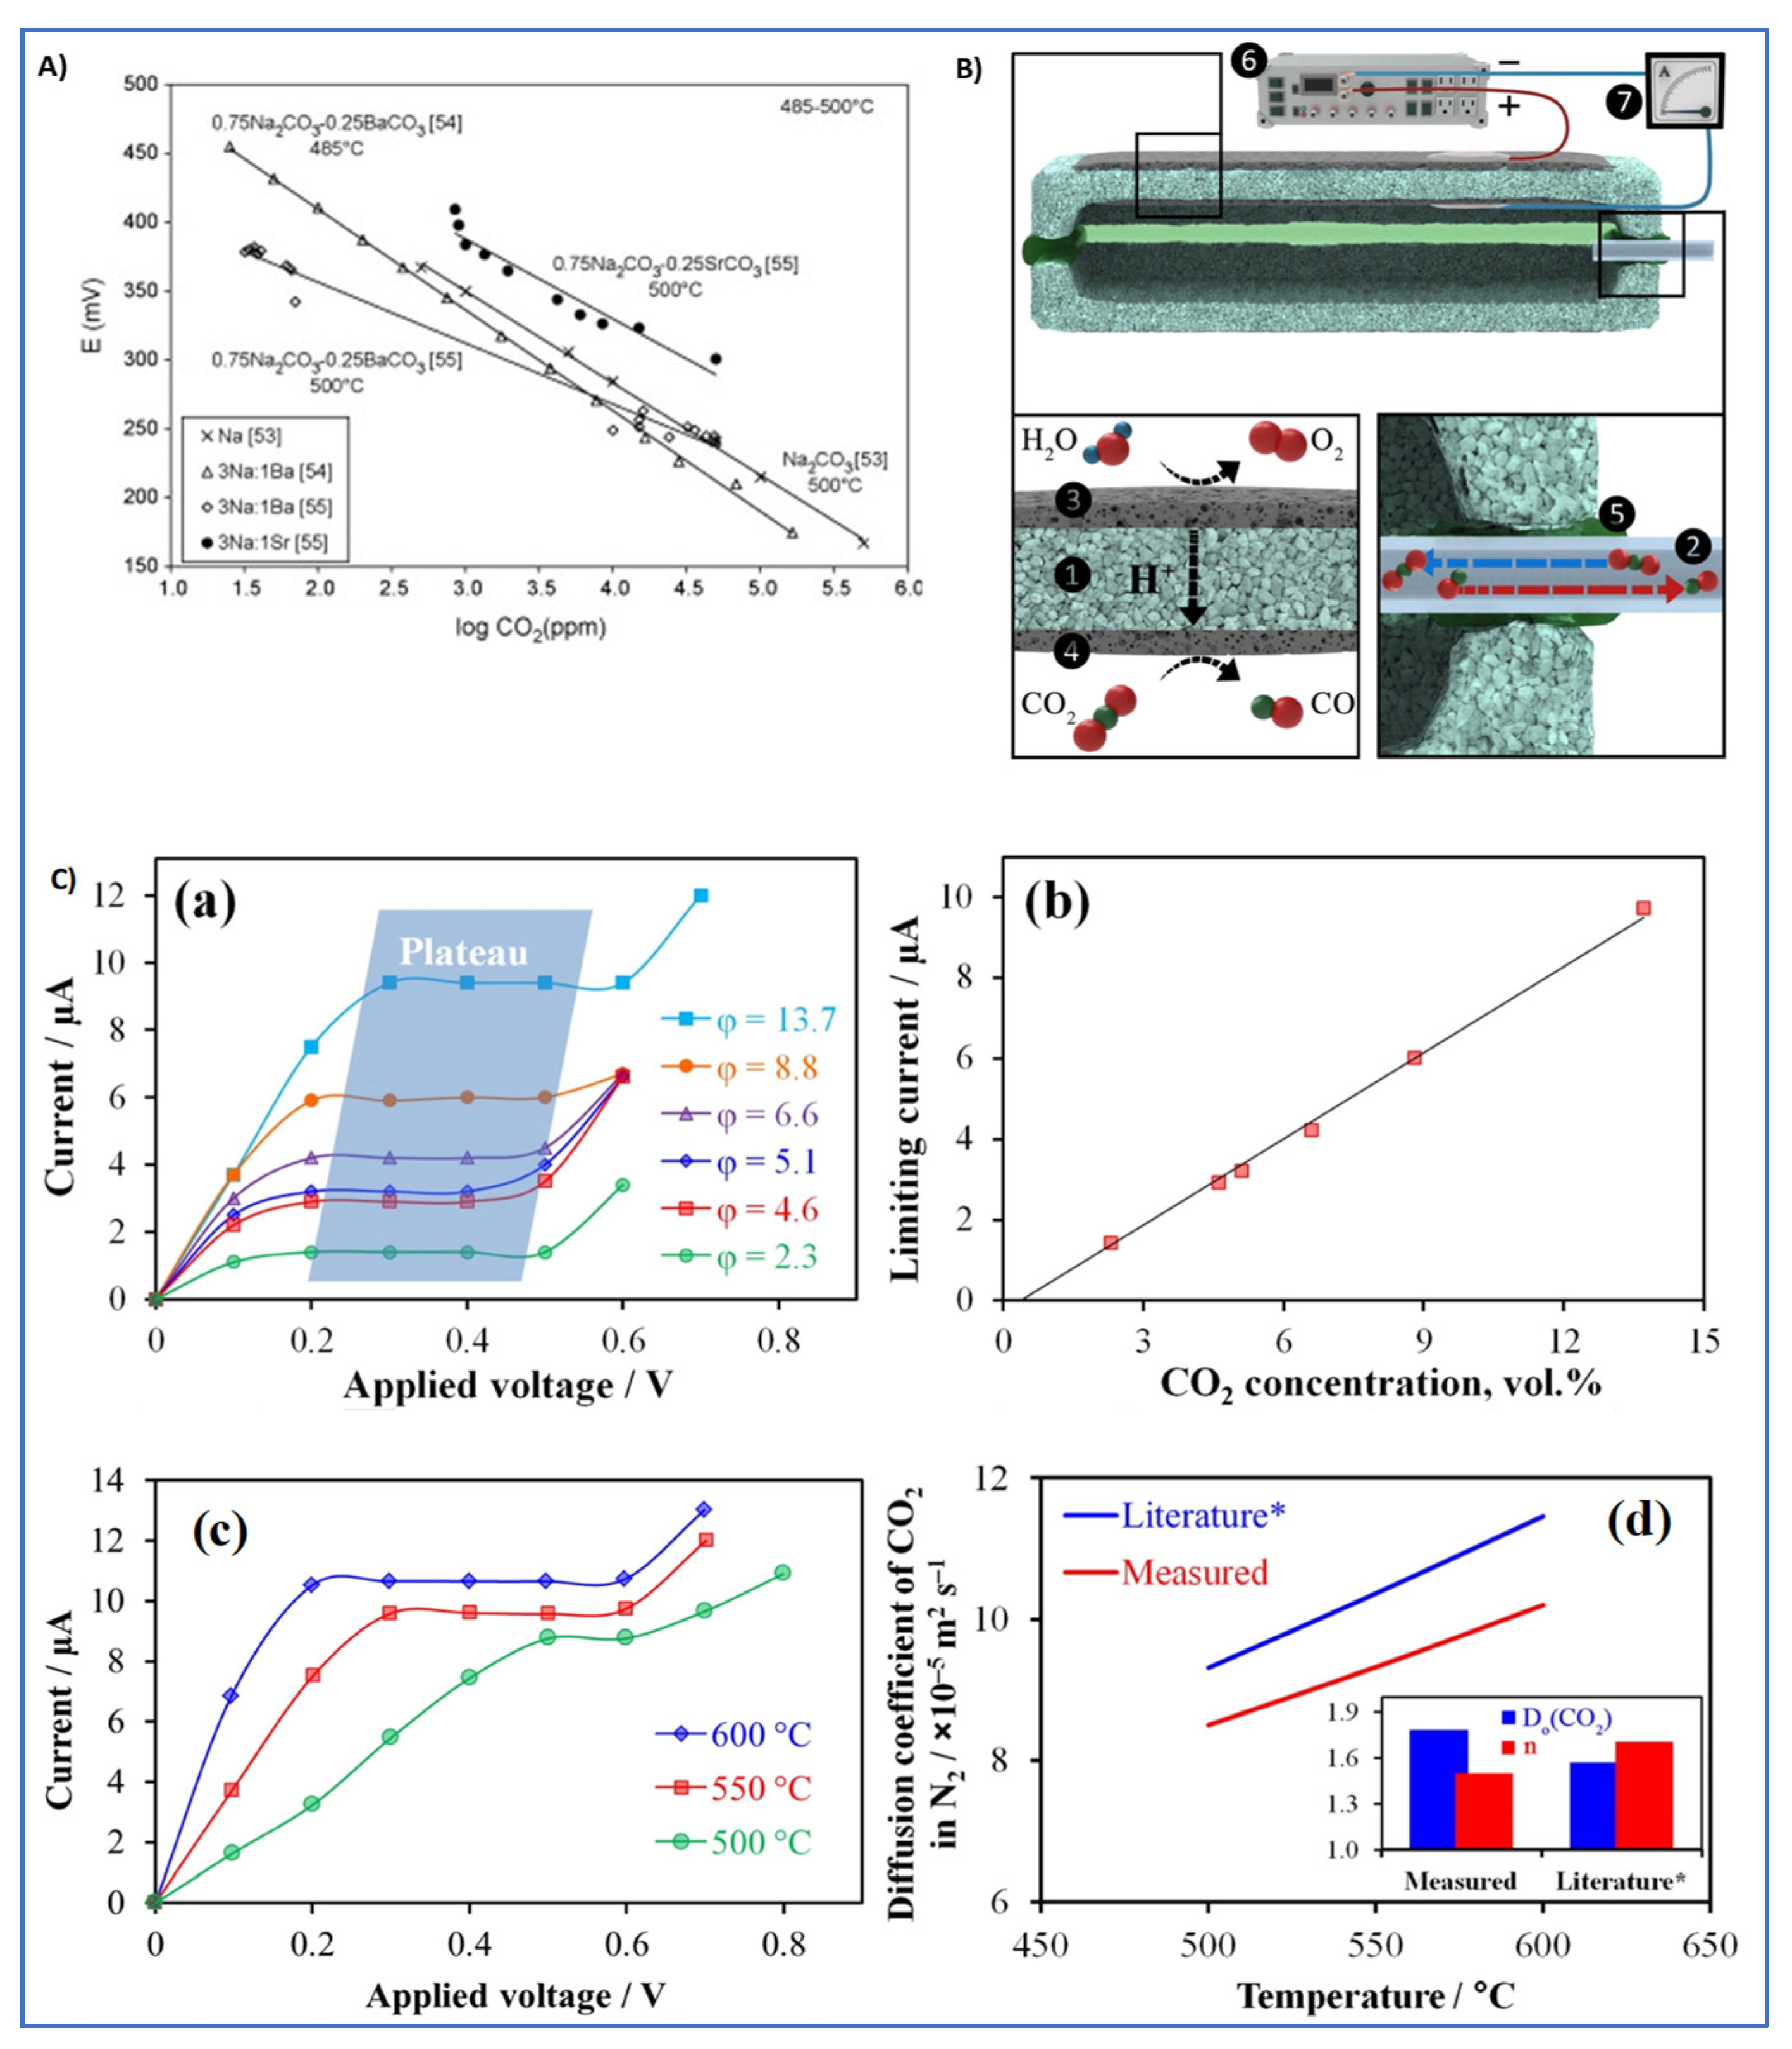
4.1.3. Carbon Dioxide (CO2) Sensors

Na-β-alumina, NASICON-type (Li1+xAlxTi2−x(PO4)3), and sodium aluminosilicate glass with Na2CO3 as an auxiliary electrode have been reported. Mixed carbonates have been used with Na2CO3 to form a more effective auxiliary electrode. The results from the sensors with Na2CO3, Na2CO3-BaCO3, and Na2CO3-SrCO3 auxiliary electrodes are reported in the literature [53] and displayed in Figure 4A.
Recently, an amperometric solid-state electrochemical sensor based on a proton-conducting electrolyte was fabricated by Kalyakin et al. [54] for the detection of CO2 at elevated temperatures and in N2 + 2%H2O + CO2 gas mixtures. This sensor consists of two La0.9Sr0.1YO3-δ electrolyte plates, sealed together using a high-temperature glass sealant to form a chamber between them. Pt electrodes were deposited at each side of one of the plates. An N2 + CO2 + 2%H2O gas mixture is fed to the sensor heated to the desired temperature. As shown in Figure 4B, A DC voltage is applied to the Pt electrodes in order to force a water decomposition reaction at the external electrode. Due to the reaction, protons are generated and moved through the proton-conducting material to the internal electrode, where CO2 reduction occurs. The two reactions are as follows.
H 2 O 1 2 O 2 + 2 H + + 2 e
2 H + + CO 2 H 2 O + CO 2 e
As a result, the concentration of CO2 inside the chamber decreases. Reaction (23) can technically keep proceeding as long as there is steam in the atmosphere, but reaction (24) is limited by the CO2 concentration in the sensor. As the CO2 is reduced, more CO2 flows inside the sensor through the capillary. However, at a certain applied voltage, the concentration of CO2 tends to zero. Under this condition, a limiting current is observed, which is calculated through Equation (7), where gas = CO2 and z = 2.
I lim = 2     F     D CO 2   P     A R     T     L X CO 2
The diffusion coefficient of CO2 can be calculated from Equation (25) and can be evaluated with the theoretically calculated one with the aid of Equation (26). For Equation (26), it is required to know only the temperature and pressure of operation and the standard value D0,CO2.
D CO 2 = D 0 , CO 2 P 0 P ( T T 0 ) n
The characteristic I-V curves of the sensor are presented in Figure 4C(a,c). More precisely, Figure 4C(a) displays the I-V curves for different CO2 concentrations, ranging from 2.3 to 13.7% at 550 °C. As observed, the current increases as the applied voltage increases until a plateau region is formed. This means that, after a certain voltage, the current response remains constant. However, by applying a much higher voltage, the current starts to rise again. This is due to the electrolytic decomposition and the appearance of electronic conductivity in the electrolyte. In all curves, a plateau region is formed. The plateau is formed between 0.2 and 0.4 V and the current ranges from 1 to 10 mA, depending on the CO2 content in the initial mixture. As CO2 concentration increases, a plateau is formed at higher applied voltages, it narrows, and the limiting current value increases. As presented in Figure 4C(b), the limiting current dependence on the CO2 content is linear. This dependence can be utilized as a calibration curve that helps to identify CO2 concentration in real gas mixtures.
Figure 4C(c) depicts I-V dependence curves at different operating temperatures. These curves were obtained for the mixture of N2 + 2% H2O + 13.7% CO2 at 500, 550, and 600 °C. As observed, with a temperature increase, the observed current increases, and the plateau region is obtained at lower applied voltages. Moreover, the width of the plateau is larger at 600 °C. Considering that the limiting current region corresponds to stationary conditions, it is highly beneficial to operate at higher temperatures to enhance diffusion (see Equation (26)). From this experiment, it is possible to measure the CO2 diffusion coefficient at any CO2 concentration and temperature. The effect of temperature on the CO2 diffusion coefficient in the mixture of N2 + H2O + 13.7% CO2 is displayed in Figure 4C(d). As observed, the experimental results are in good agreement with the results reported in the literature, suggesting the suitability and reliability of this electrochemical method for measuring the diffusion coefficient at any given CO2 concentration. Generally, DCO2 slightly increases with CCO2 increase [54].

4.2. Detection of Nitrogen Oxides (NOx) and Ammonia (NH3) Gas

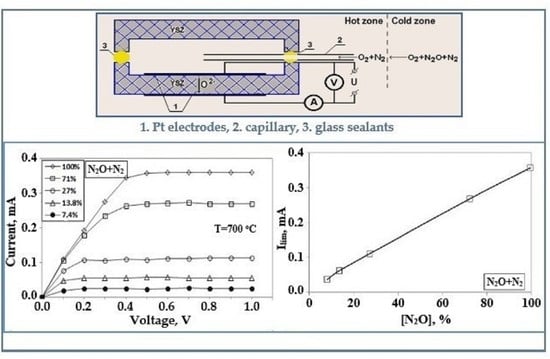
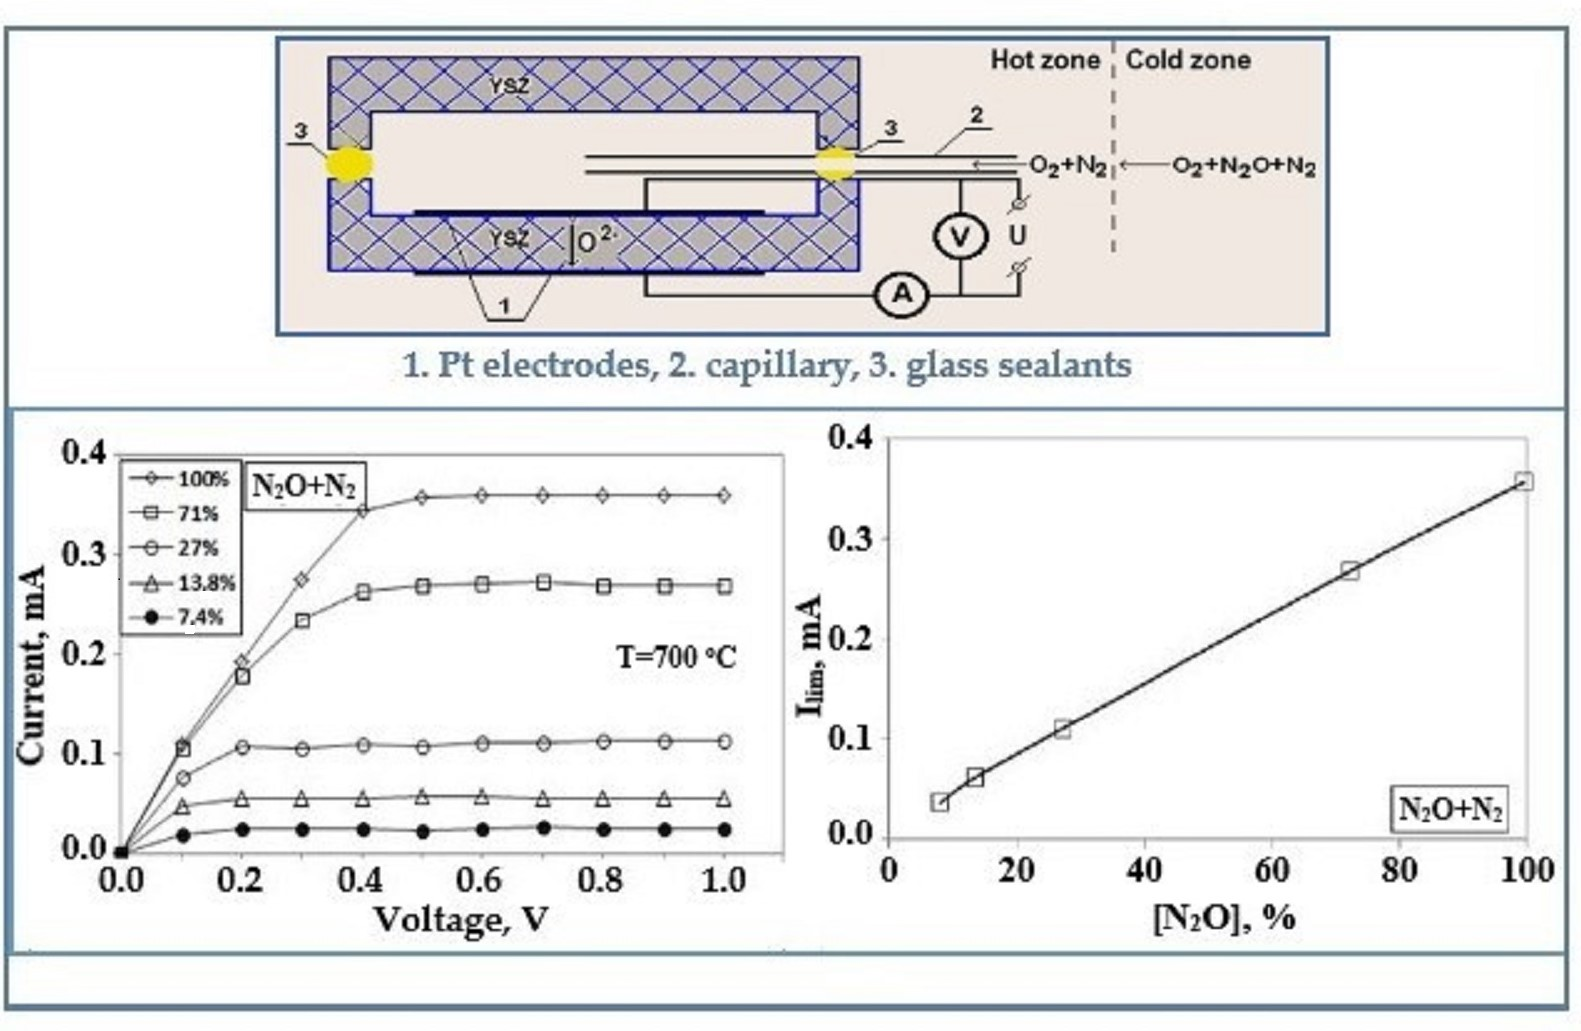
4.2.1. Nitrogen Oxides Sensors

In the 1950s and later, A.J. Haagen-Smit et al. [55,56] discovered that a certain type of smog is generated in the atmosphere by reactions involving nitrogen oxides and reactive hydrocarbons. Currently, this is known as photochemical smog and is generated when the ultraviolet part of the sunlight interacts with the existing nitrogen oxides in the atmosphere. Following this, most of the initial efforts to address this problem were oriented toward reducing HCs emissions, as it was an easier problem at the time to solve. However, over the years, research has also focused on reducing nitrogen oxide emissions. Over the last two decades, a better understanding of nitrogen oxides has resulted in the development of efficient NOx control technologies. Furthermore, due to the photochemical smog and acid rain in many urban areas, the necessity of NOx emission control devices is obvious. The nitrogen oxides are N2O, NO, NO2, N2O4, N2O3, NO3, and N2O5. Among them, NO and NO2 are the most important pollutants because they are emitted in larger quantities. In combustion exhaust emissions, NO is the main pollutant (7–80% of total NOx). Apart from environmental issues, NOx also damages the human respiratory and the nervous system. Consequently, it is necessary to develop sensors to detect NOx emissions in harsh environments and at high temperatures. Many devices use NOx sensors, aiming to reduce or eliminate NOx emissions from combustion processes. In order to be considered suitable and used in commercial combustion applications, NOx sensors must fulfill some requirements, such as the following: i) the ability to operate at elevated temperatures (600–900 °C) for a long period of time, and ii) the stable and accurate response in absence of oxygen or environments with high moisture concentration [7,57].

Amperometric NOx Sensors

Among the NOx sensors, the most commonly used type is the amperometric one. Most of them consist of two chambers. The first usually operates as an oxygen pump, extracting oxygen by exhaust emissions, while in the second chamber, the decomposition of NO to N2 and O2 takes place, and the total concentration of O2 is measured. A NOx sensor was fabricated by Kalyakin et al. [58] for detecting nitrous oxide (N2O), operating as an oxygen amperometric sensor. The sensor configuration is presented in Figure 5A. As observed, it consists of two sealed solid electrolyte plates, creating an inner chamber inside them. Both plates are made of YSZ, with Pt electrodes placed on the opposite sides of one of the plates.
When the positive potential is applied to the external electrode, oxygen in the form of oxygen ions is electrochemically pumped out of the chamber to the ambient gas, resulting in a decrease in oxygen concentration inside the chamber. Due to the created concentration difference, oxygen from the surrounding gas diffuses into the cavity through the capillary. Furthermore, the decomposition of N2O occurs inside the cavity, forming N2 and O2. When oxygen concentration inside the chamber is close to zero, a limiting current is observed. The ratio between the oxygen mole fraction in the analyzed gas for a wide range of oxygen concentrations and the limiting current is related between them with Equation (6), where gas = O2.
I lim = 4     F     D O 2     P     A R     T     L ln ( 1 X O 2 )
Knowing the kind of the initial gas mixture, the concentration of oxygen can be calculated from Equation (28):
X O 2 * = 1 0.5 X N 2 O 1 + 0.5 X N 2 O
for a mixture of nitrous oxide + oxygen:
X O 2 * = 0.5 X N 2 O 1 + 0.5 X N 2 O
for a mixture of nitrous oxide + nitrogen:
X O 2 * = 0.5 X N 2 O +   X O 2 ( 1 X N 2 O ) 1 + 0.5 X N 2 O
and for a ternary mixture of nitrous oxide + nitrogen + oxygen.
In particular, for a mixture of nitrous oxide + air, the following equation describes the mixture.
X O 2 * = 0.5 X N 2 O + 0.209 ( 1 X N 2 O ) 1 + 0.5 X N 2 O
In operating environments, there are more oxygen-containing gases, such as steam (H2O) and carbon dioxide (CO2), that are stable at operating temperatures. The value of the applied voltage should not be high enough to trigger electrochemical decomposition of these gases (lower than 1 V at 700 °C) [58]. For the experimental part, the sensor was tested in different environments of N2O + N2, N2O + air, or N2O + O2. The I-V curves for all different mixtures at an operating temperature of 700 °C are presented in Figure 5B. It is observed in Figure 5B(a,b) that the limiting current for the N2O + N2 increases linearly with the N2O concentration, as N2O provides oxygen in the initial oxygen-free N2 hot mixture (Equation (27)). Figure 5B(c) displays the I-V curves for the mixture x%N2O + air, where x ranges from 4.7 to 100%. Here, the limiting current is observed at 0.4 V. As shown in Figure 5B(d), in this mixture, there is no significant increase in the value of the limiting current as the N2O concentration increases because, with these N2O concentrations, the amount of oxygen in the initial air hot mixture slightly increases. In Figure 5B(e), with respect to the x%N2O + O2 mixture, by increasing the initial amount of N2O, a reduction in the limiting current value is observed. This can be explained by the decrease in oxygen concentration in the initial hot mixture due to the substitution of oxygen by nitrous oxide. In conclusion, this sensor is capable of detecting N2O in various mixtures for a wide range of N2O concentrations.

Mixed Potential NOx Sensors

There are also reports employing potentiometric sensors for the detection of NOx in high-temperature emissions. Equilibrium potentiometric sensors present several problems during the detection of NOx emissions in the operating environment. The fundamental problem is that there are no electrode or electrolyte materials yet that present the desired characteristics at these working conditions. Consequently, non-equilibrium potentiometric or mixed sensors are employed to overcome these problems. These sensors use electrode materials with different catalytic activities. NOx sensors require an electrode that exhibits considerable good thermal stability for high-temperature operation. Mixed potential sensors have been intensively investigated, and many metal oxides have been tested. In earlier years, CdMn2O4 [59], NiCr2O4 [60] ZnO [61], and WO3 [62] were tested for NOx detection up to 600–700 °C. Among the tested metal oxides, Ni-family oxides showed the most promising results for operation at temperatures above 800 °C. Mixed NOx sensors based on Ni oxides as electrode materials showed great sensitivity in wet or dry environments and at the highest sensing temperatures. Furthermore, NiO electrode characteristics can be further improved by the addition of a noble metal. Noble metals such as Pt, Ir, Pd, Ru, and Rh have been tested; among them, Rh provides a significant improvement in electrode characteristics [7,63].

4.2.2. Ammonia (NH3) Sensors

Most of the ammonia gas in the atmosphere is produced by human activities. Currently, 20% of ammonia (NH3) is produced for application in cleaning products, pharmaceuticals, refrigeration, and explosives, while the other 80% is for nitrogen-based fertilizers. Today, in the atmosphere, ammonia is at a low ppb level (1–5 ppb). However, ammonia is a toxic and corrosive gas; thus, even in low concentrations, it causes several life-threatening problems to humans, affecting the skin, eyes, and lungs. As the use of ammonia grows and the industry fields employing ammonia expand, so does the need for reliable and effective ammonia sensors.
As a rule, in order for a gas sensor to be suitable for the detection of ammonia over a long period, it must exhibit some major aspects. Among the sensing technologies, electrochemical gas sensors seem to be more suitable for quantifying and detecting NH3 or other hazardous gases. EGSs exhibit great sensitivity in real time for individual gas, even in ppm or ppb levels.

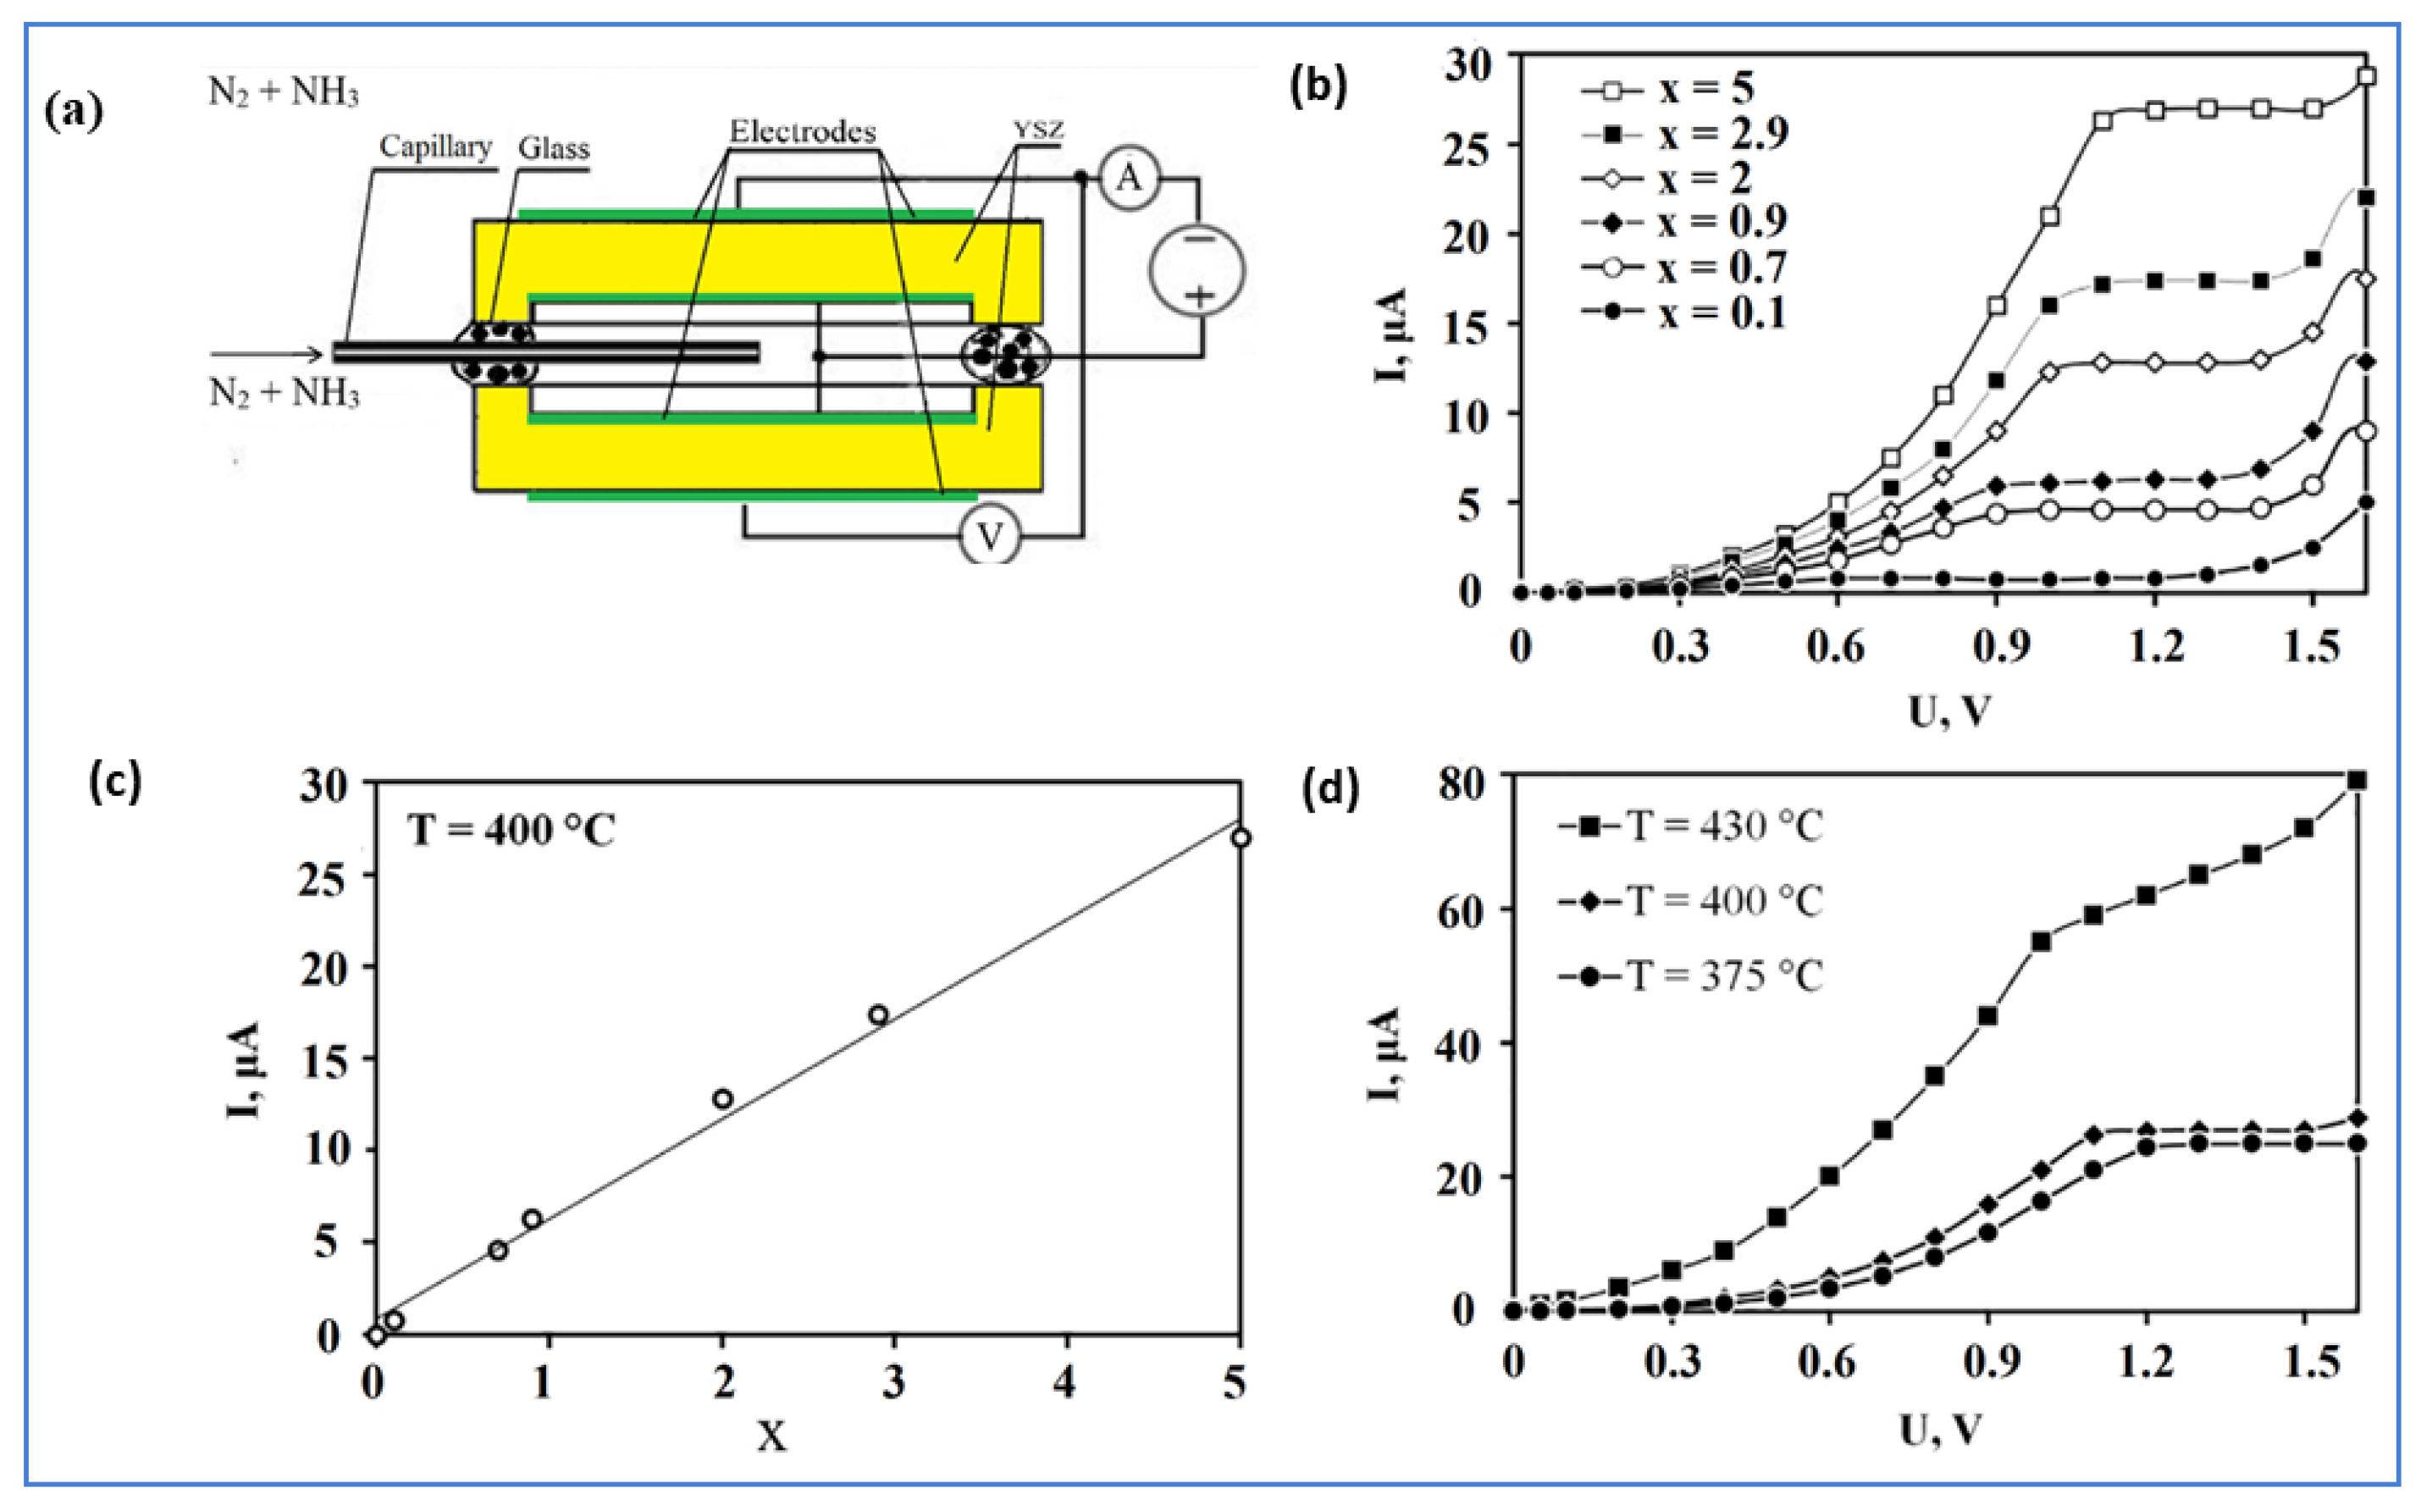
Amperometric NH3 Sensors

Most of the technological processes in metallurgical, chemical, and energetic fields need to detect ammonia content in harsh environments and at high temperatures. Consequently, solid-state electrochemical sensors are the most suitable type for operating effectively under these conditions. These sensors normally operate under potentiometric or amperometric regimes.
An amperometric ammonia sensor was fabricated by Kalyakin et al. [64]. This sensor is based on two electrochemical cells forming an inner chamber and a capillary; the capillary connects the surrounding environment with the chamber. Each cell is based on YSZ electrolyte, and Pt electrodes are deposited at each side of the two cells. The cells are glued together with the aid of a glass sealant. The configuration of this sensor is depicted in Figure 6a.
During the experiment, the sensor was placed in the NH3 + N2 gas mixture. In this experiment, the content of impurities (steam) in the mixture does not exceed 0.1 vol.%. When the chamber fills with N2 + NH3 gas mixture, a DC voltage is applied to the electrodes. Due to the applied voltage, the decomposition of H2O occurs at the outer electrodes according to reaction (9).
Oxygen anions generated by reaction (3) move through the solid electrolyte to the internal electrodes. At the internal electrode, the oxidation of ammonia takes place. The catalytic oxidation of ammonia occurs through three different reactions, generating N2 (molecular nitrogen), NO (nitrogen oxide), and N2O (nitrous oxide).
NH 3 + 1.5 O 2 0.5 N 2 + 1.5 H 2 O + 3 e
NH 3 + 2 O 2 0.5 N 2 O + 1.5 H 2 O + 4 e
NH 3 + 2.5 O 2 NO + 1.5 H 2 O + 5 e
The limiting current is calculated by using Equation (7), where gas = NH3.
I lim = z     F     D NH 3     P     A R     T     L X NH 3
As will be observed later that z is determined from experimental results.
In this experiment, the sensor was tested in different ammonia concentrations starting from 0.1 to 5 vol.% at temperatures between 375 and 430 °C. For these concentrations, the limiting current is obtained for temperatures up to 400 °C, and it is linearly proportional to the ammonia concentration. Thus, a calibration curve (limiting current vs. NH3 concentration) is obtained for the determination of ammonia in N2 + NH3 gas mixtures.
Figure 6b shows the sensor’s current response for a wide range of N2 + NH3 mixtures plotted against the applied voltage. In these curves, three different regions are distinguished. In the first region, when the DC voltage is applied, the current increases as the voltage increases. In the second region, the concentration of ammonia inside the chamber is close to zero, and the limiting current appears. The limiting current is depicted at the curves as a plateau region. In the third region, the current starts growing again with the applied voltage due to the appearance of oxygen inside the chamber according to the inverse reaction (3); this current is attributed to the exceedance of the sensor operating EMF and is not governed by diffusion. As expected, the limiting current value increases as the content of ammonia in the N2 + NH3 mixture increases. As already discussed, one of the main advantages of amperometric sensors is the linear relation between the limiting current and the target gas concentration under isothermal conditions. This function should be close to the linear one, according to Equation (35); as observed from Figure 6c, this condition is satisfied for the tested sensor. Thus, it is suitable for the detection of ammonia.
Another important observation from Figure 6d is the effect of temperature on the sensor’s operation. It is observed that, at temperatures between 375 and 400 °C, there is a clear plateau region formed at about 1.1 V, while at 430 °C it has no limiting current region. At this temperature, the catalytic decomposition of NH3 takes place at the chromo-nickel steel capillary according to reaction (36).
NH 3 0.5 N 2 + 1.5 H 2
Through reaction (36), H2 is generated at the capillary, and it diffuses inside the sensor. This hydrogen then reacts with oxygen ions that flow through the YSZ electrolyte, according to Equation (10). Therefore, the observed current is higher because hydrogen’s diffusion flow rate is higher. From this experiment, it is also possible to identify which reactions, among reactions (33)–(35), dominate inside the sensor and, thus, which are the main byproducts inside the chamber. This is accomplished by comparing the measured diffusion coefficient values in the gas mixture with the ones that appeared in the literature. The experimental values were calculated with the aid of Equation (13), where X k = X NH 3 . Using Equation (13) and changing z k for every reaction (32)–(34) without changing the other parameters, the diffusion coefficients can be calculated. The results are presented in Table 1. On the other hand, the theoretical diffusion coefficient Dth is calculated from the following Equation [65].
D th = 0.01858     T 1.5 P     σ 2     Ω DT 1 M N 2 + 1 M NH 3
In Equation (37), ΩDT is the collision integral for diffusion, σ is the characteristic distance for nitrogen/ammonia mixture, P and T are the absolute pressure and temperature, respectively, and M is the molecular mass. In Table 1 the results for the experimental and theoretical values for the diffusion coefficient are reported.
The diffusion coefficient for reaction (35) is the closest to the theoretical one, concluding that the main byproduct from the electrochemical oxidation of ammonia is N2 and not N2O or NO [64]; this means that z = 3 in Equation (35).

4.3. Detection of Oxygen (O2) and Humidity (H2O Vapor)

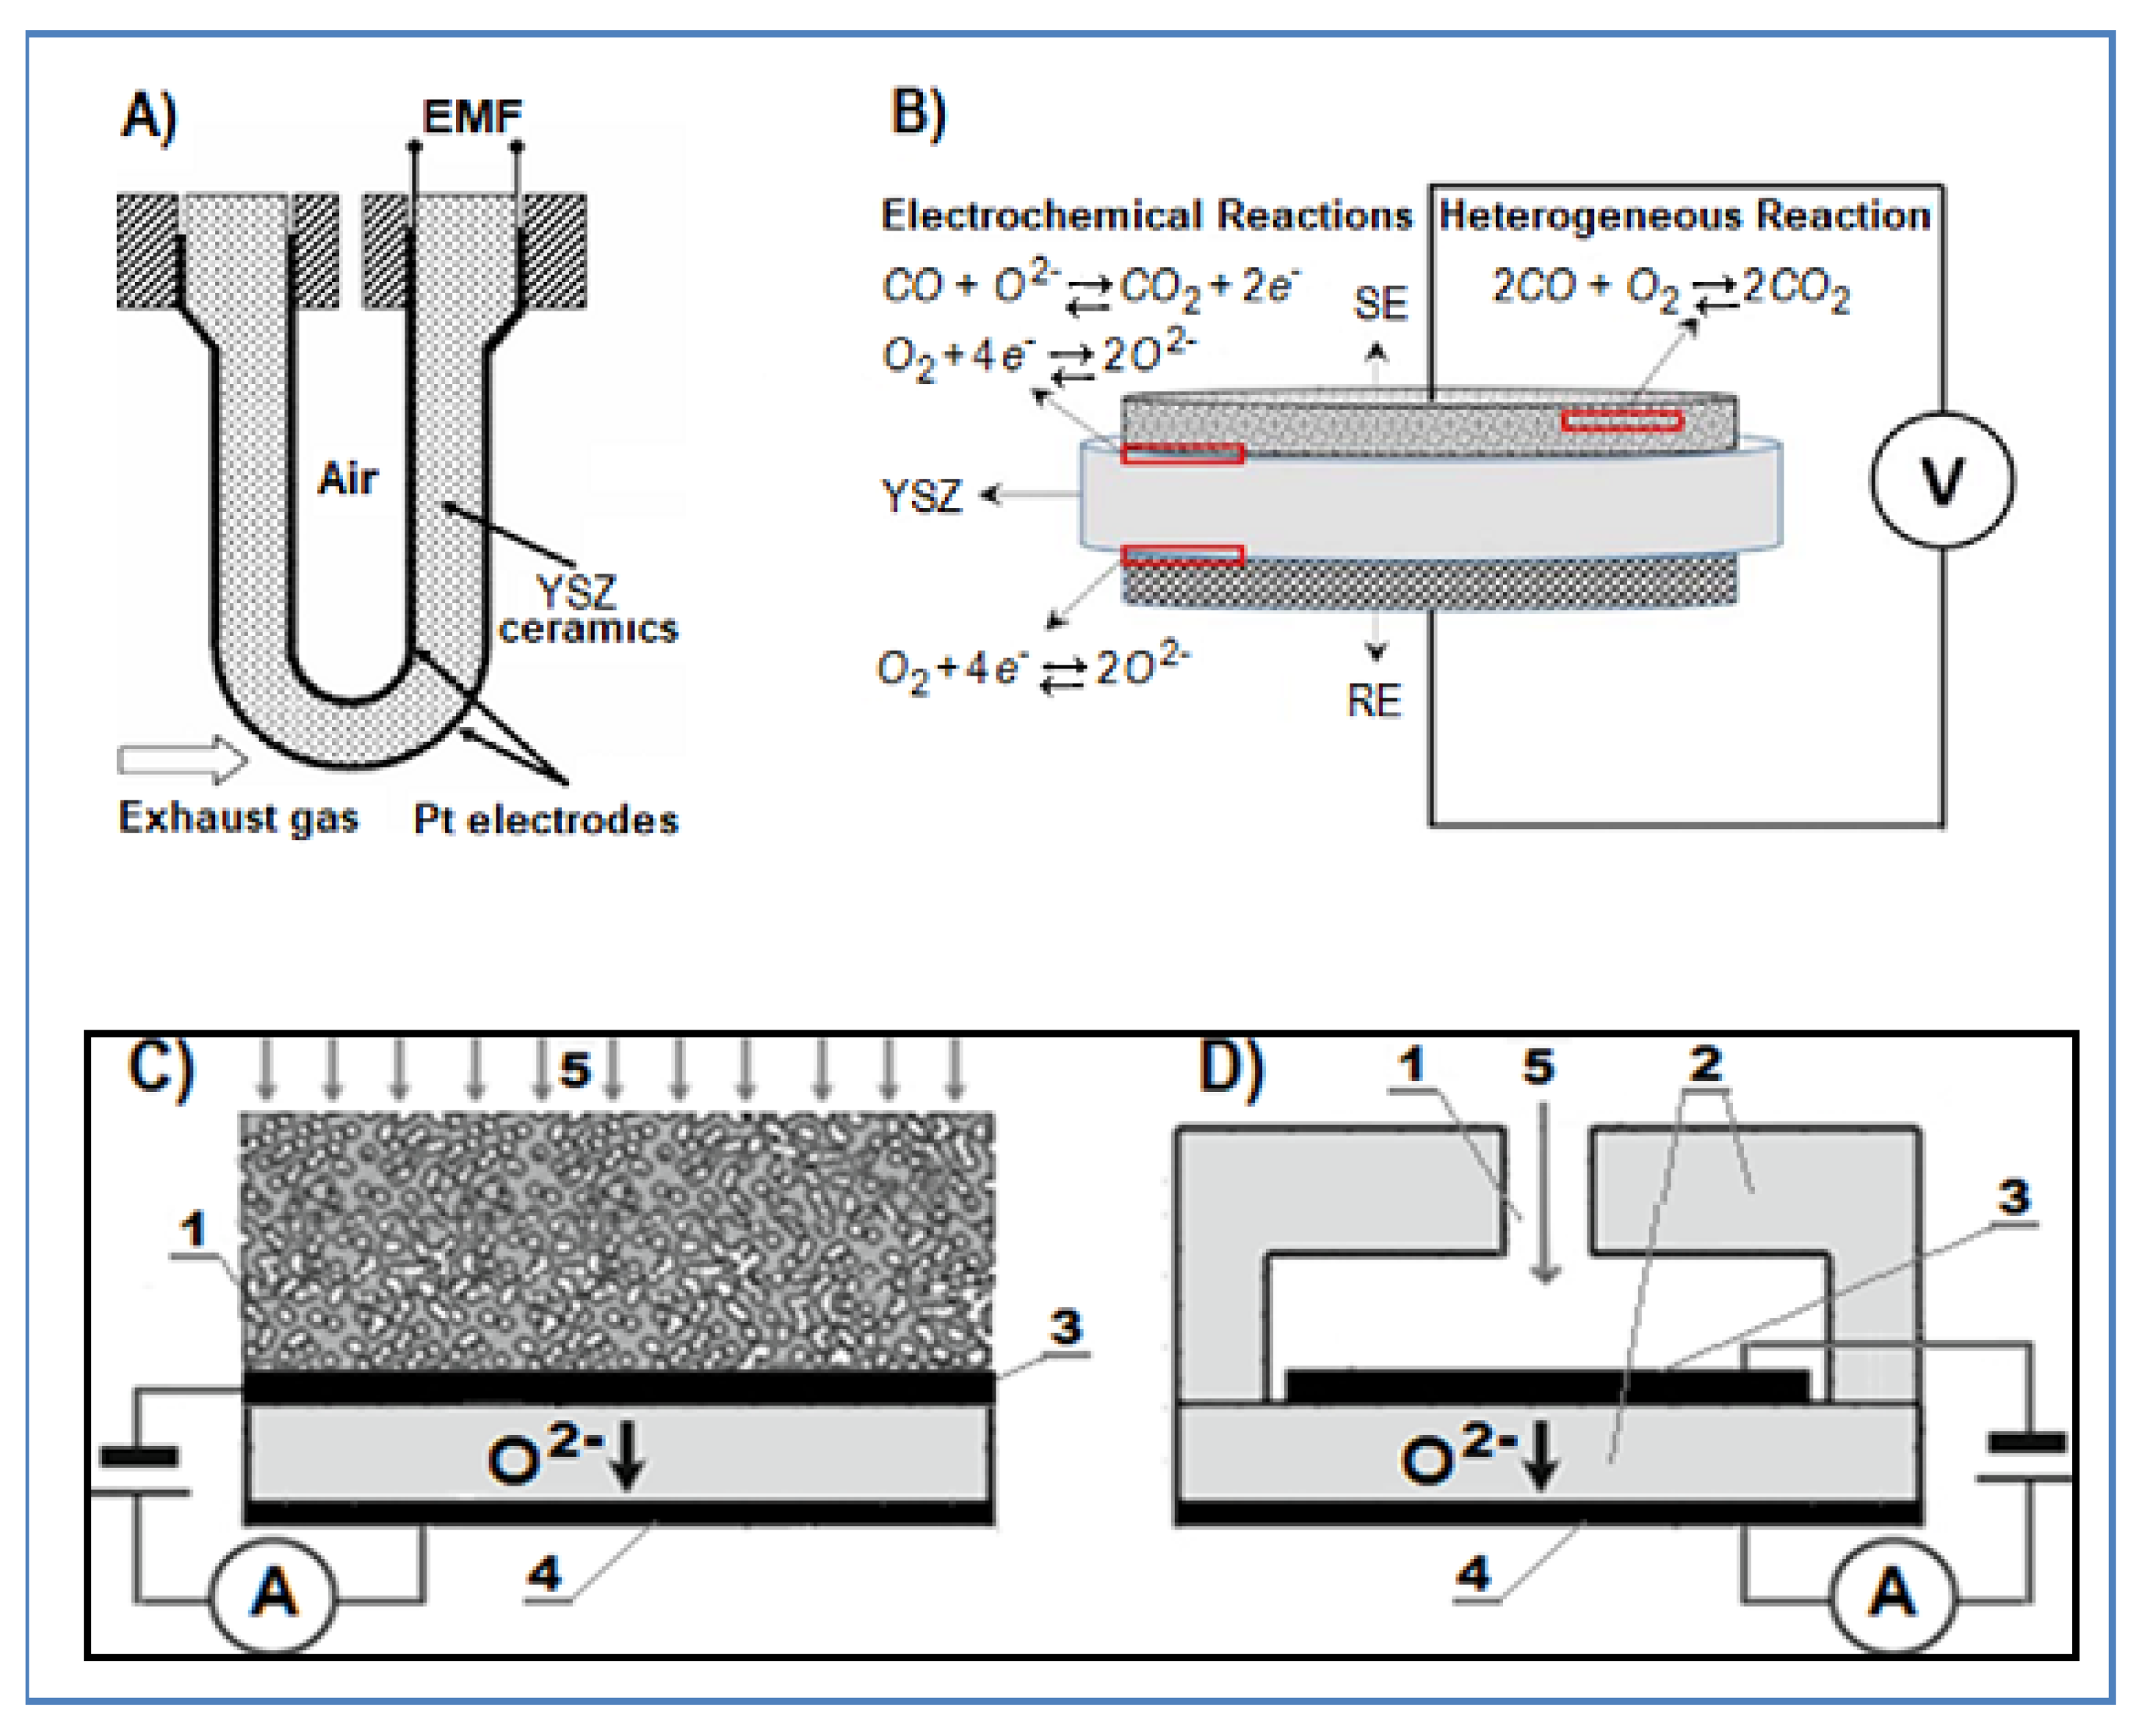
4.3.1. Oxygen Sensors

Today, there are several concerns about health and environmental pollution issues from gases released during hydrocarbons combustion. The most promising technology to address these issues is the one related with gas sensing devices. In particular, emission control and optimization of internal combustion engines used in automobiles and industry have been achieved with the help of solid electrolyte-based oxygen sensors. They are mainly used for the control of the air–fuel ratio in combustion engines and are an integral part of onboard diagnostics of the exhaust emission control system.

Potentiometric Oxygen Sensors

Equilibrium potentiometric oxygen sensors are well-known devices usually employed for the control of exhaust emissions. These sensors are one of the most successful applications of solid electrolytes. It is a simple design with a ceramic electrolyte, usually yttria-stabilized zirconia, because it is structurally and chemically stable for temperatures up to 1500 °C, between two Pt electrodes and air as the reference gas. As already discussed in previous chapters, the operation of these sensors is based on the open-circuit conditions where no current is applied to the sensor. The oxygen concentration in the target atmosphere is measured according to Nernst Equation (2).
As noted above, potentiometric sensors need a reference electrode to operate. Conventional YSZ-based oxygen sensors use Pt/air as the reference electrode resulting in some architecture limitations. Considering that they use air as reference gas, these sensors must be in contact with the environment during their operation so that the oxygen concentration can only be measured near the combustion chamber. In conclusion, to achieve miniaturization and simpler configuration of the sensors and more precise measurements of the concentration by placing the sensor in any location inside the chamber, there is a need to change the reference electrode. An alternative that has been proposed is the metal/metal oxide as the reference electrode. Many different oxides have been investigated that can provide stable equilibrium oxygen partial pressure at a fixed temperature, such as Sn/SnO2, Pd/PdO, Ru/RuO2, In/In2O3, and Ni/NiO [66,67]. Most of the abovementioned metal/metal oxides operate at temperatures below 500 °C. The latter, however, Ni/NiO, is the most promising reference alternative for the environment of the combustion chamber [7].

Amperometric Oxygen Sensors

In potentiometric oxygen sensors, as observed Equation (2), the output signal depends logarithmically on the oxygen concentration. As a result, when the oxygen concentration is high enough, as in the lean combustion gas, potentiometric sensors cannot effectively measure oxygen concentration. Consequently, an amperometric sensor is preferable for detecting higher concentrations, as it provides close linear outputs that depends on oxygen concentration according to Equation (6). The principle of operation of amperometric sensors was discussed previously.
When the sensor is operating properly, the current response increases practically linearly with the oxygen low concentration (ppm to ppb), exhibiting great accuracy in measurements and high sensitivity. For high-temperature amperometric oxygen sensors, YSZ is the most effective solid electrolyte. However, Gd and Sm doped CeO2 have been proposed as a possible alternative. For example, Ce0.8Sm0.2O1.9 (CSO) has been reported to present higher ionic conductivity than YSZ at temperatures ranging between 500 and 700 °C [68]. In addition to the solid electrolyte, diffusion barriers play an important role in the proper operation of the sensor. Diffusion barriers are expected to perform good thermal stability in the working environment.

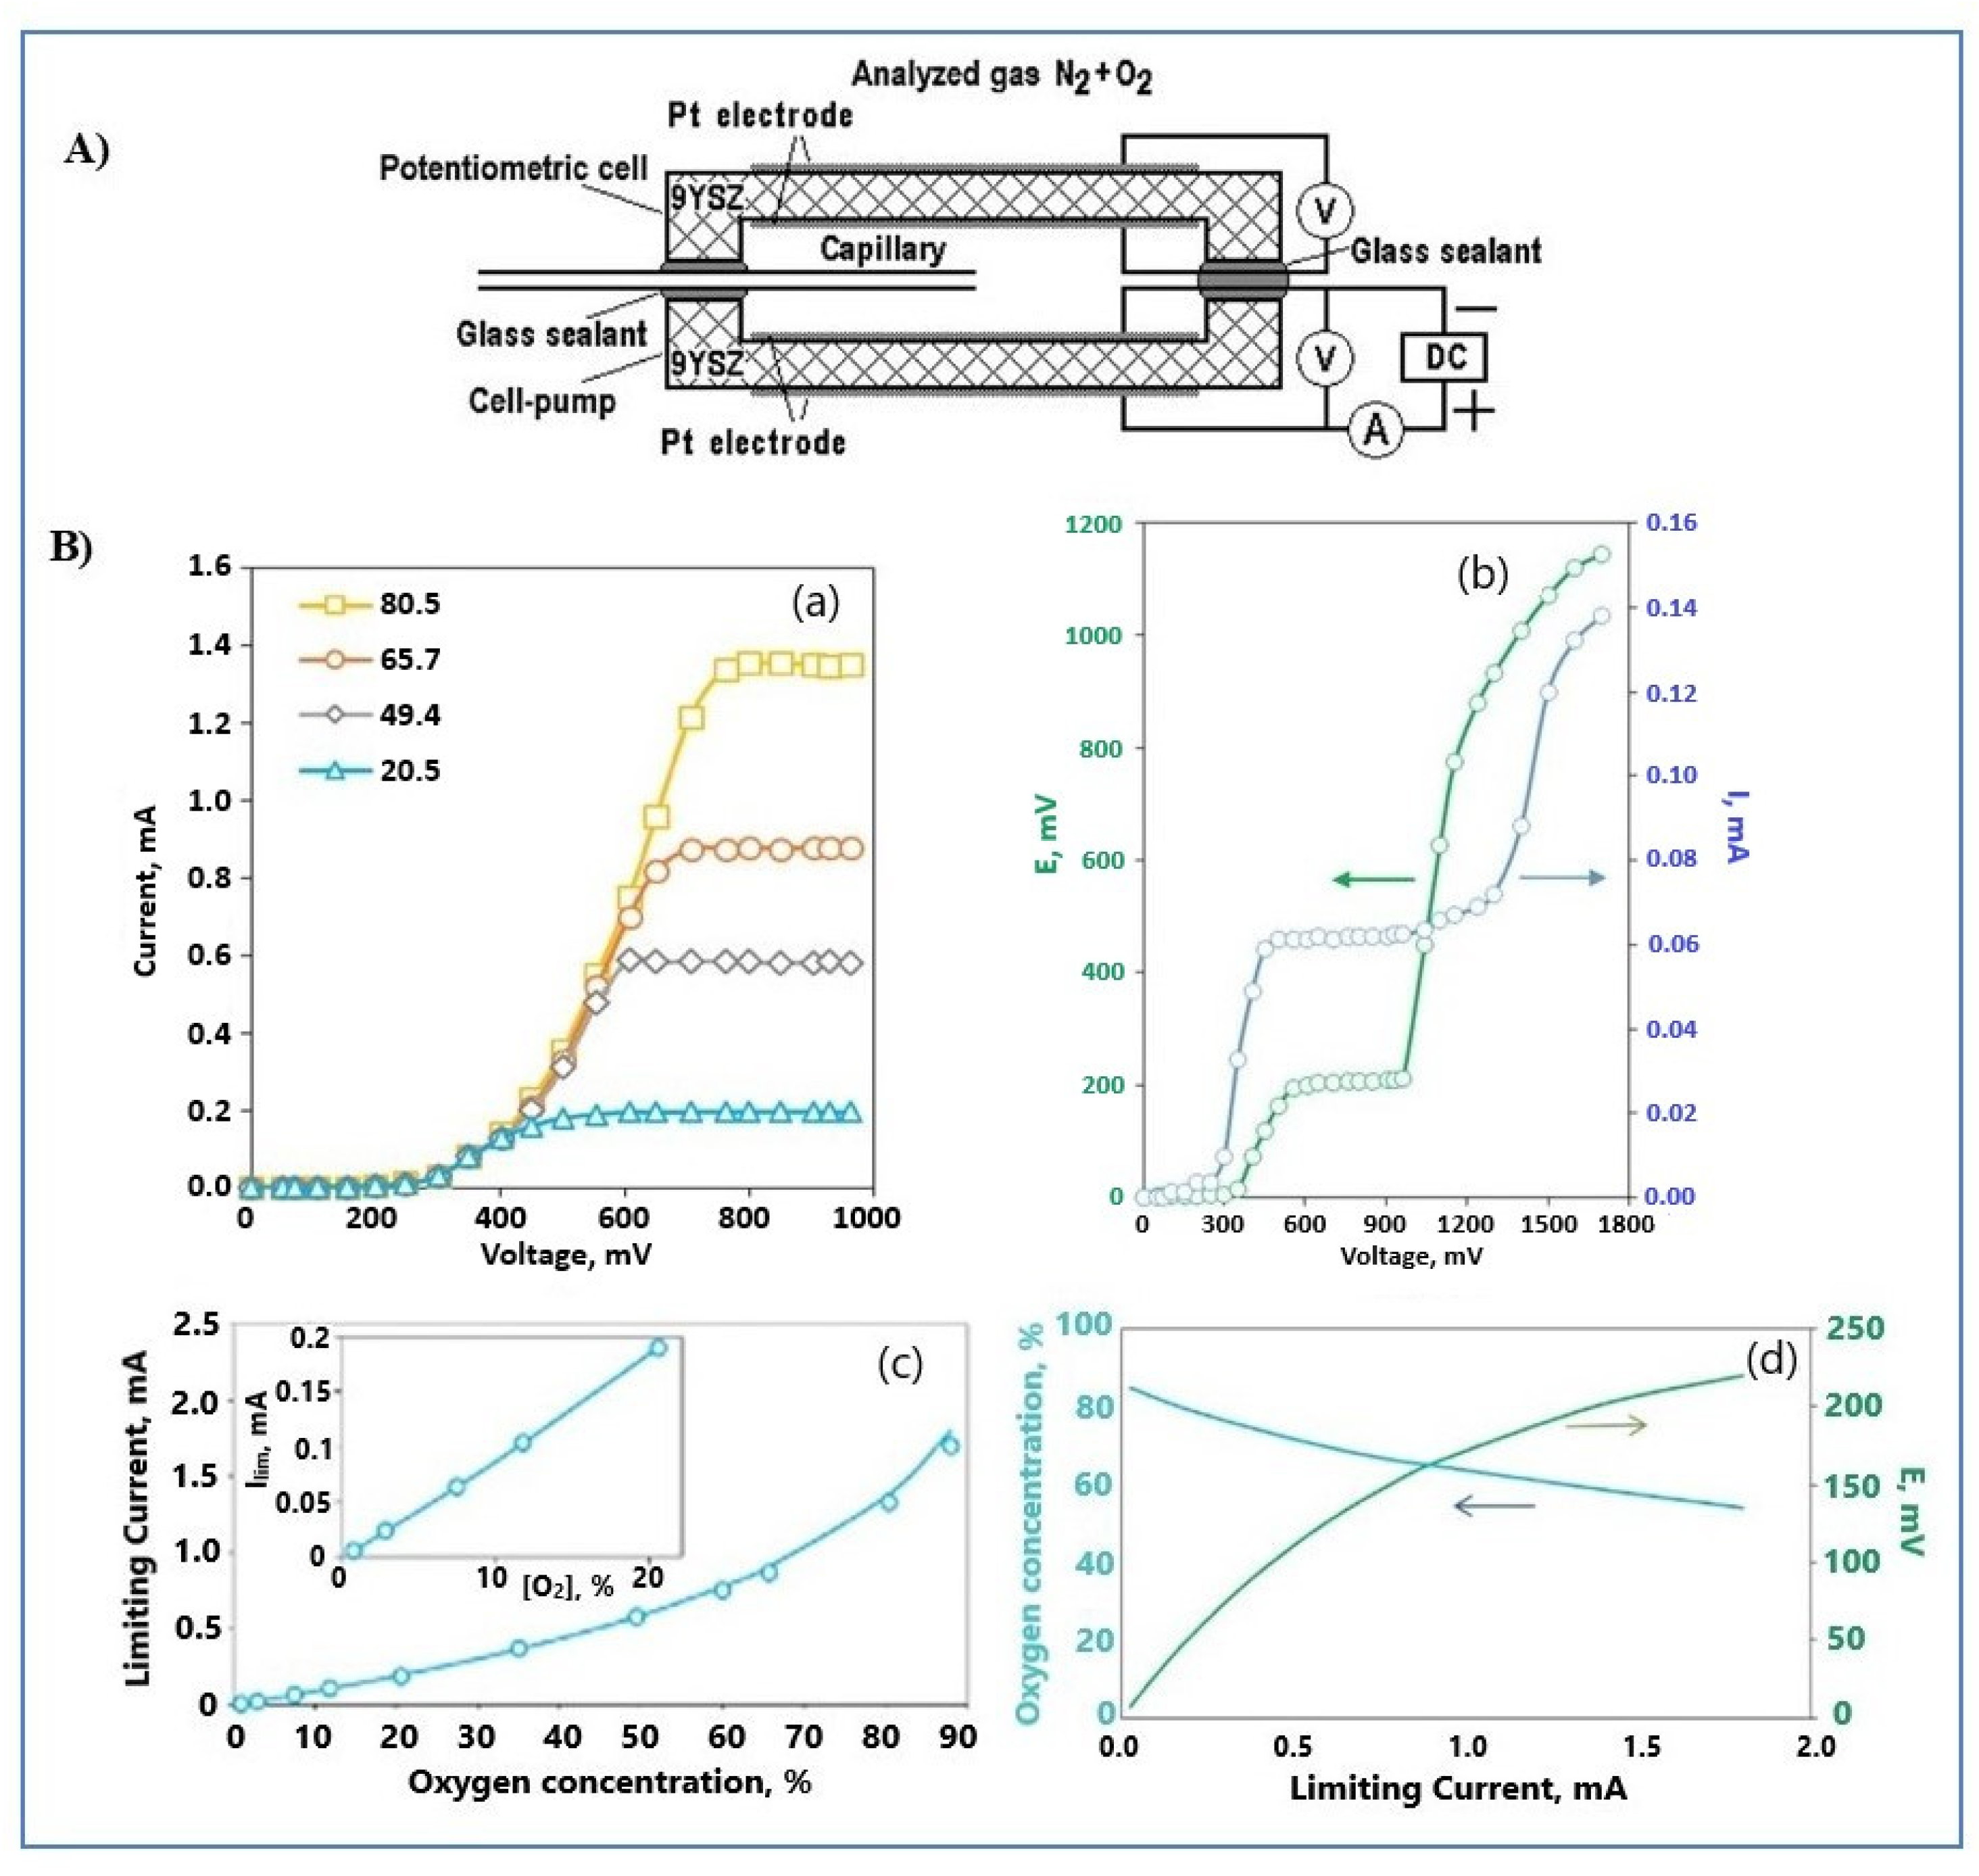
Combined Oxygen Sensors

A sensor capable of operating simultaneously under both amperometric and potentiometric regimes was fabricated and tested by Kalyakin et al. [69]. The sensor consists of two electrochemical cells based on a YSZ electrolyte. The exact composition of the solid electrolyte is 0.91ZrO2 + 0.09Y2O3. The two cells are fixed together with a heat-resistant glass so that an inner chamber is formed. The Pt porous electrodes are deposited at each side of both plates, and a metal capillary is used to connect the internal chamber with the surrounding environment. The scheme of the described sensor is presented in Figure 7A.
The principle of operation of these sensors has already been discussed. This sensor can work under a potentiometric and amperometric mode of operation. As far as the amperometric mode, a DC voltage is applied to the electrodes of one of the cells to force a reduction in oxygen in the internal electrode. In this manner, oxygen is electrochemically pumped out (oxygen anions) of the sensor to the ambient gas. With the help of the potentiometric cell, it is possible to control oxygen content inside the sensor.
For the experimental part, EMF-V and I-V dependences for different oxygen concentrations were measured simultaneously. In Figure 7B(b), the measurements of EMF and current plotted against the applied voltage are displayed. Note that the concentration of oxygen, for the EMF-V and I-V plots in Figure 7B(b), is 7.5%. It is observed that the limiting current region starts at about 400 mV of applied voltage (blue line). At this condition, the concentration of oxygen inside the sensor tends to zero. However, after about 800 mV the current gradually grows again due to the electrolytic decomposition of steam. Indeed, at about 1300 mV, a sharp growth is observed. The latter is a result of the appearance of electronic conductivity in the YSZ electrolyte. Furthermore, it is observed that the EMF-V plot (green line) also presents a plateau region. The plateau here testifies that for a wide range of applied voltages (600–1000 mV), the concentration of oxygen inside the sensor is constant. However, due to the decomposition of steam, there is a sharp rise in EMF as well. In this region, the observed EMF is defined by the ratio of hydrogen to humidity in the N2 + H2O + H2 mixture.
The current–voltage (I-V) curves of the amperometric cell at 500 °C for different oxygen concentrations, between 20.5% and 80.5%, are presented in Figure 7B(a). As observed from Figure 7B(a), the limiting current region is reached at an applied voltage ranging between 400 and 600 mV for low oxygen concentrations (20.5%), while, for higher oxygen concentrations (20.5–80.5%), it is reached at 600–800 mV. In conclusion, as the oxygen concentration inside the analyzed gas increases so does the applied voltage at which the limiting current is observed. Linear growth in limiting current’s value is observed as the content of oxygen increases up to 20%, whereas a non-linear growth is observed for oxygen concentrations higher than 20%, as shown in Figure 7B(c).
By simultaneously measuring EMF and the limiting current for different oxygen concentrations and then plotting the oxygen concentration and the EMF against the limiting current, Figure 7B(d) is obtained. Note that if, at a certain limiting current, the measured EMF value is different from that from the EMF-Ilim calibration curve, then the measured oxygen concentration is incorrect. However, considering the deviation from the correct value, two cases can be distinguished:
  • First, the EMF value is lower compared to that of the calibration curve. This condition testifies that more than the expected oxygen reaches the electrode, either due to cracks in the electrolyte or the sealant. As a result, the measured oxygen concentration is higher than that in the analyzed gas.
  • Second, the EMF value is higher compared to that of the calibration curve. This testifies that the characteristics of the metal capillary have changed. Corrosion or deposition of particles inside the capillary can change its inner diameter. As a result, the measured oxygen concentration is lower than that in the analyzed gas [69].
In summary, in the combined sensor, the potentiometric cell has the role of a control cell.

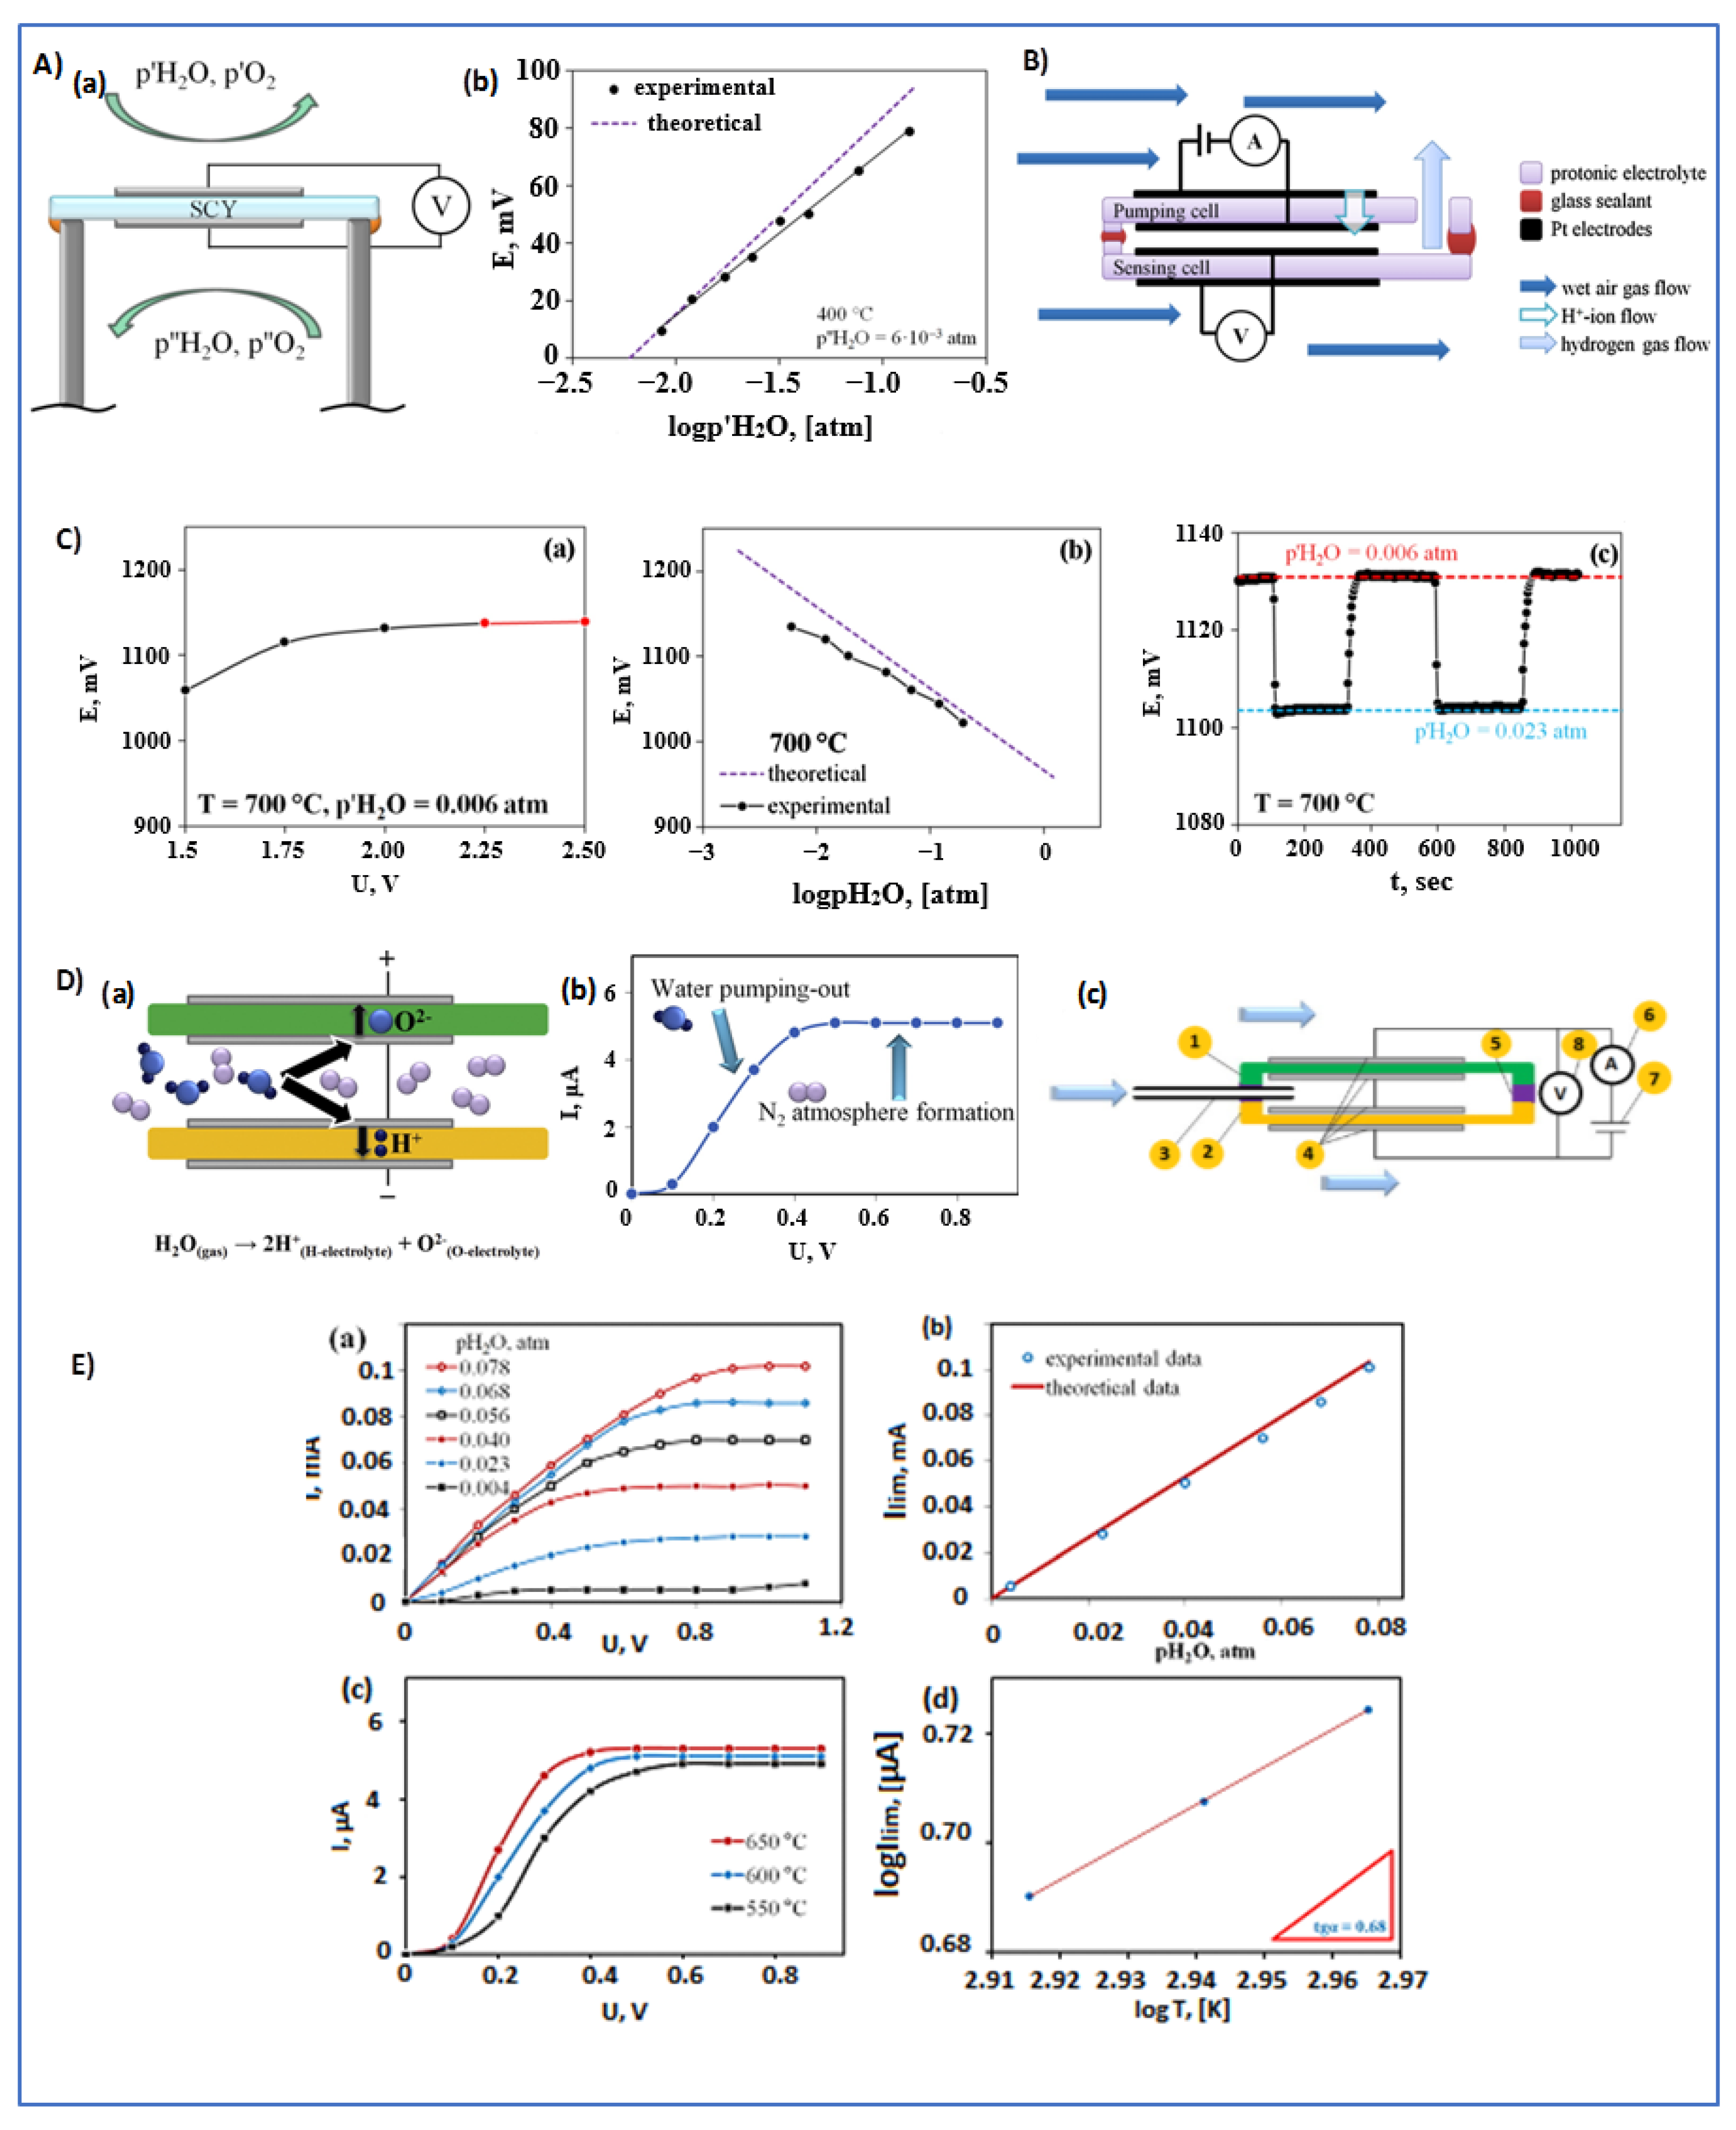
4.3.2. Humidity (H2O Steam) Sensors

The first humidity sensor was developed by Iwahara et al. based on a SrCe0.95Yb0.05O3-δ (SCY) electrolyte [70]. They designed a Pt|SCY|Pt type galvanic cell that operates as a potentiometric humidity sensor. Concerning the experimental part, this cell was tested in a wet air atmosphere at operating temperatures between 300 and 400 °C. At one side of the sensor, humidity’s partial pressure was swept from 0.008 to 0.135 atm, while on the opposite side, humidity’s partial pressure was kept constant. The dependence of the EMF was linear to the logarithm of humidity content at the sensing side. In Figure 8A(a), the configuration of the sensor is presented, and in Figure 8A(b), the measured EMF values plotted against the logarithmic value of humidity’s partial pressure are shown. As observed, there is a deviation (up to 10%) from the theoretical values obtained from Equation (37):
E = R     T 2     F ln ( p H 2 O p H 2 O ( p O 2 p O 2 ) 1 2 )
The main reason for this inaccuracy is the presence of electronic conductivity in the solid electrolyte. The electronic conductivity in the SCY electrolyte, under the operating conditions, constitutes about the 10% of the total conductivity. Equation (38) can be simplified to Equation (39).
E = R     T 2     F ln ( p H 2 O p H 2 O )
In order to obtain Equation (39) from (38), it is assumed that the partial pressure of oxygen at each side of the electrolyte is the same, p O 2 = p O 2 . However, for high H2O partial pressures, this equality is not satisfied, resulting in an error of the measured EMF.
Another humidity sensor was developed by Katahira et al. [71] based on two similar Pt|SCY|Pt type (pumping-sensing) cells glued together, with a high-temperature glass sealant, such that a chamber and a special channel are formed. The chambers inside the sensor and the outside of the sensor are connected through this special channel. The configuration of the sensor is schematically displayed in Figure 8B.
When the sensor is placed in the wet air atmosphere, a voltage is applied to the pumping cell such that hydrogen in the form of protons flows from the wet air inside the sensor. Hydrogen is generated by the decomposition of the water vapor at the external electrode. The decomposition of water occurs according to reaction (38). A reaction at the inner electrode is identical to reaction (15).
The produced hydrogen is pumped inside the sensor, displacing nitrogen and eventually forming a pure hydrogen atmosphere. Practically, this atmosphere inside the sensor can be utilized as a reference gas because the partial pressure of hydrogen inside is equal to p H 2 = 1 atm. Consequently, by measuring the voltage difference between the electrodes of the sensing cell, it is possible to calculate the hydrogen’s partial pressure of the surrounding gas from Equation (40).
E = R     T 2     F ln ( p H 2 p H 2 )
Taking into account that hydrogen in wet air is bonded, its partial pressure can be presented as follows:
p H 2 = p H 2 O K p O 2 1 2
where K is the equilibrium constant of reaction (42).
H 2 + 0.5 O 2 K H 2 O
Note that oxygen partial pressure in the atmosphere is 0.21 atm for low humidity values and 0.21 ( 1 p H 2 O ) atm for high humidity values.
The dependence of the potential difference (E) on the applied voltage and humidity content in the wet air atmosphere is presented in Figure 8C(a,b) [8]. The red line in Figure 8C(a) indicates that steady-state conditions have been established inside the chamber and p H 2 = 1 atm.
As observed in Figure 8C(b), the experimental values are close to the theoretical ones. Another important result presented in Figure 8C(c) is that the t90 parameter of the sensor is equal to 30 s at 700 °C. This parameter refers to the time that the sensor needs to reach 90% of the final value after a change in one of the system’s parameters. This makes the sensor suitable for operation when a fast response is needed.
Another amperometric humidity sensor was fabricated by Medvedev et al. [72]. This sensor combines a proton-conducting La0.9Sr0.1YO3−δ (LSY) electrolyte and an oxygen ion-conducting YSZ electrolyte. The two ceramic electrolytes are sealed together, with a high-temperature glass sealant, as shown in Figure 8D(c), and an empty chamber is formed between them. Pt electrodes are deposited at each side of both electrolytes and a capillary is employed that connects the inner chamber with the surrounding environment. It is important to note that, for this sensor, the inner electrodes are connected, forming a common electrical circuit. For the experimental part, the sensor is heated in an oven and is fed with a mixture of H2O + N2 to imitate the operating conditions. For the operation of the sensor, a DC voltage is applied to the sensor in such a manner that the minus sign corresponds to the external electrode of the LSY electrolyte and the plus sign at the external electrode of the YSZ electrolyte.
The decomposition of water occurs at the inner electrodes according to reactions (43)–(46) until a pure nitrogen atmosphere is formed in the inner chamber, as presented in Figure 8D(a,b). Reaction (43) occurs at the YSZ’s inner electrode:
H 2 O + 2 e O 2 + H 2
and reaction (44) occurs at the LSY’s inner electrode:
H 2 O 2 H + + 2 e + 1 2 O 2
as formed O2 can react at the YSZ’s inner electrode according to the following reaction:
1 2 O 2 + 2 e O 2
or as-generated H2 can react at the LSY’s inner electrode according to the following reaction.
H 2 2 H + + 2 e
Overall, reactions (43)–(46) result in a steam concentration decrease in the sensor chamber. As the water is pumped out of the sensor, the water’s diffusion flux through the capillary barrier increases. When the water’s concentration inside the chamber is negligible, the limiting current appears. The limiting current is calculated with Equation (7), where gas = H2O and z = 2.
I lim = 2     F     D H 2 O     P     A R     T     L X H 2 O
As far as the experimental part, Figure 8E(a) presents the I-V curves for different initial H2O partial pressures. As Equation (47) suggests, as the water’s partial pressure at the surrounding gas increases, the limiting current value increases as well. However, it is also observed that the current response depends on the applied voltage until a certain voltage value. This value differs depending on the water’s partial pressure. For example, the plateau region is observed at 0.9 V when the pH20 = 0.078 atm and at 0.4 V when pH20 = 0.004 atm. These curves refer to the 650 °C temperature of operation. Furthermore, from Equation (47), it is expected that the relation between the limiting current and the water’s partial pressure is linear.
Figure 8E(b) shows the comparison of the theoretical data (blue dots) obtained from Equation (47) and the experimental data (red line), and a linear behavior is also observed. The diffusion coefficient of water is calculated by Equation (49) if operation pressure and temperature are known. Do is the diffusion coefficient of H2O measured at pressure Po = 1 atm and temperature To = 0 °C, and n is considered equal to n = 2 for real gases or n = 3/2 for ideal gases.
D ( H 2 O ) = D o ( H 2 O ) ( T T o ) n ( P o P )
By combining Equation (47) with the equation of water’s diffusion coefficient (48), Equation (49) is obtained.
I lim = 2     F     D o ( H 2 O )     S     P o R     L     ( T o ) n P H 2 O T n 1
This equation is important because it suggests that Do(H2O) and n can be estimated from the experiment by the dependence of the limiting current on temperature, as shown in Figure 8E(c). Modifying Equation (49) with the aid of logarithms and by plotting log(Ilim) against log(T), those parameters can be extracted from the graph, as shown in Figure 8E(d). Equation (49) is modified to Equation (50).
log ( l lim ) = ( n 1 ) log ( T ) + log ( 2     F     S     P o     D o ( H 2 O ) R     L     ( T o ) n p H 2 O )
In conclusion, this sensor is suitable for monitoring humidity in a mixture of N2 + H2O and temperature range of operation from 400 to 700 °C. As the authors suggest, the temperature’s lower limit depends on the activity of the Pt electrodes, and the upper limit is based on the increased oxygen anion conductivity of the LSY electrolyte. The sensor can properly operate for pH2O values between 0.001 and 0.1 atm. In this range, the limiting current dependence of the H2O concentration is linear [72].

5. Concluding Remarks

In this study, several solid electrolytes for electrochemical gas sensors were reviewed. Although many materials with different ionic conductivity were presented, proton-conducting and oxide-ion-conducting materials are the ones that were thoroughly discussed. All the discussed gas sensors were designed for operation at intermediate or high temperatures, and they are based on oxide ion-conducting electrolytes and proton-conducting electrolytes. Yttria-stabilized zirconia (YSZ) is the most effective electrolyte employed in many electrochemical sensors for the detection of combustible gasses (such as H2, CH4, and CO), nitrogen oxides (NOx), ammonia (NH3), and oxygen (O2). Regarding the reported sensors based on oxygen-ion conducting materials, an electrochemical amperometric sensor based on YSZ electrolyte with Pt electrodes and a metal or ceramic capillary was tested, in operation-like conditions (high temperature and nitrogen atmosphere), for its potential to detect combustible gases, such as H2, CH4, and CO. According to the results, it is stated that for a combustible gas concentration ranging from 0 to 6%, in the abovementioned atmosphere, the limiting current present a linear dependence on H2, CO, and CH4 content. Another amperometric sensor is based on YSZ electrolyte, Pt electrodes, and metallic capillary, which are proved suitable for the detection of nitrous oxide (N2O) in mixtures of nitrogen/oxygen/air + nitrous oxide. The concentration of N2O can be determined by using the calibration curves “concentration-limiting current” for each mixture. Moreover, an NH3 amperometric sensor based on YSZ electrolytes, Pt electrodes, and a chromo-nickel diffusion barrier was tested for the detection of NH3 in nitrogen atmospheres at 375–430 °C. This device is suitable for the detection of ammonia concentrations between 0.1 and 5 vol.% at 375–400 °C, and it is capable of providing information about the diffusion coefficients and the electrochemical reaction that occurs at the inner electrodes. Finally, as far as the YSZ-based sensors, a combined oxygen sensor was reviewed. This sensor can operate at potentiometric and amperometric modes simultaneously, allowing the control of the sensor’s stability and efficiency through the calibration curves [O2]-Ilim and EMF-Ilim. Moreover, the sensor demonstrated great efficiency for an oxygen concentration range from 0.8 to 88% at 400–700 °C. Table 2 presents the abovementioned sensors based on oxygen-ion conducting electrolytes.
On the other hand, regarding the proton-conducting materials, BaCe0.9Zr0.1Y0.2O3-δ, CaTi0.95Sc0.05O3, CaZr0.9Sc0.1O3, La0.9Sr0.1YO3-δ, and La0.95Sr0.05YO3 were studied for their potential application in electrochemical gas sensors for the detection of H2, CO, CH4, CO2, and H2O in a high-temperature nitrogen atmosphere.
Concerning proton-conducting materials, BaCe0.9Zr0.1Y0.2O3-δ is tested regarding its suitability for an electrochemical H2 sensor operating under either potentiometric or amperometric mode. As stated, the combined potentiometric–amperometric H2 sensor is capable of detecting hydrogen (0.1–10 vol.%) at 450–550 °C. Furthermore, La0.9Sr0.1YO3-δ is reported as a proton conductor and it is employed, in combination with YSZ electrolyte, in an amperometric hydrogen sensor. The sensor successfully detected even lower concentrations of hydrogen (0.1–3.3%) in a mixture of nitrogen at operating temperatures between 500–600 °C.
Furthermore, a similar sensor, based on La0.9Sr0.1YO3-δ + YSZ electrolyte for the analysis of moisture in nitrogen atmospheres, is reviewed. This sensor is capable of detecting humidity at 400–700 °C. La0.9Sr0.1YO3-δ is also employed in an amperometric CO2 sensor.
This sensor proved suitable for the detection of CO2 concentrations, ranging from 2 to 14 vol.%, in a nitrogen atmosphere at 500–600 °C. Moreover, La0.95Sr0.05YO3, CaTi0.95Sc0.05O3, and CaZr0.9Sc0.1O3 were tested for their applications in amperometric sensors. As stated, La0.95Sr0.05YO3-δ is suitable for amperometric H2 sensors able to detect high concentrations (10–98%) of hydrogen and CaZr0.9Sc0.1O3 proved suitable for lower H2 concentration (0.5–5%). However, as stated, CaTi0.95Sc0.05O3 is not suitable for application in hydrogen amperometric sensors, as it exhibits high electronic conductivity. Table 3 presents the abovementioned sensors based on ceramic proton-conducting electrolytes.

Author Contributions

Conceptualization, methodology and validation, formal analysis, investigation, data curation, and writing—original draft preparation: E.G., F.T., C.M. and D.C.; resources, writing (review and editing), and supervision: A.D. and P.T. All authors have read and agreed to the published version of the manuscript.

Funding

This research received no external funding.

Data Availability Statement

The data presented in this study are available on request from the corresponding authors.

Acknowledgments

Fotini Tzorbatzoglou, Costas Molochas, and Panagiotis Tsiakaras thankfully acknowledge co-financing from the European Union and Greek national funds through the Operational Program for Competitiveness, Entrepreneurship, and Innovation, under program RESEARCH–CREATE–INNOVATE (Project code: T1EDK-02442). Catalysts 12 00001 i001

Conflicts of Interest

The authors declare no conflict of interest.

References

  1. Capone, S.; Forleo, A.; Francioso, L.; Rella, R.; Siciliano, P.; Spadavecchia, J.; Presicce, D.; Taurino, A. Solid state gas sensors: State of the art and future activities. J. Optoelectron. Adv. Mater. 2003, 5, 1335–1348. [Google Scholar] [CrossRef]
  2. Funke, K. Solid State Ionics: From Michael Faraday to green energy-the European dimension. Sci. Technol. Adv. Mater. 2013, 14, 043502. [Google Scholar] [CrossRef] [Green Version]
  3. Möbius, H.-H. On the history of solid electrolyte fuel cells. J. Solid State Electrochem. 1997, 1, 2–16. [Google Scholar] [CrossRef]
  4. Kiukkola, K.; Wagner, C. Measurements on Galvanic Cells Involving Solid Electrolytes. J. Electrochem. Soc. 1957, 104, 379. [Google Scholar] [CrossRef]
  5. Weissbart, J.; Ruka, R. Oxygen Gauge. Rev. Sci. Instrum. 1961, 32, 593–595. [Google Scholar] [CrossRef]
  6. West, A.R. Solid electrolytes. Ber. Bunsenges. Phys. Chem. 1989, 93, 1235–1241. [Google Scholar] [CrossRef]
  7. Liu, Y.; Parisi, J.; Sun, X.; Lei, Y. Solid-state gas sensors for high temperature applications—A review. J. Mater. Chem. A 2014, 2, 9919–9943. [Google Scholar] [CrossRef]
  8. Volkov, A.; Gorbova, E.; Vylkov, A.; Medvedev, D.; Demin, A.; Tsiakaras, P. Design and applications of potentiometric sensors based on proton-conducting ceramic materials. A brief review. Sens. Actuators B Chem. 2017, 244, 1004–1015. [Google Scholar] [CrossRef]
  9. Demin, A.; Gorbova, E.; Brouzgou, A.; Volkov, A.; Tsiakaras, P. Chapter 6—Sensors based on solid oxide electrolytes. In Solid Oxide-Based Electrochemical Devices; Lo Faro, M., Ed.; Academic Press: Cambridge, MA, USA, 2020; pp. 167–215. [Google Scholar]
  10. López-Gándara, C.; Ramos, F.M.; Cirera, A. YSZ-Based Oxygen Sensors and the Use of Nanomaterials: A Review from Classical Models to Current Trends. J. Sens. 2009, 2009, 1–15. [Google Scholar] [CrossRef]
  11. Liu, T.; Zhang, X.; Yuan, L.; Yu, J. A review of high-temperature electrochemical sensors based on stabilized zirconia. Solid State Ion. 2015, 283, 91–102. [Google Scholar] [CrossRef]
  12. Liu, F.; Wang, J.; Jiang, L.; You, R.; Wang, Q.; Wang, C.; Lin, Z.; Yang, Z.; He, J.; Liu, A.; et al. Compact and planar type rapid response ppb-level SO2 sensor based on stabilized zirconia and SrMoO4 sensing electrode. Sens. Actuators B Chem. 2020, 307, 127655. [Google Scholar] [CrossRef]
  13. Khan, M.A.; Qazi, F.; Hussain, Z.; Idrees, M.U.; Soomro, S.; Soomro, S. Recent trends in electrochemical detection of NH3, H2S and NOx gases. Int. J. Electrochem. Sci. 2017, 12, 1711–1733. [Google Scholar] [CrossRef]
  14. Okamoto, H.; Obayashi, H.; Kudo, T. Carbon monoxide gas sensor made of stabilized zirconia. Solid State Ion. 1980, 1, 319–326. [Google Scholar] [CrossRef]
  15. Ramaiyan, K.P.; Mukundan, R. Editors’ Choice—Review—Recent Advances in Mixed Potential Sensors. J. Electrochem. Soc. 2020, 167, 037547. [Google Scholar] [CrossRef]
  16. Jasiński, P. Solid-state electrochemical gas sensors. Mater. Sci. Pol. 2006, 24, 269–278. [Google Scholar] [CrossRef]
  17. Morata, A.; Dezanneau, G.; Tarancon, A.; Peiro, F.; Morante, J.R. Novel design and preliminary results of YSZ electrolyte-based amperometric oxygen sensors. In Conference on Electron Devices, 2005 Spanish; IEEE: Piscataway, NJ, USA, 2005; pp. 585–588. [Google Scholar] [CrossRef]
  18. Kalyakin, A.; Lyagaeva, J.; Medvedev, D.; Volkov, A.; Demin, A.; Tsiakaras, P. Characterization of proton-conducting electrolyte based on La0. 9Sr0. 1YO3–δ and its application in a hydrogen amperometric sensor. Sens. Actuators B Chem. 2016, 225, 446–452. [Google Scholar] [CrossRef]
  19. Usui, T.; Asada, A.; Nakazawa, M.; Osanai, H. Gas Polarographic Oxygen Sensor Using an Oxygen/Zirconia Electrolyte. J. Electrochem. Soc. 1989, 136, 534–542. [Google Scholar] [CrossRef]
  20. Rheaume, J.M.; Pisano, A.P. A review of recent progress in sensing of gas concentration by impedance change. Ionics 2011, 17, 99–108. [Google Scholar] [CrossRef] [Green Version]
  21. Nakatou, M.; Miura, N. Impedancemetric sensor based on YSZ and In2O3 for detection of low concentrations of water vapor at high temperature. Electrochem. Commun. 2004, 6, 995–998. [Google Scholar] [CrossRef]
  22. Wama, R.; Utiyama, M.; Plashnitsa, V.V.; Miura, N. Highly sensitive impedance-based propene sensor using stabilized zirconia and zinc oxide sensing-electrode. Electrochem. Commun. 2007, 9, 2774–2777. [Google Scholar] [CrossRef]
  23. Wu, N.; Chen, Z.; Xu, J.; Chyu, M.; Mao, S.X. Impedance-metric Pt/YSZ/Au–Ga2O3 sensor for CO detection at high temperature. Sens. Actuators B Chem. 2005, 110, 49–53. [Google Scholar] [CrossRef]
  24. Miura, N.; Nakatou, M.; Zhuiykov, S. Impedancemetric gas sensor based on zirconia solid electrolyte and oxide sensing electrode for detecting total NOx at high temperature. Sens. Actuators B Chem. 2003, 93, 221–228. [Google Scholar]
  25. Liu, T.; Zhang, X.; Wang, X.; Yu, J.; Li, L. A review of zirconia-based solid electrolytes. Ionics 2016, 22, 2249–2262. [Google Scholar] [CrossRef]
  26. Pikalova, E.Y.; Murashkina, A.A.; Maragou, V.I.; Demin, A.K.; Strekalovsky, V.N.; Tsiakaras, P.E. CeO2 based materials doped with lanthanides for applications in intermediate temperature electrochemical devices. Int. J. Hydrog. Energy 2011, 36, 6175–6183. [Google Scholar] [CrossRef]
  27. Inaba, H.; Tagawa, H. Ceria-based solid electrolytes. Solid State Ion. 1996, 83, 1–16. [Google Scholar] [CrossRef]
  28. Ishihara, T.; Matsuda, H.; Takita, Y. Doped LaGaO3 perovskite type oxide as a new oxide ionic conductor. J. Am. Chem. Soc. 1994, 116, 3801–3803. [Google Scholar] [CrossRef]
  29. Ishihara, T.; Matsuda, H.; bin Bustam, M.A.; Takita, Y. Oxide ion conductivity in doped Ga based perovskite type oxide. Solid State Ion. 1996, 86, 197–201. [Google Scholar] [CrossRef]
  30. Ishihara, T.; Honda, M.; Shibayama, T.; Minami, H.; Nishiguchi, H.; Takita, Y. Intermediate Temperature Solid Oxide Fuel Cells Using a New LaGaO3 Based Oxide Ion Conductor: I. Doped as a New Cathode Material. J. Electrochem. Soc. 1998, 145, 3177. [Google Scholar] [CrossRef]
  31. Skinner, S.J.; Kilner, J.A. Oxygen ion conductors. Mater. Today 2003, 6, 30–37. [Google Scholar] [CrossRef]
  32. Boivin, J.; Mairesse, G. Recent material developments in fast oxide ion conductors. Chem. Mater. 1998, 10, 2870–2888. [Google Scholar] [CrossRef]
  33. Iwahara, H.; Uchida, H.; Tanaka, S. High temperature-type proton conductive solid oxide fuel cells using various fuels. J. Appl. Electrochem. 1986, 16, 663–668. [Google Scholar] [CrossRef]
  34. Virkar, A.; Maiti, H. Oxygen ion conduction in pure and yttria-doped barium cerate. J. Power Sources 1985, 14, 295–303. [Google Scholar] [CrossRef]
  35. Mitsui, A.; Miyayama, M.; Yanagida, H. Evaluation of the activation energy for proton conduction in perovskite-type oxides. Solid State Ion. 1987, 22, 213–217. [Google Scholar] [CrossRef]
  36. Medvedev, D.; Brouzgou, A.; Demin, A.; Tsiakaras, P. Proton-Conducting Electrolytes for Solid Oxide Fuel Cell Applications. In Advances in Medium and High Temperature Solid Oxide Fuel Cell Technology; Springer: Cham, Switzerland, 2017; pp. 77–118. [Google Scholar]
  37. Medvedev, D.A.; Lyagaeva, J.G.; Gorbova, E.V.; Demin, A.K.; Tsiakaras, P. Advanced materials for SOFC application: Strategies for the development of highly conductive and stable solid oxide proton electrolytes. Prog. Mater. Sci. 2016, 75, 38–79. [Google Scholar] [CrossRef]
  38. Yajima, T.; Kazeoka, H.; Yogo, T.; Iwahara, H. Proton conduction in sintered oxides based on CaZrO3. Solid State Ion. 1991, 47, 271–275. [Google Scholar] [CrossRef]
  39. Liang, K.C.; Nowick, A.S. High-temperature protonic conduction in mixed perovskite ceramics. Solid State Ion. 1993, 61, 77–81. [Google Scholar] [CrossRef]
  40. Kochetova, N.; Animitsa, I.; Medvedev, D.; Demin, A.; Tsiakaras, P. Recent activity in the development of proton-conducting oxides for high-temperature applications. RSC Adv. 2016, 6, 73222–73268. [Google Scholar] [CrossRef]
  41. Zhuiykov, S. Electrochemistry of Zirconia Gas Sensors; CRC Press: Boca Raton, FL, USA, 2007. [Google Scholar]
  42. Yajima, T.; Koide, K.; Takai, H.; Fukatsu, N.; Iwahara, H. Application of hydrogen sensor using proton conductive ceramics as a solid electrolyte to aluminum casting industries. Solid State Ion. 1995, 79, 333–337. [Google Scholar] [CrossRef]
  43. Zheng, X.; Zhang, C.; Xia, J.; Zhou, G.; Jiang, D.; Wang, S.; Li, X.; Shen, Y.; Dai, M.; Wang, B.; et al. Mesoporous tungsten oxide electrodes for YSZ-based mixed potential sensors to detect NO2 in the sub ppm-range. Sens. Actuators B Chem. 2019, 284, 575–581. [Google Scholar] [CrossRef]
  44. Garzon, F.H.; Mukundan, R.; Brosha, E.L. Solid-state mixed potential gas sensors: Theory, experiments and challenges. Solid State Ion. 2000, 136–137, 633–638. [Google Scholar] [CrossRef]
  45. Brosha, E.L.; Mukundan, R.; Brown, D.R.; Garzon, F.H.; Visser, J. Development of ceramic mixed potential sensors for automotive applications. Solid State Ion. 2002, 148, 61–69. [Google Scholar] [CrossRef]
  46. Guillet, N.; Lalauze, R.; Pijolat, C. Oxygen and carbon monoxide role on the electrical response of a non-Nernstian potentiometric gas sensor; proposition of a model. Sens. Actuators B Chem. 2004, 98, 130–139. [Google Scholar] [CrossRef]
  47. Lu, G.; Miura, N.; Yamazoe, N. High-temperature hydrogen sensor based on stabilized zirconia and a metal oxide electrode. Sens. Actuators B Chem. 1996, 35, 130–135. [Google Scholar] [CrossRef]
  48. Di Bartolomeo, E.; Grilli, M.L. YSZ-based electrochemical sensors: From materials preparation to testing in the exhausts of an engine bench test. J. Eur. Ceram. Soc. 2005, 25, 2959–2964. [Google Scholar] [CrossRef]
  49. Zosel, J.; Westphal, D.; Jakobs, S.; Müller, R.; Guth, U. Au–oxide composites as HC-sensitive electrode material for mixed potential gas sensors. Solid State Ion. 2002, 152–153, 525–529. [Google Scholar] [CrossRef]
  50. Fadeyev, G.; Kalyakin, A.; Gorbova, E.; Brouzgou, A.; Demin, A.; Volkov, A.; Tsiakaras, P. A simple and low-cost amperometric sensor for measuring H2, CO, and CH4. Sens. Actuators B Chem. 2015, 221, 879–883. [Google Scholar] [CrossRef]
  51. Kalyakin, A.; Fadeyev, G.; Demin, A.; Gorbova, E.; Brouzgou, A.; Volkov, A.; Tsiakaras, P. Application of Solid oxide proton-conducting electrolytes for amperometric analysis of hydrogen in H2+N2+H2O gas mixtures. Electrochim. Acta 2014, 141, 120–125. [Google Scholar] [CrossRef]
  52. Kalyakin, A.; Volkov, A.; Lyagaeva, J.; Medvedev, D.; Demin, A.; Tsiakaras, P. Combined amperometric and potentiometric hydrogen sensors based on BaCe0.7Zr0.1Y0.2O3−δ proton-conducting ceramic. Sens. Actuators B Chem. 2016, 231, 175–182. [Google Scholar] [CrossRef]
  53. Fergus, J.W. A review of electrolyte and electrode materials for high temperature electrochemical CO2 and SO2 gas sensors. Sens. Actuators B Chem. 2008, 134, 1034–1041. [Google Scholar] [CrossRef]
  54. Kalyakin, A.S.; Medvedev, D.A.; Volkov, A.N. Electrochemical sensors based on proton-conducting electrolytes for determination of concentration and diffusion coefficient of CO2 in inert gases. Chem. Eng. Sci. 2021, 229, 116046. [Google Scholar] [CrossRef]
  55. Haagen-Smit, A.J.; Fox, M.M. Photochemical Ozone Formation with Hydrocarbons and Automobile Exhaust. Air Repair 1954, 4, 105–136. [Google Scholar] [CrossRef]
  56. Haagen-Smit, A.J. Photochemistry and Smog. J. Air Pollut. Control. Assoc. 1963, 13, 444–454. [Google Scholar] [CrossRef]
  57. Cooper, C.D.; Alley, F.C. Air Pollution Control: A Design Approach; Waveland Press: Long Grove, IL, USA, 2010. [Google Scholar]
  58. Kalyakin, A.; Volkov, A.; Demin, A.; Gorbova, E.; Tsiakaras, P. Determination of nitrous oxide concentration using a solid-electrolyte amperometric sensor. Sens. Actuators B Chem. 2019, 297, 126750. [Google Scholar] [CrossRef]
  59. Miura, N.; Kurosawa, H.; Hasei, M.; Lu, G.; Yamazoe, N. Stabilized zirconia-based sensor using oxide electrode for detection of NOx in high-temperature combustion-exhausts. Solid State Ion. 1996, 86–88, 1069–1073. [Google Scholar] [CrossRef]
  60. Zhuiykov, S.; Nakano, T.; Kunimoto, A.; Yamazoe, N.; Miura, N. Potentiometric NOx sensor based on stabilized zirconia and NiCr2O4 sensing electrode operating at high temperatures. Electrochem. Commun. 2001, 3, 97–101. [Google Scholar] [CrossRef]
  61. Miura, N.; Akisada, K.; Wang, J.; Zhuiykov, S.; Ono, T. Mixed-potential-type NO x sensor based on YSZ and zinc oxide sensing electrode. Ionics 2004, 10, 1–9. [Google Scholar] [CrossRef]
  62. Di Bartolomeo, E.; Kaabbuathong, N.; Grilli, M.L.; Traversa, E. Planar electrochemical sensors based on tape-cast YSZ layers and oxide electrodes. Solid State Ion. 2004, 171, 173–181. [Google Scholar] [CrossRef]
  63. Wang, J.; Elumalai, P.; Terada, D.; Hasei, M.; Miura, N. Mixed-potential-type zirconia-based NOx sensor using Rh-loaded NiO sensing electrode operating at high temperatures. Solid State Ion. 2006, 177, 2305–2311. [Google Scholar] [CrossRef]
  64. Kalyakin, A.; Volkov, A.; Vylkov, A.; Gorbova, E.; Medvedev, D.; Demin, A.; Tsiakaras, P. An electrochemical method for the determination of concentration and diffusion coefficient of ammonia-nitrogen gas mixtures. J. Electroanal. Chem. 2018, 808, 133–136. [Google Scholar] [CrossRef]
  65. Poling, B.E.; Prausnitz, J.M.; O’connell, J.P. Properties of Gases and Liquids; McGraw-Hill Education: New York, NY, USA, 2001. [Google Scholar]
  66. Spirig, J.V.; Ramamoorthy, R.; Akbar, S.A.; Routbort, J.L.; Singh, D.; Dutta, P.K. High temperature zirconia oxygen sensor with sealed metal/metal oxide internal reference. Sens. Actuators B Chem. 2007, 124, 192–201. [Google Scholar] [CrossRef]
  67. Colominas, S.; Abella, J.; Victori, L. Characterisation of an oxygen sensor based on In/In2O3 reference electrode. J. Nucl. Mater. 2004, 335, 260–263. [Google Scholar] [CrossRef]
  68. Thangadurai, V.; Weppner, W. Ce0. 8Sm0. 2O1. 9: Characterization of electronic charge carriers and application in limiting current oxygen sensors. Electrochim. Acta 2004, 49, 1577–1585. [Google Scholar] [CrossRef]
  69. Kalyakin, A.; Demin, A.; Gorbova, E.; Volkov, A.; Tsiakaras, P. Combined amperometric-potentiometric oxygen sensor. Sens. Actuators B Chem. 2020, 313, 127999. [Google Scholar] [CrossRef]
  70. Iwahara, H.; Uchida, H.; Kondo, J. Galvanic cell-type humidity sensor using high temperature-type proton conductive solid electrolyte. J. Appl. Electrochem. 1983, 13, 365–370. [Google Scholar] [CrossRef]
  71. Katahira, K.; Matsumoto, H.; Iwahara, H.; Koide, K.; Iwamoto, T. A solid electrolyte steam sensor with an electrochemically supplied hydrogen standard using proton-conducting oxides. Sens. Actuators B Chem. 2000, 67, 189–193. [Google Scholar] [CrossRef]
  72. Medvedev, D.; Kalyakin, A.; Volkov, A.; Demin, A.; Tsiakaras, P. Electrochemical moisture analysis by combining oxygen- and proton-conducting ceramic electrolytes. Electrochem. Commun. 2017, 76, 55–58. [Google Scholar] [CrossRef]
Figure 1. (A) A typical potentiometric sensor for the detection of oxygen in exhaust gases. Reproduced with permission from [16]; (B) schematic representation of a typical mixed potential sensor with YSZ electrolyte and porous electrodes, reproduced with permission from [15]; (C,D) schematic representation of amperometric sensors: (1) the diffusion barrier, (2) the solid electrolyte, (3) cathode, (4) anode, and (5) surrounding gas. Reproduced with permission from [17,18].
Catalysts 12 00001 g001
Figure 2. (A) Schematic representation of an amperometric sensor. Reproduced with permission from [50]. (B) I-V characteristic curves of the tested sensor at 450 °C; (a) for the mixture N2 + H2 at different H2 concentrations (0.5, 2, 4, 6 vol.% H2); (b) for the mixture N2 + CH4 for different CH4 concentrations (2, 4, 6 vol.% CH4); (c) for the mixture N2 + CO for different CO concentrations (1, 2, 4, 6 vol.% CO); (d) the relation between the limiting current and different concentrations of the three tested combustible gases (H2, CH4, and CO). Reproduced with permission from [50]. (C) Schematic representation of the amperometric sensor, (1) proton-conducting electrolyte, (2) glass sealant, (3–4) Pt electrodes, and (5) platinum lead. Reproduced with permission from [51]. (D) I-V curves for (a) La0.95Sr0.05YO3 electrolyte-based cell, (b) CaZr0.90Sc0.1O3 electrolyte-based cell, (c) CaTi0.95Sc0.05O3 electrolyte-based cell, for different H2 concentrations in mixtures of N2 + 2%H2O + H2 at operating temperature of 800 °C, and (d) dependence of limiting current on hydrogen content for cell-1. Reproduced with permission from [51].
Catalysts 12 00001 g002
Figure 3. (A) Schematic representation of the hydrogen amperometric sensor (left): (1) the ambient gas, (2) the ceramic capillary, (3) the Pt electrodes, and (4) the glass sealants; (right) the experimental cell. Reproduced with permission from [18]. (B) (a,b) Dependence of current on the applied voltage for x vol.% H2 in N2 + H2 mixture at 550 °C, (c) dependence of limiting current to hydrogen content, and (d) I and ΔVoc plotted against U for the 0.7 vol.% H2 + N2 mixture at 550 °C. Reproduced with permission from [18]. (C) Combined potentiometric (a) amperometric (b) hydrogen sensor, (1) BZCY proton conductor, (2) chamber inside the sensor, (3) capillary barrier, (4) Pt electrodes, and (5) glass sealant. Reproduced with permission from [52]. (D) (a) EMF-V curves for different hydrogen content in x%H2 + N2 + 2%H2O gas mixtures at 500 °C; (b) the limiting current as a function of hydrogen content in N2 + H2 mixture at 500 °C; (c) I-V curves for different temperatures of operation and (d) for different H2 concentrations at 500 °C. Reproduced with permission from [52].
Catalysts 12 00001 g003
Figure 4. (A) Sodium ion-conducting electrolytes and different Na2CO3 based auxiliary electrodes Reproduced with permission from [53]. (B) Configuration and operation of the amperometric CO2 sensor; (1) La0.9Sr0.1YO3-δ proton-conducting electrolytes; (2) capillary barrier; (3–4) Pt electrodes; (5) glass sealant; (6) DC source and (7) amperometer. Reproduced with permission from [54]. (C) (a) current–voltage curves for N2 + 2%H2O + x%CO2 (x = 2.3 to 13.7) gas mixtures, (b) relation between limiting current and CO2 concentration, (c) current–voltage curves for N2 + 2%H2O + 13.7%CO2 for 500, 550, and 600 °C, and (d) experimental DCO2 values for different temperatures compared to the values from literature. Reproduced with permission from [54].
Catalysts 12 00001 g004
Figure 5. (A) A scheme of an amperometric NOx sensor. (1) Pt electrodes, (2) capillary, and (3) glass sealants. Reproduced with permission from [58]. (B) Current–voltage curves at 700 °C for different N2O concentrations in mixtures of (a) N2O + N2, (c) N2O + air, and (e) N2O + O2; dependences of the limiting currents on N2O concentration (b), (d), and (f) for the corresponding gas mixtures. Reproduced with permission from [58].
Catalysts 12 00001 g005
Figure 6. (a) Schematic representation of a NH3 amperometric sensor. Reproduced with permission from [64]. (b) Current response on the applied voltage for different ammonia concentrations at 400 °C. x is the NH3 concentration in vol.%. (c) The relation between the limiting current and different NH3 concentrations and (d) current–voltage curves for different temperatures for 5 vol.% ammonia. Reproduced with permission from [64].
Catalysts 12 00001 g006
Figure 7. (A) Scheme of a combined potentiometric/amperometric oxygen sensor. (B) The sensor characteristics. (a) Current–voltage curves at 500 °C, (b) typical EMF-V and I-V characteristics at 500 °C and oxygen’s concentration of 7.5, (c) relation between limiting current and oxygen concentration at 500 °C, (d) calibration curves at 500 °C for the determination of oxygen’s concentration through limiting current (green line), and dependence of the EMF on the limiting current (blue line). Reproduced with permission from [69].
Catalysts 12 00001 g007
Figure 8. (A) (a) Scheme of the humidity sensor fabricated by Iwahara et al.; (b) theoretical and experimental E(mV)-log(pH2O) plot at 400 °C. Reproduced with permission from [70]. (B) Configuration of the humidity sensor designed by Katahira et al. (Reproduced with permission from [71]). (C) Electric potential as a function of applied voltage (a) and H2O (b) vapor content at 700 °C; (c) E(mV)-t(sec) for cyclical changes in p’H2O (Reproduced with permission from [8]). (D) (a) Reactions at the inner electrodes and (b) the formation of pure nitrogen atmosphere as the applied voltage increases, (c) (1) YSZ electrolyte, (2) LSY electrolyte, (3) capillary barrier, (4) Pt electrodes, (5) high-temperature glass sealant, (6) amperometer, (7) DC source, and (8) voltammeter. Reproduced with permission from [72]. (E) (a) Current–voltage curves for different H2O concentrations, (b) relation between the limiting current and the H2O concentration and comparison between the theoretical and experimental values, (c) I-V curves at different temperature for the mixture of N2 + H2O for pH2O = 0.004 atm; (d) Temperature dependence of limiting current. Reproduced with permission from [72].
Catalysts 12 00001 g008
Table 1. Experimental (Dexp) and theoretical diffusion (Dth) coefficients for ammonia in nitrogen at different temperatures [64].
T, °CEquationDexp·104m2/sDth·104m2/sΔD/Dth %Byproduct
400(35)1.111.120.9N2
(36)0.83 26N2O
(37)0.67 40NO
375(35)1.011.053.8N2
(36)0.76 28N2O
(37)0.60 43NO
Table 2. Electrochemical gas sensors based on oxygen anion-conducting materials.
TypeTemperatureTarget GasElectrolyteRefs
amperometric450H2, CH4, CO9YSZ[50]
amperometric700N2OYSZ[58]
amperometric375–430NH38YSZ[64]
Amperometric/potentiometric400–700O29YSZ[69]
Table 3. Electrochemical gas sensors based on proton-conducting materials.
TypeTemperature °CTarget GasElectrolyteRefs
amperometric500–600H2La0.9Sr0.1YO3-δ[18]
amperometric850H2La0.95Sr0.05YO3-CaZr0.9Sc0.1O3[51]
amperometric/potentiometric450–550H2BaCe0.9Zr0.1Y0.2O3-δ[52]
amperometric650H2OLa0.9Sr0.1YO3-δ + YSZ[72]
amperometric500–600CO2La0.9Sr0.1YO3-δ[54]
Publisher’s Note: MDPI stays neutral with regard to jurisdictional claims in published maps and institutional affiliations.

