Article

Synthesis of Catalytic Ni/Cu Nanoparticles from Simulated Wastewater on Li–Al Mixed Metal Oxides for a Two-Stage Catalytic Process in Ethanol Steam Reforming: Catalytic Performance and Coke Properties

1
Department of Materials Science and Engineering, National Chung Hsing University, 145 Xingda Rd., Taichung 40227, Taiwan
2
Innovation and Development Center of Sustainable Agriculture (IDCSA), National Chung Hsing University, 145 Xingda Rd., Taichung 40227, Taiwan
3
Green Energy and Environment Research Laboratories, Energy Storage System Department, New Energy Technology Division, Industrial Technology Research Institute, 195, Sec. 4, Chung Hsing Rd., Chutung, Hsinchu 31040, Taiwan
*
Author to whom correspondence should be addressed.
Catalysts 2021, 11(9), 1124; https://doi.org/10.3390/catal11091124
Submission received: 24 August 2021 / Revised: 16 September 2021 / Accepted: 16 September 2021 / Published: 18 September 2021

Abstract

:
This work recovered Ni or Cu cations from simulated electroplating wastewater to synthesize Ni/Cu nano-catalysts for H2 generation by ethanol steam reforming (ESR). Aluminum lathe waste was used as a framework to prepare the structured catalyst. Li–Al–CO3 layered double hydroxide (LDH) was electrodeposited on the surface of the framework. The LDH was in a platelet-like structure, working as a support for the formation of the precursor of the metal catalysts. The catalytic performance and the coke properties of a 6Cu_6Ni two-stage catalyst configuration herein used for ESR catalytic reaction were studied. The Cu–Ni two-stage catalyst configuration (6Cu_6Ni) yielded more H2 (~10%) than that by using the Ni-based catalyst (6Ni) only. The 6Cu_6Ni catalyst configuration also resulted in a relatively stable H2 generation rate vs. time, with nearly no decline during the 5-h reaction. Through the pre-reaction of ethanol-steam mixture with Cu/LiAlO2 catalyst, the Ni/LiAlO2 catalyst in the 6Cu_6Ni catalyst configuration could steadily decompose acetaldehyde, and rare acetate groups, which would evolve condensed coke, were formed. The Ni nanoparticles were observed to be lifted and separated by the carbon filaments from the support and had no indication of sintering, contributing to the bare deactivation of the Ni/LiAlO2 catalyst in 6Cu_6Ni.

Graphical Abstract

1. Introduction

Nickel plating and copper plating are often conducted in the preparation of a surface for treatment or as the final treatment of many items in everyday use [1,2]. Significant quantities of Ni and Cu cations are thus frequently present in plating wastewater. To protect public health and aquatic life, excessive quantities of Ni and Cu ions must be removed from industrial effluent before it is discharged into the public wastewater treatment system [2,3]. The authors’ earlier investigation [4] reviewed numerous methods for treating nickel plating and copper plating wastewater, including filtration, membrane separation, ion-exchange, precipitation, adsorption, and biosorption. Studies concerning the extraction of Ni2+ and Cu2+ either from the electroplating wastewater or the rinse stream when plated workpieces are washed are very few. This work concerned a new process used to recover metal ions from simulated Ni or Cu electroplating wastewater for use in the synthesis of nano-catalysts. Additionally, the use of the prepared Ni- and Cu-based catalysts in ethanol steam reforming (ESR) to produce hydrogen was investigated.
Hydrogen is regarded as a promising source of energy because it is a clean fuel that combusts to produce only water [5]. Currently, methods of H2 production include photocatalysts [6], electrolysis of water [7], metal hydrolysis [8], biomass processes [9], and steam reforming [10]. Steam reforming is the most widely used process for generating H2 because of its high H2 yield, low energy requirement, and low cost [5]. Ethanol is a potential feedstock for steam reforming since it is a renewable resource that can be generated in large amounts from biomass. Additionally, ethanol is not toxic, easy to handle, and has the potential to yield large amounts of H2 [11]. The complete ESR reaction is as the following.
C2H5OH + 3H2O → 6H2 + 2CO2 ΔH° = 173.4 kJ/mole.
The main reaction paths in ESR are as follows [12].
C2H5OH → CH3CHO + H2 (ethanol dehydrogenation),
C2H5OH → C2H4 + H2O (ethanol dehydration),
CH3CHO → CH4 + CO (acetaldehyde decomposition),
CH3CHO + H2O → 2CO + 3H2 (acetaldehyde steam reforming),
CH4 + H2O → CO + 3H2 (methane steam reforming),
CO + H2O → CO2 + H2 (water gas shift).
Ni is the most widely used catalyst in the industrial production of H2 by steam reforming due to its efficient cracking of the C−C bond and lower cost than noble metal catalysts (such as Pd, Pt, Ru, and Rh) [11]. The main challenges associated with the use of Ni-based catalysts are the formation of coke and the sintering of Ni particles, which both cause the deactivation of Ni catalysts [12]. Freni et al. [13] designed a Cu–Ni two-layer catalytic reactor to improve the catalytic performance of ESR reactions. In their experiments, ethanol/water mixture first passed through the first-layer Cu/SiO2 catalyst, which is an effective catalyst for the dehydrogenation of ethanol to acetaldehyde (CH3CHO), at 370 °C. The low operating temperature prevented the sintering of the Cu catalyst and reduces the formation of ethylene (C2H4). Then, the reacted atmosphere passed through the second-layer Ni/MgO catalyst to be further decomposed into syngas of H2, CO2, CO, and other gases. The relatively high operating temperature (at 650 °C) for the Ni/MgO catalyst promoted the conversion of ethanol, while the generation of some undesirable by-products, such as CO and C2H4, also increased. The two-layer catalytic reactor is difficult to down-size to a nano-scale structure, whose high surface area favors a complete and efficient ESR reaction. In this work, high-density distributed Ni and Cu nanoparticles were prepared on a special collocation of catalyst support (Li–Al layered double hydroxide) and substrate (aluminum lathe waste) for use in Cu–Ni two-stage catalyst configuration. The influence of a Cu-based catalyst on coke formation, nanoparticles sintering, and partial deactivation of subsequent Ni-based catalyst was investigated.
Catalyst supports can influence the nature of catalysts and even the catalytic reaction paths [12]. In some studies, layered double hydroxides (LDHs) have been applied to be catalyst supports [14]. LDHs are a series of hydrotalcite-like clays which consist of positively charged layers with intercalated water molecules and anions for charge balance. The positively charged layers are composed of mono- or di- and trivalent metal cations in hydroxyl slabs. One special case involving monovalent cations, Li–Al LDH, in which Li+ occupies the octahedral interstitial sites of gibbsite (Al(OH)3) sheets to form positively charged layers, and the present authors previously studied this case [15,16,17]. Although several types of LDH have been studied, there is no study using Li–Al LDH as support to disperse nano-scale Ni or Cu particles on its surface. In this study, the use of Li–Al LDH as the catalyst support for Ni or Cu nano-catalysts was studied. LDHs are calcined and transferred into the so-called “mixed metal oxides” to possess the properties of high surface area, high thermal stability, high metal dispersion, and others. The calcination product of Li–Al LDH, LiAlO2, has been found to have high basicity, and its basicity is even higher than that of Mg-Al LDH [18]. According to the mechanism introduced by Cosimo et al. [19], the strong basic-acid pairs on Mg-Al mixed metal oxides helped to adsorb ethanol molecules and induced the forming of acetaldehyde. The effect of LiAlO2 on the catalytic reaction of ESR was investigated in this work.
In most relevant investigations, powdered new catalysts are investigated to obtain better performance of ESR. However, the stacking of powder in a reaction bed often causes non-uniform temperature distribution and pressure drop [20]. Processing the catalyst powder into the form of pellets is one of the solutions to reduce the pressure drop. In addition, the use of structured catalysts, such as some ceramic/metal foams and monoliths, has been investigated for resolving the issues of non-uniform temperature distribution and pressure drop in a reaction bed [20,21,22,23,24]. This work is the first to use aluminum lathe waste as the substrate of a structured catalyst. Aluminum lathe waste is an industrial residue generated from the processing of aluminum alloys on lathes, so that it can be recycled and reused at a relatively low cost. Metal substrates also have better thermal conductivity than ceramics, and can provide a relatively uniform temperature distribution [23,24]. To disperse catalytic nanoparticles at high density on a surface with a large area, a Li–Al–CO3 LDH thin film was formed on the lathe waste surface using a method of electrodeposition that can be found in an earlier study by the authors, in which a Li–Al LDH coating was prepared on an Mg alloy substrate [15]. Aluminum foil and lithium hydroxide were used to prepare Al3+- and Li+-containing solution as the electrolyte for electrodeposition [25]. Aqueous solutions of Ni or Cu ions that simulate the industrial wastewater were used as sources of Ni and Cu for the formation of metallic nanoparticles. The use of LDHs for the removal of heavy metal ions (Cu2+, Cd2+, Pd2+, Cr2+, and others) from aqueous solutions has been studied [26]. In the present study, the calcined Li–Al LDH-coated aluminum lathe waste worked as a framework for forming catalyst precursors on it, and by the way, it removed heavy metal ions when being dipped in the simulated wastewater containing Ni2+ or Cu2+ (as revealed by the experimental photographs in Figure S1). Figure S1a shows that the Ni2+ concentration decreased from the original 535 ppm to 3.3 ppm, as the framework immersion in the simulated wastewater. The Ni catalyst precursor was formed on the surface of the framework, leading to the reduction of Ni2+ in the wastewater. Similarly, Figure S1b suggests that Cu2+ concentration decreased from the original 78 ppm to 4.8 ppm. Herein, the removal of the metal ions from the wastewater would lead to the formation of the precursor of Ni or Cu nano-catalysts. This study investigated the microstructures of the nano-catalysts on LiAlO2 support. Moreover, their catalytic performance in ESR was examined. The objective of this research is to combine the utility of industrial waste (lathe waste and plating wastewater) and the beneficial support properties of LDH for the synthesis of a catalyst from the perspective of the environmentally friendly process. The catalyst is synthesized on a structured substrate made of Al lathe waste to obtain good catalyst nanoparticles dispersion and adhesion on the structured support. The roles of Ni/Cu catalysts and LiAlO2 support in ESR are clarified to explore the appreciate reaction conditions.

2. Results and Discussion

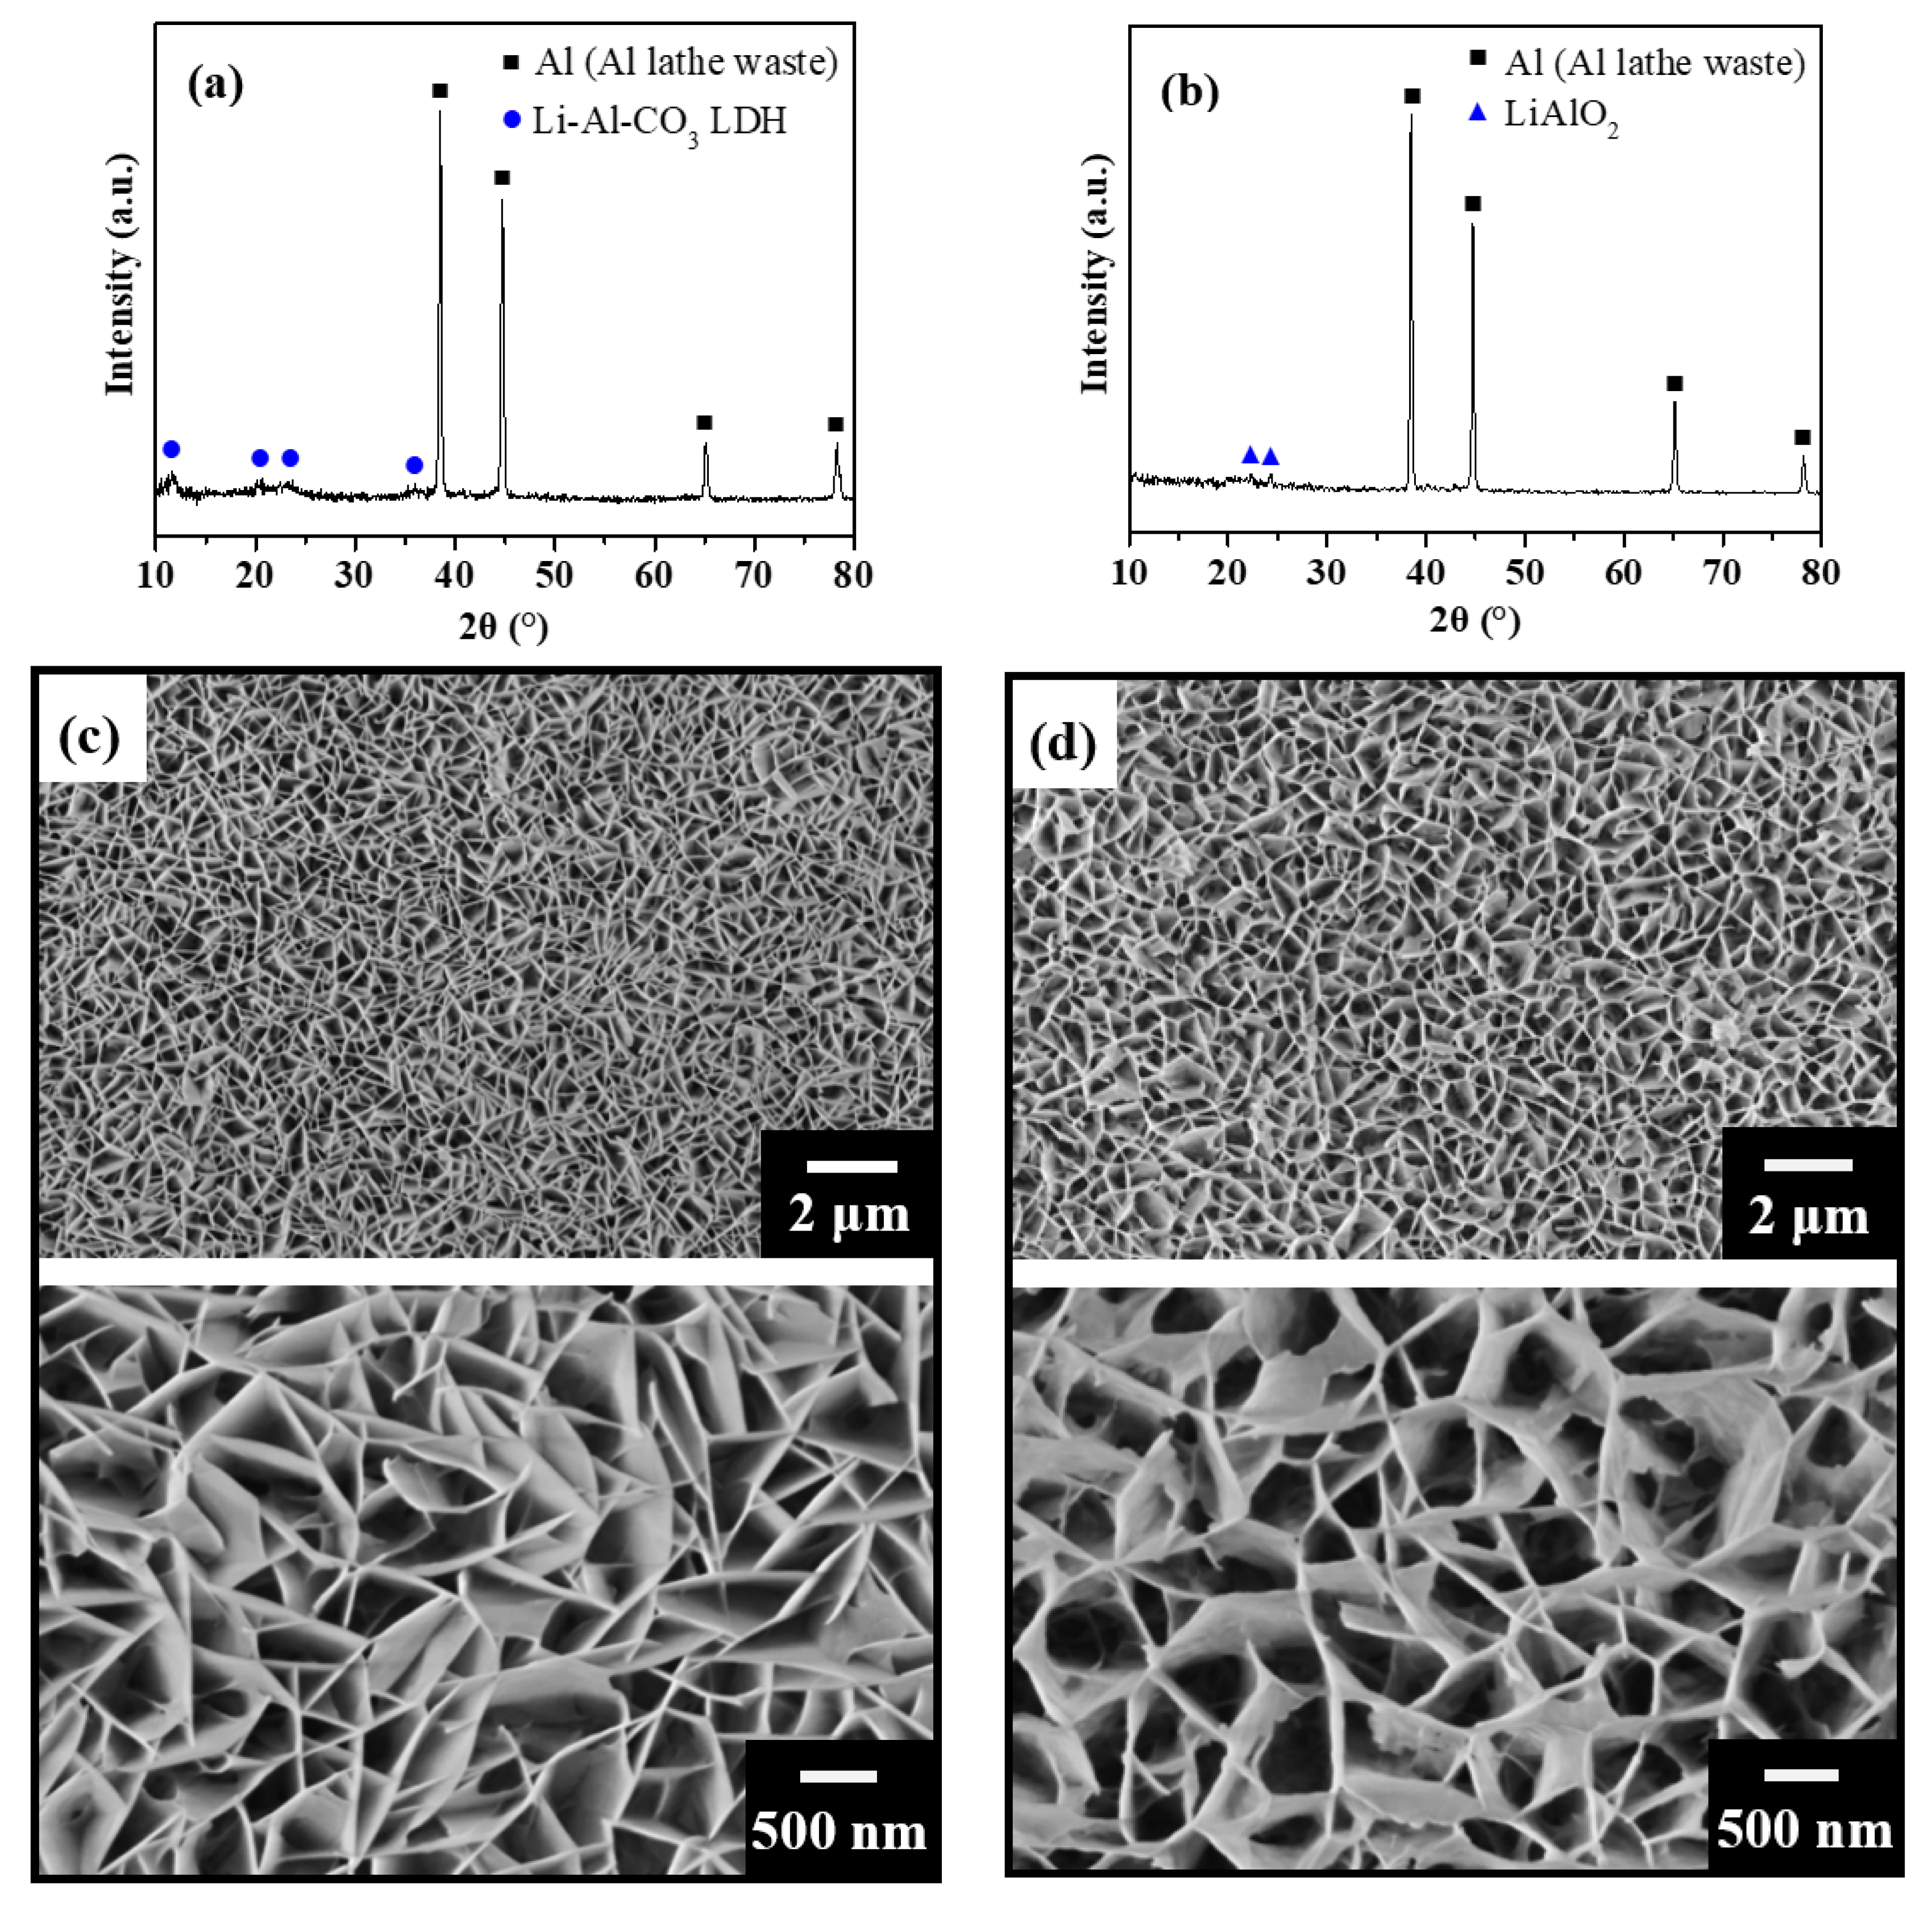
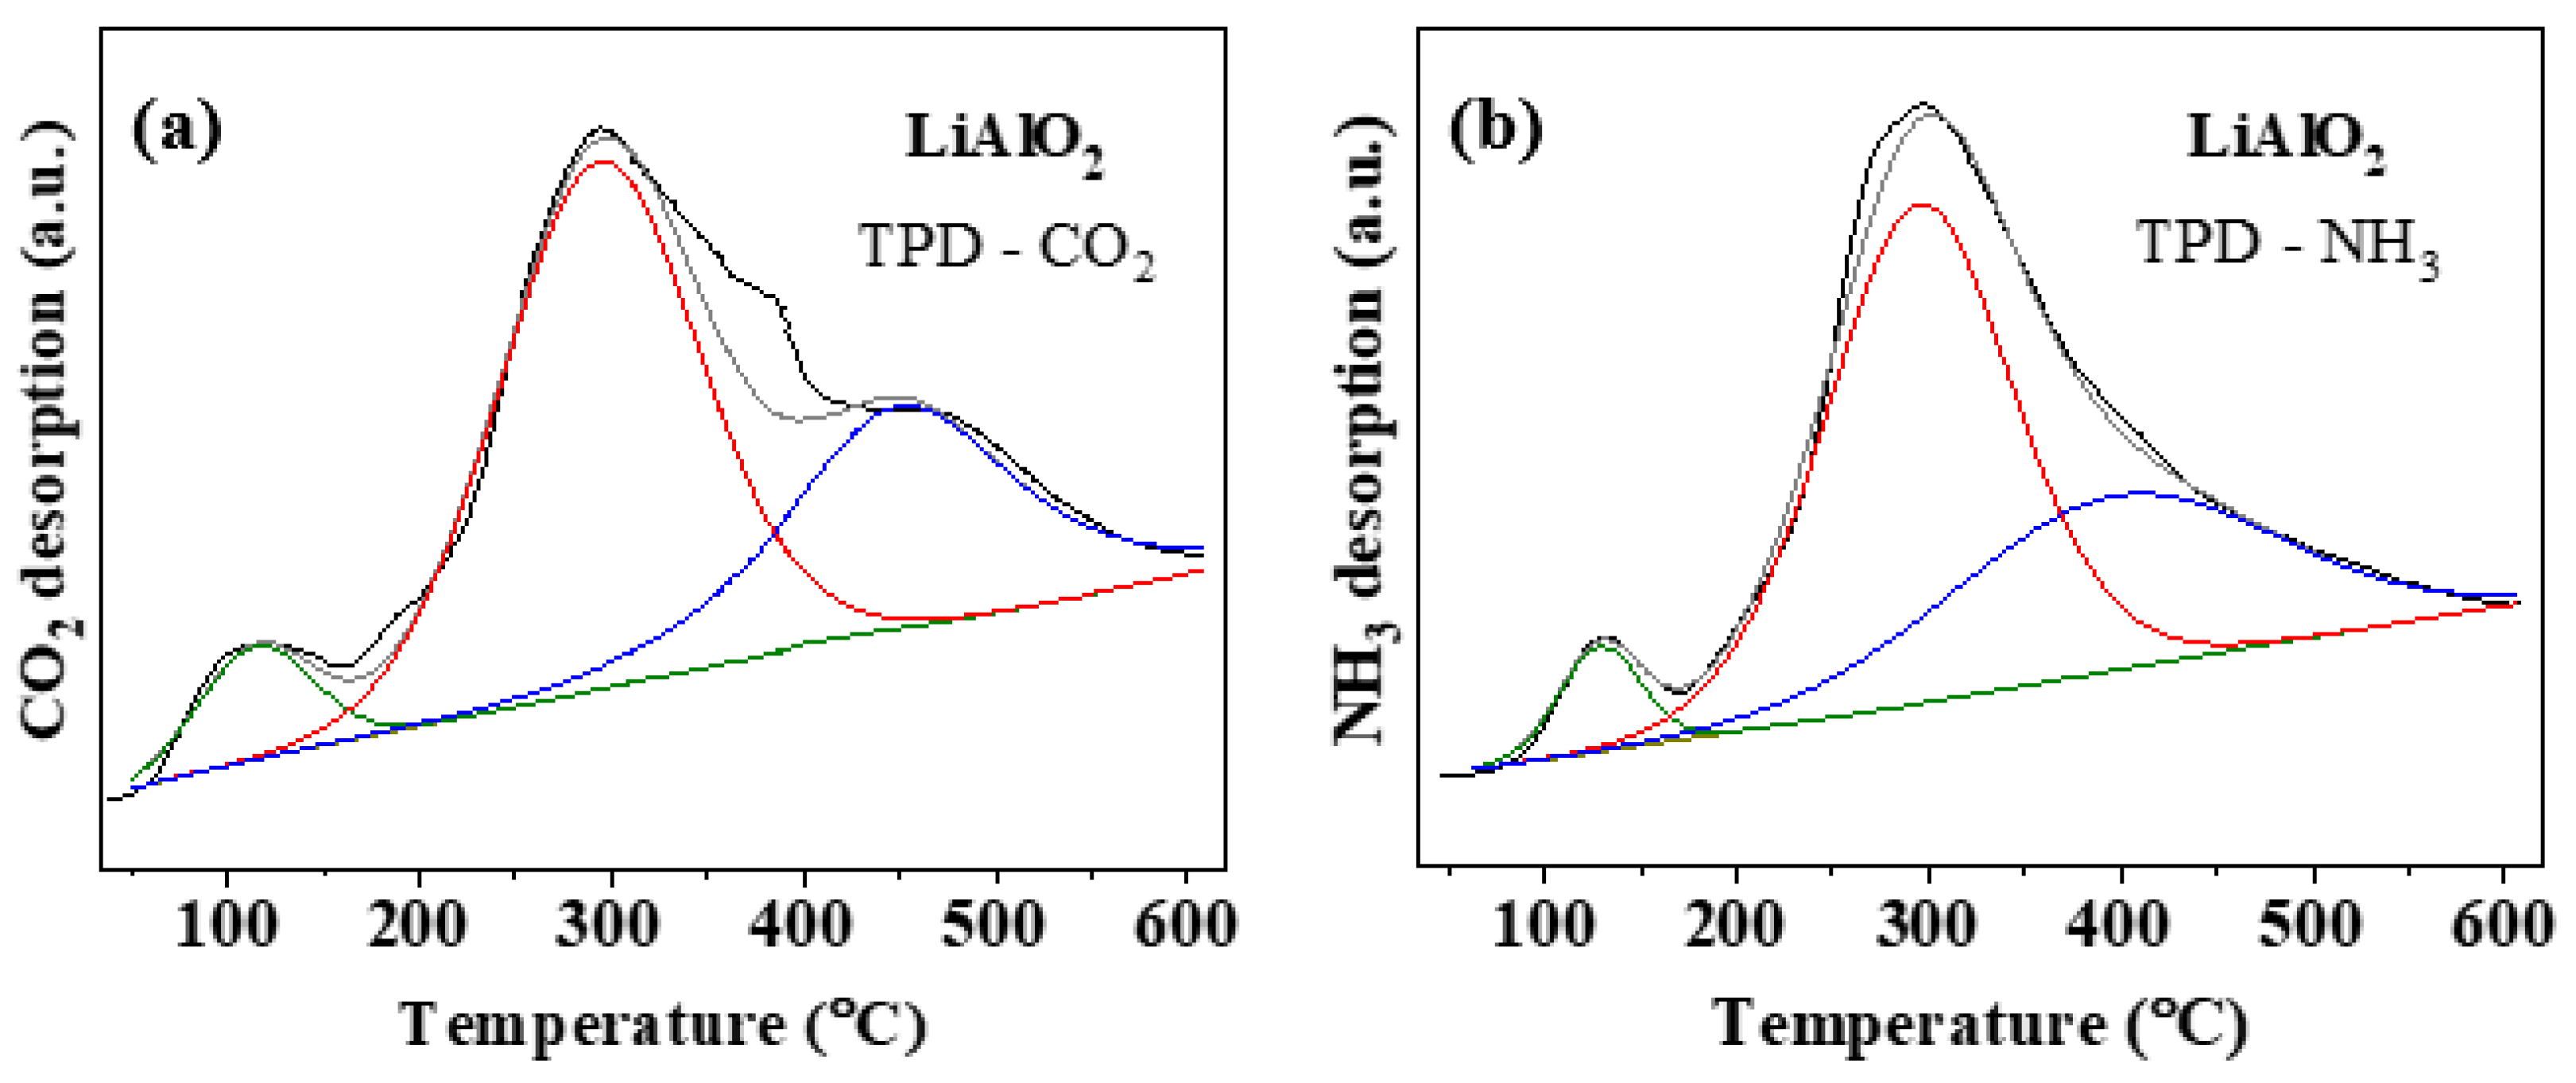
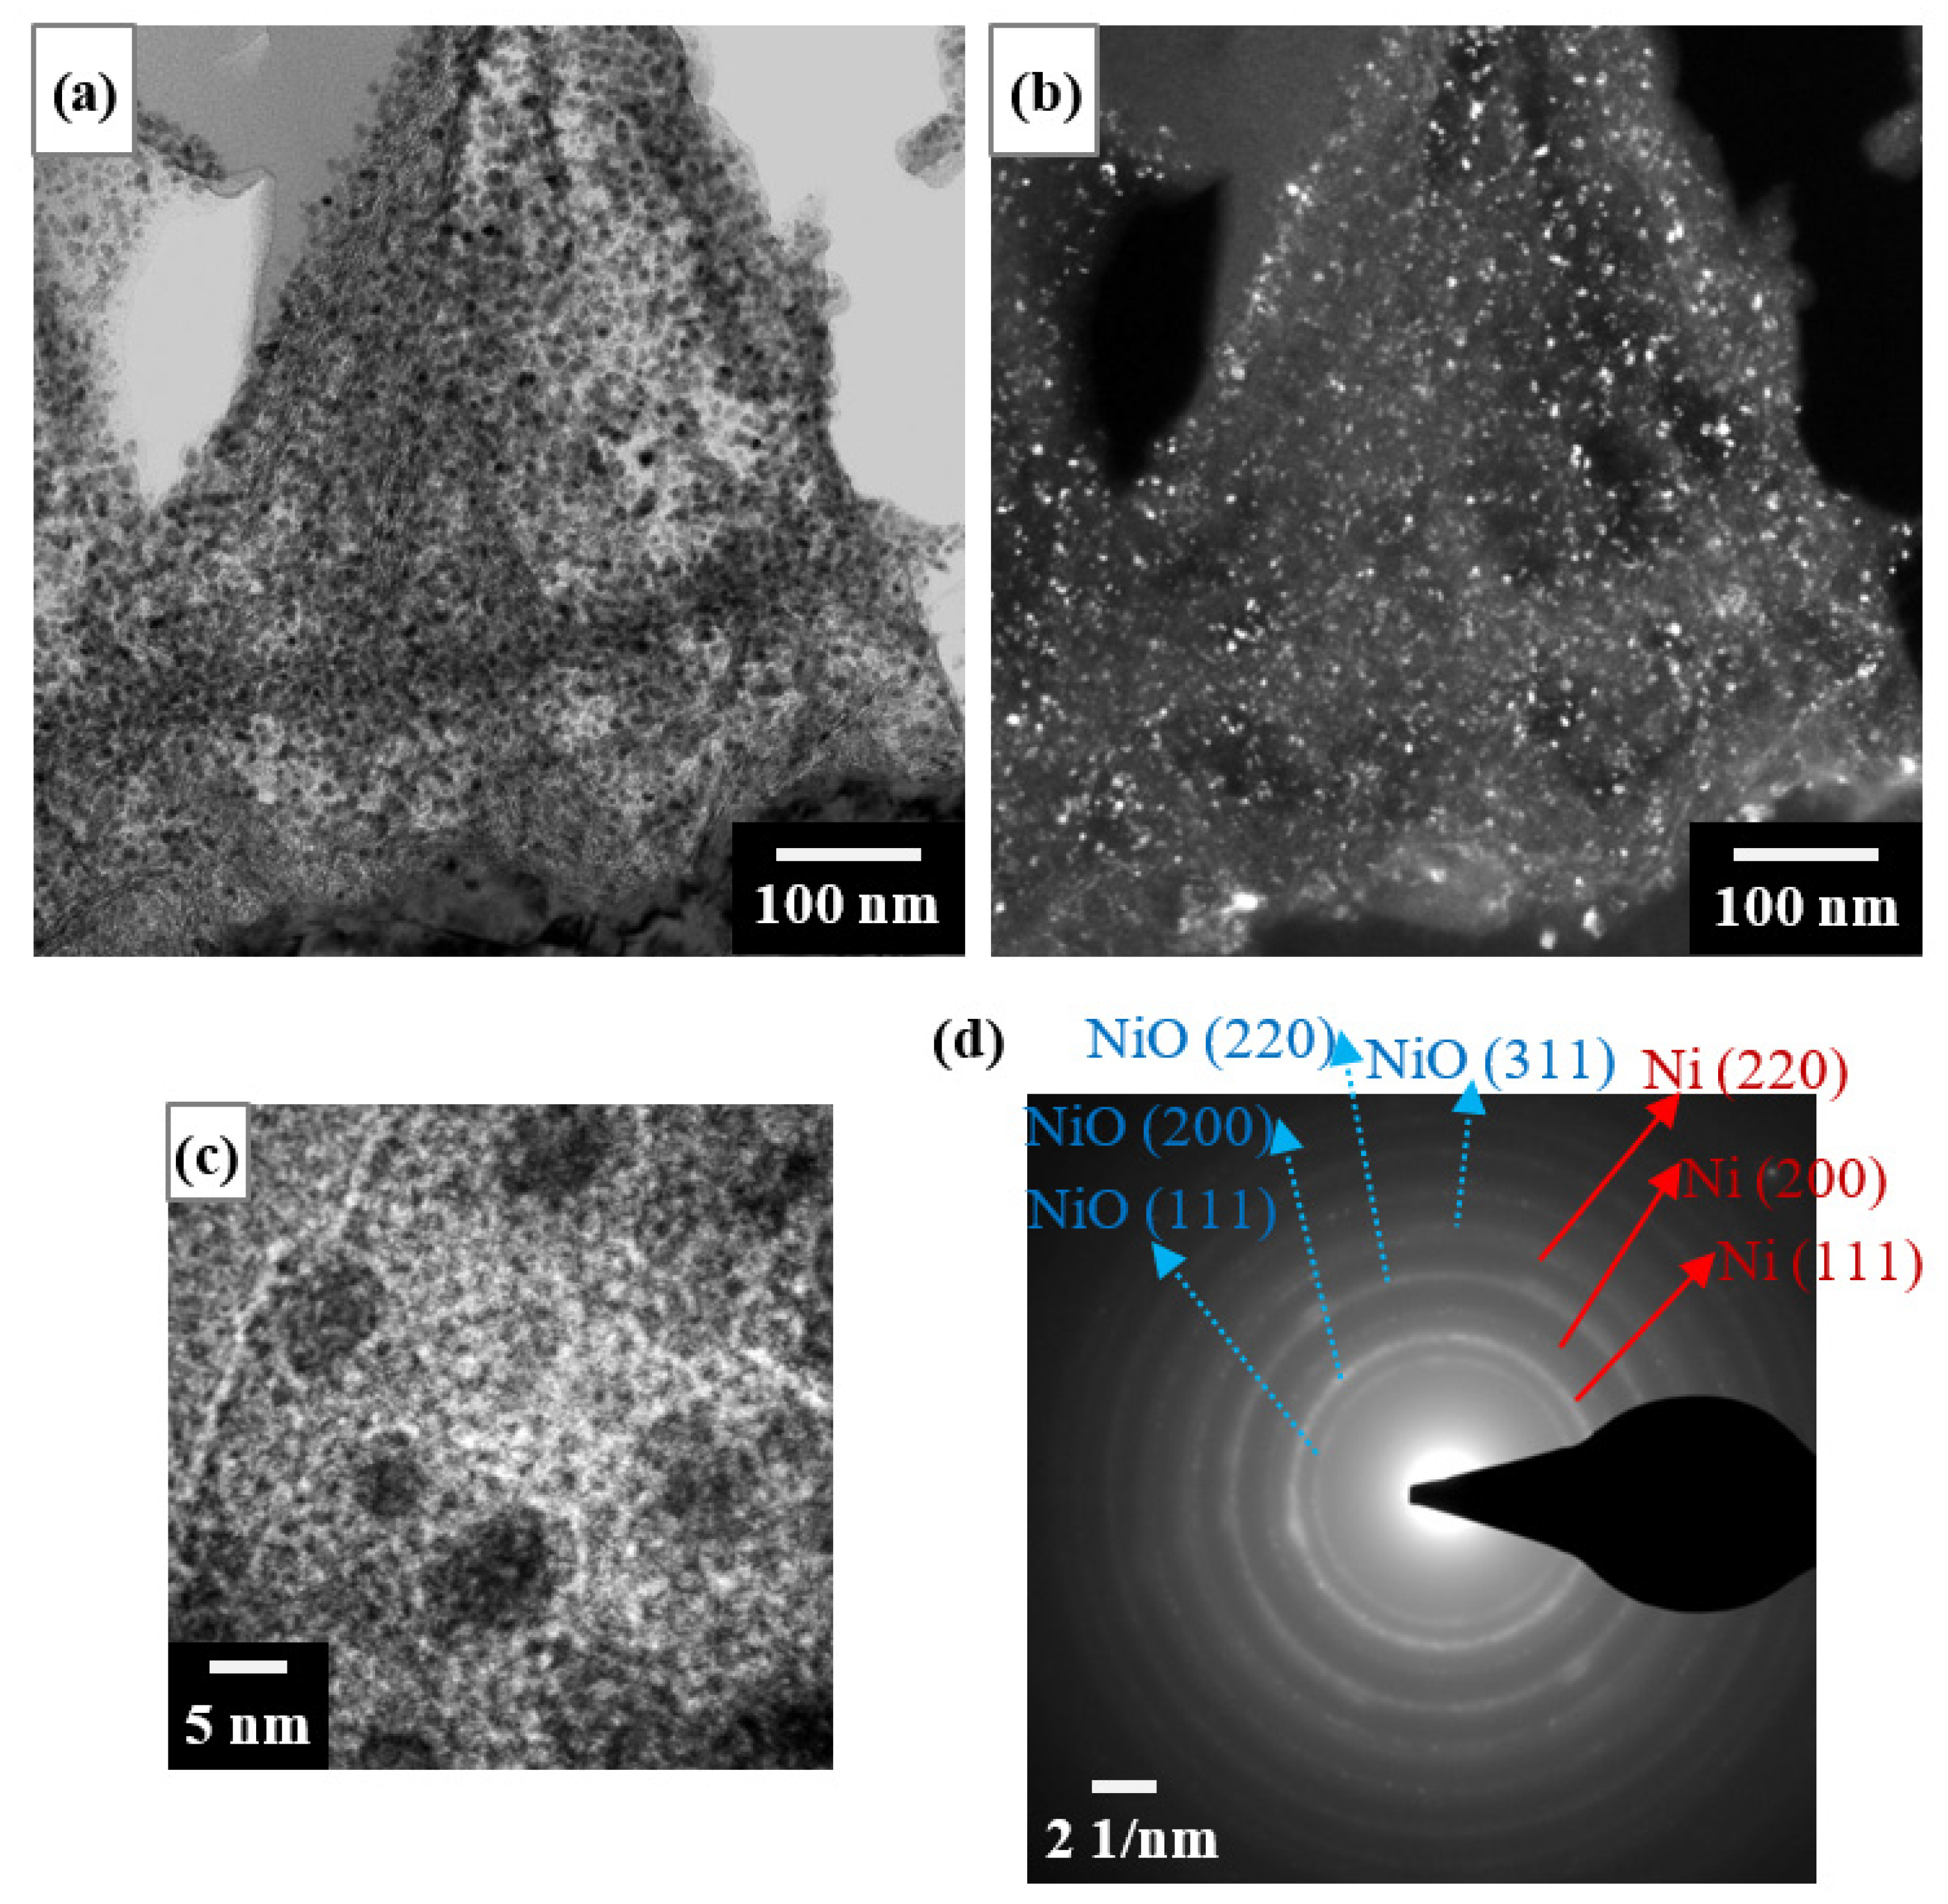
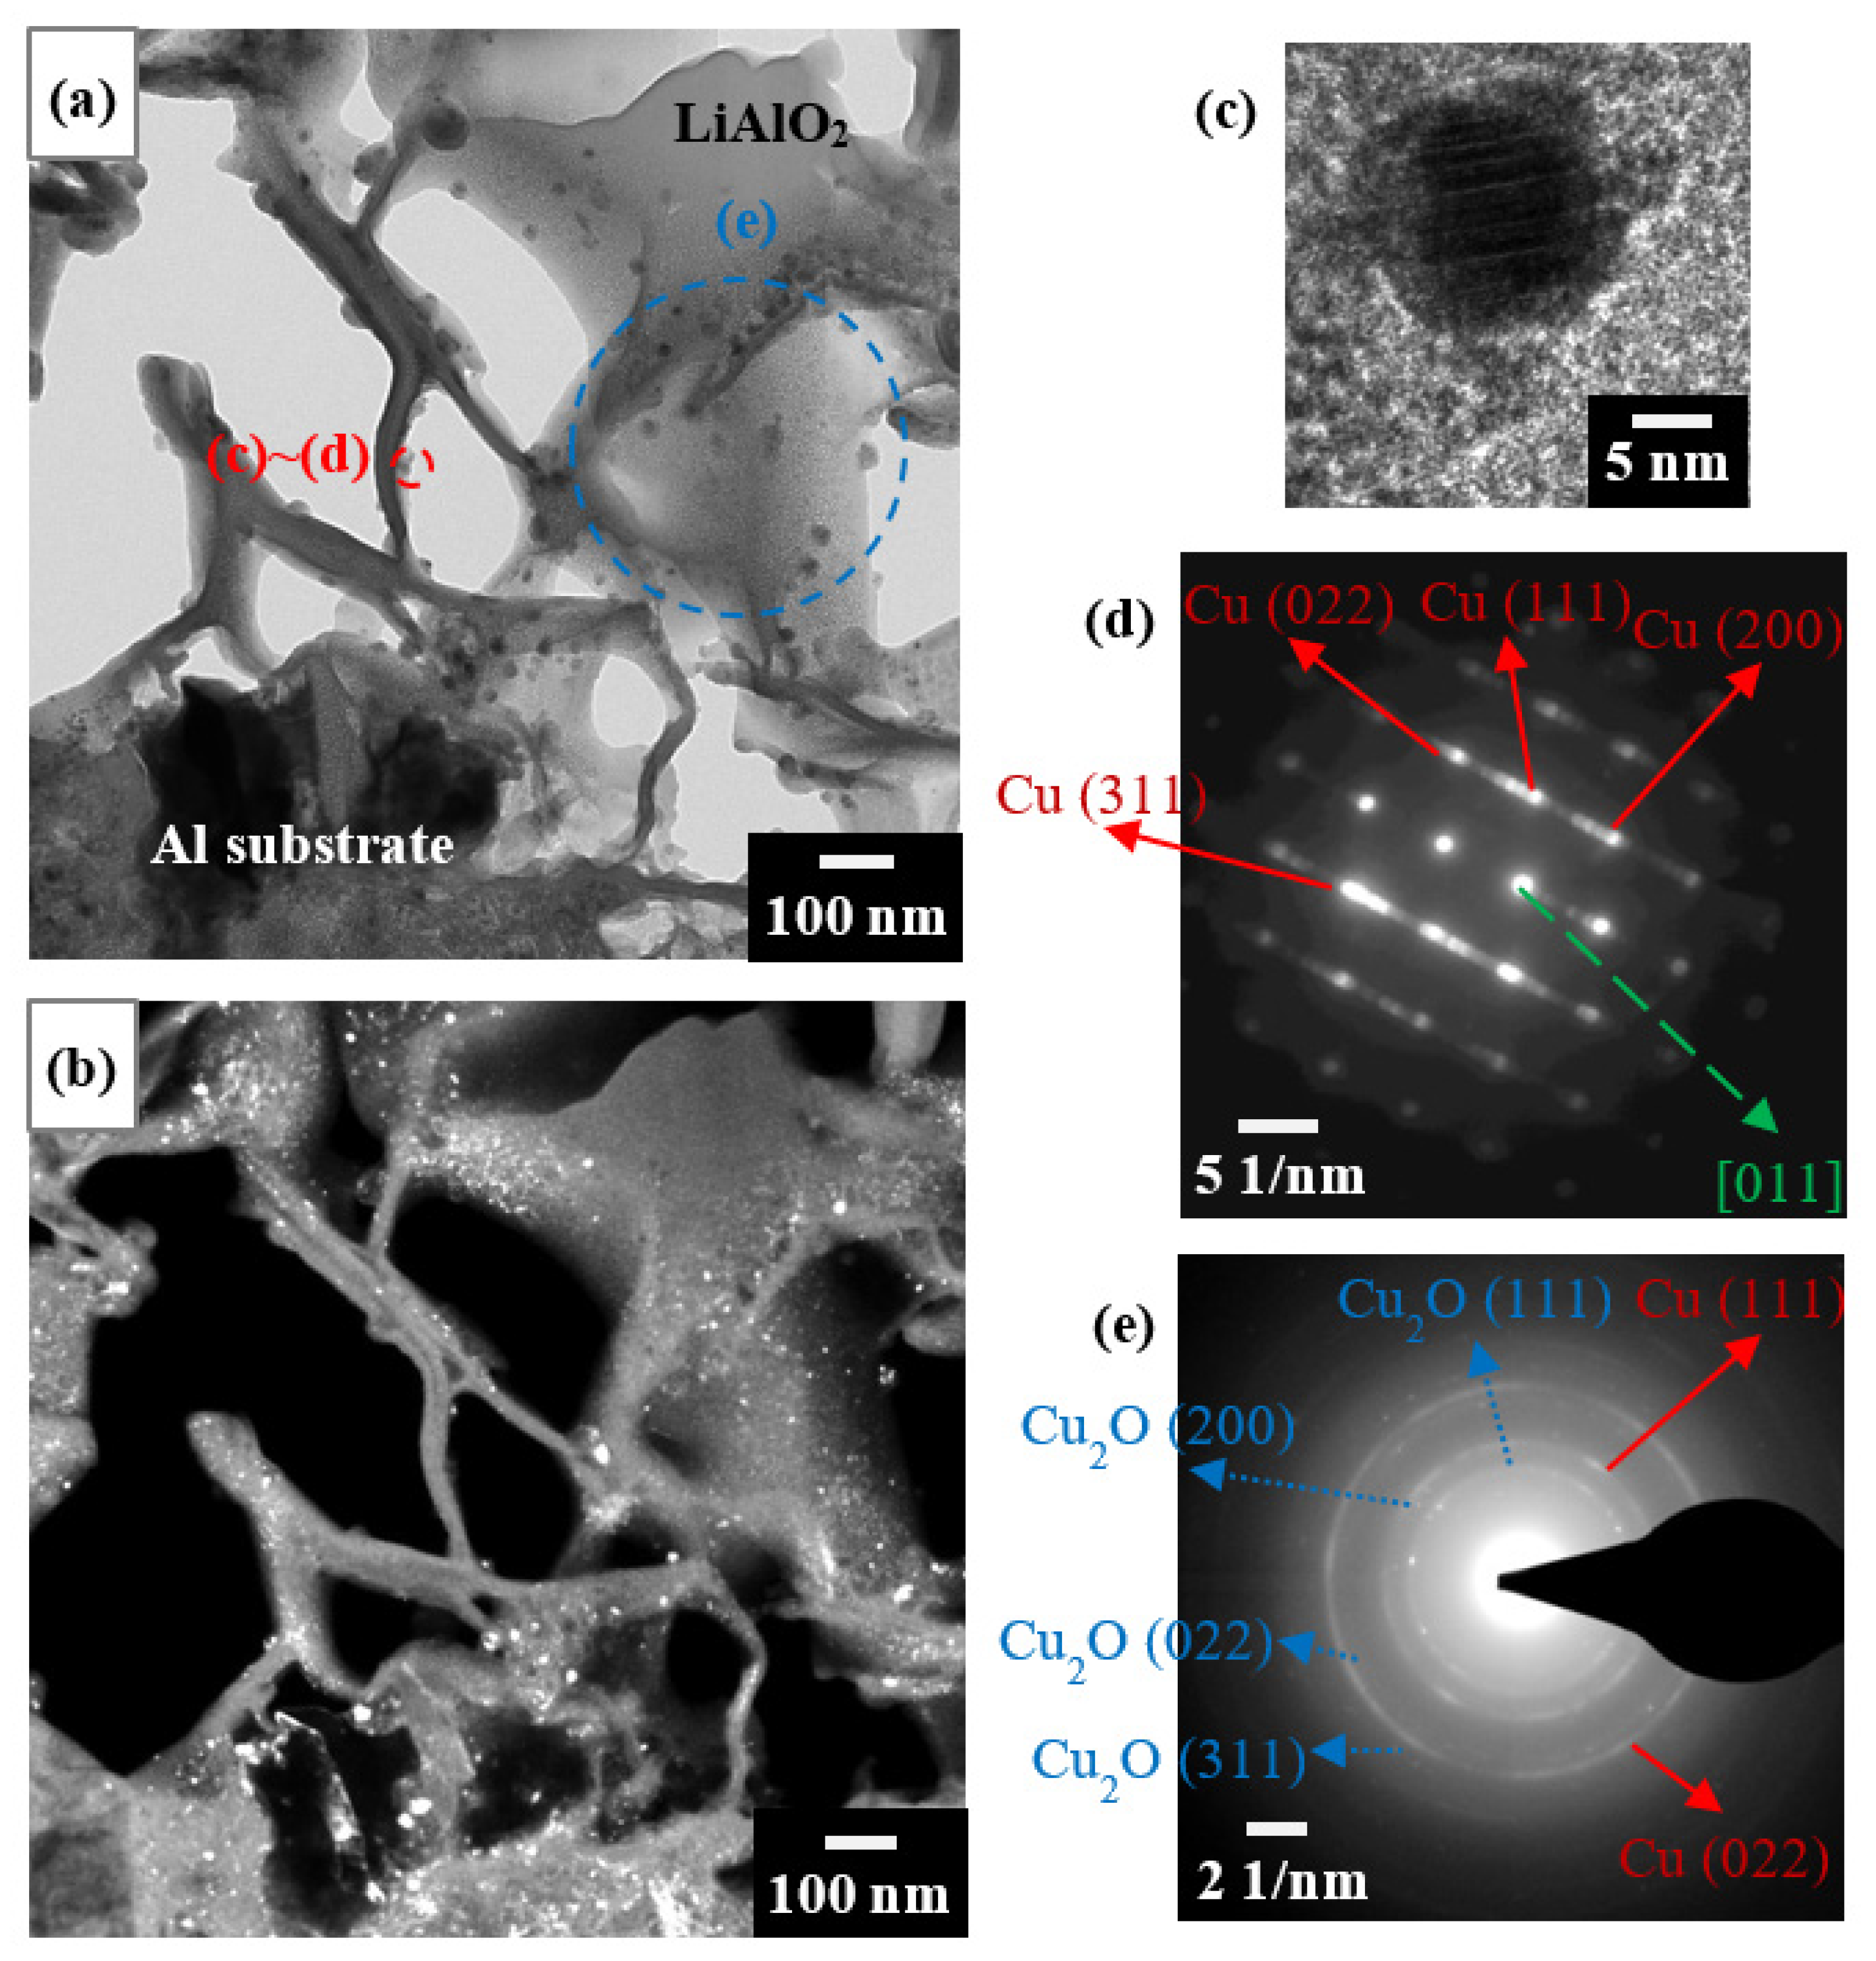
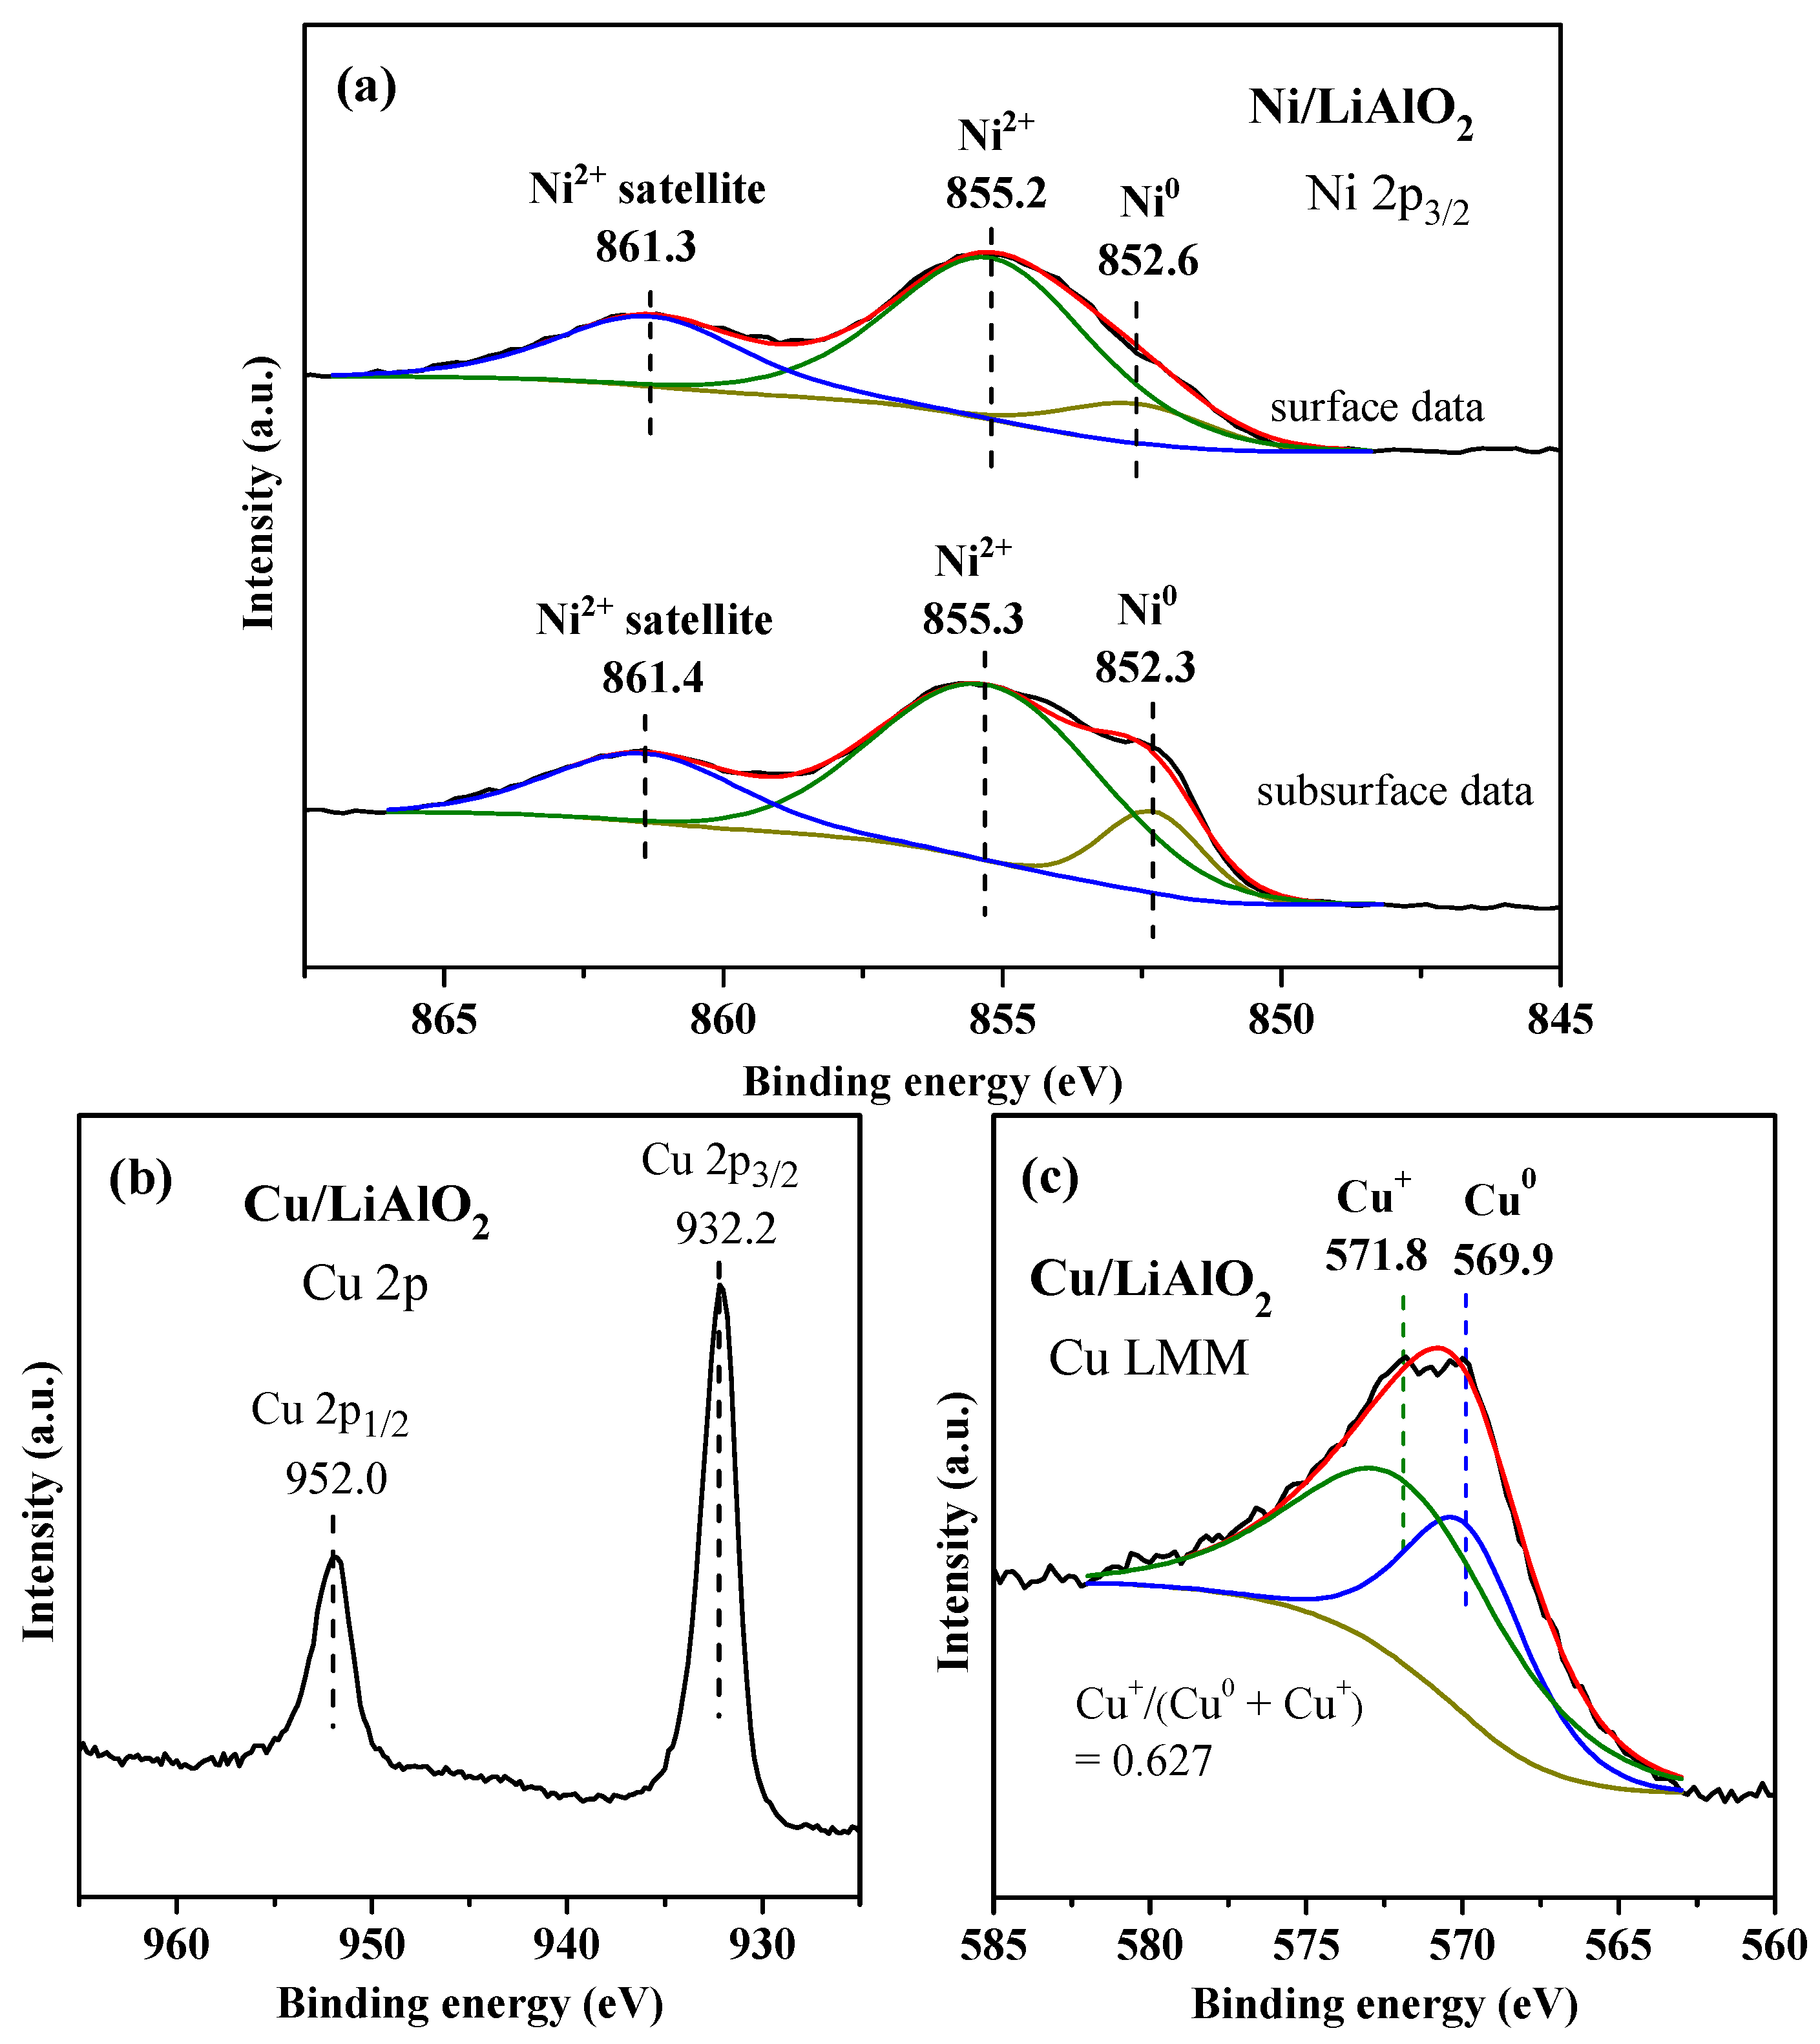
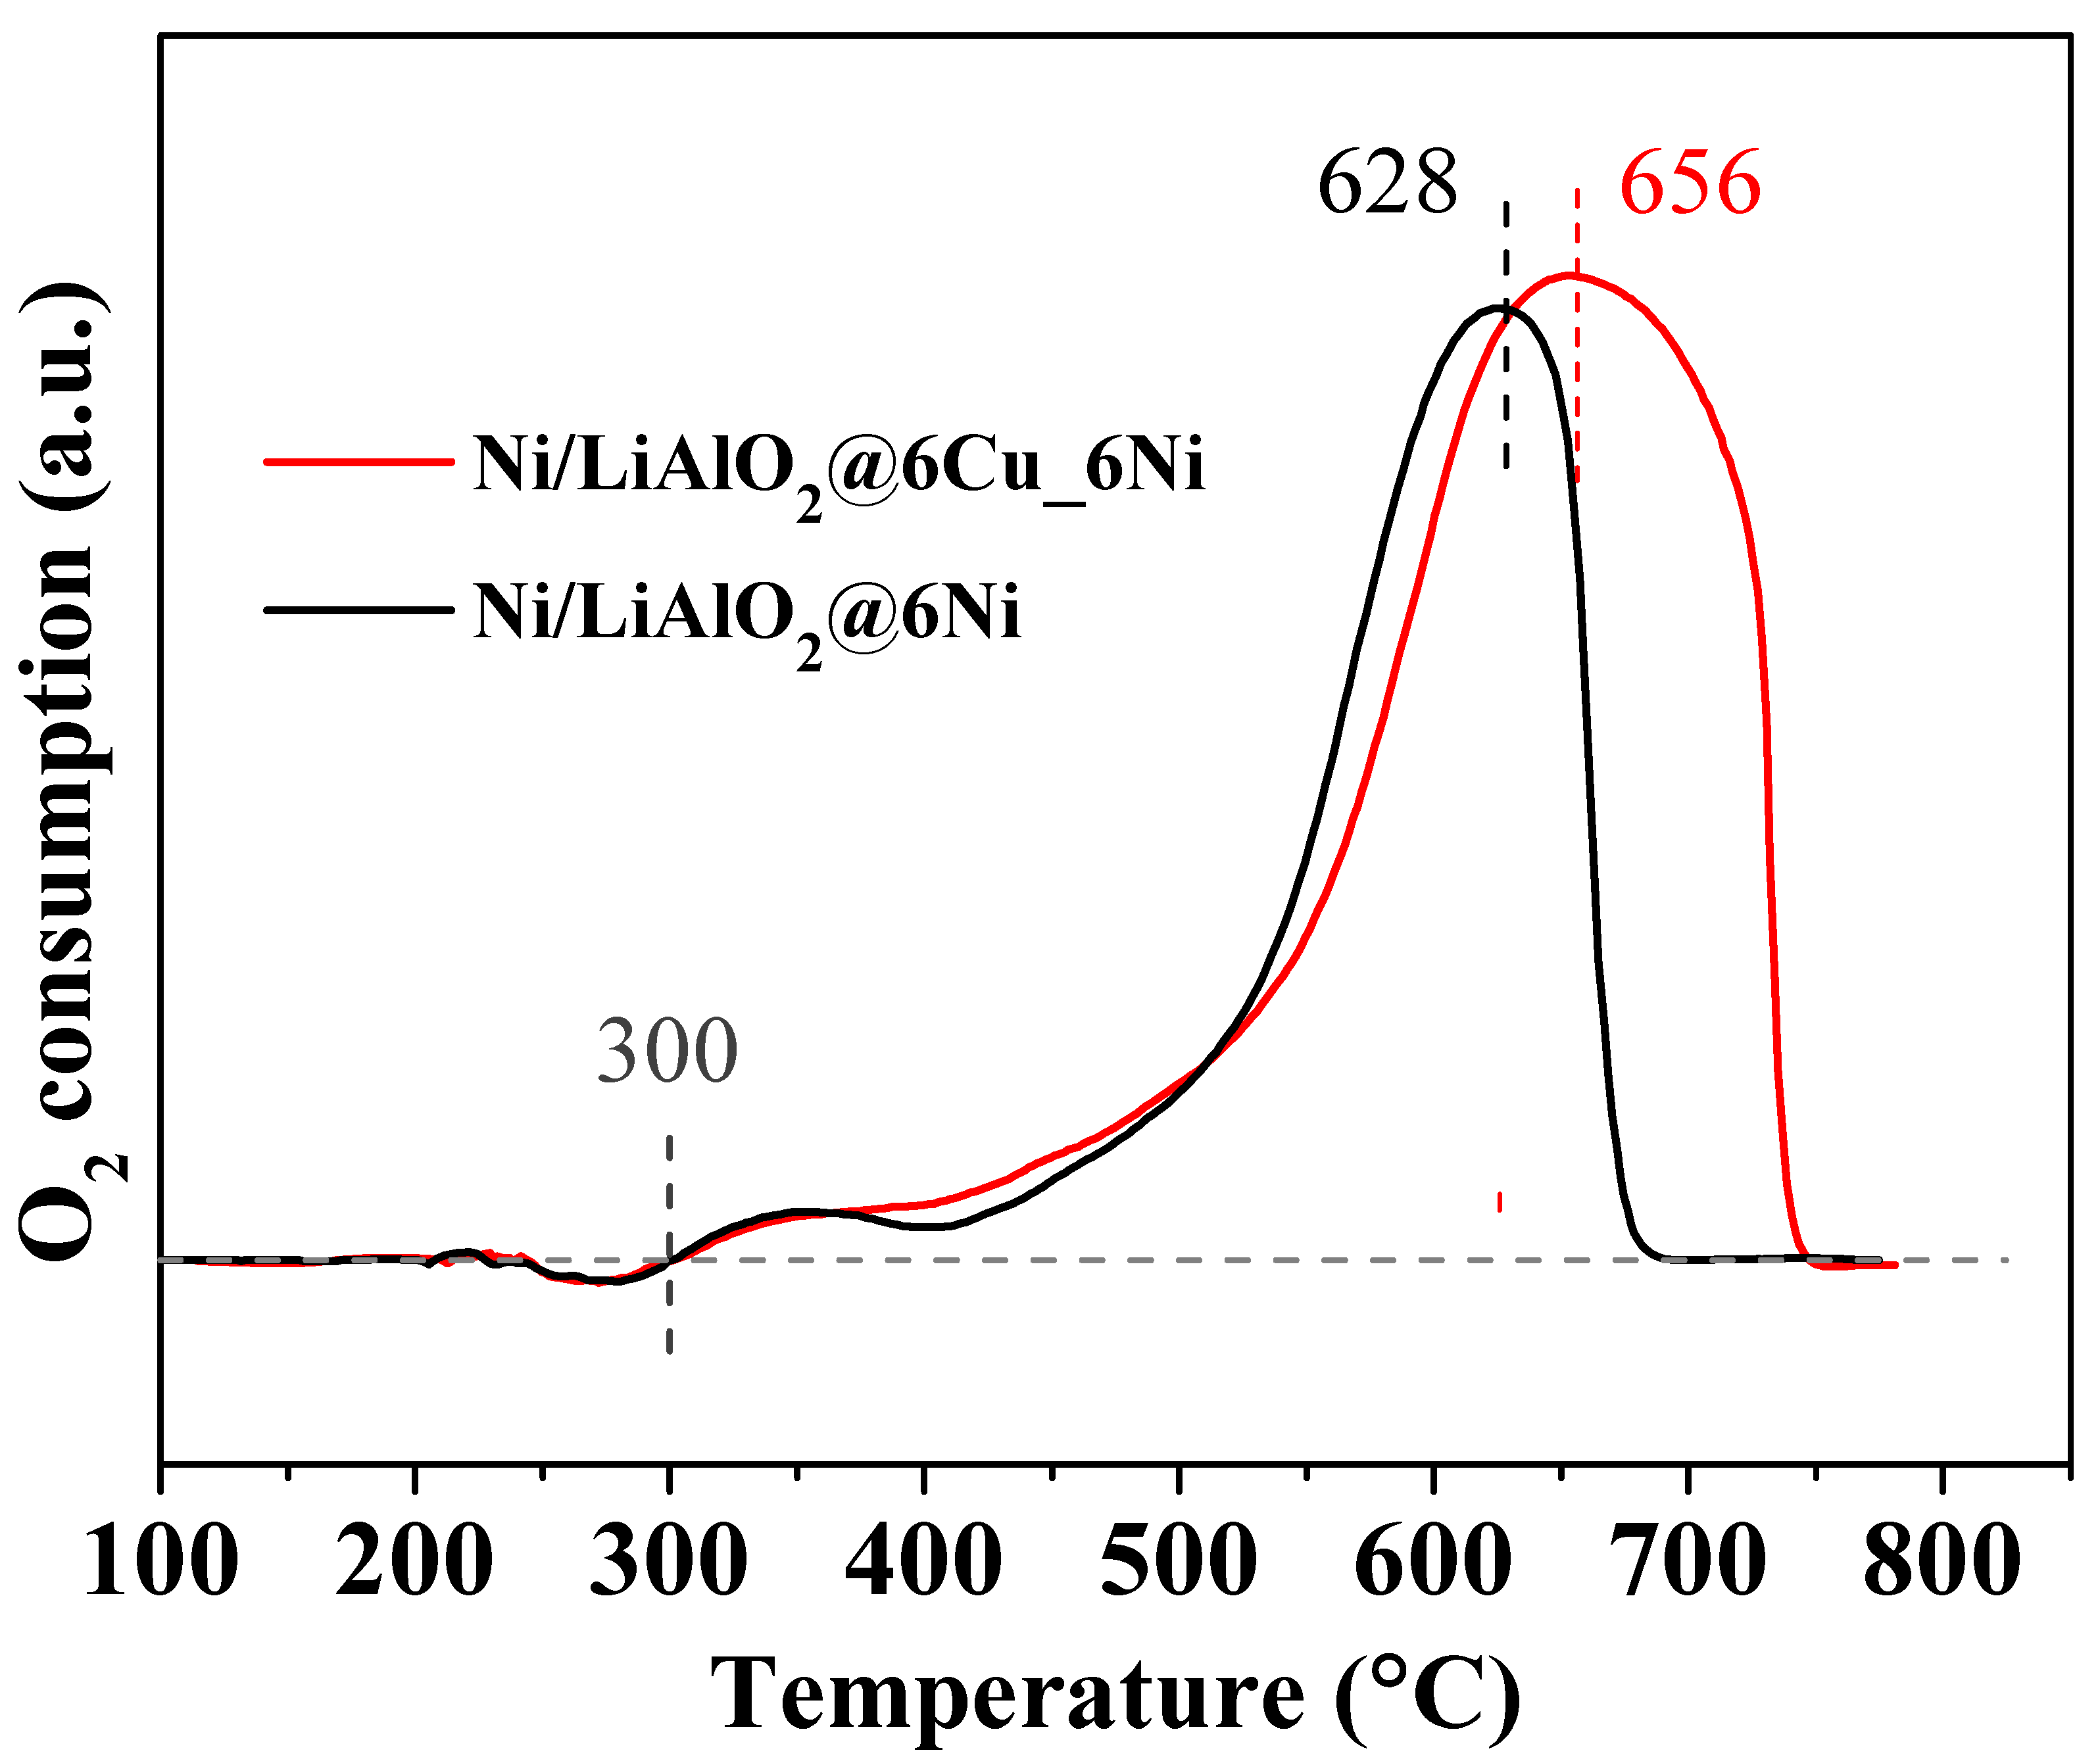
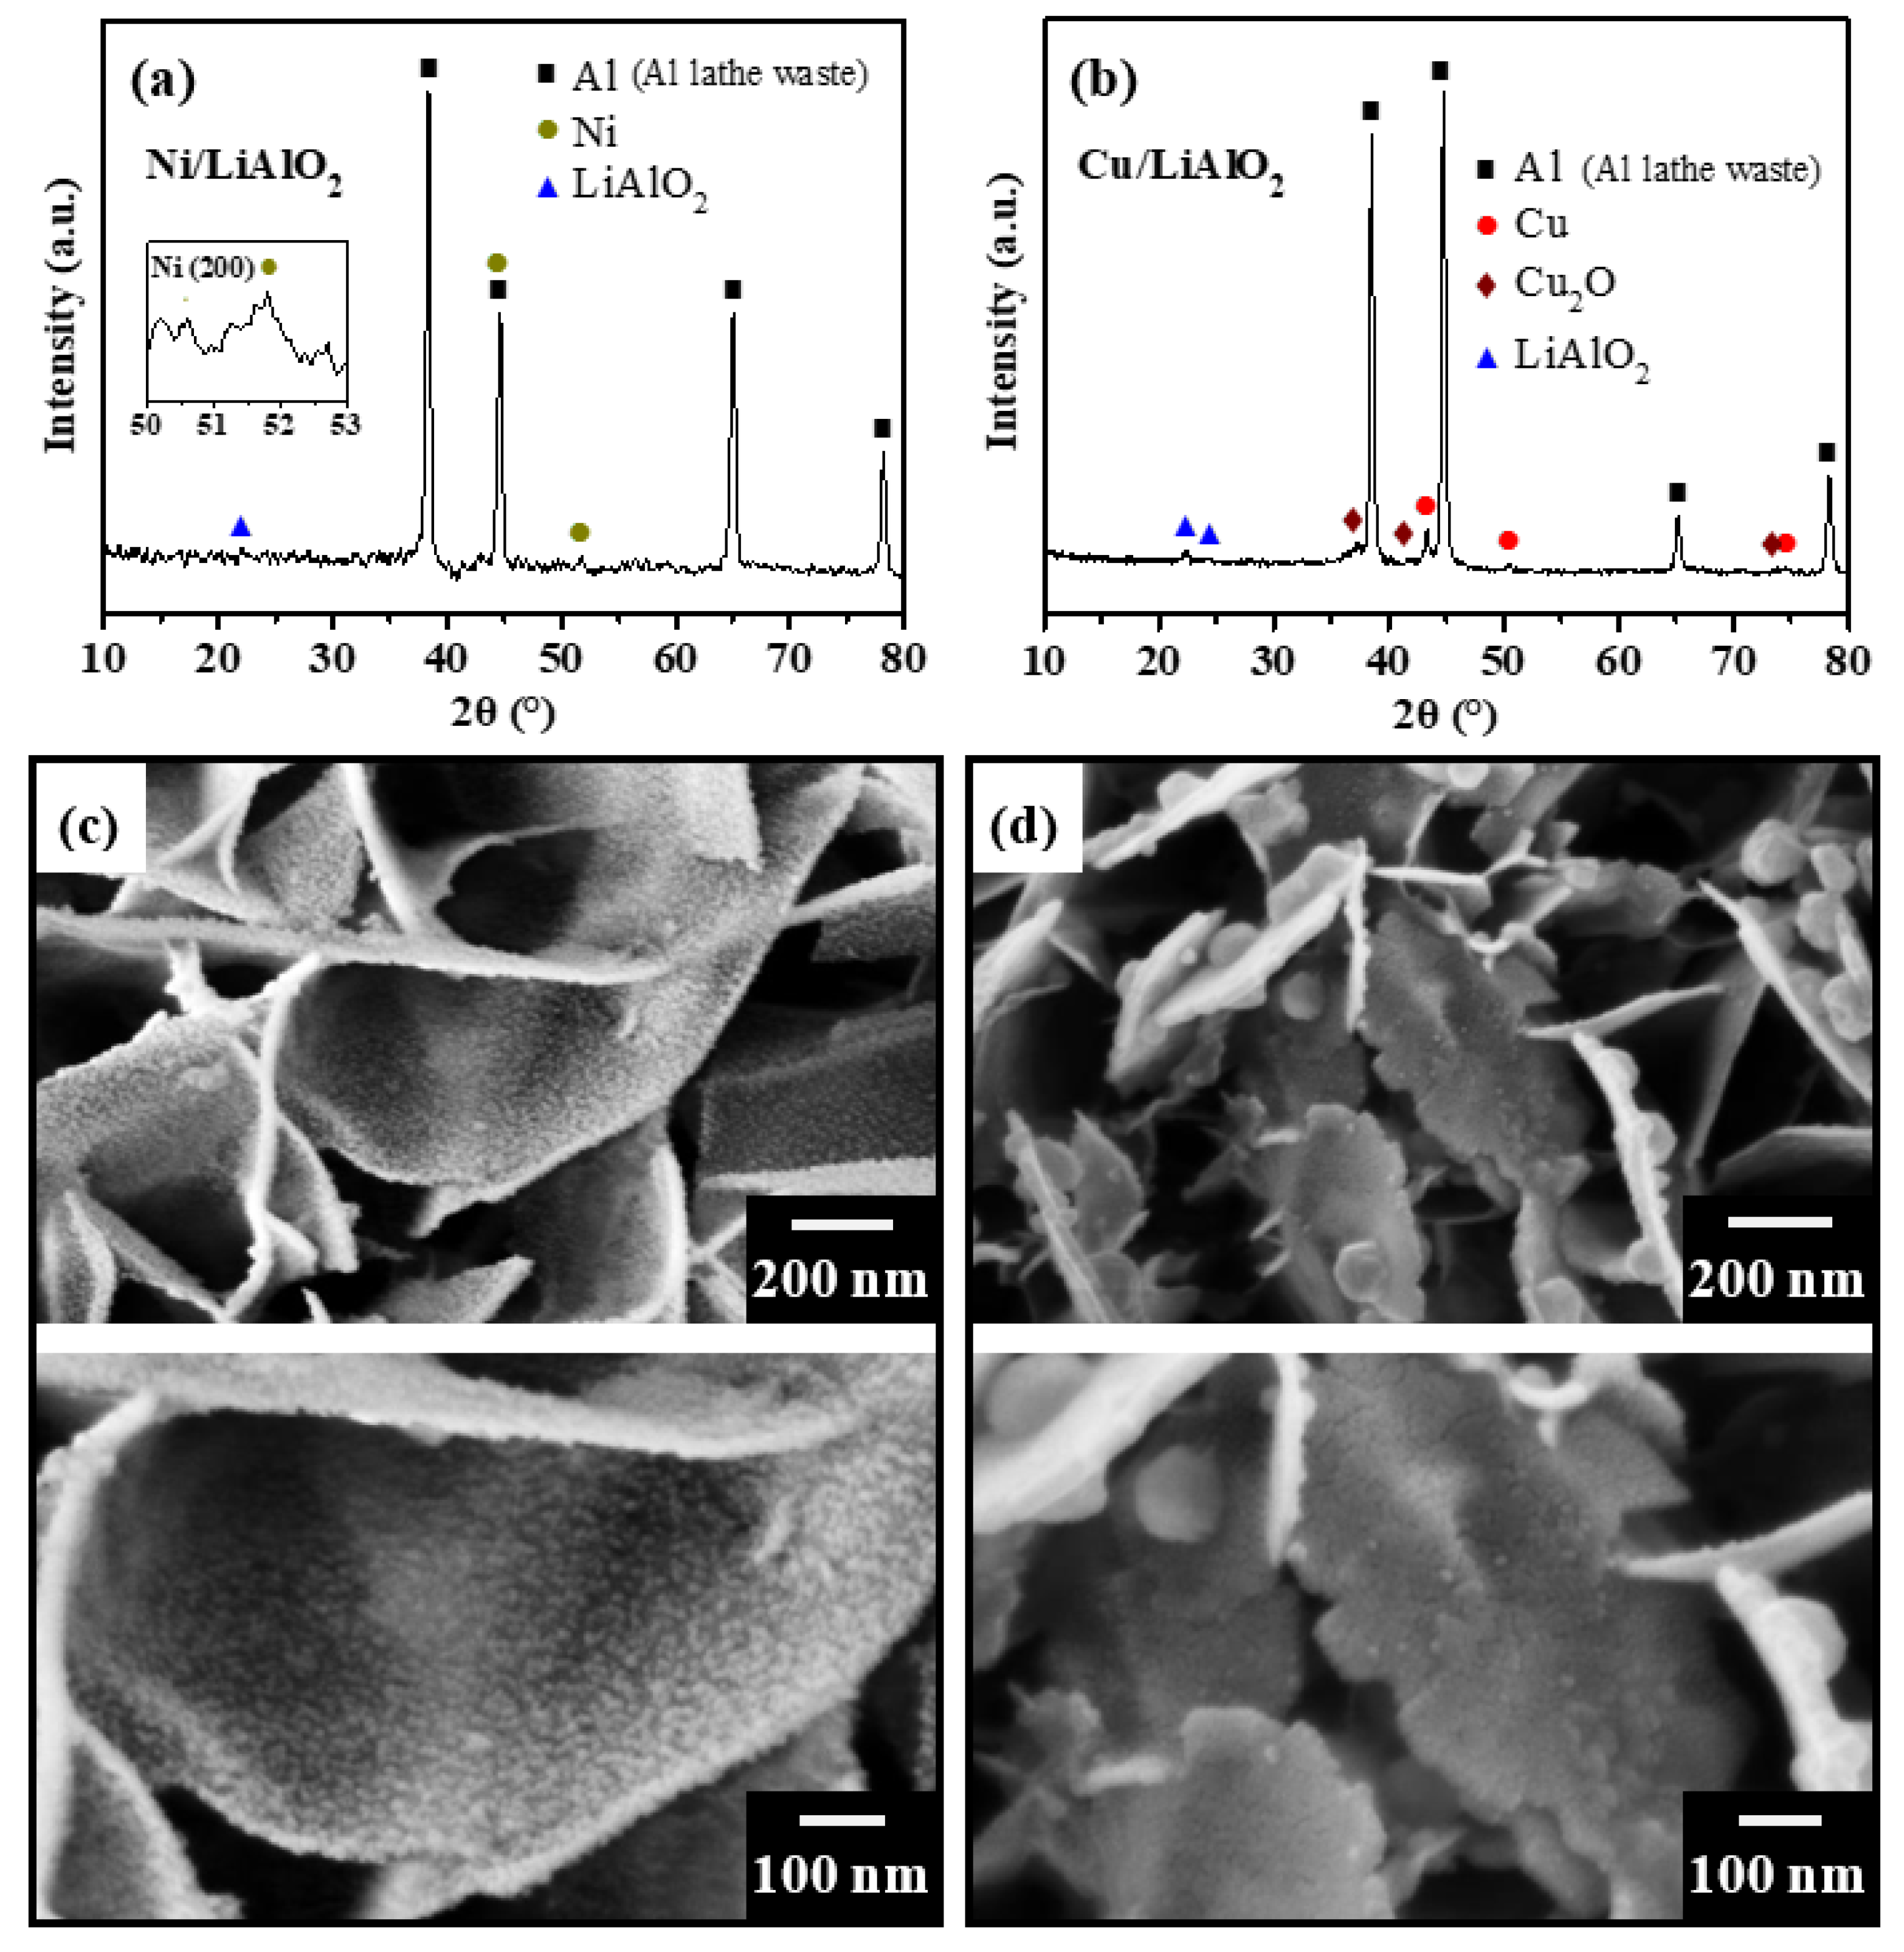
2.1. Catalyst Characteristics

Figure 1a presents the XRD pattern of the as-prepared Li–Al–CO3 LDH that was coated on aluminum lathe waste by electrodeposition. Diffraction peaks of Li–Al–CO3 LDH (JCPDS 42-0729), as well as those of the aluminum substrate, are observed, suggesting that the electrodeposition method deposited Li–Al–CO3 LDH on the aluminum substrate. Figure 1b shows the XRD pattern of this coating following calcination treatment at 500 °C for 3 h. Huang et al. [27] and our previous study [17] suggested that Li–Al–CO3 LDH transferred into mixed metal oxides with low crystallinity after it was heated at 400~500 °C. Accordingly, in Figure 1b, only two weak peaks at around 22.3° and 24.3°, corresponding to LiAlO2 (JCPDS 75-0905), are obtained. Figure 1c displays SEM surface morphologies of the as-prepared Li–Al–CO3 LDH coating on aluminum lathe waste. Li–Al–CO3 LDH had vertical platelet-like structures and densely covers the surface of the aluminum substrate. Calcination at 500 °C for 3 h did not change the surface morphology of the coating, but it slightly distorted the platelets (as shown in Figure 1d). The results in Figure 1d proved that the nano-structured catalyst support was not destroyed during high-temperature calcination.
The basicity and acidity properties of the LiAlO2 support were studied by temperature programmed desorption (TPD). Figure 2a,b present TPD-CO2 and TPD-NH3 profiles of the LiAlO2 support, respectively. The CO2 desorption curve (shown in Figure 2a) reveals the basicity property of the sample. In Figure 2a, a small peak appears at a low temperature of 115 °C, corresponding to the weak Brønsted basic sites (−OH). At 200–400 °C, the strong peak represents that CO2 was desorbed from the moderate Lewis basic sites (Li+−O2− pairs). At high temperature range (400–600 °C), a minor peak indicates the strong basic sites (isolated O2−) [18]. The NH3 desorption curve shown in Figure 2b, on the other hand, reveals the acidity property of the sample. In Figure 2b, the desorption curve of NH3 presents three peaks corresponding to the weak (100–200 °C), medium (200–400 °C), and strong (400–600 °C) acid sites. They are mainly associated with the absorption of NH3 by Lewis acid sites (Al3+−O2− pairs) with various strengths [28].
Table 1 presents the fractions of different sites (weak, medium, and strong sites) of the total number of CO2/NH3 desorption sites on LiAlO2 according to the TPD profiles. As revealed in Table 1, the medium basic/acidic sites account for the largest proportion of the total number of basic/acidic sites, with fractions of ~60%. The total number of basic sites is greater than the total number of acid sites, and the ratio of the two is 1.44. Choong et al. [28] added various amounts of Ca onto Al2O3; the ratio of basic/acidic sites increased with the amounts of Ca addition. Their experimental results confirmed that the appreciated amounts of Ca addition could suppress the ethanol dehydration reaction (Equation (3)) and reduce the formation of ethylene in ESR compared with the result of pure Al2O3. The performance of LiAlO2 support in ethanol decomposition is discussed in the following Section 2.2.
Figure 3 presents XRD patterns and the SEM surface morphologies of the reduced catalysts (the catalyst after reduction reaction in H2 atmosphere at 500 °C). The XRD pattern of Ni/LiAlO2 (Figure 3a) includes a broad, weak characteristic peak of Ni (200) at 51.9°. The characteristic peak of Ni (111) is very close to that of Al (111) at 44.5° and is therefore difficult to distinguish. The broad and weak peaks are considered to arise from tiny particles with high dispersion [29]. The XRD pattern of Cu/LiAlO2 (Figure 3b) includes peaks of Cu (at 43.3°, 50.5°, and 74.1°) and Cu2O (at 36.4°, 46.3°, and 73.6°). The SEM surface morphologies of the Ni/LiAlO2 catalyst in Figure 3c show nanoparticles (~10 nm in size) at high density on the surface of LiAlO2 platelets. In contrast, concerning the Cu/LiAlO2 catalyst, shown in Figure 3d, the particles on the LiAlO2 platelets are sparsely distributed. The sizes of the particles on the Cu/LiAlO2 catalyst varied significantly. The larger particles had diameters of about 100 nm while some of the tiny particles had diameters of about 10 nm.
Figure 4 presents TEM cross-sectional images of the Ni/LiAlO2 catalyst. As shown in Figure 4a, nanoparticles were densely and uniformly distributed on the LiAlO2 platelets. The corresponding TEM dark field image (Figure 4b) shows bright nanoparticles. Figure 4c magnifies the particles in Figure 4a, which have sizes of around 10 nm. Figure 4d shows the diffraction ring pattern of the selected area in Figure 4c. As shown in Figure 4d, the rings in the diffraction pattern are consistent with the diffraction data for Ni and NiO, suggesting that the nano-sized particles comprised Ni and NiO. Figure 5 presents TEM cross-sectional images of the Cu/LiAlO2 catalyst. The bright-field image (Figure 5a) shows nanoparticles (~less than 20 nm in size) on LiAlO2 platelets. The corresponding dark field image (Figure 5b) shows bright particles with sizes of ~less than 20 nm. Figure 5c magnifies the particle that is enclosed by the red dotted circle in Figure 5a, revealing crystal twinning. Figure 5d displays the diffraction pattern for this particle (the particle shown in Figure 5c). This pattern is associated with the diffraction plane (011) of Cu. The points in the diffraction pattern lie on lines, confirming the crystal twinning structure. Figure 5e presents the selected area diffraction pattern from the area within the blue dotted circle in Figure 5a. The indexing of the diffraction rings reveals polycrystalline Cu and Cu2O in this area. From the above observations, Cu and Cu2O nanoparticles are inferred to have formed on the Cu/LiAlO2 catalyst, despite the presence of the agglomerates that are seen in the SEM images (Figure 3d).
Figure 6 displays XPS spectra of the reduced catalysts. The XPS examination of Ni/LiAlO2 focuses on Ni 2p3/2 to identify the states of Ni (Figure 6a). As shown in Figure 6a, besides the surface data (the upper curve), the subsurface data (sputtering for 20 s) are also collected (shown as the bottom curve) for comparison. The binding energy of Ni0 is about 852.6 eV and that of Ni2+ is around 855.2 eV [30,31]. Another peak at around 861.3 eV corresponds to a satellite peak of Ni2+. The dominance of Ni2+ rather than Ni0 in the Ni 2p3/2 peak may be attributed to the high oxygen affinity of the high surface area of the small metal particles [32,33]. Compared with the surface data, the subsurface data present a more distinct peak corresponding to Ni0, which also implies that the surface of Ni nanoparticles is prone to oxidation. The Cu 2p spectrum of Cu/LiAlO2 (Figure 6b) includes main peaks at 932.2 eV and 952.0 eV, corresponding to 2p3/2 and 2p1/2 of Cu0/Cu+, respectively [34,35]. The absence of a Cu2+ satellite peak between 940 eV and 950 eV suggests the absence of Cu2+. The characteristic peaks of Cu0 2p and Cu+ 2p in the Cu 2p spectrum are too close to each other to allow them to be distinguished. The Auger electron spectrum (AES) of Cu LMM is examined to distinguish between Cu+ and Cu0 species on the Cu/LiAlO2 catalyst. As shown in Figure 6c, Cu0 and Cu+ yield peaks at the binding energy of 569.9 eV and 571.8 eV, respectively. Cu+ accounts for a high proportion (62.7%) of the total number of Cu0 and Cu+ species, revealing that the dispersal of Cu+ on the surface of Cu/LiAlO2 catalyst is higher than that of Cu0. The incorporation of copper into the LDH-based precursor makes the strong interaction with the oxygen of some Cu species, which would remain as Cu2O after H2 reduction [36]. Table 2 presents the surface elemental composition of the reduced samples examined by XPS. According to Table 2, the catalytic metal loadings on the Ni/LiAlO2 and Cu/LiAlO2 catalysts are 17.5 at.% Ni and 12.3 at.% Cu, respectively.

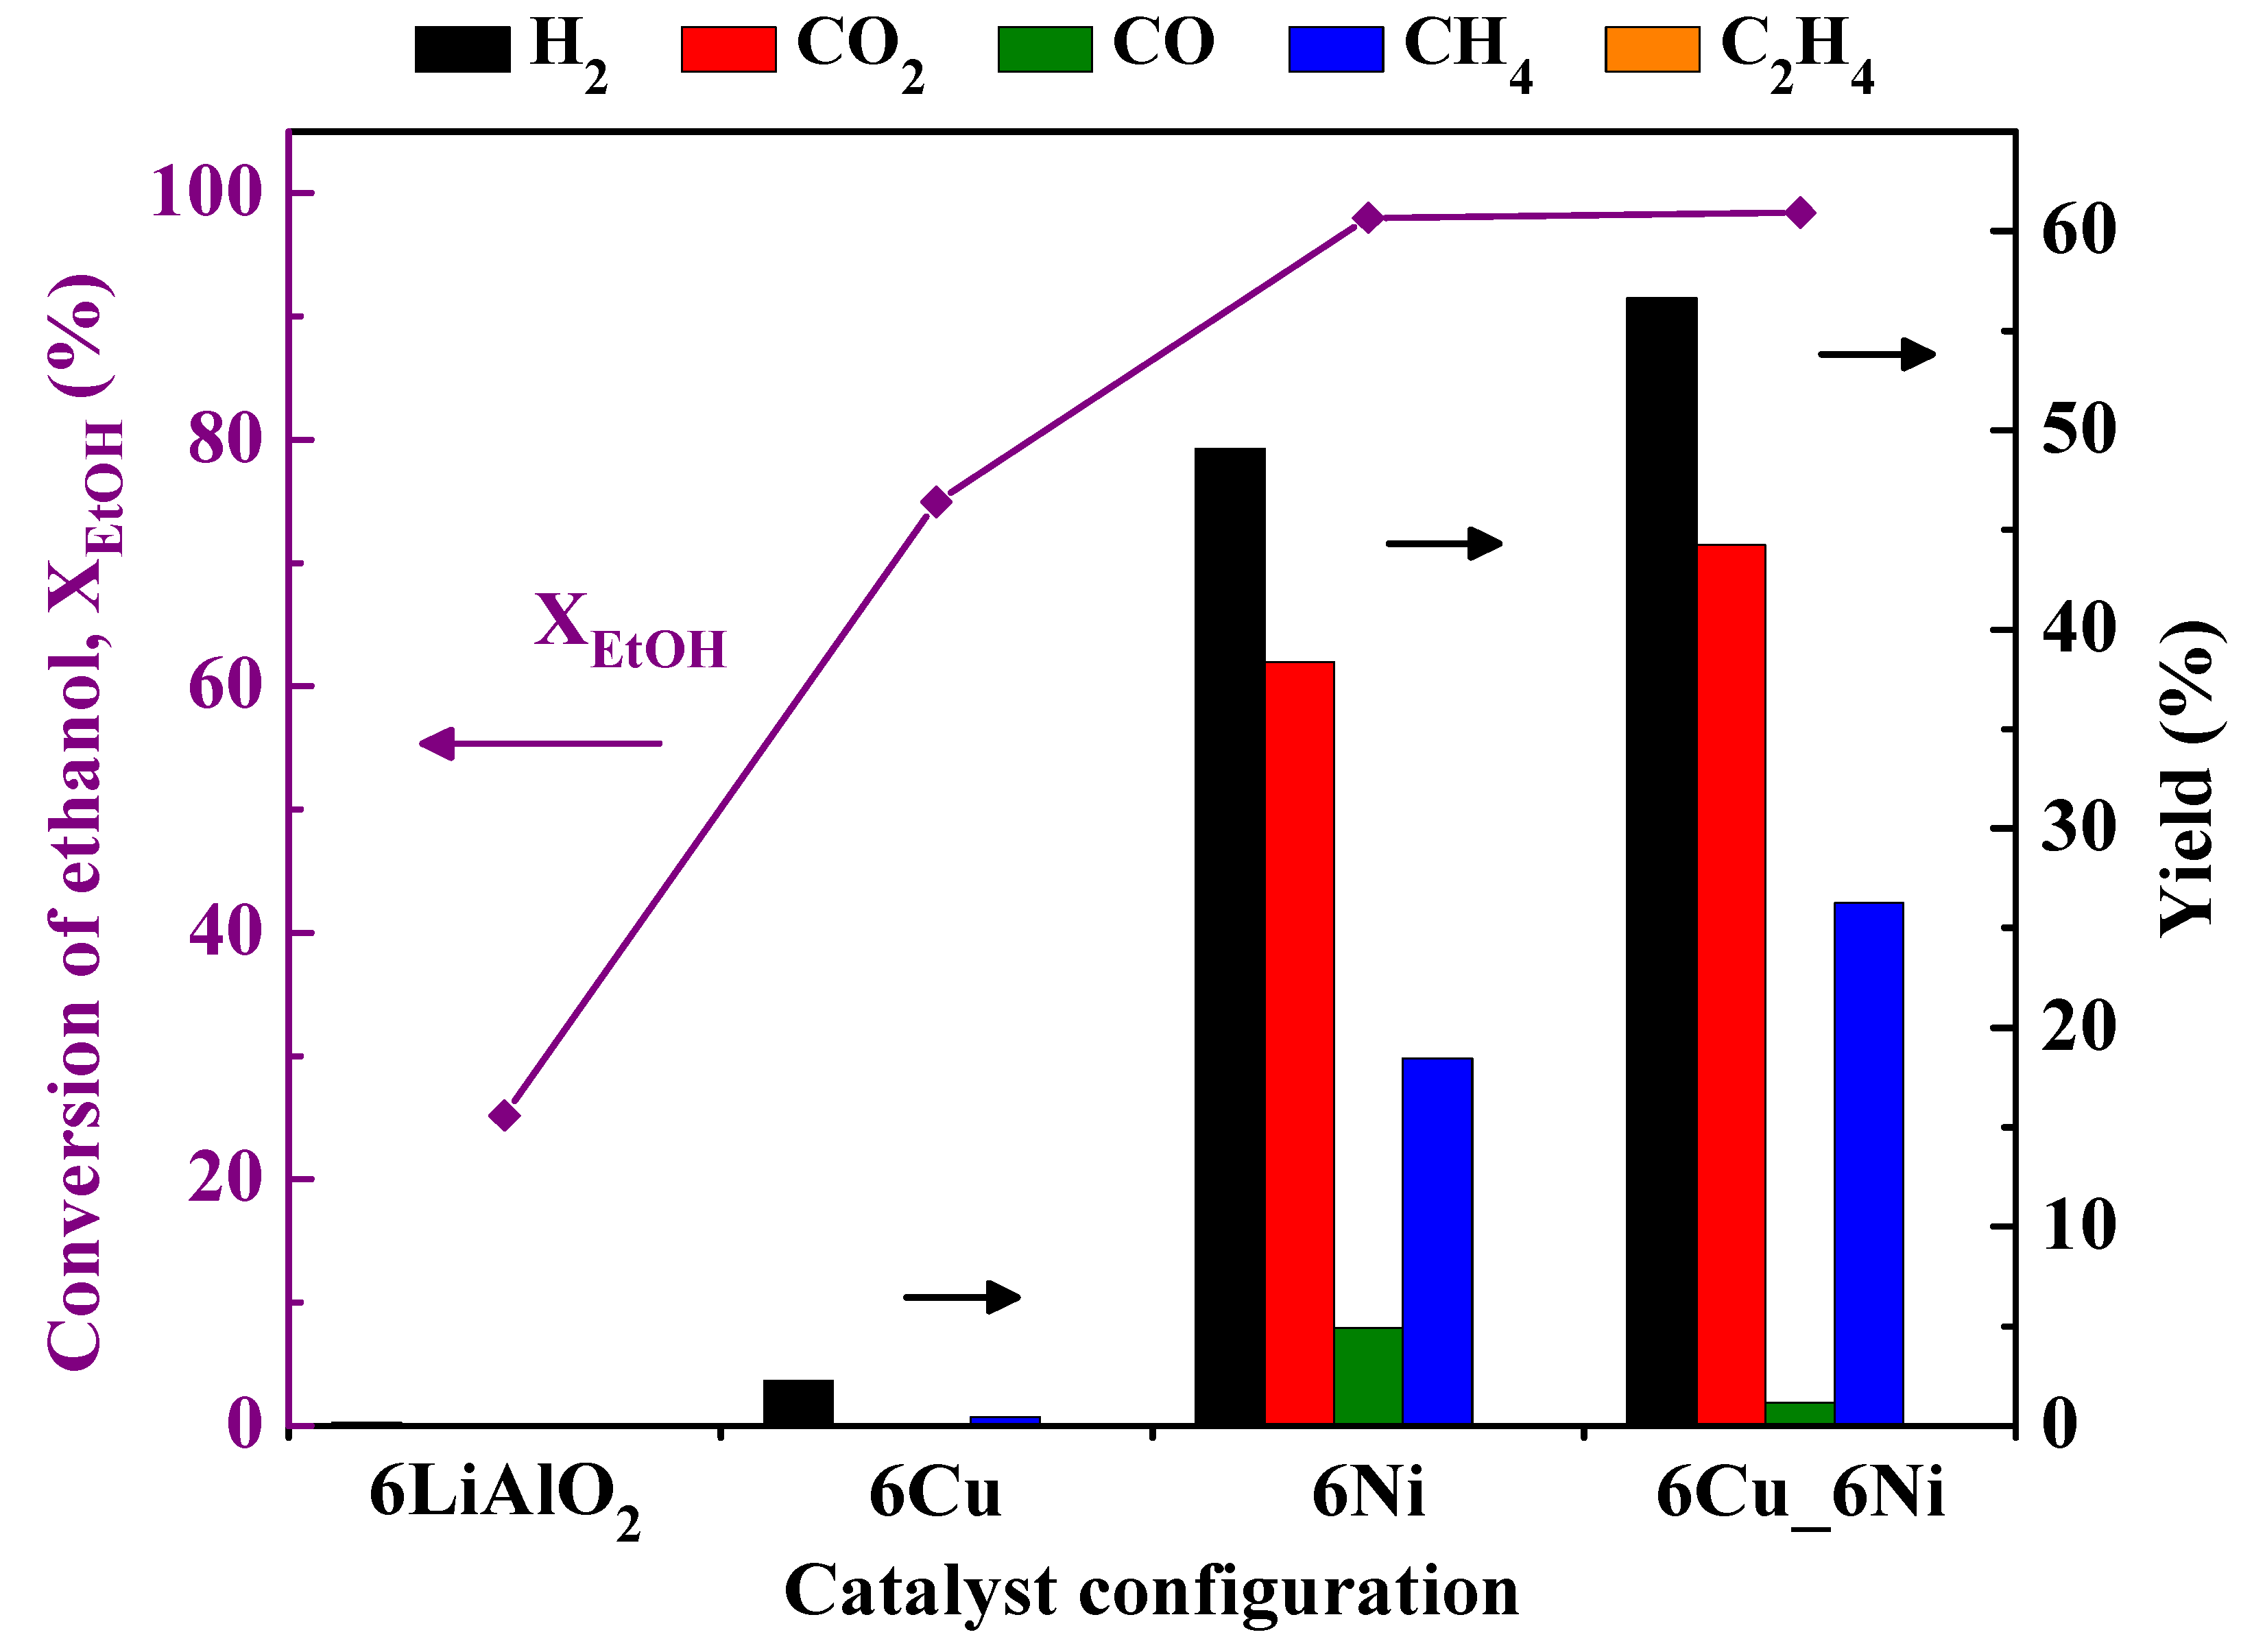
2.2. Effect of LiAlO2 Support and Cu/Ni Catalysts

Figure 7 plots the ethanol conversion (XEtOH) and yields of gas-phase products in ESR over various catalyst configurations at 500 °C. The catalyst configuration with six aluminum lathe waste strip balls with LiAlO2 on the strip surface (denoted as 6LiAlO2), was tested to determine the effect of the LiAlO2 support on ESR. As shown in Figure 7, 6LiAlO2 exhibits a low ethanol conversion of 25% and provides a very low H2 yield of ~0.2%. The 6Cu catalyst configuration provides a higher ethanol conversion of 75% and a higher H2 yield of ~2.3% than 6LiAlO2. No ethylene was detected in the gas generated in ESR over either catalyst configuration (as revealed by the GC-MS results in Figure S2), indicating that no ethanol dehydration (Equation (3)) occurred. The condensed liquid phase products were mainly water, ethanol, and acetaldehyde over either catalyst configuration (as revealed by the GC-MS results in Figure S3). The most acetaldehyde was obtained using 6Cu, followed by 6LiAlO2; the last one was obtained using 6Ni or 6Cu_6Ni (which provided similar amounts). The evolution of acetaldehyde is elucidated as follows. First, the base-acid pairs on the LiAlO2 support could provide sites for the initial adsorption of the hydroxyl group (–OH) of ethanol and the relatively large amounts of basic sites (as revealed in Table 1) could prevent the formation of ethylene, leaving a small amount of acetaldehyde as the primary product of ethanol decomposition [19,28]. Secondly, the introduction of Cu/Cu2O onto LiAlO2 could further improve the efficiency of ethanol dehydrogenation (Equation (2)), resulting in the Cu/LiAlO2 generating almost twice the amount of acetaldehyde as the LiAlO2 (according to the GC-MS results in Figure S3). Copper is known to be an effective catalyst of ethanol dehydrogenation (Equation (2)) [11]. The participation of Cu2O in ethanol dehydrogenation (Equation (2)) has also been examined [37]. Sato et al. [38] suggested that the Cu+/Cu0 pairs on a Cu-based catalyst (Cu/SiO2) exhibited high selectivity toward acetaldehyde in ethanol conversion reaction. Herein, Figure 7 shows that the 6Ni and 6Cu_6Ni catalyst configurations yield large amounts of H2 and C1 gases (CO2, CO, and CH4) because of the efficient C−C bond-breaking ability of nickel.

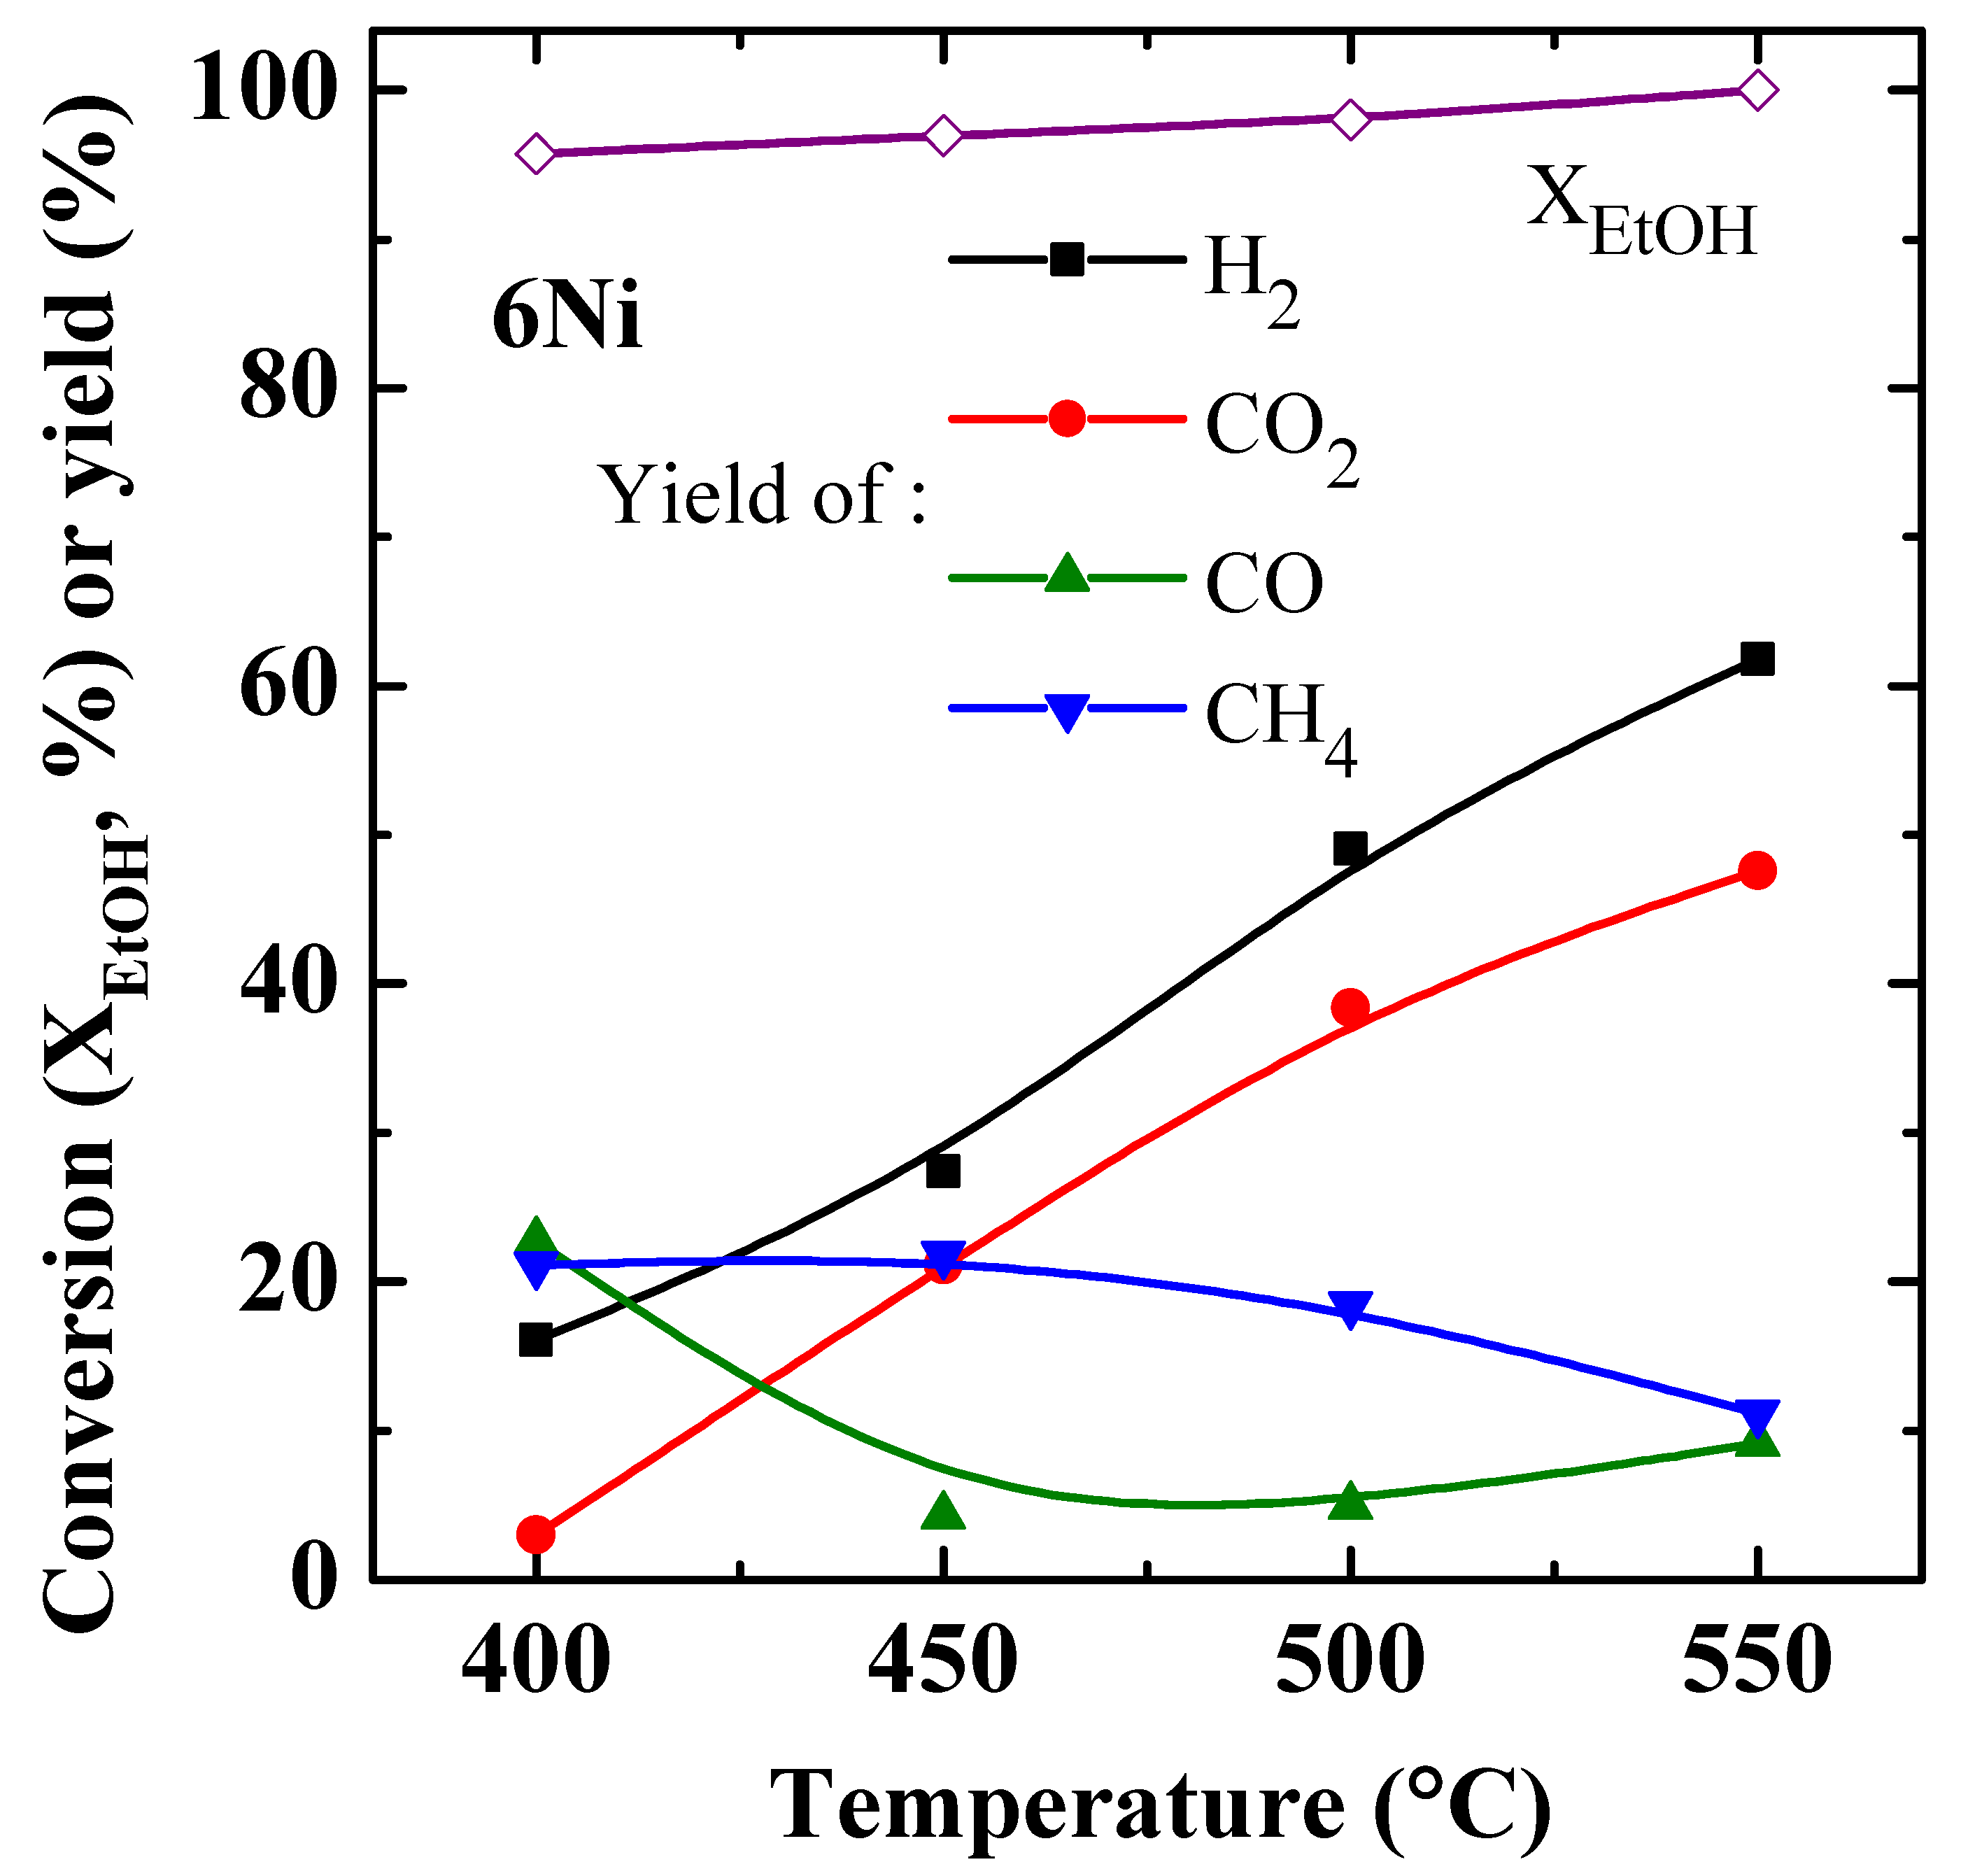
2.3. Effect of Temperature on ESR over 6Ni Catalyst Configuration

Figure 8 presents the effect of temperature on ethanol conversion (XEtOH) and gas yields in ESR by using the 6Ni catalyst configuration. As shown in Figure 8, the ethanol conversion is higher than 95% at 400 °C, increasing gradually with temperature to 100% at 550 °C. The H2 yield increases linearly from 15% to 60% as the temperature rises from 400 °C to 550 °C. The CO2 yield is very low at 400 °C, revealing that the water gas shift (Equation (7)) hardly occurs. As the temperature increases to 450 °C, the amount of CO generated decreases while the amount of CO2 generated increases to almost the amount of CH4 generated. The almost equal amounts of CH4 and CO2 + CO imply that acetaldehyde decomposition (Equation (4)) remains the dominant reaction that generates CO and CH4 at 450 °C. Most of the CO is then converted to CO2 via water gas shift (Equation (7)). As the temperature rises from 450 °C to 550 °C, the CO2 yield continues to increase while the CH4 yield decreases. This result reveals that acetaldehyde steam reforming (Equation (5)), methane steam reforming (Equation (6)), and water gas shift (Equation (7)) reactions are gradually enhanced. Increasing the temperature promotes these reactions, resulting in more H2 generation.

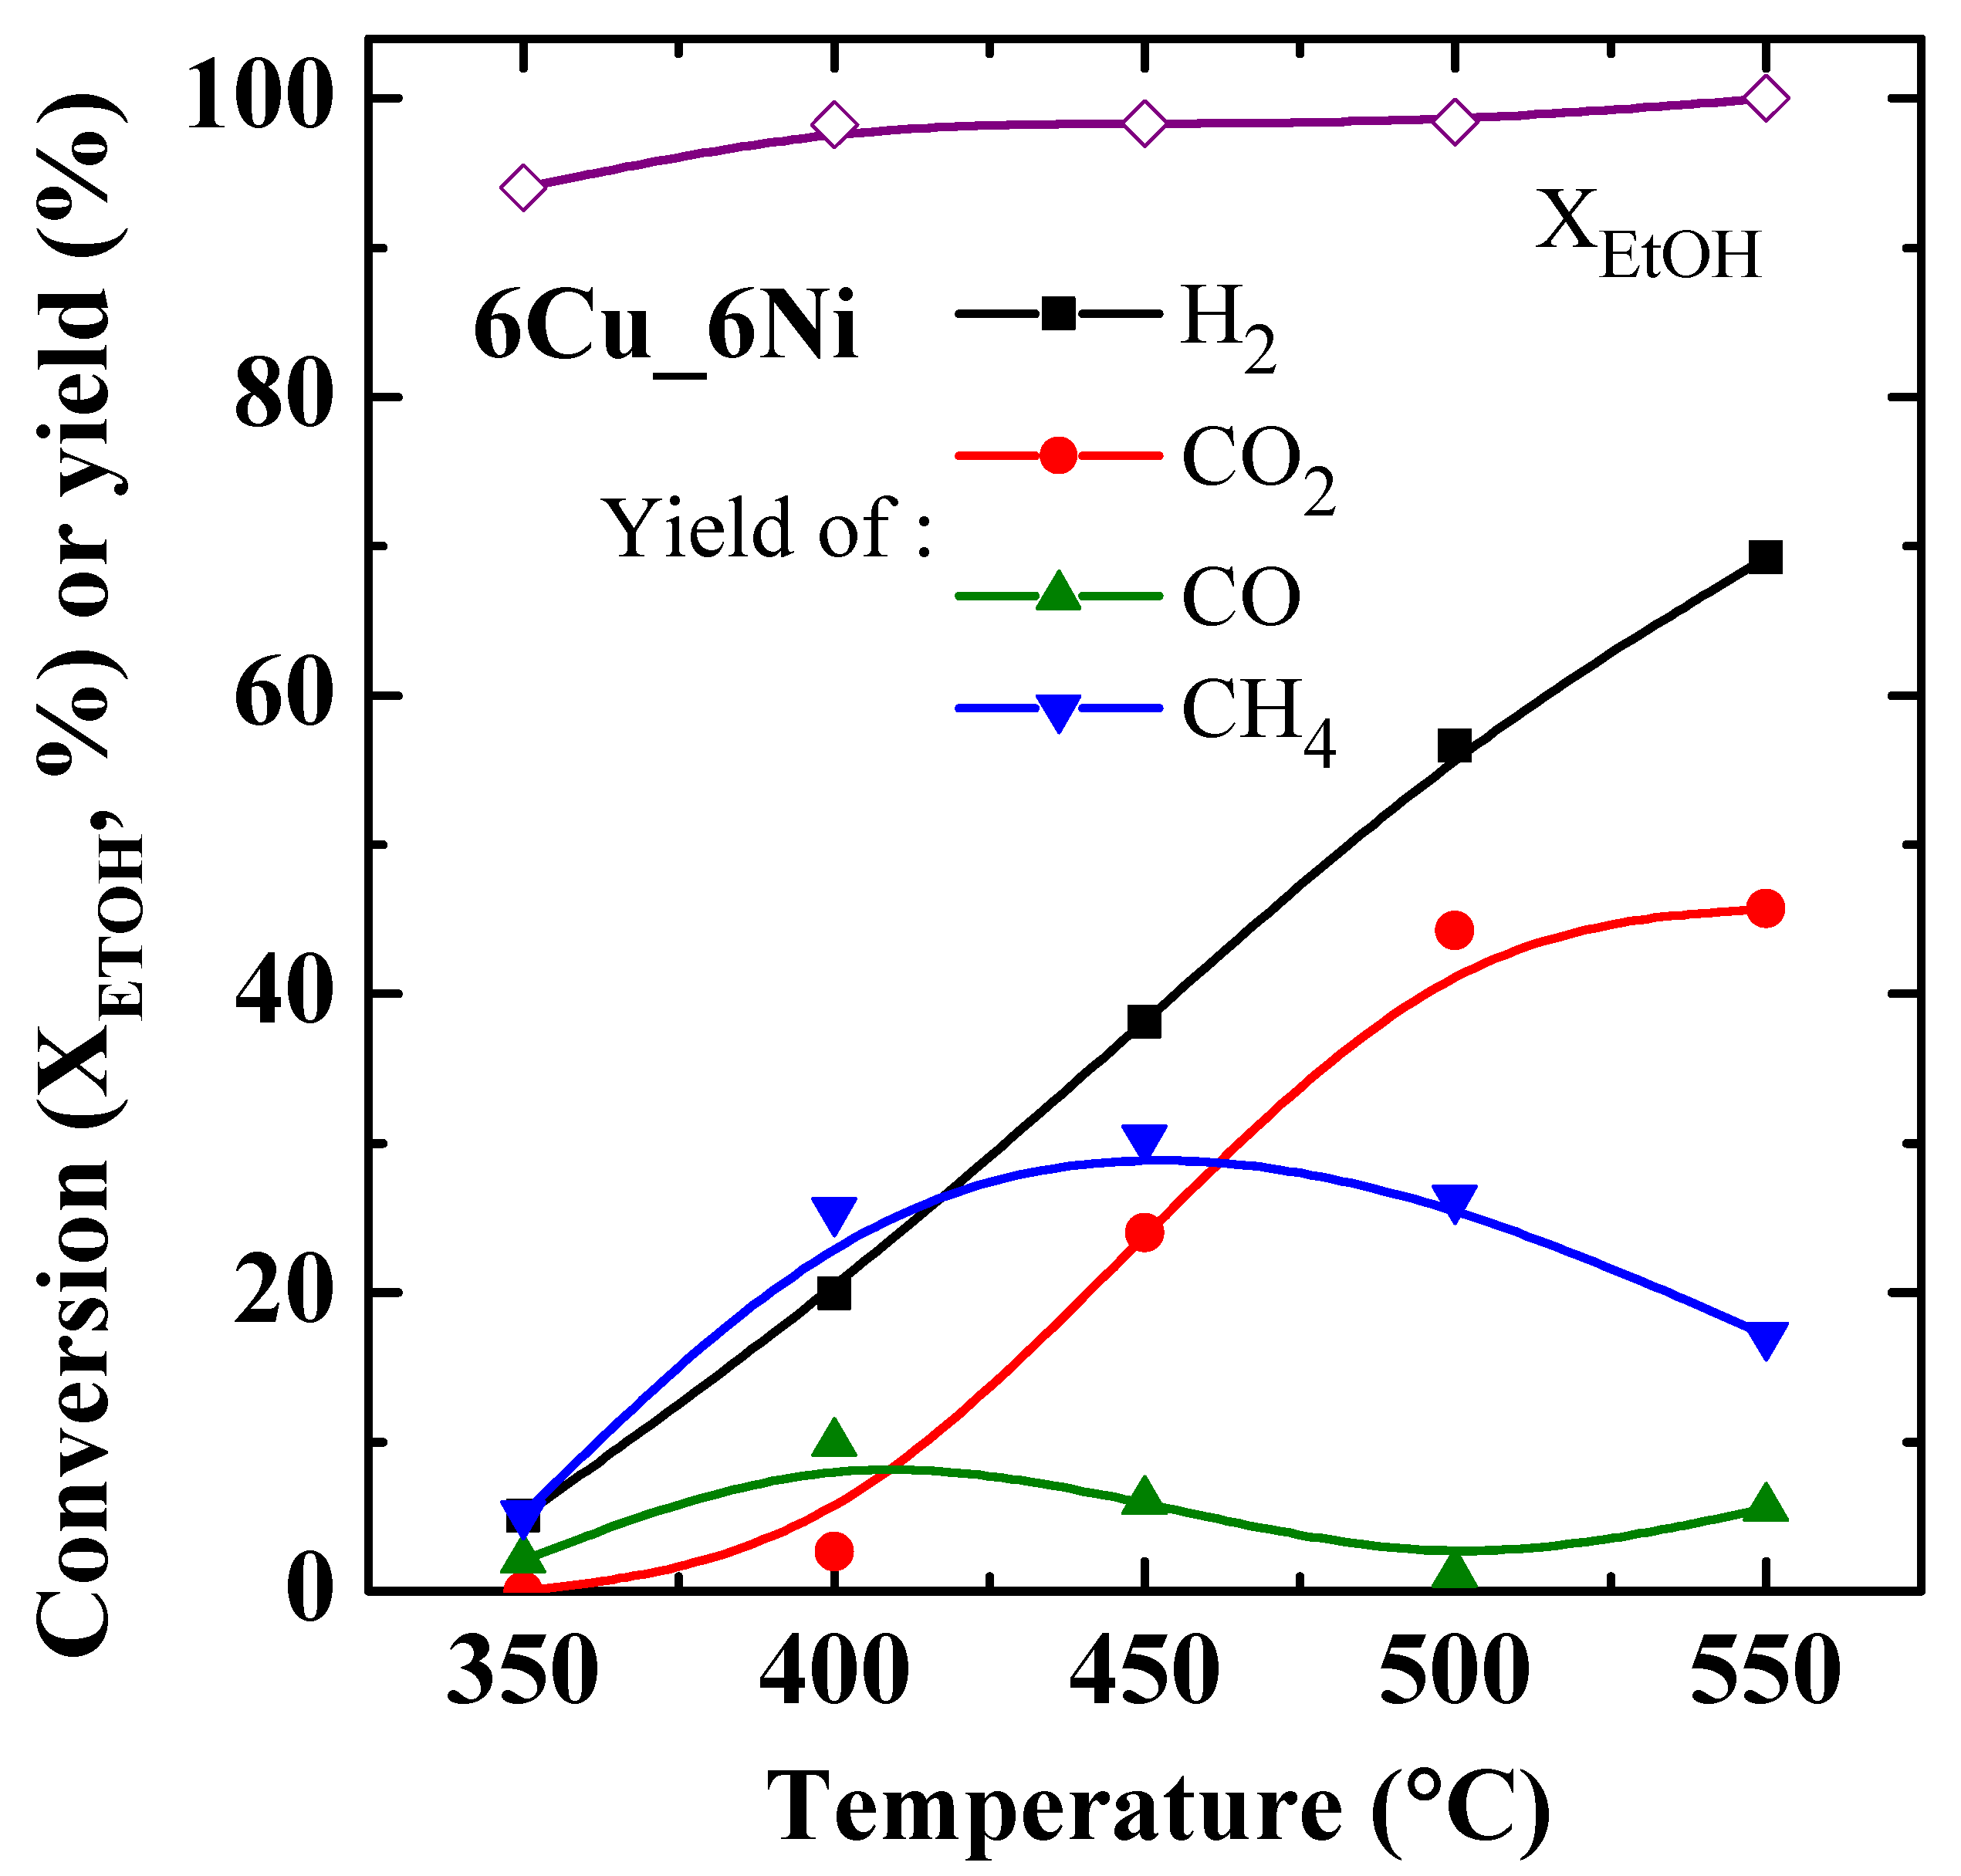
2.4. Effect of Temperature on ESR over 6Cu_6Ni Catalyst Configuration

Figure 9 shows the effect of temperature on ethanol conversion (XEtOH) and gas yields in ESR over 6Cu_6Ni. The ethanol conversion is more than 98% above 400 °C and attains 100% at 550 °C. The H2 yield increases almost linearly with temperature from 350 °C to 550 °C. Compared with the 6Ni catalyst configuration, the ethanol-water mixture steam feed firstly reacted with the Cu-based catalyst in 6Cu_6Ni configuration; the reacted gas then immediately passed through the Ni-based catalyst, resulting in ~10% higher H2 yield than that of 6Ni at each temperature. As shown in Figure 9, at relatively low temperatures from 350 °C to 450 °C, more amounts CH4 than CO2 + CO are generated, indicating that the acetaldehyde decomposition (Equation (4)) dominates the conversion of acetaldehyde at such temperatures. Methanation (the reverse reaction of Equation (6)) converts some CO to CH4, causing more CH4 than CO2 + CO to be generated. The 6Cu_6Ni catalyst configuration generates more C1 gases than the 6Ni catalyst configuration at temperatures higher than 400 °C, which proves that the decomposition of acetaldehyde is more promoted by 6Cu_6Ni. The pre-reaction of ethanol on the Cu-based catalyst facilitates the dehydrogenation steps, generating acetaldehyde and promotes the subsequent C−C bond breakage during the subsequent interaction with the Ni-based catalyst. At temperatures above 450 °C, the gas-phase distribution of 6Cu_6Ni varies similarly to that of 6Ni. Compared with 6Ni, the yields of CO2 and CH4 are higher and the yield of CO is lower for 6Cu_6Ni at 500 °C. It indicates that the water gas shift (Equation (7)) and methanation (the reverse reaction of Equation (6)) reactions are more promoted on 6Cu_6Ni than on 6Ni at 500 °C. The enhancement of both reactions reduces the generation of CO.

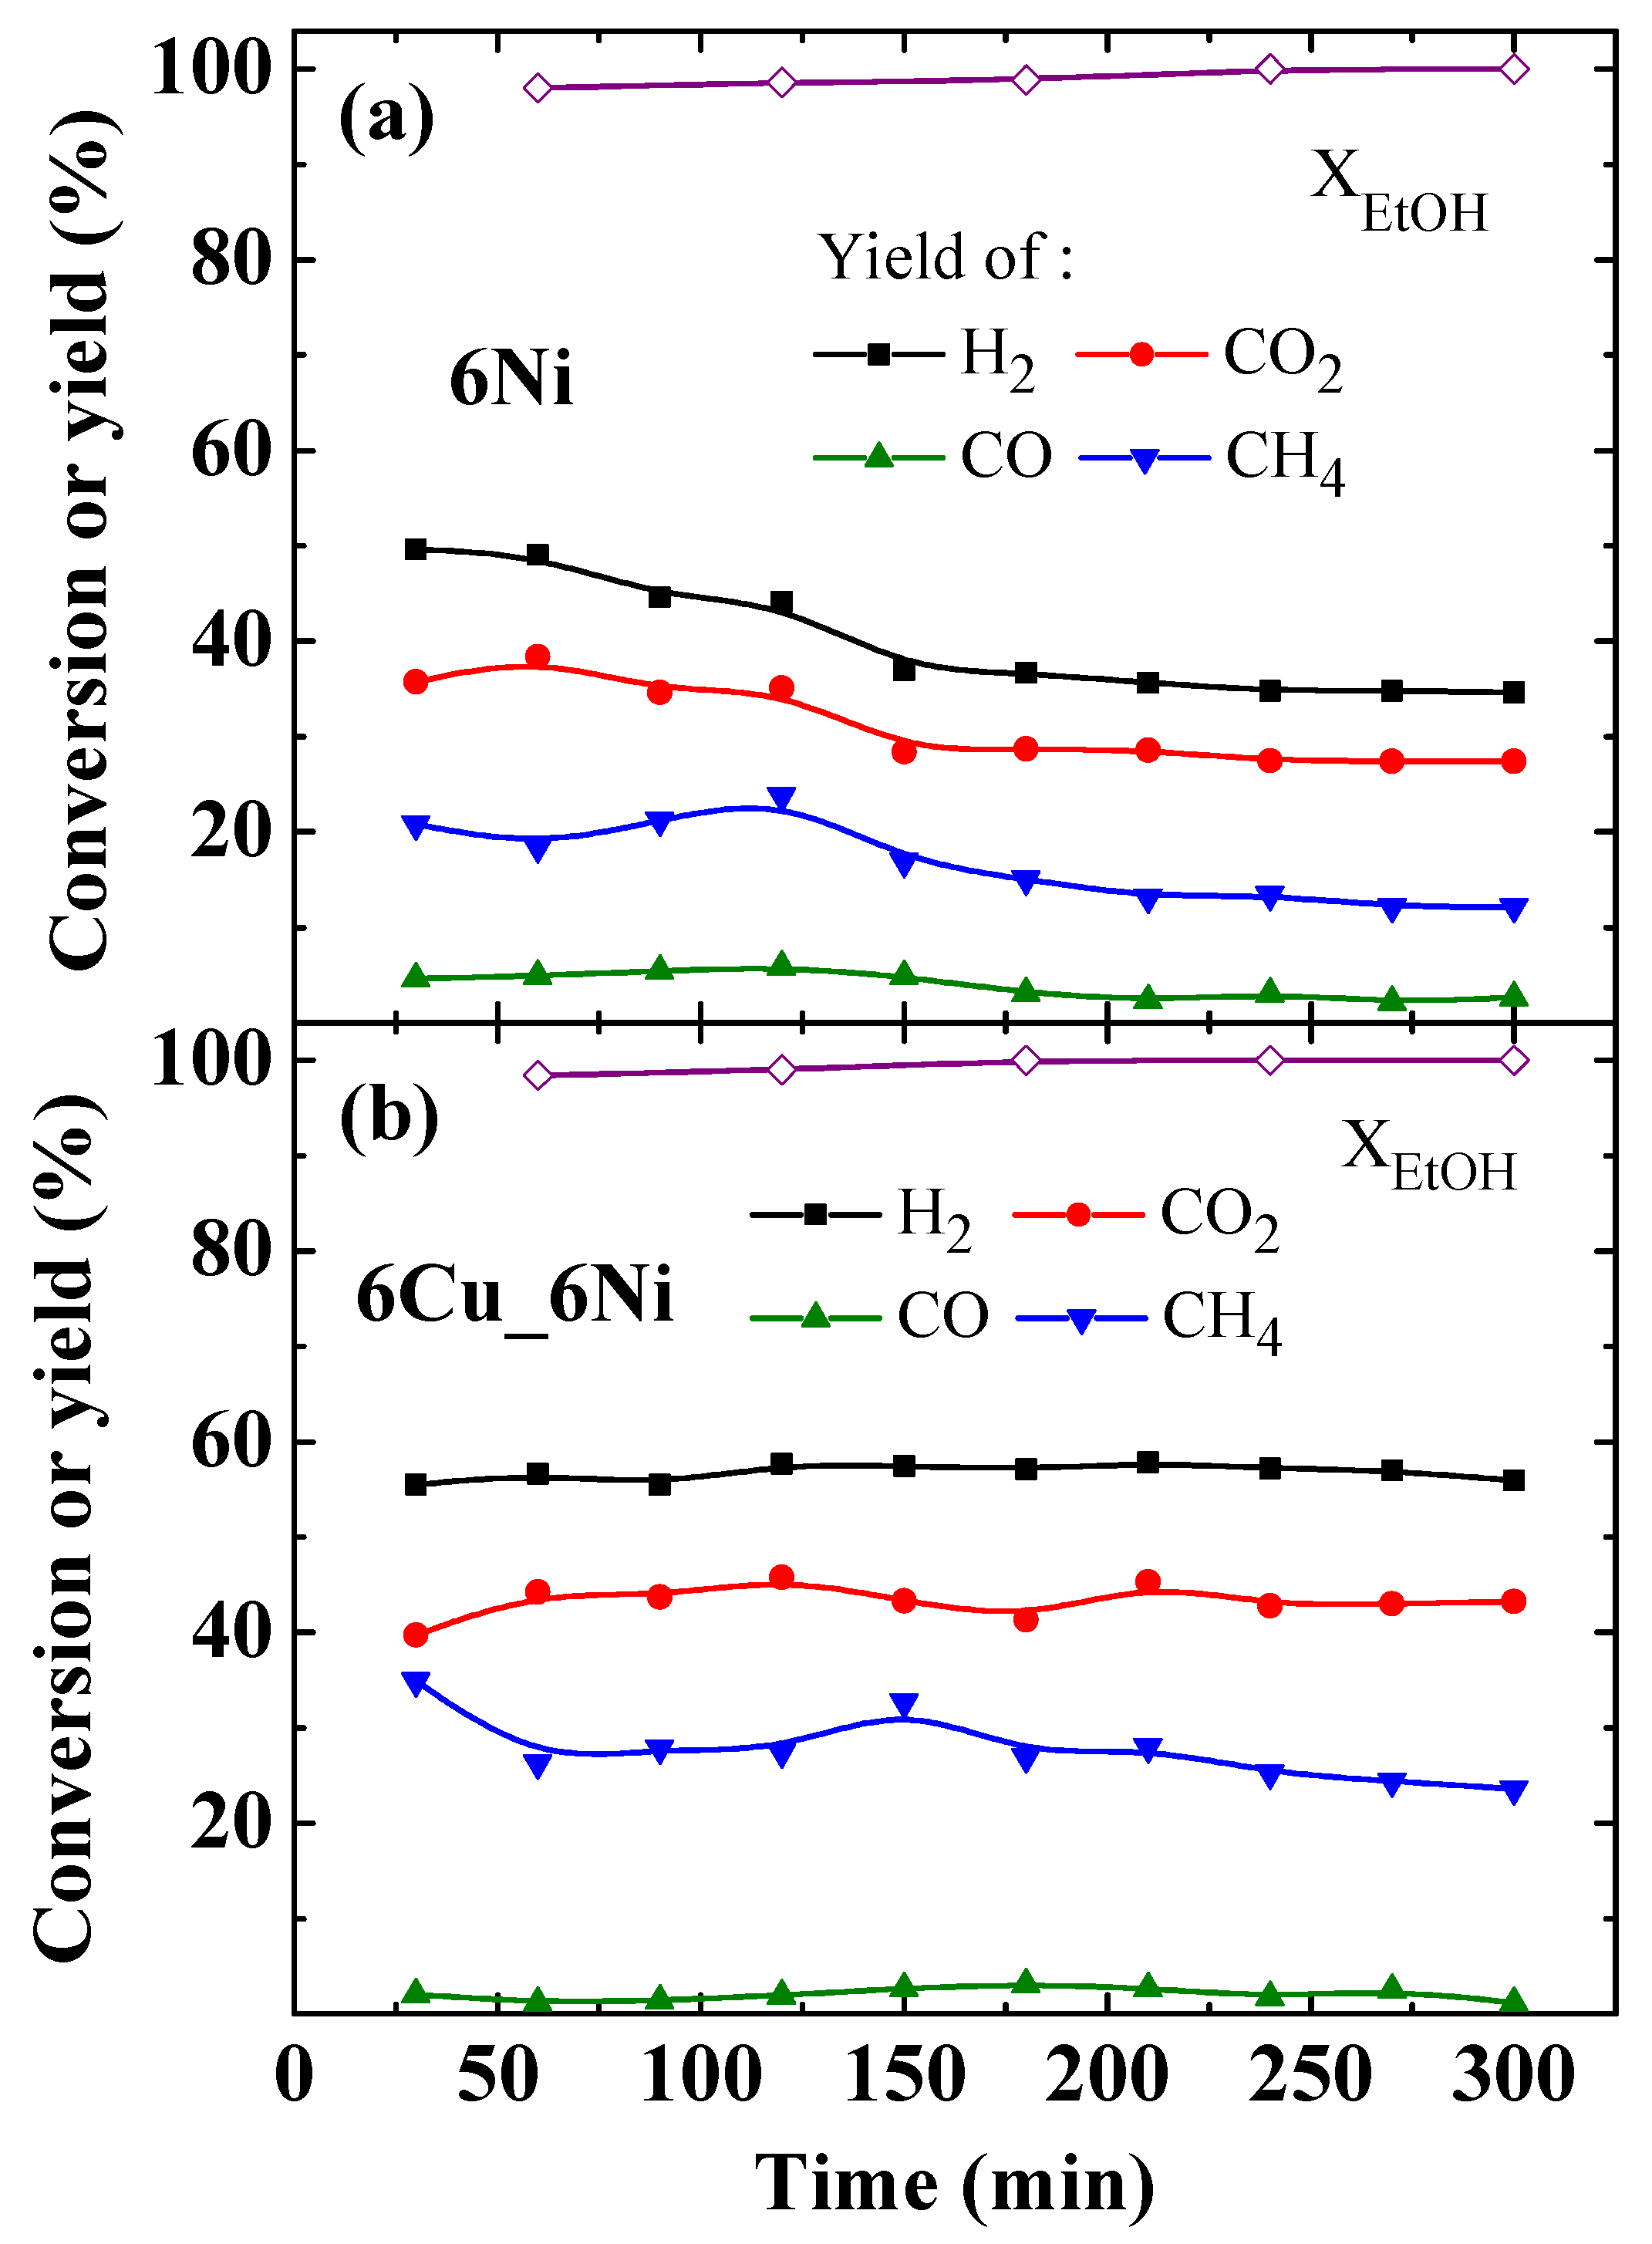
2.5. ESR vs. Reaction Time

Figure 10a plots the ethanol conversion and yields of the produced gases during prolonged reaction time over 6Ni. Ethanol conversion is 98% at 1 h, reaching 100% at 3 h, and remaining 100% until the end of the 5-h test. The H2 yield drops from an initial 50% to 35% after 150 min; this yield is maintained until the end of the test. Yields of C1 gases also decrease as the reaction time increases, revealing catalyst partial deactivation. Figure 10b displays the performance of 6Cu_6Ni. Ethanol conversion is 99% at 1 h, which slightly exceeds that for the 6Ni catalyst at the same time. It reaches 100% at 3 h and remains at 100% until the end of the 5-h test. The yield of H2 is approximately 57% throughout the 5-h test, showing better stability in the amounts of H2 generation than that via the 6Ni catalyst configuration (as shown in Figure 10a). Moreover, as indicated in Figure 10b, yields of C1 gases also remain stable throughout the test, implying that the partial deactivation of the 6Cu_6Ni catalyst configuration is insignificant. Table 3 compares the H2 yields and gas compositions that are achieved using the 6Ni and 6Cu_6Ni catalyst configurations herein and the data taken from previous studies that involve various catalysts [21,22,23,39,40,41,42,43]. As shown in the table, although test conditions are different from various studies, the experimental conditions of this study are more stringent than those used in other studies. Herein, this study employed smaller space-time conditions than those used in the various previous studies. A smaller space time can be interpreted as using a less catalyst/ethanol feed ratio for the reaction. As shown in Table 3, 6Cu_6Ni has almost the best H2 yield among the compared structured catalysts. This yield is only lower than that obtained using Cu–Ni–K/Mg–Al LDH powder in a previous study [39] in which the catalyst was tested at a relatively high space time (14.22 gcatal.∙min/gEtOH) and a high background pressure of 101 kPa. Our study herein by 6Cu_6Ni had space time only 3.42 gcatal.∙min/gEtOH. More importantly, 6Cu_6Ni also generated a relatively high H2 yield and the lowest CO concentration, about 0.48%, than that obtained in other studies using Ni-Cu bimetal catalysts in ESR (mostly more than 2%). CO is a pollutant of Pt catalysts that are used in fuel cells and causes them to fail. According to Devrim et al. [44], the suppression of CO in feed gas reduced the loss of current density in high-temperature proton exchange membrane fuel cells (HT-PEMFCs) and helped to maintain their performance.

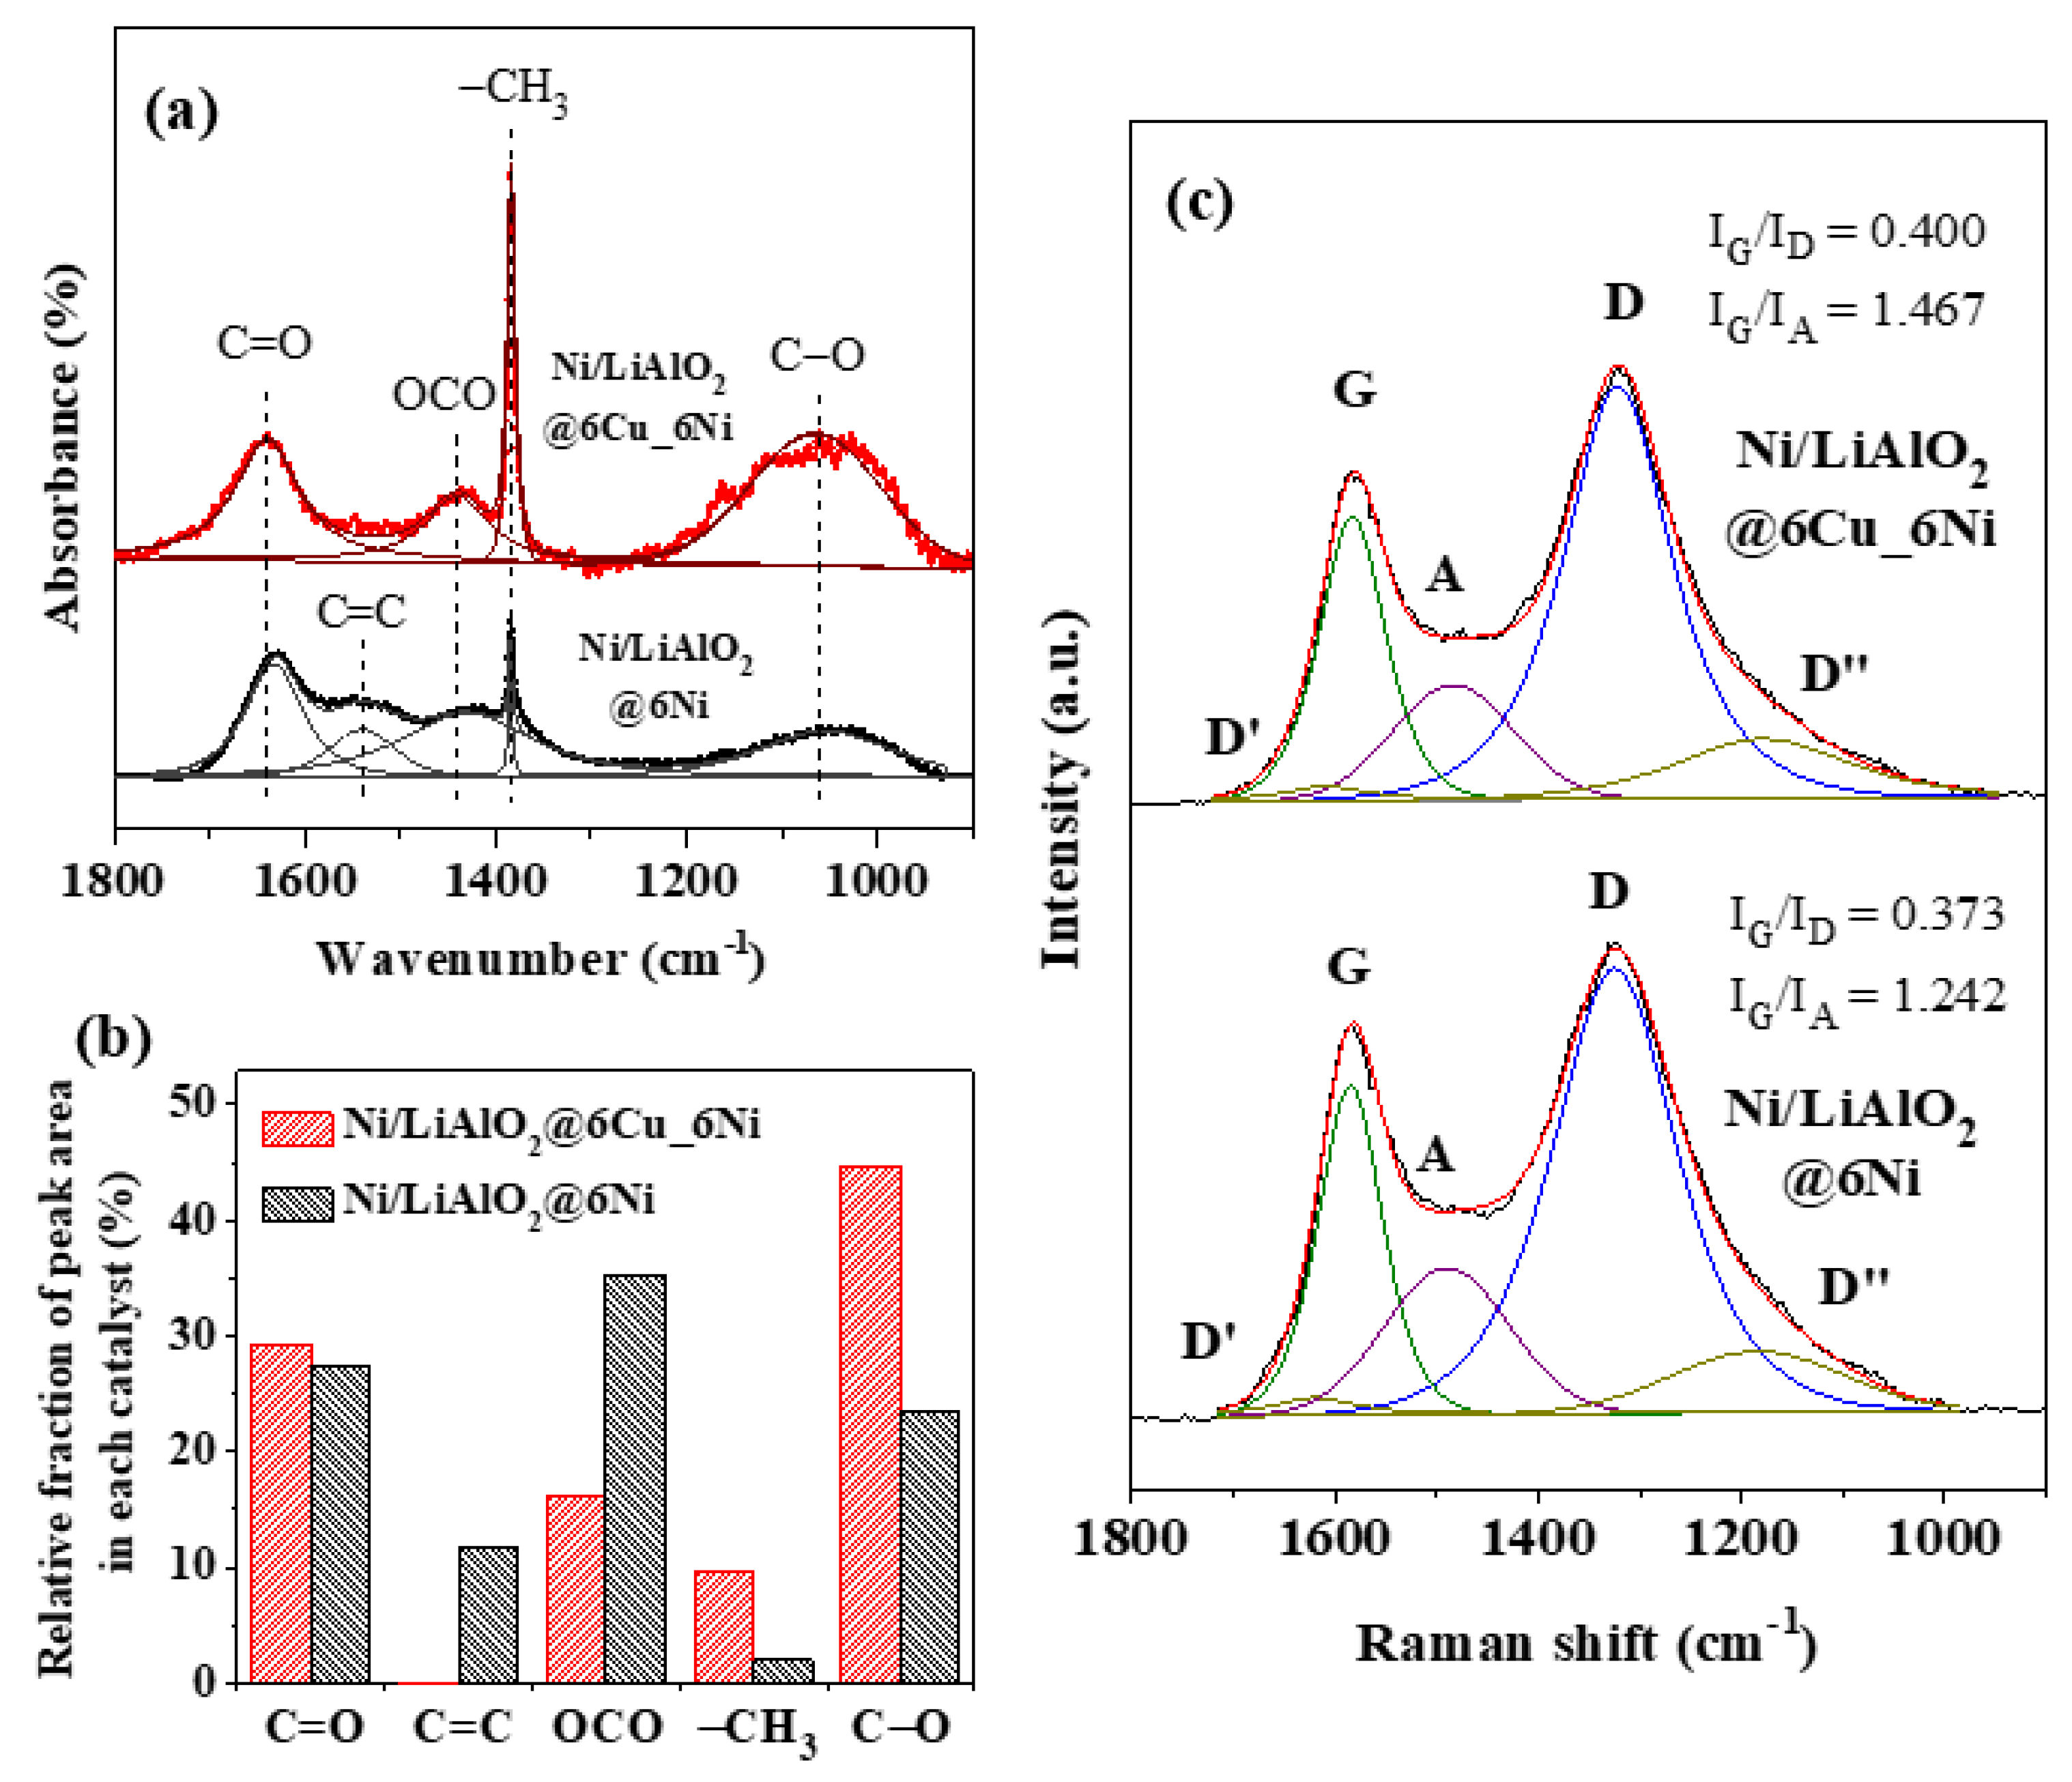
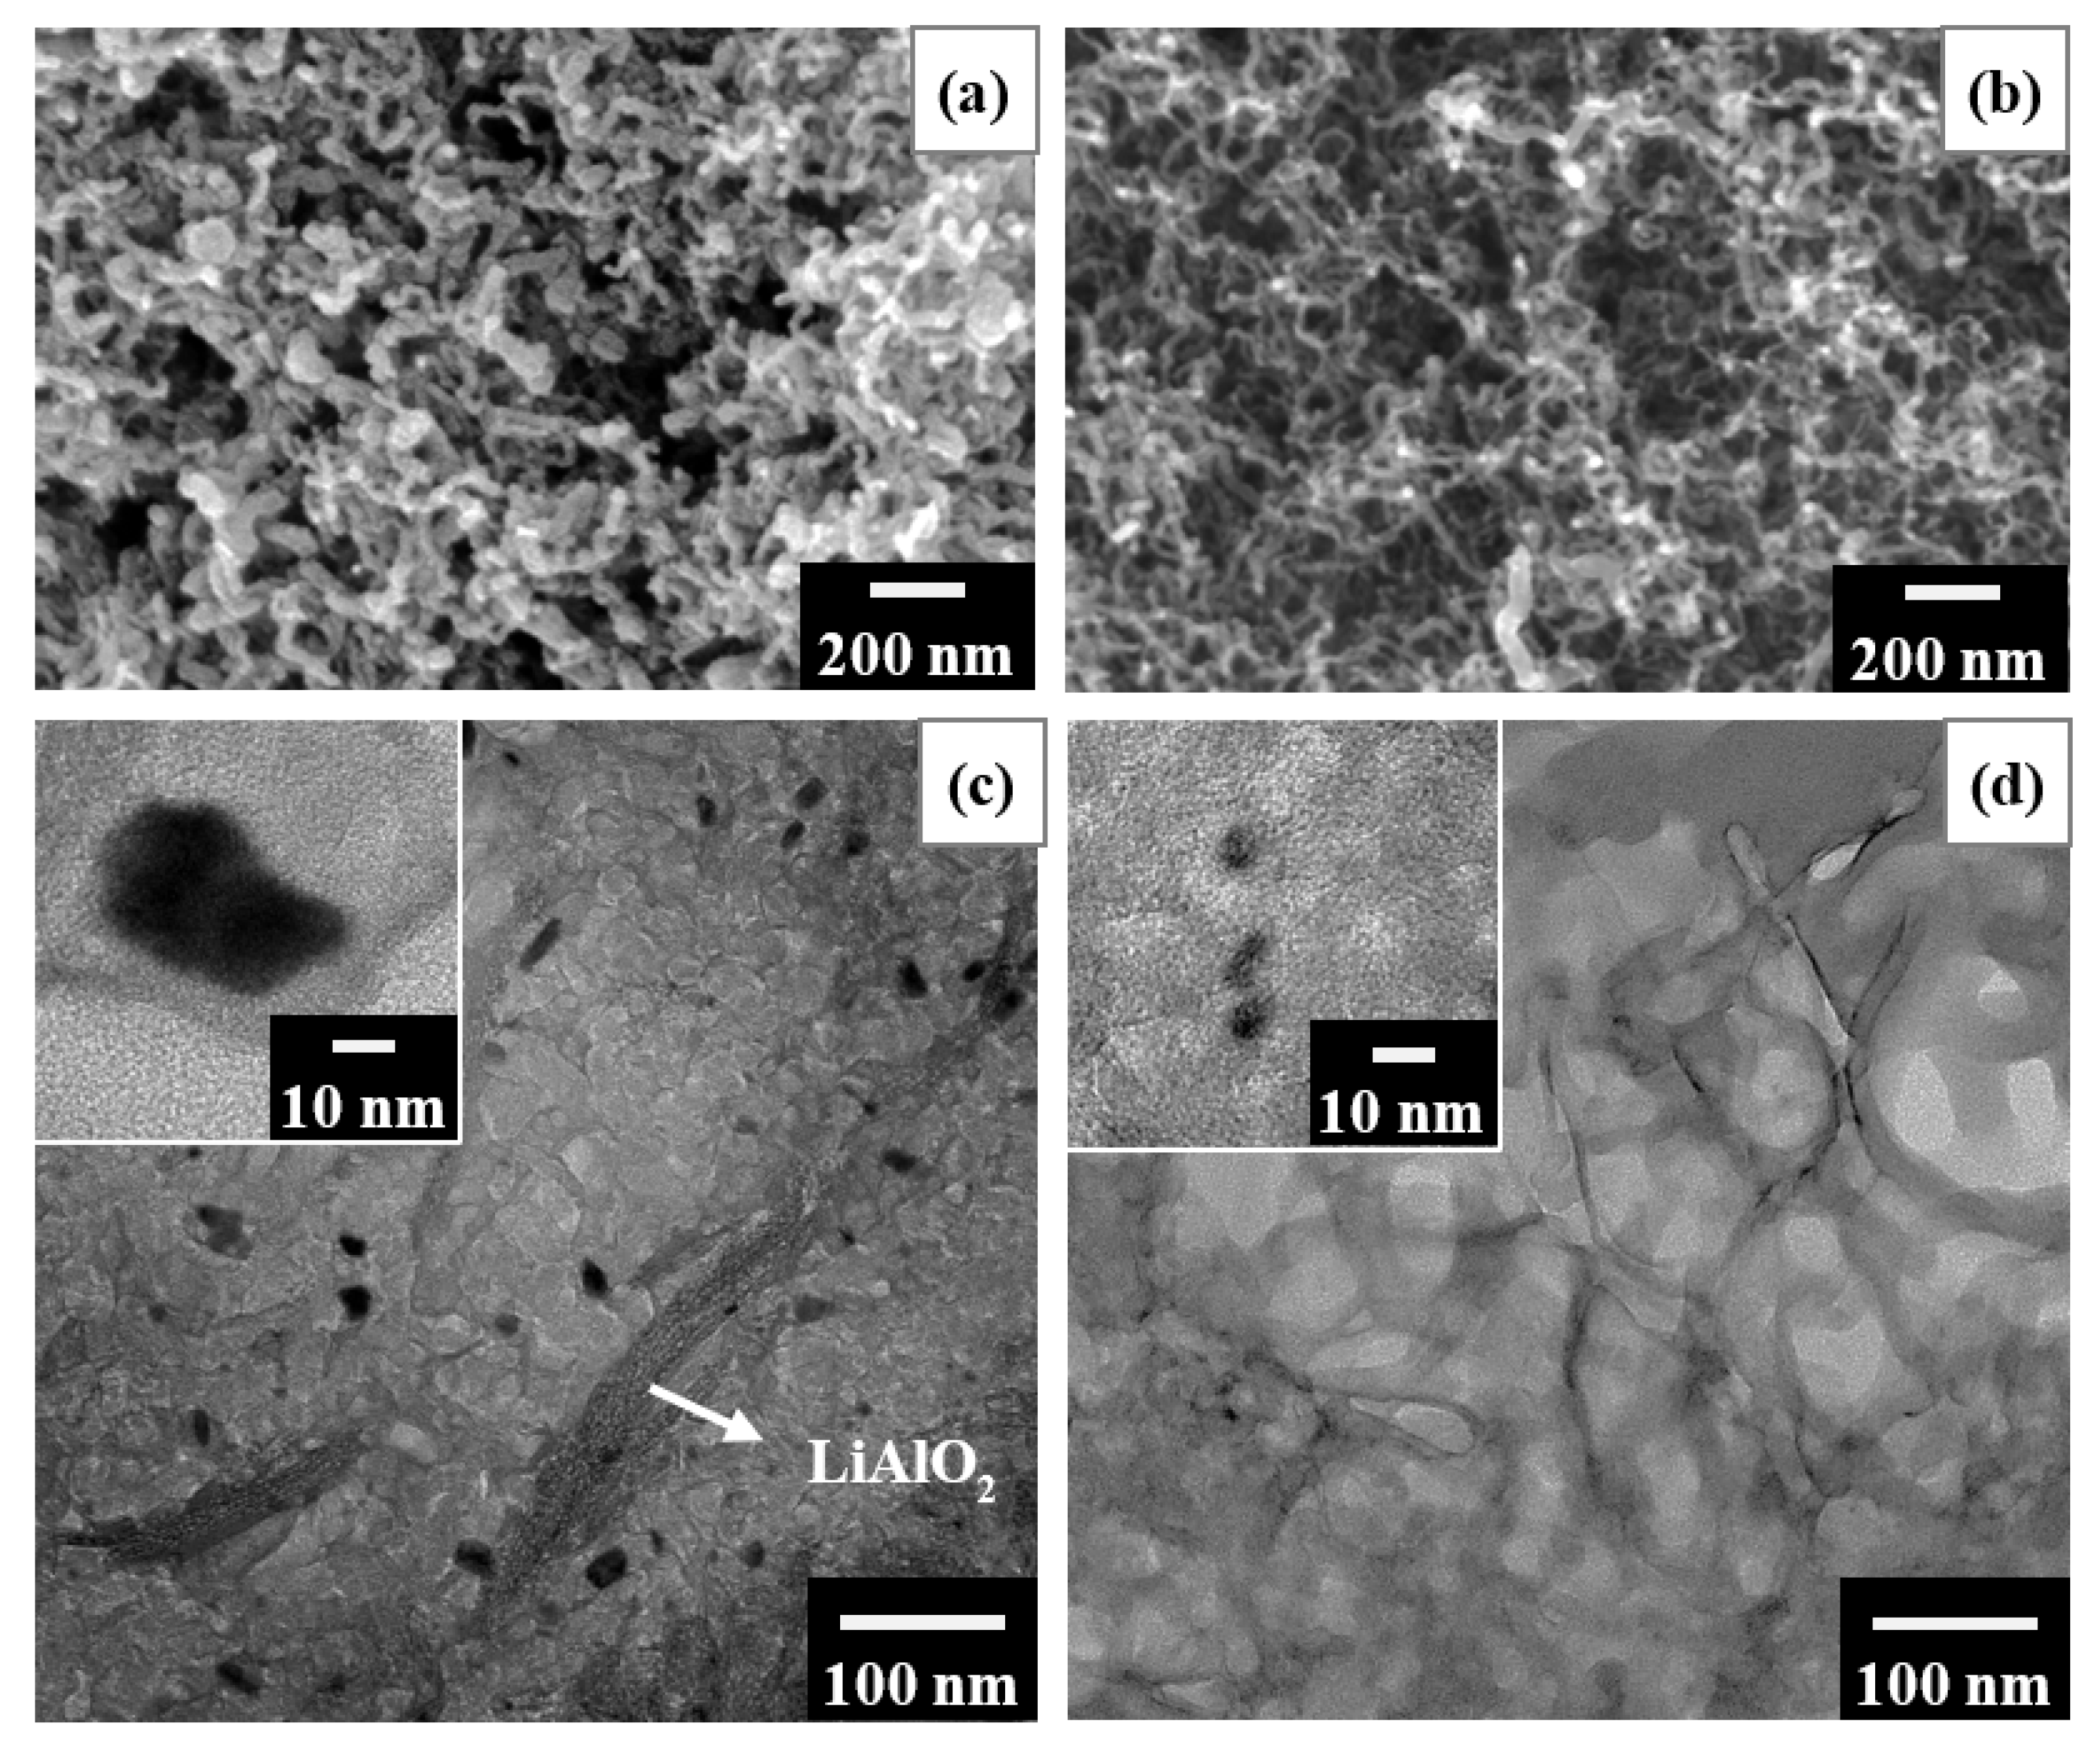
2.6. Coke Properties

The material characterization results of the spent Cu/LiAlO2 catalyst that was used in the 5-h reaction over 6Cu_6Ni are displayed in Figure S4. The XRD pattern (Figure S4a) from the spent Cu/LiAlO2 catalyst includes original peaks of Cu, Cu2O, and aluminum substrate. SEM observations (Figure S4b) reveal no carbon deposition on the surface of the catalyst and no obvious sintering of Cu/Cu2O particles. These results are consistent with studies that have noted that copper has a relatively weak effect on the cleavage of C−C bonds so the Cu/LiAlO2 catalyst produces almost no coke [32].
Figure 11a,b presents the SEM surface images of the spent Ni/LiAlO2 catalysts that were used in the 5-h reactions over 6Ni and 6Cu_6Ni catalyst configurations (herein denoted as Ni/LiAlO2@6Ni and Ni/LiAlO2@6Cu_6Ni, respectively). The coke formed on the spent Ni/LiAlO2@6Ni (Figure 11a), exhibiting coarse- and thick-diameter filamentous coke, appears to cover the surface of the catalyst. On the other hand, the coke formed on the spent Ni/LiAlO2@6Cu_6Ni was illustrated in Figure 11b, exhibiting filamentous coke (~20 nm in diameter) with the possible catalyst particles (the bright particles of size ~10 nm) on the top end of the filamentous coke. TEM cross-sectional observations (Figure 11c,d) reveal the nanoparticles and coke on the spent Ni/LiAlO2 catalysts. In Figure 11c, the carbon that formed on the spent Ni/LiAlO2@6Ni has a foam-like appearance, covering LiAlO2 platelets and Ni nanoparticles. As shown in the high-resolution TEM image (the inserted image in Figure 11c), it seems that the particles came across other particles and caused sintering. In contrast, the spent Ni/LiAlO2@6Cu_6Ni, as shown in Figure 11d, exhibits carbon filaments with a diameter of approximately 20 nm. Particles on the spent Ni/LiAlO2@6Cu_6Ni, unlike the spent Ni/LiAlO2@6Ni, are of a size similar to that of the original particles (as shown in the inserted TEM image in Figure 11d). The growth of carbon filaments lifted and separated the Ni particles, preventing them from sintering. Selected area diffraction patterns of the particles on the spent Ni/LiAlO2@6Ni and Ni/LiAlO2@6Cu_6Ni (shown in Figure S5a,b, respectively) suggest that these particles contain Ni and NiO.
Owing to the different morphologies of the carbon on the spent Ni/LiAlO2 catalysts that were respectively used in the two different catalyst configurations, FTIR and Raman spectroscopy, were used to examine the carbon. Figure 12a shows the FTIR spectra of the coke on Ni/LiAlO2@6Ni and Ni/LiAlO2@6Cu_6Ni around the wavenumber of 900–1800 cm−1. The absorbance bands in Figure 12a and their positions are identified and mainly correspond to the following [45,46,47]: 1060 cm−1 for the stretching vibrational mode of C−O bonds; 1385 cm−1 for the symmetric stretching vibrations of −CH3 groups; 1440 cm−1 for the symmetric bending vibrations of O=C−O bonds in acetate groups (CH3COO−); 1540 cm−1 for the C=C bonds in polycondensed aromatics; and 1640 cm−1 for the C=O stretching vibrations in acetyl groups (CH3CO−). The relative fractions of the peak area of the absorbance bands in each FTIR spectrum were displayed in Figure 12b. From Figure 12b, the band related to C=O of acetyl groups at 1640 cm−1 has the nearly same fraction (about 27–29%) for the spent Ni/LiAlO2@6Ni and Ni/LiAlO2@6Cu_6Ni, confirming that the adsorption of acetaldehyde on the Ni/LiAlO2 in either of the two catalyst configurations was similar. The bands at 1540 cm−1 (C=C) and 1440 cm−1 (OCO) show higher area fraction in the coke formed on the spent Ni/LiAlO2@6Ni than those on the spent Ni/LiAlO2@6Cu_6Ni. These two bands are associated with polycondensed coke, which grows simultaneously with the accumulation of acetate groups [46,47]. This non-filamentous coke could cover the Ni nanoparticles, as observed in the TEM images in Figure 11c, possibly causing the decay of the catalytic performance of the Ni/LiAlO2@6Ni. On the other hand, the band at 1060 cm−1 (C−O) accounts for a higher fraction (of ~44.7%) of peak area intensity for the coke formed on the spent Ni/LiAlO2@6Cu_6Ni than that of Ni/LiAlO2@6Ni (~23.5%). This reveals that the decomposition of acetaldehyde (to form CH4 and CO) was relatively boosted by the Ni/LiAlO2@6Cu_6Ni. Montero et al. [46] studied the coke evolution during the stages of non-deactivation and deactivation of a Ni/La2O3−αAl2O3 catalyst in ethanol steam reforming. According to Montero et al. [46], under the stage of non-deactivation state, FTIR spectrum from the surface of the catalyst showed that the area fraction corresponding to the band at ~1106 cm−1 (C−O) was ~47%. The area fraction of this band decreased with time as the catalyst became partial deactivated in ESR. Moreover, Montero et al. [46] found that non-filamentous coke (i.e., the condensed coke) was evolved on the deactivated catalyst at the late stage of ESR. The simultaneous increase of fractions of bands at ~1575 cm−1 (C=C) and ~1444 cm−1 (O=C−O assigned to acetate groups) indicated the contribution of accumulated acetate groups to the formation of the condensed coke. As presented in Figure 12b, the spent Ni/LiAlO2@6Cu_6Ni after being used in the 5-h reaction of ESR shows that the C−O bonds still account for a high fraction (~44.7%) in the filamentous-like coke formation (the coke as shown in the TEM image in Figure 11d). Accordingly, the Ni/LiAlO2@6Cu_6Ni catalyst could effectively decompose acetaldehyde, and this process is stable over time with a bare accumulation of acetate groups. The Cu/LiAlO2@6Cu_6Ni first contacting to the ethanol-water mixture steam can initially dehydrogenate ethanol to form acetaldehyde; thus, the subsequent Ni/LiAlO2@6Cu_6Ni could have high efficiency to decompose the acetaldehyde to generate H2 and C1 gases directly. This process is stable over time, and it reduces the chance of acetaldehyde being oxidized by lattice oxygen or hydroxyl groups (−OH) on Ni/LiAlO2 surface to form acetate acetic acid [12], which was found on spent Ni/LiAlO2@6Ni. Through the pre-reaction of the ethanol-water mixture steam with the Cu/LiAlO2@6Cu_6Ni, the Ni/LiAlO2@6Cu_6Ni catalyst avoids the formation of condensed carbon.
Figure 12c presents first-order Raman spectra of carbon from 900 to 1800 cm−1. Two main characteristic peaks at around 1585 and 1310 cm−1 (G and D in Figure 12c) in each spectrum respectively present the so-called G-band and D-band. The G-band is associated with stretching of the carbon sp2 bonds in the ordered graphite structure, while the D-band arises from disordered carbon. As the ordered graphite begins to amorphize, a band that is associated with amorphous carbon appears at 1520 cm−1 (the so-called A-band, indicated by A in Figure 12c) [48]. The other two relatively weak peaks at 1200 and 1620 cm−1 are also associated with disordered carbon (D’ and D” in Figure 12c). Both of the Raman spectra in Figure 12c reveal the dominance of disordered carbon. To evaluate the degree of ordering of carbon, the peak areas of bands G, A, and D (represented by IG, IA, and ID) are compared. The ratios IG/ID and IG/IA are indicated in Figure 12c. The carbon formation on the spent Ni/LiAlO2@6Cu_6Ni had higher values of IG/ID (by ~7%) and IG/IA (by ~15%) ratios than those of the spent Ni/LiAlO2@6Ni. The analysis by Raman spectroscopy confirms that the filamentous carbon forming on the spent Ni/LiAlO2@6Cu_6Ni is more ordered and graphitized than the condensed coke formed on the spent Ni/LiAlO2@6Ni. Figure S6 exhibits XRD patterns of the spent Ni/LiAlO2@6Ni and Ni/LiAlO2@6Cu_6Ni catalysts that were used in the 5-h reactions. The spent Ni/LiAlO2@6Cu_6Ni (bottom pattern in Figure S6) yielded a broad peak at 26.4°, representing graphite (002). As for the spent Ni/LiAlO2@6Ni (bottom pattern in Figure S6), this characteristic peak (at ~26°) could hardly be found. It exhibited large background signals at 2θ < 20°. The large background signals are considered to arise from their amorphous nature [46]. The XRD results agree with the crystallinity of carbon determined by Raman spectroscopy.
Temperature programmed oxidation (TPO) analysis was performed for the spent Ni/LiAlO2@6Ni and Ni/LiAlO2@6Cu_6Ni catalysts. As shown in Figure 13, both samples start to consume oxygen at ~300 °C. The TPO data curve in black represented the oxygen consumption of the spent Ni/LiAlO2@6Ni, presenting a oxygen combustion peak with maximum intensity at ~628 °C. The red curve plots the TPO data of the coke on spent Ni/LiAlO2@6Cu_6Ni, showing a intensive oxygen combustion peak with a much wider full width at half maximum than that of the black peak, and the maximum oxygen consumption occurred at ~656 °C. Literature suggests that amorphous carbon burns in the air at 200–500 °C; the carbon with defects burns in the air between 500 and 600 °C; the graphitic carbon burns above 600 °C [49,50]. According to Figure 13, the TPO of the coke on spent Ni/LiAlO2@6Cu_6Ni indicates a relatively high amount of graphitic carbon. This is related to the higher degree of ordering of coke on the spent Ni/LiAlO2@6Cu_6Ni than that on the spent Ni/LiAlO2@6Ni, which was also revealed by Raman spectroscopy (Figure 12c). Based on the area under the curve in Figure 13, the spent Ni/LiAlO2@6Cu_6Ni consumes ~48% more oxygen than the spent Ni/LiAlO2@6Ni by both using the same weight of the TPO samples. This indicates that the coke on spent Ni/LiAlO2@6Cu_6Ni is highly composed of C with low content of O and H, which means it has to be burned at relatively high temperatures.

3. Materials and Methods

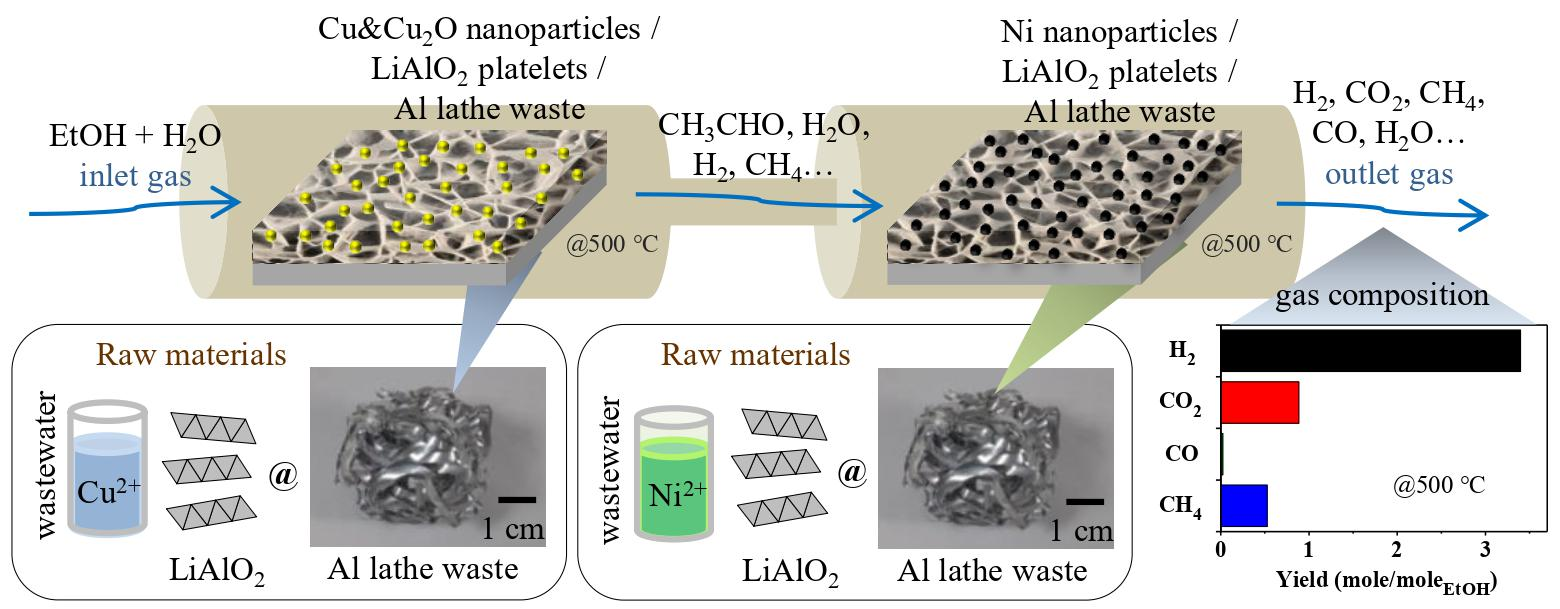
3.1. Catalyst Preparation

Aluminum lathe strips were formed into cylindrical strip balls, working as a structural framework, with a diameter of about 4 cm and a length of about 4 cm, as shown in the photograph in Figure 14. The lathe strip ball (working as a framework structure to support the catalyst that would be formed on it afterward (see Figure S1)) was ultrasonically cleaned in acetone to remove the oil and debris from its surface. Al3+- and Li+-containing electrolyte solution was prepared by adding aluminum foil into a 0.06 M LiOH aqueous solution with a Li/Al molar ratio of two. To prepare the electrolyte solution, an appropriate amount of LiOH·H2O was dissolved in deionized water at 50 °C. The water was simultaneously purged with high-purity Ar gas to reduce any potential dissolution of contaminating CO2. Aluminum foil was cut into strips (1 mm × 5 mm) and added to the aqueous LiOH solution. This solution was magnetically stirred for 30 min at 50 °C and then filtered through a filter paper to obtain a clear solution, which was used as the electrolyte solution. A potentiostat (EG & G model 273A, Princeton Applied Research, US) in which the anode was platinum-coated titanium mesh and the cathode was the aluminum lathe strip ball (Figure 14) was used. The setup was used for electrodeposition for 2 h at a constant DC voltage of 5 V. The lathe waste strip ball that was coated with Li–Al–CO3 LDH was then rinsed with distilled water.
The LDH-coated aluminum lathe waste strip ball was calcined at 500 °C for 1 h to increase the hydrophilicity of its surface. Appropriate amounts of NiCl2·6H2O and CuCl2·2H2O were respectively added into a magnetically stirred deionized water at 50 °C to prepare 0.15 M Ni2+- and 0.0012 M Cu2+-containing aqueous solutions. Then, saturated aqueous NaHCO3 was added dropwise to a pH value of 6.7 for the Ni2+- and 7.5 for the Cu2+-containing solution, respectively. The calcined LDH-coated lathe strip ball was immersed in the magnetically stirred Ni2+- or Cu2+-containing solutions for 1 h (see the immersion in Figure S1) to have Ni or Cu hydroxide precursor on it. The sample was then reduced with pure H2 flow at 500 °C in a tube furnace to complete the reduction reaction changing Ni/Cu hydroxide precursor into metallic Ni or Cu. The reduced catalysts were denoted as Ni/LiAlO2 and Cu/LiAlO2, respectively.

3.2. Catalytic Tests

ESR tests were performed in a stainless-steel tubular reactor (6 cm in diameter and 45 cm long) at ambient pressure. The reactor consisted of two chambers: the first was used to heat and vaporize the feed ethanol solution. The vaporized gas was subsequently going into the second reactor where the catalysts explored herein were loaded into. These two chambers were preheated to 250 °C and 500 °C, respectively, with hot N2 gas flow as the carrying gas herein. After the specified temperatures were reached, aqueous ethanol was fed into the first reactor by a diaphragm metering pump (KNF SIMDOWS 02). The outlet products out of the second reactor were cooled and then dried. The total gas flow rate was then measured using a flow meter and the gas phase was analyzed using an on-line gas analyzer. The contents of ethanol, acetaldehyde (in the liquid phase products), and ethylene (in the gas phase products) were determined using a gas chromatograph (GC, Agilent 7890CB). The column of RT-Q-BOND was equipped on GC to separate CO2, CH4, and other C-containing compounds from O2, N2, and CO, using He as the carrier gas. Ethanol conversion (XEtOH) was estimated as follows.
X E t O H =   1     n E t O H n E t O H , 0 ,
where nEtOH is the molar flow rate of ethanol in exhausted liquid and nEtOH,0 is the molar feed rate of ethanol at the inlet. The yield (Yi) of the output gas was calculated as follows.
Y i =   n i v i × n E t O H , 0 ,
where ni is the molar flow rate of each gas at the outlet and vi is the corresponding stoichiometric coefficient. The cumulative H2 output was estimated by integrating nH2 over time. In each ESR test, six of the lathe strip balls with the catalyst of Ni/LiAlO2 catalyst or Cu/LiAlO2 catalyst were used for testing (denoted as 6Ni and 6Cu, respectively). The catalyst configuration in which six lathe strip balls of Cu/LiAlO2 catalyst were placed in front of six lathe strip balls of Ni/LiAlO2 catalyst in the reaction chamber for the ESR test was denoted as 6Cu_6Ni. The total mass of the catalyst (LiAlO2 support + catalyst particles) on six lathe strip balls of Ni/LiAlO2 catalyst (6Ni) was 0.33 g and that on six lathe strip balls of Cu/LiAlO2 catalyst (6Cu) was 0.28 g.

3.3. Material Characterization

The crystallographic structures of the as-prepared and used catalysts were determined by glancing angle X-ray diffraction (GAXRD, Bruker D8 Advance ECO) with a glancing angle of 0.5° using Cu Kα1 (1.5406 Å) radiation. A field emission scanning electron microscope (FE-SEM, ZEISS Ultra Plus) was used to observe the surface morphologies of the as-prepared and used catalysts. X-ray photoelectron spectroscopy (XPS, ULVAC-PHI, PHI 5000 VersaProbe) was used to confirm the states of the surface elements. For the XPS study, the surface underwent Ar ion bombardment for 6 s to remove the surface-adsorbed gas, and surface data were then collected. The cross-sectional microstructures of the catalysts were determined and their phases were identified from their diffraction patterns that were collected using a field emission transmission electron microscope (FE-TEM, FEI Tecnai G2 F20). Specimens for TEM observation were prepared using a focused ion beam (FIB, Hitachi NX2000). A carbon film was deposited before FIB bombardment to protect the surface of the sample from damage.
CO2 and NH3 temperature programmed desorption (TPD) of the calcined LDH sample (the Li–Al LDH that was calcined at 500 °C for 3 h) was investigated by using a volumetric gas adsorption analyzer (Anton Paar Novatouch LX2, Austria). A total of 150 mg of the calcined LDH sample was used in each test. Prior to the TPD test, the adsorption of CO2 was performed at 100 °C for 1 h by flowing a 15% CO2/N2 gas mixture passing through the sample. Followed by flushing the sample with He at room temperature for 1 h for removing any physically adsorbed CO2. TPD of CO2 was carried out at a heating rate of 10 °C/min from the room temperature to 600 °C. NH3 adsorption was performed at 30 °C for 1 h by using a 15% NH3/N2 flow, and then flushed with He at room temperature for 1 h for removing any physically adsorbed NH3. TPD of NH3 was carried out at a heating rate of 20 °C/min from the room temperature to 600 °C.
The powder of coke dropped from the catalysts was collected for the characterization of the coke formation. Fourier transform infrared (FTIR) spectra were obtained using a Perkin-Elmer Spectrum 65 FT-IR spectrometer over the range of wavenumber of 900–1800 cm−1 with a resolution of 4 cm−1, using the KBr pressed disc method. The crystallinity degree of the coke was determined by Raman spectroscopy (Tokyo Instruments. Nanofinder 30) with a 632.8 nm He-Ne laser source. Before FTIR, each sample was dried in an oven to remove H2O molecular from sample’s surface. Temperature programmed oxidation (TPO) was carried out using a volumetric gas adsorption analyzer (Anton Paar Novatouch LX2, Austria). The coke sample (10 mg) was first flushed with an N2 flow at 100 °C, then subsequently an airflow was introduced, heating up to 800 °C at 5 °C/min. The consumption signals of oxygen were simultaneously recorded.

4. Conclusions

A process of recovering metal ions from simulated Ni or Cu electroplating wastewater for use in synthesizing nano-catalysts was proposed. A coating of Li–Al layered double hydroxide (LDH) with nano-sized platelet structure was successfully electrodeposited on the surface of aluminum lathe waste. The LDH works as catalyst support with a high surface area for being loaded with many catalytic nanoparticles. The calcined Li–Al LDH, owning to good hydrophilicity, can adsorb ions of Ni or Cu during dipping in the aqueous solution containing ions of Ni or Cu. It can be regarded as irreversible fouling of precursors such as Ni or Cu hydrate hydroxides on the surface of platelets, possibly owing to the concentration of solute on the surface of platelets exceeding the solubility product. By the reduction treatment with H2 at 500 °C, Ni- or Cu-based nanoparticles can be formed on the surface of LiAlO2 (derived from Li–Al LDH) platelets. LiAlO2, as for the catalyst support, exhibits high basicity, which is conducive to the initial adsorption of ethanol on its surface. The introduction of metal nanoparticles onto LiAlO2 platelets (the Cu/LiAlO2 and Ni/LiAlO2 catalysts) had combined advantages of easy absorption of ethanol molecules on LiAlO2 surface and the enhancement of ethanol dehydrogenation and acetaldehyde conversion reactions by the metal catalysts. The use of aluminum lathe waste to prepare the structured catalyst eliminates the requirement of background pressure in ESR, making the reaction to perform effectively under ambient pressure. The Cu–Ni two-stage catalyst configuration (6Cu_6Ni) increased the H2 production rate by about 10% compared with the only Ni-based catalyst configuration (6Ni). It also improves the stability of H2 output in the 5-h reaction of ESR compared with 6Ni. The gas produced by using 6Cu_6Ni at 500 °C contains a lower CO concentration (less than 1%) compared with previous studies that applied Ni-Cu bimetal catalysts to ESR (mostly more than 2%), which is advantageous for its application. Coke formation on the spent Ni/LiAlO2 catalyst in 6Cu_6Ni was in the form of relatively graphitized carbon filaments, which did not significantly deactivate the catalyst. The pre-reaction of ethanol-water mixture steam with Cu catalyst in ESR provides a way to improve Ni catalyst’s catalytic efficiency and stability. The pre-reaction reduces the partial deactivation behavior of the Ni catalyst and the sintering of the Ni nanoparticles.

Supplementary Materials

The following are available online at https://www.mdpi.com/article/10.3390/catal11091124/s1, Figure S1: Recovering of Ni2+ (a) and Cu2+ (b) from the simulated wastewater were found, with the changes of the concentrations of (a) Ni2+ from 535 ppm to 3.3 ppm between the initial and after the immersion time of 9 h (by using three calcined LDH-coated frameworks consecutively, each was dipped for 3 h); (b) Cu2+ decreased from 78 ppm to 4.8 ppm between the initial time and the immersion time of 1 h. The concentration of the cations in the solutions was measured by an inductively coupled plasma optical emission spectrometer (ICP-OES, US, Agilent 5110 ICP-OES), Figure S2: GC-MS results of gas-phase products for ESR over catalyst configurations which generate abundant gas (i.e., 6Ni and 6Cu_6Ni) at a reaction time of 1 h compared with air atmosphere. NL means the normalization level. Reaction conditions: same as that described in Figure 7, Figure S3: (a) GC-MS results of condensed liquid phase products for ESR over various catalyst configurations at a reaction time of 1 h compared with H2O; (b) magnification view of the peaks corresponding to acetaldehyde. NL means the normalization level. Reaction conditions: same as that described in Figure 7, Figure S4: (a) XRD pattern; (b) SEM surface morphology of the spent Cu/LiAlO2@6Cu_6Ni catalyst that was used in 5-h reaction of ESR. Reaction conditions: same as that described in Figure 10, Figure S5: Selected area diffraction patterns of the particles on the spent catalysts that were used in 5-h reactions of ESR: (a) Ni/LiAlO2@6Ni; (b) Ni/LiAlO2@6Cu_6Ni. Reaction conditions: same as that described in Figure 10, Figure S6: GAXRD patterns of the spent Ni/LiAlO2@6Ni and Ni/LiAlO2@6Cu-6Ni catalysts that were used in 5-h reactions of ESR. Reaction conditions: same as that described in Figure 10.

Author Contributions

Conceptualization, J.-Y.U.; methodology, Y.-J.C.; validation, S.-H.H.; investigation, Y.-J.C.; data curation, Y.-J.C.; writing—original draft preparation, J.-Y.U.; writing—review and editing, Y.-J.C.; visualization, Y.-J.C.; supervision, J.-Y.U.; project administration, H.-T.L.; funding acquisition, H.-T.L. All authors have read and agreed to the published version of the manuscript.

Funding

This research was funded by Bureau of Energy, Grant No.110-E0202.

Data Availability Statement

The data that support the findings of this study are abailable on request from the corresponding author. The data are not publicly available due to privacy or ethical restrictions.

Acknowledgments

The financial support provided by Bureau of Energy (Grant No.110-E0202) is gratefully acknowledged.

Conflicts of Interest

The authors declare no conflict of interest.

References

  1. Castelblanque, J.; Salimbeni, F. NF and RO membranes for the recovery and reuse of water and concentrated metallic salts from waste water produced in the electroplating process. Desalination 2004, 167, 65–73. [Google Scholar] [CrossRef]
  2. Al-Shannag, M.; Al-Qodah, Z.; Bani-Melhem, K.; Qtaishat, M.R.; Alkasrawi, M. Heavy metal ions removal from metal plating wastewater using electrocoagulation: Kinetic study and process performance. Chem. Eng. J. 2015, 260, 749–756. [Google Scholar] [CrossRef]
  3. Buxton, S.; Garman, E.; Heim, K.E.; Lyons-Darden, T.; Schlekat, C.E.; Taylor, M.D.; Oller, A.R. Concise review of nickel human health toxicology and ecotoxicology. Inorganics 2019, 7, 89. [Google Scholar] [CrossRef] [Green Version]
  4. Chang, Y.C.; Uan, J.Y. Mg17Al12 phase in magnesium alloy waste facilitating the Ni2+ reduction in nickel plating wastewater. J. Hazard. Mater. 2021, 403, 123556. [Google Scholar] [CrossRef]
  5. Acar, C.; Dincer, I. Comparative assessment of hydrogen production methods from renewable and non-renewable sources. Int. J. Hydrogen Energy 2014, 39, 1–12. [Google Scholar] [CrossRef]
  6. Liao, C.H.; Huang, C.W.; Wu, J. Hydrogen production from semiconductor-based photocatalysis via water splitting. Catalysts 2012, 2, 490–516. [Google Scholar] [CrossRef] [Green Version]
  7. Sapountzi, F.M.; Gracia, J.M.; Fredriksson, H.O.; Niemantsverdriet, J.H. Electrocatalysts for the generation of hydrogen, oxygen and synthesis gas. Prog. Energy Combust. Sci. 2017, 58, 1–35. [Google Scholar] [CrossRef] [Green Version]
  8. Yu, S.H.; Uan, J.Y.; Hsu, T.L. Effects of concentrations of NaCl and organic acid on generation of hydrogen from magnesium metal scrap. Int. J. Hydrogen Energy 2012, 37, 3033–3040. [Google Scholar] [CrossRef]
  9. Hosseini, S.E.; Abdul Wahid, M.; Jamil, M.; Azli, A.A.; Misbah, M.F. A review on biomass-based hydrogen production for renewable energy supply. Int. J. Energy Res. 2015, 39, 1597–1615. [Google Scholar] [CrossRef]
  10. Konsolakis, M.; Ioakimidis, Z.; Kraia, T.; Marnellos, G.E. Hydrogen production by ethanol steam reforming (ESR) over CeO2 supported transition metal (Fe, Co, Ni, Cu) catalysts: Insight into the structure-activity relationship. Catalysts 2016, 6, 39. [Google Scholar] [CrossRef] [Green Version]
  11. Hou, T.; Zhang, S.; Chen, Y.; Wang, D.; Cai, W. Hydrogen production from ethanol reforming: Catalysts and reaction mechanism. Renew. Sust. Energ. Rev. 2015, 44, 132–148. [Google Scholar] [CrossRef]
  12. Li, D.; Li, X.; Gong, J. Catalytic reforming of oxygenates: State of the art and future prospects. Chem. Rev. 2016, 116, 11529–11653. [Google Scholar] [CrossRef] [PubMed] [Green Version]
  13. Freni, S.; Mondello, N.; Cavallaro, S.; Cacciola, G.; Parmon, V.; Sobyanin, V. Hydrogen production by steam reforming of ethanol: A two step process. React. Kinet. Catal. Lett. 2000, 71, 143–152. [Google Scholar] [CrossRef]
  14. Sikander, U.; Sufian, S.; Salam, M. A review of hydrotalcite based catalysts for hydrogen production systems. Int. J. Hydrogen Energy 2017, 42, 19851–19868. [Google Scholar] [CrossRef]
  15. Syu, J.H.; Uan, J.Y.; Lin, M.C.; Lin, Z.Y. Optically transparent Li–Al–CO3 layered double hydroxide thin films on an AZ31 Mg alloy formed by electrochemical deposition and their corrosion resistance in a dilute chloride environment. Corros. Sci. 2013, 68, 238–248. [Google Scholar] [CrossRef]
  16. Lin, M.C.; Chang, F.T.; Uan, J.Y. Aqueous Li+/Al3+ alkaline solution for CO2 capture and the massive Li–Al–CO3 hydrotalcite precipitation during the interaction between CO2 gas and the Li+/Al3+ aqueous solution. J. Mater. Chem. A. 2013, 1, 14773–14782. [Google Scholar] [CrossRef] [Green Version]
  17. Huang, S.H.; Liu, S.J.; Uan, J.Y. Controllable luminescence of a Li–Al layered double hydroxide used as a sensor for reversible sensing of carbonate. J. Mater. Chem. C. 2019, 7, 11191–11206. [Google Scholar] [CrossRef]
  18. Stepanova, L.; Belskaya, O.; Vasilevich, A.; Gulyaeva, T.; Leont’eva, N.; Serkova, A.; Salanov, A.; Likholobov, V. The study of structural, textural and basic properties of MgAl-and LiAl-LDH prepared by mechanochemical method. Catal. Today 2019. [Google Scholar] [CrossRef]
  19. Di Cosimo, J.; Dıez, V.; Xu, M.; Iglesia, E.; Apesteguıa, C. Structure and surface and catalytic properties of Mg-Al basic oxides. J. Catal. 1998, 178, 499–510. [Google Scholar] [CrossRef] [Green Version]
  20. Cybulski, A.; Moulijn, J.A. Structured Catalysts and Reactors; CRC Press: Boca Raton, FL, USA, 2005. [Google Scholar]
  21. López, E.; Divins, N.J.; Anzola, A.; Schbib, S.; Borio, D.; Llorca, J. Ethanol steam reforming for hydrogen generation over structured catalysts. Int. J. Hydrogen Energy 2013, 38, 4418–4428. [Google Scholar] [CrossRef]
  22. Palma, V.; Ruocco, C.; Castaldo, F.; Ricca, A.; Boettge, D. Ethanol steam reforming over bimetallic coated ceramic foams: Effect of reactor configuration and catalytic support. Int. J. Hydrogen Energy 2015, 40, 12650–12662. [Google Scholar] [CrossRef]
  23. Santander, J.A.; Tonetto, G.M.; Pedernera, M.N.; López, E. Ni/CeO2–MgO catalysts supported on stainless steel plates for ethanol steam reforming. Int. J. Hydrogen Energy 2017, 42, 9482–9492. [Google Scholar] [CrossRef]
  24. Palma, V.; Gallucci, F.; Pullumbi, P.; Ruocco, C.; Meloni, E.; Martino, M. Pt/Re/CeO2 Based Catalysts for CO-Water–Gas Shift Reaction: From Powders to Structured Catalyst. Catalysts 2020, 10, 564. [Google Scholar] [CrossRef]
  25. Wang, S.L.; Lin, C.H.; Yan, Y.Y.; Wang, M.K. Synthesis of Li/Al LDH using aluminum and LiOH. Appl. Clay Sci. 2013, 72, 191–195. [Google Scholar] [CrossRef]
  26. Liang, X.; Zang, Y.; Xu, Y.; Tan, X.; Hou, W.; Wang, L.; Sun, Y. Sorption of metal cations on layered double hydroxides. Colloids Surf. A 2013, 433, 122–131. [Google Scholar] [CrossRef]
  27. Huang, L.; Wang, J.; Gao, Y.; Qiao, Y.; Zheng, Q.; Guo, Z.; Zhao, Y.; O’Hare, D.; Wang, Q. Synthesis of LiAl2-layered double hydroxides for CO2 capture over a wide temperature range. J. Mater. Chem. A 2014, 2, 18454–18462. [Google Scholar] [CrossRef]
  28. Choong, C.K.; Huang, L.; Zhong, Z.; Lin, J.; Hong, L.; Chen, L. Effect of calcium addition on catalytic ethanol steam reforming of Ni/Al2O3: II. Acidity/basicity, water adsorption and catalytic activity. Appl. Catal. A 2011, 407, 155–162. [Google Scholar] [CrossRef]
  29. Li, Z.; Hu, X.; Zhang, L.; Liu, S.; Lu, G. Steam reforming of acetic acid over Ni/ZrO2 catalysts: Effects of nickel loading and particle size on product distribution and coke formation. Appl. Catal. A 2012, 417, 281–289. [Google Scholar] [CrossRef]
  30. Meng, F.; Li, X.; Li, M.; Cui, X.; Li, Z. Catalytic performance of CO methanation over La-promoted Ni/Al2O3 catalyst in a slurry-bed reactor. Chem. Eng. J. 2017, 313, 1548–1555. [Google Scholar] [CrossRef]
  31. Chen, G.; Tao, J.; Liu, C.; Yan, B.; Li, W.; Li, X. Steam reforming of acetic acid using Ni/Al2O3 catalyst: Influence of crystalline phase of Al2O3 support. Int. J. Hydrogen Energy 2017, 42, 20729–20738. [Google Scholar] [CrossRef]
  32. Chen, L.C.; Lin, S.D. The ethanol steam reforming over Cu-Ni/SiO2 catalysts: Effect of Cu/Ni ratio. Appl. Catal. B 2011, 106, 639–649. [Google Scholar] [CrossRef]
  33. Knapp, R.; Wyrzgol, S.A.; Jentys, A.; Lercher, J.A. Water–gas shift catalysts based on ionic liquid mediated supported Cu nanoparticles. J. Catal. 2010, 276, 280–291. [Google Scholar] [CrossRef]
  34. Wang, Z.Q.; Xu, Z.N.; Peng, S.Y.; Zhang, M.J.; Lu, G.; Chen, Q.S.; Chen, Y.; Guo, G.C. High-performance and long-lived Cu/SiO2 nanocatalyst for CO2 hydrogenation. ACS Catal. 2015, 5, 4255–4259. [Google Scholar] [CrossRef]
  35. Zhang, X.; Zhu, X.; Lin, L.; Yao, S.; Zhang, M.; Liu, X.; Wang, X.; Li, Y.-W.; Shi, C.; Ma, D. Highly dispersed copper over β-Mo2C as an efficient and stable catalyst for the reverse water gas shift (RWGS) reaction. ACS Catal. 2017, 7, 912–918. [Google Scholar] [CrossRef]
  36. Lee, C.H.; Kim, S.; Yoon, H.J.; Yoon, C.W.; Lee, K.B. Water gas shift and sorption-enhanced water gas shift reactions using hydrothermally synthesized novel Cu–Mg–Al hydrotalcite-based catalysts for hydrogen production. Renew. Sust. Energ. Rev. 2021, 145, 111064. [Google Scholar] [CrossRef]
  37. Marks, K.; Besharat, Z.; Soldemo, M.; Önsten, A.; Weissenrieder, J.; Stenlid, J.H.; Öström, H.; Göthelid, M. Adsorption and Decomposition of Ethanol on Cu2O (111) and (100). J. Phys. Chem. C 2019, 123, 20384–20392. [Google Scholar] [CrossRef]
  38. Sato, A.G.; Volanti, D.P.; de Freitas, I.C.; Longo, E.; Bueno, J.M.C. Site-selective ethanol conversion over supported copper catalysts. Catal. Commun. 2012, 26, 122–126. [Google Scholar] [CrossRef]
  39. Cunha, A.F.; Wu, Y.-J.; Li, P.; Yu, J.-G.; Rodrigues, A.E. Sorption-enhanced steam reforming of ethanol on a novel K–Ni–Cu–hydrotalcite hybrid material. Ind. Eng. Chem. Res. 2014, 53, 3842–3853. [Google Scholar] [CrossRef]
  40. Chen, F.; Tao, Y.; Ling, H.; Zhou, C.; Liu, Z.; Huang, J.; Yu, A. Ni-Cu bimetallic catalysts on Yttria-stabilized zirconia for hydrogen production from ethanol steam reforming. Fuel 2020, 280, 118612. [Google Scholar] [CrossRef]
  41. Dai, R.; Zheng, Z.; Lian, C.; Shi, K.; Wu, X.; An, X.; Xie, X. A sinter-resistant catalytic system based on ultra-small Ni–Cu nanoparticles encapsulated in Ca–SiO2 for high-performance ethanol steam reforming. Nanoscale 2020, 12, 16605–16616. [Google Scholar] [CrossRef]
  42. Niazi, Z.; Irankhah, A.; Wang, Y.; Arandiyan, H. Cu, Mg and Co effect on nickel-ceria supported catalysts for ethanol steam reforming reaction. Int. J. Hydrogen Energy 2020, 45, 21512–21522. [Google Scholar] [CrossRef]
  43. Zheng, Z.; Sun, C.; Dai, R.; Wang, S.; Wu, X.; An, X.; Wu, Z.; Xie, X. Ethanol steam reforming on Ni-based catalysts: Effect of Cu and Fe addition on the catalytic activity and resistance to deactivation. Energy Fuels 2017, 31, 3091–3100. [Google Scholar] [CrossRef]
  44. Devrim, Y.; Albostan, A.; Devrim, H. Experimental investigation of CO tolerance in high temperature PEM fuel cells. Int. J. Hydrogen Energy 2018, 43, 18672–18681. [Google Scholar] [CrossRef]
  45. Ochoa, A.; Aramburu, B.; Ibáñez, M.; Valle, B.; Bilbao, J.; Gayubo, A.G.; Castaño, P. Compositional insights and valorization pathways for carbonaceous material deposited during bio-oil thermal treatment. ChemSusChem 2014, 7, 2597–2608. [Google Scholar] [CrossRef] [PubMed]
  46. Montero, C.; Ochoa, A.; Castaño, P.; Bilbao, J.; Gayubo, A.G. Monitoring Ni0 and coke evolution during the deactivation of a Ni/La2O3–αAl2O3 catalyst in ethanol steam reforming in a fluidized bed. J. Catal. 2015, 331, 181–192. [Google Scholar] [CrossRef]
  47. Ochoa, A.; Arregi, A.; Amutio, M.; Gayubo, A.G.; Olazar, M.; Bilbao, J.; Castaño, P. Coking and sintering progress of a Ni supported catalyst in the steam reforming of biomass pyrolysis volatiles. Appl. Catal. B 2018, 233, 289–300. [Google Scholar] [CrossRef]
  48. Merlen, A.; Buijnsters, J.G.; Pardanaud, C. A guide to and review of the use of multiwavelength Raman spectroscopy for characterizing defective aromatic carbon solids: From graphene to amorphous carbons. Coatings 2017, 7, 153. [Google Scholar] [CrossRef]
  49. Velasquez, M.; Batiot-Dupeyrat, C.; Gallego, J.; Santamaria, A. Chemical and morphological characterization of multi-walled-carbon nanotubes synthesized by carbon deposition from an ethanol–glycerol blend. Diam. Relat. Mater. 2014, 50, 38–48. [Google Scholar] [CrossRef]
  50. Charisiou, N.; Tzounis, L.; Sebastian, V.; Hinder, S.; Baker, M.; Polychronopoulou, K.; Goula, M. Investigating the correlation between deactivation and the carbon deposited on the surface of Ni/Al2O3 and Ni/La2O3-Al2O3 catalysts during the biogas reforming reaction. Appl. Surf. Sci. 2019, 474, 42–56. [Google Scholar] [CrossRef] [Green Version]
Figure 1. GAXRD patterns of: (a) Li–Al–CO3 LDH coating on aluminum lathe waste by electrodeposition; (b) the coated material after calcination at 500 °C for 3 h. SEM surface morphologies of: (c) Li–Al–CO3 LDH coating on aluminum lathe waste by electrodeposition; (d) the coated material after calcination at 500 °C.
Catalysts 11 01124 g001
Figure 2. (a) TPD-CO2; (b) TPD-NH3 profiles of the LiAlO2 support.
Catalysts 11 01124 g002
Figure 3. GAXRD patterns of the reduced catalysts obtained herein: (a) Ni/LiAlO2; (b) Cu/LiAlO2. SEM surface morphologies of the reduced catalysts obtained herein: (c) Ni/LiAlO2; (d) Cu/LiAlO2.
Catalysts 11 01124 g003
Figure 4. TEM cross-sectional observations of the Ni/LiAlO2 catalyst: (a) bright-field image; (b) dark-field image; (c) magnified view of particles in Figure 4a; (d) selected area diffraction pattern of the particles.
Catalysts 11 01124 g004
Figure 5. TEM cross-sectional observations of the Cu/LiAlO2 catalyst: (a) bright-field image; (b) dark-field image; (c) magnified view of the particle framed by the red dotted line in Figure 5a. Selected area diffraction patterns of: (d) the particle framed by the red dotted line in Figure 5a; (e) the area framed by the blue dotted line in Figure 5a.
Catalysts 11 01124 g005
Figure 6. XPS surface spectra of the reduced catalysts obtained herein: (a) Ni 2p3/2 of Ni/LiAlO2, the surface data is compared with the subsurface data (sputtering for 20 s); (b) Cu 2p of Cu/LiAlO2; (c) Cu LMM AES spectrum of Cu/LiAlO2.
Catalysts 11 01124 g006
Figure 7. Ethanol conversion (XEtOH) and yields of gas-phase products in ESR over various catalyst configurations. Ethanol aqueous solution with a feed rate of 0.5 mL/min was vaporized and mixed with N2 flow for a total gas feed rate of 1000 mL/min. Reaction conditions: temperature = 500 °C; steam/ethanol (S/E) molar ratio = 10.
Catalysts 11 01124 g007
Figure 8. Effect of temperature on ethanol conversion (XEtOH) and gas yields in ESR over the 6Ni catalyst configuration at a reaction time of 1 h. Reaction conditions: S/E = 10; space time = 3.42 gcatal.∙min/gEtOH.
Catalysts 11 01124 g008
Figure 9. Effect of temperature on ethanol conversion (XEtOH) and gas yields in ESR over the 6Cu_6Ni catalyst configuration at a reaction time of 1 h. Reaction conditions: S/E = 10; space time = 3.42 gcatal.∙min/gEtOH (space time is only based on the weight of Ni/LiAlO2 catalyst, which is the same as that of 6Ni).
Catalysts 11 01124 g009
Figure 10. Ethanol conversion (XEtOH) and gas yields vs. reaction time over: (a) 6Ni; (b) 6Cu_6Ni catalyst configurations. Reaction conditions: temperature = 500 °C; S/E = 10; space time = 3.42 gcatal.∙min/gEtOH.
Catalysts 11 01124 g010
Figure 11. SEM surface morphologies of the spent catalysts that were used in 5-h reactions of ESR: (a) Ni/LiAlO2@6Ni; (b) Ni/LiAlO2@6Cu_6Ni. TEM cross-sectional images of the spent catalysts that were used in 5-h reactions of ESR: (c) Ni/LiAlO2@6Ni; (d) Ni/LiAlO2@6Cu_6Ni. Reaction conditions: same as that described in Figure 10.
Catalysts 11 01124 g011
Figure 12. (a) FTIR spectra; (b) the relative fractions of peak area of the absorbance bands in each FTIR spectrum; (c) Raman spectra of the coke on spent Ni/LiAlO2@6Cu_6Ni and Ni/LiAlO2@6Ni catalysts that were used in the 5-h reactions of ESR. Reaction conditions: same as that described in Figure 10.
Catalysts 11 01124 g012
Figure 13. TPO profiles of the spent Ni/LiAlO2@6Ni and Ni/LiAlO2@6Cu_6Ni catalysts that had been tested after 5-h reactions of ESR. Reaction conditions: the same as that described in Figure 10.
Catalysts 11 01124 g013
Figure 14. The photograph of the aluminum lathe waste strip ball working as a structured framework (this picture showing the framework before LDH and catalyst depositions), which would be employed as the substrate of the structured catalyst.
Catalysts 11 01124 g014
Table 1. The fractions of different sites (weak, medium, and strong sites) of the total number of CO2/NH3 desorption sites on LiAlO2 according to the TPD profiles.
SiteCO2 DesorptionNH3 Desorption
Weak (%)7.325.29
Medium (%)60.9859.47
Strong (%)31.7135.24
B/A a1.44 a
a Total number of basic sites (B) over total number of acid sites (A), based on the ratio of the total area of peaks of TPD-CO2 and TPD-NH3.
Table 2. Surface elemental composition of the reduced catalysts as determined by XPS.
CatalystXPS Compositions
O (at.%)Al (at.%)Ni (at.%)Cu (at.%)
Ni/LiAlO268.713.717.5--
Cu/LiAlO271.816.0--12.3
Table 3. Comparison of H2 yield and gas composition in ESR over various catalysts at 500 °C.
CatalystReaction ConditionsH2 Yield (%)Gas Composition (vol.%)Ref.
S/ESpace Time
(gcatal.·min/gEtOH)
H2CO2COCH4
6Ni a,b103.4249.0769.7217.372.5110.40This work
6Cu_6Ni a,b103.4256.6370.3218.320.4810.88This work
Rh–Pd/CeO2 b,d610.04~33~53~24~3~20[21]
Pt–Ni/CeO2–ZrO2 b,d36.39~46~60~21~6~13[22]
Ni/CeO2–MgO b6101.13~53~62~23~3~12[23]
K-Cu–Ni/Mg–Al LDH c,d1014.22~67~67~21~2~10[39]
Cu–Ni/YSZ c,d38.15~37~61~18~8~13[40]
Cu–Ni@Ca–SiO2 c,d68.33-- e~70~15~7~8[41]
Cu–Ni/CeO2 c,d611.19-- e~69~18~2~11[42]
Cu–Ni/Zeolite c,d88.16-- e~71~20~3~6[43]
a 6Ni (i.e., Ni/LiAlO2) and 6Cu_6Ni (i.e., Cu/LiAlO2_Ni/LiAlO2) catalyst configurations at reaction time of 1 h. Reaction conditions: steam/ethanol (S/E) molar ratio, S/E = 10; space time = 3.42 gcatal.∙min/gEtOH, where gcatal and gEtoch are the weight used for reaction. b Structured catalysts. c Powdered catalysts. d Bimetal catalysts. e Not given.
Publisher’s Note: MDPI stays neutral with regard to jurisdictional claims in published maps and institutional affiliations.

