
Creating and Preserving Nanoparticles during Co-Sintering of Solid Oxide Electrodes and Its Impact on Electrocatalytic Activity


Abstract
:1. Introduction
2. Results and Discussion
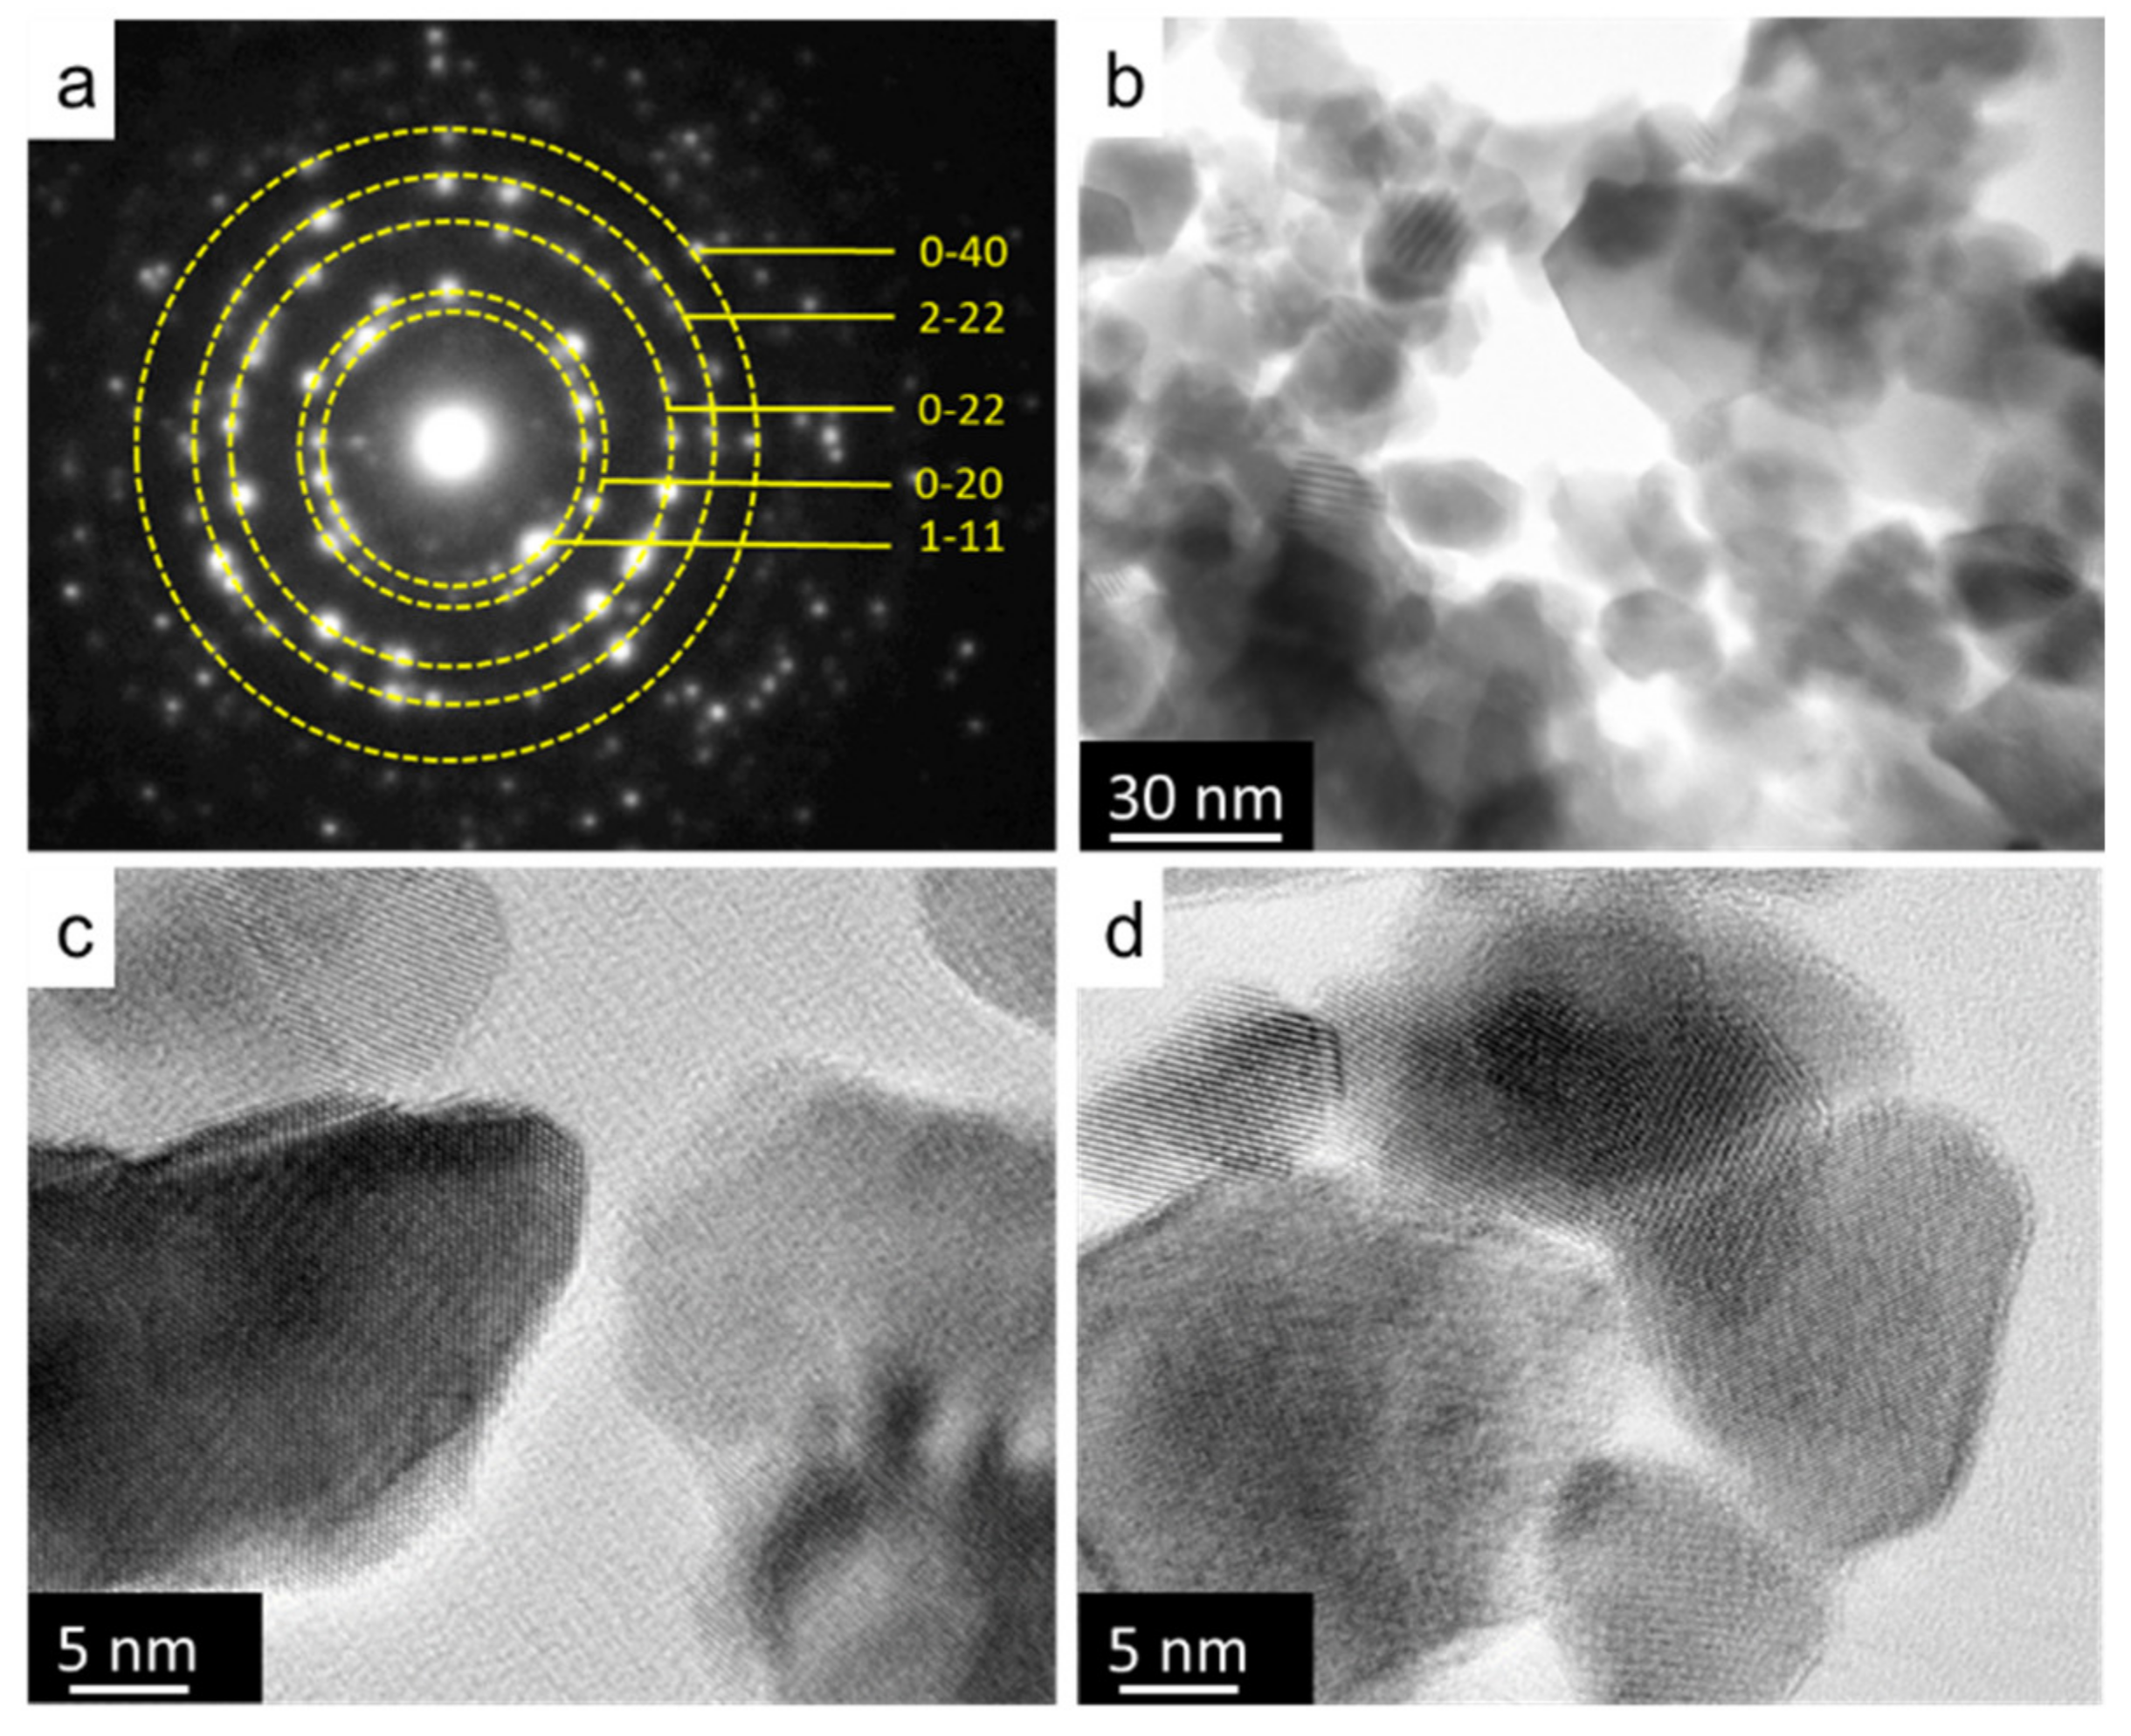
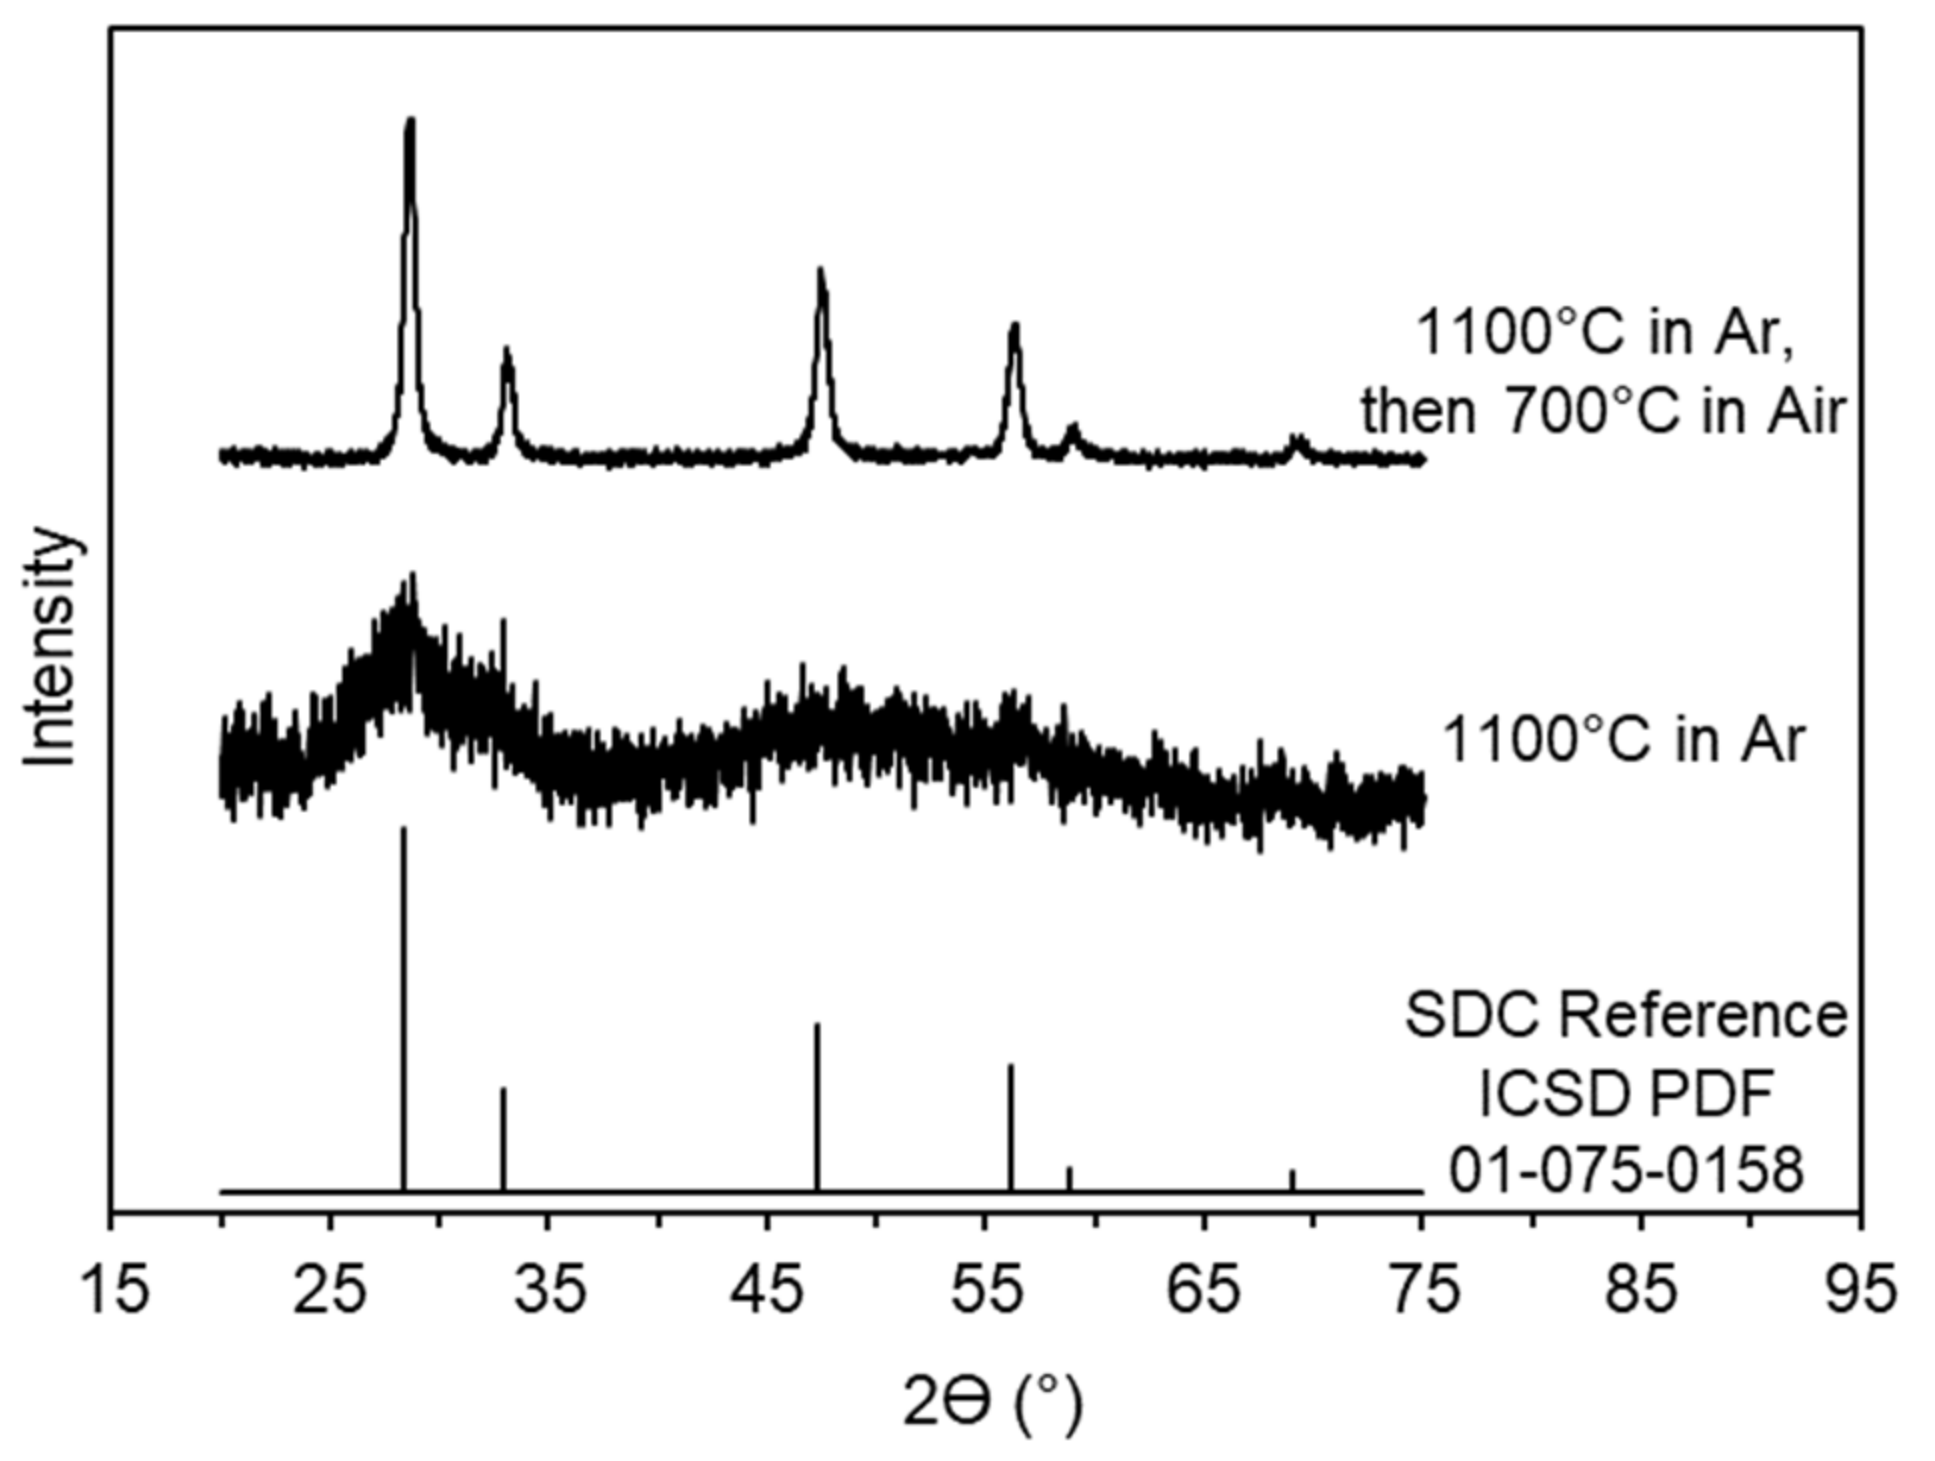
2.1. Material Characterization
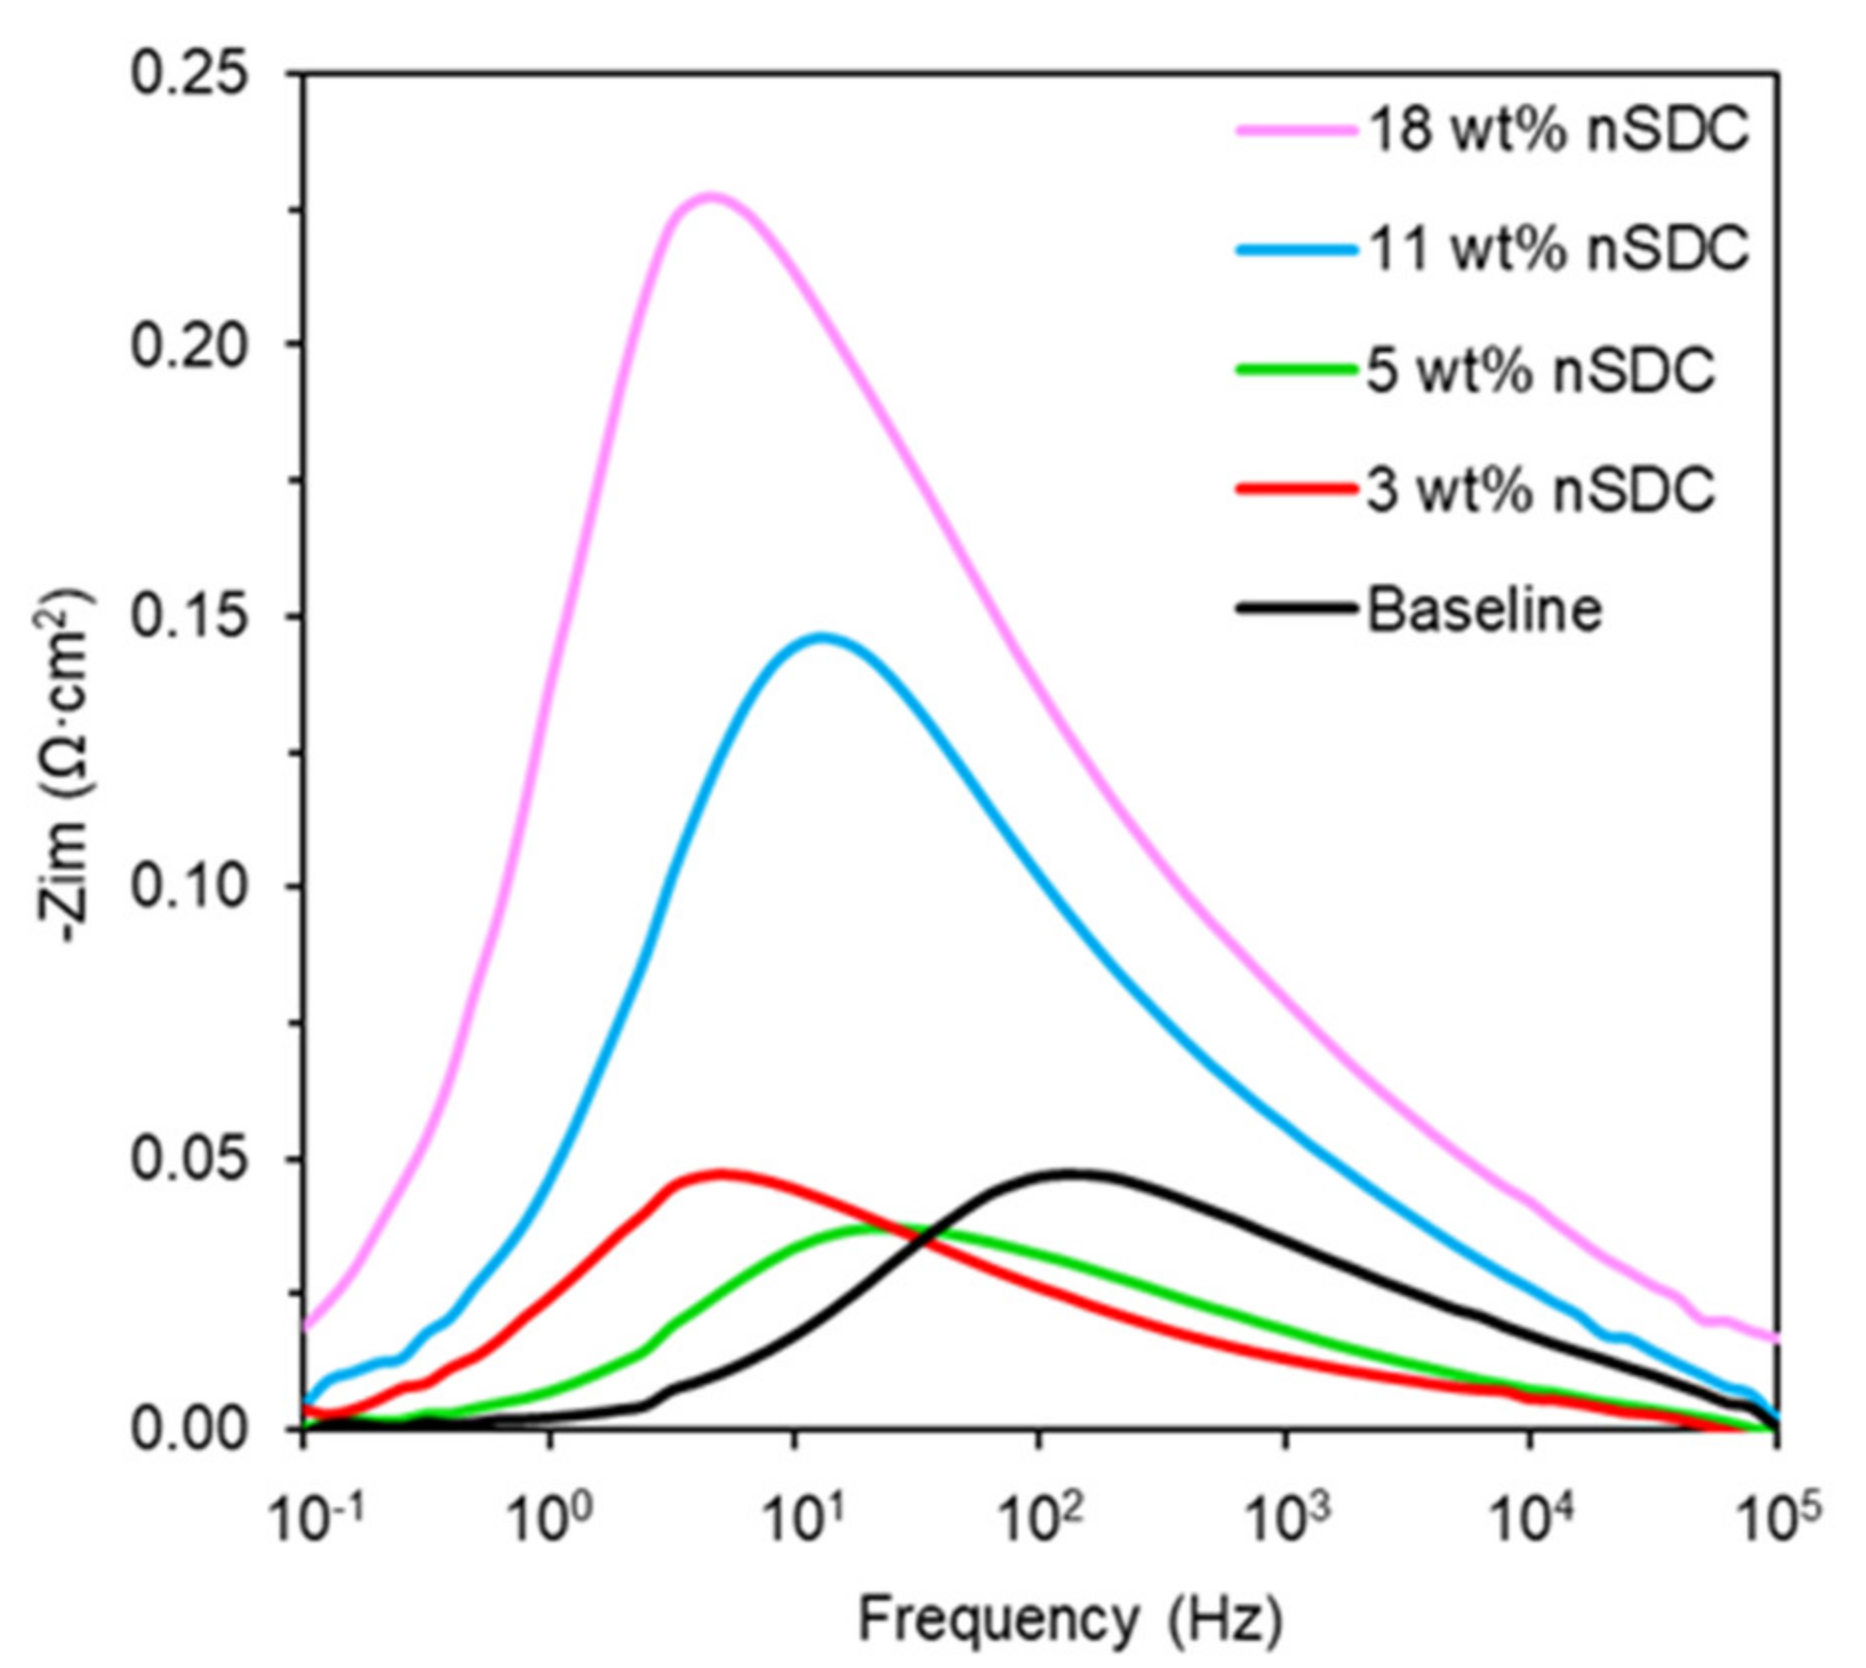
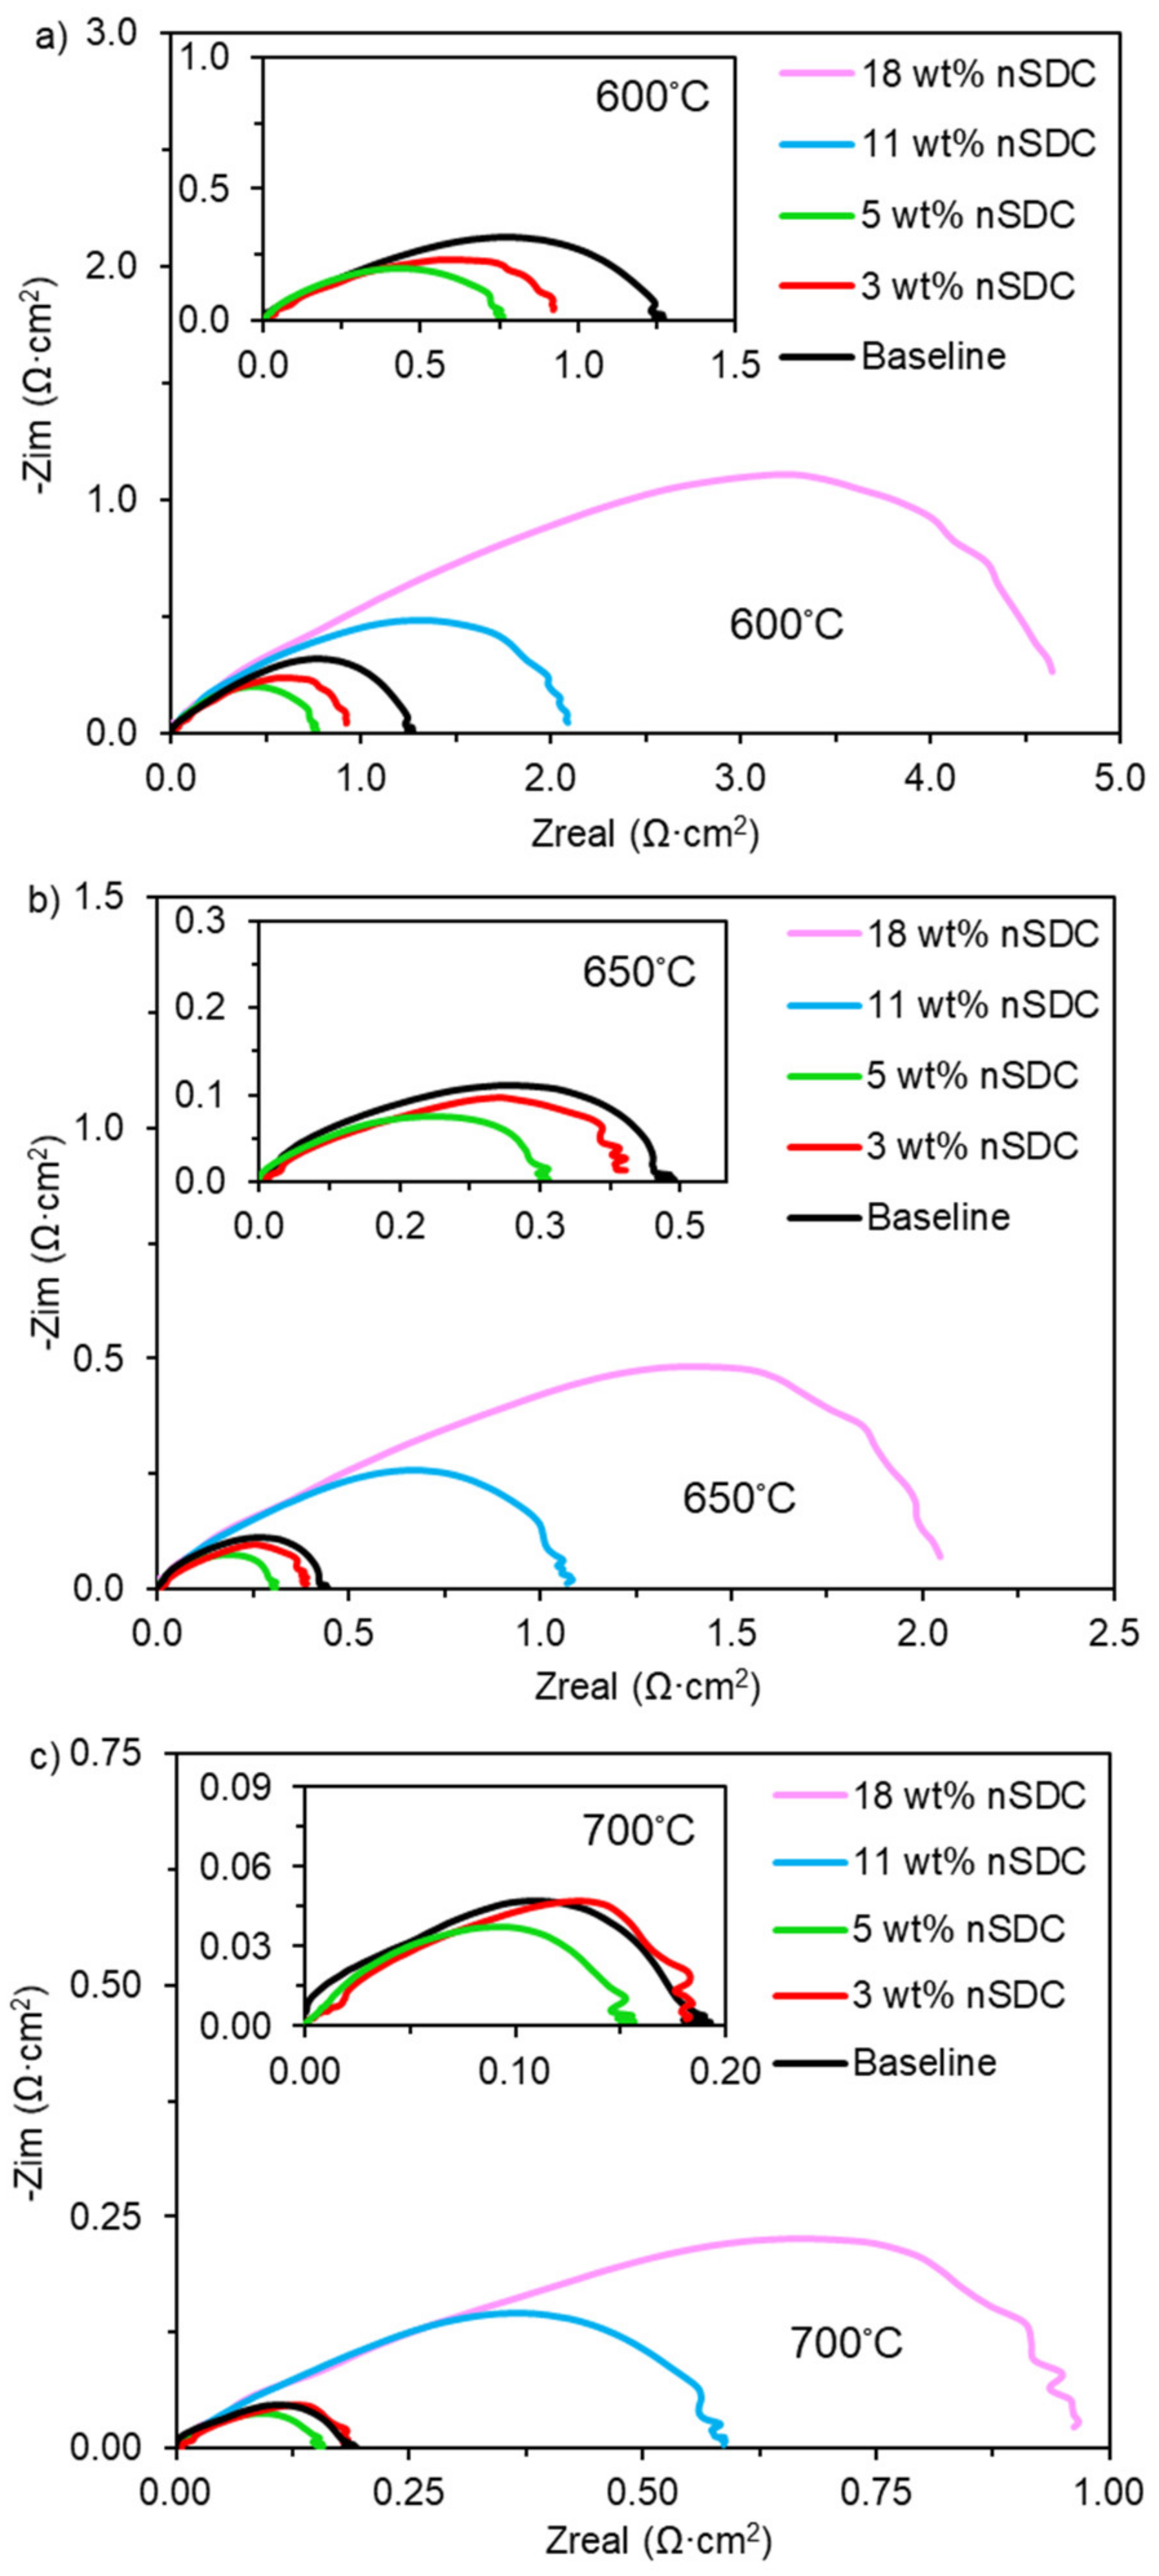
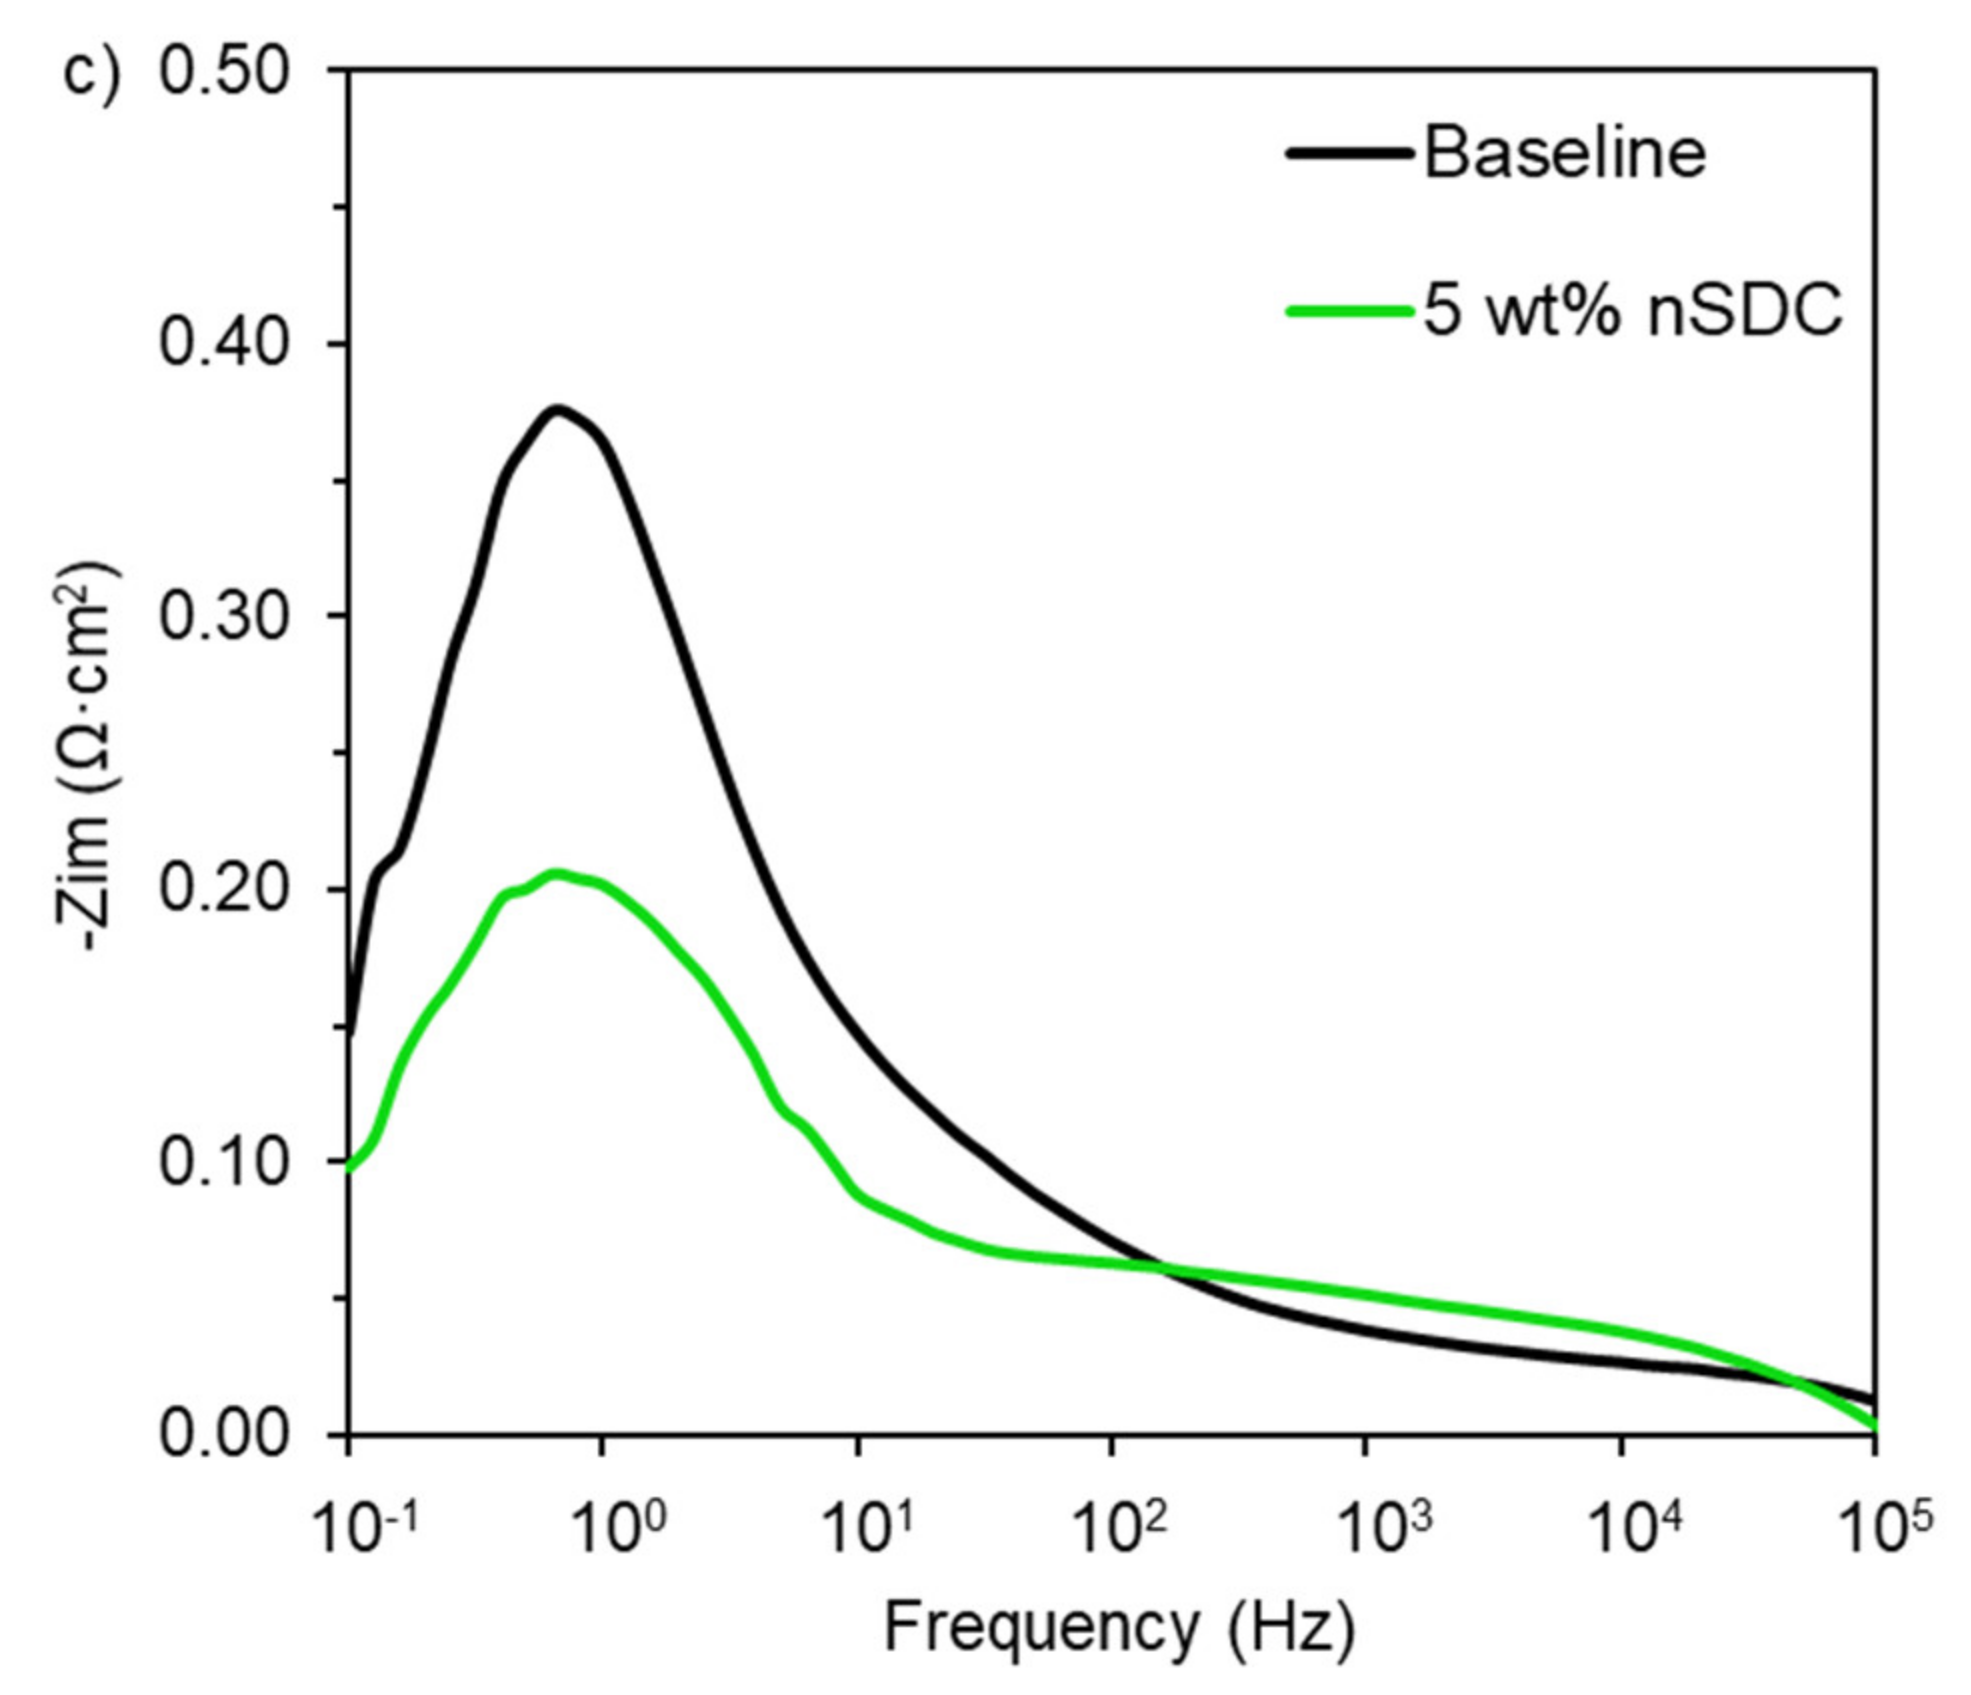
2.2. Symmetrical Cell Electrochemical Analysis
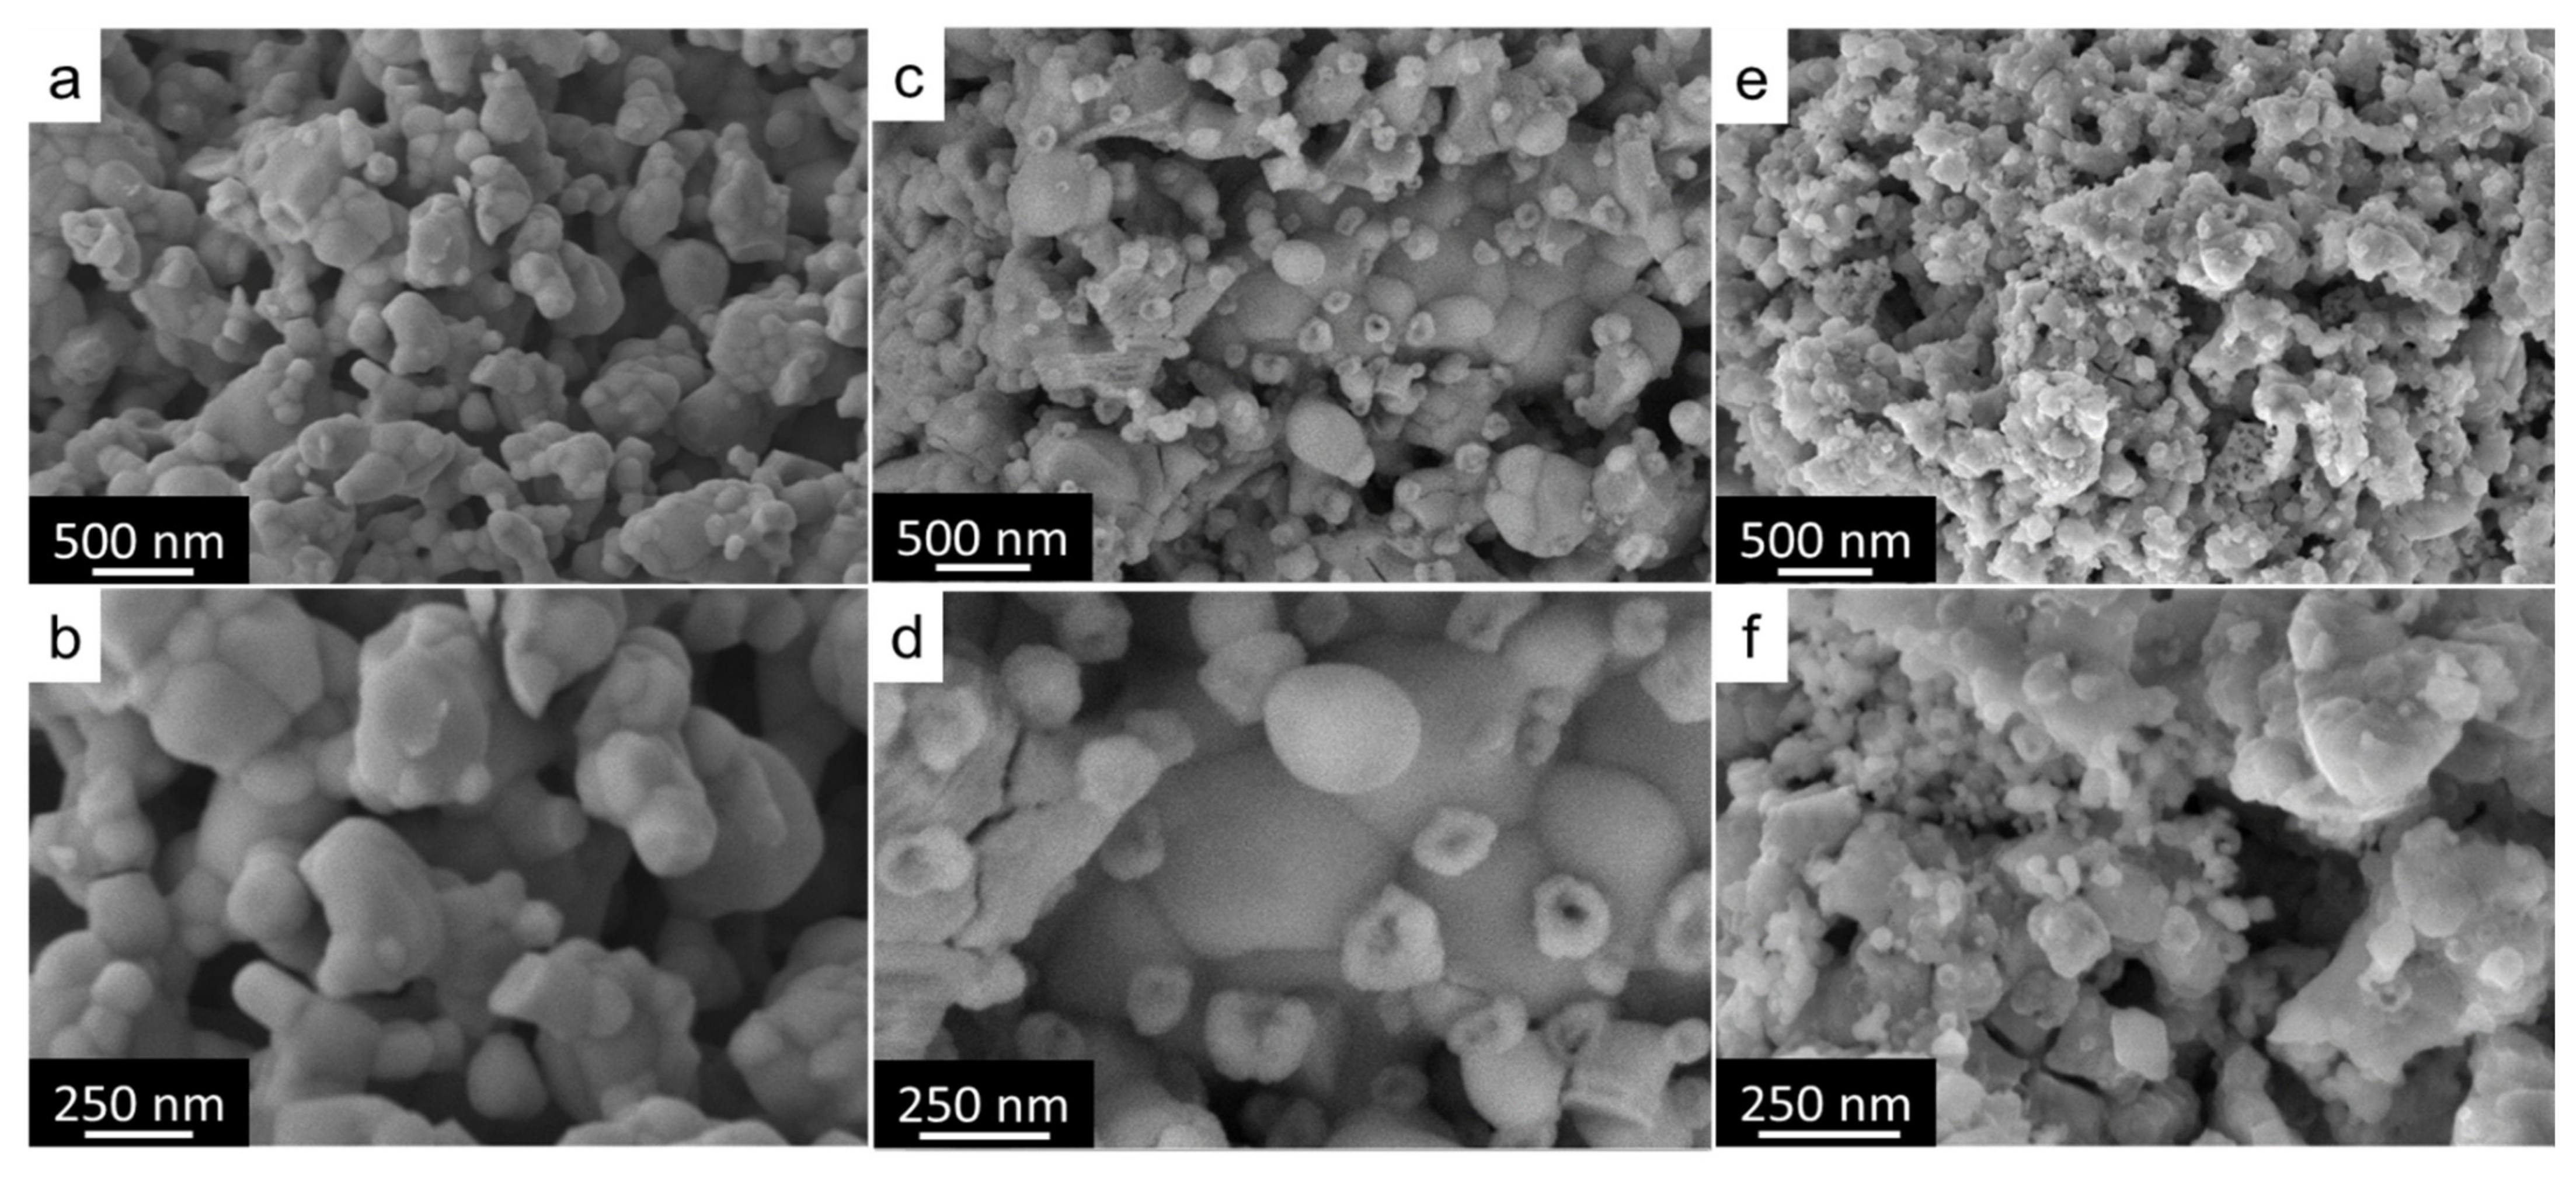
2.3. Morphological Analysis
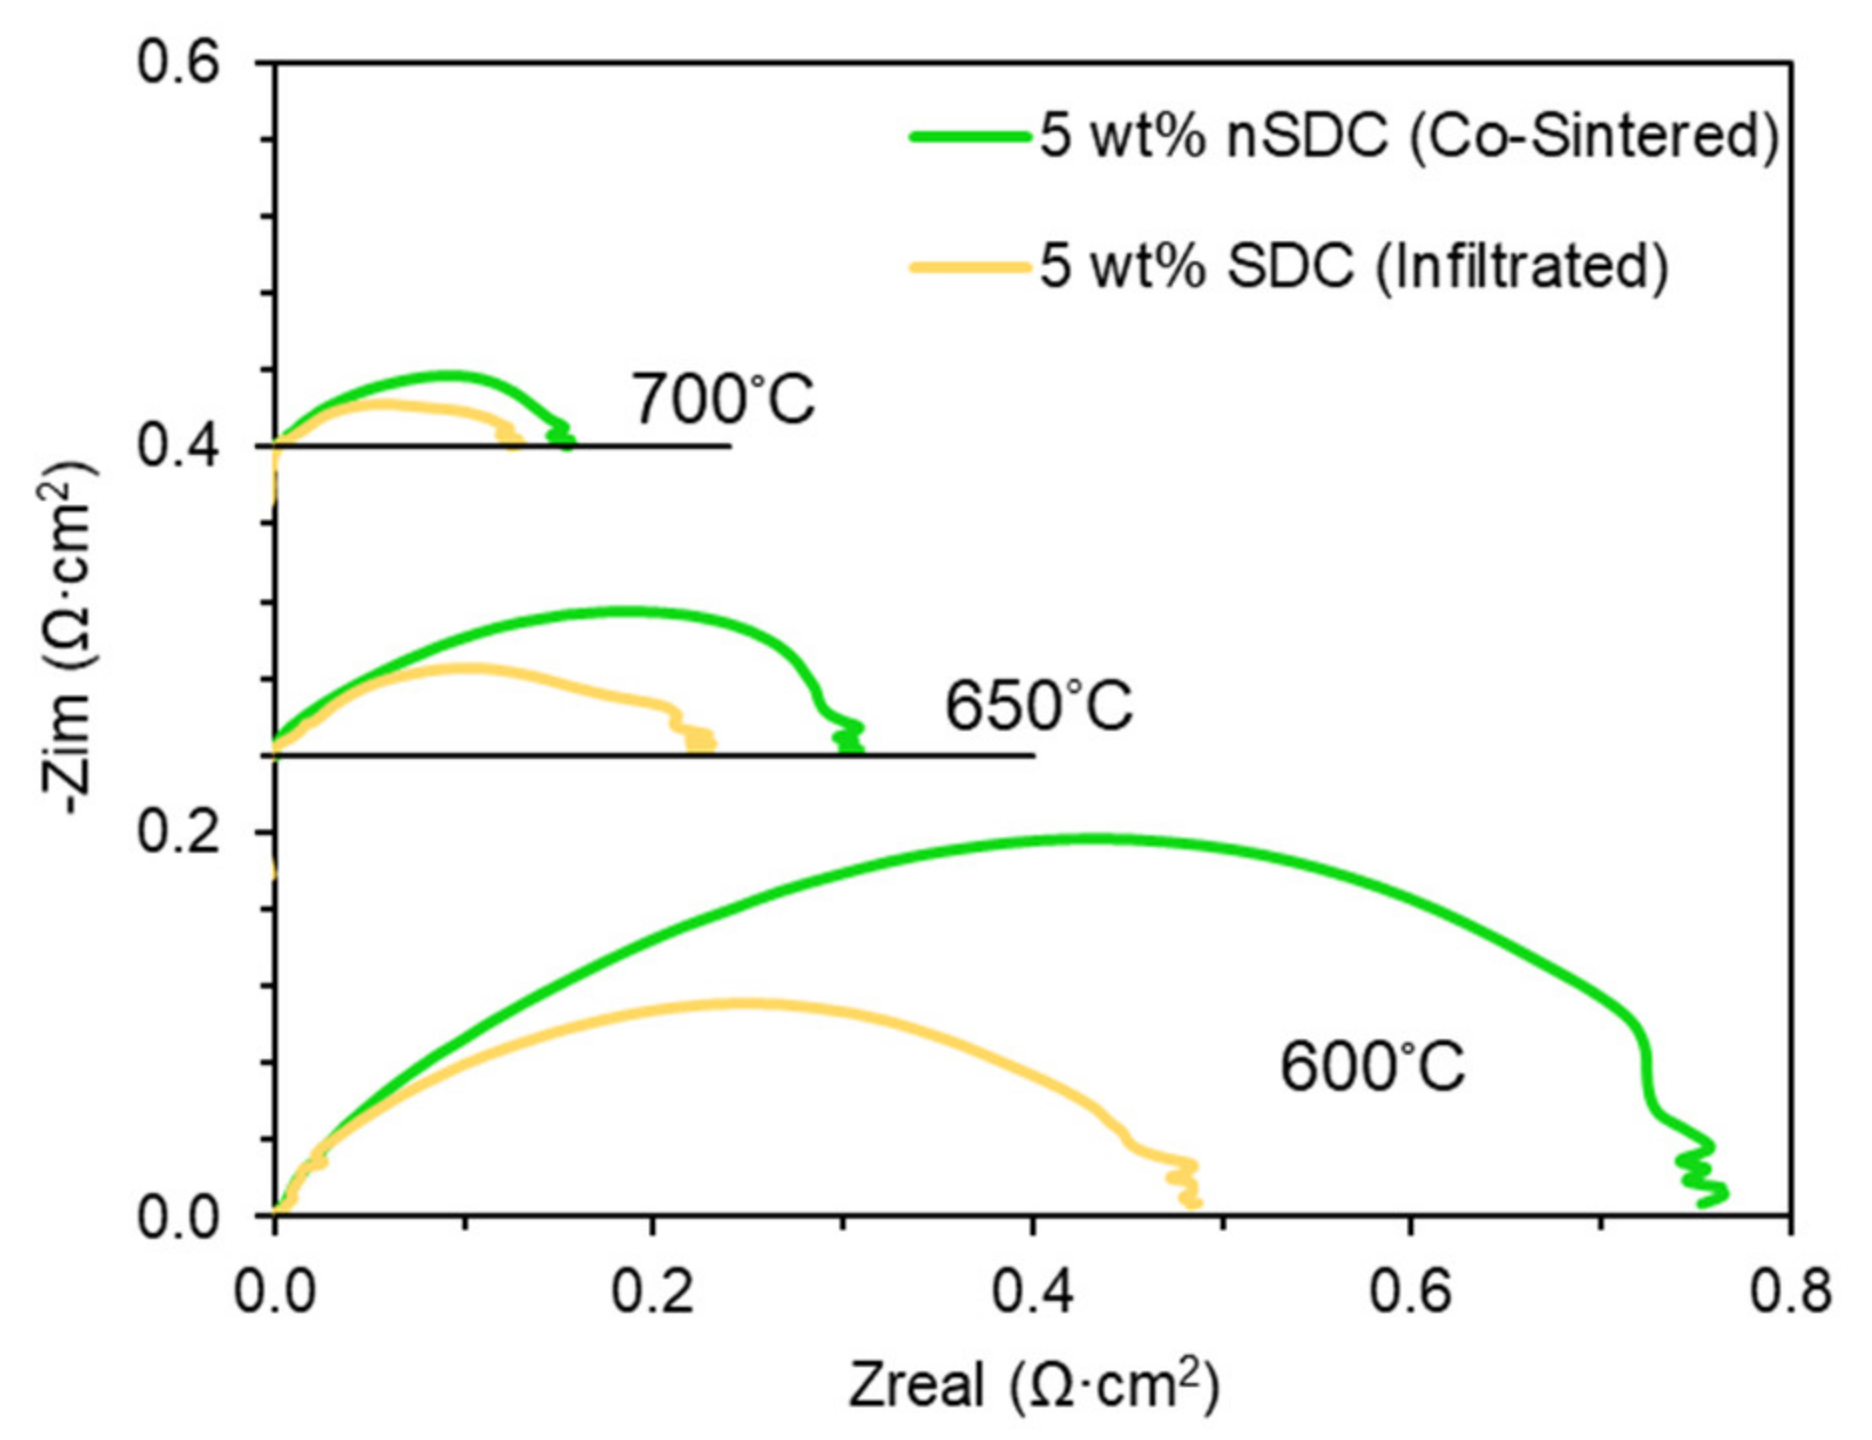
2.4. Infiltrated Symmetrical Cell
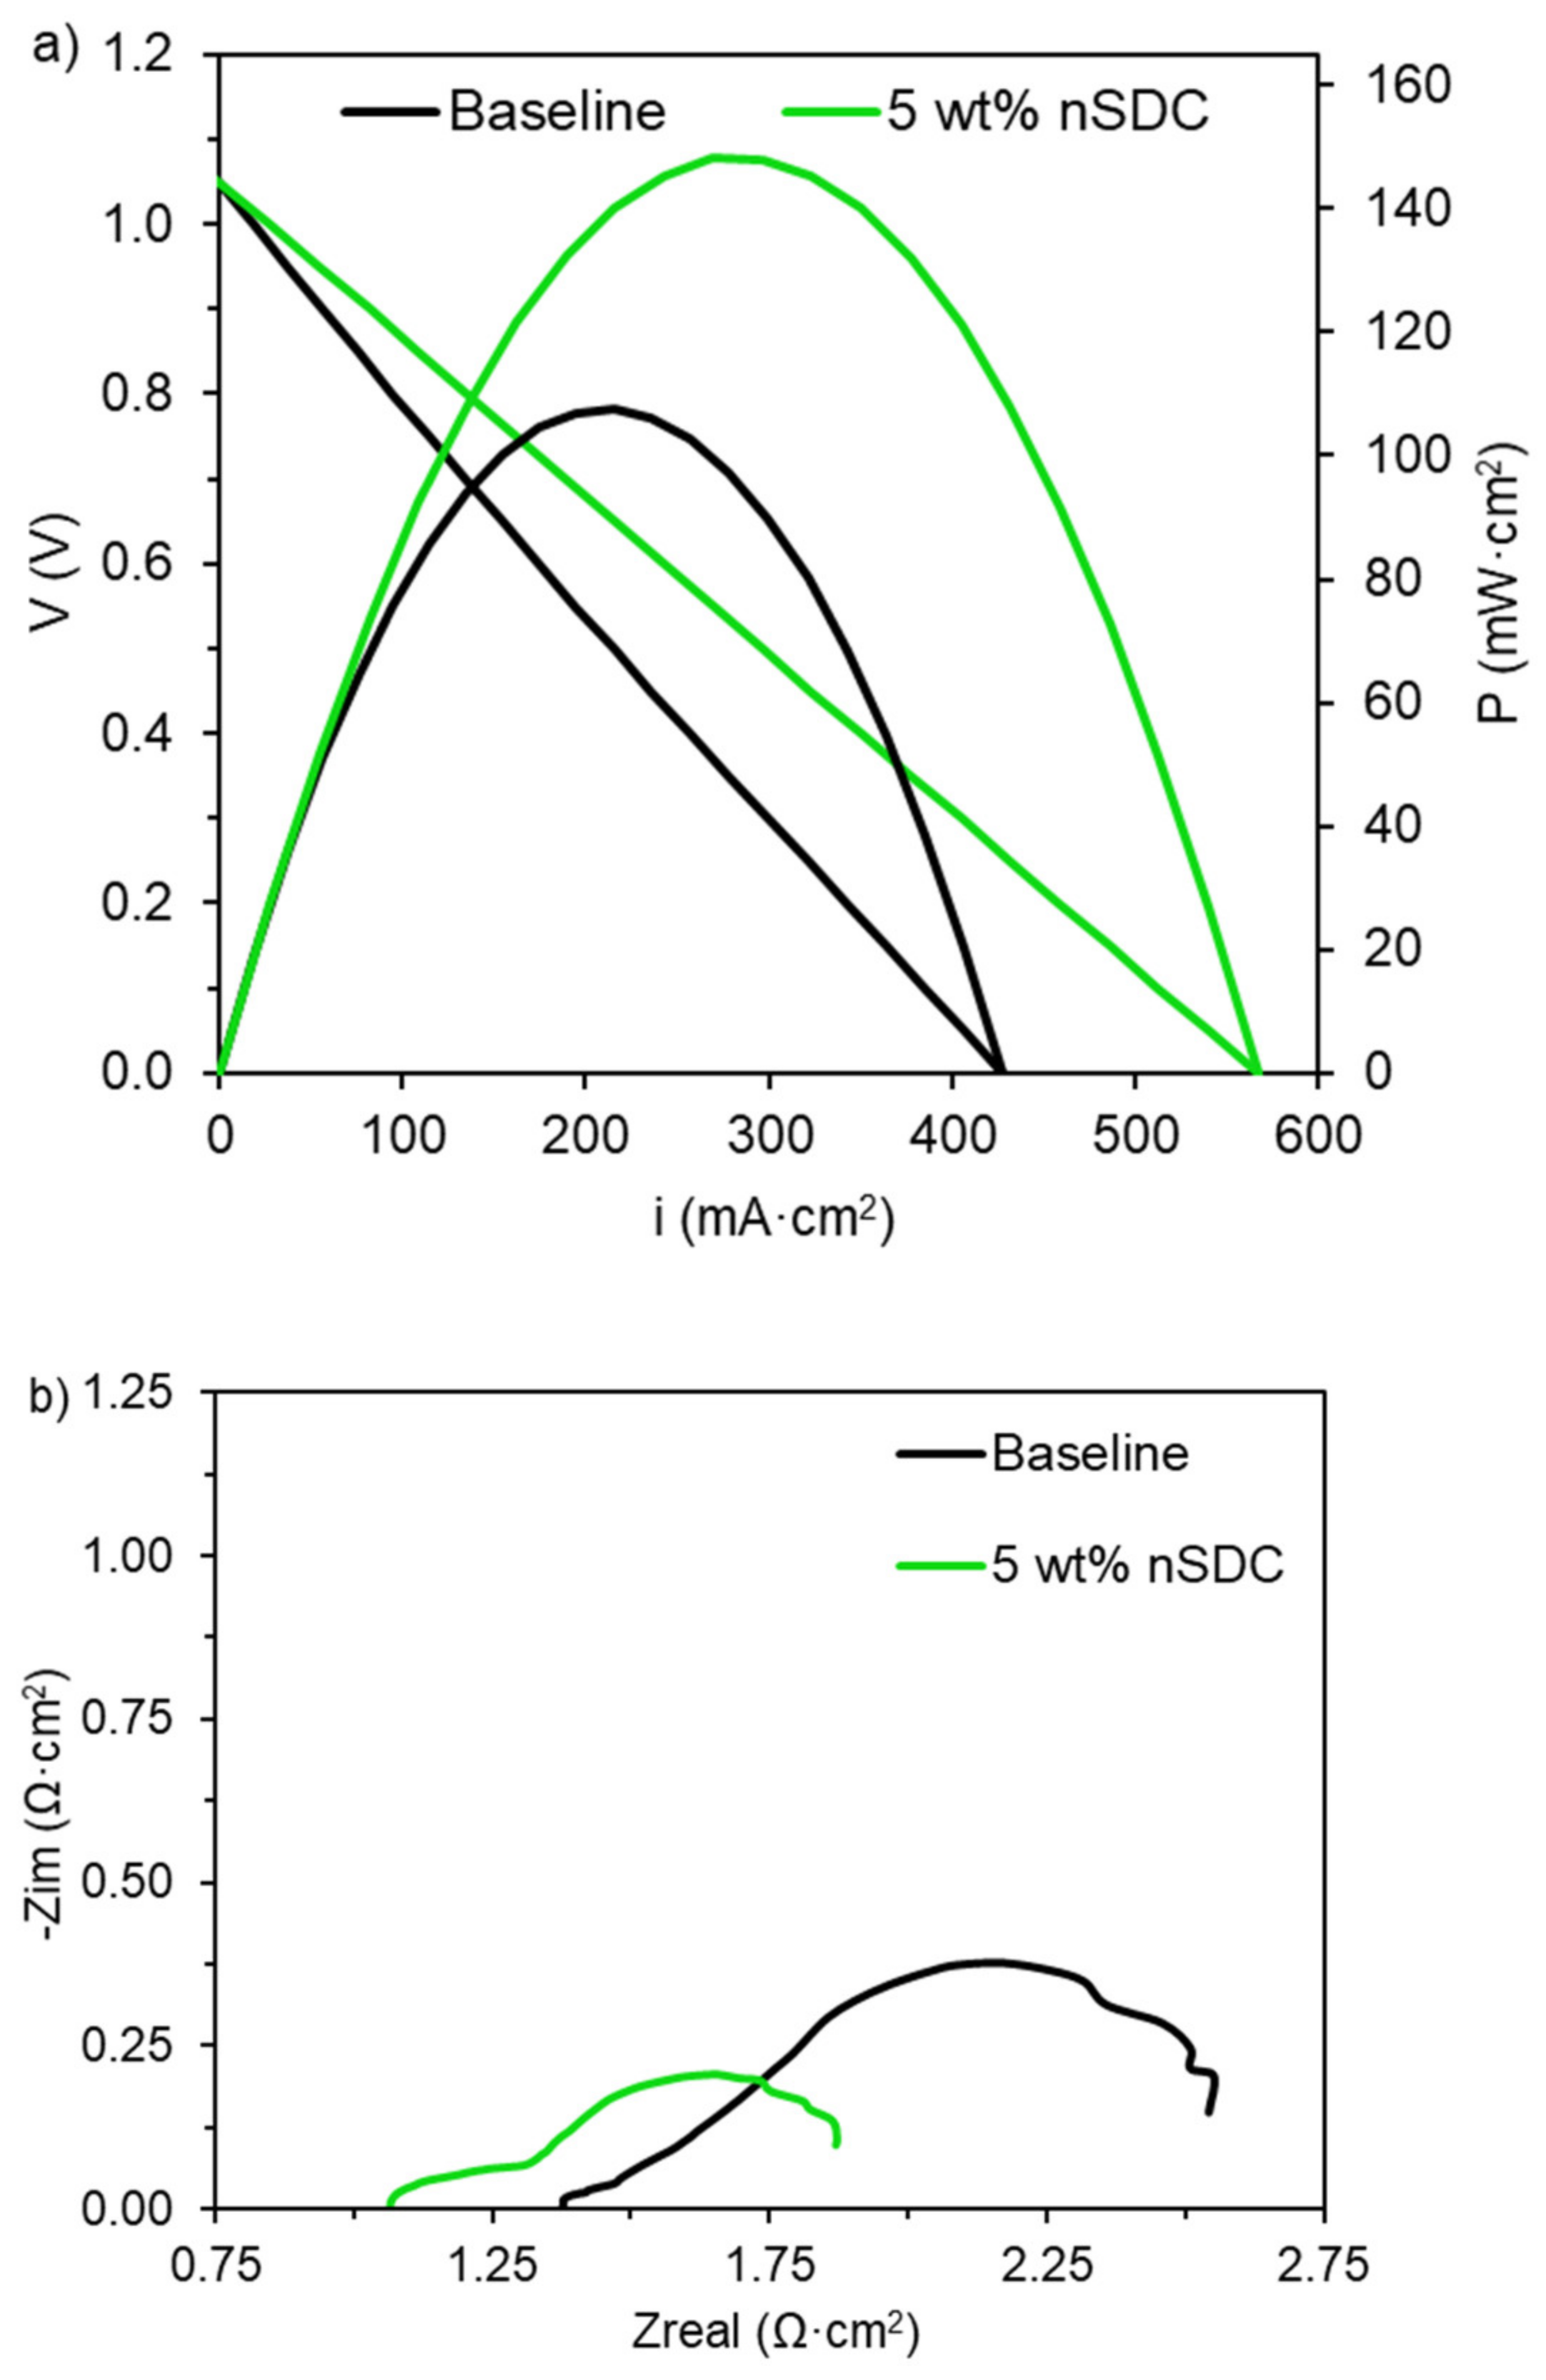
2.5. Fuel Cell Electrochemical Analysis
3. Materials and Methods
3.1. Material Preparation
3.2. Material Characterization
3.3. Symmetrical and Fuel Cell Fabrication
3.4. Symmetrical and Fuel Cell Characterization
4. Conclusions
Author Contributions
Funding
Data Availability Statement
Acknowledgments
Conflicts of Interest
Disclaimer
References
- Mogensen, M.; Skaarup, S. Kinetic and Geometric Aspects of Solid Oxide Fuel Cell Electrodes. Solid State Ion. 1996, 86–88, 1151–1160. [Google Scholar] [CrossRef]
- Steele, B.C.H.; Hori, K.M.; Uchino, S. Kinetic Parameters Influencing the Performance of IT-SOFC Composite Electrodes. Solid State Ion. 2000, 135, 445–450. [Google Scholar] [CrossRef]
- Haile, S.M. Fuel Cell Materials and Components. Acta Mater. 2003, 51, 5981–6000. [Google Scholar] [CrossRef]
- Ji, S.; Chang, I.; Lee, Y.H.; Park, J.; Paek, J.Y.; Lee, M.H.; Cha, S.W. Fabrication of low-temperature solid oxide fuel cells with a nanothin protective layer by atomic layer deposition. Nanoscale Res. Lett. 2013, 8, 48. [Google Scholar] [CrossRef] [PubMed] [Green Version]
- Kim, Y.B.; Hus, C.-M.; Connor, S.T.; Gur, T.M.; Cui, Y.; Prinz, F.B. Nanopore Patterned Pt Array Electrodes for Triple Phase Boundary Study in Low Temperature SOFC. J. Electrochem. Soc. 2010, 157, B1269–B1274. [Google Scholar] [CrossRef] [Green Version]
- Ji, S.; Chang, I.; Chao, G.Y.; Lee, Y.H.; Shim, J.H.; Cha, S.W. Application of dense nano-thin platinum films for low-temperature solid oxide fuel cells by atomic layer deposition. Int. J. Hydrogen Energy 2014, 39, 12402–12408. [Google Scholar] [CrossRef]
- Egger, A.; Bucher, E.; Yang, M.; Sitte, W. Comparison of Oxygen Exchange Kinetics of the IT-SOFC Cathode Materials La0.5Sr0.5CoO3-δ and La0.6Sr0.4CoO3-δ. Solid State Ion. 2012, 225, 55–60. [Google Scholar] [CrossRef]
- Wachsman, E.D.; Lee, K.T. Lowering the Temperature of Solid Oxide Fuel Cells. Science 2011, 334, 935–939. [Google Scholar] [CrossRef]
- Gao, Z.; Mogni, L.V.; Miller, E.C.; Railsback, J.G.; Barnett, S.A. A Perspective on Low-Temperature Solid Oxide Fuel Cells. Energy Environ. Sci. 2016, 9, 1602–1644. [Google Scholar] [CrossRef]
- Yang, G.; Su, C.; Shi, H.; Zhu, Y.; Song, Y.; Zhou, W.; Shao, Z. Toward Reducing the Operation Temperature of Solid Oxide Fuel Cells: Our Past 15 Years of Efforts in Cathode Development. Energy Fuels 2020, 34, 15169–15194. [Google Scholar] [CrossRef]
- Kilner, J.A.; Burriel, M. Materials for Intermediate-Temperature Solid-Oxide Fuel Cells. Annu. Rev. Mater. Res. 2014, 44, 365–393. [Google Scholar] [CrossRef]
- Fabbri, E.; Bi, L.; Pergolesi, D.; Traversa, E. Towards the Next Generation of Solid Oxide Fuel Cells Operating Below 600 °C with Chemically Stable Proton-Conducting Electrolytes. Adv. Mater. 2012, 24, 195–208. [Google Scholar] [CrossRef] [PubMed]
- Vohs, J.M.; Gorte, R.J. High-Performance SOFC Cathodes Prepared by Infiltration. Adv. Mater. 2009, 21, 943–956. [Google Scholar] [CrossRef]
- Jiang, S.P. A Review of Wet Impregnation—An Alternative Method for the Fabrication of High Performance and Nano-structured Electrodes of Solid Oxide Fuel Cells. Mater. Sci. Eng. A 2006, 418, 199–210. [Google Scholar] [CrossRef]
- Jiang, Z.; Xia, C.; Chen, F. Nano-structured Composite Cathodes for Intermediate-Temperature Solid Oxide Fuel Cells via an Infiltration/Impregnation Technique. Electrochim. Acta 2010, 55, 3595–3605. [Google Scholar] [CrossRef]
- He, H.; Huang, Y.; Regal, J.; Boaro, M.; Vohs, J.M.; Gorte, R.J. Low-Temperature Fabrication of Oxide Composites for Solid-Oxide Fuel Cells. J. Am. Ceram. Soc. 2004, 87, 331–336. [Google Scholar] [CrossRef]
- Ding, D.; Li, X.; Lai, S.Y.; Gerdes, K.; Liu, M. Enhancing SOFC Cathode Performance by Surface Modification through Infiltration. Energy Environ. Sci. 2014, 7, 552–575. [Google Scholar] [CrossRef]
- Shah, M.; Barnett, S.A. Solid Oxide Fuel Cell Cathodes by Infiltration of La0.6Sr0.4Co0.2Fe0.8O3-δ into Gd-Doped Ceria. Solid State Ion. 2008, 179, 2059–2064. [Google Scholar] [CrossRef]
- Synodis, M.J.; Porter, C.L.; Vo, N.M.; Reszka, A.J.L.; Gross, M.D.; Snyder, R.C. A Model to Predict Percolation Threshold and Effective Conductivity of Infiltrated Electrodes for Solid Oxide Fuel Cells. J. Electrochem. Soc. 2013, 160, F1216–F1224. [Google Scholar] [CrossRef]
- Reszka, A.J.L.; Snyder, R.C.; Gross, M.D. Insights into the Design of SOFC Infiltrated Electrodes with Optimized Active TPB Density via Mechanistic Modeling. J. Electrochem. Soc. 2014, 161, F1176–F1183. [Google Scholar] [CrossRef]
- Kim, J.D.; Kim, G.D.; Moon, J.W.; Park, Y.I.; Lee, W.H.; Kobayashi, K.; Nagai, M.; Kim, C.E. Characterization of LSM-YSZ Composite Electrode by AC Impedance Spectroscopy. Solid State Ion. 2001, 143, 379–389. [Google Scholar] [CrossRef]
- Choi, J.H.; Jang, J.H.; Oh, S.M. Microstructure and Cathodic Performance of La0.9Sr0.1MnO3/Yttria-Stabilized-Zirconia Composite Electrodes. Electrochim. Acta 2001, 46, 867–874. [Google Scholar] [CrossRef]
- Matsuzaki, Y.; Yasuda, I. Electrochemical properties of reduced-temperature SOFCs with mixed ionic–electronic conductors in electrodes and/or interlayers. Solid State Ion. 2002, 152–153, 463–468. [Google Scholar] [CrossRef]
- Muhoza, S.P.; Barrett, T.E.; Cottam, M.A.; Soll, S.E.; Yuce, M.D.; Prathab, V.S.; Hambright, S.K.; Rezazad, M.; Racchi, O.; Gross, M.D. High Surface Area SOFC Electrode Materials Prepared at Traditional Sintering Temperatures. J. Electrochem. Soc. 2018, 165, F46–F54. [Google Scholar] [CrossRef]
- Muhoza, S.P.; Barrett, T.E.; Soll, S.E.; Gross, M.D. Nanostructured SOFC Electrode Scaffolds Prepared via High Temperature in situ Carbon Templating of Hybrid Materials. ECS Trans. 2017, 78, 1407–1416. [Google Scholar] [CrossRef]
- Muhoza, S.P.; Cottam, M.A.; Gross, M.D. High Temperatures Fabrication of Nanostructured Yttria-Stabilized-Zirconia (YSZ) Scaffolds by In Situ Carbon Templating Xerogels. J. Vis. Exp. 2017, 122, e55500. [Google Scholar] [CrossRef] [PubMed]
- Muhoza, S.P.; McCormack, A.; Garrett, R.W.; Yuce, M.D.; Prathab, V.S.; Hambright, S.K.; Cottam, M.A.; Gross, M.D. Processing Nano-YSZ in Solid Oxide Fuel Cells: The Effect of Sintering Atmosphere on Thermochemical Stability. J. Electrochem. Soc. 2019, 166, F53–F58. [Google Scholar] [CrossRef]
- Muhoza, S.P.; Taylor, T.H.; Song, X.; Gross, M.D. The Impact of Sintering Atmosphere and Temperature on the Phase Evolution of High Surface Area LSCF Prepared by In Situ Carbon Templating. J. Electrochem. Soc. 2021, 168, 034519. [Google Scholar] [CrossRef]
- Cottam, M.; Muhoza, S.; Gross, M.D. Preserving Nanomorphology in YSZ Scaffolds at High Temperatures via In Situ Carbon Templating of Hybrid Materials. J. Am. Ceram. Soc. 2016, 99, 2625–2631. [Google Scholar] [CrossRef]
- Muhoza, S.P.; Lee, S.; Song, X.; Guan, B.; Yang, T.; Gross, M.D. Enhancing Activity, Charge Transport, Power Production, and Stability of Commercial Solid Oxide Fuel Cells with Yttria-Stabilized Zirconia Nanoparticles. J. Electrochem. Soc. 2020, 167, 024517. [Google Scholar] [CrossRef]
- Chen, Y.; Bu, Y.; Zhang, Y.; Yan, R.; Ding, D.; Zhao, B.; Yoo, S.; Dang, D.; Hu, R.; Yang, C.; et al. A Highly Efficient and Robust Nanofiber Cathode for Solid Oxide Fuel Cells. Adv. Energy Mater. 2017, 7, 1601890. [Google Scholar] [CrossRef]
- Xu, H.; Zhang, H.; Chu, A. An Investigation of Oxygen Reduction Mechanism in Nano-sized LSCF-SDC Composite Cathodes. Int. J. Hydrogen Energy 2016, 41, 22415–22421. [Google Scholar] [CrossRef] [Green Version]
- Xu, X.; Jiang, Z.; Fan, X.; Xia, C. LSM-SDC Electrodes Fabricated with an Ion-Impregnating Process for SOFCs with Doped Ceria Electrolytes. Solid State Ion. 2006, 177, 2113–2117. [Google Scholar] [CrossRef]
- Endler, C.; Leonide, A.; Weber, A.; Tietz, F.; Ivers-Tiffée, E. Time-Dependent Electrode Performance Changes in Intermediate Temperature Solid Oxide Fuel Cells. J. Electrochem. Soc. 2010, 157, B292–B298. [Google Scholar] [CrossRef]
- Kornely, M.; Menzler, N.H.; Weber, A.; Ivers-Tiffée, E. Degradation of a High Performance SOFC Cathode by Cr-Poisoning at OCV Conditions. Fuel Cells 2013, 13, 506–510. [Google Scholar] [CrossRef]
- Weber, A.; Szász, J.; Dierickx, S.; Endler-Schuck, C.; Ivers-Tiffée, E. Accelerated Lifetime Tests for SOFCs. ECS Trans. 2015, 68, 1953–1960. [Google Scholar] [CrossRef]
- Wuillemin, Z.; Antonetti, Y.; Beetschen, C.; Millioud, O.; Ceschini, S.; Madi, H.; Van herle, J. Local Activation and Degradation of Electrochemical Processes in a SOFC. ECS Trans. 2013, 57, 561–570. [Google Scholar] [CrossRef]
- Caliandro, P.; Nakajo, A.; Diethelm, S.; Van herle, J. Model-assisted identification of solid oxide cell elementary processes by electrochemical impedance spectroscopy measurements. J. Power Sources 2019, 436, 226838. [Google Scholar] [CrossRef]
- Jung, D.W.; Duncan, K.L.; Wachsman, E.D. Effect of Total Dopant Concentration and Dopant Ratio on Conductivity of (DyO1.5)x-(WO3)y-(BiO1.5)1-x-y. Acta Mater. 2010, 58, 355–363. [Google Scholar] [CrossRef]
- Wachsman, E.; Ishihara, T.; Kilner, J. Low-Temperature Solid-Oxide Fuel Cells. MRS Bull. 2014, 39, 773–779. [Google Scholar] [CrossRef] [Green Version]
- Ishihara, T.; Matsuda, H.; Takita, Y. Effects of Rare Earth Cations Doped for La Site on the Oxide Ionic Conductivity of LaGaO3-based Perovskite Type Oxide. Solid State Ion. 1995, 79, 147–151. [Google Scholar] [CrossRef]
- Huang, K.; Tichy, R.; Goodenough, J.B. Superior Perovskite Oxide-Ion Conductor; Strontium- and Magnesium-Doped LaGaO3: III, Performance Tests of Single Ceramic Fuel Cells. J. Am. Ceram. Soc. 1998, 81, 2581–2585. [Google Scholar] [CrossRef]
- Zhang, W.; Hu, Y.H. Progress in Proton-Conducting Oxides as Electrolytes for Low-Temperature Solid Oxide Fuel Cells: From Materials to Devices. Energy Sci. Eng. 2021, 9, 984–1011. [Google Scholar] [CrossRef]
- Lin, Y.; Ran, R.; Zheng, Y.; Shao, Z.; Jin, W.; Xu, N.; Ahn, J. Evaluation of Ba0.5Sr0.5Co0.8Fe0.2O3-δ as a Potential Cathode for an Anode-Supported Proton-Conducting Solid Oxide Fuel Cell. J. Power Sources 2008, 180, 15–22. [Google Scholar] [CrossRef]
- Cervera, R.B.; Oyama, Y.; Miyoshi, S.; Kobayashi, K.; Yagi, T.; Yamaguchi, S. Structural Study and Proton Transport of Bulk Nanograined Y-Doped BaZrO3 Oxide Protonics Materials. Solid State Ion. 2008, 179, 236–242. [Google Scholar] [CrossRef]


| Symmetrical Cells | Fuel Cells | ||
|---|---|---|---|
| Temperature | 600 °C, 650 °C, and 700 °C | 700 °C | |
| Electrode Atmosphere | Both electrodes: Air | Anode: 97% H2/3% H2O | |
| Cathode: Air | |||
| Electrochemical Impedance Spectroscopy (EIS) | DC Voltage | 0 V | 0.7 V |
| AC Perturbation | 20 mV | ||
| Frequency | 105–10−1 Hz | ||
Publisher’s Note: MDPI stays neutral with regard to jurisdictional claims in published maps and institutional affiliations. |
© 2021 by the authors. Licensee MDPI, Basel, Switzerland. This article is an open access article distributed under the terms and conditions of the Creative Commons Attribution (CC BY) license (https://creativecommons.org/licenses/by/4.0/).
Share and Cite
Muhoza, S.P.; Gross, M.D. Creating and Preserving Nanoparticles during Co-Sintering of Solid Oxide Electrodes and Its Impact on Electrocatalytic Activity. Catalysts 2021, 11, 1073. https://doi.org/10.3390/catal11091073
Muhoza SP, Gross MD. Creating and Preserving Nanoparticles during Co-Sintering of Solid Oxide Electrodes and Its Impact on Electrocatalytic Activity. Catalysts. 2021; 11(9):1073. https://doi.org/10.3390/catal11091073
Chicago/Turabian StyleMuhoza, Sixbert P., and Michael D. Gross. 2021. "Creating and Preserving Nanoparticles during Co-Sintering of Solid Oxide Electrodes and Its Impact on Electrocatalytic Activity" Catalysts 11, no. 9: 1073. https://doi.org/10.3390/catal11091073
APA StyleMuhoza, S. P., & Gross, M. D. (2021). Creating and Preserving Nanoparticles during Co-Sintering of Solid Oxide Electrodes and Its Impact on Electrocatalytic Activity. Catalysts, 11(9), 1073. https://doi.org/10.3390/catal11091073