Article

Role of Reaction Intermediate Diffusion on the Performance of Platinum Electrodes in Solid Acid Fuel Cells

1
Leibniz Institute of Surface Engineering (IOM), Permoserstraße 15, 04318 Leipzig, Germany
2
Department of Chemistry and Mineralogy, Ostwald-Institute of Physical and Theoretical Chemistry, Leipzig University, Linnéstraße 3, 04103 Leipzig, Germany
3
Felix Bloch Institute of Solid State Physics, Faculty of Physics and Earth Science, Leipzig University, Linnéstraße 5, 04103 Leipzig, Germany
*
Author to whom correspondence should be addressed.
Both authors contributed equally.
Catalysts 2021, 11(9), 1065; https://doi.org/10.3390/catal11091065
Submission received: 10 August 2021 / Revised: 26 August 2021 / Accepted: 31 August 2021 / Published: 31 August 2021
(This article belongs to the Section Catalysis for Sustainable Energy)

Abstract

:
Understanding the reaction pathways for the hydrogen oxidation reaction (HOR) and the oxygen reduction reaction (ORR) is the key to design electrodes for solid acid fuel cells (SAFCs). In general, electrochemical reactions of a fuel cell are considered to occur at the triple-phase boundary where an electrocatalyst, electrolyte and gas phase are in contact. In this concept, diffusion processes of reaction intermediates from the catalyst to the electrolyte remain unconsidered. Here, we unravel the reaction pathways for open-structured Pt electrodes with various electrode thicknesses from 15 to 240 nm. These electrodes are characterized by a triple-phase boundary length and a thickness-depending double-phase boundary area. We reveal that the double-phase boundary is the active catalytic interface for the HOR. For Pt layers ≤ 60 nm, the HOR rate is rate-limited by the processes at the gas/catalyst and/or the catalyst/electrolyte interface while the hydrogen surface diffusion step is fast. For thicker layers (>60 nm), the diffusion of reaction intermediates on the surface of Pt becomes the limiting process. For the ORR, the predominant reaction pathway is via the triple-phase boundary. The double-phase boundary contributes additionally with a diffusion length of a few nanometers. Based on our results, we propose that the molecular reaction mechanism at the electrode interfaces based upon the triple-phase boundary concept may need to be extended to an effective area near the triple-phase boundary length to include all catalytically relevant diffusion processes of the reaction intermediates.

Graphical Abstract

1. Introduction

For the decarbonization of the energy sector, fuel cells are already a key technology in the transition towards the increasing use of renewable energy sources. Energy output from renewable sources is usually fluctuating, depending, for example, on wind and sunshine, which call for energy storage and conversion solutions. Fuel cells can convert chemical into electrical energy without producing greenhouse gases. Their construction consists of an electrolyte that is sandwiched between catalyst-coated gas diffusion electrodes. By selecting the electrolyte, the operation temperature can be adapted to the requirements. In particular, intermediate temperature fuel cells are of growing interest [1,2,3]. One representative of this class is the solid acid fuel cell (SAFC) which utilizes a proton-conducting solid acid electrolyte, such as CsH2PO4, at an operating temperature near 520 K [4,5]. SAFCs combine highly attractive attributes such as fuel flexibility (e.g., methanol, ethanol or reformate), enhanced resistance against catalyst poisoning, improved kinetics, an all-solid-state system and a non-toxic electrolyte [6,7]. Platinum (Pt) is the most common electrocatalyst for SAFCs due to its high activity and stability. For SAFCs, various deposition and fabrication methods have been investigated, resulting in different electrocatalyst microstructures and electrode architectures [7,8,9,10,11,12,13,14,15]. The deposition methods included metal-precursor impregnation, metal-organic chemical vapor deposition (MOCVD), atomic layer deposition (ALD) and direct current magnetron sputtering (dcMS), and these methods were utilized on the current collector as well as the electrolyte particles. Consequently, a large variety of fuel cell performances have been achieved. In particular, Pt composite electrodes have demonstrated power densities of 415 mW cm−2 and performance degradation of just 110 μV h−1 at 200 mA cm−2 [12,13,14]. Nevertheless, the performance was achieved with a high Pt loading of greater than 1 mg cm−2 per electrode, indicating a broad research field to enhance SAFCs in terms of power output at reduced Pt loading, hence at a lower cost. In other types of fuel cells, the electrode microstructure of Pt and other electrocatalysts has been modified using additives, electrodeposition and nanocages [16,17,18].
A refined strategy for enhancing the electrode performance is to investigate the reaction pathways to derive rational design rules for the electrode architecture. In the case of composite electrodes, a fundamental investigation of the reaction pathways is prevented by their complex architecture. In general, fuel cell reactions are considered to occur at the triple-phase boundary where the gas phase, the proton-conducting electrolyte and the electron-conducting catalyst are in contact with each other. For the hydrogen oxidation reaction (HOR) at the anode, Louie et al. investigated the reaction pathway of a well-defined model electrode system consisting of a dense, close Pt thin film grown on the electrolyte pellet [19]. In this case, the electrode architecture prevents the triple-phase boundary activity. This allowed them to demonstrate a second reaction pathway based on the diffusion of hydrogen through the platinum thin film. This diffusion process extends the catalytically active area to the interfaces between the gas and the catalyst (gas/catalyst) and the catalyst and the electrolyte (catalyst/electrolyte). Since the diffusion of hydrogen can become a rate-limiting factor, this expansion is naturally limited to the immediate vicinity of the interfaces. At a layer thickness of 50 nm, they distinguished two catalytically active regions: the mixed-controlled and the diffusion-controlled region. The second one is only diffusion-controlled, whereas the mixed-controlled region is limited by interfacial effects and the diffusion process. The rate-limiting reaction of an SAFC is the oxygen reduction reaction (ORR) at the cathode [14,20]. The reaction mechanism is slower overall and consists of a four-electron process that can be described by an associative and a dissociative mechanism [21,22]. Additionally, in the case of the ORR, the contribution of the triple-phase boundary as well as the diffusion of reaction intermediates through or on the surface of the catalyst still remain unclear [10,14]. Lim et al. proposed, for Pt-coated electrolyte particles, that the catalytic activity of the cathode is caused by a diffusion of hydrogen through the electrocatalyst [14]. Nevertheless, the contribution in their electrode architecture of the triple-phase boundary, which can be caused by cracks in the coating or from the contact area between the catalyst coated particles and the electrolyte pellet, remains vague.
To answer the questions on the dominant pathway for complex Pt composite electrodes, we here examine the reaction pathways for the HOR as well as the ORR with a Pt electrode architecture that provides a triple-phase boundary site and a variable surface area near the latter. In this study, the variable surface area is denoted as a double-phase boundary. For the examination of the reaction pathways, we exploit the versatility of magnetron sputtering to tailor the microstructure of a Pt electrode [23]. The catalytic contribution of the triple- and double-phase boundaries are unfolded by experiments varying the Pt electrode layer thickness. Moreover, we determine the film properties by electron microscopy, X-ray diffraction and profilometry and compare the electrode performance to a standard dense Pt thin film by electrochemical impedance spectroscopy and polarization curves analysis. In addition, we identify a thermally induced process comparable to sintering as the main degradation mechanism for the open-structured Pt electrode and correlated the microstructural changes to the impedance measurements.

2. Results

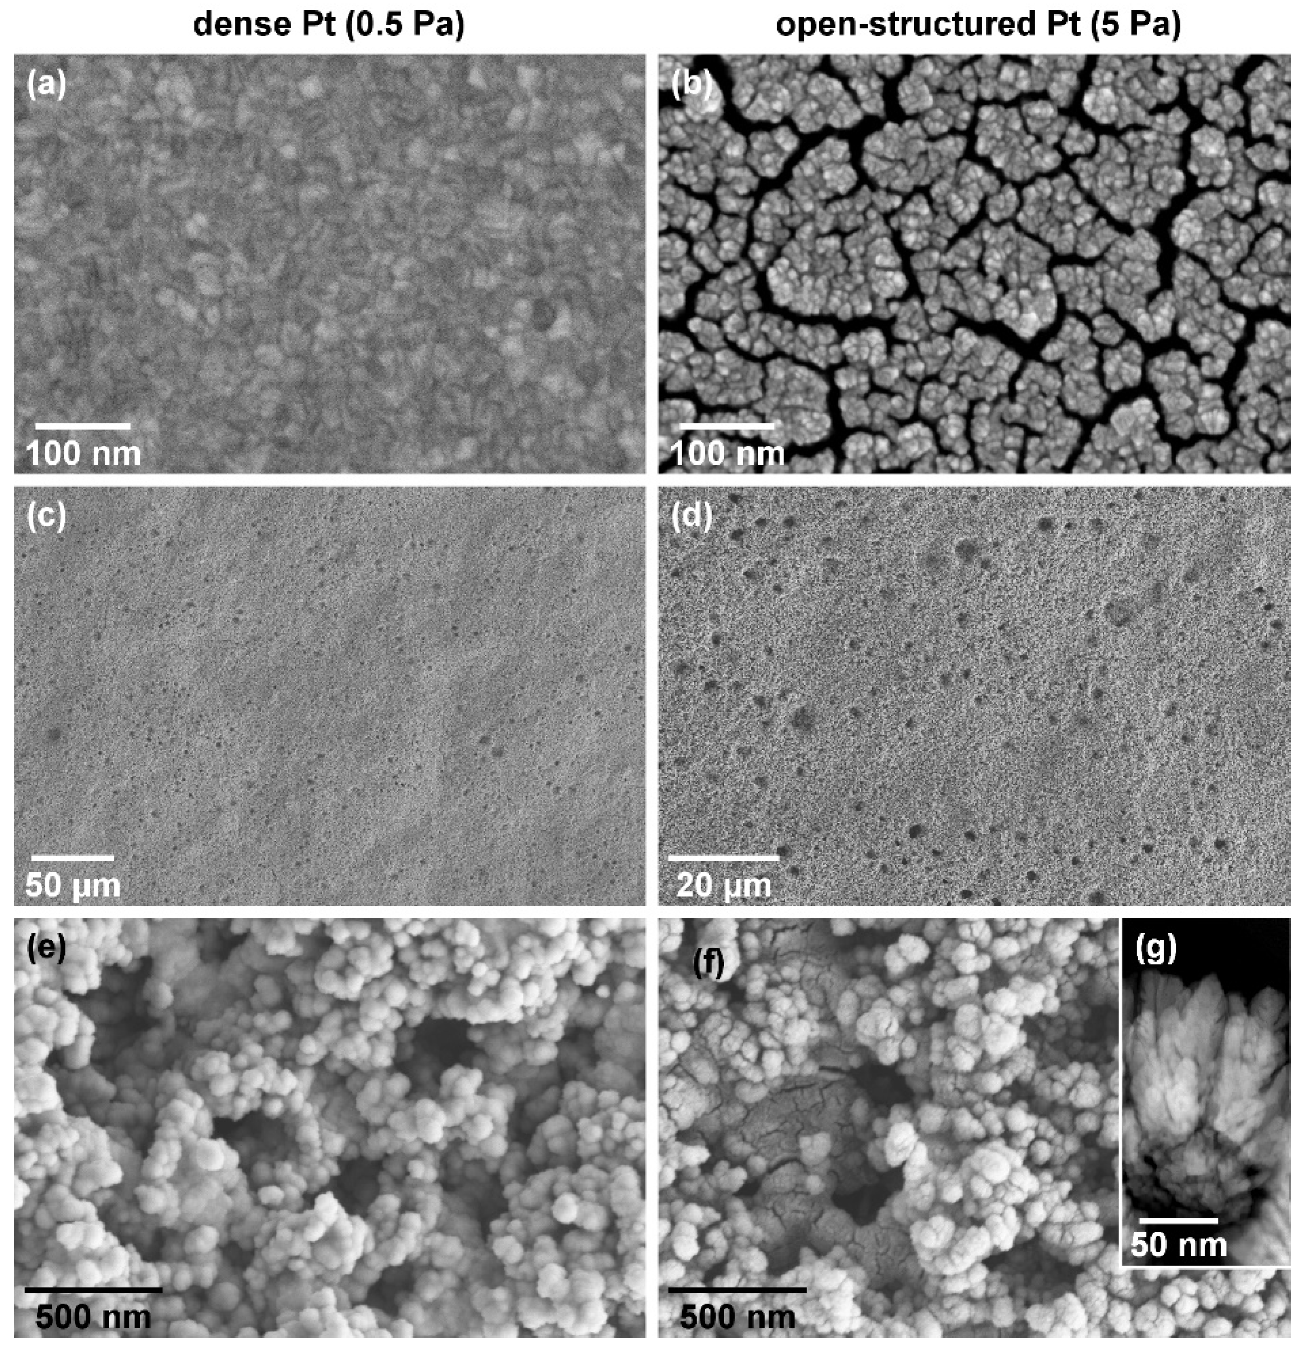
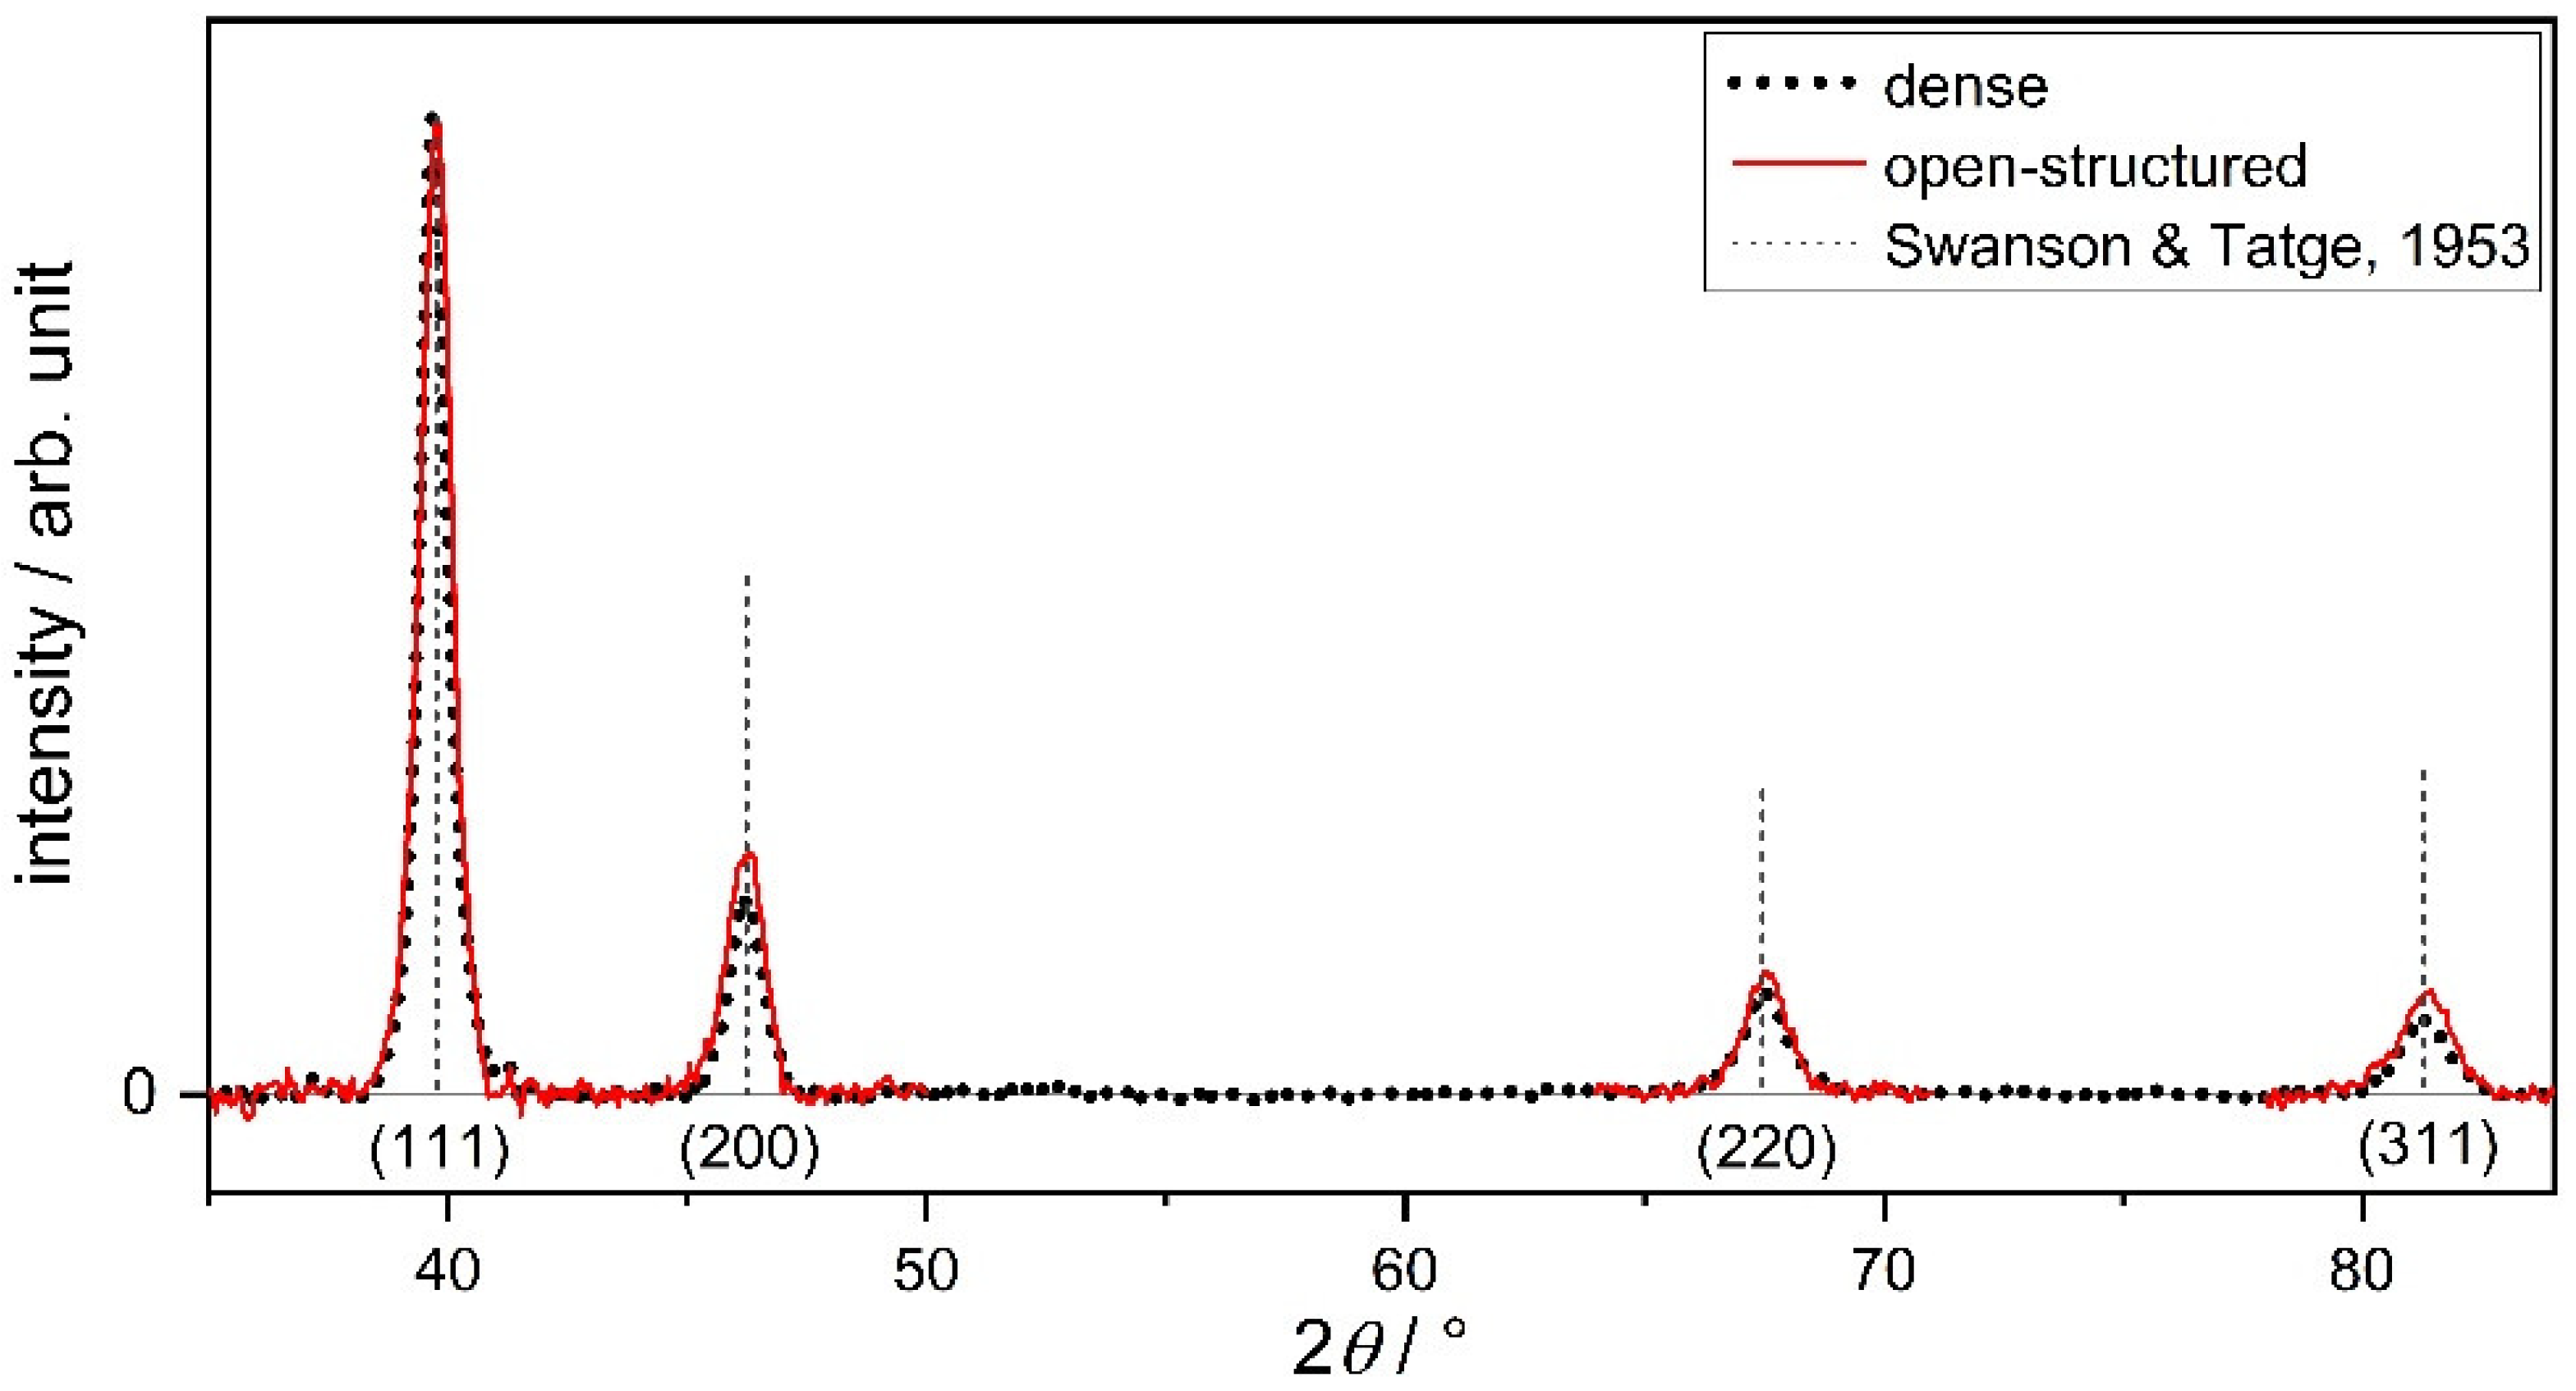
2.1. Structural Characterization

Representative scanning electron micrographs of the Pt thin films fabricated at Ar working gas pressures of 0.5 Pa and 5 Pa reveal microstructural differences (Figure 1). Figure 1a,b show the Pt thin films sputtered onto lapped Si substrates, while Figure 1c–f presents the Pt thin films grown onto the rough carbon paper, together forming the gas diffusion electrodes (GDEs).
The Pt film deposited onto the Si substrate at 0.5 Pa (a pressure common to magnetron sputtering) exhibits a smooth, closed surface with an average grain size of (15.3 ± 2.7) nm (Figure 1a and ESI1). The deposition at a much higher working gas pressure of 5 Pa led to the growth of an open-structured Pt thin film (Figure 1b and ESI1) similar to earlier reports [24,25]. The grown film has an average grain size of (8.0 ± 1.7) nm. According to the non-crystalline to crystalline transformation range of 1.1 to 5 nm of Pt nanoparticles on carbon, we assume that both Pt thin films are crystalline [26]. The grains are clustered into columns, and these are separated from each other by smaller and larger voids with widths ranging from less than 2 nm up to 20 nm. The cross-sectional micrograph indicates void depths of up to the entire layer thickness (see Figure 1g). The results are consistent with simulations for film growth with an enhanced adatom diffusion barrier [27]. The representative micrographs of the GDEs are shown in Figure 1c–f. Overview images of the depositions onto carbon paper (Figure 1c,d) show a rough structure with holes and waviness reflecting the original structure of the carbon paper with its surface roughness of 5–6 µm (compare ESI2). The detail and overview images reveal a complete coverage of the carbon paper (compare Figure 1c,e for the dense and Figure 1d,f for the open-structured film). The appearance of the films on the carbon paper differs in a similar way as the film microstructure on the Si substrates. The dense GDE displays a complete homogeneous coating without cracks, whereas the open-structured GDE exhibits a more structured coverage, including visible voids in between the columns (Figure 1e,f). The measurement of the Pt grain size and the Pt surface area on the GDEs is prevented by the surface roughness of the carbon paper and by the low Pt loading, respectively. However, considering the intercolumnar voids of the open-structured thin film, the Pt surface area of the open-structured thin film is significantly larger than that of the close, dense Pt thin film.
A further indication of the microstructural differences is the film thickness growth rate. For the higher working gas pressure of 5 Pa, the film thickness grows faster compared to the process at 0.5 Pa. The film growth rates and thin film properties are summarized in Table 1.
The XRD patterns of the Pt films deposited onto the carbon paper are shown in Figure 2. The intensities are normalized to the {111} reflection. A slight difference in the reflection intensity ratios of the patterns for the films is noticeable. The intensity ratio of I200/I111 is increased for the open-structured versus the dense films. This is in line with Slavcheva et al., who observed similar trends in XRD intensity ratios with increasing working gas pressure [28]. The ratios of I220/I111 and I311/I111 are also lower for the dense case as well, which gives an overall stronger {111} signal compared to the open-structured film. In summary, the differences in intensity ratios are indicative of a less preferentially oriented open-structured film compared to the dense film.
The differences in terms of microstructure, as well as the intensity ratio of the XRD patterns of the films, can be understood from the different Ar working gas pressures. During sputtering, atoms are released into the gas phase. The mean free path length of a Pt atom in the Ar working gas is 1/(nAr × σPt/Ar) = 7.5 cm for a working gas pressure of 0.5 Pa with an Ar density nAr estimated according to the ideal gas law at a process gas temperature of Tgas = 500 K and assuming a Pt-Ar scattering cross-section σPt/Ar = 2 × 10⁻¹⁹ m2. At a distance of 12 cm between target and substrate, exp(−12 cm/7.5 cm) ≈ 20 % of all sputtered particles will not undergo a collision with the Ar gas. They therefore deposit their full initial energy on the growing film, which is typically a few eV per atom in a sputtering process [30]. The momentum brought to the substrate increases the surface mobility of the adatoms, which elevates their probability of reaching an energetically perferred site, thereby densifying the growing film [23]. Generally, the additional energy allows the system to adapt to an energetically favorable arrangement. Thus, the dense film shows a smooth coverage and a lower value of I200/I111 since the {111} crystal faces of Pt have the lowest surface energy [31]. At 5 Pa working gas pressure, the mean free path decreases by a factor of 10 to 7.5 mm, which greatly increases the number of average collisions with the working gas. Consequently, the energy of the sputtered Pt atoms is reduced to thermal energies. At a working gas temperature of 500 K, this energy lies around 3/2 kBTgas ≈ 0.05 eV. Thus, the energy flux onto the substrate is limited, which restricts the lattice rearrangement, and the Pt film grows with larger voids and smaller grain sizes [24].

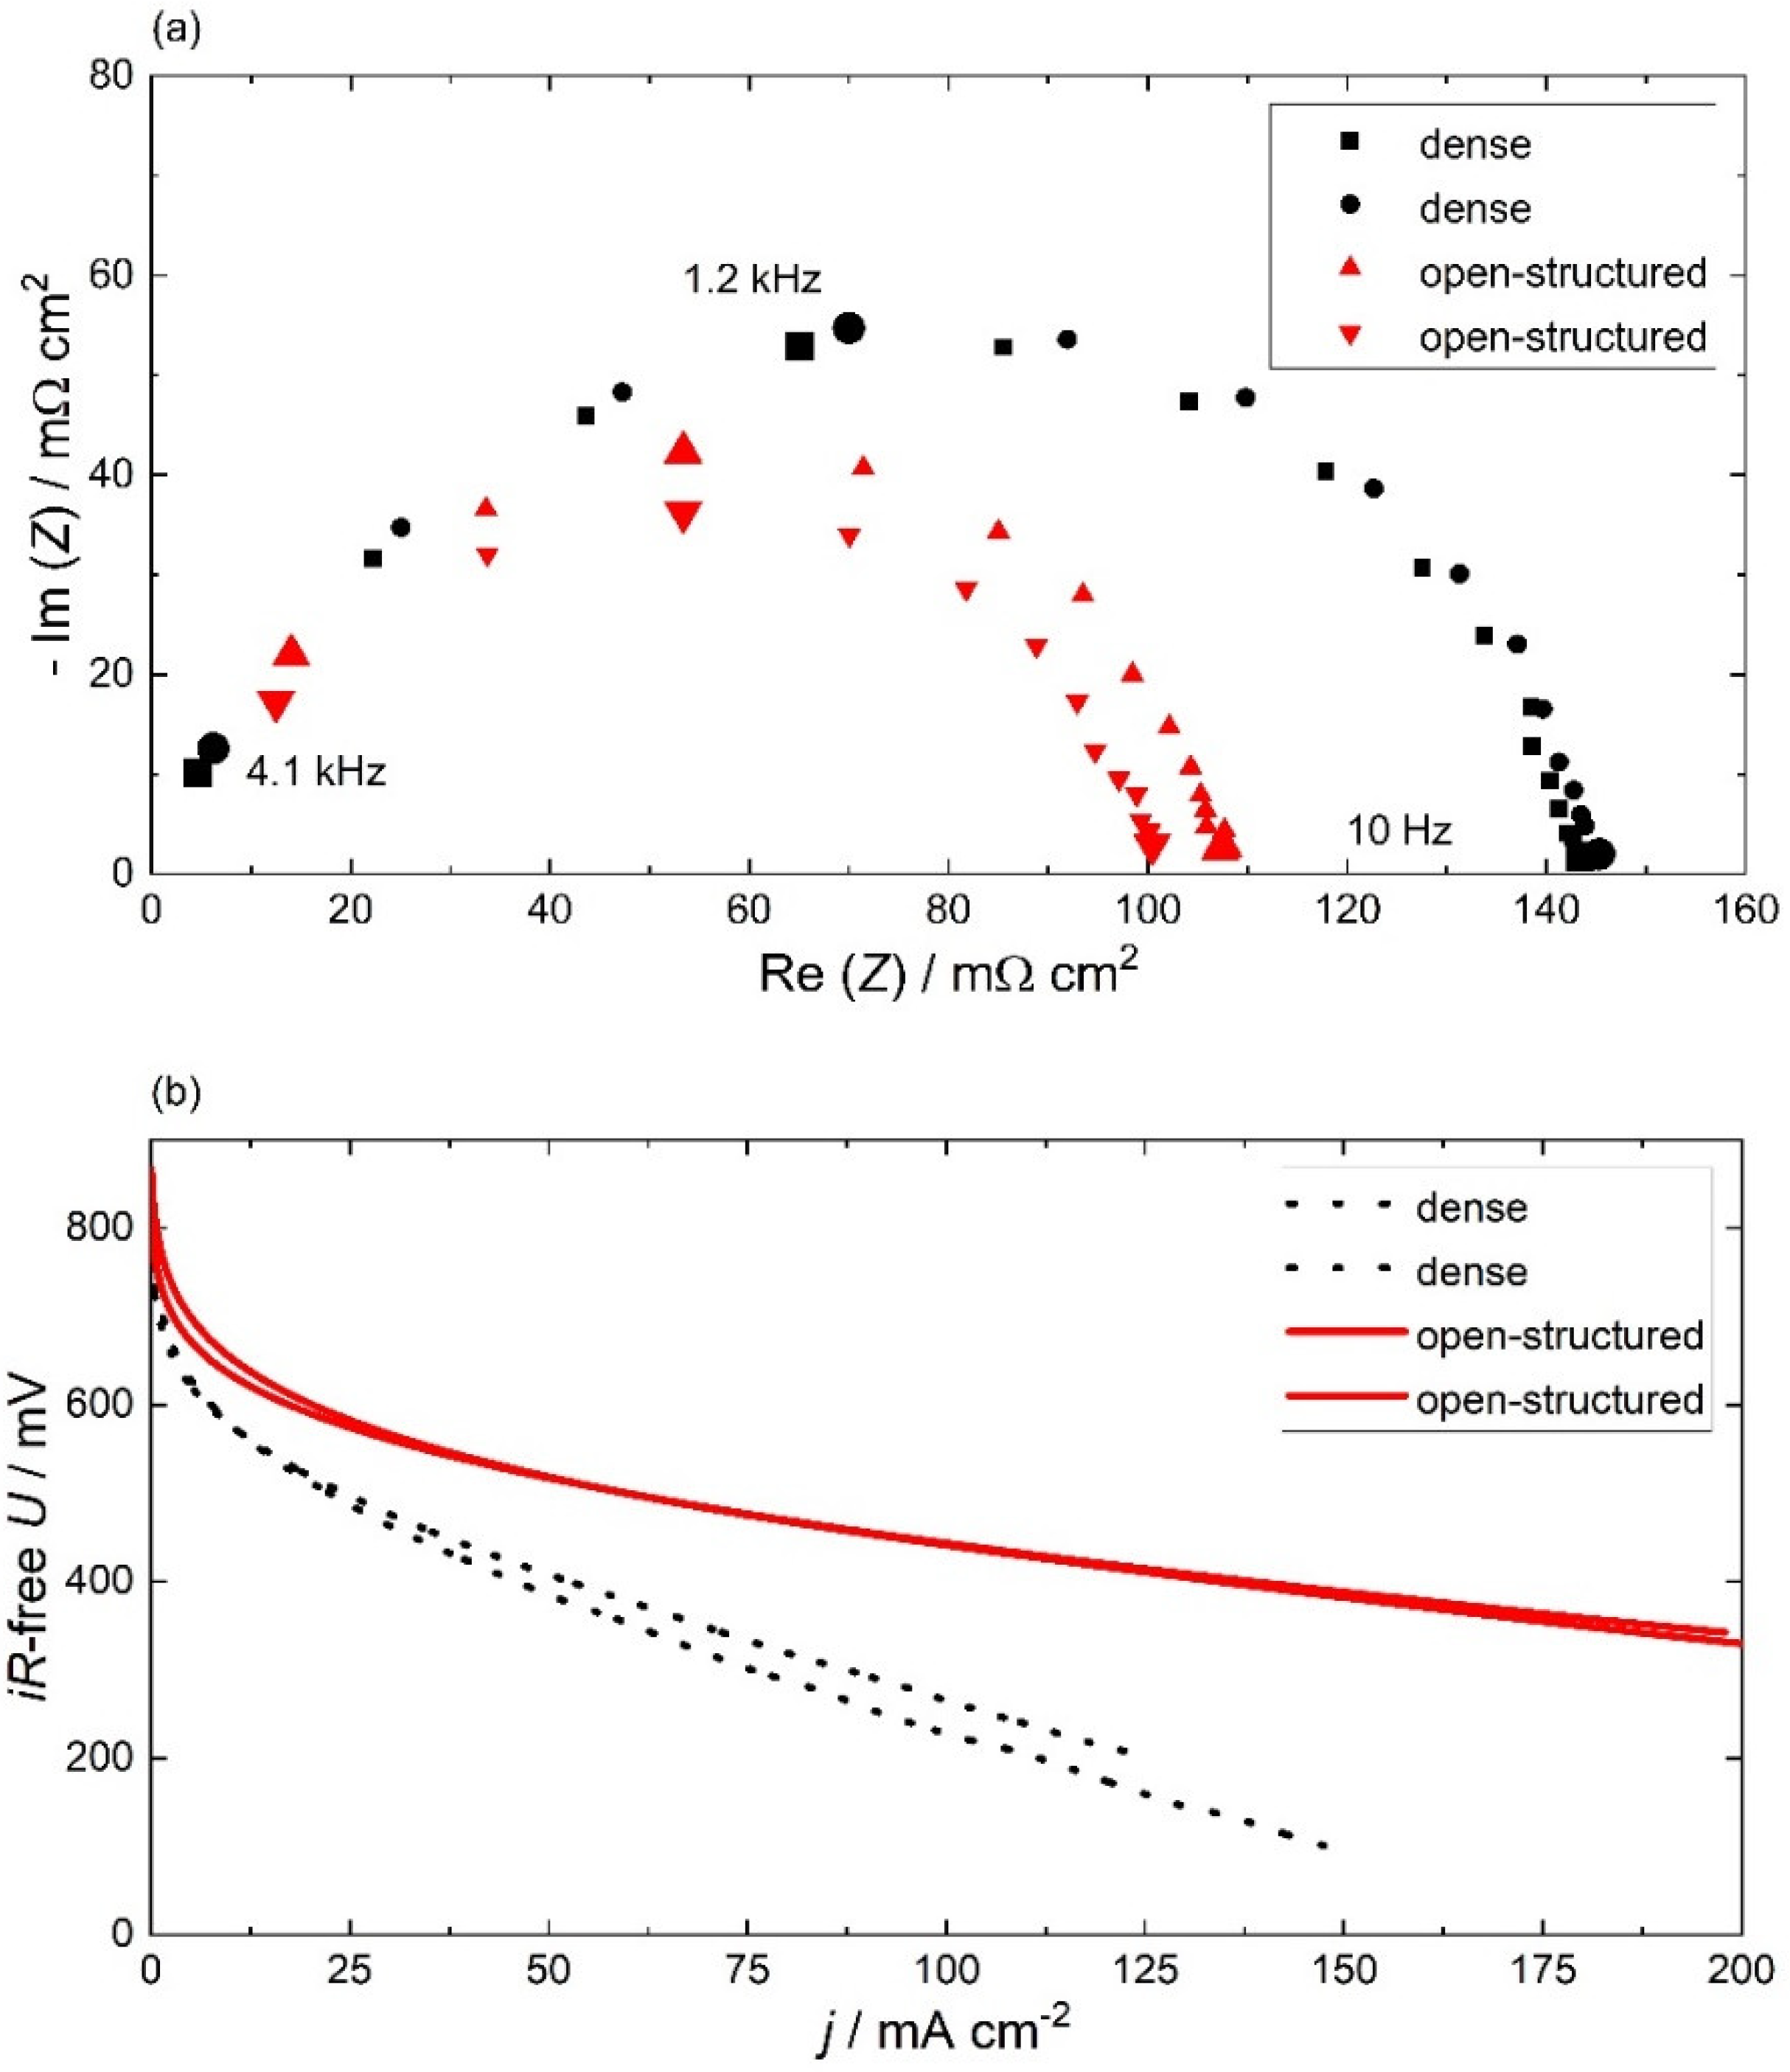
2.2. Electrochemical Characterization

The electrochemical performance of the HOR, as well as the ORR of two membrane electrolyte assemblies (MEAs) with 60 nm thick, open-structured Pt films on each site, are compared to two MEAs with 60 nm thick, dense GDEs in Figure 3. Both measurements were corrected for ohmic losses. For each GDE type, two MEAs were measured to show the reproducibility of the results.
Electrochemical impedance spectroscopy was performed under anodic fuel cell conditions to investigate the HOR. The Nyquist representation of the GDE impedance is shown in Figure 3a. For all measurements, the impedance data consist of a capacitive, depressed semi-circle arc for which the width was used to determine the area-normalized resistance (ANR). The averaged ANR of the open-structured and dense electrode is (104 ± 3) mΩ cm2 and (144 ± 1) mΩ cm2, respectively. It is remarkable that the 30% performance improvement of the open-structured GDE is achieved with only half of the Pt loading. Therefore, it is essential to calculate the mass-normalized activity (MNA) from the inverse of the ANR divided by the Pt loading. The MNAs for the dense and open-structured GDE are (51 ± 1) S mgPt−1 and (144 ± 5) S mgPt−1, respectively. The MNA of the open-structured Pt film is more than twice compared to the best results for SAFCs presented by Thoi et al. (61 S mgPt−1) [11]. Here, the MEA with open-structured GDE is the first electrode for SAFCs that combines an encouraging performance with a Pt loading of 134 μg cm−2 that approaches the target of the DOE of 125 μg cm−2 per cell [32].
However, the rate-limiting reaction under fuel cell conditions is the ORR at the cathode. In general, it is assumed that a structure-induced improvement of the anode performance has an equal performance-enhancing effect on the cathode [20,33]. The cathode performance is analyzed using the polarization curves shown in Figure 3b. Over the entire potential range, the open-structured MEA has a lower overpotential than the dense cell. For a rough comparison, the i·R-free overpotential at a current density of 50 mA cm−2 is reduced by 40% for the open-structured MEA. The enhanced Pt utilization of (2.0 ± 0.1) g kW−1 for the open-structured cell is comparable to the results of Wagner et al. but is still insufficient to address the 2020 target of DOE for a total platinum-group metal loading of only 125 mg kW−1 [20,32].
To analyze the reason for the superior performance of the open-structured GDEs, several aspects need to be considered. The open-structured and the dense MEAs were deposited and assembled in the same way. The resulting electrical contact and contact area between the current collector, the deposited thin film and the pressed electrolyte pellet are comparable for all manufactured MEAs. In addition, the discrepancy between the surface roughness (5–6 µm) of the Pt-coated GDE and the smoother electrolyte pellet generates a hollow microsphere at the interface between the electrolyte pellet and the electrocatalyst. Thus, these micro-hollows create additional double- and triple-phase boundary sites for both types of thin films (as indicated in Figure 4).
The first difference between the two films is the reduced grain size of the open-structured film. For SAFCs, electrodes with grain size from 2 nm up to 10 nm have shown the highest catalytic activity, which could explain the better performance of the open-structured GDE [8,13,14]. The second difference is the microstructure, in particular the intercolumnar voids of the open-structured film. These voids are excellent gas diffusion pathways through the thin films, enabling the electrolyte/electrode interface to become an active triple-phase boundary length as described schematically in Figure 4. The columnar voids enlarge the inner surface of the open-structured film, which increases the double-phase boundary area of the film. To unfold the catalytic contribution of the double-phase and triple-phase boundary sites, the layer thickness of the open-structured thin film is varied from 15 to 240 nm. For still thinner films, no reproducible electrochemical performance data is obtained. We suspect an incomplete or inhomogeneous coating of Pt as the cause of the performance variations for thin films below 15 nm. The contact area from the GDE and the electrolyte pellet remain identical, whereas the inner surface of the film varies with respect to the layer thickness. Therefore, the differences in the performance depending on the layer thickness are attributed to the enlarged double-phase boundary area.

2.2.1. Hydrogen Oxidation Reaction (HOR)

To investigate the reaction pathways for the HOR, the anodic fuel cell performance was analyzed by electrochemical impedance spectroscopy as a function of layer thickness. The resulting ANR and MNA are presented in Figure 5. As the layer thickness increases, the fuel cell performance improves from an ANR of 417 mΩ cm2 for the 15 nm GDE up to 72 mΩ cm2 for the 240 nm GDE. For the 120 and 240 nm Pt layers, the ANR improves only by 25% and 30%, respectively, compared to the 60 nm GDE. This indicates a still present but smaller contribution of additional Pt loading. The GDEs with a layer thickness of 60 nm or less have the same MNA of (144 ± 5) S mgPt−1. Note that the 120 nm open-structured layer has the same Pt loading as the 60 nm dense GDE, whereas the catalytic activity is doubled.
The results can be interpreted as follows. With increasing layer thickness, the electrodes become more and more active, indicating the importance of the double-phase boundary on the overall catalytic activity of the open-structured MEA. Considering the trend of the MNA, two regimes can be distinguished. The first regime goes up to a film thickness of 60 nm. For this regime, the whole Pt loading is equally available to contribute to the HOR. Thus, no diffusion limitation can be derived for this regime. Assuming that the triple-phase boundary activity is independent of the layer thickness, it can be concluded that there is no additional contribution of triple-phase boundary sites on the catalytic activity of the electrode. Otherwise, the MNA would increase for thinner films. In summary, the HOR for the first regime is rate-limited by the reactions at the interfaces between gas/catalyst or catalyst/electrolyte.
For the second regime with Pt layer thicknesses larger than 60 nm, the MNA decreases. The additional Pt loading is no longer equally contributing to the HOR. We conclude that for films thicker than 60 nm, the diffusion contribution of the reaction intermediates becomes the limiting factor. A similar trend was observed by Louie et al. for a different electrode architecture [19].
Summarizing, the presented approach of utilizing an electrode architecture with a fixed triple-phase boundary length and a variable double-phase boundary area reveals the significance of diffusion of the reaction intermediates on the catalytic process of the HOR. Moreover, we emphasize the possibility of unfolding the reaction pathways on the electrode performance by varying the Pt layer thickness.

2.2.2. Oxygen Reduction Reaction (ORR)

To investigate the ORR reaction pathway, the fuel cell performance is analyzed under SAFC operation conditions. Figure 6 shows polarization curves of MEAs with GDEs with variable Pt layer thicknesses at the cathode. To exclude the influence of the anode side, the Pt layer thickness is kept constant at 60 nm. Over the entire potential range, the fuel cell performance is similar for different layer thicknesses. The slight differences in cell performance can be attributed to experimental deviations. Thus, the ORR activity of the MEAs is independent of film thickness greater than 15 nm. In summary, the catalytically active region is limited to an area of below 15 nm near the triple-phase boundary. Therefore, the reaction pathway should have a dominant contribution to the triple-phase boundary. A possible catalytic contribution of the double-phase boundary can only be below a diffusion length of 15 nm.

2.2.3. Electrochemical Stability
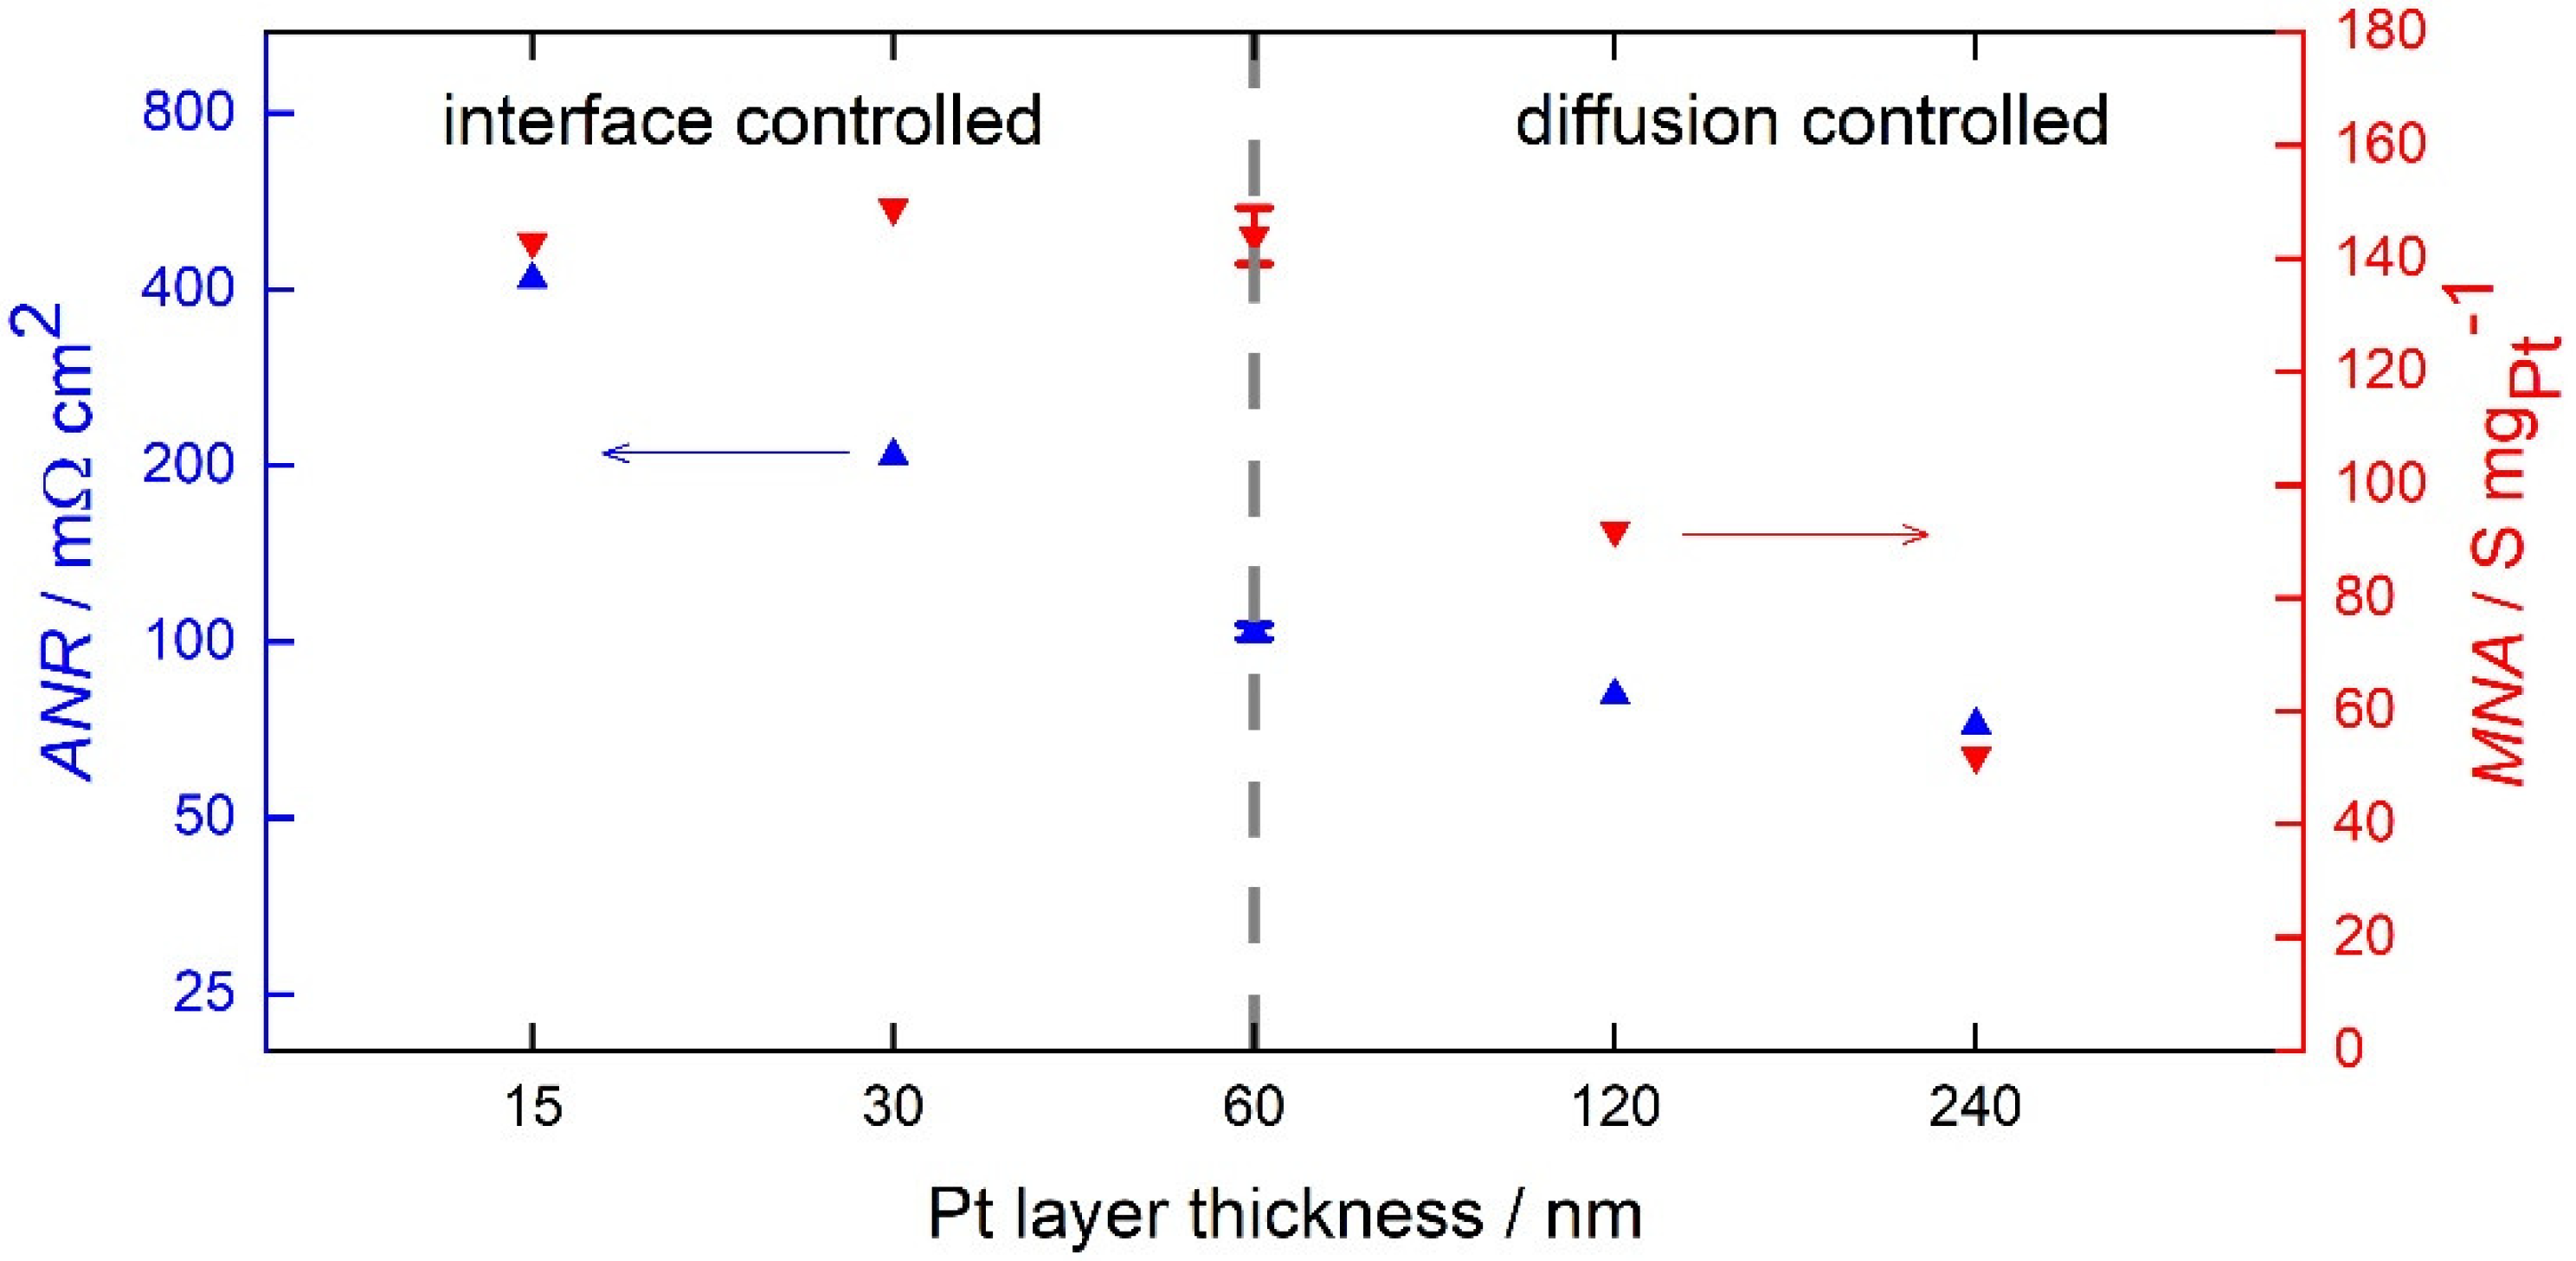
The electrochemical performance stability for the open-structured MEAs was investigated under constant current density conditions of 60 mA cm−2 and compared to that of the dense GDEs (Figure 7a). The initial performance improves for both MEAs over the first few hours. This effect is well-known for SAFC and usually attributed to the sintering of the electrolyte, which improves the interfacial contact under the pressure of the measurement setup [8,11]. This conjunction is supported by the averaged open-circuit voltage, which improves from (0.80 ± 0.05) V to (0.85 ± 0.05) V between pre- and post-fuel cell operation for both MEA types. Subsequently, the dense MEA begins to stabilize at a rate similar to the MEAs of Wagner et al. [34]. In the last 5 hours, the potential drops only by 400 μV h−1, whereas the open-structured MEAs exhibit an accelerated degradation of 1600 μV h−1. The cause of the degradation needs to be attributed to the microstructural differences between the two GDEs. Moreover, the slow degradation occurs under constant current density conditions as well as under open circuit potential and is independent of the layer thickness. This hints towards a mechanism that is independent of current and potential, and we here suggest the performance degradation to be thermally induced.
To determine the cause of the degradation, the constant current measurement for the open-structured MEA was extended to over 60 h. The resulting electrochemical impedance measurements at a potential of 100 mV are presented pre- and post-fuel cell operation, as shown in Figure 7b. For both measurements, the impedance data comprise an ohmic resistance, inductive reactance, a capacitive loop and an incomplete inductive loop below a frequency of 3 Hz. To obtain the nominal zero-frequency data, the slopes of the polarization curves are analyzed, and the resulting polarization resistance is marked by arrows in the Nyquist representation. Comparing both impedance plots, the ohmic resistance and the inductive reactance remain equal, whereas the capacitive loop increases, confirming the degradation of the MEA performance. Moreover, the symmetry of the capacitive arc differs from a depressed symmetrical semi-circle arc for pre-fuel cell operation to a tear-drop shape loop for post-fuel cell measurement. The same trend is observed for the impedance data for the potentials from 250 mV to 400 mV (see ESI3). To analyze the reason for the change in impedance symmetry, two mechanistic equivalent circuit models were fitted (see Figure 7b). The dotted lines present the high quality of the inserted fits based on the two circuit models and hence the suitability of the models. In particular, the high-frequency capacitive region is stretched, which can be attributed to a distributed finite-length Warburg diffusion element Wd [35,36,37]. This element indicates a diffusion limitation that can be associated with the diffusion of a reaction intermediates (e.g. adsorbed oxygen and /or water) of the ORR [38].
This diffusion limitation is caused by a microstructural change of the open-structured film. To confirm the hypothesis, ex situ scanning electron and scanning transmission electron microscopy measurements are conducted for the open-structured GDE in the pre (Figure 8a,c) and post 60 h fuel cell measurement (Figure 8b,d). The scanning electron micrograph of the pre-state displays a highly structured surface, whereas the post-state clearly presents a smoothened surface. Cross-sections of samples (Figure 8c,d) confirm the top view interpretation. In the pre-state, the columnar structure of the open-structured Pt thin film is clearly visible. After fuel cell measurements, the patterning of the Pt layer is reduced over the entire cross-section. Columns are not visible anymore. This is clearly an effect of the fuel cell operation, which is confirmed by the micrographs after 15 h under fuel cell operation conditions (see ESI4). We attribute these changes to the elevated operating temperatures of the cell of 513 K over a time duration of 60 h.

3. Discussion

In this study, we fabricated and analyzed open-structured GDEs and compared them with dense GDEs. In the following, we will discuss the performance of these cells in view of the reaction pathways. When considering the performance of the dense GDE, we must consider the large discrepancy between the surface roughness (5–6 µm) of the Pt-coated microporous layer on the carbon paper and the smoother electrolyte pellet. As a result of this mismatch, there are many micro-hollows at the interface between the electrolyte pellet and the electrocatalyst. These hollow microspheres create double- and triple-phase boundary sites that allow the electrode to become catalytically active. Compared to the open-structured GDE, the dense and smooth structure reduces the catalytically active surface.
Moreover, the open-structured and dense MEAs exhibit superior Pt utilization by combining an encouraging performance with low Pt loading compared to other studies (Table 2). Even the dense film presents a high platinum utilization, which stresses the advantages of directly depositing the electrocatalyst on the current collector. With this electrode architecture, we combine attractive attributes such as a good electron and proton connection of the catalyst. Moreover, the performance stability of the dense film displays a similar value to the results produced by composite Pt-coated electrolyte particles studied elsewhere [14].
In the following, we will analyze the underlying principles for the good performance and give an outlook on how to further improve the performance of SAFCs. For the HOR, there is a broadly accepted consensus in the literature that the mechanism in an acidic solution is a Tafel–Volmer or Heyrovsky–Volmer mechanism [39,40,41,42,43].
Tafel step:  H2 ⇄ 2 Had(1)
Heyrovsky step:  H2 ⇄ Had + e + H+(2)
Volmer step:  Had ⇄ H+ + e(3)
In this study, we have identified an exclusive double-phase boundary activity, suggesting that the two-step reaction mechanism is separated by the diffusion of adsorbed hydrogen, Had. In contrast to Louie et al., we observe no diffusion limitation on the catalytic activity within the first 60 nm layer thickness [19]. To determine the cause, we need to consider the different electrode architectures. Louie et al. report that hydrogen diffuses through a dense Pt thin film. In addition, it is known that the solution of hydrogen in Pt is low, and grain boundary diffusion through a dense Pt film has trap sides that further slows down the diffusion process [44,45]. In our case, the Pt microstructure permits hydrogen to diffuse through the intercolumnar voids. Here, we assume that the diffusion of adsorbed hydrogen occurs along the surface of the columns in the open-structured GDE (Figure 9). Therefore, we explain that our films are not limited by diffusion for layer thicknesses up to 60 nm. This interpretation is consistent with calculations in which each reaction step has a minimum activation energy of 40 kJ mol−1 versus a surface diffusion barrier of below 10 kJ mol−1 [46,47]. Furthermore, the depressed semi-circle arc symmetry under anodic fuel cell operation condition is in line with the symmetry of other electrode architectures that are free of Warburg diffusion element [8,9,11,20,48,49]. Therefore, we hypothesize that the open-structured GDE represents the reaction pathways for the electrode architecture of the above-mentioned studies. Considering the fast diffusion within a layer thickness of 60 nm, it is a geometrical consequence that the reaction occurs at the much larger double-phase boundary area compared to the small triple-phase length. We attribute the 30% improved performance of the 60 nm open-structured GDE compared to the 60 nm dense GDE to an enlarged electrochemically active surface area (ECSA). A quantitative, in situ measurement of the ECSA for SAFCs according to the method of Lohmann-Richters et al. was very challenging (see ESI5) [10]. In general, electrodes with a small Pt grain size have an enlarged surface-to-bulk ratio, which increases the catalytic activity and results in an improved mass-normalized activity (MNA).
For the ORR, the reaction mechanism is much more complex and involves multiple transition states [21,22]. Based on our measurements with varied film thicknesses and the reaction mechanism, we conclude the dominance of the triple-phase boundary activity (Figure 9). Moreover, the thermally induced sintering process results in an unstructured thin film in which the electrochemical impedance data indicate a finite-length Warburg diffusion element. This element may indicate the diffusion of adsorbed oxygen or water through the sintered catalyst film [50,51]. Therefore, we assume that the sintered microstructure of the degraded open-structured thin film possesses diffusion pathways through the film of a few nanometers in thickness. In view of the similar behavior of the hydrogen diffusion through a dense Pt film, we assume that the ORR has an active double-phase boundary within a few nanometers of diffusion length on the surface of the Pt columns.
Moreover, the differences in the ORR and HOR reaction pathways are consistent with the surface diffusion coefficient for adsorbed oxygen and hydrogen on Pt surfaces. The surface diffusion coefficients of hydrogen and oxygen are 10−3 cm2 s−1 and 10−7±1 cm2 s−1, respectively [52,53]. For experimental reasons, these values were measured at a temperature close to 200 K. Note that the surface diffusion coefficient is only one parameter besides the surface coverage and the desorption rate that influences the reaction pathways [54].
For an optimized electrode architecture based on our results, we derive an electrode architecture for the HOR with an enlarged surface area from a Pt film thickness in the range of 60 nm. For the ORR electrode, a porous microstructure with a Pt grain size of a few nanometers is optimum to efficiently utilize the Pt loading. We stress for this electrode that the electrocatalyst must be in contact with both the electrolyte and the gas phase. The usage of asymmetric Pt electrodes for the anode and cathode side will, in the future, considerably reduce Pt utilization while keeping the power output.

4. Materials and Methods

4.1. Electrode and Cell Fabrication

GDEs were fabricated by depositing a Pt thin film onto a carbon paper with a microporous layer (Freudenberg H23C2 with thickness: 215–255 μm and surface roughness Ra: 5–6 μm, Weinheim, Germany) by magnetron sputtering in a custom-built vacuum chamber. The coated area was circular with a diameter of 18 mm and a Pt layer thickness of 60 nm. We used a magnetron with a circular planar and 2″ (50.8 mm) diameter target (Pt purity: 99.99%, Kurt J. Lesker Company, Hastings, UK) with a target thickness of 0.125″ (3.2 mm). The magnetron source was inclined with respect to the substrate normal by approximately 20° and pointed to the center of the substrate with a distance of 12 cm. The ultimate base pressure was 1.4 x 10⁻⁴ Pa. Argon was introduced as a process gas at a constant flow rate of 60 sccm. The pumping speed was reduced by adjusting the throttle valve to reach a working gas pressure of 0.5 or 5 Pa. The magnetron was operated in continuous (direct current) mode with a constant power of 100 W for all depositions. The resulting thin films created at 0.5 Pa and 5 Pa working gas pressure are denoted as dense and open-structured, respectively.
The electrolyte, CsH2PO4, was synthesized by the methanol (99.9%, anhydrous, Alfa Aesar, Kandel, Germany)-induced precipitation reaction of the aqueous solution of Cs2CO3 (99.9%, Carl Roth, Karlsruhe, Germany) and H3PO4 (>85%, Sigma Aldrich, Darmstadt, Germany) with a yield of 65%. In brief, Cs2CO3 was diluted in water with a stoichiometric equivalent of H3PO4 and finally precipitated by methanol. The suspension was filtrated, washed and dried over 18 h at 350 K.
For the MEA, a dense pellet (diameter: 2 cm; thickness: ~250 μm) of ground and sieved electrolyte particles was pressed by an automatic, uniaxial hydraulic press (GS25440-AtlasTM Automatic 15T) at 90 MPa for 1 minute. The electrolyte pellet was sandwiched between two identical GDEs. The cell was completed by a custom-built flow field based on a sintered metal mesh (SIKA-R 10 AX, GKN Sinter Metals Filters GmbH, Radevormwald, Germany). Finally, the fuel cell was sealed by Teflon tape (100% PTFE, RS pro, Frankfurt am Main, Germany). A cross-section scanning electron micrograph of the cell is shown in Figure 10.

4.2. Physical and Electrochemical Characterization

The Pt film thickness was determined by a tactile profilometer (Bruker DektakXT, Billerica, Massachusetts, USA). For that, each film was deposited in parallel onto a lapped monocrystalline Si substrate that was locally shaded. The resulting step height between the Si surface and the film surface revealed the layer thickness (see ESI6).
The thin film and GDE microstructure were characterized by scanning electron microscopy (SEM, Ultra 55 SEM, Carl Zeiss Microscopy GmbH, Jena, Germany). The determined particle sizes were averaged over 20 measurements for both thin films.
The successful synthesis of the electrolyte powder and the Pt thin film (deposited onto carbon paper, above-mentioned Si substrate and onto an amorphous glass substrate) was confirmed by X-ray diffraction (XRD, Rigaku Ultima IV diffractometer with parallel beam geometry using Cu Kα radiation, λ = 0.15418 nm) (see ESI7). Both 2θ/ω scans as well as grazing incidence diffraction (GID) scans at a constant incidence angle of 1° were performed (see ESI8 and ESI9).
The Pt loading of the GDEs was determined by inductively coupled plasma-optical emission spectroscopy (ICP-OES, CIROS VISION, Spectro Analytical Instruments GmbH & Co. KG, Kleve, Germany). For that, Pt was dissolved in an acid solution (HCl/HNO3; 6/1; v/v) for 29 min at 500 K in a microwave-assisted oven (microPREP, MLS-GmbH Mikrowellenlaborsysteme, Leutkirch, Germany). The resulting solution was diluted in water and analyzed. The solution concentration was determined using an external multi-element standard (inorganic ventures, IV-Stock-58, 10 % (v/v) HCl, 100 µg/mL). The Pt loading was averaged over two samples of each film.
The electrochemical measurements of the manufactured MEAs were recorded with a potentiostat (VSP-300, BioLogic Science Instruments, Göttingen, Germany) and analyzed with the implemented software EC-Lab V11.36. Therefore, the MEAs were heated at a constant rate of 2 K min−1 under dry argon up to 423 K. Above this temperature, argon was humidified (flow rate 60 sccm). All electrochemical measurements were conducted at 513 K in a humidified gas atmosphere at a pressure of 0.3 atm H2O using the following procedure: at first, the symmetrical impedance measurements (sinusoidal voltage perturbation 10 mV; frequency range: 1 Hz–1 MHz) were acquired under anodic fuel cell conditions with a hydrogen gas flow rate of 60 sccm for both electrode sides. For the following fuel cell characterization, the MEAs were purged with argon (100 sccm) for 30 min. Thereafter, the gas flow rates were set to 30 sccm H2 and 30 sccm O2 at the anode and the cathode side, respectively. The anode was used as pseudo-reference electrode and counter electrode. This configuration has been commonly used for SAFCs [10,13,34,55,56]. The open-circuit voltage was measured, and the polarization curves were recorded at a scan rate of 50 mV s−1 from open-circuit voltage to 0 V. All measurements were corrected for ohmic losses, which were determined by the high-frequency intersection of the abscissa axis in the Nyquist plot. The performance stability was investigated by measuring the cell voltage at a constant current density (CC) of 60 mA cm−2 over a period of 20 h for the MEAs with dense and open-structured GDEs.
For the investigation of the open-structured MEA degradation process, the CC measurement was extended over a period of 60 h. Staircase potential electrochemical impedance spectroscopy (SPEIS) was performed with a 10 mV sinusoidal perturbation in a frequency range from 1 MHz to 200 mHz at a voltage range between 550 mV and 100 mV pre- and post-CC measurements. The polarization resistance was determined by the slope of the polarization curves (linear fit regression coefficient R2 > 0.999) and inserted into the PEIS representation of 100 mV as nominal zero-frequency resistance. The SPEIS measurements were analyzed using a mechanistic equivalent circuit model consisting of a series of inductor and ohmic resistance, and in parallel, a constant-phase element (CPE) with an ohmic resistance. For the degraded MEA, the equivalent circuit was extended with a finite-length Warburg diffusion element in the RCPE subcircuit. All electrochemical impedance data were analyzed with the Kramers–Kronig validity test to ensure a linear, time-invariant and causal system (see ESI10) [57,58]
If not stated otherwise, the Pt layer thickness of the dense and open-structured films was 60 nm. For the determination of the initial catalytic contribution of the double-phase boundary and triple-phase boundary, the layer thickness of the open-structured GDEs was varied from 15 to 240 nm. For the investigation of the HOR, the MEA consisted of identical GDEs. For the investigation of the ORR, asymmetrical MEAs were fabricated, consisting of a Pt layer thickness of 60 nm at the anode and varying Pt thin film thicknesses at the cathode.
For the ex situ investigation of the degraded, open-structured GDEs, the cell was passively cooled down, washed with water to dissolve the electrolyte and dried over 18 h at 380 K. The measurements were conducted by scanning electron microscopy with the above-mentioned instrument and a transmission electron microscopy (FEI Titan3 G2 60–300 S/TEM, FEI Company, Hillsboro, OR, USA) operating at 300 keV accelerating voltage. The preparation of cross-section specimens for transmission electron microscopy studies was completed by a combination of a focused gallium (15 keV, 5 keV and 2 keV) and focused argon (900 eV and 500 eV at LN2 temperature) ion beam milling. A probe forming annular aperture of 20 mrad was used for scanning transmission electron microscopy (STEM) work. STEM images were recorded with a high-angle dark-field (HAADF) STEM detector using annular ranges of 80–200 mrad.

5. Conclusions

In this study, we unravel the reaction pathways for an open-structured Pt electrode exhibiting a triple-phase boundary at the catalyst/electrolyte/gas interface and a double-phase boundary at the gas/catalyst interface. The area of the latter depends on the film thickness. The reaction pathways for the hydrogen oxidation reaction (HOR) proceed exclusively via the double-phase boundary. For the HOR, two regions must be distinguished. In the first region, which applies to film thicknesses up to 60 nm, the electrochemical activity is rate-limited by the processes at the gas/catalyst and/or the catalyst/electrolyte interfaces. When the film thickness exceeds 60 nm, the hydrogen surface diffusion becomes the rate-limiting process. The reaction pathway for the oxygen reduction reaction (ORR) proceeds predominantly via the triple-phase boundary. The double-phase boundary contributes additionally with a diffusion length of only a few nanometers. It is furthermore shown that in the case of reduced activity at the triple-phase boundary, e.g., due to thermally induced sintering of the formerly open-structured electrodes, ORR can proceed via the double-phase boundary followed by the diffusion of reaction intermediates through the thin film. The fabricated fuel cells using open-structured Pt electrodes exhibit superior electrocatalyst utilization. Here, the mass-normalized activity (MNA), as well as the Pt usage, is high with (144 ± 5) S mgPt−1 and (2.0 ± 0.1) g kW−1 for our SAFC, respectively. The current results suggest that the molecular reaction mechanism at the electrodes, based only on the triple-phase boundary concept, can be extended to an effective area to include all catalytic relevant diffusion processes of the reaction intermediates.

Supplementary Materials

This study includes an electronic supplementary informantion (ESI) and are available online at https://www.mdpi.com/article/10.3390/catal11091065/s1. Figure S1: Representative scanning electron micrographs of the 60 nm thick dense (left hand side) and open-structured (right hand side; including an enlarged insertion) Pt thin film deposited onto a Si substrate. The representative measured grain size (in nm) are marked white brackets. Figure S2: Representative scanning electron micrographs of the Freudenberg carbon paper including a microporous layer. Figure S3: Staircase potential impedance spectroscopy from 250 up to 550 mV vs. pseudo-hydrogen electrode pre and post fuel cell operation (60 h @ 60 mA cm-2, 0.3 atm H2O, 30 sccm H2, 30 sccm O2). The black dotted lines representing the fits for the equivalent circuits’ models consisting of a series of inductor and ohmic resistance, and in parallel a constant-phase element (CPE) with an ohmic resistance (Start) and the RCDP subcircuit was extended with finite-length Warburg diffusion element (End). Figure S4: Representative scanning (a) and scanning (b) transmission electron micrographs post 15 h of fuel cell operation. Figure S5: The polarization curves of fuel cell during the ECSA measurement. The current density depends on the upper vertex potential. The upper vertex potential is marked in the legend. The current density j is normalized to the initial current density j0 at 100 mV vs. pseudo-hydrogen electrode. Figure S6: Representative tactile profilometry measurement of the platinum layer thickness. The step height between the Si surface (marked in red) and the film surface (marked in green) reveals the layer thickness of 60 nm. Figure S7: X-ray diffraction pattern (using Cu Kα) of the synthesized electrolyte CsH2PO4 powder in this work and the powder data published by Preisinger et al.1 (with offset for better presentation). The diffraction data from Preisinger were obtained from the Cambridge Structural Database (CCDC number 1639853) and the presented diffraction pattern was predicted using the software PLATON. Figure S8: Grazing incidence X-ray diffraction patterns (using Cu Kα) of the 60 nm thick dense and open-structured Pt thin films deposited on Si wafer and glass substrate (intensity normalized to Pt{111}, y-axis offset for better presentability). Reference positions of the X-ray reflections based on Davey et al. Figure S9: Comparison between the grain sizes estimated from XRD patterns via Scherrer equation (Figure S3) and measured by the SEM micrographs. Figure S10a: Impedance data residuals (blue- residuals of Re(Z) and green- residuals of Im(Z)) from the potential electrochemical impedance measurement pre and post fuel cell operation (with an offset of 2%) according to the Kramers-Kronig relation. The dotted, grey lines present the validity region of ±1%. Figure S10b: Impedance data residuals (blue- residuals of Re(Z) and green- residuals of Im(Z)) from the impedance measurement under anodic conditions for two 0.5 and 5 Pa MEAs according to the Kramers-Kronig relation. For clarification, each measurement has an offset of 2%. The dotted, grey lines present the validity region of ±1%. Figure S11: Nyquist representation of the open-structured GDE impedance of the varied layer thicknesses measured under anodic fuel cell conditions (513 K, 60 sccm H2 and 0.3 atm H2O).

Author Contributions

Conceptualization: O.L. and A.K.; methodology: O.L.; validation: M.R. and J.W.G.; formal analysis: O.L. and A.K.; investigation: O.L., A.K., W.D., A.P., J.G., S.W. and A.L.; resources: A.A. and B.A.; data curation: O.L. and A.K.; writing—original draft preparation: O.L., A.K. and M.R.; writing—review and editing: M.R., W.D., A.P., J.W.G., J.G., S.W., A.L., A.A. and B.A.; visualization: A.K.; supervision: M.R.; project administration: M.R.; funding acquisition: A.A. and B.A. All authors have read and agreed to the published version of the manuscript.

Funding

The authors are grateful for partial funding of this activity by the Volkswagen Foundation (Grant No. 90367) and the European Regional Development Fund (Grant No. 100336119).

Data Availability Statement

Data are contained within the article. The raw data that supports the findings of this study are available from the corresponding author upon resonbale request.

Acknowledgments

The authors are grateful to C. Laube (Leibniz Institute of Surface Engineering, IOM, Leipzig) and H. Kohlmann (Leipzig University) for helpful, inspiring discussions. We thank U. Gey, A. Mill, J. Knipper, S. Pyczak, M. Börner, M. Wagner and T. Liebeskind (Leibniz Institute of Surface Engineering, IOM, Leipzig) and S. Möller (BioLogic Germany, Göttingen) for technical support.

Conflicts of Interest

The authors declare that they have no known competing financial interests or personal relationships that could have appeared to influence the work reported in this paper.

References

  1. Goñi-Urtiaga, A.; Presvytes, D.; Scott, K. Solid Acids as Electrolyte Materials for Proton Exchange Membrane (PEM) Electrolysis: Review. Int. J. Hydrogen Energy 2012, 37, 3358–3372. [Google Scholar] [CrossRef]
  2. Paschos, O.; Kunze, J.; Stimming, U.; Maglia, F. A Review on Phosphate Based, Solid State, Protonic Conductors for Intermediate Temperature Fuel Cells. J. Phys. Condens. Matter 2011, 23, 234110. [Google Scholar] [CrossRef]
  3. Scott, K.; Xu, C.; Wu, X. Intermediate Temperature Proton-Conducting Membrane Electrolytes for Fuel Cells: Intermediate Temperature Proton-Conducting Membrane Electrolytes for Fuel Cells. WIREs Energy Environ. 2014, 3, 24–41. [Google Scholar] [CrossRef]
  4. Haile, S.M.; Boysen, D.A.; Chisholm, C.R.I.; Merle, R.B. Solid Acids as Fuel Cell Electrolytes. Nature 2001, 410, 910–913. [Google Scholar] [CrossRef] [Green Version]
  5. Taninouchi, Y.; Uda, T.; Awakura, Y.; Ikeda, A.; Haile, S.M. Dehydration Behavior of the Superprotonic Conductor CsH2PO4 at Moderate Temperatures: 230 to 260 °C. J. Mater. Chem. 2007, 17, 3182. [Google Scholar] [CrossRef]
  6. Uda, T.; Boysen, D.A.; Chisholm, C.R.I.; Haile, S.M. Alcohol Fuel Cells at Optimal Temperatures. Electrochem. Solid State Lett. 2006, 9, A261. [Google Scholar] [CrossRef]
  7. Chisholm, C.R.I.; Boysen, D.A.; Papandrew, A.B.; Zecevic, S.; Cha, S.; Sasaki, K.A.; Varga, Á.; Giapis, K.P.; Haile, S.M. From Laboratory Breakthrough to Technological Realization: The Development Path for Solid Acid Fuel Cells. Electrochem. Soc. Interface 2009, 18, 53. [Google Scholar]
  8. Lohmann, F.P.; Schulze, P.S.C.; Wagner, M.; Naumov, O.; Lotnyk, A.; Abel, B.; Varga, Á. The next Generation Solid Acid Fuel Cell Electrodes: Stable, High Performance with Minimized Catalyst Loading. J. Mater. Chem. A 2017, 5, 15021–15025. [Google Scholar] [CrossRef]
  9. Suryaprakash, R.C.; Lohmann, F.P.; Wagner, M.; Abel, B.; Varga, A. Spray Drying as a Novel and Scalable Fabrication Method for Nanostructured CsH 2 PO 4, Pt-Thin-Film Composite Electrodes for Solid Acid Fuel Cells. RSC Adv. 2014, 4, 60429–60436. [Google Scholar] [CrossRef]
  10. Lohmann-Richters, F.P.; Abel, B.; Varga, Á. In Situ Determination of the Electrochemically Active Platinum Surface Area: Key to Improvement of Solid Acid Fuel Cells. J. Mater. Chem. A 2018, 6, 2700–2707. [Google Scholar] [CrossRef]
  11. Thoi, V.S.; Usiskin, R.E.; Haile, S.M. Platinum-Decorated Carbon Nanotubes for Hydrogen Oxidation and Proton Reduction in Solid Acid Electrochemical Cells. Chem. Sci. 2015, 6, 1570–1577. [Google Scholar] [CrossRef] [PubMed] [Green Version]
  12. Uda, T.; Haile, S.M. Thin-Membrane Solid-Acid Fuel Cell. Electrochem. Solid State Lett. 2005, 8, A245–A246. [Google Scholar] [CrossRef] [Green Version]
  13. Papandrew, A.B.; Chisholm, C.R.I.; Elgammal, R.A.; Özer, M.M.; Zecevic, S.K. Advanced Electrodes for Solid Acid Fuel Cells by Platinum Deposition on CsH 2 PO 4. Chem. Mater. 2011, 23, 1659–1667. [Google Scholar] [CrossRef] [Green Version]
  14. Lim, D.-K.; Liu, J.; Pandey, S.A.; Paik, H.; Chisholm, C.R.I.; Hupp, J.T.; Haile, S.M. Atomic Layer Deposition of Pt@CsH2PO4 for the Cathodes of Solid Acid Fuel Cells. Electrochim. Acta 2018, 288, 12–19. [Google Scholar] [CrossRef] [Green Version]
  15. Papandrew, A.B.; Elgammal, R.A.; Tian, M.; Tennyson, W.D.; Rouleau, C.M.; Puretzky, A.A.; Veith, G.M.; Geohegan, D.B.; Zawodzinski, T.A. Nanostructured Carbon Electrocatalyst Supports for Intermediate-Temperature Fuel Cells: Single-Walled versus Multi-Walled Structures. J. Power Sources 2017, 337, 145–151. [Google Scholar] [CrossRef] [Green Version]
  16. An, Q.; Paulus, F.; Vaynzof, Y. Controlling the Microstructure and Porosity of Perovskite Films by Additive Engineering. ACS Appl. Energy Mater. 2021, 4, 2990–2998. [Google Scholar] [CrossRef]
  17. Quintero-Ruiz, J.; Ruiz-Rosas, R.; Quílez-Bermejo, J.; Salinas-Torres, D.; Cazorla-Amorós, D.; Morallón, E. Preparation of Pt/CNT Thin-Film Electrodes by Electrochemical Potential Pulse Deposition for Methanol Oxidation. C 2021, 7, 32. [Google Scholar] [CrossRef]
  18. Zhu, J.; Xu, L.; Lyu, Z.; Xie, M.; Chen, R.; Jin, W.; Mavrikakis, M.; Xia, Y. Janus Nanocages of Platinum-Group Metals and Their Use as Effective Dual-Electrocatalysts. Angew. Chem. Int. Ed. 2021, 60, 10384–10392. [Google Scholar] [CrossRef] [PubMed]
  19. Louie, M.W.; Haile, S.M. Platinum Thin Film Anodes for Solid Acid Fuel Cells. Energy Environ. Sci. 2011, 4, 4230. [Google Scholar] [CrossRef] [Green Version]
  20. Wagner, M.; Dreßler, C.; Lohmann-Richters, F.P.; Hanus, K.; Sebastiani, D.; Varga, A.; Abel, B. Mechanism of Ion Conductivity through Polymer-Stabilized CsH2PO4 Nanoparticular Layers from Experiment and Theory. J. Mater. Chem. A 2019, 7, 27367–27376. [Google Scholar] [CrossRef]
  21. Fu, C.; Liu, C.; Li, T.; Zhang, X.; Wang, F.; Yang, J.; Jiang, Y.; Cui, P.; Li, H. DFT Calculations: A Powerful Tool for Better Understanding of Electrocatalytic Oxygen Reduction Reactions on Pt-Based Metallic Catalysts. Comput. Mater. Sci. 2019, 170, 109202. [Google Scholar] [CrossRef]
  22. Kulkarni, A.; Siahrostami, S.; Patel, A.; Nørskov, J.K. Understanding Catalytic Activity Trends in the Oxygen Reduction Reaction. Chem. Rev. 2018, 118, 2302–2312. [Google Scholar] [CrossRef] [PubMed]
  23. Anders, A. A Structure Zone Diagram Including Plasma-Based Deposition and Ion Etching. Thin Solid Films 2010, 518, 4087–4090. [Google Scholar] [CrossRef] [Green Version]
  24. Slavcheva, E.; Ganske, G.; Topalov, G.; Mokwa, W.; Schnakenberg, U. Effect of Sputtering Parameters on Surface Morphology and Catalytic Efficiency of Thin Platinum Films. Appl. Surf. Sci. 2009, 255, 6479–6486. [Google Scholar] [CrossRef]
  25. Sakaliūnienė, J.; Abakevičienė, B.; Šlapikas, K.; Tamulevičius, S. Influence of Magnetron Sputtering Deposition Conditions and Thermal Treatment on Properties of Platinum Thin Films for Positive Electrode–Electrolyte–Negative Electrode Structure. Thin Solid Films 2015, 594, 101–108. [Google Scholar] [CrossRef]
  26. Li, L.; Wang, L.-L.; Johnson, D.D.; Zhang, Z.; Sanchez, S.I.; Kang, J.H.; Nuzzo, R.G.; Wang, Q.; Frenkel, A.I.; Li, J.; et al. Noncrystalline-to-Crystalline Transformations in Pt Nanoparticles. J. Am. Chem. Soc. 2013, 135, 13062–13072. [Google Scholar] [CrossRef]
  27. Zepeda-Ruiz, L.A.; Chason, E.; Gilmer, G.H.; Wang, Y.; Xu, H.; Nikroo, A.; Hamza, A.V. Understanding the Relation between Stress and Surface Morphology in Sputtered Films: Atomistic Simulations and Experiments. Appl. Phys. Lett. 2009, 95, 151910. [Google Scholar] [CrossRef]
  28. Slavcheva, E.; Topalov, G.; Ganske, G.; Radev, I.; Lefterova, E.; Schnakenberg, U. Influence of Sputtering Pressure on Surface Structure and Oxygen Reduction Reaction Catalytic Activity of Thin Platinum Films. Electrochim. Acta 2010, 55, 8992–8997. [Google Scholar] [CrossRef]
  29. Swanson, H.; Tatge, E. Standard X-Ray Diffraction Powder Patterns; National Bureau of Standards Circular 539; US Department of Commerce: Washington, DC, USA, 1953; Volume 1. [Google Scholar]
  30. Thomas, J.H., II. Effect of Pressure on Dc Planar Magnetron Sputtering of Platinum. J. Vac. Sci. Technol. A 2003, 21, 572–576. [Google Scholar] [CrossRef]
  31. Wang, J.; Wang, S.-Q. Surface Energy and Work Function of Fcc and Bcc Crystals: Density Functional Study. Surf. Sci. 2014, 630, 216–224. [Google Scholar] [CrossRef]
  32. DOE Technical Targets for Polymer Electrolyte Membrane Fuel Cell Components|Department of Energy. Available online: https://www.energy.gov/eere/fuelcells/doe-technical-targets-polymer-electrolyte-membrane-fuel-cell-components (accessed on 10 March 2021).
  33. Varga, A. Progress in Solid Acid Fuel Cell Electrodes. Am. J. Nano Res. Appl. 2014, 2, 61–65. [Google Scholar] [CrossRef]
  34. Wagner, M.; Lorenz, O.; Lohmann-Richters, F.; Varga, A.; Abel, B. Study on Solid Electrolyte Catalyst Poisoning in Solid Acid Fuel Cells. J. Mater. Chem. A 2021, 9, 11347–11358. [Google Scholar] [CrossRef]
  35. Boukamp, B.A. Derivation of a Distribution Function of Relaxation Times for the (Fractal) Finite Length Warburg. Electrochim. Acta 2017, 252, 154–163. [Google Scholar] [CrossRef]
  36. Dhirde, A.M.; Dale, N.V.; Salehfar, H.; Mann, M.D.; Han, T.-H. Equivalent Electric Circuit Modeling and Performance Analysis of a PEM Fuel Cell Stack Using Impedance Spectroscopy. IEEE Trans. Energy Convers. 2010, 25, 778–786. [Google Scholar] [CrossRef]
  37. Franceschetti, D.R.; RossMacdonald, J.; Buck, R.P. Interpretation of Finite-Length-Warburg-Type Impedances in Supported and Unsupported Electrochemical Cells with Kinetically Reversible Electrodes. J. Electrochem. Soc. 1991, 138, 1368. [Google Scholar] [CrossRef]
  38. Giner-Sanz, J.J.; Ortega, E.M.; Pérez-Herranz, V. Mechanistic Equivalent Circuit Modelling of a Commercial Polymer Electrolyte Membrane Fuel Cell. J. Power Sources 2018, 379, 328–337. [Google Scholar] [CrossRef]
  39. Wang, J.X.; Springer, T.E.; Adzic, R.R. Dual-Pathway Kinetic Equation for the Hydrogen Oxidation Reaction on Pt Electrodes. J. Electrochem. Soc. 2006, 153, A1732. [Google Scholar] [CrossRef]
  40. Harrington, D.A.; Conway, B.E. Ac Impedance of Faradaic Reactions Involving Electrosorbed Intermediates—I. Kinetic Theory. Electrochim. Acta 1987, 32, 1703–1712. [Google Scholar] [CrossRef] [Green Version]
  41. de Chialvo, M.R.G.; Chialvo, A.C. Hydrogen Diffusion Effects on the Kinetics of the Hydrogen Electrode Reaction. Part I: Theoretical Aspects. Phys. Chem. Chem. Phys. 2004, 6, 4009. [Google Scholar] [CrossRef]
  42. Bhardwaj, M.; Balasubramaniam, R. Uncoupled Non-Linear Equations Method for Determining Kinetic Parameters in Case of Hydrogen Evolution Reaction Following Volmer–Heyrovsky–Tafel Mechanism and Volmer–Heyrovsky Mechanism. Int. J. Hydrogen Energy 2008, 33, 2178–2188. [Google Scholar] [CrossRef]
  43. Durst, J.; Siebel, A.; Simon, C.; Hasché, F.; Herranz, J.; Gasteiger, H.A. New Insights into the Electrochemical Hydrogen Oxidation and Evolution Reaction Mechanism. Energy Environ. Sci. 2014, 7, 2255–2260. [Google Scholar] [CrossRef] [Green Version]
  44. Turnbull, A. Hydrogen Diffusion and Trapping in Metals. In Gaseous Hydrogen Embrittlement of Materials in Energy Technologies; Elsevier: Amsterdam, Netherlands, 2012; pp. 89–128. [Google Scholar] [CrossRef]
  45. Ishikawa, T.; McLellan, R.B. The Diffusivity of Hydrogen in the Noble Metals at Low Temperature. Acta Metall. 1985, 33, 1979–1985. [Google Scholar] [CrossRef]
  46. Skúlason, E.; Tripkovic, V.; Björketun, M.E.; Gudmundsdóttir, S.; Karlberg, G.; Rossmeisl, J.; Bligaard, T.; Jónsson, H.; Nørskov, J.K. Modeling the Electrochemical Hydrogen Oxidation and Evolution Reactions on the Basis of Density Functional Theory Calculations. J. Phys. Chem. C 2010, 114, 18182–18197. [Google Scholar] [CrossRef]
  47. Watson, G.W.; Wells, R.P.K.; Willock, D.J.; Hutchings, G.J. A Comparison of the Adsorption and Diffusion of Hydrogen on the {111} Surfaces of Ni, Pd, and Pt from Density Functional Theory Calculations. J. Phys. Chem. B 2001, 105, 4889–4894. [Google Scholar] [CrossRef]
  48. Haile, S.M.; Chisholm, C.R.I.; Sasaki, K.; Boysen, D.A.; Uda, T. Solid Acid Proton Conductors: From Laboratory Curiosities to Fuel Cell Electrolytes. Faraday Discuss. 2007, 134, 17–39. [Google Scholar] [CrossRef] [PubMed] [Green Version]
  49. Papandrew, A.B.; Chisholm, C.R.I.; Zecevic, S.K.; Veith, G.M.; Zawodzinski, T.A. Activity and Evolution of Vapor Deposited Pt-Pd Oxygen Reduction Catalysts for Solid Acid Fuel Cells. J. Electrochem. Soc. 2013, 160, F175–F182. [Google Scholar] [CrossRef]
  50. Eikerling, M.; Kornyshev, A.A. Electrochemical Impedance of the Cathode Catalyst Layer in Polymer Electrolyte Fuel Cells. J. Electroanal. Chem. 1999, 475, 107–123. [Google Scholar] [CrossRef]
  51. Touhami, S.; Mainka, J.; Dillet, J.; Taleb, S.A.H.; Lottin, O. Transmission Line Impedance Models Considering Oxygen Transport Limitations in Polymer Electrolyte Membrane Fuel Cells. J. Electrochem. Soc. 2019, 166, F1209–F1217. [Google Scholar] [CrossRef]
  52. Graham, A.P.; Menzel, A.; Toennies, J.P. Quasielastic Helium Atom Scattering Measurements of Microscopic Diffusional Dynamics of H and D on the Pt(111) Surface. J. Chem. Phys. 1999, 111, 1676–1685. [Google Scholar] [CrossRef]
  53. Wintterlin, J.; Schuster, R.; Ertl, G. Existence of a Hot Atom Mechanism for the Dissociation of O2 on Pt(111). Phys. Rev. Lett. 1996, 77, 123. [Google Scholar] [CrossRef]
  54. Lombardo, S.J.; Bell, A.T. A Review of Theoretical Models of Adsorption, Diffusion, Desorption, and Reaction of Gases on Metal Surfaces. Surf. Sci. Rep. 1991, 13, 3–72. [Google Scholar] [CrossRef]
  55. Boysen, D.A. High-Performance Solid Acid Fuel Cells Through Humidity Stabilization. Science 2004, 303, 68–70. [Google Scholar] [CrossRef] [PubMed] [Green Version]
  56. Sasaki, K.A.; Hao, Y.; Haile, S.M. Geometrically Asymmetric Electrodes for Probing Electrochemical Reaction Kinetics: A Case Study of Hydrogen at the Pt–CsH2PO4 Interface. Phys. Chem. Chem. Phys. 2009, 11, 8349. [Google Scholar] [CrossRef] [PubMed] [Green Version]
  57. Boukamp, B.A. A Linear Kronig-Kramers Transform Test for Immittance Data Validation. J. Electrochem. Soc. 1995, 142, 1885–1894. [Google Scholar] [CrossRef]
  58. Schönleber, M.; Klotz, D.; Ivers-Tiffée, E. A Method for Improving the Robustness of Linear Kramers-Kronig Validity Tests. Electrochim. Acta 2014, 131, 20–27. [Google Scholar] [CrossRef]
Figure 1. Electrode microstructure: representative plane-view scanning electron micrographs of 60 nm thick dense (left-hand side) and open-structured (right-hand side) platinum thin films deposited onto a Si substrate (a,b) and onto a carbon paper (cg), respectively. Micrographs (c) and (d) present an overview of the morphology of the GDEs, whereas the micrographs (e) and (f) show detailed images. Micrograph (g) represents a cross-sectional image of the open-structured Pt thin film.
Catalysts 11 01065 g001
Figure 2. X-ray diffraction patterns (using Cu Kα radiation) of the 60 nm thick dense and open-structured Pt thin films deposited on carbon paper (normalized to Pt{111}). Reference positions and intensities of the X-ray reflections from Pt powder based on Swanson and Tatge [29].
Catalysts 11 01065 g002
Figure 3. Electrochemical performance: (a) Nyquist plot of 60 nm thick dense and open-structured GDE impedance measured under anodic fuel cell conditions (513 K, 60 sccm H2 and 0.3 atm H2O). The enlarged data points indicate the measurement frequencies and are added for orientation. (b) Polarization curves of the dense and open-structured MEAs under fuel cell operation conditions (513 K, 30 sccm O2, 30 sccm H2, 0.3 atm H2O). Both measurements were corrected for ohmic losses. The dense and open-structured electrodes are marked in black and red, respectively.
Catalysts 11 01065 g003
Figure 4. Cross-section through the anode of the solid acid fuel cell. The scheme shows protons (darker blue), hydrogen gas (lighter blue), the double-phase (green lines) and triple-phase boundary (red dots) on the Pt columns of the open-structured GDE. The roughness mismatch between the Pt-coated carbon paper and the electrolyte pellet is indicated by the hollow microsphere. The illustration is not to scale.
Catalysts 11 01065 g004
Figure 5. Double-logarithmic plot of the Pt layer thickness and the area-normalized resistance (ANR) in blue under anodic fuel cell conditions (513 K, 60 sccm H2 and 0.3 atm H2O). The resulting mass-normalized activity (MNA) is plotted in red with a linear scale.
Catalysts 11 01065 g005
Figure 6. Polarization curves of the MEAs with open-structured GDEs possessing different layer thicknesses from 15 nm up to 120 nm at the cathode and a 60 nm-thick open-structured GDE at the anode under fuel cell operation conditions (513 K, 30 sccm O2, 30 sccm H2, 0.3 atm H2O).
Catalysts 11 01065 g006
Figure 7. Electrochemical performance stability: (a) representative cell voltage under constant current measurement conditions (current density: 60 mA cm−2) under fuel cell operation conditions (513 K, 30 sccm H2, 30 sccm O2) over a period of 20 h for the 60 nm dense (black) and open-structured (red) MEAs. Occasional spikes in the cell voltage of the dense MEAs are attributed to water vapor, which improves the electrical connection between the MEA and the sample holder but does not influence the cell performance. (b) Potential impedance spectroscopy at 100 mV vs. pseudo-hydrogen electrode pre- (start, marked in blue) and post- (end, marked in green) fuel cell operation (60h @ 60 mA cm−2, 0.3 atm H2O, 30 sccm H2, 30 sccm O2). The black dotted lines represent the fits for the equivalent circuits’ models inserted above the graph. The arrows represent the polarization resistance, which is extracted from the slope of the polarization curves.
Catalysts 11 01065 g007
Figure 8. Representative scanning (as top view, a,b) and scanning transmission (as cross-section, c,d) electron micrographs of the open-structured GDE pre (a,c) and post (b,d) 60 h of fuel cell operation.
Catalysts 11 01065 g008
Figure 9. Cross-section through the membrane electrolyte assembly (MEA) with an illustration of the reaction pathways of the hydrogen oxidation reaction (HOR) on the left side and the oxygen reduction reaction (ORR) on the right side. The gases hydrogen (dark blue) and oxygen (light blue) as well as the reaction product, water, are marked. The green marked areas indicate the active double-phase boundary (for HOR—within 60 nm layer thickness with equal and above 60 nm gradual contribution; ORR—with a gradual contribution within 15 nm layer thickness) and the red dots the contribution of the triple-phase boundary on the ORR side. The scheme is not to scale.
Catalysts 11 01065 g009
Figure 10. Representative scanning electron micrograph of a cross-section from a symmetrical membrane electrolyte assembly (MEA) consisting of a dense CsH2PO4 (CDP) electrolyte pellet in the center and two identical gas diffusion electrodes (GDEs) including a platinum thin film (Pt) on each side.
Catalysts 11 01065 g010
Table 1. Platinum film growth rates at different working gas pressures and properties (method) of the associated dense and open-structured thin films, including film thickness (tactile profilometer), platinum loading (ICP-OES) and grain size (SEM).
Deposition Rate
(nm min−1)
Film Thickness (nm)Pt Loading
(µg cm−2)
Grain Size
(nm)
Dense (0.5 Pa)25.9 ± 1.563 ± 4136 ± 215.3 ± 2.7
Open-structured (5 Pa)34.5 ± 2.458 ± 467 ± 18.0 ± 1.7
Table 2. Comparison of our membrane electrolyte assembly (MEA) performance to recently reported SAFC performance, including platinum loading per electrode, area-normalized resistance (ANR), mass-normalized activity (MNA) and power density-normalized platinum utilization (Pt use) and the deposition methods (dcMS—DC Magnetron Sputtering; MOCVD—metal-organic chemical vapor deposition, ALD—atomic layer deposition, imp.—impregnation) on CDP–electrolyte particles, CNTs—carbon nanotubes or CP—carbon paper with microporous layer. The performance data obtained in this study are added in the first two lines.
Electrode ArchitecturePt Loading
(µg cm−2)
ANR
(mΩ cm2)
MNA
(S mg−1)
Pt Utilization
(g kW−1)
60 nm Ptopen-structured@CP (this work)67 ± 1104 ± 3144 ± 52.0 ± 0.1
60 nm Ptdense@CP (this work)136 ± 2144 ± 151 ± 19.8 ± 0.2
7.5 nm PtdcMS@CDP1917310019
PtALD@CDP1410005020<10
PtMOCVD@CDP131750 6.5
PtMOCVD@CNTs8410504911.7
30 nm PtdcMS@CDPSpray2064745212.0
PtImpregnation@CNTs1114120061
Publisher’s Note: MDPI stays neutral with regard to jurisdictional claims in published maps and institutional affiliations.

