Article

Simultaneous Galvanic Generation of Fe2+ Catalyst and Spontaneous Energy Release in the Galvano-Fenton Technique: A Numerical Investigation of Phenol’s Oxidation and Energy Production and Saving

1
Higher School of Industrial Technologies, Department of Second Cycle, P.O. Box 218, Annaba 23000, Algeria
2
Chemical Engineering Department, College of Engineering, King Saud University, P.O. Box 800, Riyadh 11421, Saudi Arabia
3
Laboratoire Ampère, École Centrale de Lyon, 36 Avenue Guy de Collongue, 69134 Écully, France
*
Author to whom correspondence should be addressed.
Catalysts 2021, 11(8), 943; https://doi.org/10.3390/catal11080943
Submission received: 6 July 2021 / Revised: 25 July 2021 / Accepted: 2 August 2021 / Published: 4 August 2021
(This article belongs to the Special Issue Advancements in Electrochemical Energy Catalysts)

Abstract

:
The present paper investigates the potential of the Galvano-Fenton process as an advanced technique in terms of the simultaneous oxidation of a model pollutant, phenol, and the energy release and saving as compared to conventional electrochemical techniques, namely, Fenton, Fenton-like, and Electro-Fenton. A numerical model describing the electrochemical, electrolytic, and phenol’s mineralization reactions is presented. Simulations are conducted to predict the kinetics of ferrous and ferric ions, radicals’ formation, and phenol degradation along with released power. Parametric analysis and comparisons are also performed between the basic configuration of the Galvano-Fenton process and its upgraded version integrating a pre-immersion stage of the electrodes in the electrolyte equivalent to 25% of the total experiment’s duration. The ratio of the initial concentration of H 2 O 2 to the concentration of the released/added F e 2 + catalyst is varied from 10 to 30. The effect of phenol concentration is inspected over the range of 0.188 to 10 mg/L as well. Compared to conventional Fenton-based techniques, the Galvano-Fenton process demonstrated a higher performance by reaching 1.34% of degradation efficiency per released J. This is associated with the generation of hydroxyl radicals of 0.047 nM/released J with initial concentrations of hydrogen peroxide and phenol of 0.187 mM and 2 µM, respectively. Moreover, the integration of the pre-immersion stage allowed the overcoming the barrier of the null degradation rate at the initial instant.

1. Introduction

The history of the Fenton reaction began in 1894 when Henry John Horstman Fenton observed a higher oxidative capacity of a mixture containing iron ions and oxidizing agents compared to the oxidative capacity of its components [1]. Since then, the Fenton reaction has referred to the advanced oxidation process in which ferrous ions F e 2 + initiate and catalyze the decomposition of H 2 O 2 , resulting in the in situ generation of hydroxyl and hydroperoxyl radicals [2].
In a fundamental process, reduced iron unleashes the oxidative power of hydrogen peroxide into reactive intermediates, as illustrated in Figure 1a. However, the mechanism by which F e 2 + catalyzes the oxidation of H 2 O 2 and the identity of the participating intermediates remain controversial [3]. As a result, high reactive oxidizing species are generated, most commonly the hydroxyl radical H O , as shown in Figure 1a, which is responsible for the oxidative destruction of a wide variety of organic compounds [4,5].
The Fenton reaction plays fundamental roles in in vivo and advanced oxidation processes (AOPs) [6,7,8,9], with both of its classic or modified forms included in the so-called “Fenton-based techniques”, some of which are schematized in Figure 1b–d. For instance, the use of photo-Fenton or electro-Fenton for the treatment of wastewater was studied and performed by several scientists such as Martins et al. [10], Tarkwa et al. [11], and more recently, Lu et al. [12]. These techniques use additional energy and/or chemicals to generate highly oxidizing agents, mainly hydroxyl radicals. Thus, the efficiency of Fenton-based techniques is usually associated with the production of hydroxyl radicals.
The decomposition of hydrogen peroxide in the Fenton reaction is catalyzed by F e ( I I ) . The F e ( I I ) oxidizes to F e ( I I I ) , while the hydroxyl radical is produced as illustrated in Figure 1a. F e ( I I I ) is expected to regenerate F e ( I I ) through the reaction with hydrogen peroxide. However, this reaction is known to be very slow, owing to the formation of intermediate non-radical species such as F e ( H O 2 ) 2 + . Hence, the classic Fenton process needs high amounts of Fenton’s reagent to generate a high enough quantity of H O , which implies economic and environmental issues. Moreover, the formation of F e 3 + ions and their slow transformation into Fenton’s catalyst promote the occurrence of wasting reactions, directly impacting the overall efficiency of the process [13].
Several solutions were proposed to overcome these limits, including heterogeneous Fenton systems [14,15,16]. Hydroxyl radicals are generated in heterogeneous Fenton systems in two ways. This can be completed through rither the true heterogeneous catalytic mechanism described by Lin et al. [17] or the homogeneous Fenton reaction occurring because of the leached iron from the solid catalyst as reported by He et al. [18], Hartmann et al. [19], and Ramirez et al. [20]. This latter pathway is illustrated in Figure 1c,d in the case of both the Galvano-Fenton and electro-Fenton processes. In both ways, iron-based materials are considered superior heterogeneous Fenton catalysts because of their high catalytic activity, insignificant toxicity, low cost, and easy recovery techniques.
Electro-Fenton is an electrochemical process based on the Fenton reaction; its basic mechanism is illustrated in Figure 1c. The electro-Fenton process combines both the continuous regeneration of Fe(II) and the in situ production of H2O2. In this process, Fe(II) species can be regenerated by the reduction of Fe(III) species at the cathode that also allows the in situ electro-generation of hydrogen peroxide using dissolved oxygen as a reagent.
The use of zero-valent iron (ZVI) [21,22] as a Fenton’s catalyst has also been subject to increasing interest in the last few years, owing to its stability, efficiency, and environmental friendliness in heterogeneous Fenton. Rezaei and Vione [23] reported in their recent review that ZVI is not stable in ambient conditions. It can become oxidized by H 2 O 2 to directly gorm H O through the proper heterogeneous Fenton reaction. It can also easily convert to F e 2 + by reacting with water and/or dissolved oxygen, leading to a homogeneous Fenton system. Zhou et al. [24] experimentally studied the degradation of 4-chlorophenol by a ZVI-Fenton mechanism. In terms of the kinetics of degradation, the authors observed an initial slow stage that could be explained by the heterogeneous reactions occurring at the metal surface. The second stage of degradation was characterized by rapid kinetics that were comparable to that of homogenous Fenton, revealing the occurrence of reactions between hydrogen peroxide and ferrous ions released by the ZVI. In such a process, the control of the kinetics of F e 2 + generation remains a challenge, since the spontaneous corrosion of ZVI under the effect of water and oxygen is difficult to predict and monitor.
More recently, a novel process based on the combination of a galvanic cell and Fenton reaction, namely the Galvano-Fenton process [25], has been experimentally and numerically investigated for its performance in terms of the catalyst formation and regeneration [26] and the degradation of acid orange 7 [27]. The basic mechanism of the Galvano-Fenton process is illustrated in Figure 1d. It relies on the galvanic corrosion of the iron waste used as a sacrificial anode. The cathode, characterized by a higher redox potential usually made of copper, forces the anode to oxidize to ferrous ions, acting as the catalyst of the homogeneous Fenton reaction. The main advantage of the process is its energy-free operation and in situ catalyst production. Moreover, galvanic corrosion can be controlled and monitored externally, which allows for a concise estimation of the process performance. More than that, while operating, the Galvano-Fenton process releases electrical current to the external circuits as a result of the spontaneous motion of electrons between the anode and the cathode.
The present paper aims to numerically assess the performance of the Galvano-Fenton process based on two configurations. An initial “basic” version based on the simultaneous immersion of electrodes in the electrolyte and the addition of hydrogen peroxide and an upgraded “novel” version integrating a pre-immersion time aiming to accelerate the start-up phase of the process once Fenton’s reagent is added, with particular attention to an energetic parameter, namely, the ratio of the degradation efficiency to the released energy. The “basic” Galvano-Fenton process is first confronted with classic Fenton, electro-Fenton, and Fenton-like techniques in terms of the degradation of a model pollutant, namely phenol, until its total mineralization. Both the basic and novel configurations of the Galvano-Fenton reaction are then compared based on the kinetics of formation and transformation of ferrous and ferric ions, the hydrogen peroxide consumption of the free radical generation, and the pollutant degradation. Furthermore, several energetic insights are given, particularly for the comparison of the positive and negative energy balances presented by the electro-Fenton and the Galvano-Fenton processes that related to their respective performances in terms of phenol’s degradation. Finally, a parametric examination of the effects of the concentrations of hydrogen peroxide and phenol on the degradation kinetics is conducted with both basic and upgraded configurations of the Galvano-Fenton process.

2. Results and Discussion

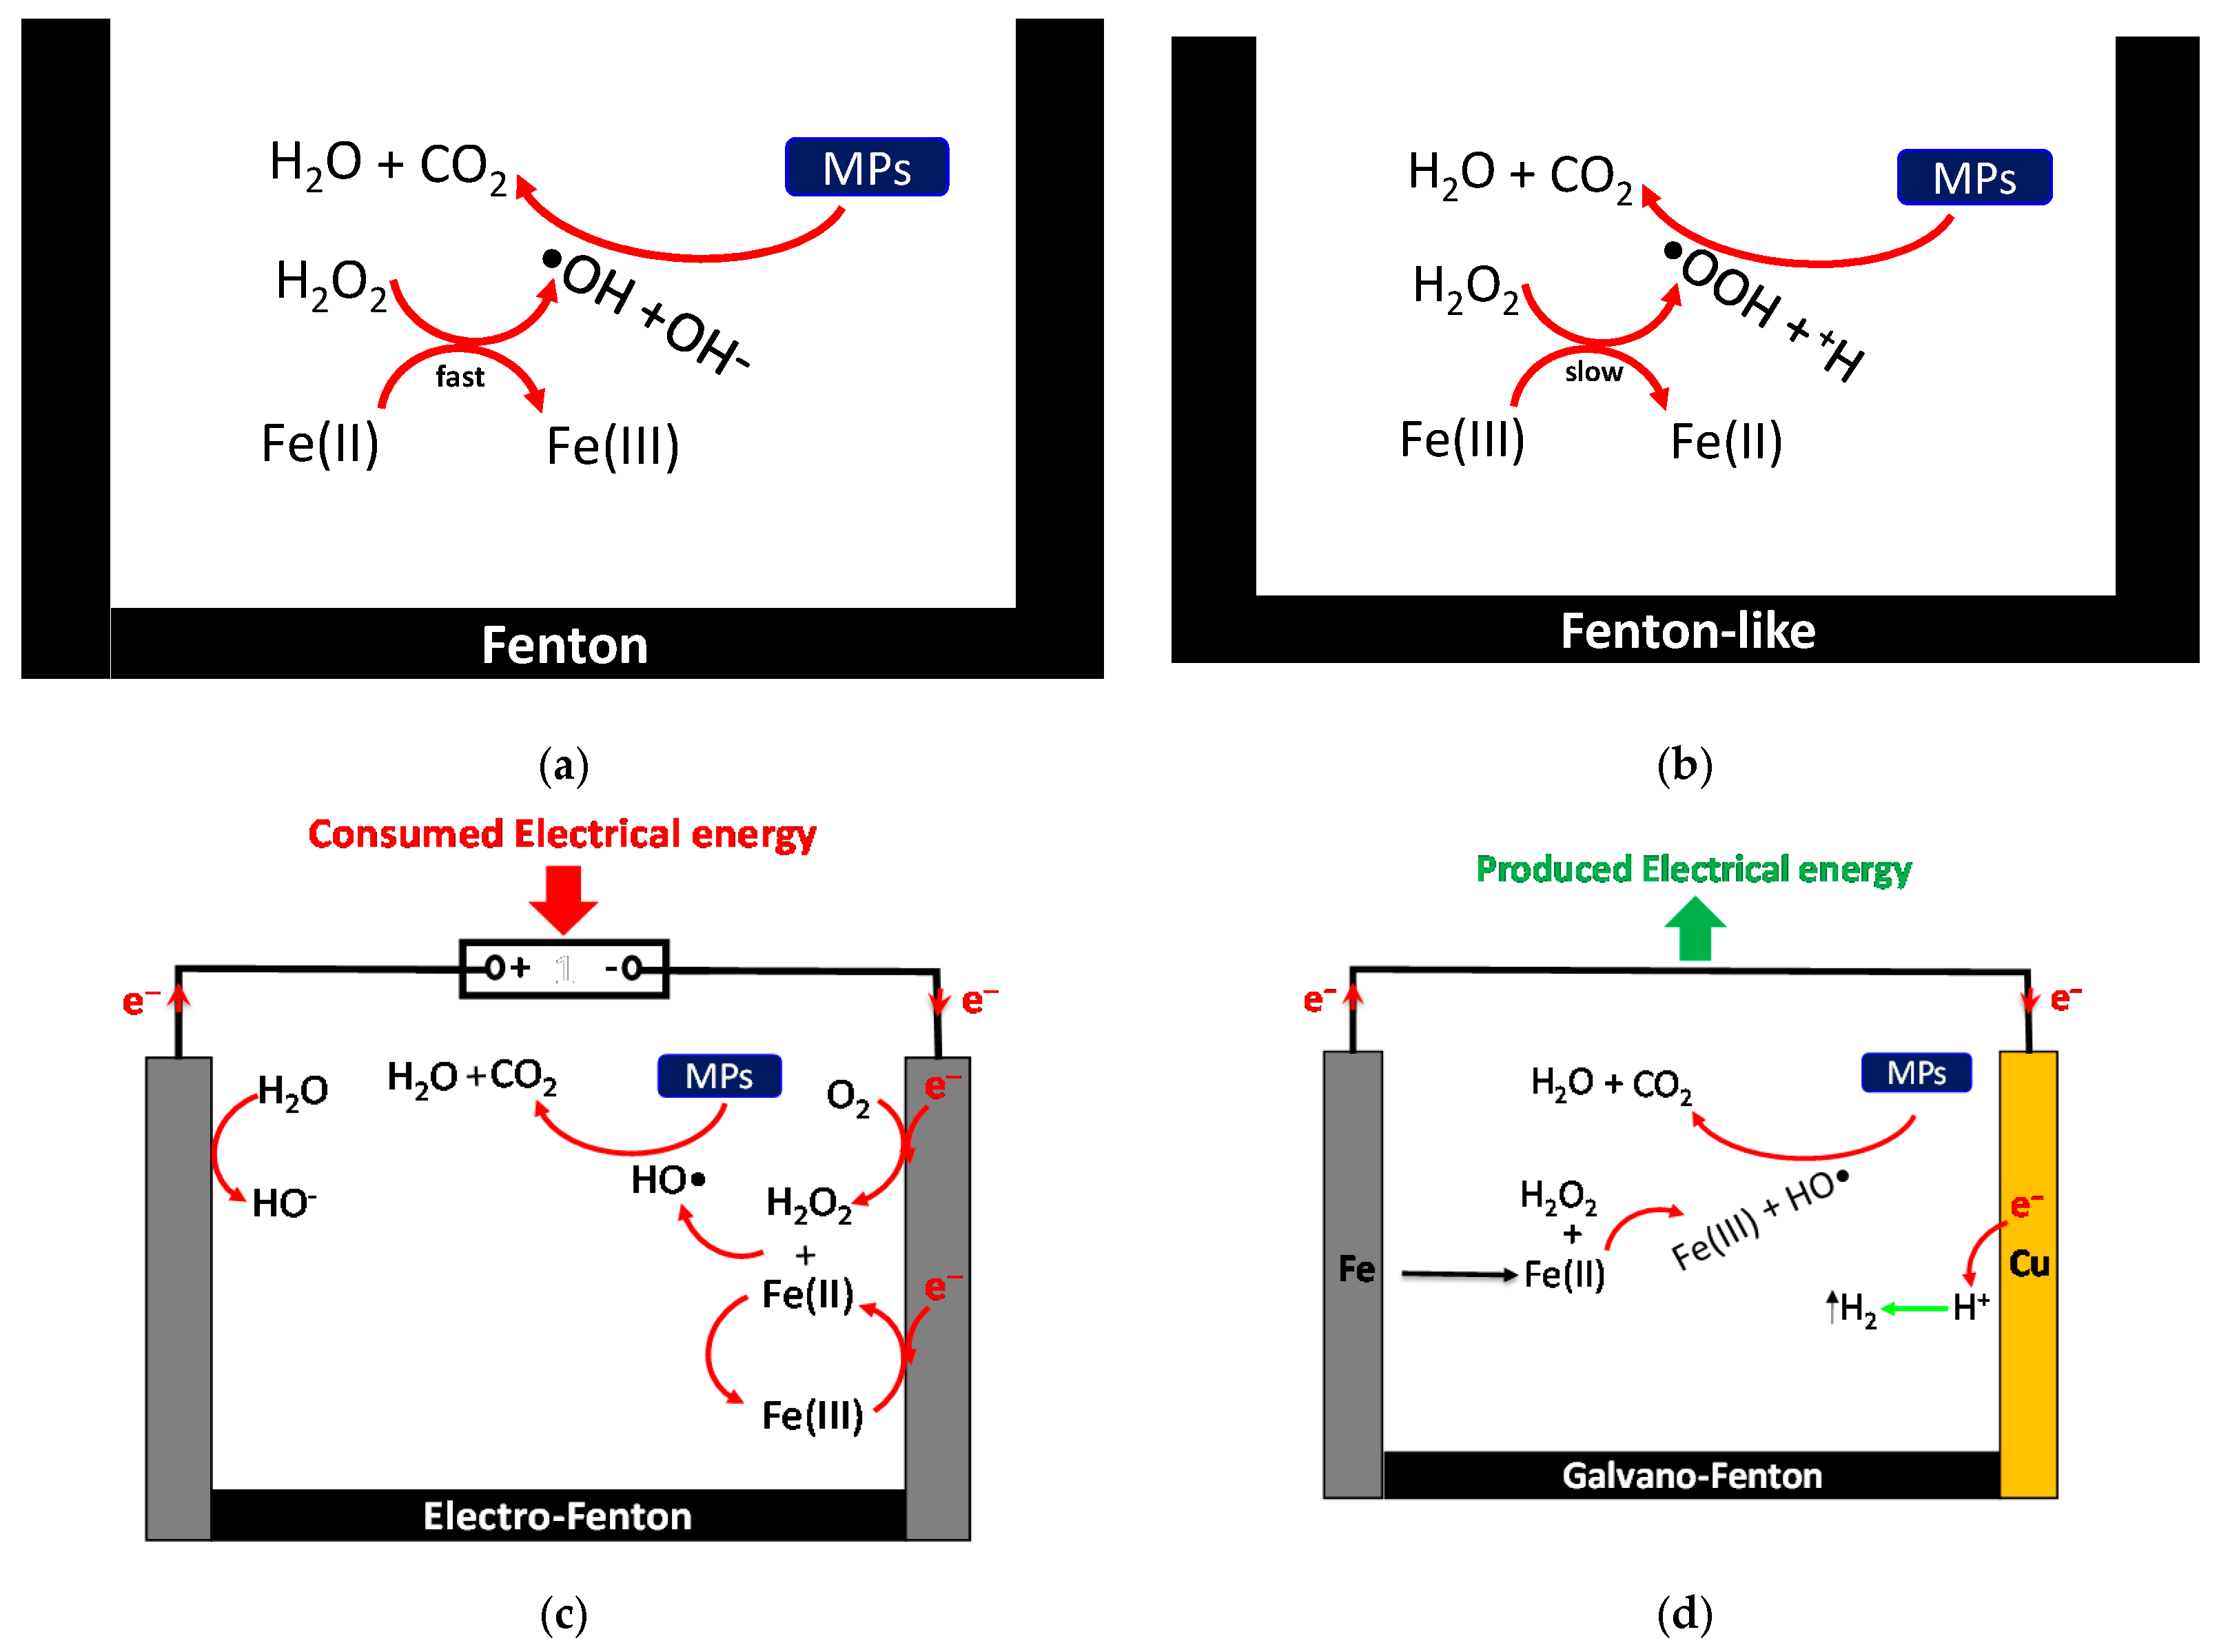
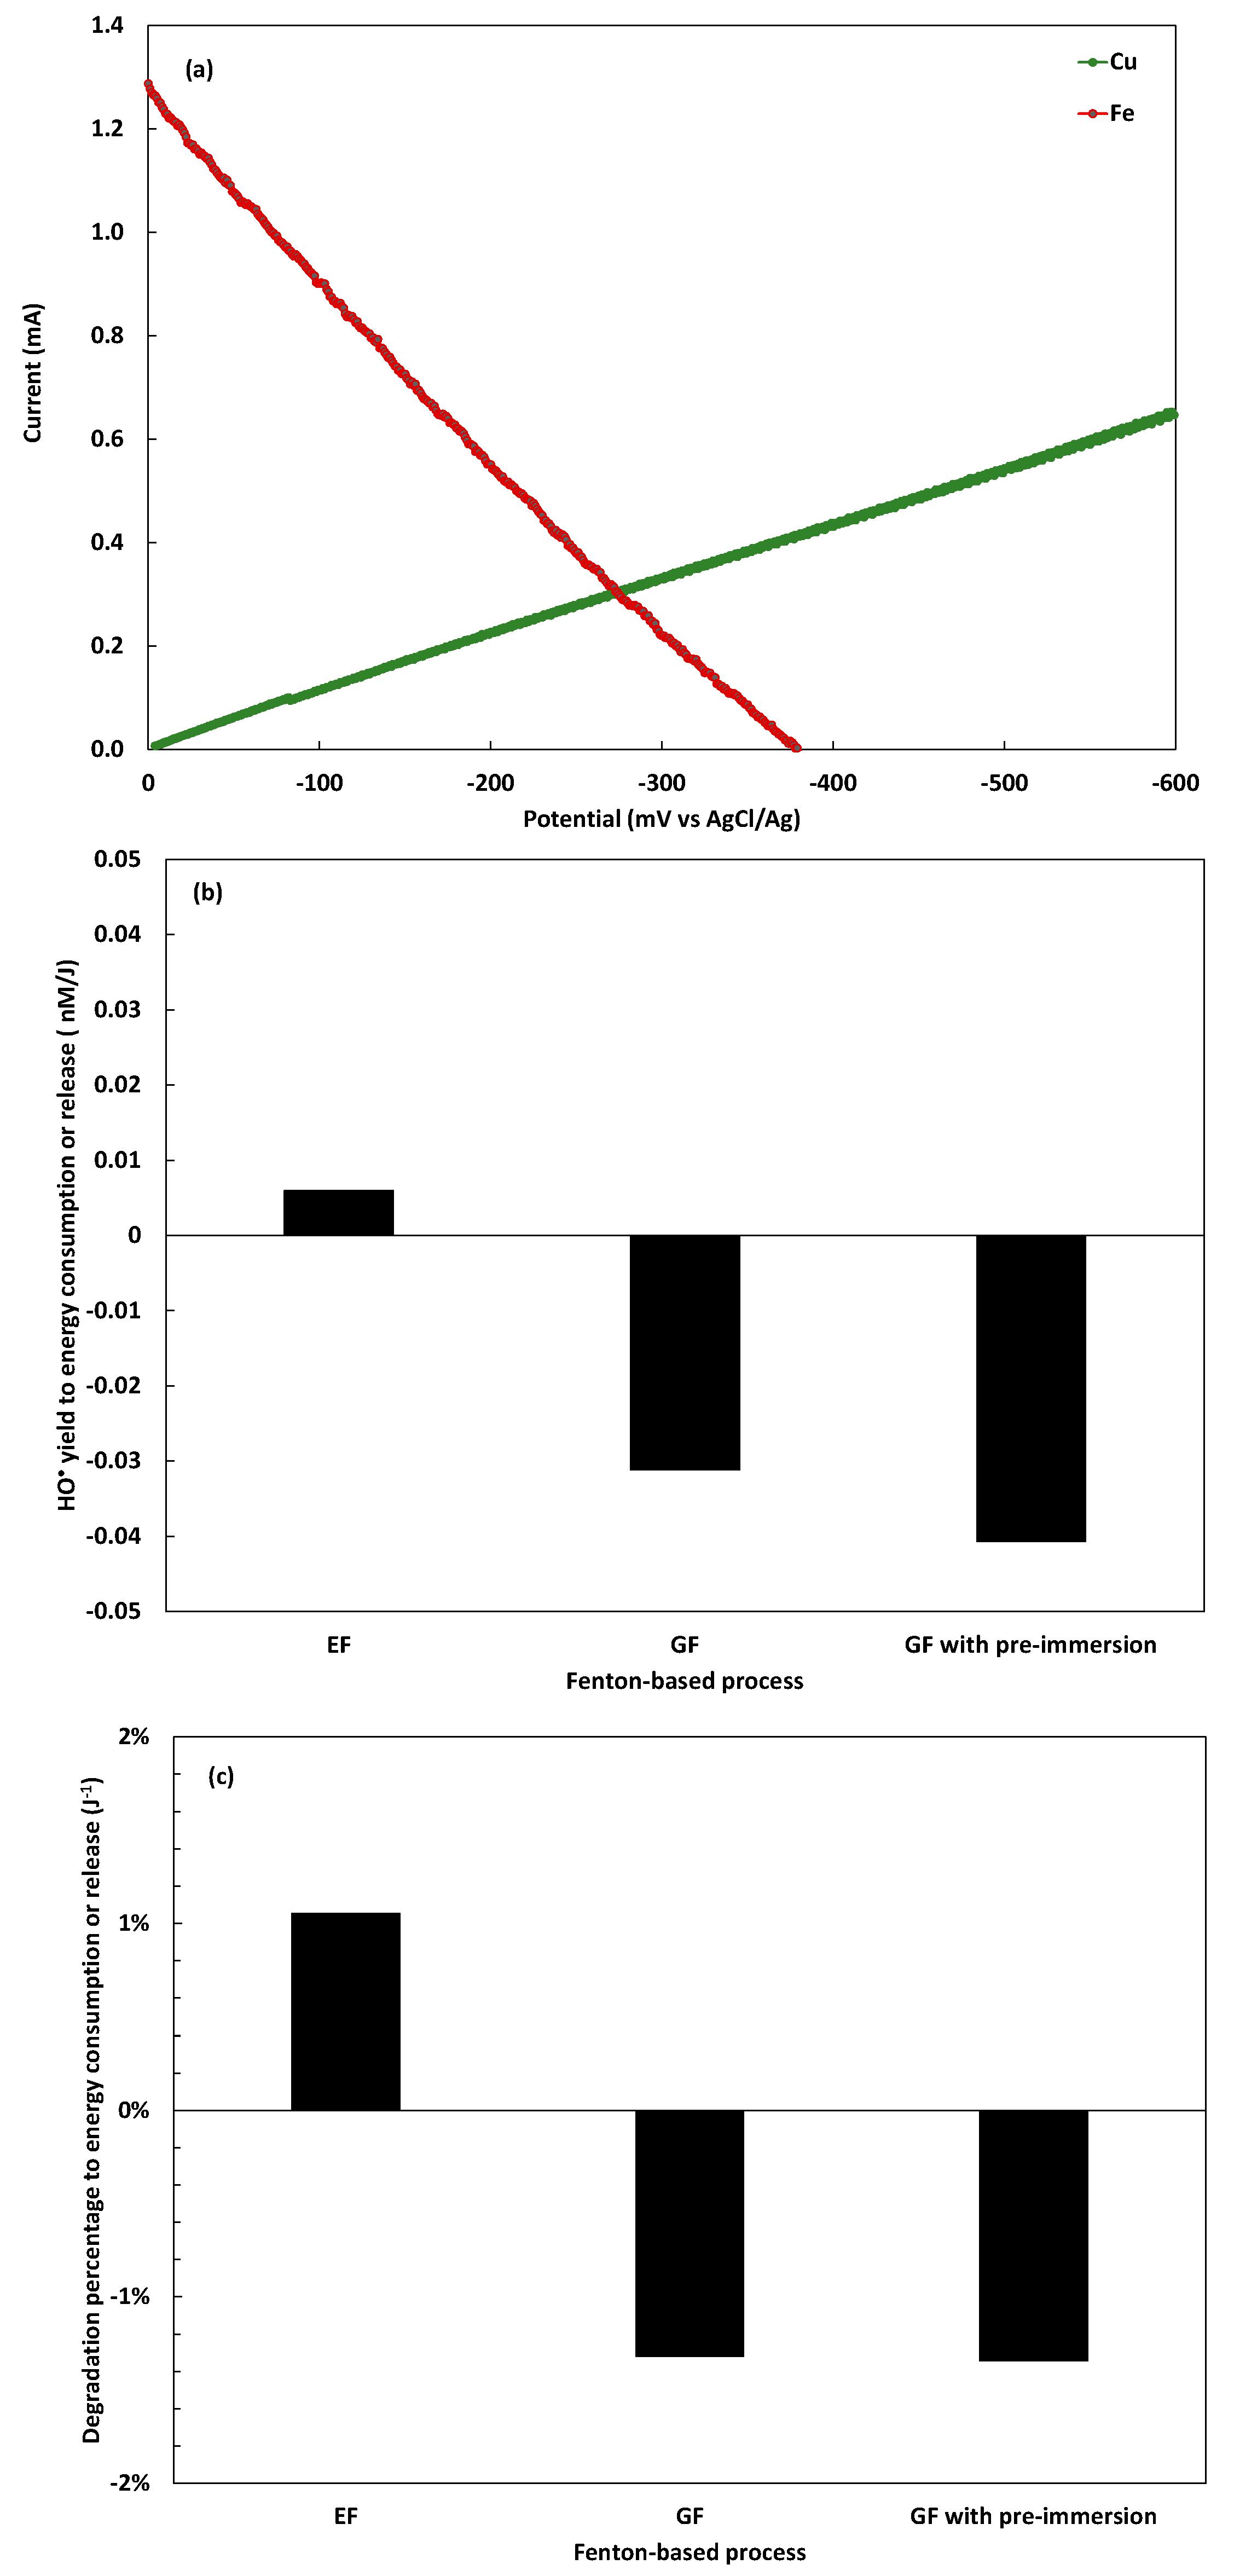
2.1. Comparison of the Performances of the Galvano-Fenton Technique to the Different Fenton-Based Processes

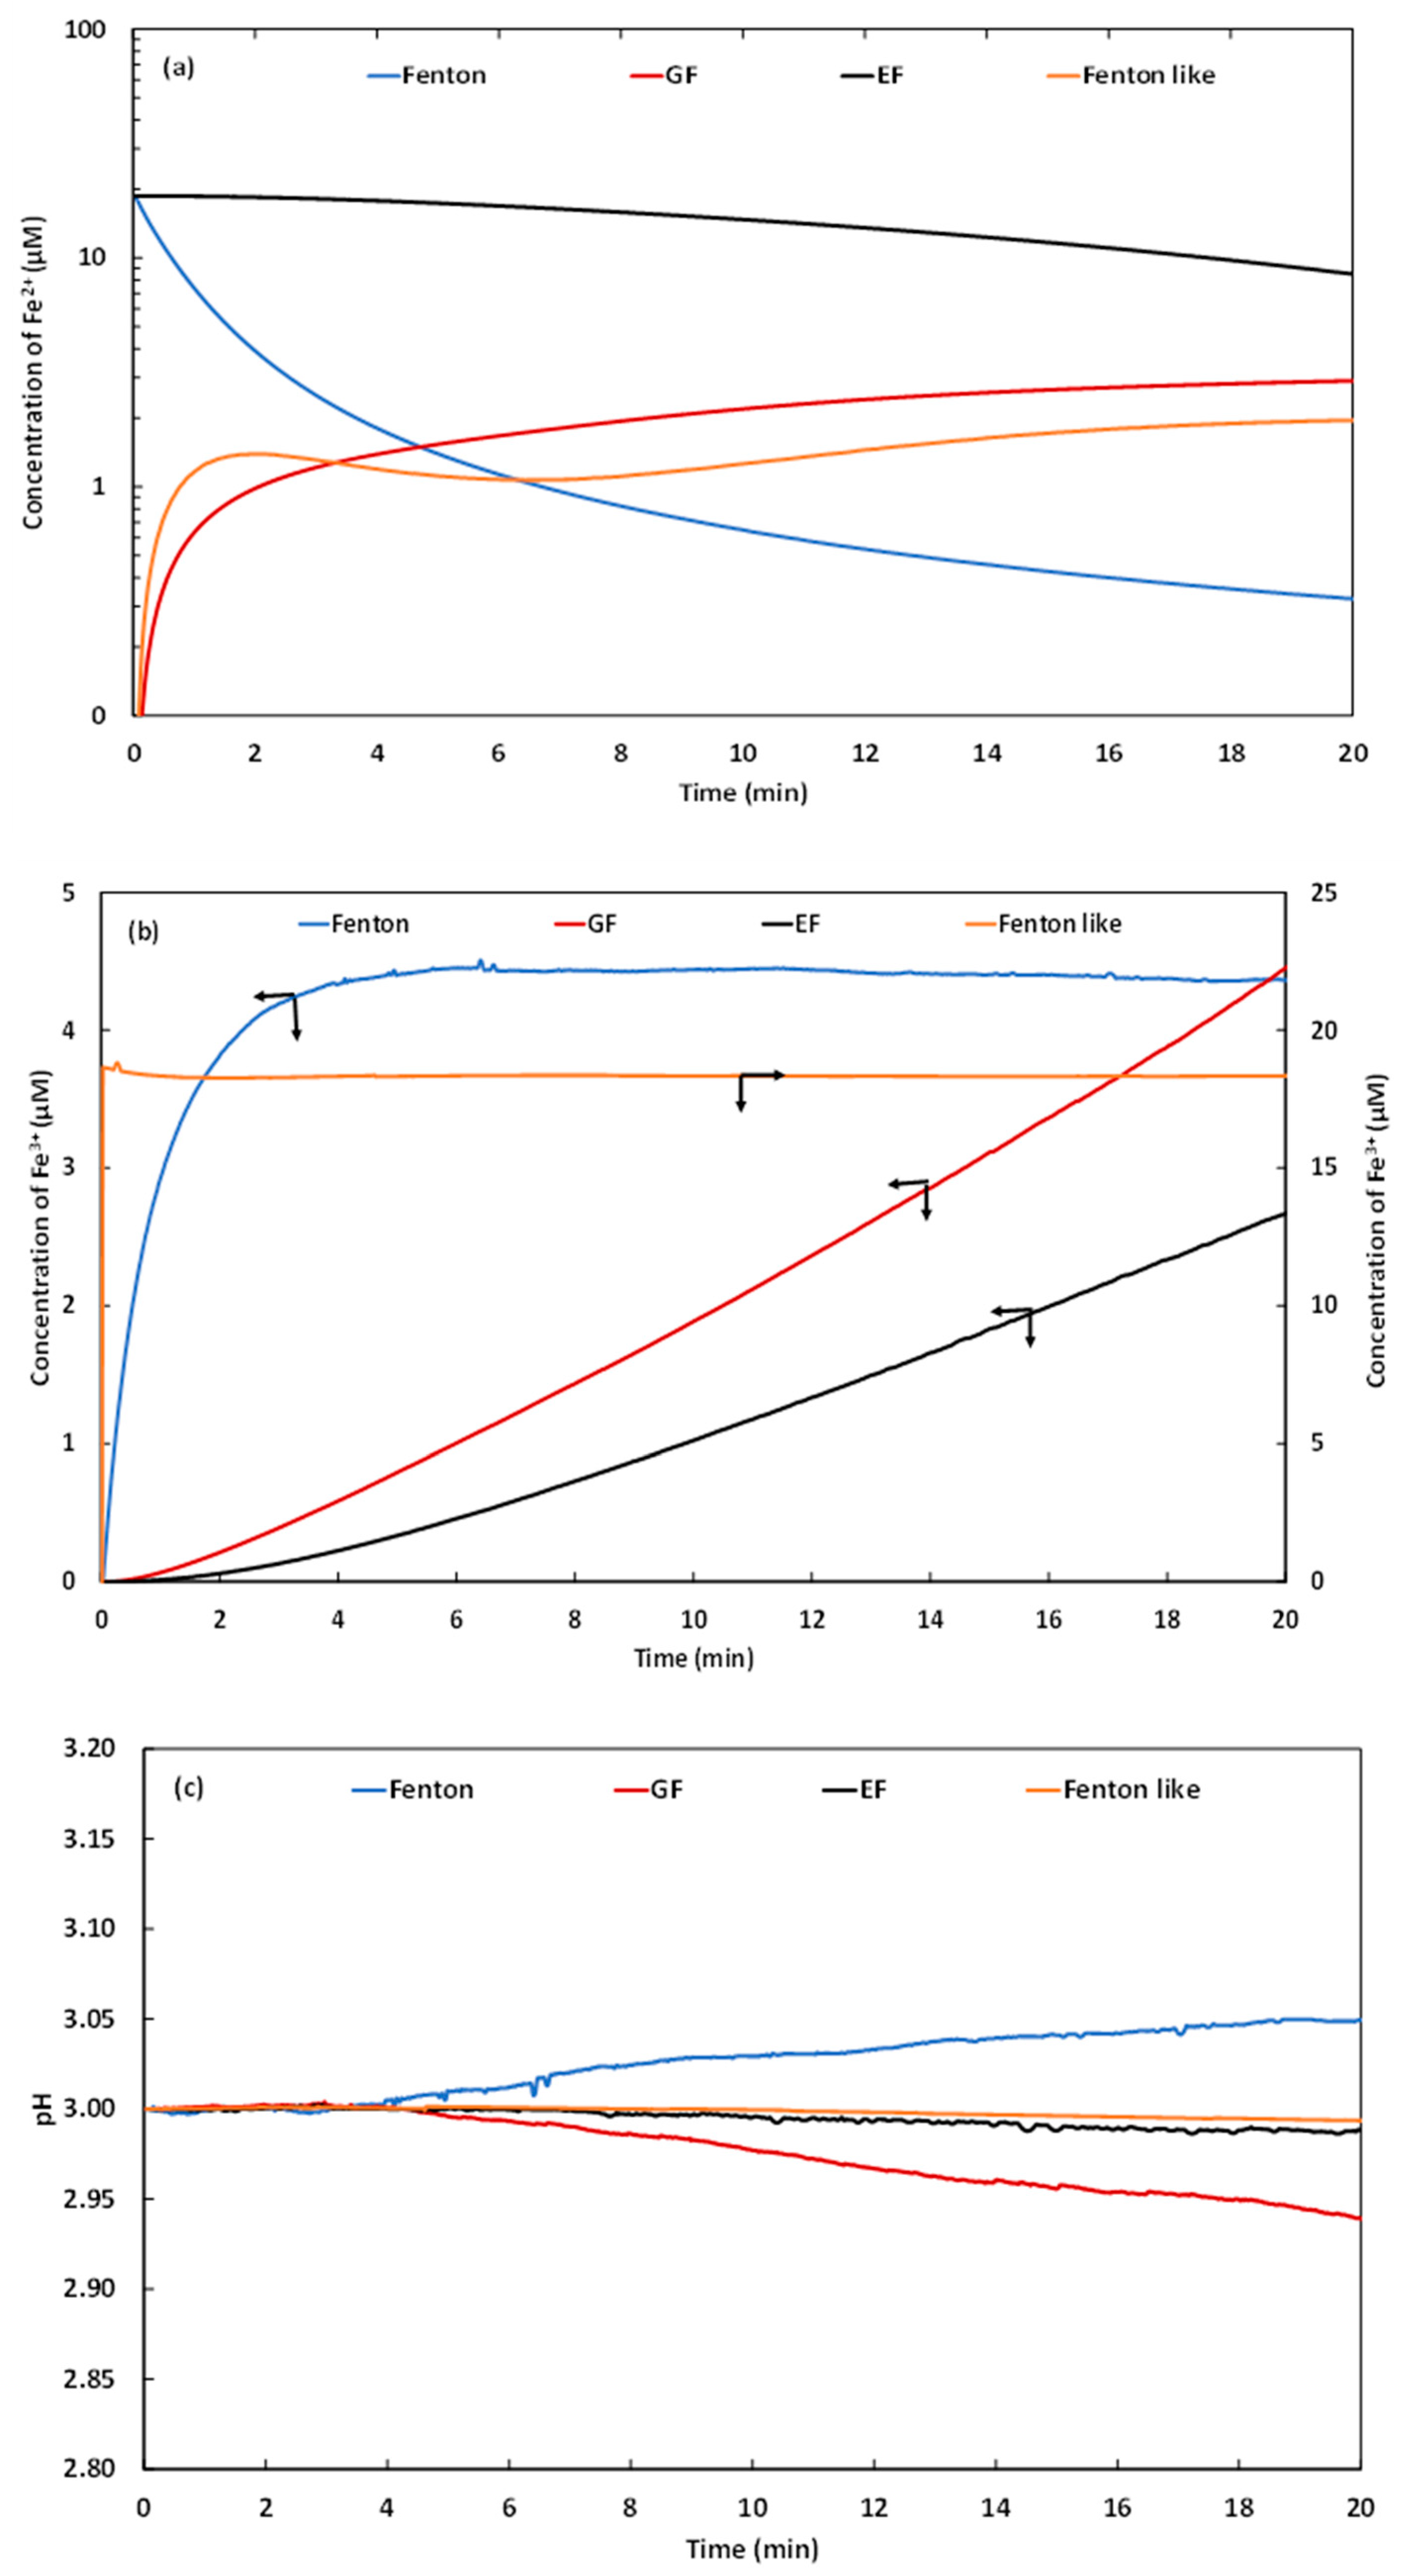
2.1.1. Evolution of Ionic Species

Ferrous ions represent the catalyst of the Fenton reaction. They decompose hydrogen peroxide molecules into hydroxyl radicals while being transformed to ferric ions. Ferrous ions are then regenerated through the reaction of ferric ions with hydrogen peroxide, a three-step slow mechanism that passes through the formation of F e ( H O 2 ) 2 + , as shown in Table 1. In this part of the study, the evolutions of the concentration of F e 2 + and F e 3 + are investigated in a function of time with classic Fenton, Fenton-like, electro-Fenton, and Galvano-Fenton processes. Figure 2a,b reports the results, respectively. It is observed from Figure 2a that although the electro-Fenton and classic Fenton processes are based on the same initial concentration of ferrous ions with a value of 18.7 µM in the form of added F e S O 4 , the decrease of the amount of F e 2 + is significantly accelerated in the case of classic Fenton starting from the beginning of the process, compared to the electro-Fenton process. Within 20 min, the concentration of F e 2 + reaches 0.32 µM with classic Fenton, while it attains 8.5 µM with electro-Fenton. This observation is explained by the presence of a stoichiometric yield of hydrogen peroxide, which is added externally in the case of the classic Fenton process, while it is continuously produced in situ in the case of electro-Fenton through the cathodic reduction of oxygen in acidic conditions under the effect of an external current density of 25 µA/cm2 reporting to the active surface of the cathode as shown later in the Section 3. In the case of the Fenton-like process, the ferrous ions are generated by the reaction of hydrogen peroxide and ferric ions passing through the formation of F e ( H O 2 ) 2 + . This slow mechanism is abruptly increased at the initial instant, corresponding to the first contact of initial yields of H 2 O 2 and F e 3 + . It is then braked throughout the process duration. The concentration of F e 2 + does not significantly increase; it only evolves from 1.32 to 1.95 µM between 3 and 20 min. The Galvano-Fenton process shows a continuous increase in the concentration of F e 2 + , with an important evolution at the beginning of the process, explained by the corrosion of iron and then a slower evolution until attaining 2.91 µM at 20 min, explained by the simultaneous generation and consumption of F e 2 + in the decomposition of H 2 O 2 . Although not relying on an initial amount of ferrous or ferric ions added in the form of salt but rather on in situ generation through the spontaneous galvanic corrosion of iron, i.e., without the need for any external current, the Galvano-Fenton process appears to maintain a relatively high yield of ferrous catalyst in the electrolyte during the processing time compared to classic Fenton and Fenton-like reactions. The only process leading to a higher concentration of F e 2 + than the Galvano-Fenton process is the electro-Fenton. Yet, the latter requires an external current to feed the electrochemical cell, while the Galvano-Fenton process releases current through the galvanic cell.
At each instant, the observed concentration of F e 2 + is the result of the available initial concentration (in classic Fenton and electro-Fenton processes), the instantaneous produced concentration (in the Galvano-Fenton process), the consumed concentration, and the regenerated concentration from F e 3 + (with the four processes). Regeneration is examined through the evolution of F e 3 + concentration in a function of time, as shown in Figure 2b.
Figure 2b reveals that the Fenton-like process is characterized by the highest initial concentration of ferric ions due to the addition of a stoichiometric amount of ferric salt at the beginning of the process with a concentration of 18.7 µM. However, it appears that this concentration is almost conserved over the process duration, and it barely decreases to 18.3 µM within 20 min, which proves that the mechanism behind the formation of the ferrous catalyst is indeed slow in the Fenton-like process. This observation confirms the explanation given previously regarding the evolution of F e 2 + concentration, but also demonstrates that the major proportion of the added ferric ions in the Fenton-like process is unused.
In fact, in the Fenton-like process, the ferric ions are supposed to be added at the initial instant in the form of ferric sulfate salt. Thus, the highest concentration of F e 3 + is achieved as soon as the ferric sulfate salt is added, i.e., at t = 0. The maximum concentration of F e 2 + in the electrolyte observed in this case at t = 1 min is explained by the slow reactions of 2, 3, and 4, which are reported in Table 1. As soon as the concentration of F e 2 + starts increasing, the well-known rapid Fenton reaction ( H 2 O 2 / F e 2 + ) is activated, again releasing F e 3 + in the medium, as described by Reaction 1 in Table 1. Overall, and as a result of the aforementioned mechanism, the concentration of F e 3 + remains quite stable in the electrolyte, as observed in Figure 2b in the case of the Fenton-like process.
Moreover, the classic Fenton process is characterized by a rapid increase in the concentration of ferric ions in the electrolyte, particularly during the initial stage of the process (almost 3 first minutes). The concentration of F e 3 + the reaches a plateau of 4.4 µM that lasts until the end of the process, revealing the slowness of F e 2 + regeneration, and consequently, the low compensation of consumed ferrous catalyst in the decomposition of hydrogen peroxide, inducing its permanent decrease.
Both the electro-Fenton and Galvano-Fenton processes present similar trends for the evolution of the concentration of F e 3 + . F e 3 + concentration increases quasi-linearly starting from the beginning of the process as a result of the gradual and continuous reaction between F e 2 + and H 2 O 2 , resulting the continuous in situ production of H 2 O 2 in the case of the electro-Fenton process and the continuous in situ release of F e 2 + catalyst in the case of the Galvano-Fenton process. Apparently, the spontaneous galvanic generation of F e 2 + in the Galvano-Fenton process leads to a higher rate of the reaction F e 2 + + H 2 O 2 F e 3 + + O H + H O compared to the electro-Fenton process, which leads to a higher instantaneous concentration of F e 3 + reaching 4.45 µM at 20 min versus 2.67 µM with the electro-Fenton technique.
The evolution of the Fenton reaction, whether through the direct addition or the in situ generation of Fenton reagent and catalyst, induces a modification of the balance of H + and O H in the electrolyte. The initial pH of the medium is deemed equal to 3, which is the recommended pH value for the Fenton reaction according to the Pourbaix diagram and several previous studies [28]. The variation of the pH during the four studied processes is examined and reported in Figure 2c. This figure shows that Fenton-like and electro-Fenton processes can stably maintain the pH of the electrolyte at 3 over the process duration. With the classic Fenton process, the medium tends to become less acidic, with a pH value that attains 3.05 after 20 min, which is equivalent to a decrease of 0.1 mM in H + concentration. On the contrary, the Galvano-Fenton process leads to a slightly more acidic medium, with a final pH value of 2.94, which is equivalent to a gain of 0.15 mM in H + concentration.

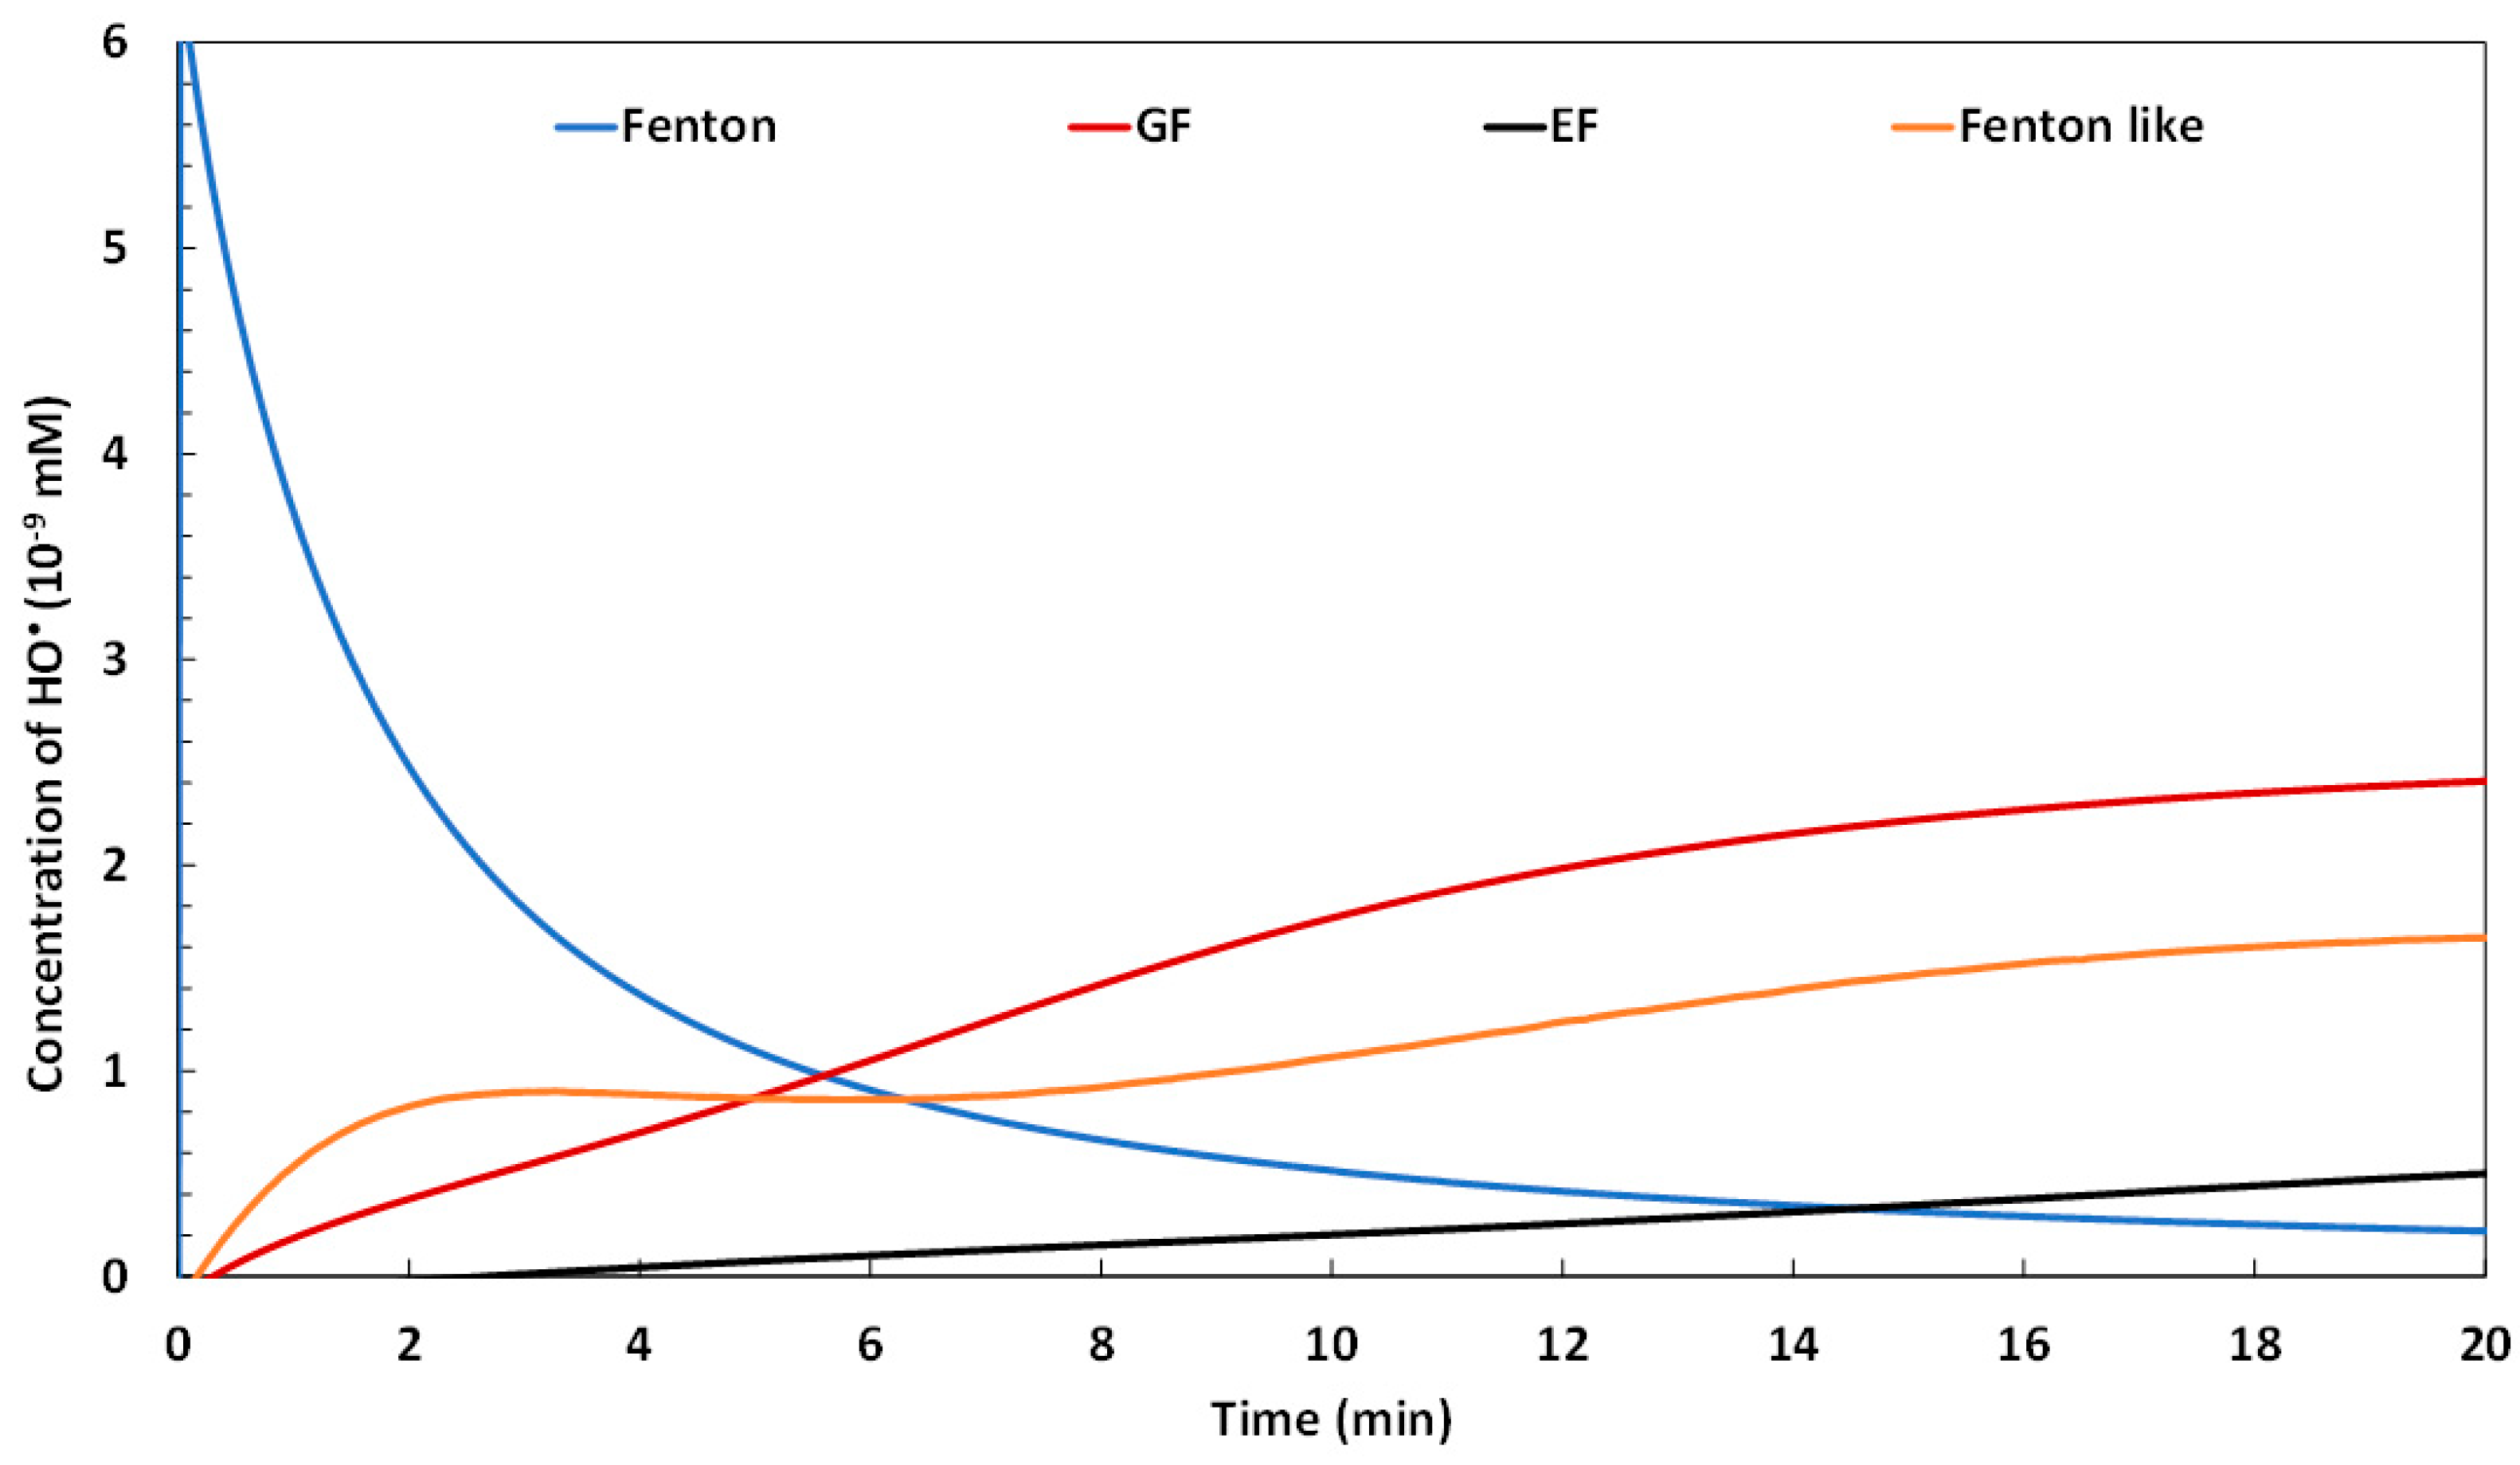
2.1.2. Evolution of Hydroxyl Radical Yield

As an advanced oxidation process, the Galvano-Fenton degradation of pollutants is based on the generation of highly oxidative free radicals, principally H O . A hydroxyl radical is not only characterized by the second highest redox potential after fluor, but it is also characterized by its non-selective character in terms of oxidized species. The evolution of the generation of hydroxyl radical is presented in Figure 3 in a function of time for the four compared processes. This figure reveals that the kinetics of hydroxyl radical generation can be divided into two stages; the first stage would comprise the first 5 min starting from the beginning of the processes, while the second stage would correspond to the interval ranging from 5 to 20 min. During the first stage, the classic Fenton process results in a drastic increase of the concentration of H O in the electrolyte at the initial instant to the order of 10−8 mM. As soon as Fenton reagent and catalyst are added and put in contact, the rate of the H 2 O 2 decomposition reaction strongly increases due to high concentrations of both reagent and catalyst. However, this scenario is only valid during the very beginning of the process, i.e., as long as the concentrations of H 2 O 2 and F e 2 + are high. Once consumed, the concentration of H 2 O 2 becomes limited, and the regeneration of F e 2 + becomes very slow, which inhibits the continuous release of H O during the second stage, and its concentration drops to less than 10−9 mM. Nevertheless, the high concentration of H O during the initial stage would strongly enhance the degradation process that would be decelerated afterward. During the first stage, the Fenton-like, the Galvano-Fenton, and the electro-Fenton processes experience a gradual increase of H O production; however, the electro-Fenton process is revealed to be the slowest process among the three. This could be explained by the gradual release of the Fenton reagent H 2 O 2 in the electrolyte, which results in its gradual decomposition and then the slow apparition of H O , even during the second stage. The Fenton-like process shows an initial increase in the concentration of H O during the first three minutes, accompanying the initial increase in the yield of F e 2 + observed in Figure 2a during the same timeslot. Owing to the slow conversion of F e 3 + into F e 2 + , the generation rate of H O becomes low, and the evolution of its concentration during the second stage becomes very limited. In contrast, the Galvano-Fenton process is characterized by a quasi-linear increase of H O concentration during the first stage. At 5 min, it ends up at the same concentration reached with the Fenton-like process, with an order of magnitude of 10−9 mM. The concentration of H O continues its increase with the Galvano-Fenton process during the second stage and attains the highest concentration compared to the three other processes, with a value of 2.5 × 10⁻⁹ mM at 20 min.

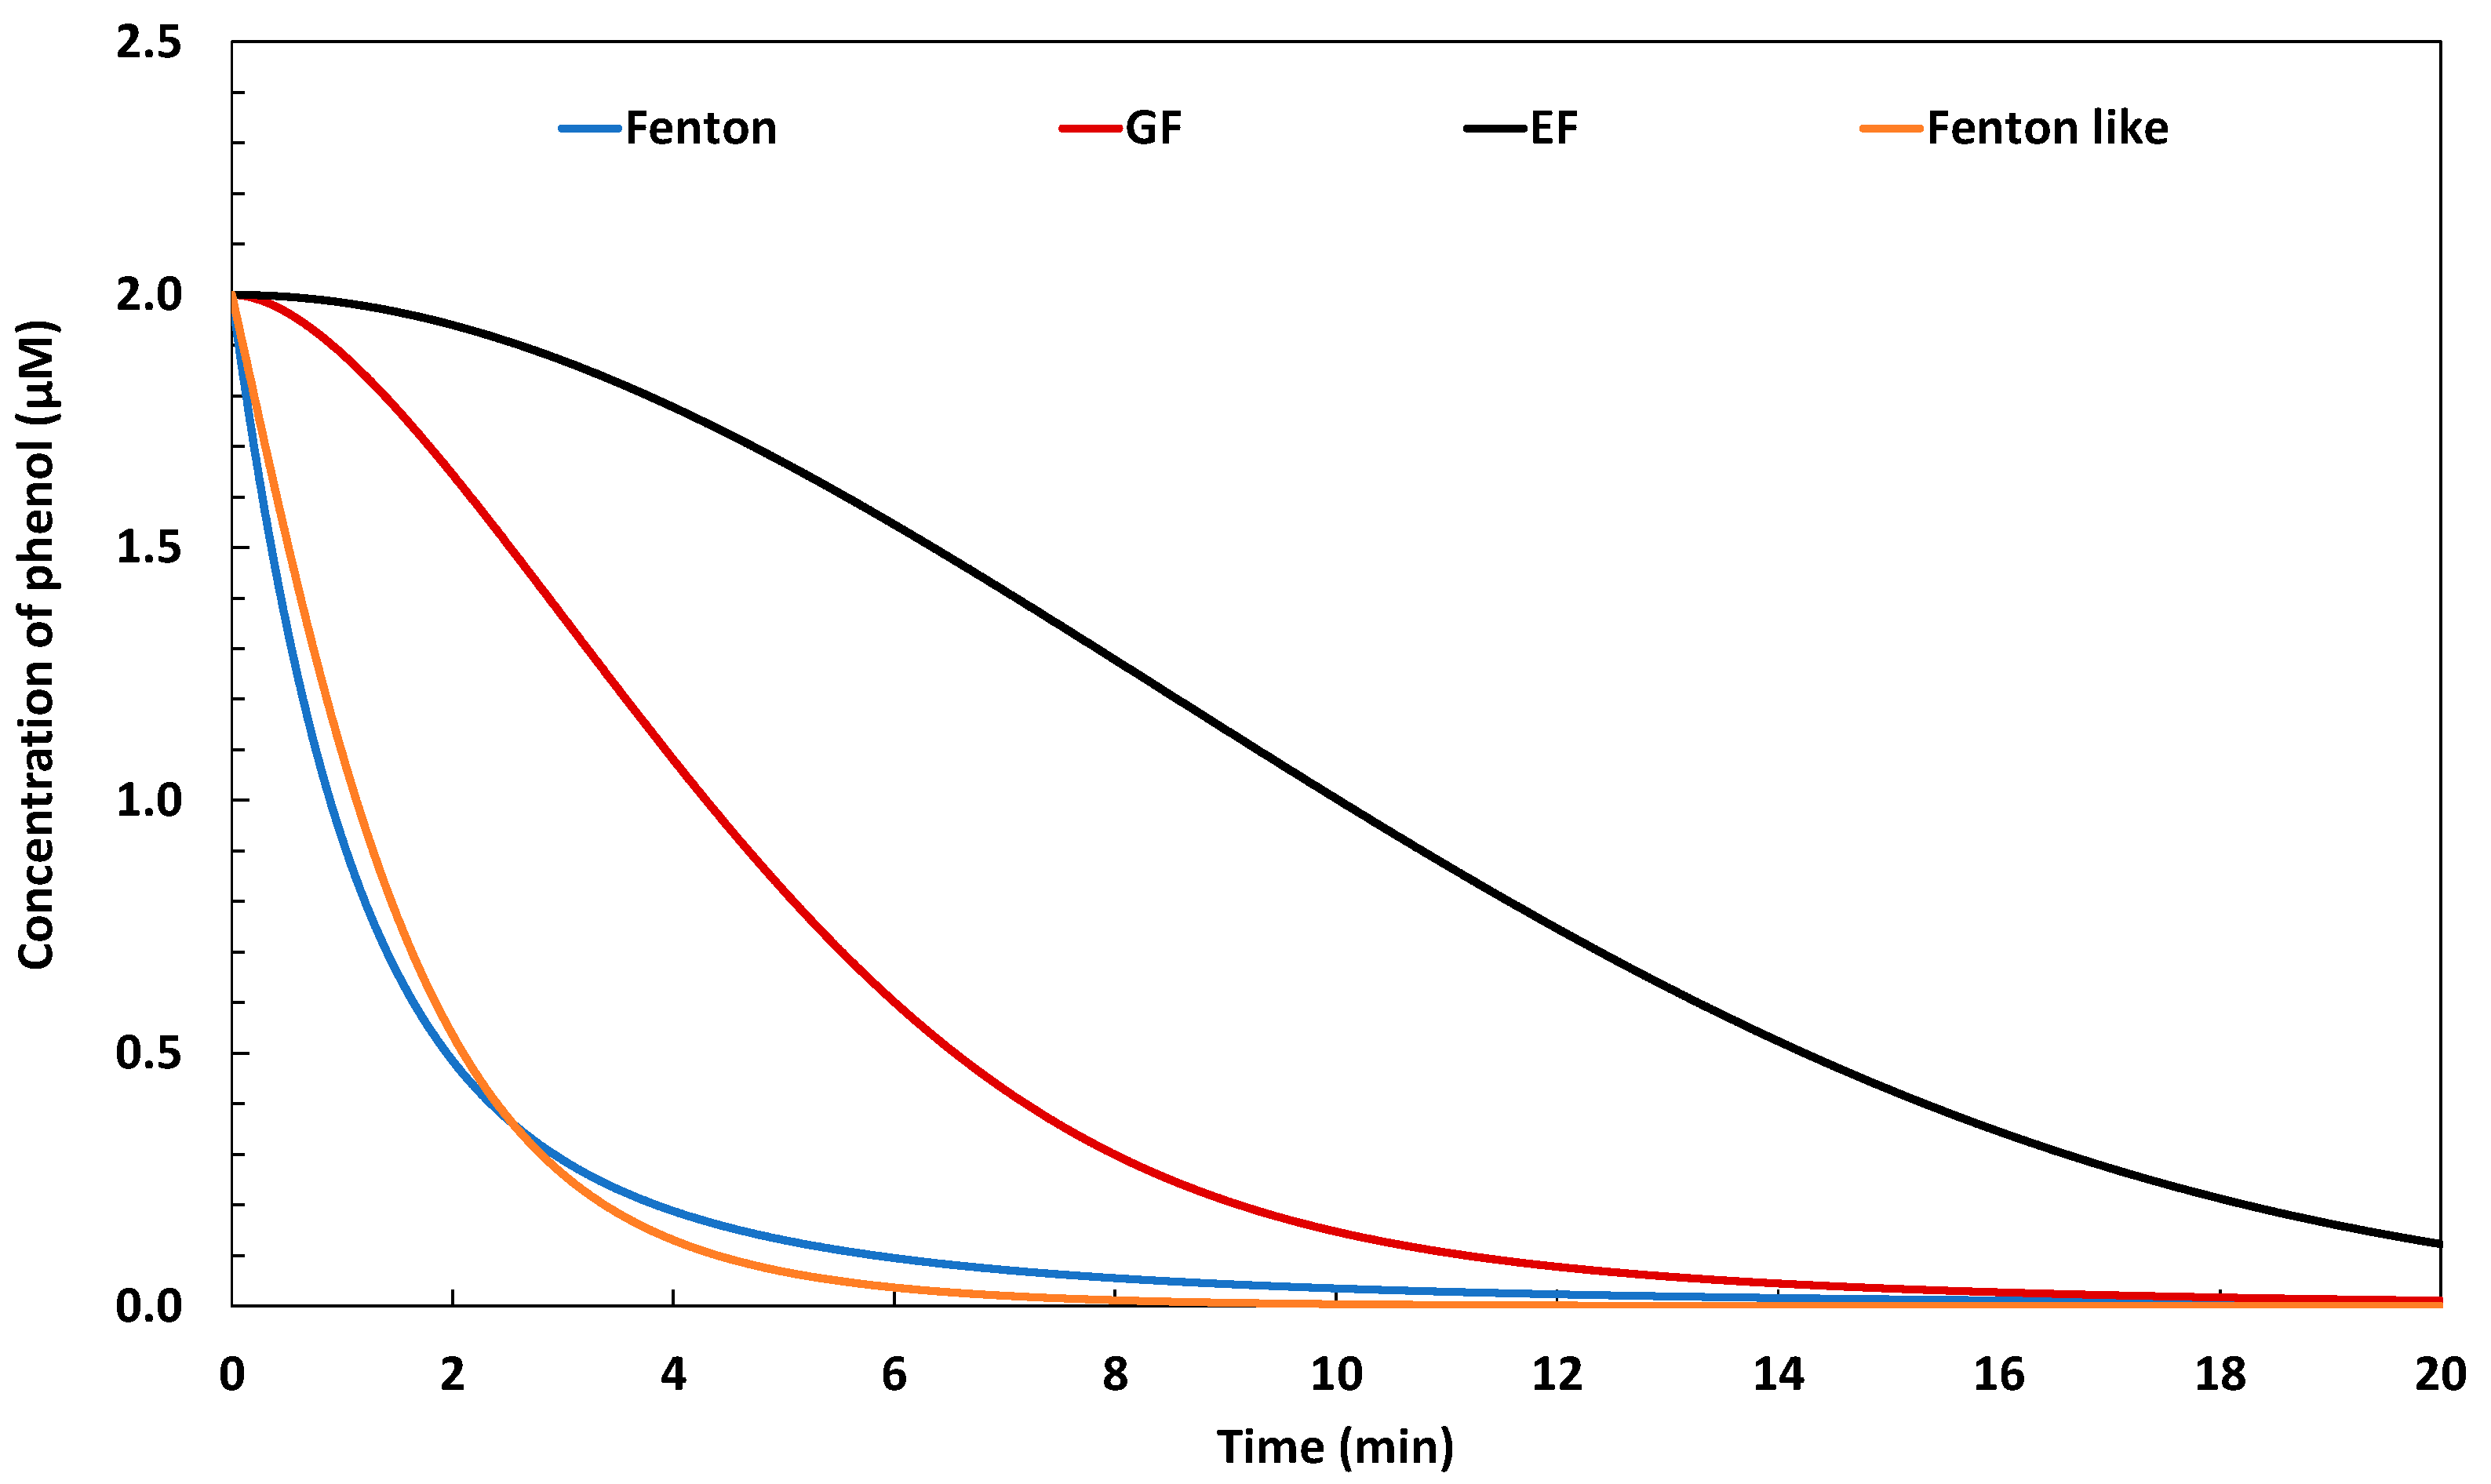
2.1.3. Efficiency in Terms of Phenol Degradation

In the presence of an organic molecule, the hydroxyl radical produced by an advanced oxidation process is expected to exert an oxidative attack initiating a decomposition process. With phenol, this mechanism is susceptible to lead to complete mineralization, as described in Table 1. In this part of the study, the Galvano-Fenton process is compared to classic Fenton, electro-Fenton, and Fenton-like processes in terms of phenol degradation, as presented in Figure 4. It is shown that both the classic Fenton and Fenton-like techniques lead to very rapid degradation of phenol at the initial stage, explained by the availability of both the Fenton reagent and the catalyst during this time slot, which is in agreement with the relatively high concentration of the hydroxyl radical observed in Figure 3. However, this trend characterizes the first 2 min. The degradation rate then decreases, owing to the decrease of the available concentration of the hydroxyl radical but also to the decrease of the phenol concentration. With higher concentrations of phenol, it is expected that the degradation would not approach 100%. On the other hand, it is observed that the electro-Fenton process induces a very slow decrease of the phenol concentration during the initial stage, which is explained by the low concentration of hydroxyl radicals noticed in Figure 3. The degradation rate begins to increase starting from 4 min, and the phenol degradation becomes quasi-linear, leading to a phenol concentration of 0.12 µM, i.e., a degradation rate of 94%. Although this degradation rate is significant, it requires 20 min of operation time with the electro-Fenton technique, while it is achieved within 4 and 5 min with the Fenton-like and classic Fenton processes, respectively.
The Galvano-Fenton process results in the kinetics of phenol degradation evolving in a function of time in the intermediate between the kinetics resulting from the electro-Fenton and both the classic-Fenton and Fenton-like processes. It shows a null initial degradation rate revealed by the horizontal tangent of the curve of concentration of phenol vs. time. This observation is explained by the absence of the ferrous ion catalyst at t0. However, this barely lasts a few seconds, then the phenol concentration starts decreasing linearly between 0.5 and 6 min. The phenol concentration reaches then 0.5 µM, which is equivalent to 75% degradation. The linear evolution of the phenol degradation through the Galvano-Fenton process occurs in parallel to the linear increase of the hydroxyl radical concentration, resulting from the gradual release of F e 2 + in the electrolyte through galvanic corrosion. The achievement of a degradation rate exceeding 96% requires almost 12 min, which is twice the time required for the classic Fenton and the Fenton-like processes to show the same performance. The initial latency, due to the absence of the Fenton catalyst when the process is started, is probably the reason for the delay observed in terms of the performance of the Galvano-Fenton process for the degradation of phenol, compared to the classic Fenton and Fenton-like processes. Thus, we suggest modifying its configuration by integrating a pre-immersion time for both electrodes in the electrolyte before the addition of hydrogen peroxide. The resulting changes are discussed in the following paragraph.

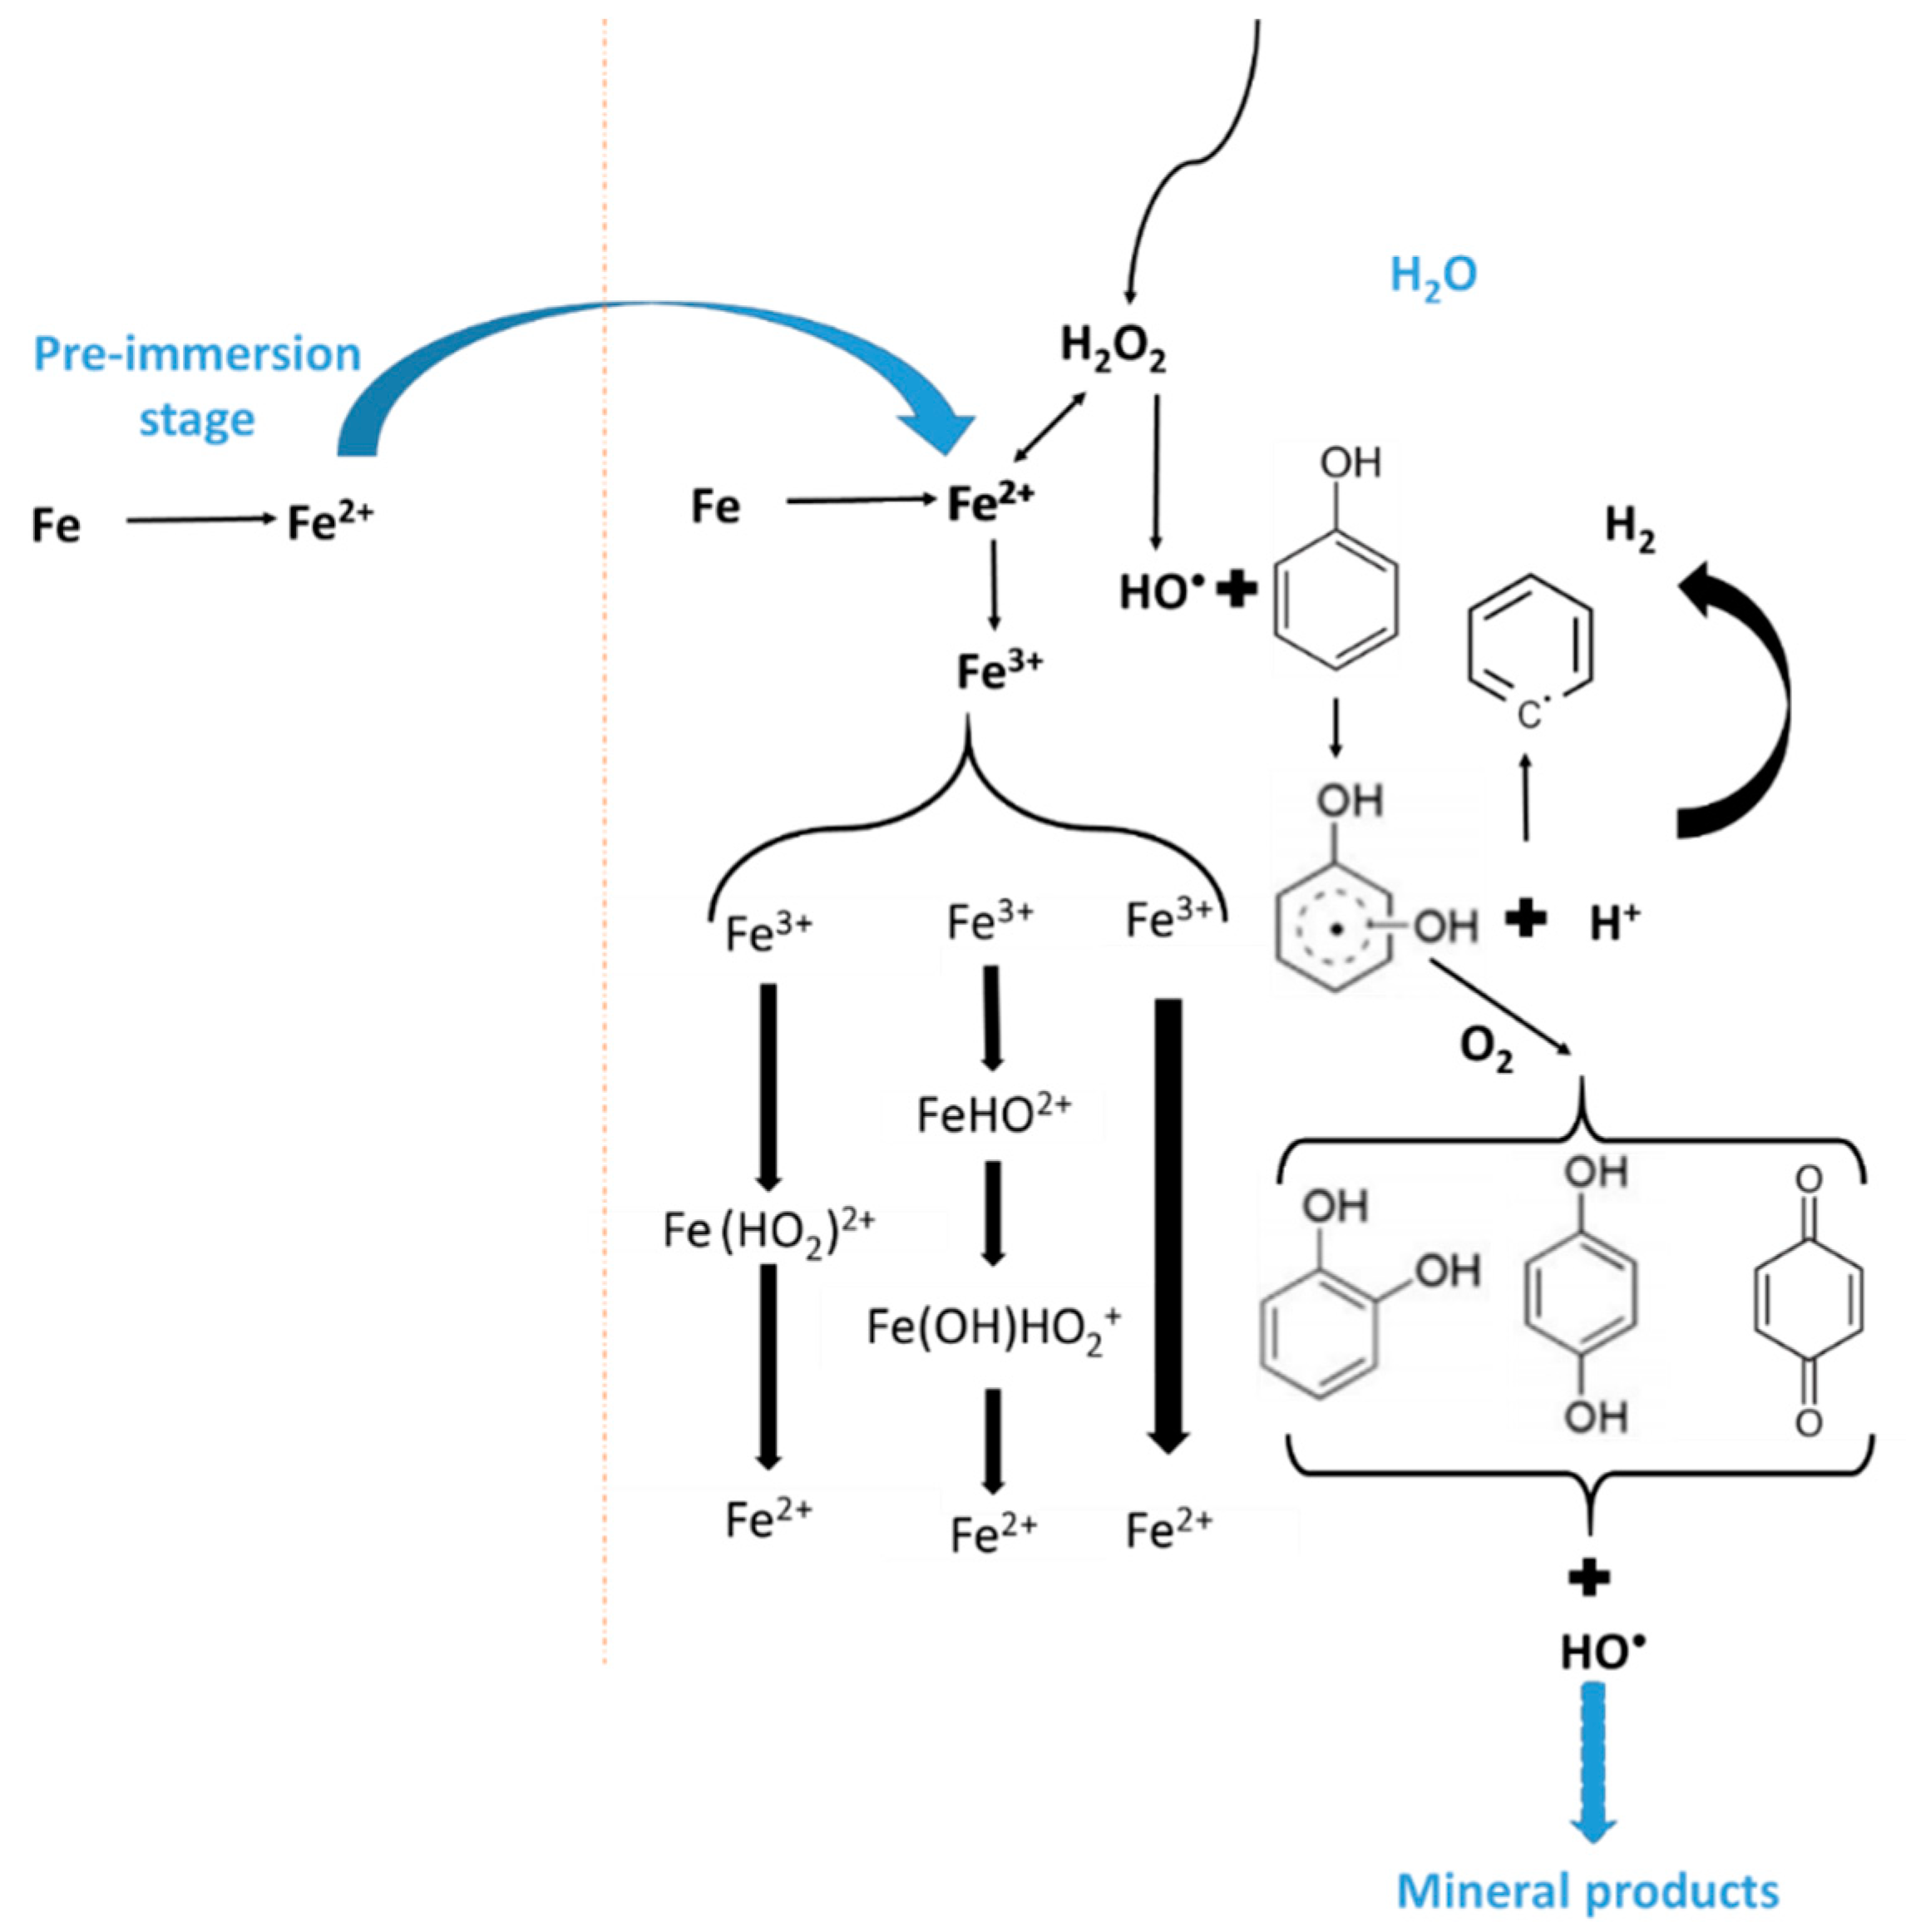
2.2. Galvano-Fenton and Pre-Immersion Effects

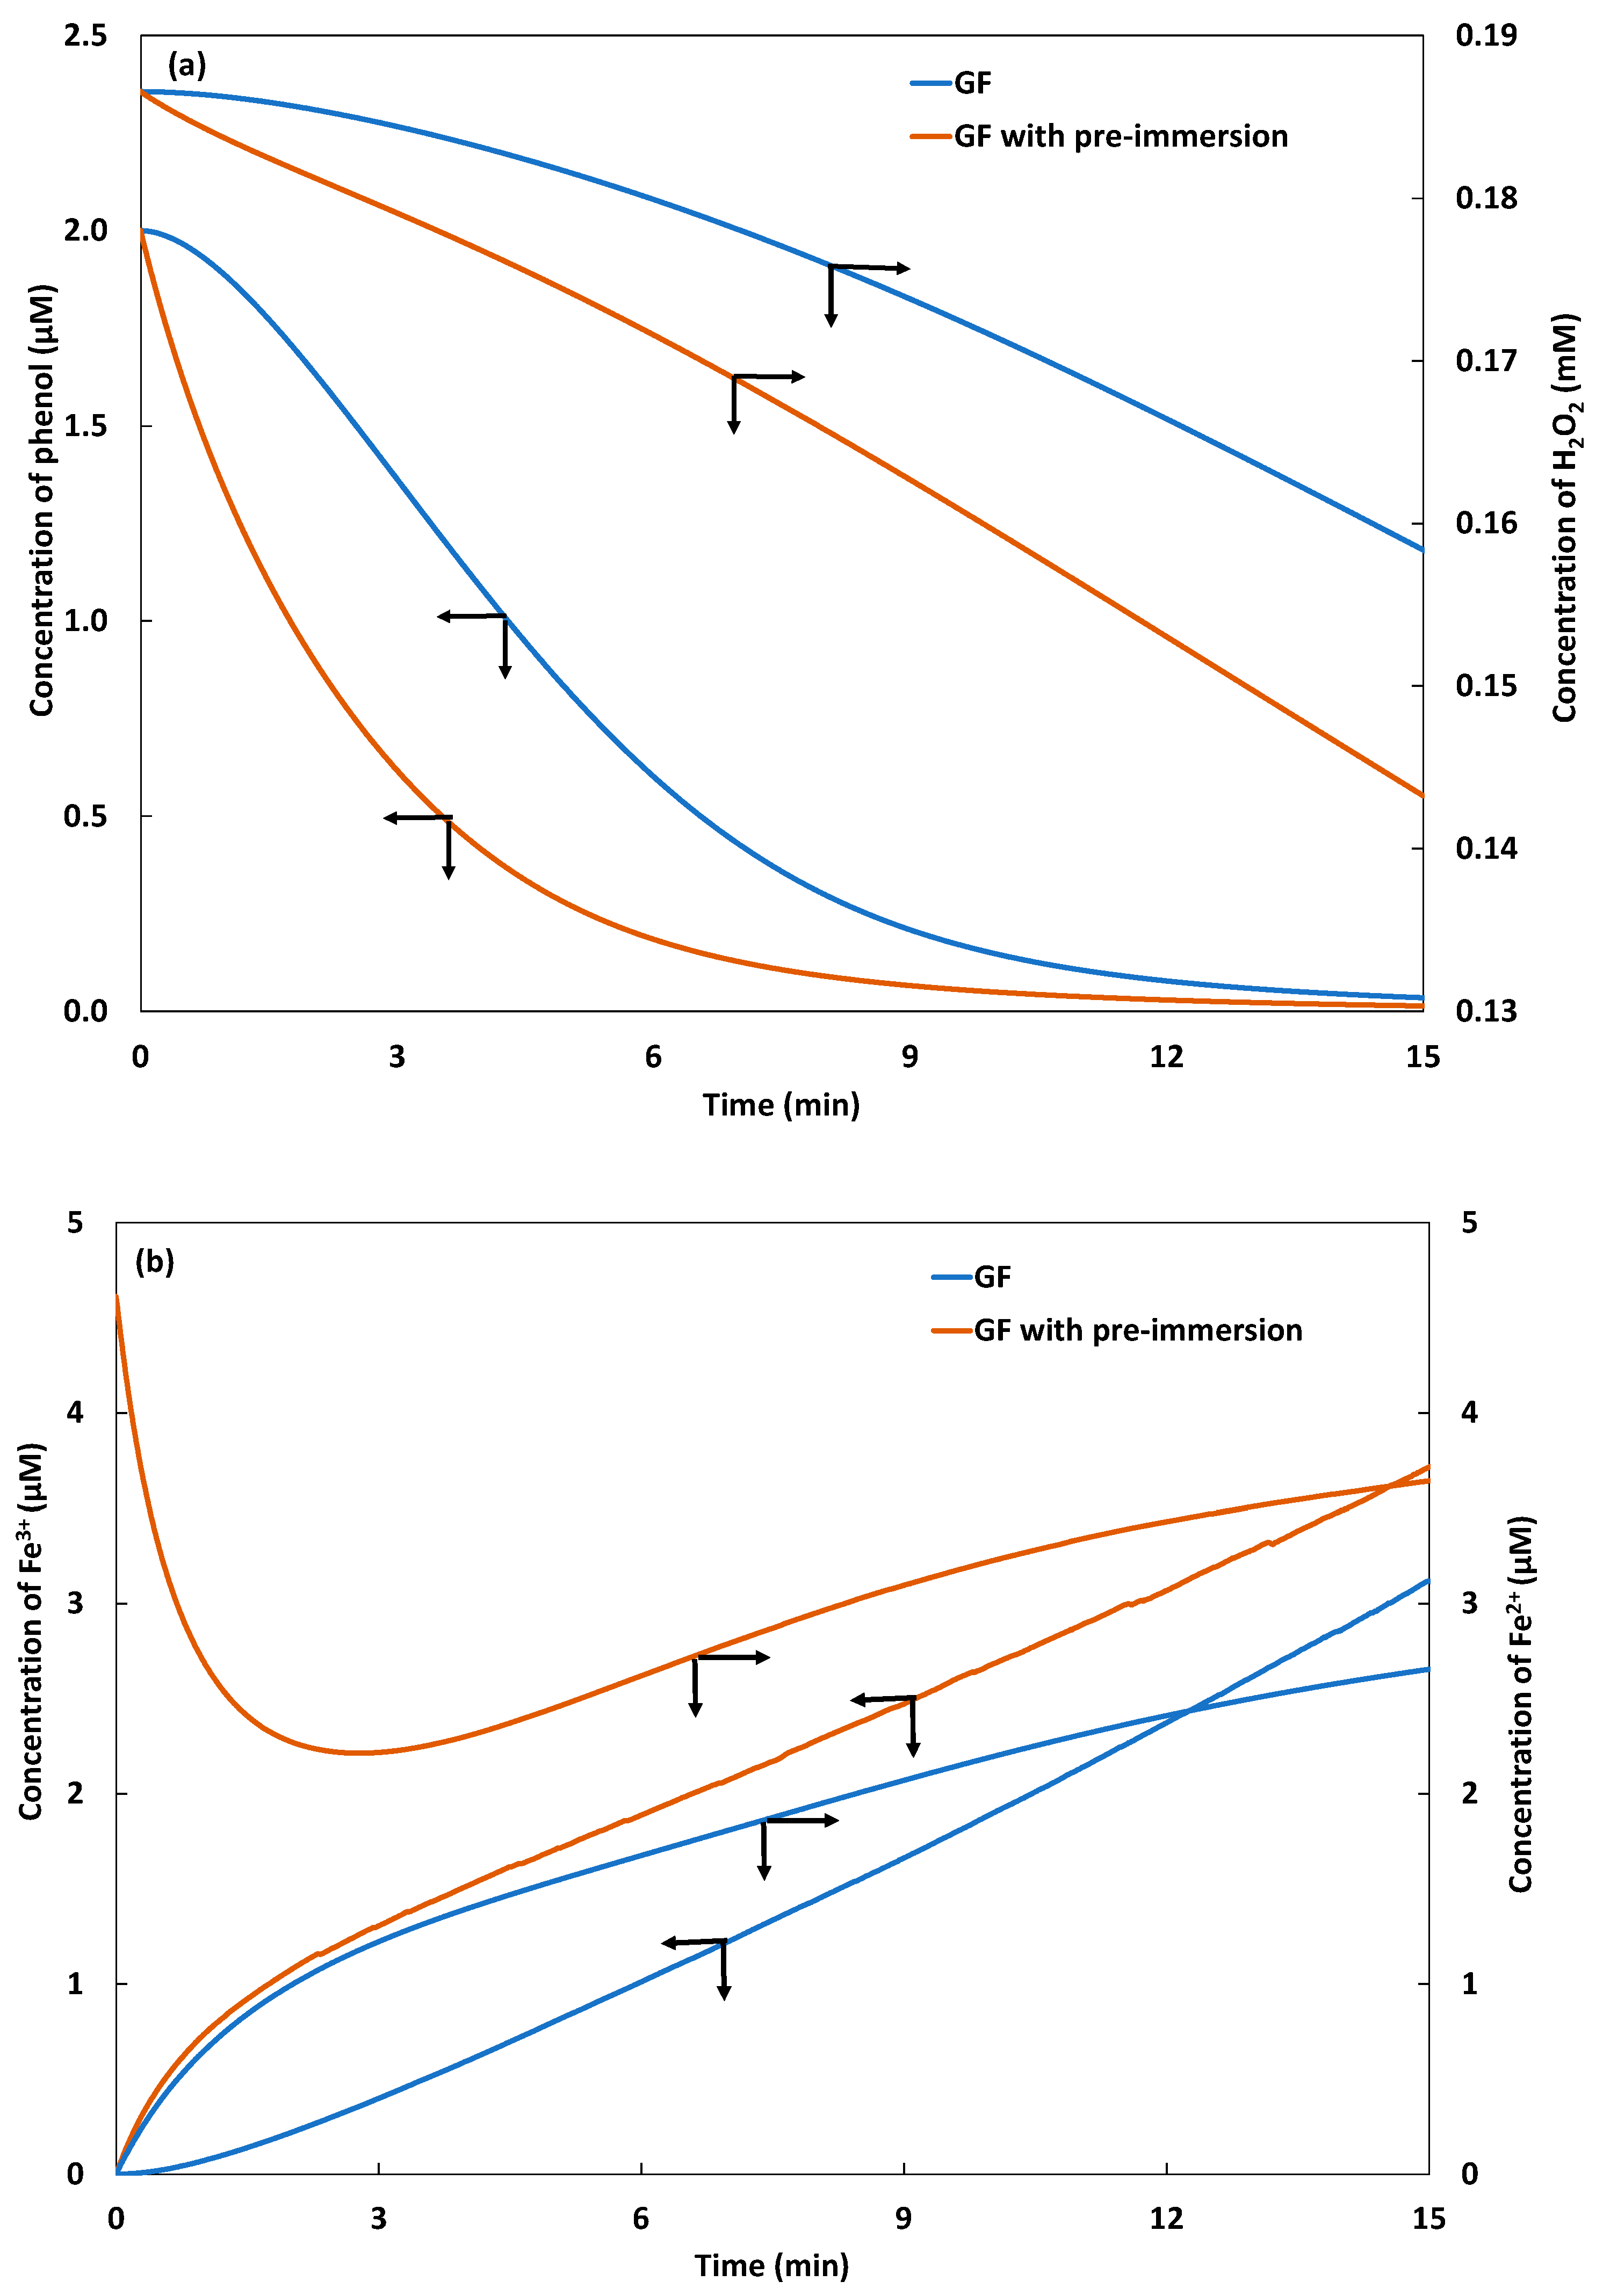
2.2.1. Fenton Reagent, Catalyst, and Phenol Degradation

The integration of the pre-immersion time in the Galvano-Fenton process aims to overcome the barrier of the null initial rate of degradation due to the absence of the ferrous ion catalyst at the initial instant. The pre-immersion of the electrodes is expected to release ferrous ions through the spontaneous oxidation of the solid iron electrode, as shown in Equation (1).
F e F e 2 + + 2 e
In the present section, both the Galvano-Fenton process and the Galvano-Fenton process with pre-immersion time are compared based on the evolution of the concentration of hydrogen peroxide, ferrous and ferric ions, and phenol. We are arbitrarily considering a pre-immersion time of 5 min for the Galvano-Fenton process with pre-immersion time while considering similar operating conditions. Both processes are compared in Figure 5a,b, starting from the instant of the addition of hydrogen peroxide at 0.186 mM.
Figure 5a demonstrates that with a pre-immersion time of 5 min, the evolution trend of phenol degradation is completely changed at the beginning of the process, i.e., when hydrogen peroxide is added. Indeed, at the opposite of what was previously observed with the Galvano-Fenton process, the degradation rate is at the highest at the initial instant, revealing the instantaneous decomposition of H 2 O 2 into hydroxyl radicals as soon as it is added. This occurs thanks to the availability of the Fenton catalyst released during the pre-immersion time by the galvanic corrosion of the iron electrode. The rapid decomposition of H 2 O 2 is confirmed by the net decrease of its concentration when integrating the pre-immersion time, compared to the Galvano-Fenton process. In quantitative terms, phenol degradation exceeds 96% within 7 min when considering the pre-immersion of the electrodes, which is against the 12 min time reported earlier. Simultaneously, a consumption rate of H 2 O 2 of 2.87 µM/min is recorded when integrating the pre-immersion, while it is limited to 1.8 µM/min without the pre-immersion, which is equivalent to an 88.58% increase in the Fenton reagent decomposition.
The effect of the novel configuration on the evolution of the concentration of the ferrous and ferric ions is examined in Figure 5b. It clearly shows that while the Galvano-Fenton process begins with a null concentration of catalyst, the Galvano-Fenton with pre-immersion time counts 4.6 µM of F e 2 + at the instant of the addition of H 2 O 2 . This concentration abruptly decreases once both Fenton’s reagent and the catalyst come to contact. Indeed, it is noticeable that the concentration of F e 2 + decreases to 2.3 µM at 2.5 min, which is in parallel to the increase of F e 3 + resulting from the reaction of H 2 O 2 and F e 2 + , as shown in Table 1. Interestingly, after 2.5 min, the concentration of ferrous ions increases again as a result of the permanent galvanic corrosion of iron electrode releasing F e 2 + . In this regard, the pre-immersion time seems to offer three advantages: (i) it allows the process to starts instantaneously with a positive degradation rate of phenol, (ii) it provides an initial catalyst yield that is capable of maintaining the catalyst concentration in the electrolyte at a relatively high level, almost 4-fold that provided by the Galvano-Fenton process, and (iii) it partially resolves the issue of the slow F e 2 + regeneration from F e 3 + , observed earlier and previously reported in the literature [29]. Studies report that a Fenton reaction proceeds through a non-radical Fe(IV) species, namely, the -oxo (FeIVO)2+ species, but its mechanism awaits proper experimental validation [30].
Indeed, Figure 5b demonstrates a rapid increase in the ferric ion concentration in both cases, revealing the slowness of the regeneration process and the predominance of galvanic corrosion as a source of F e 2 + , compared to the reaction transforming F e 3 + into F e 2 + .

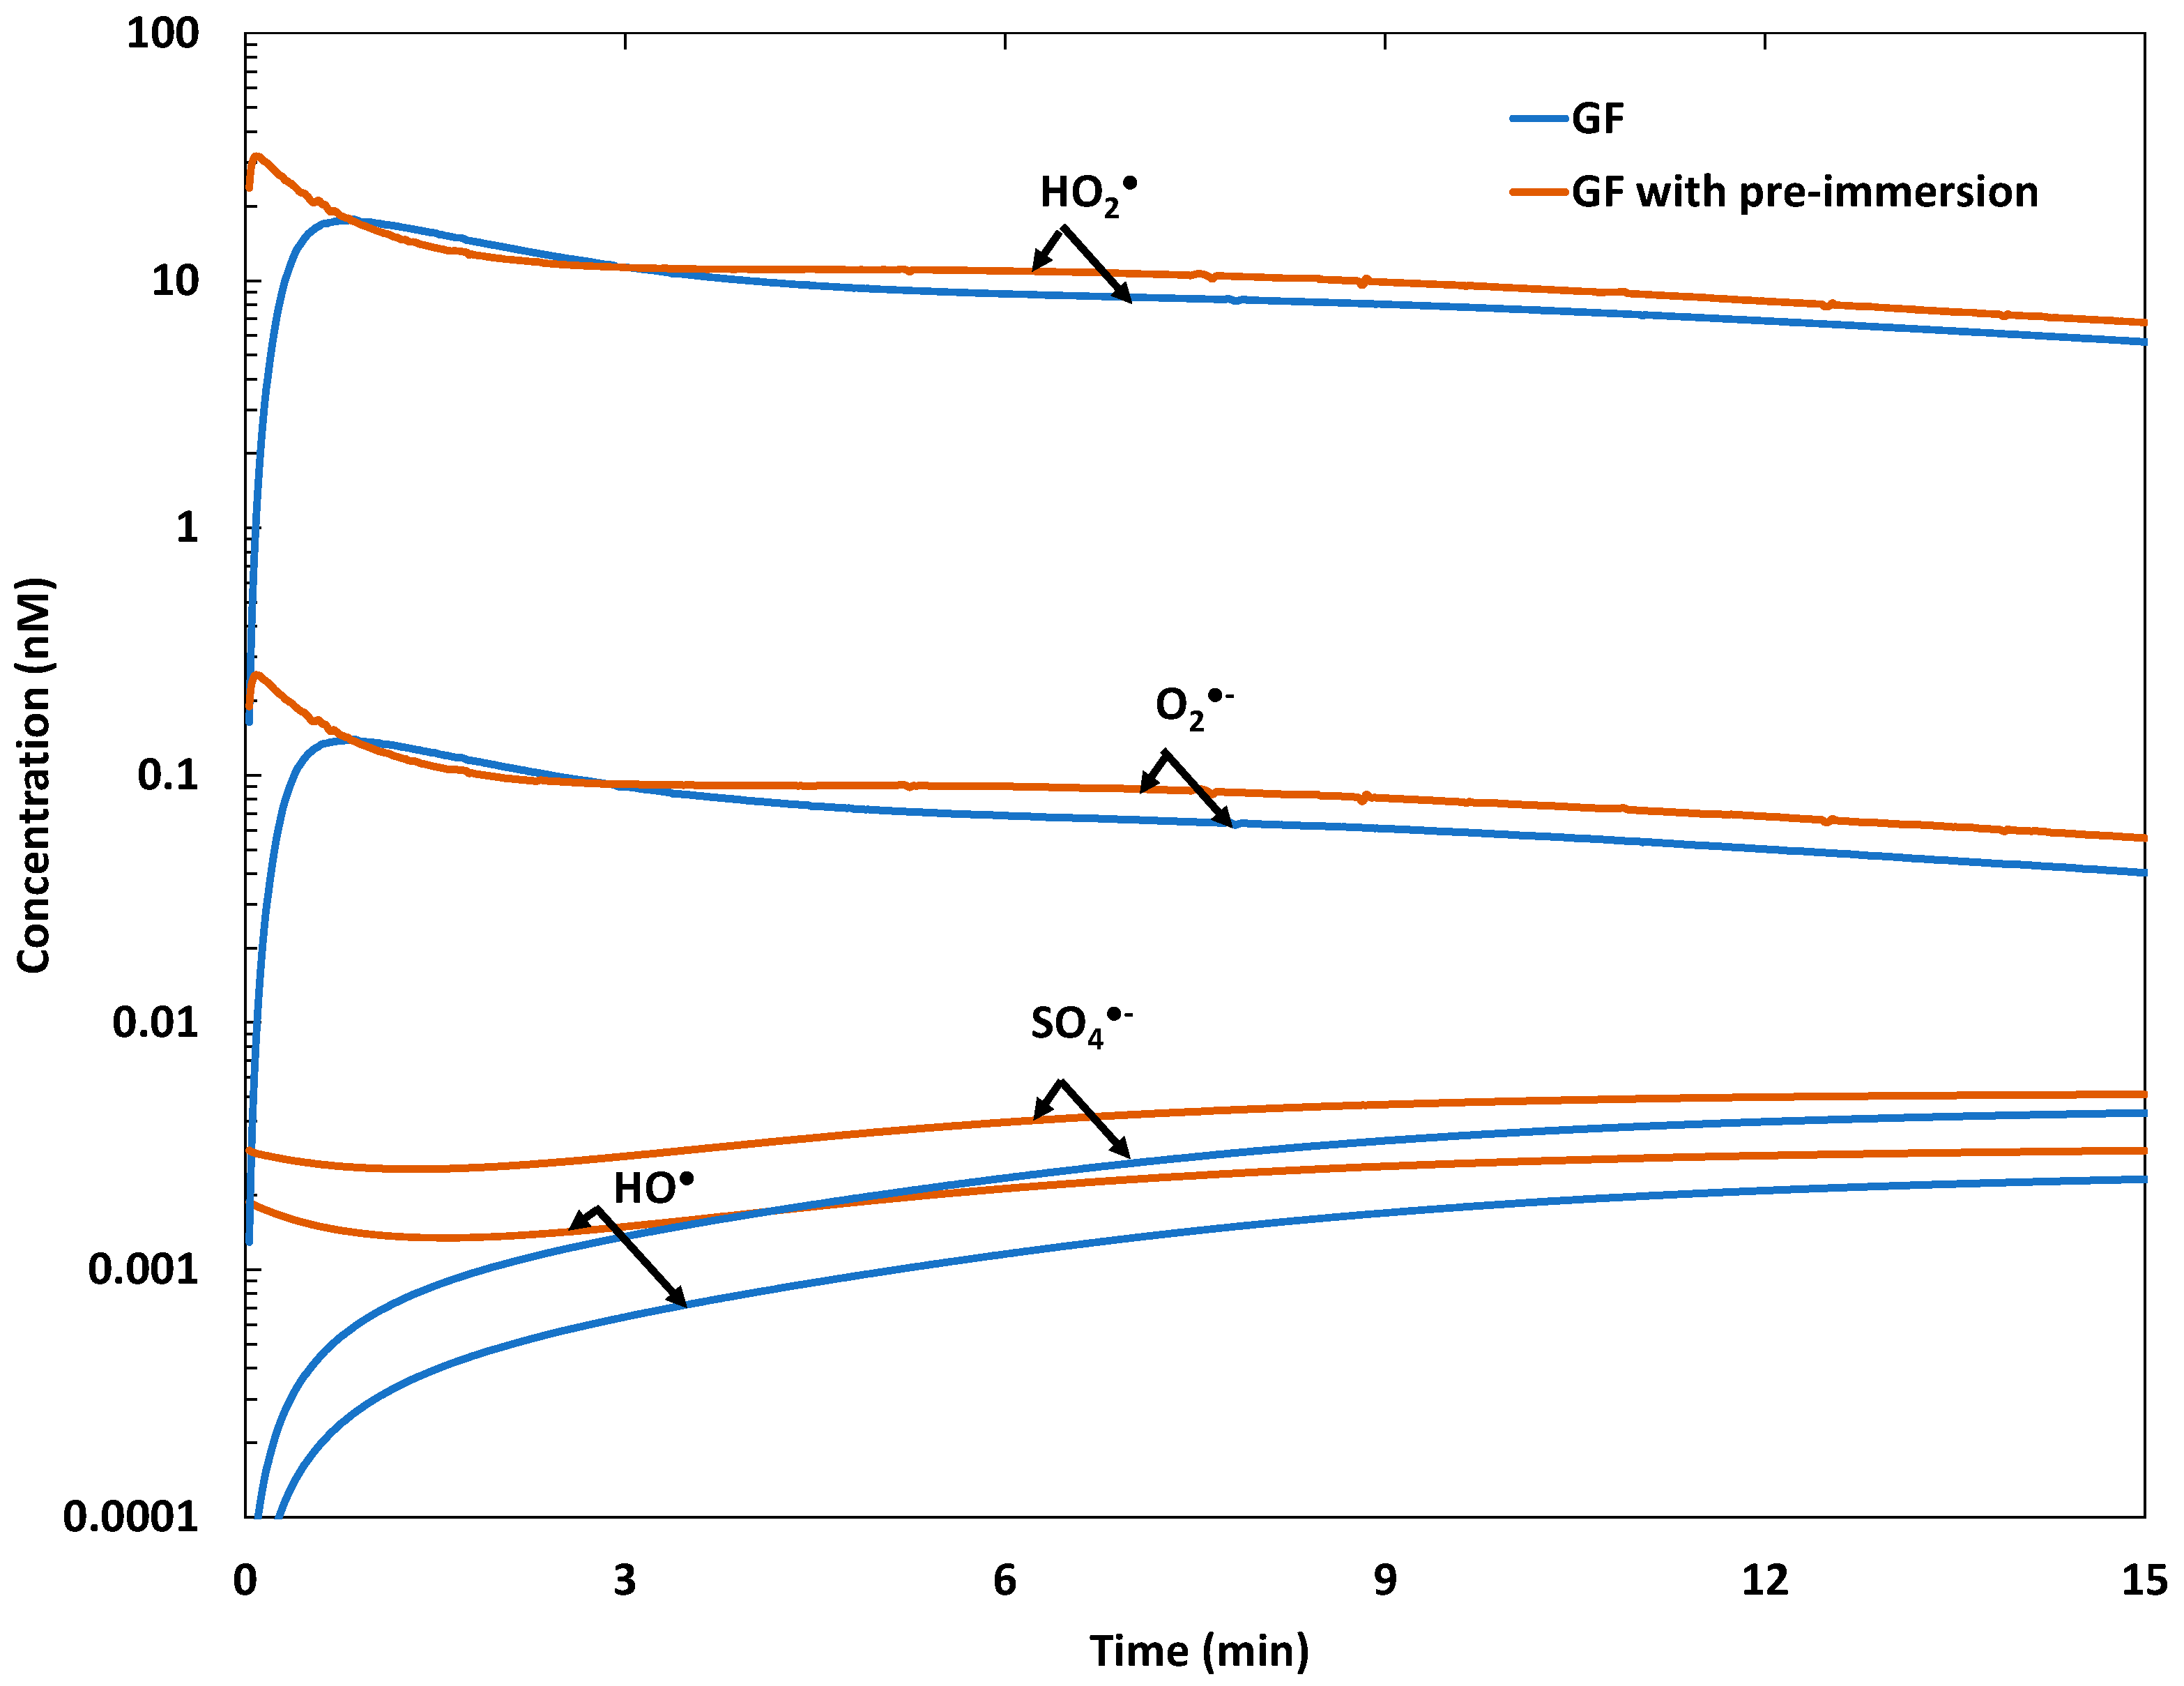
2.2.2. Evolution of Free Radicals’ Yields

We suggest inspecting the kinetics of the production of free radicals, namely, H O , H O 2 , S O 4 , and O 2 , through both Galvano-Fenton and Galvano-Fenton with pre-immersion time. Figure 6 reports the simulation results considering the addition of hydrogen peroxide into the electrolyte at 0.186 mM at the reference time. It is observable that the pre-immersion time of 5 min resulted in the instantaneous apparition of free radicals as soon as the Fenton reagent was added. The largest difference in terms of the concentration of free radicals is noticed during the first minute of both processes. For instance, whilst the concentration of H O is quasi-null at t0 in the case of the Galvano-Fenton process, it is to the order of 0.002 nM when integrating the pre-immersion of the electrodes. The highest concentration among the four aforementioned free radicals is reached by H O 2 . At the initial instant, its concentration is about 0.2 nM with the Galvano-Fenton process, while it exceeds 30 nM when considering the pre-immersion of the electrodes in the electrolyte over 5 min. After 1 min from the addition of the hydrogen peroxide, both processes seem to result in very close concentrations of free radicals in the electrolyte, with slightly higher values for the Galvano-Fenton process with pre-immersion time. The difference neighbors the order of 20% to 50% as a function of the free radical species by the end of the experiment’s duration.

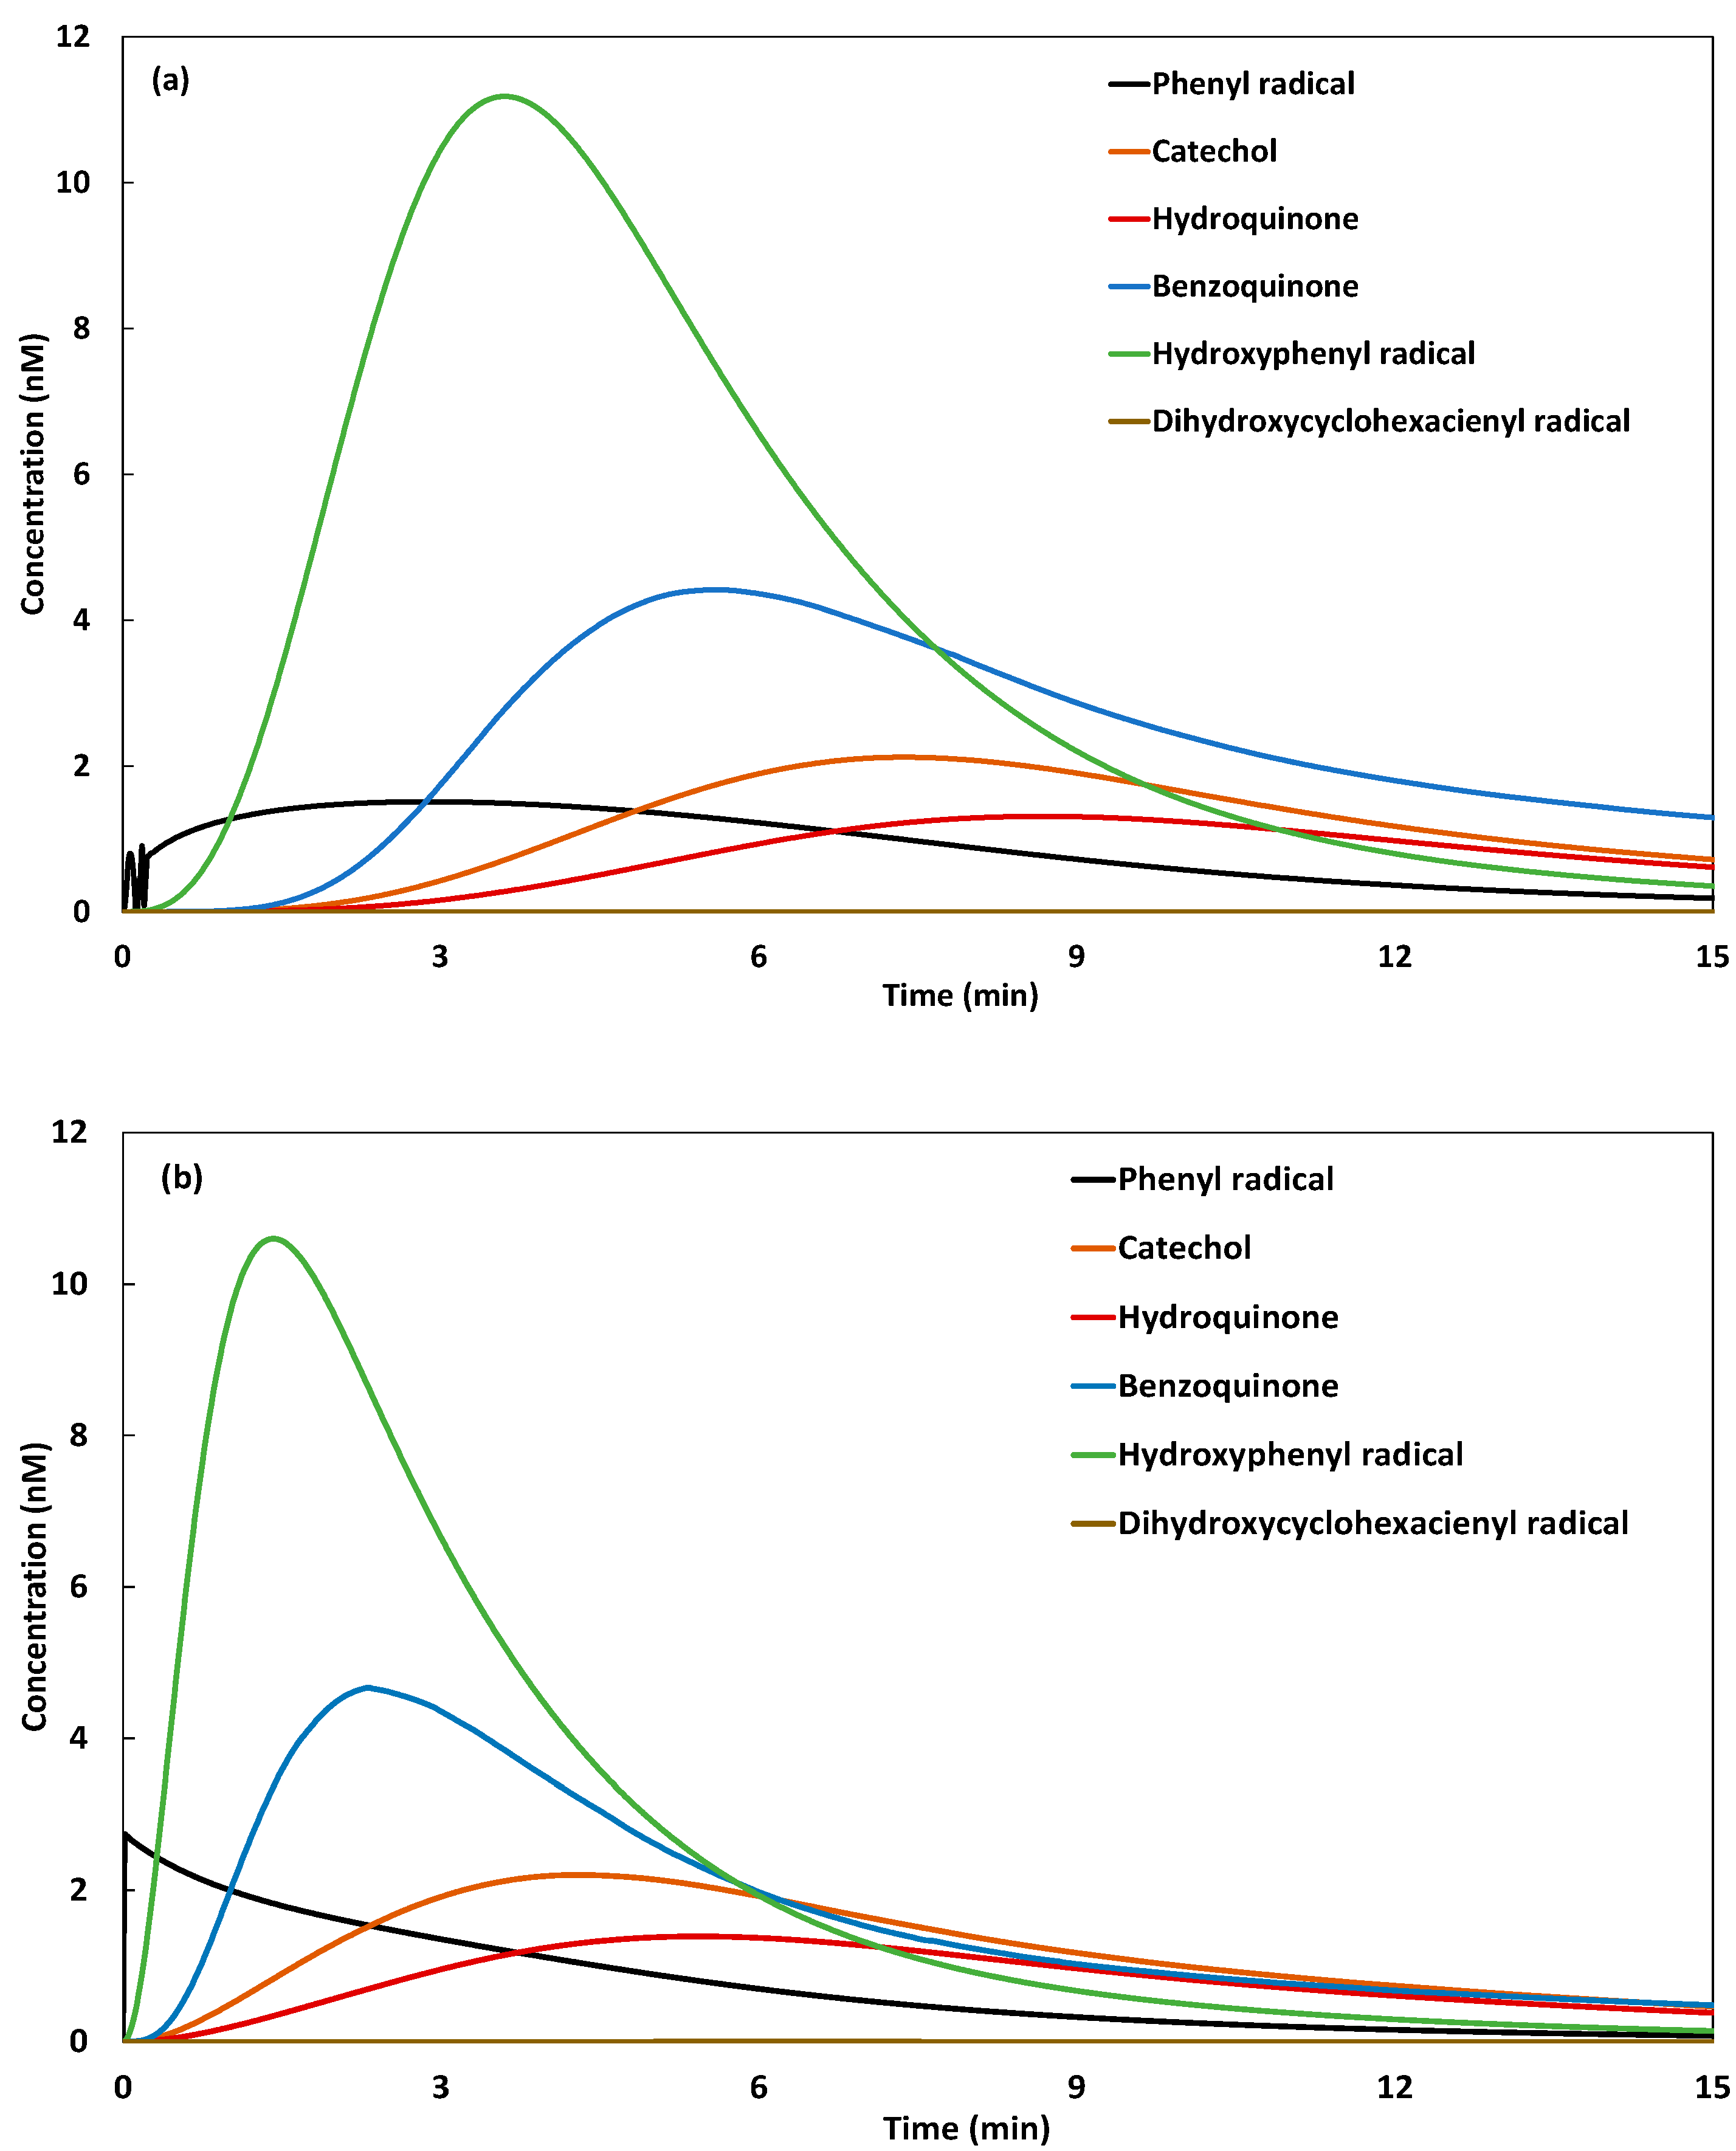
2.2.3. Mechanistic Insights

The mechanism of phenol degradation is closely dependent on the release of free radicals in the electrolyte; hence, in Figure 7a,b, we examine the evolution of the concentration of the intermediate species formed during phenol degradation, as described in Table 1 and in the case of the Galvano-Fenton process and the Galvano-Fenton process with pre-immersion time, respectively. When comparing both figures, we notice that an earlier formation of intermediate species is observed when integrating the pre-immersion time. With the first intermediate species to appear in the phenyl radical, its concentration instantaneously reaches 2.7 nM as soon as hydrogen peroxide is added after the 5 min of pre-immersion of electrodes in the electrolyte. In contrast, the concentration of the phenyl radical gradually increases in the case of the Galvano-Fenton process until it reaches a maximum value of 1.7 nM at 3 min. The same delay is observed in the evolution of the concentrations of the other intermediate species. For instance, the peak of the hydroxyphenyl radical concentration is observed at 3.6 min in the Galvano-Fenton process, while it appears at 1.5 min when considering the pre-immersion time. Similarly, the maximum concentration of benzoquinone is reached at 5.5 and 2.5 min in both processes, respectively. The early apparition of the intermediate phenol degradation species reveals the most rapid degradation of phenol tending to its mineralization.
The adopted mechanism of phenol degradation assumes the formation of all of the known intermediates until total mineralization. Accordingly, through the simulations depicted in Figure 7a,b, within 15 min, the adopted mechanism leads to the complete degradation of phenol and the total disappearance of all the intermediate species, revealing the apparition of mineral products as per reactions 42, 43, 45, 47, 48, and 49 in Table 1. Figure 8 illustrates the overall process of hydroxyl production and phenol degradation until mineralization through the Galvano-Fenton process without and with the pre-immersion stage. It appears that the accumulation of ferrous ions accelerates the initiation stage and hence enhances the production of hydroxyl radicals in both time and yield (earlier production with higher amount). The produced hydroxyl radical is expected to react with the phenol molecule, but it is also expected to react with the three major products of phenol oxidation, namely, hydroquinone, benzoquinone and catechol, leading to chain reactions resulting in their complete mineralization to C O 2 and H 2 O .

2.2.4. Energetic Insights

At present, we suggest relating the efficiency of the Galvano-Fenton and Galvano-Fenton process with pre-immersion time to the energy release [31], compared to the efficiency of the electro-Fenton process to the energy consumption, considering similar conditions of spontaneous and forced electrochemical reactions. Figure 9a represents the polarization curves of the Fe-Cu galvanic cell within the Galvano-Fenton process in the presence of hydrogen peroxide at 0.187 mM, as described in the present work. This figure shows that the corrosion current is concisely 298.75 µA for a corrosion potential of 0.277 V, which is equivalent to a maximum power of 82.75 mW. Considering an operating duration of 15 min, the total energy released by both configurations of the Galvano-Fenton process starting from the instant of the addition of H 2 O 2 would be to the order of 74.47 J.
In Figure 9b, the ratios of the yield of hydroxyl radicals emerging over the process duration to the energy released by both configurations of the Galvano-Fenton process are presented. In the same figure, we report the ratio of the yield of the produced hydroxyl radical in the electro-Fenton process and reporting the energy consumption using the same process. Conventionally, we correlate this with a negative sign the energy release. The figure demonstrates that the highest ratio is attained with the Galvano-Fenton process, to which we integrate a pre-immersion of electrodes in the electrolyte over 5 min. The ratio then equals 0.047 nM per released Joule. With the Galvano-Fenton process, the ratio is estimated to be at 0.0311 nM per released Joule. On the opposite hand, an electro-Fenton process operating at the same conditions would produce 0.0059 nM per consumed Joule.
In terms of phenol degradation efficiency, Figure 9c reports the ratio of the percentage of phenol degradation to the released or consumed energy when considering an initial phenol concentration of 2 µM. This figure shows that the Galvano-Fenton process with pre-immersion time can degrade 1.34% the initial phenol concentration by 1.34% for each released Joule against 1.32% with the Galvano-Fenton process. The electro-Fenton process, however, would degrade 1.05% for each consumed joule. Overall, both configurations of the Galvano-Fenton process, when treated as energetic systems, are characterized by a higher performance added to an energy release, while the electro-Fenton process not only shoes a lower performance but also shows lower energy consumption.

2.3. Parametric Analysis of Galvano-Fenton and Galvano-Fenton with Pre-Immersion Techniques

2.3.1. Effect of the Ratio of H2O2 to Total Released Iron

Figure 10 reports the variation of the phenol concentration as a function of the concentration of the added hydrogen peroxide with both the Galvano-Fenton process and the Galvano-Fenton process with a pre-immersion time of 5 min. It is observed that although the hydrogen peroxide is not totally consumed during the simulation duration, the increase of its concentration positively affects the degradation rate of the phenol. This is explained by the acceleration of the decomposition kinetics of hydrogen peroxide as well as the regeneration kinetics of ferrous ions from ferric ions, as indicated in Table 1. In terms of Fenton’s reagent to Fenton’s catalyst ratio, from Figure 10a, it appears that considering the similarly released yield of F e 2 + during the experiment’s duration, a 100% increase in the ratio of the yield of H 2 O 2 to that of the released F e 2 + allows the achievement of 96% phenol degradation almost 4 min earlier. However, a further increase of Fenton’s reagent to the Fenton’s catalyst ratio of 200% would not induce any significant gain in terms of degradation efficiency. Indeed, with 0.373 and 0.559 µM of added H 2 O 2 , the curves of phenol degradation are almost superimposed, with an initial phenol concentration of 2 µM.
When the concentration of phenol increases to 20 and 105.4 µM, the increase of the concentration of added hydrogen peroxide demonstrates a more important enhancement in phenol degradation. For instance, Figure 10b shows that the phenol degradation rate increases from 79.37% to 88.72% and 92.10% when the phenol concentration increases from 0.187 to 0.373 and 0.559 µM, respectively, with an initial phenol concentration of 20 µM. The effect of the phenol concentration will be further discussed in the following section.
In the case of the Galvano-Fenton process with pre-immersion time, the increase of the initial concentration of hydrogen peroxide clearly acts on the initial degradation rate. This is noticeable from the tangent of the phenol degradation curves in Figure 10d–f. The increase of the hydrogen peroxide concentration also induces an increase in the phenol degradation percentage as a function of time, and this gain is accentuated as the concentration of phenol increases.
The comparison of both processes, i.e., without and with the integration of the pre-immersion time, demonstrates that the increase of hydrogen peroxide concentration leads to higher phenol degradation when the addition of the Fenton’s reagent is preceded by the immersion of the electrodes in the electrolyte over 5 min. However, the gains in terms of phenol degradation seem to be comparable. To illustrate, with an initial phenol concentration of 105.4 µM and similar augmentations of the initial H 2 O 2 concentration from 0.187 to 0.559 µM, the Galvano-Fenton process depicts an increase of the degradation percentage from 40.90% to 69.41%, which is equivalent to a gain of 28.49%, as shown in Figure 10c, while the Galvano-Fenton process with pre-immersion time demonstrates an increase in the degradation percentage from 57.78% to 85.06%, i.e., a gain of 27.28%, as shown in Figure 10f.

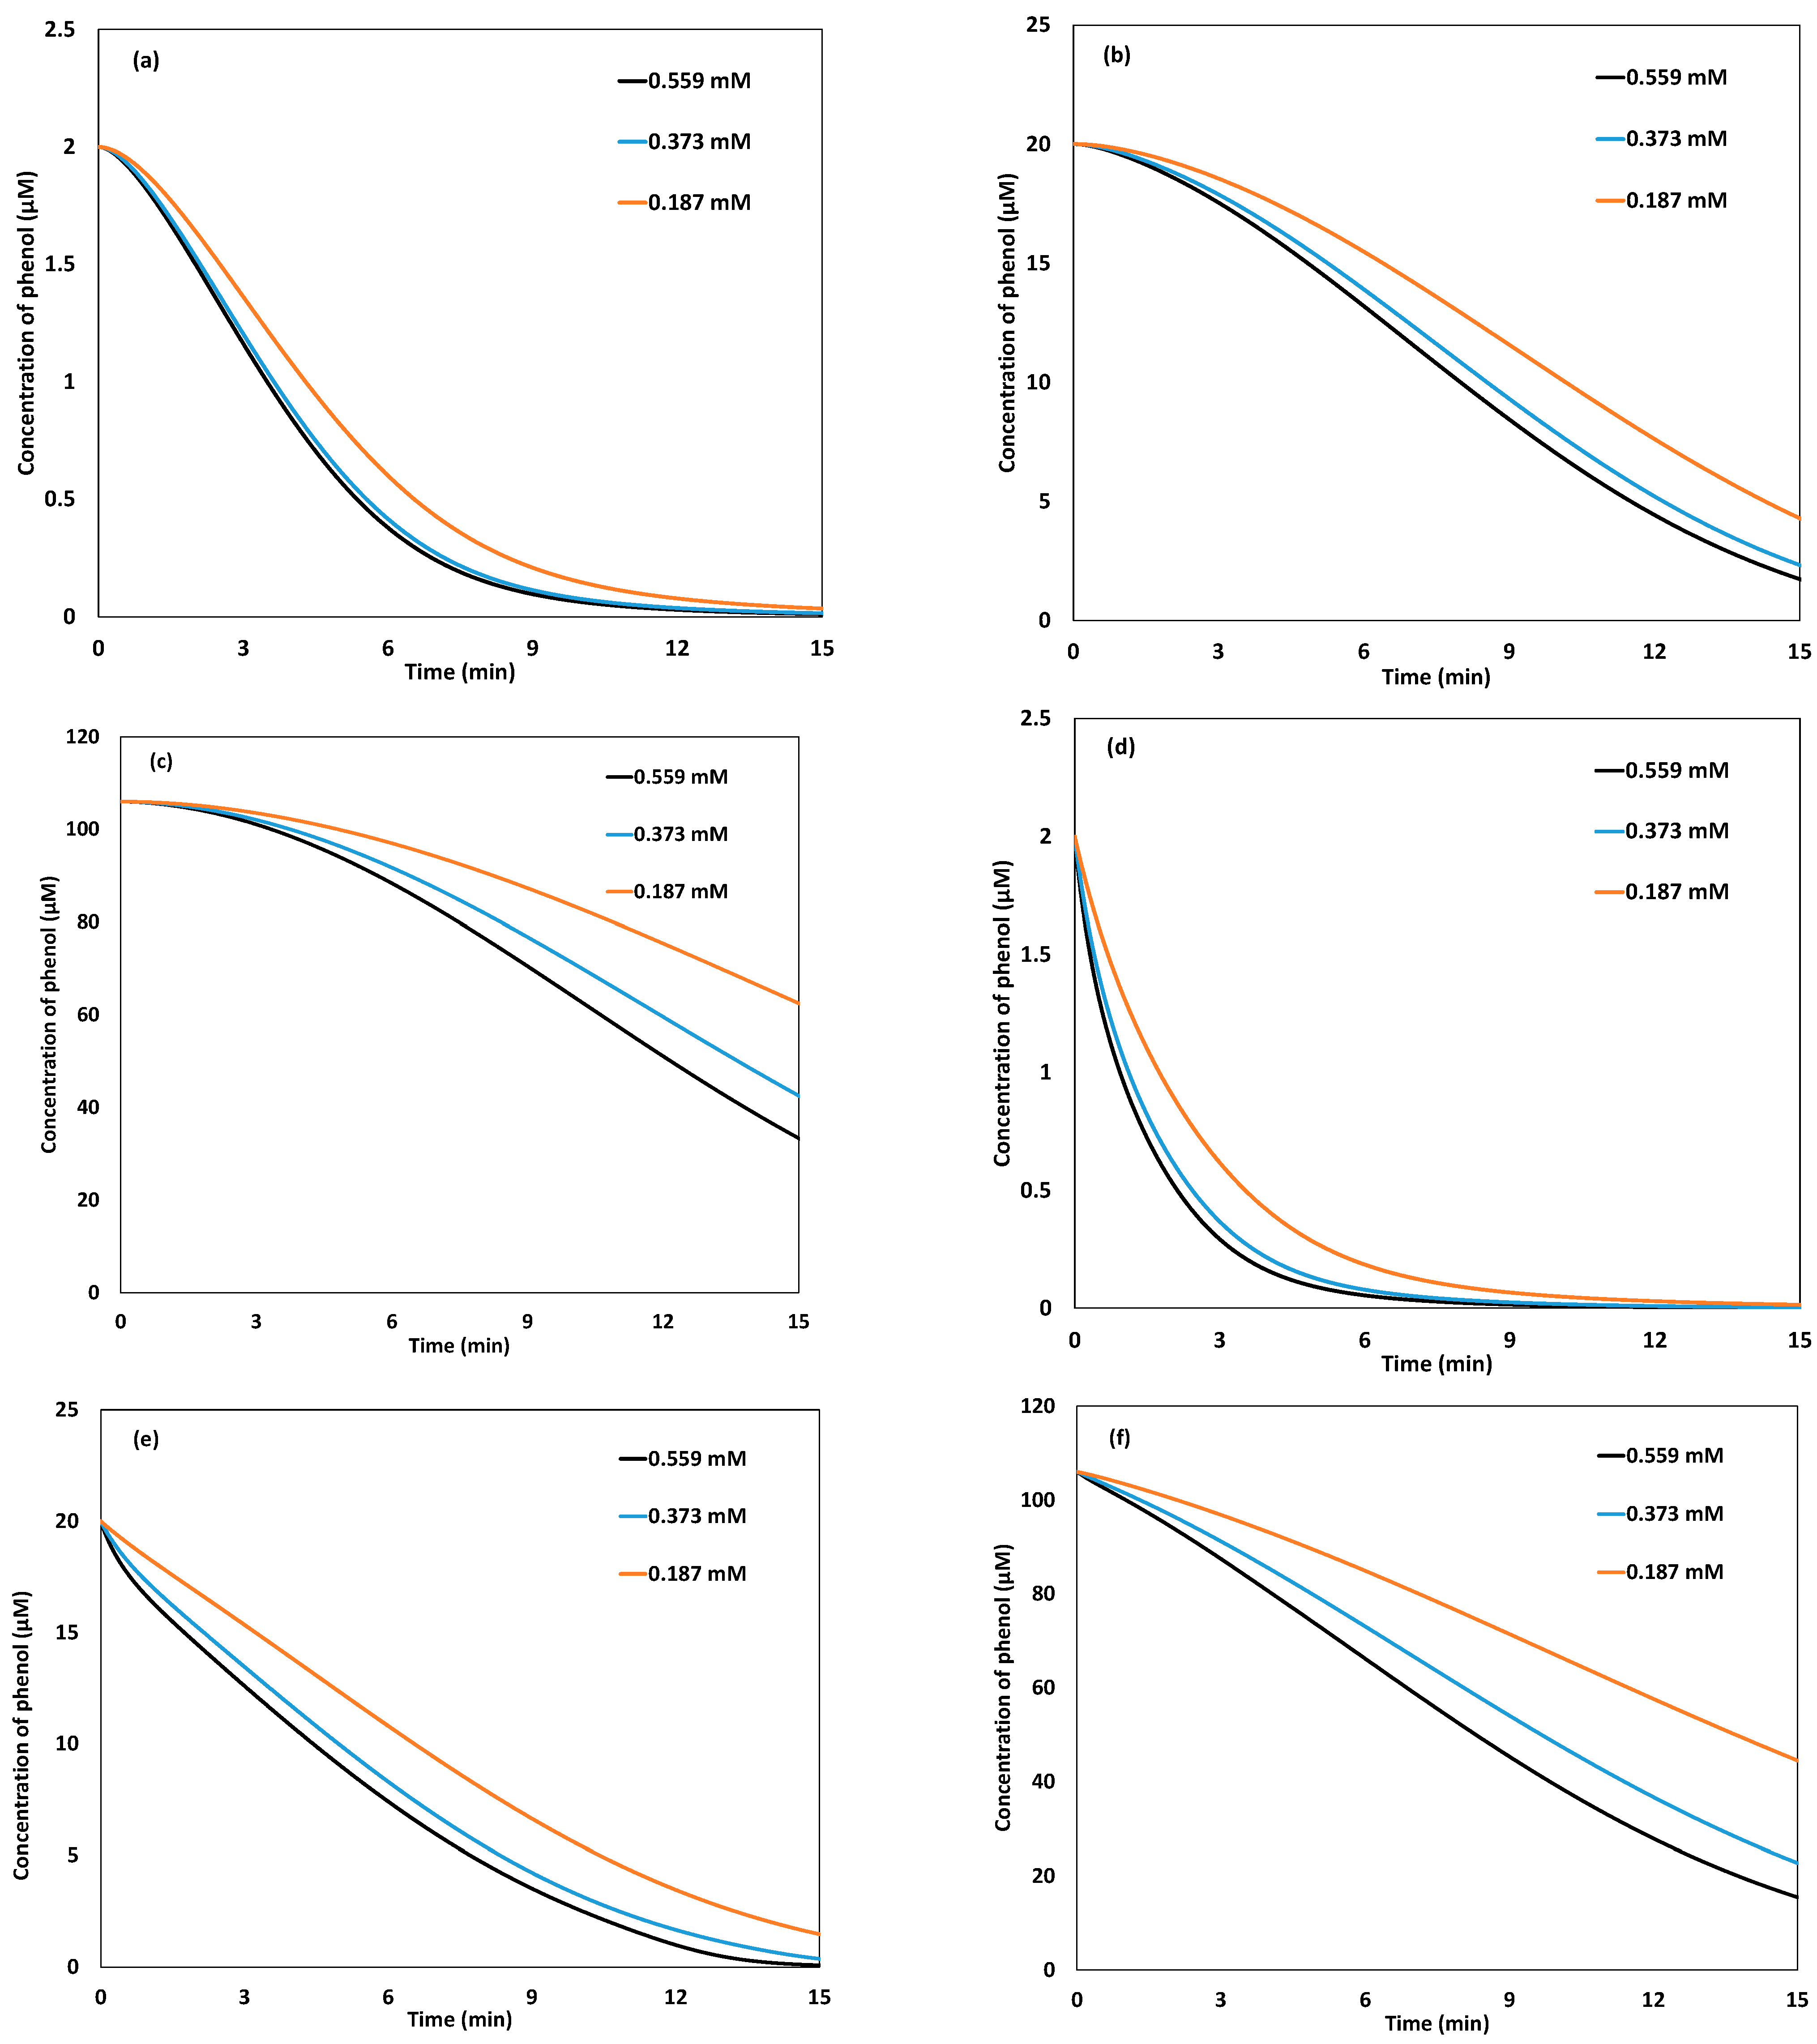
2.3.2. Effect of Phenol Concentration

In parallel to the effect of the initial concentration of hydrogen peroxide, Figure 10 reports the effect of the phenol concentration with both the Galvano-Fenton process and the Galvano-Fenton process with pre-immersion time. There are three cases that can be distinguished with each of both processes: (i) With a low phenol concentration, i.e., 2 µM in the present study, the pre-immersion of electrodes in the electrolyte over 5 min transforms the initial phenol degradation phase from slow kinetics characterized by a zero initial rate to kinetics starting instantaneously with the addition of hydrogen peroxide and showing a maximum degradation rate at the initial time. In terms of the degradation efficiency, the pre-immersion time results in a shift in the degradation curve as a function of time and demonstrates a gain of almost 4 min for similar degradation percentages. (ii) With an intermediate concentration of phenol, i.e., 20 µM, the latency phase in the phenol degradation kinetics is extended to almost 1 min with the Galvano-Fenton process. When integrating the pre-immersion time, the decrease of the phenol concentration becomes quasi-linear with the lowest concentration of hydrogen peroxide and shows maximum degradation rates at the initial instant when the concentration of hydrogen peroxide is increased. (iii) With a high concentration of phenol, i.e., 105.4 µM, the latency time in the phenol degradation kinetics with the Galvano-Fenton process reaches the order of 2 min. In contrast, all of the curves of the evolution of the phenol concentration with the Galvano-Fenton process with pre-immersion time exhibit linear trends, avoiding the initial phase of zero degradation rate and consequently leading to a higher degradation percentage for a similar experiment time. For instance, after an operating time of 15 min with an initial hydrogen peroxide concentration of 0.559 µM, the final concentration of phenol reaches 15.73 µM versus 32.24 µM, without the pre-immersion of electrodes in the electrolyte. This means a gain of 15.67% in terms of degradation performance.

3. Materials and Methods

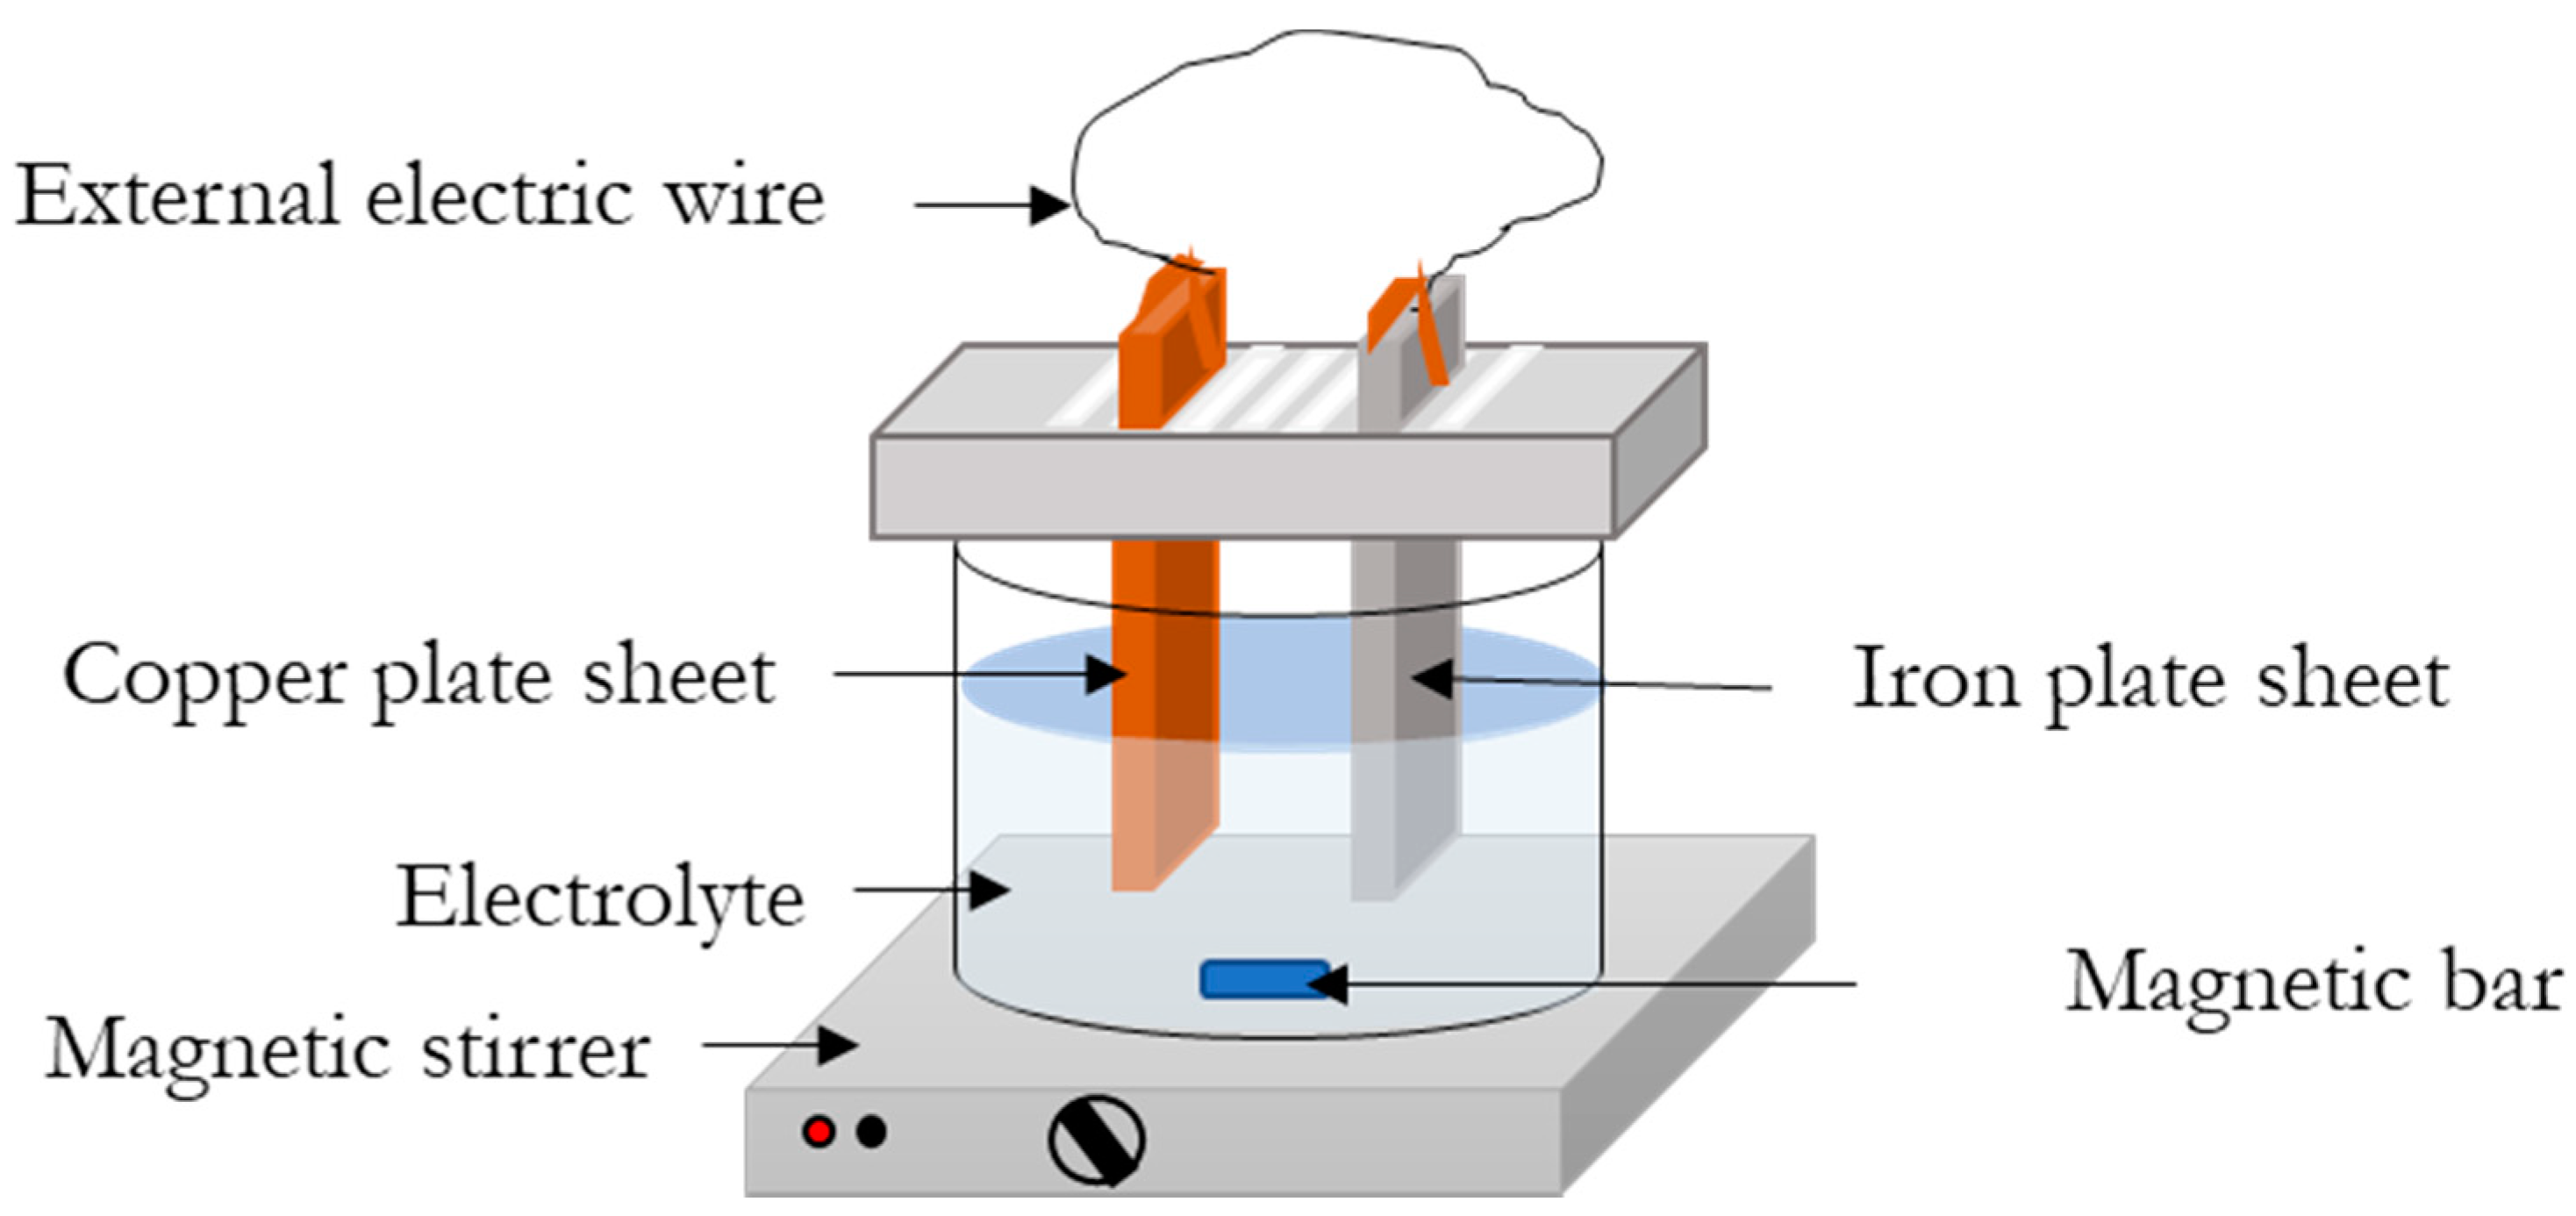
3.1. Processes’ Configuration

In both treated electrochemical processes, i.e., the Galvano-Fenton and the electro-Fenton processes, both electrodes are used in the form of rectangular smooth plates of a 12 cm2 area, 6 cm2 of each are immersed, putting 12 cm2 of the contact surface between the electrode and the electrolyte, which is in 100 mL of distilled water contained in a glass beaker. In the adopted configuration of the Galvano-Fenton process, the electrodes are deemed to be arranged in parallel in the electrolyte. They are electrically connected by an external wire ensuring the movement of the electrons, while the movement of the ions in the electrolyte provides internal electrical continuity, aided by a magnetic stirring at 350 rpm, as illustrated in Figure 11. The Galvano-Fenton process spontaneously releases electrical energy. A zero ammeter was used to measure the corrosion current adopted in the numerical model. The setup was also connected to a galvanostat-potentiostat to acquire the polarization curves presented in Figure 9a. For comparison purposes, in the electro-Fenton process, both electrodes are assumed to be connected to a DC generator delivering the same current density as that recorded in the Galvano-Fenton process. Finally, with both the Fenton and Fenton-like processes, the same nature, volume, and pH of the electrolyte is considered. The initial conditions of all of the studied processes are described in the following paragraph.

3.2. Numerical Approach

3.2.1. Galvano-Fenton Process

The Galvano-Fenton process is simulated considering a corrosion current of 300 µA for a contact surface of the anode of 12 cm2, which is equivalent to a current density reported to the active surface of the anode of 25 µA/cm2. The Galvano-Fenton system is modeled by combining electrochemical reactions taking place at the anode and the cathode with chemical reactions related to the Fenton mechanism occurring in the bulk liquid volume. As the iron constitutes the sacrificial electrode, F e oxidizes to F e 2 + (E0 = −0.44 V vs. SHE) according to Equation (1), which was mentioned earlier.
At the cathode, the most probable reaction concerns the reduction of H + to form H 2   (E0 = 0 V vs. SHE) owing to the acidity of the medium. This has been proven in a previous work conducted by our research group [26]. The reduction reaction is then expressed as reported in Equation (2).
2   H + + 2 e H 2
The kinetics related to all of the electrochemical reactions are governed by Faraday’s law [32], given in Equation (3), and describe the evolution of the C k concentration of the species involved in the electrochemical reactions in a function of time.
d C k d t = ± i c o r r n F V
n represents the valence number; it equals 2 for reaction 1 and 1 for reaction 2. F is Faraday’s number, which equals 96,490 C/mol. i c o r r represents the corrosion current, while V constitutes the volume of the electrolyte.
According to Equations (1) and (3), the yield of ferrous ions generated during 20 min is estimated to be 18.6 µM.

3.2.2. Galvano-Fenton Process with Pre-Immersion Time

The upgraded configuration of the Galvano-Fenton process is characterized by the integration of a pre-immersion of connected electrodes in the electrolyte 5 min before the addition of hydrogen peroxide. This period is then described as a galvanic cell, operating spontaneously due to the difference in the redox potential between the cathode and the anode and continuously releasing ferrous ions into the 100 mL electrolyte according to Equation (1). F e 2 + is then accumulated during this period and will constitute the initial concentration of the catalyst when the hydrogen peroxide is added. The kinetics of the formation of ferrous ions in the electrolyte during the pre-immersion stage is described by Faradays law, which is given in Equation (3), by considering a valence number of 2. For coherent comparison, the operating time is limited to 15 min and is compared to the other processes based on similar operating times.

3.2.3. Electro-Fenton Process

The electro-Fenton process is simulated by considering an external current equal to the corrosion current measured in the Galvano-Fenton process, i.e., 300 µA for a cathode surface contact area of 12 cm2, or in other words, a current density reported to the cathode active surface of 25 µA/cm2 and an initial concentration of 18.6 µM added F e 2 + in form of ferrous sulfate salt. The 100 mL of electrolyte is supposed saturated with oxygen, whose solubility in water under the operating conditions is about 1.22 mM [33]. The hydrogen peroxide is deemed to be released at the cathode through the reaction shown in Equation (4) and is a generally accepted reaction in the electro-Fenton process [34,35,36]. The cathodic current also feeds the reaction for ferric ions reduction into ferrous ions, which is shown in Equation (5), allowing for the regeneration of the catalyst. However, since hydrogen peroxide is the limiting reactant in the electro-Fenton configuration, the highest performance of the process is achieved when the fraction of current dedicated to the reduction of oxygen into hydrogen peroxide is equal to 1. This hypothesis is adopted in the present work. At the anode, water molecules are believed to oxidize, giving protons and oxygen as indicated in Equation (6) [37].
O 2 + 2   H + + 2   e H 2 O 2
F e 3 + + e F e 2 +
H 2 O 2   H + + 1 2 O 2 + e
The formation kinetics and the disappearance of the species involved in Equations (4)–(6) are governed by Equation (3). The production of hydrogen peroxide according to Equation (4) is characterized by a valence number of 2.

3.2.4. Classic Fenton and Fenton-Like Processes

Both configurations of the Galvano-Fenton process (with and without pre-immersion stage) as well as the electro-Fenton process are compared to the classic Fenton and Fenton-like processes. The comparison is performed by considering the initial yields of Fenton’s reagent and the catalyst in the classic Fenton and Fenton-like processes that are equivalent to those that would be released in situ in the Galvano-Fenton and electro-Fenton processes. Thus, the classic Fenton process is modeled and simulated considering an initial concentration of ferrous sulfate of 18.7 µM, while the Fenton-like process is set based on a ferric sulfate salt concentration of 9.35 µM, giving an initial ferric ion concentration of 18.7 µM. In all the cases, the initial concentrations of the equilibrium products are considered in the simulations when applicable, according to Equations (7) and (8) [8].
[ H S O 4 ] [ H + ] [ S O 4 2 ] = 3.47 × 10 1   M 1
[ F e S O 4 ] [ F e 2 + ] [ S O 4 2 ] = 2.29 × 10 1   M 1
[ F e 3 + ] [ H + ] [ F e O H 2 + ] = 34.48 × 10 1   M 1

3.2.5. Chemical Mechanism in the Electrolyte

Once Fenton’s or the Fenton-like reagent and catalyst are present in the electrolyte, all of the possible reactions expected to occur in the presence of phenol are reported in Table 1.
The chemical kinetics describing the evolution of all of the Fenton-based mechanisms evolving in the electrolyte are set based on the kinetics constant reported in the same table.
Each reaction in Table 1 can be schematized according to Equation (10).
k = 1 K v k i X k   k = 1 K v k i X k
v k i is the stoichiometric coefficient related to the kth species X k within the ith chemical reaction. The kinetics rate related to the ith reaction is expressed as reported in Equation (11).
r i = k i k = 1 K [ C k ] ϑ k i
k i is the kinetic constant related to the ith reaction among the 47 reported in Table 1 and is determined at the operating temperature of 25 °C in the present study.
The kinetics of apparition and the disappearance of a species X k in the electrolyte is governed by Equation (12) for species involved in the electrochemical reactions and by Equation (13) for species that are only implicated in the electrolytic reactions [38].
d [ X k ] d t = ± 1 n V i c o r r F + i = 1 N ( v k i v k i )   k i j = 1 K [ X j ] ϑ j i
d [ X k ] d t = i = 1 N ( v k i v k i )   k i j = 1 K [ X j ] ϑ j i
The system of non-linear differential equations derived from Equations (3) and (10)–(13) is resolved using the fourth-order Runge–Kutta algorithm on Matlab with a fixed step of 1 s.
Table 1. Chemical scheme of the possible reactions occurring in the electrolyte by the Fenton-based processes in the presence of phenol; ki is the absolute reaction constant of the ith reaction. Adapted from [7,39,40,41].
iith Reaction k i Unit   of   k i
1 F e 2 + + H 2 O 2 F e 3 + + O H + H O 6.3 × 10 2 mol 1 . m 3 . s 1
2 F e 3 + + H 2 O 2 F e ( H O 2 ) 2 + + H + 3.1 × 10 4 mol 1 . m 3 . s 1
3 F e ( H O 2 ) 2 + + H + F e 3 + + H 2 O 2 1.0 × 10 7 mol 1 . m 3 . s 1
4 F e ( H O 2 ) 2 + F e 2 + + H O 2 2.3 × 10 3 s 1
5 H 2 O 2 + H O H O 2 + H 2 O 3.3 × 10 4 mol 1 . m 3 . s 1
6 H O 2 O 2 + H + 1.58 × 10 5 s 1
7 O 2 + H + H O 2 1.0 × 10 7 mol 1 . m 3 . s 1
8 F e 2 + + H O F e 3 + + O H 3.2 × 10 5 mol 1 . m 3 . s 1
9 H O 2 + F e 2 + + H 2 O F e 3 + + H 2 O 2 + O H 1.2 × 10 3 mol 1 . m 3 . s 1
10 H O 2 + F e 3 + F e 2 + + H + + O 2 3.6 × 10 2 mol 1 . m 3 . s 1
11 O 2 + F e 2 + + 2 H 2 O F e 3 + + H 2 O 2 + 2   O H 1.0 × 10 4 mol 1 . m 3 . s 1
12 O 2 + F e 3 + F e 2 + + O 2 5.0 × 10 4 mol 1 . m 3 . s 1
13 H O + H O H 2 O 2 5.2 × 10 6 mol 1 . m 3 . s 1
14 H O 2 + H O 2 H 2 O 2 + O 2 8.3 × 10 2 mol 1 . m 3 . s 1
15 O 2 + H + H O 2 1.0 × 10 7 mol 1 . m 3 . s 1
16 H O + H O 2 O 2 + H 2 O 7.1 × 10 6 mol 1 . m 3 . s 1
17 H O + O 2 O 2 + O H 1.01 × 10 7 mol 1 . m 3 . s 1
18 H O 2 + O 2 + H 2 O H 2 O 2 + O 2 + O H 9.7 × 10 4 mol 1 . m 3 . s 1
19 H O 2 + H 2 O 2 O 2 + H O + H 2 O 5.0 × 10 4 mol 1 . m 3 . s 1
20 O 2 + H 2 O 2 O 2 + H O + O H 1.3 × 10 4 mol 1 . m 3 . s 1
21 F e 2 + + S O 4 2 F e S O 4 2.29 × 10 8 mol 1 . m 3 . s 1
22 S O 4 2 + H O S O 4 + O H 1.4 × 10 4 mol 1 . m 3 . s 1
23 H S O 4 + H O S O 4 + H 2 O 3.5 × 10 2 mol 1 . m 3 . s 1
24 S O 4 + H 2 O H + + S O 4 2 + H O 3.0 × 10 5 s 1
25 S O 4 + O H S O 4 2 + H O 1.4 × 10 4 mol 1 . m 3 . s 1
26 S O 4 + H 2 O 2 S O 4 2 + H + + H O 2 1.2 × 10 4 mol 1 . m 3 . s 1
27 S O 4 + H O 2 S O 4 2 + H + + O 2 3.5 × 10 6 mol 1 . m 3 . s 1
28 S O 4 + F e 2 + F e 3 + + S O 4 2 3.0 × 10 5 mol 1 . m 3 . s 1
29 F e S O 4 F e 2 + + S O 4 2 1.0 × 10 10 s 1
30 F e 3 + + H 2 O F e O H 2 + + H + 2.9 × 10 7 s 1
31 F e O H 2 + + H + F e 3 + + H 2 O 1.0 × 10 7 mol 1 . m 3 . s 1
32 F e O H 2 + + H 2 O 2 F e ( O H ) H O 2 + + H + 2.0 × 10 3 mol 1 . m 3 . s 1
33 F e ( O H ) H O 2 + + H + F e O H 2 + + H 2 O 2 1.0 × 10 7 mol 1 . m 3 . s 1
34 F e ( O H ) H O 2 + F e 2 + + H O 2 + O H 2.3 × 10 3 s 1
35 P h + H O D H C D 7.3 × 10 6 mol 1 . m 3 . s 1
36 D H C D + H + P h + H 2 O 5.0 × 10 5 mol 1 . m 3 . s 1
37 D H C D + O 2 C C + H O 2 1.5 × 10 6 mol 1 . m 3 . s 1
38 D H C D + O 2 H Q + H O 2 5.0 × 10 5 mol 1 . m 3 . s 1
39 D H C D + O 2 B Q + H O 2 5.0 × 10 5 mol 1 . m 3 . s 1
40 D H C D + B Q P h + C C + H Q 3.7 × 10 6 mol 1 . m 3 . s 1
41 2 D H C D P h + C C 5.0 × 10 5 mol 1 . m 3 . s 1
42 2 D H C D products 5.0 × 10 5 mol 1 . m 3 . s 1
43 D H C D + P h products 5.0 × 10 5 mol 1 . m 3 . s 1
44 D H C D + P h P h + C C + H Q 5.0 × 10 5 mol 1 . m 3 . s 1
45 P h + P h products 1.0 × 10 6 mol 1 . m 3 . s 1
46 B Q + O 2 H P H + O 2 1.0 × 10 6 mol 1 . m 3 . s 1
47 C C + H O products 1.1 × 10 7 mol 1 . m 3 . s 1
48 H Q + H O products 5.0 × 10 6 mol 1 . m 3 . s 1
49 B Q + H O products 1.2 × 10 6 mol 1 . m 3 . s 1
PH: phenol, C6H6O. DHCD•: dihydroxy cyclohexadienyl radical, C12H16O3. PH•: phenyl radical, C6H5. HPH•: hydroxyphenyl radical, C6H4OH. CC: catechol, C6H6O2. HQ: hydroquinone, C6H6O2. BQ: benzoquinone C6H4O2.

4. Conclusions

The present paper aimed to numerically access the performance of the Galvano-Fenton process based on an initial “basic” version and an upgraded “novel” version while integrating a pre-immersion time.
The comparison of the “basic” Galvano-Fenton process to classic Fenton, electro-Fenton, and Fenton-like techniques revealed that both the electro-Fenton and Galvano-Fenton processes present similar quasi-linear trends for the evolution of the concentration of F e 3 + . The spontaneous galvanic generation of F e 2 + in the Galvano-Fenton process leads to a higher F e 2 + + H 2 O 2 F e 3 + + O H + H O reaction rate compared to the electro-Fenton process, which leads to a higher instantaneous concentration of F e 3 + . Moreover, during the first stage, the Fenton-like, the Galvano-Fenton, and the electro-Fenton processes showed a gradual increase in HO production. The electro-Fenton presented the slowest process among the three.
The integration of the 5 min pre-immersion stage allowed the acceleration of the start-up phase of the process and the overcoming of the barrier of the null degradation rate at the initial instant. This resulted in the instantaneous apparition of free radicals as soon as the Fenton reagent was added. The largest difference in terms of the concentration of free radicals was noticed during the first minute of both basic and upgraded processes.
Particular attention was paid to the ratio of the degradation efficiency to the released energy. The Galvano-Fenton process demonstrated a higher performance by reaching 1.34% of the degradation efficiency per released J. This was associated with the generation of hydroxyl radicals of 0.047 nM/released J, with initial concentrations of hydrogen peroxide and phenol of 0.187 mM and 2 µM, respectively. The electro-Fenton process, however, proved to degrade 1.05% for each consumed joule. Overall, both configurations of the Galvano-Fenton process, which were treated as energetic systems, were characterized by a higher performance added to an energy release, while the electro-Fenton process not only shows a lower performance but also shows lower energy consumption.

Author Contributions

K.K.: conceptualization, methodology, software, validation, formal analysis, investigation, writing—original draft preparation, and writing—review and editing; O.H.: supervision, conceptualization, methodology, project administration, resources, funding acquisition, investigation, validation, and writing—review and editing; N.H.: investigation, validation, methodology, supervision, and writing—review and editing; A.A.: visualization, validation, and writing—review and editing. All authors have read and agreed to the published version of the manuscript.

Funding

This work was financially supported by the “Hubert Curien Program” through the PHC MAGHREB Project number 19MAG23/41382WC, the Deep Tech Innovation Incubator of Lyon and Saint-Etienne PULSALYS and the Deanship of Scientific Research at King Saud University through research group No. RG-1441-501.

Data Availability Statement

Not applicable.

Acknowledgments

The authors extend their appreciation to the Deanship of Scientific Research at King Saud University for the funding of this work through research group No. RG-1441-501.

Conflicts of Interest

The authors declare no conflict of interest.

References

  1. Thomas, N.; Dionysiou, D.D.; Pillai, S.C. Heterogeneous Fenton catalysts: A review of recent advances. J. Hazard. Mater. 2021, 404, 124082. [Google Scholar] [CrossRef]
  2. Tagg, A.S.; Harrison, J.P.; Ju-Nam, Y.; Sapp, M.; Bradley, E.L.; Sinclair, C.J.; Ojeda, J.J. Fenton’s reagent for the rapid and efficient isolation of microplastics from wastewater. Chem. Commun. 2017, 53, 372–375. [Google Scholar] [CrossRef] [Green Version]
  3. Enami, S.; Sakamoto, Y.; Colussi, A.J. Fenton chemistry at aqueous interfaces. Proc. Natl. Acad. Sci. USA 2014, 111, 623–628. [Google Scholar] [CrossRef] [Green Version]
  4. Sarmento, A.P.; Borges, A.C.; de Matos, A.T.; Romualdo, L.L. Phenol degradation by Fenton-like process. Environ. Sci. Pollut. Res. 2016, 23, 18429–18438. [Google Scholar] [CrossRef] [PubMed]
  5. Sirés, I.; Brillas, E.; Oturan, M.A.; Rodrigo, M.A.; Panizza, M. Electrochemical advanced oxidation processes: Today and tomorrow. A review. Environ. Sci. Pollut. Res. 2014, 21, 8336–8367. [Google Scholar] [CrossRef] [PubMed]
  6. De Laat, J.; Truong Le, G.; Legube, B. A comparative study of the effects of chloride, sulfate and nitrate ions on the rates of decomposition of H2O2 and organic compounds by Fe(II)/H2O2 and Fe(III)/H2O2. Chemosphere 2004, 55, 715–723. [Google Scholar] [CrossRef] [PubMed]
  7. De Laat, J.; Le, T.G. Effects of chloride ions on the iron(III)-catalyzed decomposition of hydrogen peroxide and on the efficiency of the Fenton-like oxidation process. Appl. Catal. B Environ. 2006, 66, 137–146. [Google Scholar] [CrossRef]
  8. De Laat, J.; Gallard, H. Catalytic decomposition of hydrogen peroxide by Fe(III) in homogeneous aqueous solution: Mechanism and kinetic modeling. Environ. Sci. Technol. 1999, 33, 2726–2732. [Google Scholar] [CrossRef]
  9. Madhavan, J.; Grieser, F.; Ashokkumar, M. Combined advanced oxidation processes for the synergistic degradation of ibuprofen in aqueous environments. J. Hazard. Mater. 2010, 178, 202–208. [Google Scholar] [CrossRef]
  10. Martins, A.F.; Wilde, M.L.; Vasconcelos, T.G.; Henriques, D.M. Nonylphenol polyethoxylate degradation by means of electrocoagulation and electrochemical Fenton. Sep. Purif. Technol. 2006, 50, 249–255. [Google Scholar] [CrossRef]
  11. Tarkwa, J.B.; Oturan, N.; Acayanka, E.; Laminsi, S.; Oturan, M.A. Photo-Fenton oxidation of Orange G azo dye: Process optimization and mineralization mechanism. Environ. Chem. Lett. 2019, 17, 473–479. [Google Scholar] [CrossRef]
  12. Lu, M.; Wang, J.; Wang, Y.; He, Z. Heterogeneous photo-fenton catalytic degradation of practical pharmaceutical wastewater by modified attapulgite supported multi-metal oxides. Water 2021, 13, 156. [Google Scholar] [CrossRef]
  13. Monteil, H.; Péchaud, Y.; Oturan, N.; Oturan, M.A. A review on efficiency and cost effectiveness of electro- and bio-electro-Fenton processes: Application to the treatment of pharmaceutical pollutants in water. Chem. Eng. J. 2019, 376, 119577. [Google Scholar] [CrossRef]
  14. Nidheesh, P.V. Heterogeneous Fenton catalysts for the abatement of organic pollutants from aqueous solution: A review. RSC Adv. 2015, 5, 40552–40577. [Google Scholar] [CrossRef]
  15. Cihanoǧlu, A.; Gündüz, G.; Dükkanci, M. Influence of ultrasound on the heterogeneous Fenton-like oxidation of acetic acid. Water Sci. Technol. 2017, 76, 2793–2801. [Google Scholar] [CrossRef]
  16. Poza-Nogueiras, V.; Rosales, E.; Pazos, M.; Sanromán, M.Á. Current advances and trends in electro-Fenton process using heterogeneous catalysts—A review. Chemosphere 2018, 201, 399–416. [Google Scholar] [CrossRef] [PubMed]
  17. Lin, S.S.; Gurol, M.D. Catalytic decomposition of hydrogen peroxide on iron oxide: Kinetics, mechanism, and implications. Environ. Sci. Technol. 1998, 32, 1417–1423. [Google Scholar] [CrossRef]
  18. He, J.; Yang, X.; Men, B.; Wang, D. Interfacial mechanisms of heterogeneous Fenton reactions catalyzed by iron-based materials: A review. J. Environ. Sci. 2016, 39, 97–109. [Google Scholar] [CrossRef]
  19. Hartmann, M.; Kullmann, S.; Keller, H. Wastewater treatment with heterogeneous Fenton-type catalysts based on porous materials. J. Mater. Chem. 2010, 20, 9002–9017. [Google Scholar] [CrossRef]
  20. Ramirez, J.H.; Maldonado-Hódar, F.J.; Pérez-Cadenas, A.F.; Moreno-Castilla, C.; Costa, C.A.; Madeira, L.M. Azo-dye Orange II degradation by heterogeneous Fenton-like reaction using carbon-Fe catalysts. Appl. Catal. B Environ. 2007, 75, 312–323. [Google Scholar] [CrossRef]
  21. Bremner, D.H.; Burgess, A.E.; Houllemare, D.; Namkung, K.C. Phenol degradation using hydroxyl radicals generated from zero-valent iron and hydrogen peroxide. Appl. Catal. B Environ. 2006, 63, 15–19. [Google Scholar] [CrossRef]
  22. GilPavas, E.; Correa-Sánchez, S.; Acosta, D.A. Using scrap zero valent iron to replace dissolved iron in the Fenton process for textile wastewater treatment: Optimization and assessment of toxicity and biodegradability. Environ. Pollut. 2019, 252, 1709–1718. [Google Scholar] [CrossRef]
  23. Rezaei, F.; Vione, D. Effect of pH on zero valent iron performance in heterogeneous Fenton and Fenton-like processes: A review. Molecules 2018, 23, 3127. [Google Scholar] [CrossRef] [PubMed] [Green Version]
  24. Zhou, T.; Li, Y.; Ji, J.; Wong, F.S.; Lu, X. Oxidation of 4-chlorophenol in a heterogeneous zero valent iron/H2O2 Fenton-like system: Kinetic, pathway and effect factors. Sep. Purif. Technol. 2008, 62, 551–558. [Google Scholar] [CrossRef]
  25. Haddour, N.; Kherrat, R. Procédé de Traitement d’un Effluent Liquide Comprenant un Polluant Organique, Assurant la Production D’énergie Électrique et Dispositif Associé. Patent WO2016097601, 18 December 2014. [Google Scholar]
  26. Gasmi, I.; Kerboua, K.; Haddour, N.; Hamdaoui, O.; Alghyamah, A.; Buret, F. Kinetic pathways of iron electrode transformations in Galvano-Fenton process: A mechanistic investigation of in-situ catalyst formation and regeneration. J. Taiwan Inst. Chem. Eng. 2020, 116, 81–91. [Google Scholar] [CrossRef]
  27. Gasmi, I.; Kerboua, K.; Haddour, N.; Hamdaoui, O.; Alghyamah, A.; Buret, F. The Galvano-Fenton process: Experimental insights and numerical mechanistic investigation applied to the degradation of acid orange 7. Electrochim. Acta 2021, 373. [Google Scholar] [CrossRef]
  28. Cook, W.G.; Olive, R.P. Pourbaix diagrams for the iron-water system extended to high-subcritical and low-supercritical conditions. Corros. Sci. 2012, 55, 326–331. [Google Scholar] [CrossRef]
  29. Wang, X.; Liu, C.; Li, X.; Li, F.; Zhou, S. Photodegradation of 2-mercaptobenzothiazole in the γ-Fe2O3/oxalate suspension under UVA light irradiation. J. Hazard. Mater. 2008, 153, 426–433. [Google Scholar] [CrossRef]
  30. Chen, H.Y. Why the Reactive Oxygen Species of the Fenton Reaction Switches from Oxoiron(IV) Species to Hydroxyl Radical in Phosphate Buffer Solutions? A Computational Rationale. ACS Omega 2019, 4, 14105–14113. [Google Scholar] [CrossRef] [Green Version]
  31. Gasmi, I.; Haddour, N.; Hamdaoui, O.; Kerboua, K.; Alghyamah, A.; Buret, F. A Novel Energy-from-Waste Approach for Electrical Energy Production by Galvano—Fenton Process. Molecules 2021, 26, 4013. [Google Scholar] [CrossRef]
  32. Ahmad, Z. Corrosion kinetics. In Principles of Corrosion Engineering and Corrosion Control; Butterworth-Heinemann: Oxford, UK, 2006; pp. 57–119. [Google Scholar] [CrossRef]
  33. Xing, W.; Yin, M.; Lv, Q.; Hu, Y.; Liu, C.; Zhang, J. Oxygen Solubility, Diffusion Coefficient, and Solution Viscosity. In Rotating Electrode Methods and Oxygen Reduction Electrocatalysts; Elsevier: Amsterdam, The Netherlands, 2014; pp. 1–31. [Google Scholar] [CrossRef]
  34. Ghanbari, F.; Moradi, M. A comparative study of electrocoagulation, electrochemical Fenton, electro-Fenton and peroxi-coagulation for decolorization of real textile wastewater: Electrical energy consumption and biodegradability improvement. J. Environ. Chem. Eng. 2015, 3, 499–506. [Google Scholar] [CrossRef]
  35. Qiu, S.; He, D.; Ma, J.; Liu, T.; Waite, T.D. Kinetic Modeling of the Electro-Fenton Process: Quantification of Reactive Oxygen Species Generation. Electrochim. Acta 2015, 176, 51–58. [Google Scholar] [CrossRef] [Green Version]
  36. Thirugnanasambandham, K.; Kandasamy, S.; Sivakumar, V.; Kumar, R.K.; Mohanavelu, R. Modeling of by-product recovery and performance evaluation of Electro-Fenton treatment technique to treat poultry wastewater. J. Taiwan Inst. Chem. Eng. 2015, 46, 89–97. [Google Scholar] [CrossRef]
  37. Ting, W.; Lu, M.; Huang, Y. The reactor design and comparison of Fenton, electro-Fenton and photoelectro-Fenton processes for mineralization of benzene sulfonic acid (BSA). J. Hazard. Mater. 2008, 156, 421–427. [Google Scholar] [CrossRef] [PubMed]
  38. Davis, R.J. The Basics of Reaction Kinetics for Chemical Reaction Engineering. In Fundamentals of Chemical Reaction Engineering; McGraw Hill: New York, NY, USA, 2003; pp. 1–52. Available online: http://resolver.caltech.edu/CaltechBOOK:2003.001 (accessed on 1 August 2021).
  39. Koprivanac, N.; Loň, A. Photo-assisted Fenton type processes for the degradation of phenol: A kinetic study. J. Hazard. Mater. 2006, 136, 632–644. [Google Scholar] [CrossRef]
  40. Bray, W.C. The mechanism of reactions in aqueous solution Examples Involving Equilibria and Steady States. Chem. Rev. 1931, 10, 161–177. [Google Scholar] [CrossRef]
  41. Machulek, A., Jr.; Moraes, J.E.F.; Okano, L.T.; Silvério, C.A.; Quina, F.H. Photolysis of ferric ions in the presence of sulfate or chloride ions: Implications for the photo-Fenton process. Photochem. Photobiol. Sci. 2009, 8, 985–991. [Google Scholar] [CrossRef]
Figure 1. Basic reactional mechanisms describing classic Fenton (a), Fenton-like (b), electro-Fenton (c), and Galvano-Fenton (d) processes.
Catalysts 11 00943 g001
Figure 2. Evolutions of the F e 2 + (a) and F e 3 + (b) concentrations and the pH of the electrolyte (c) in a function of time with classic Fenton, Fenton-like, electro-Fenton, and Galvano-Fenton processes in the presence of phenol at 2 µM.
Catalysts 11 00943 g002
Figure 3. Evolutions of H O concentration in a function of time with classic Fenton, Fenton-like, electro-Fenton, and Galvano-Fenton processes in the presence of phenol at 2 µM.
Catalysts 11 00943 g003
Figure 4. Evolution of the concentration of phenol in function of time with classic Fenton, Fenton-like, electro-Fenton, and Galvano-Fenton processes with an initial phenol concentration of 2 µM.
Catalysts 11 00943 g004
Figure 5. Comparison of Galvano-Fenton and Galvano-Fenton with pre-immersion time in terms of phenol degradation and hydrogen peroxide consumption (a) and the evolution of the concentrations of ferrous and ferric ions (b).
Catalysts 11 00943 g005
Figure 6. Comparison of the Galvano-Fenton and the Galvano Fenton with pre-immersion in terms of the concentrations of free radicals.
Catalysts 11 00943 g006
Figure 7. Kinetics of the formation of intermediate species from the degradation of phenol in the Galvano-Fenton process (a) and the Galvano-Fenton process with pre-immersion time (b).
Catalysts 11 00943 g007
Figure 8. Schematic illustration of the production mechanism of the hydroxyl radical and phenol degradation until mineralization through the Galvano Fenton process without and with the pre-immersion stage.
Catalysts 11 00943 g008
Figure 9. Polarization curves of the Fe-Cu galvanic cell within the Galvano-Fenton process in the presence of H2O2 (a) and ratios of the HO yield (b) and phenol degradation percentage (c) to the consumed or released energy.
Catalysts 11 00943 g009
Figure 10. Degradation kinetics of phenol considering three different initial concentrations of phenol (2, 20 and 105.4 µM) and hydrogen peroxide (0.559, 0.373, and 0.187 mM) in the Galvano-Fenton process (ac) and in the Galvano-Fenton process with pre-immersion time (df).
Catalysts 11 00943 g010
Figure 11. Considered configuration in the modeling of the Galvano-Fenton process.
Catalysts 11 00943 g011
Publisher’s Note: MDPI stays neutral with regard to jurisdictional claims in published maps and institutional affiliations.

