Article

Turbidity Changes during Carbamazepine Oxidation by Photo-Fenton

by
Natalia Villota
1,*,
Cristian Ferreiro
2,
Hussein A. Qulatein
3,
Jose M. Lomas
1 and
Jose Ignacio Lombraña
2
1
Department of Environmental and Chemical Engineering, Faculty of Engineering of Vitoria-Gasteiz, University of the Basque Country, UPV/EHU, 01006 Vitoria-Gasteiz, Spain
2
Department of Chemical Engineering, Faculty of Science and Technology, University of the Basque Country, UPV/EHU, 48940 Leioa, Spain
3
Department of Chemical Engineering, Faculty of Engineering, Anadolu University, 26470 Eskişehir, Turkey
*
Author to whom correspondence should be addressed.
Catalysts 2021, 11(8), 894; https://doi.org/10.3390/catal11080894
Submission received: 25 June 2021 / Revised: 20 July 2021 / Accepted: 21 July 2021 / Published: 24 July 2021

Abstract

:
The objective of this study is to evaluate the turbidity generated during the Fenton photo-reaction applied to the oxidation of waters containing carbamazepine as a function of factors such as pH, H2O2 concentration and catalyst dosage. The results let establish the degradation pathways and the main decomposition byproducts. It is found that the pH affects the turbidity of the water. Working between pH = 2.0 and 2.5, the turbidity is under 1 NTU due to the fact that iron, added as a catalyst, is in the form of a ferrous ion. Operating at pH values above 3.0, the iron species in their oxidized state (mainly ferric hydroxide in suspension) would cause turbidity. The contribution of these ferric species is a function of the concentration of iron added to the process, verifying that the turbidity increases linearly according to a ratio of 0.616 NTU L/mg Fe. Performing with oxidant concentrations at (H2O2) = 2.0 mM, the turbidity undergoes a strong increase until reaching values around 98 NTU in the steady state. High turbidity levels can be originated by the formation of coordination complexes, consisting of the union of three molecules containing substituted carboxylic groups (BaQD), which act as ligands towards an iron atom with Fe3+ oxidation state.

1. Introduction

Over the last decade, special attention has been paid to the presence in waters (in relation to both their distribution and concentration) of certain organic compounds that, until now, had not been considered significant dangerous species. This is related to the improvement of analytical technique, as formerly undetected organic components are being more widely observed, considering that they have the potential to cause adverse effects both environmentally and in living beings [1].
Specifically, preventive measures are being adopted to control the emissions of pharmaceutically active products (PhACs) on environmental systems due to the harmful impacts that they can cause both on aquatic life and on human health [2] because they are recalcitrant compounds that generate toxicity [3,4]. The frequent presence of PhACs in freshwater and wastewater has promoted the establishment of water quality standards for periodic monitoring [5]. Thus, carbamazepine (CBZ) is proposed as an anthropogenic marker of water contamination, caused by its persistence in conventional water treatment plants, also being perceptible in some freshwater systems [6,7,8].
CBZ is an anticonvulsive and mood-stabilizing drug, which is used primarily in the treatment of epilepsy and bipolar disorder [9]. After consumption, around 10% of CBZ is excreted from the human body [10]. Besides, CBZ is the main cause of Stevens–Johnson syndrome that can cause toxic epidermal necrolysis [11]. This skin condition is potentially fatal, with a mortality rate of 30%, in which cell death causes the epidermis to separate from the dermis [12]. On the other hand, intrauterine exposure to CBZ is associated with a congenital defect of the spine and spinal cord, spina bifida [13] and problems with the neurodevelopmental embryo [14]. Moreover, higher fetal losses, as well as congenital malformation rates, have been reported among women consuming carbamazepine during pregnancy [15]. For these reasons, the presence of CBZ in drinking water and some groundwater is a cause for concern since it constitutes a risk factor as a possible route of access to the embryo and the infant through intrauterine exposure or breastfeeding.
A large part of the PhACs reach the wastewater through human body excretion and, if they are not effectively eliminated in the water treatment plants (WWTPs), both the effluent and the sludge lead to an important source of spreading PhACs in the environment [16,17]. In particular, conventional wastewater treatment plants remove less than 10% of the CBZ contained in the input influents [18,19,20]. Thus, WWTP effluents are an important gateway for CBZ accessing surface and groundwater. In general, the concentration of CBZ is higher in WWTPs than in exterior waters because the dilution phenomena and natural attenuation significantly reduce the concentration of these pollutants [21].
The need to effectively eliminate PhACs has promoted Advanced Oxidation Processes, known as AOPs [22]. Among the AOPs with the greatest applications stand out the technologies based on oxidation with ozone [23], electrochemical oxidation, photocatalysis based on the use of UV and Fenton processes [24] and photo-Fenton [25,26]. However, it should be noted that the oxidation with ozone, although highly reactive with organic compounds that have olefins or amines in their internal structure, is less effective when applied in the degradation of the CBZ and ibuprofen [27,28]. In electrochemical oxidation, the materials making up the electrodes are a limiting factor for industrial application. Besides, Fenton-like processes produce hydroxyl radicals, which are strong oxidizing agents capable of degrading a wide range of polluting organic compounds. However, the traditional Fenton reagent requires a continuous supply of Fe2+, which produces an excess of iron in the generated sludge [29]. To alleviate this drawback, this work applies photo-Fenton technology since UV light increases the efficiency of the process. Therefore, the concentrations of Fe (II) utilized can be much smaller than in the conventional Fenton reaction.
This study evaluates the Fenton photo-reaction applied to the degradation of CBZ as a function of several factors, such as pH, hydrogen peroxide concentration and catalyst dosage. Experimental assays allow checking that during the oxidation treatment, the treated waters acquire high levels of turbidity depending on the operating conditions used in the tests. In this way, the aim of this work has been to establish the causes of turbidity in the treated water and the factors that affect it, relating the formation of turbidity with the degradation pathways and the main decomposition byproducts causing turbidity. Several references reported in the bibliography have studied the photo-Fenton treatment applied to carbamazepine degradation in domestic wastewater [30]. In general, the main objectives of these works are based on the intensification of ultraviolet technology combined with other AOPs as iron complexes or ultrasound waves [27,31] and the use of solar light improving the operational cost [32,33]. However, the novelty of this work is to analyze and establish the selectivity of the degradative routes of CBZ to water-turbidity generation as a function of the operating conditions.

2. Results

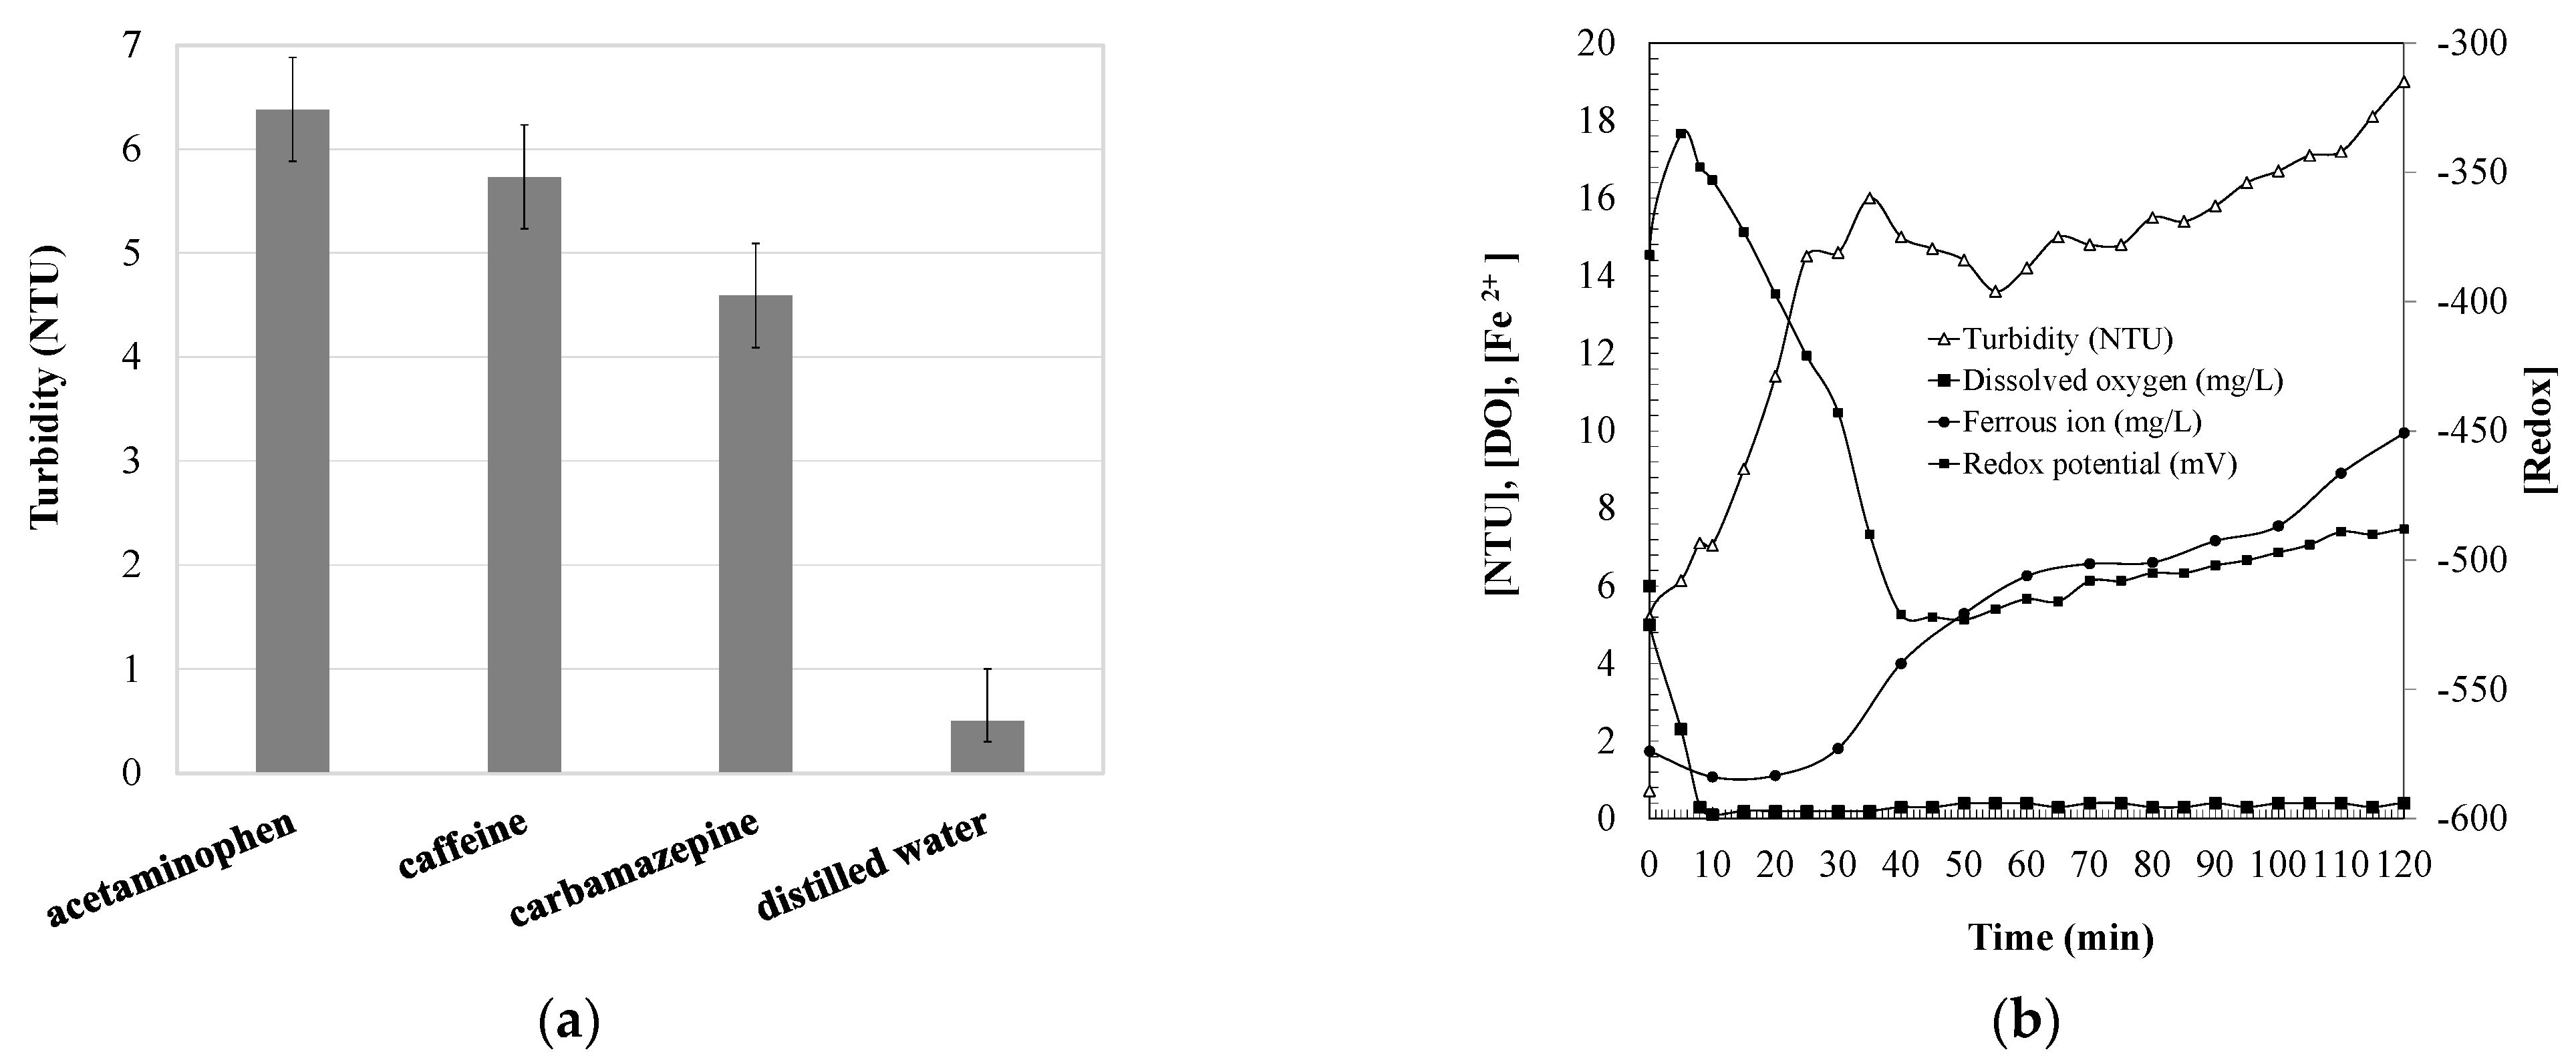
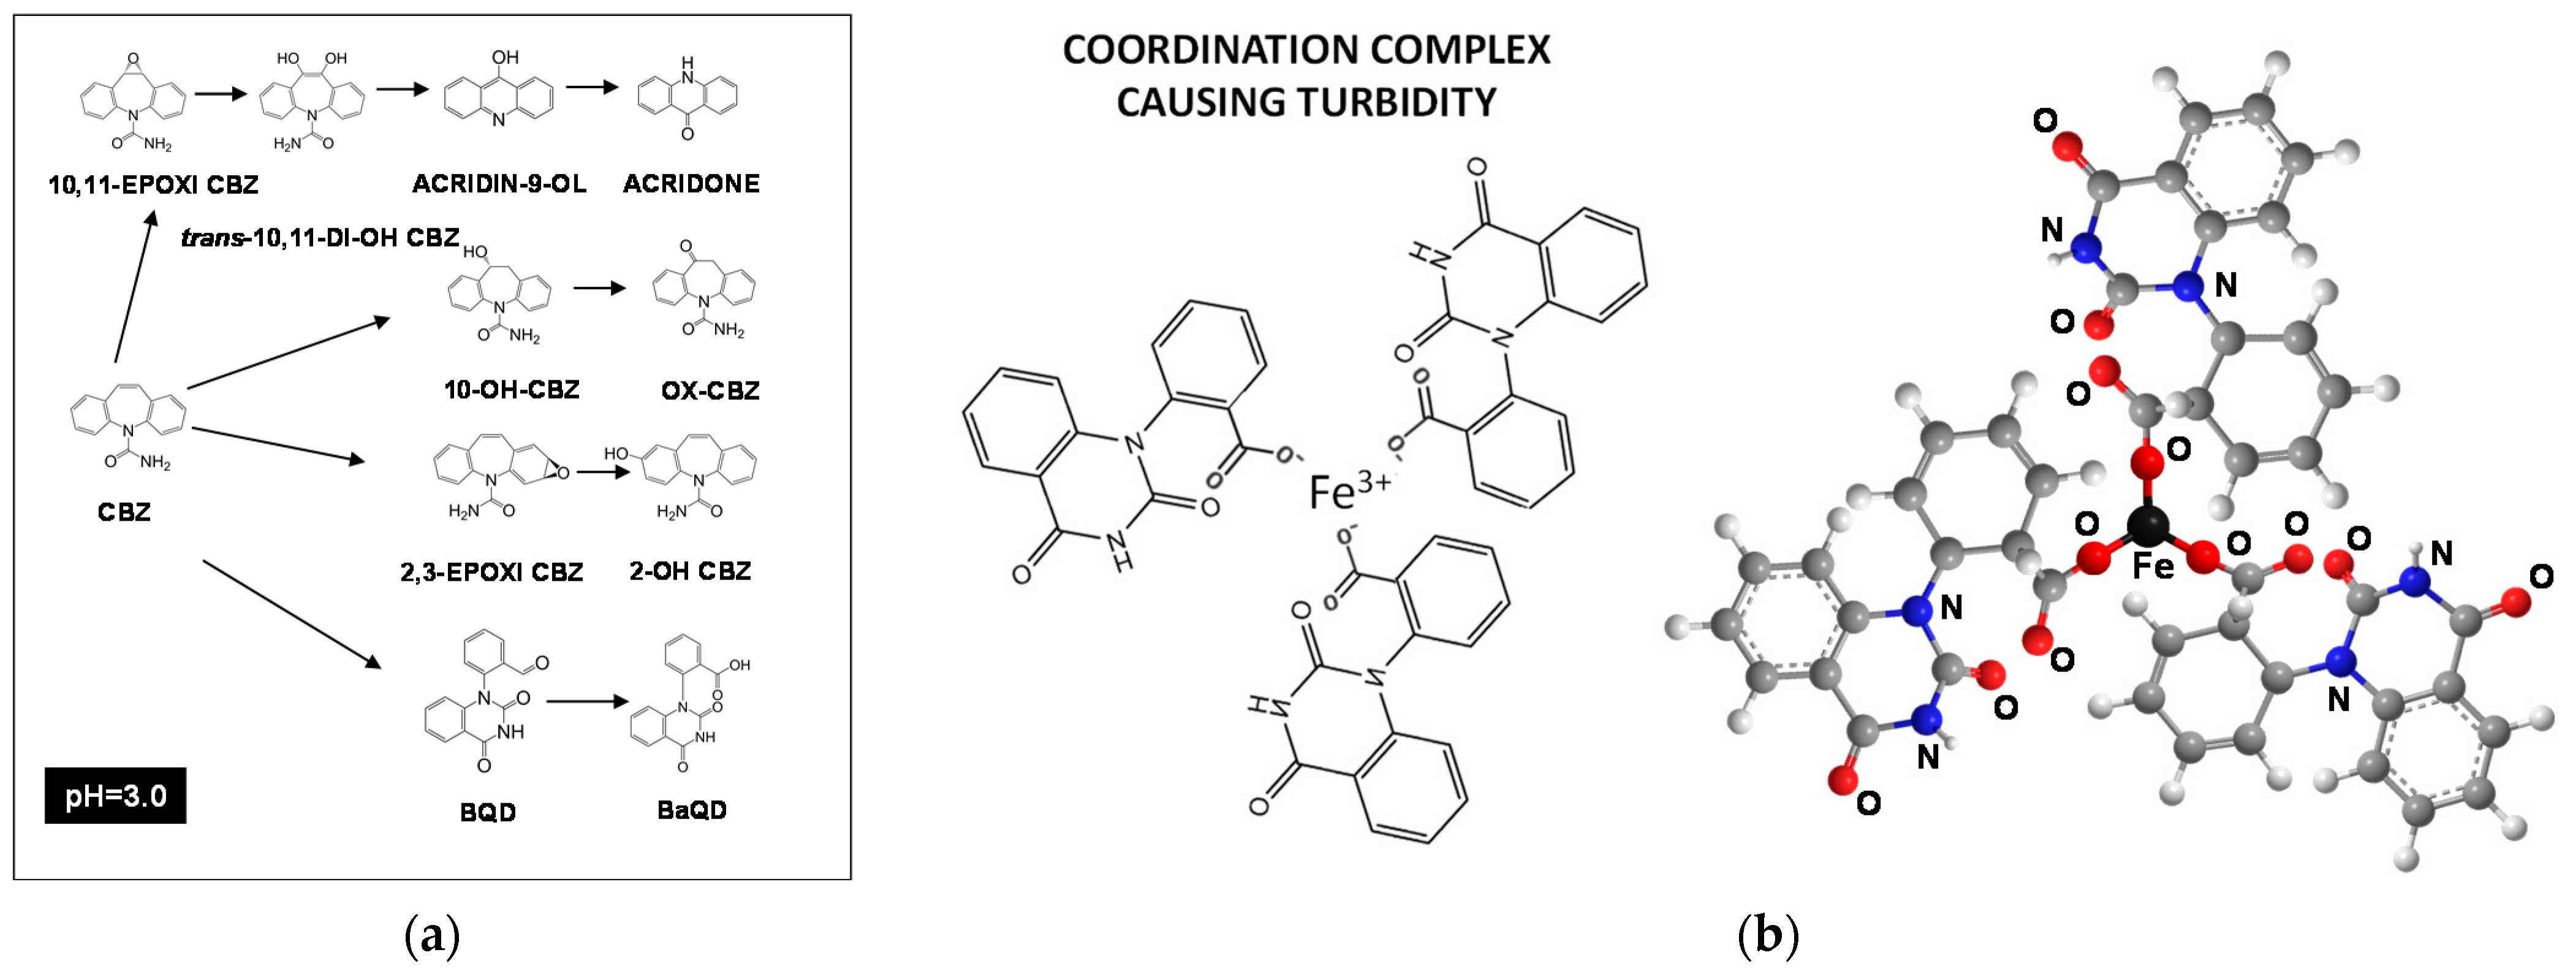
2.1. Turbidity Changes during Carbamazepine Oxidation
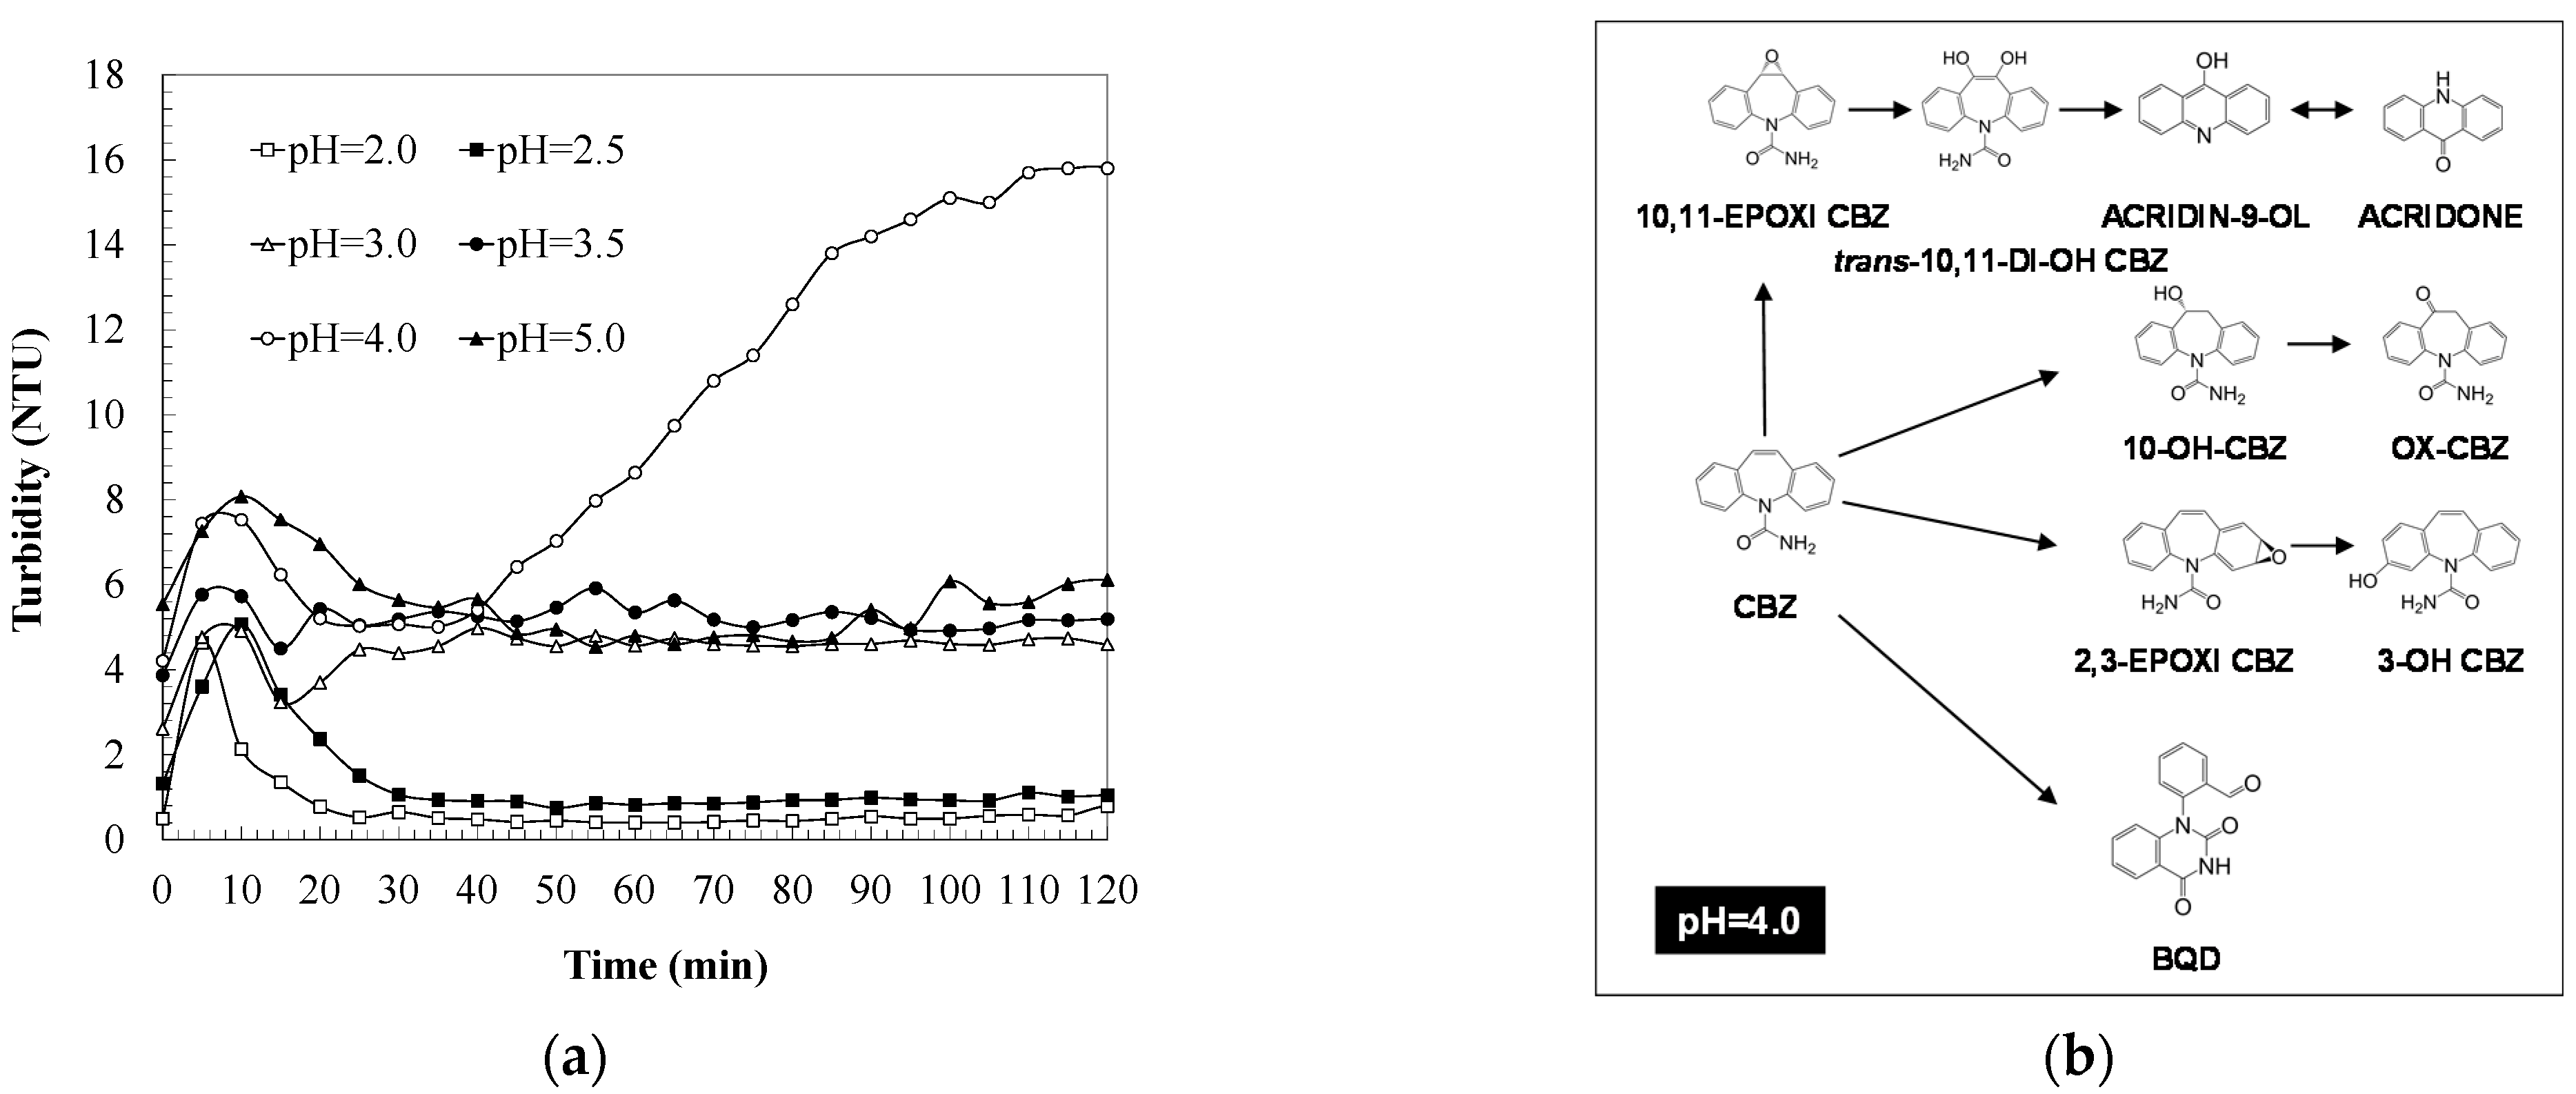
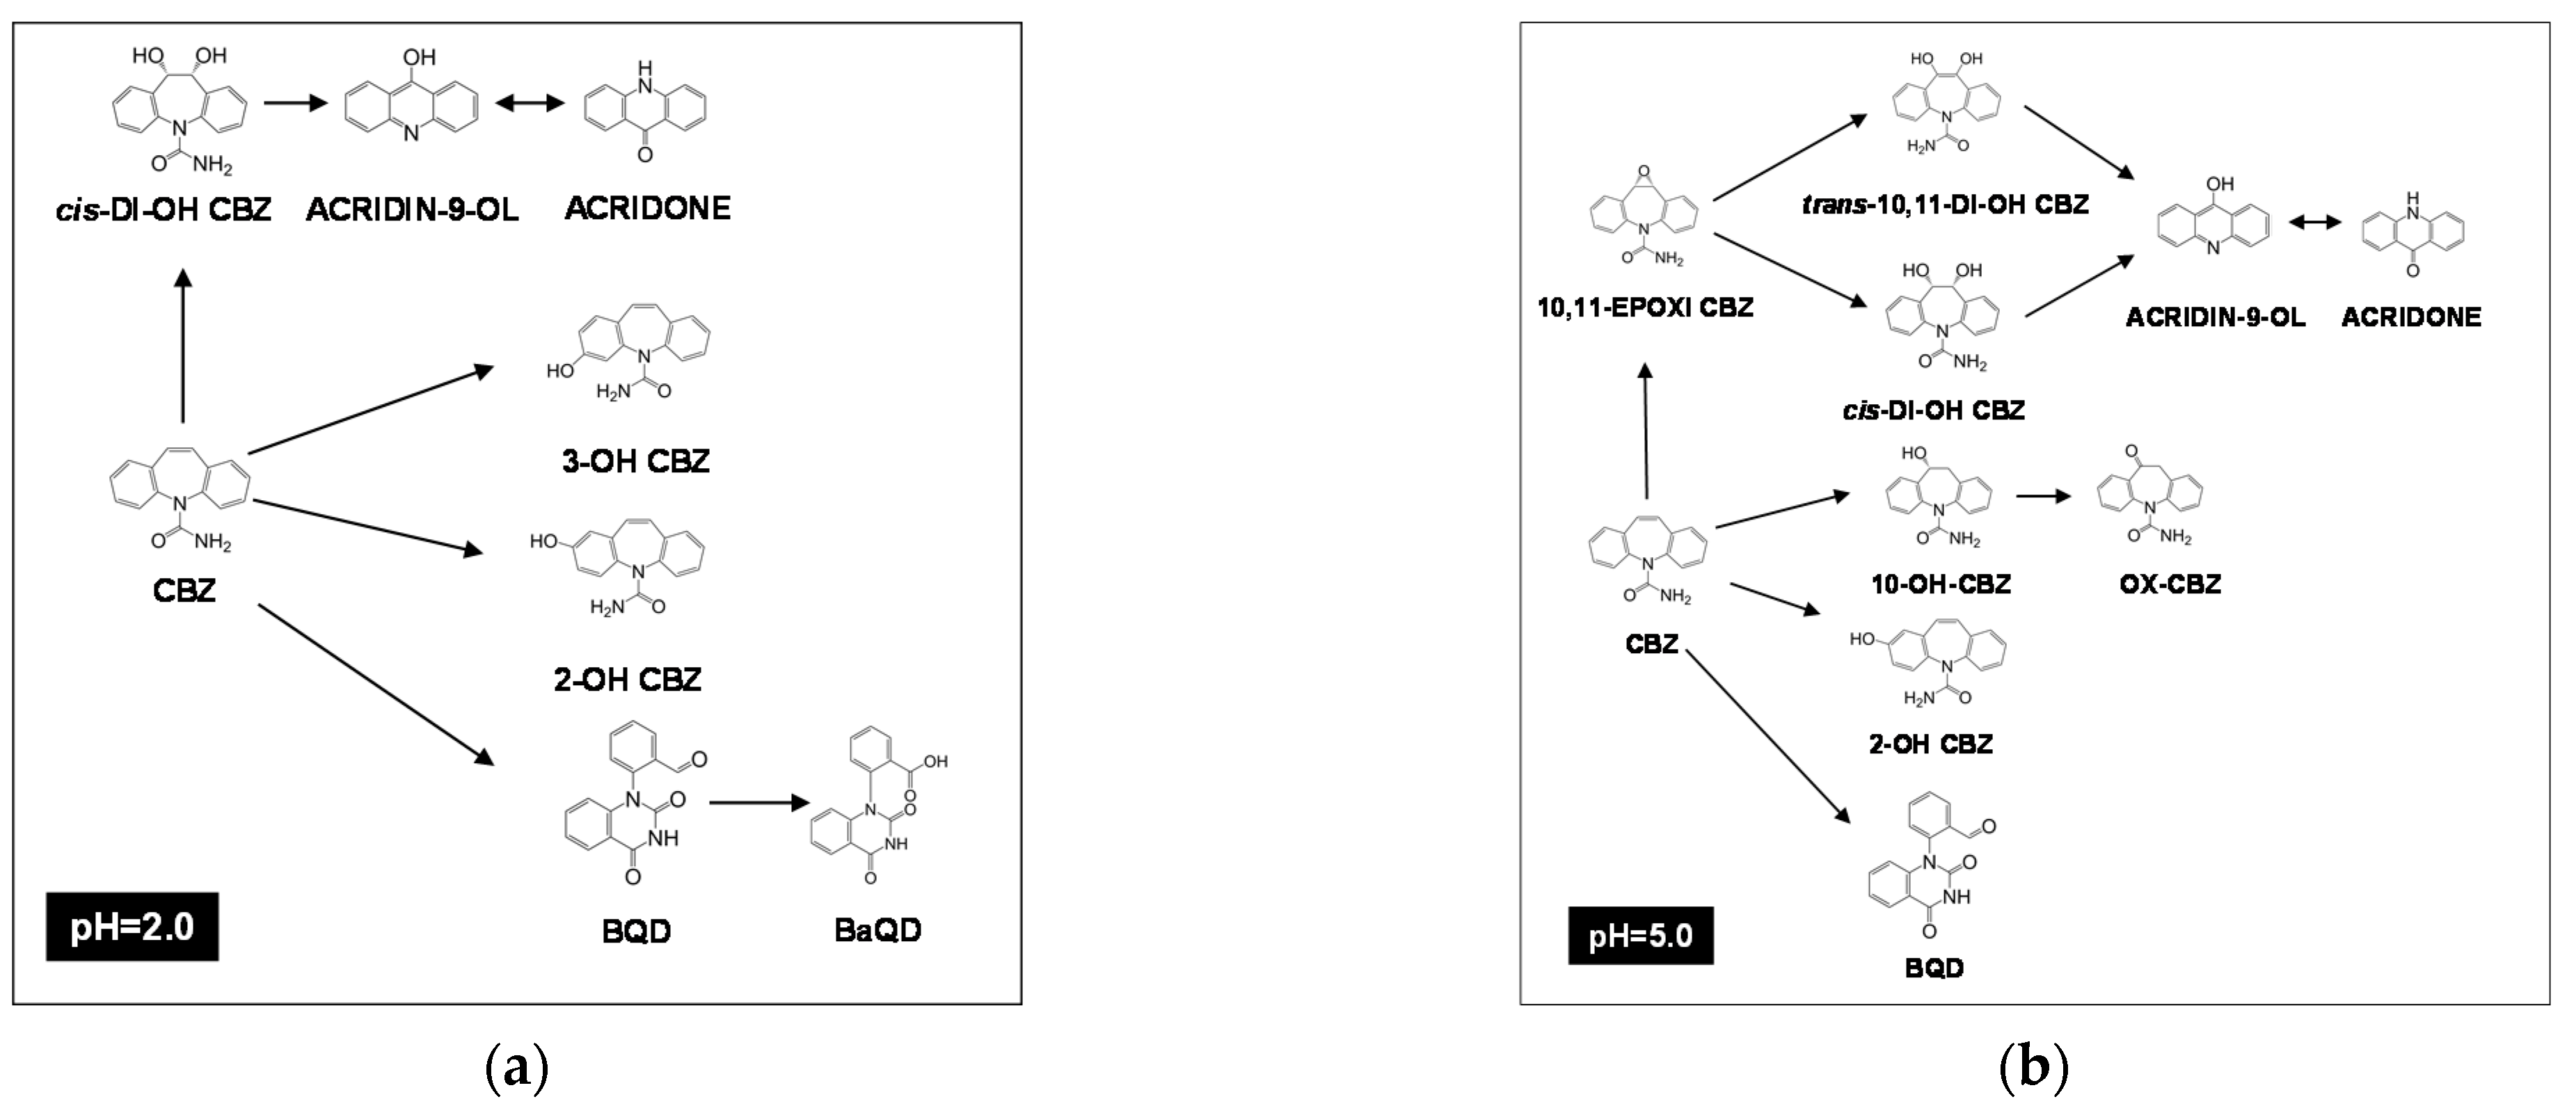
During the degradation of aqueous solutions containing different drugs, using a photo-Fenton process, it is found that turbidity appears in the treated water (see Figure 1a). The turbidity control of the water is closely related to the effectiveness of the disinfection processes, both chemical (chlorine or other biocides) and physical (UV radiation). This is due to the particles causing turbidity, which reduce the efficiency of the processes of chlorination in the elimination of pathogenic organisms, since they physically protect microorganisms from direct contact with the disinfectant. Although the direct effects of turbidity on health are not known yet, it affects the organoleptic properties of the water, which is why it often causes the rejection of consumers.
As shown in Figure 1a, the turbidity generated is a function of the type of pollutant that the water contains, as well as the operating conditions used in the oxidation treatment. Comparing these results with those shown in Figure 1b for the case of carbamazepine oxidation, when carrying out photo-oxidation using oxidant concentrations (H2O2) = 15.0 mM, the oxidized water presents turbidity levels of 4.6 NTU. Meanwhile, when using (H2O2) = 2.0 mM, the turbidity of the water increases to levels of 19.0 NTU after 120 min of reaction. For this reason, it is necessary to perform specific studies for each kind of effluent, since the turbidity will be determined by the presence of PhACs contained in the water, as a consequence of the human activities in the emission sources.
Globally, the World Health Organization (WHO) Quality Guidelines for Water for Human Consumption recommends a maximum of 5 NTU as a reference value, although the WHO indicates that, to achieve efficient disinfection, the water must have average turbidity lower than or equal to 1 NTU. Considering Spain, turbidity is a parameter included in current regulations, where its maximum permitted limits are regulated in Royal Decree 140/2003 [34] on hygienic–sanitary criteria of water for human consumption and Royal Decree 1620/2007 [35] on reuse of purified waters.
On the other hand, Figure 1b represents turbidity as a function of other signs of water quality, such as the redox potential and the concentrations of ferrous ion and dissolved oxygen. As displayed, the results do not indicate a direct relationship with the formation of turbidity. Thus, a more in-depth analysis is necessary to estimate the effect of the main operating parameters of the photo-Fenton treatment on the formation of turbidity. In this work, pH, oxidant and catalyst dosage are considered.

2.2. pH Effect

Figure 2a shows the changes in turbidity of the aqueous solutions containing CBZ during their degradation, using the photo-Fenton process, where the pH of each test varied between pH = 2.0 and 5.0. It should be noted that the pH value has remained constant throughout the reaction. These results let verify that acidity affects the formation of turbidity in the water. However, its formation does not follow a linear relationship with the pH, but rather, three general ranges of operation are observed.
When applying acidity between pH = 2.0 and 2.5, the turbidity of the treated water is less than 1 NTU. This indicates that they are accepted by the legislation, which establishes the water quality criteria for both consumption and reuse. Oxidized water samples were analyzed to test carbamazepine degradation intermediates that coexist in the solution once a steady state is reached (see Appendix A, Table A1). The reason that these intermediate species cause low levels of turbidity is due to the fact that, performing at a controlled pH = 2.0–2.5, the iron species added in the form of a catalyst are present as ferrous ions. Iron species in their reduced state have a low capacity to react with organic matter, forming metallic complexes or inorganic hydroxides that cause turbidity.
The intermediates detected operating at pH = 2.0 allow proposing the degradation mechanism shown in Figure 3a, where CBZ would be oxidized through four main degradation routes. The dihydroxylation of the central benzene ring in the cis position of the hydroxyl groups, which would lead to obtaining acridones through the formation of hydroxylated acridines (Acridin-9-ol). On the other hand, the two benzene rings located at the extremes of the CBZ molecule would be hydroxylated, giving rise to the simultaneous formation of 3-hydroxy-carbamazepine (3-OH CBZ) and 2-hydroxy-carbamazepine (2-OH CBZ). Moreover, the attack of the aromatic ring of CBZ, according to the Criegee mechanism, would lead to the formation of 1-(2-benzaldehyde)-4-hydro-(1H,3H)-quinazoline-2-one(BQM) after intramolecular reactions and rearrangements. The reaction of BQM with hydroxyl radicals would lead to the formation of 1-(2-benzaldehyde)-(1H, 3H)-quinazoline-2,4-dione (BQD) [20,36]. Finally, the aldehyde group of the BQD could react with the hydroxyl radicals giving rise to the formation of the carboxyl group, generating the molecular structure 1-(2-benzoic acid)-(1H, 3H) -quinazoline-2,4-dione (BaQD), [37,38].
Conducting at pH values 3.0 and 3.5, turbidity around 5 NTU was observed, which would be the maximum limit value accepted by the water legislation. In tests performed at pH = 5.0, kinetic results were obtained that lead to similar turbidity. Besides, the intermediates that contain the oxidized CBZ samples were analyzed, operating at pH = 3.0 (see Table A2) and pH = 5.0 (see Table A4), in such a way that they allow to propose the potential degradation mechanisms of CBZ. It is found that, when carrying out the oxidation of CBZ both at pH = 3.0 and at pH = 5.0 controlled throughout the process, the four degradation pathways observed when operating at pH between 2.0 and 2.5 are kept, although with some nuances.
Figure 3b displays the CBZ degradation mechanism proposed for the assay conducted at a controlled pH = 5.0. In this case, the formation of the epoxide group in the central benzene ring, 10,11 epoxycarbamazepine (10,11-Epoxy CBZ), is detected, which leads to the formation of the two dihydroxylated isomers in cis positions 10,11-dihydroxycarbamazepine (cis 10,11-DiOH-CBZ) and trans 10,11-dihydroxycarbamazepine (trans 10,11-DiOH-CBZ). In turn, both are degraded, generating acridin-9-ol and acridone. On the other hand, the hydroxylation of the central benzene ring occurs, giving rise to the formation of 10-hydroxy-carbamazepine (10-OH CBZ), as well as the hydroxylation of the lateral ring generating 2-hydroxy-carbamazepine (2-OH CBZ). Moreover, the presence of (BQD) was tested. Given that the nature of the CBZ degradation intermediates analyzed does not present relevant structural differences with respect to the species detected in the previous case, operating at pH = 2.0, it should be considered that iron species could be the species directly affected by the change in the applied pH. In the case of conducting at pH = 3.0 and 5.0, iron would be found mainly in the form of ferric ions. However, when degrading intermediates of CBZ, the formation of metallic complexes between organic matter and ferric ions does not seem important. It would be more accurate to consider that the direct cause of turbidity formation would be the presence of ferric hydroxide in the solution, which would remain in suspension, and that would be a function of the concentration of iron added to the system. In this case, the tests were conducted at (Fe) = 10.0 mg/L, and the turbidity of the water was similar.
When carrying out the treatment operating at pH = 4.0, Figure 2a shows that the turbidity potentially increases, reaching maximum values around 16 NTU at 120 min of reaction. However, it is noted that as the oxidation process progresses, the turbidity decreases, reaching values about 5 NTU in the steady state.
To explain this effect, the oxidized water was analyzed at pH = 4.0 (see Table A3), where, from the results obtained, the degradation mechanism shown in Figure 2b is proposed. In a similar way to the rest of the assays, four main degradation pathways are detected, towards the formation of acridon, in this case, through the trans isomer 10,11-DiOH-CBZ, as well as the hydroxylation pathways through the central and lateral benzene ring of CBZ, confirming the formation of BQD and its subsequent oxidation-generating BaQD.
It should be remarked that in all the tests performed during the first 30 min of reaction, a small turbidity peak occurs, whose maximum increases proportionally with the pH. In the case of operating at pH = 4.0, a second turbidity peak appears, with a larger area, which is not observed in the rest of the experiments. This significant increase in turbidity may be due to the formation of ferric species that remain in suspension during the first two hours of the reaction. Afterward, they slowly precipitate until a solution is obtained with turbidity not exceeding 5 NTU.
These results allow us to consider that the iron species, mainly ferric hydroxide, cause turbidity changes when varying the operational pH. Therefore, when applying pH = 4.0, which means that iron is mainly found as a ferric ion, and since the same initial iron catalyst concentration is used ((Fe) = 10.0 mg/L), the final turbidity of the treated water is similar to that of the oxidized samples at pH = 3.0–5.0, which fluctuate around 5 NTU.
The effect of hydrogen peroxide dosage on the formation of turbidity during the oxidation of CBZ was analyzed using a photo-Fenton treatment (see Figure 4a). The tests were performed varying the concentration of oxidant dosed between 2.0 and 15.0 mM, keeping steady the dosage of iron, added as a catalyst in the form of ferrous ion, at 10.0 mg/L and pH = 0. Checking turbidity in the water during the oxidation of CBZ shows three operating ranges that lead to similar turbidity levels. This fact could indicate that the dose of hydrogen peroxide would affect the selectivity of the oxidation pathways of CBZ, leading to the formation of degradation intermediates that cause turbidity.
When applying oxidant concentrations between (H2O2) = 8.0 and 15.0 mM, a slight peak of turbidity appears during the first 20 min of the oxidation. It is verified that the maximum turbidity value of the peak is a function of the oxidant concentration. Therefore, that, using (H2O2) = 8.0 mM, produces a maximum turbidity of 12.5 NTU. Meanwhile, (H2O2) = 1.0 mM produces 7.2 NTU and (H2O2) = 15.0 mM creates 5.0 NTU. Once the peak arises, the turbidity evolves according to the kinetics of parallel trend until it coincides in similar values. Besides, it happens that in the steady state (see Figure 4b), the water treated under these conditions presents turbidity around 5 NTU. This result could indicate that the turbidity-causing intermediates formed during the first 20 min, which are dependent on the oxidation degree of the CBZ reached by using different doses of oxidant, are degraded to species of a similar nature.
Experimenting with oxidant concentrations (H2O2) = 5.0 mM, the formation of a turbidity peak is observed during the first 60 min of CBZ oxidation. In this case, the pinnacle is of greater area than in the previous interval. Moreover, it is verified that the turbidity evolves to values near 1.5 NTU in the steady state (see Figure 4b). Performing with oxidant concentrations (H2O2) = 2.0 mM, the water turbidity undergoes a notable increase during the first 30 min of oxidation of the CBZ, following a linear ratio of 0.34 NTU/min. Subsequently, the turbidity increases over time, but more slowly, at a rate of 0.057 NTU/min, until reaching around 98 NTU in the steady state (see Figure 4b). This result would indicate that CBZ degradation occurs through serial reactions that lead to the formation of species of a different nature, which cause turbidity.
Next, the treated water was analyzed using the oxidant dose (H2O2) = 2.0 mM to determine the degradative routes of CBZ towards the formation of species causing turbidity since it creates the highest turbidity in the tests conducted (see Figure 5a). These results allow us to verify that the four general pathways of CBZ degradation observed in the study of the effect of pH also occur here. The oxidation proceeds towards the production of acridones through the formation of the epoxide in the central benzene ring of CBZ, as well as the creation of the epoxide group in the lateral benzene ring, which leads to the development of hydroxylated species 2-OH-CBZ. On the other hand, hydroxylation reactions happen in the central benzene ring of CBZ, with the consequent formation of OX-CBZ and degradation towards the formation of BQD and BaQD.
Given the molecular structures of the species detected, it does not seem conceivable that the formation of intermolecular hydrogen bondings generates stable structures of a purely organic nature. In this case, it is contemplated that there are ferric species in the system, since the tests were performed at pH = 3.0, which determines the distribution of the iron species in the solution. Based on this premise, it is plausible that the high levels of turbidity generated in the water when using oxidant concentrations (H2O2) =2.0 mM can be caused by the formation of coordination complexes. They consist of the union of three molecules containing substituted carboxylic groups (BaQD), which act as ligands towards an iron atom with oxidation state 3+, whose molecular structure is shown in Figure 5b.

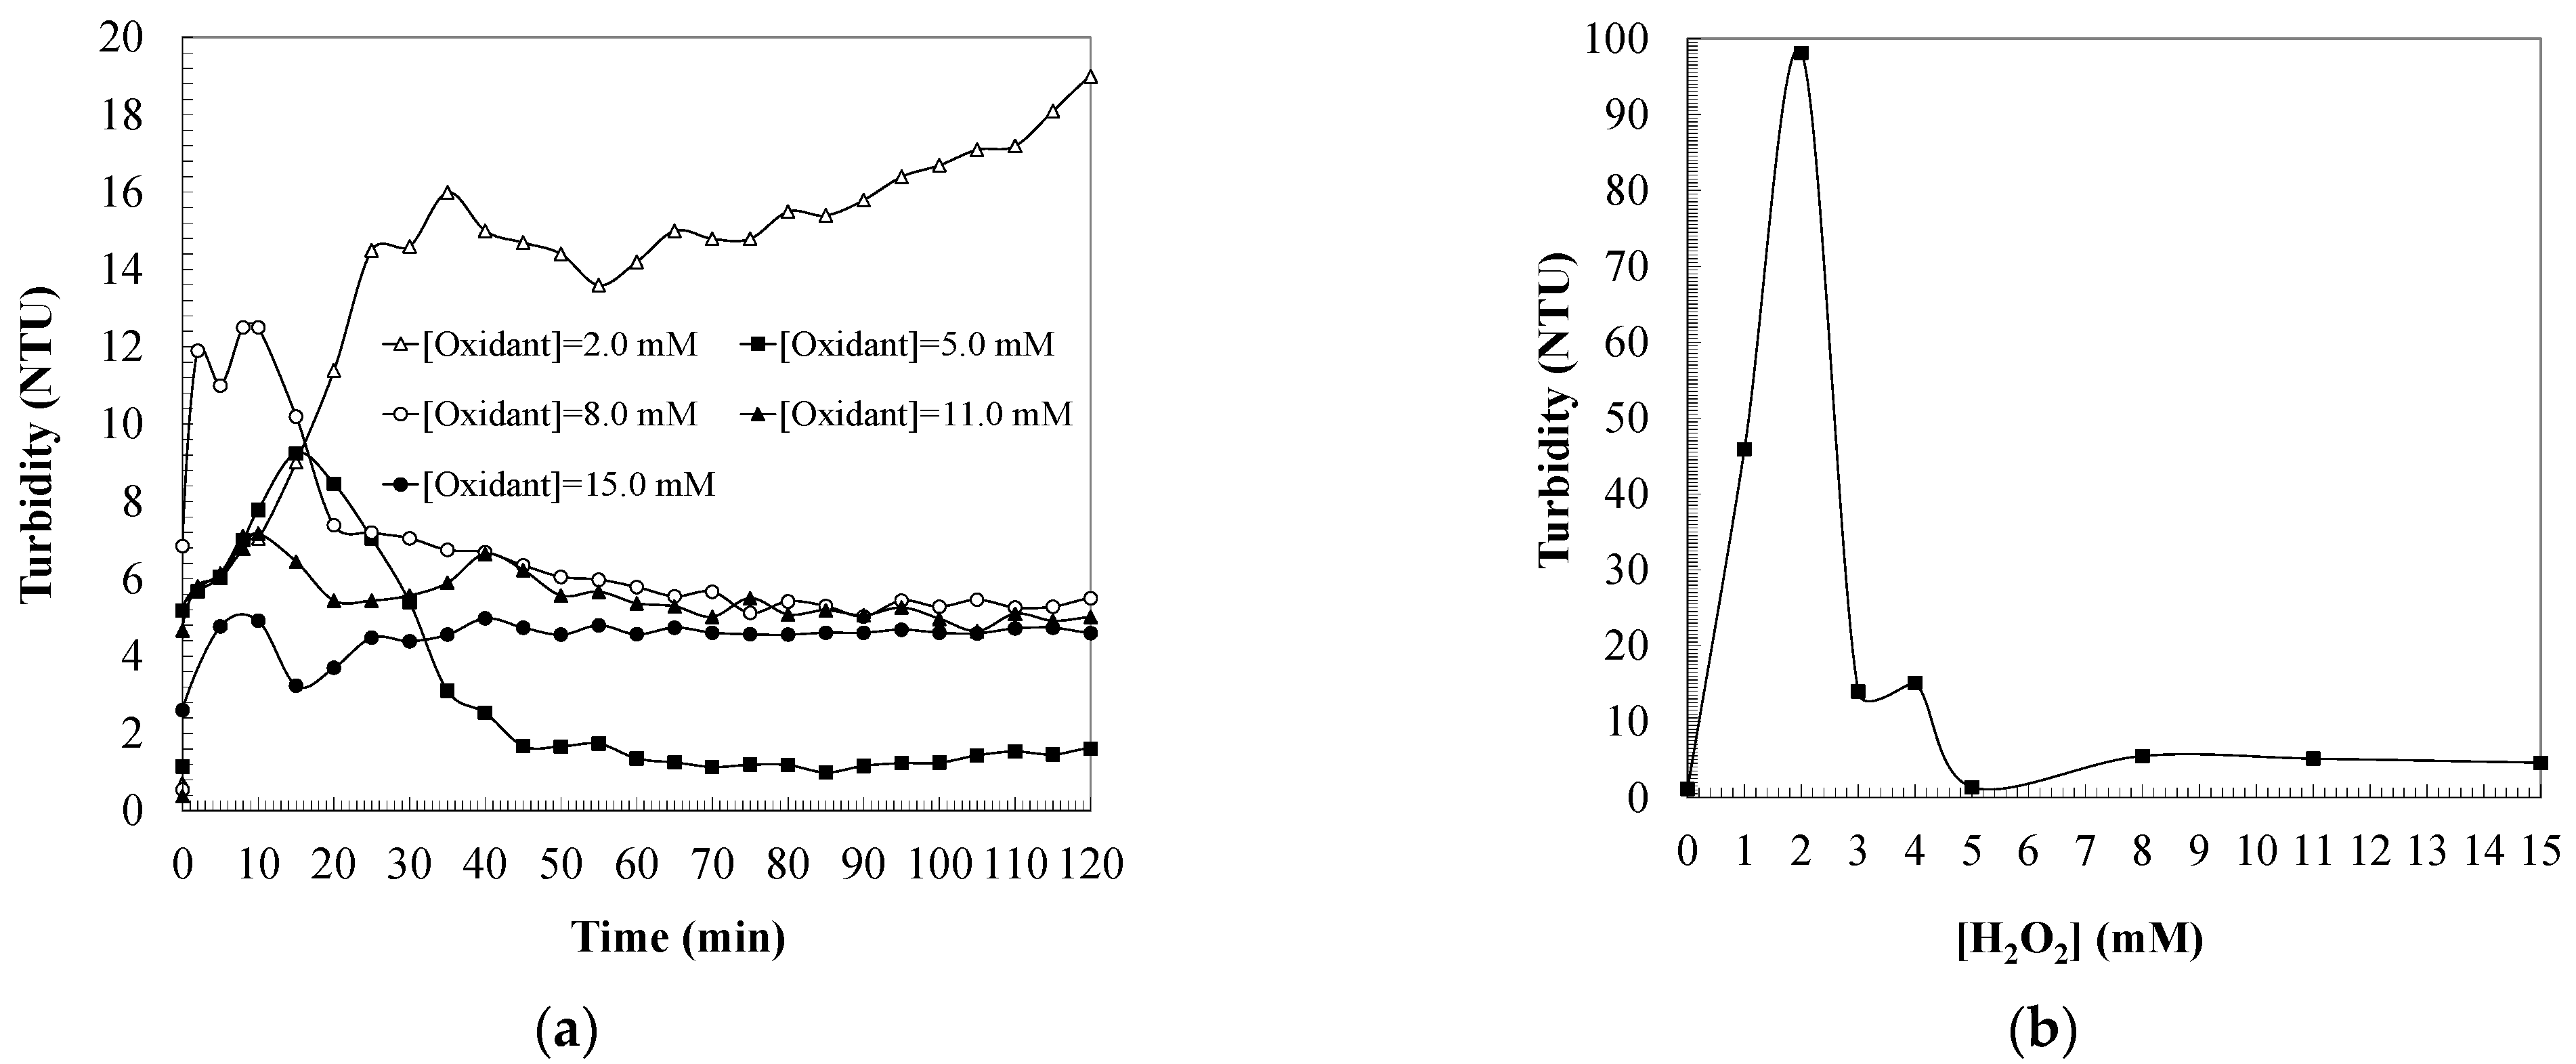
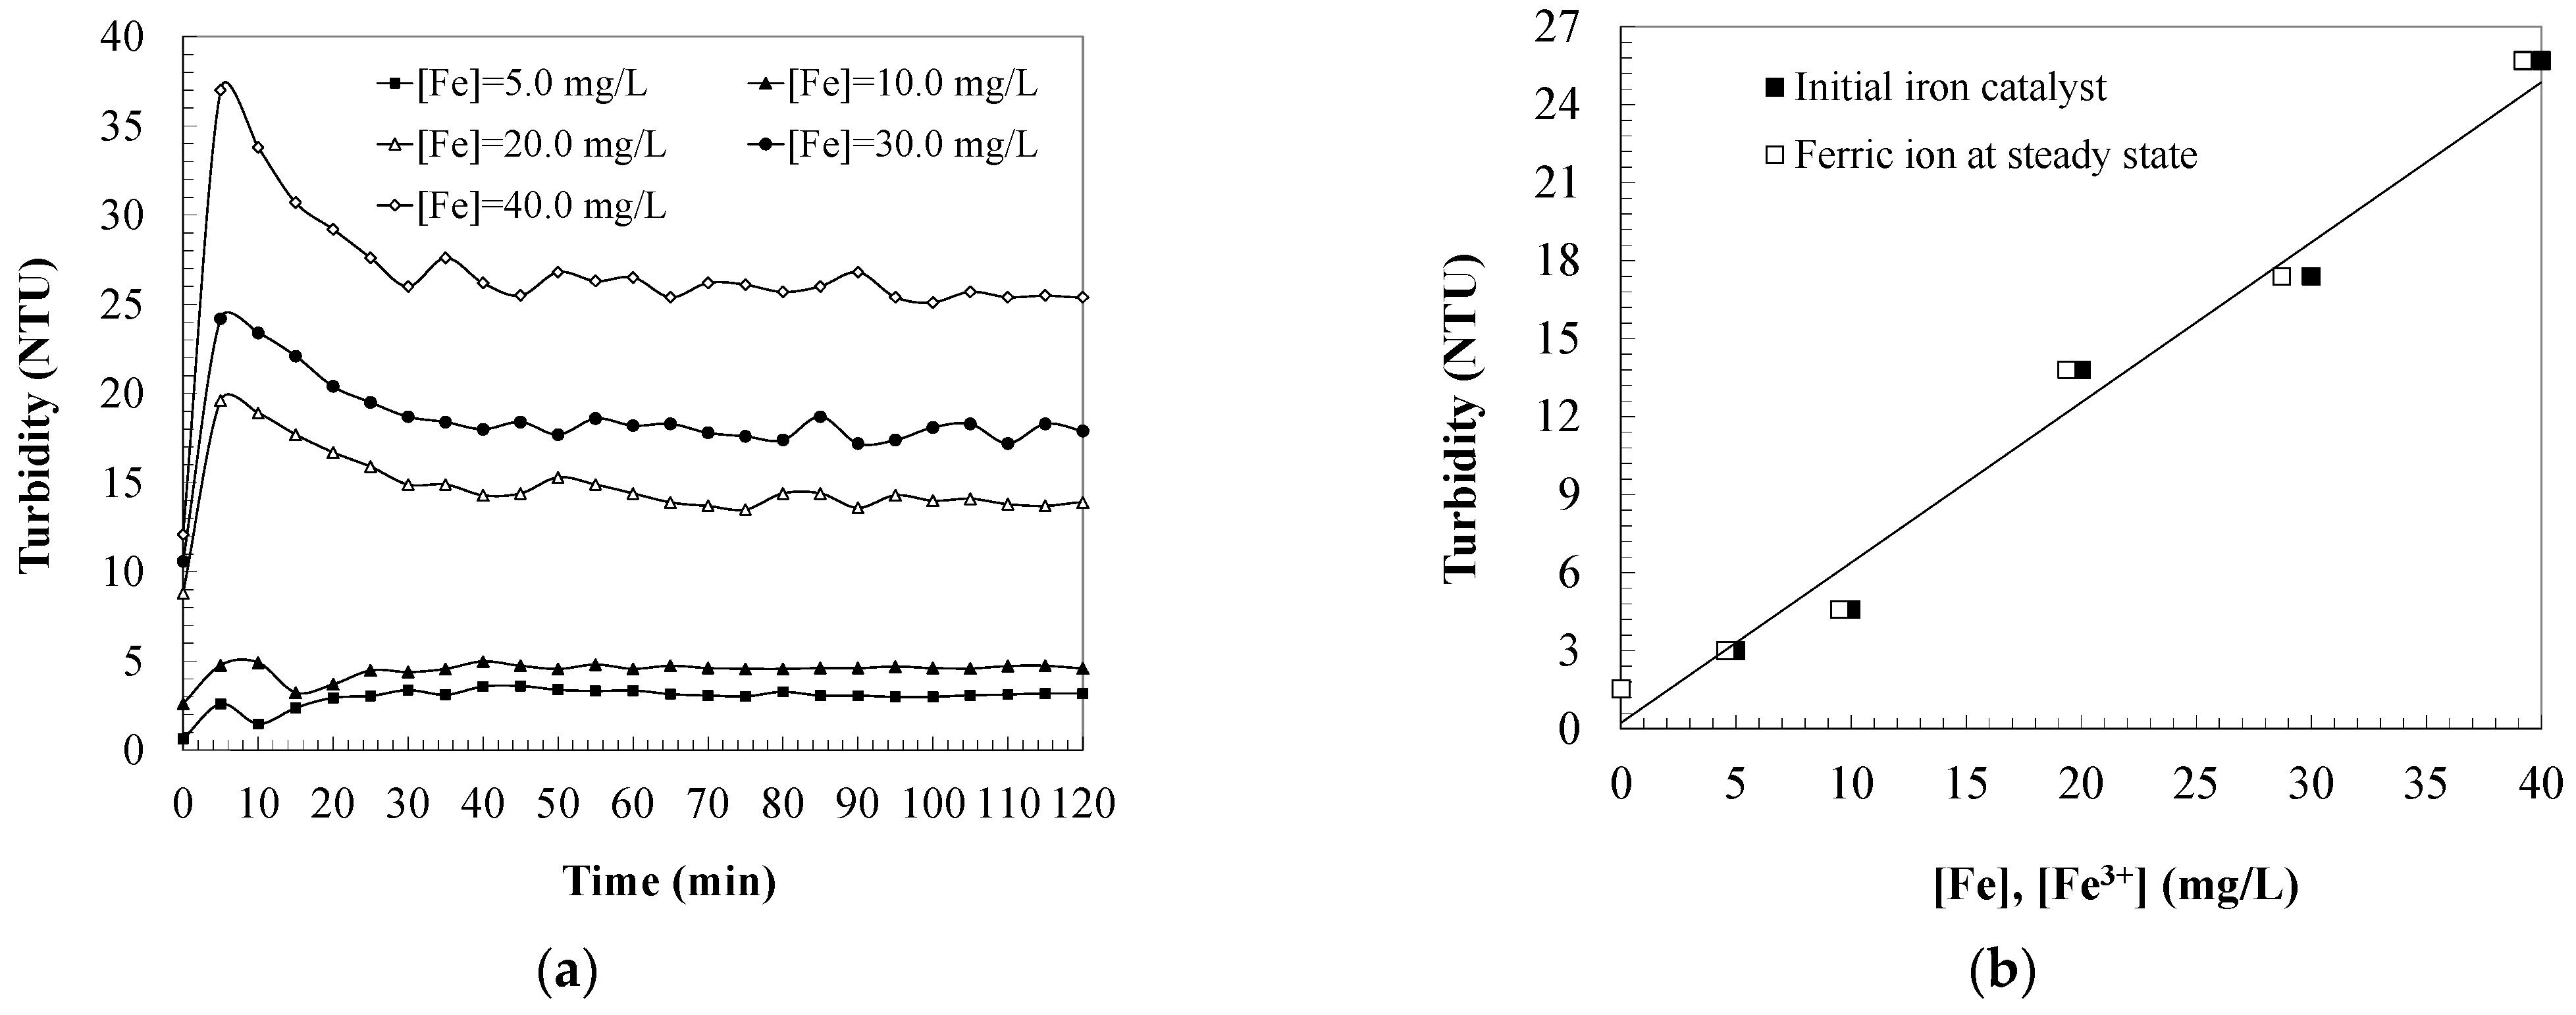
2.3. Effect of Iron Catalyst

The effect of iron dosage, used as a catalyst, was studied, working with concentrations between (Fe) = 5.0 and 40.0 mg/L (see Figure 6a) and keeping steady the oxidant concentration and pH. The results indicate that the turbidity kinetics analyzed during the oxidation of CBZ show a parallel evolution in all the tests, where the turbidity increases linearly with the iron concentration according to a ratio of 0.616 NTU L/mg Fe (see Equation (1)). These results demonstrate that iron does not affect the CBZ degradation mechanism. Furthermore, by operating at a constant pH, the distribution of ferrous and ferrous species in solution is kept constant. Finally, the concentration of iron species was analyzed, verifying that the catalyst is mainly found as ferric species (see Figure 6b).
[NTU] = [NTU]0 + 0.6159 [Fe] (r2 = 0.9804)
Being that:
[NTU]0: turbidity of the aqueous solution of CBZ (=0.2261 NTU);
[NTU]: water turbidity (NTU);
[Fe]: initial iron concentration (mg/L).

3. Materials and Methods

3.1. Experimental Methods

Samples of carbamazepine aqueous solutions ((CBZ) = 50.0 mg/L, Fagron 99.1%) were studied in a photocatalytic 1.0 L reactor provided with a UV-150W mercury lamp of medium pressure (Heraeus, 95% transmission between 300 and 570 nm). Reactions began adding the iron catalyst as ferrous ion ((Fe), mg/L) operating between (Fe)0 = 5.0–40.0 mg/L (FeSO4 7H2O, Panreac 99.0%) and the oxidant dosage for each set of experiments, which varied between (H2O2) = 0–15.0 mM (Panreac, 30% w/v). All the experiments were carried out at around 40 °C in order to simulate real operating conditions, considering the heat absorbed by the water that is in direct contact with the ultraviolet lamp. Assays were performed operating under different initial pH conditions (pH between 2.0 and 5.0) in order to assess the effect of this parameter on color formation during oxidation of carbamazepine aqueous solutions. Acidity was kept constant, adding NaOH and HCl 0.1M.

3.2. Analytical Methods

Turbidity (NTU) was analyzed by a turbidimeter (100Q-Hach) and ferrous ion (Fe2+, mg/L) by the phenanthroline method at λ = 510 nm (Fortune, 1938) using a UV/Vis Spectrophotometer 930-Uvikon, Kontron Instruments (Mazowieckie, Poland). Dissolved oxygen (DO, mg/L) was assessed by a Polarographic Portable Dissolved Oxygen Meter HI9142, Hanna Instruments, S.L. (Eibar, Spain). Total dissolved solids (TDS, mg/L) were analyzed by a TDS Metter Digital and redox potential (V) by a conductimeter Basic 20 Crison, Hach (Derio, Spain).

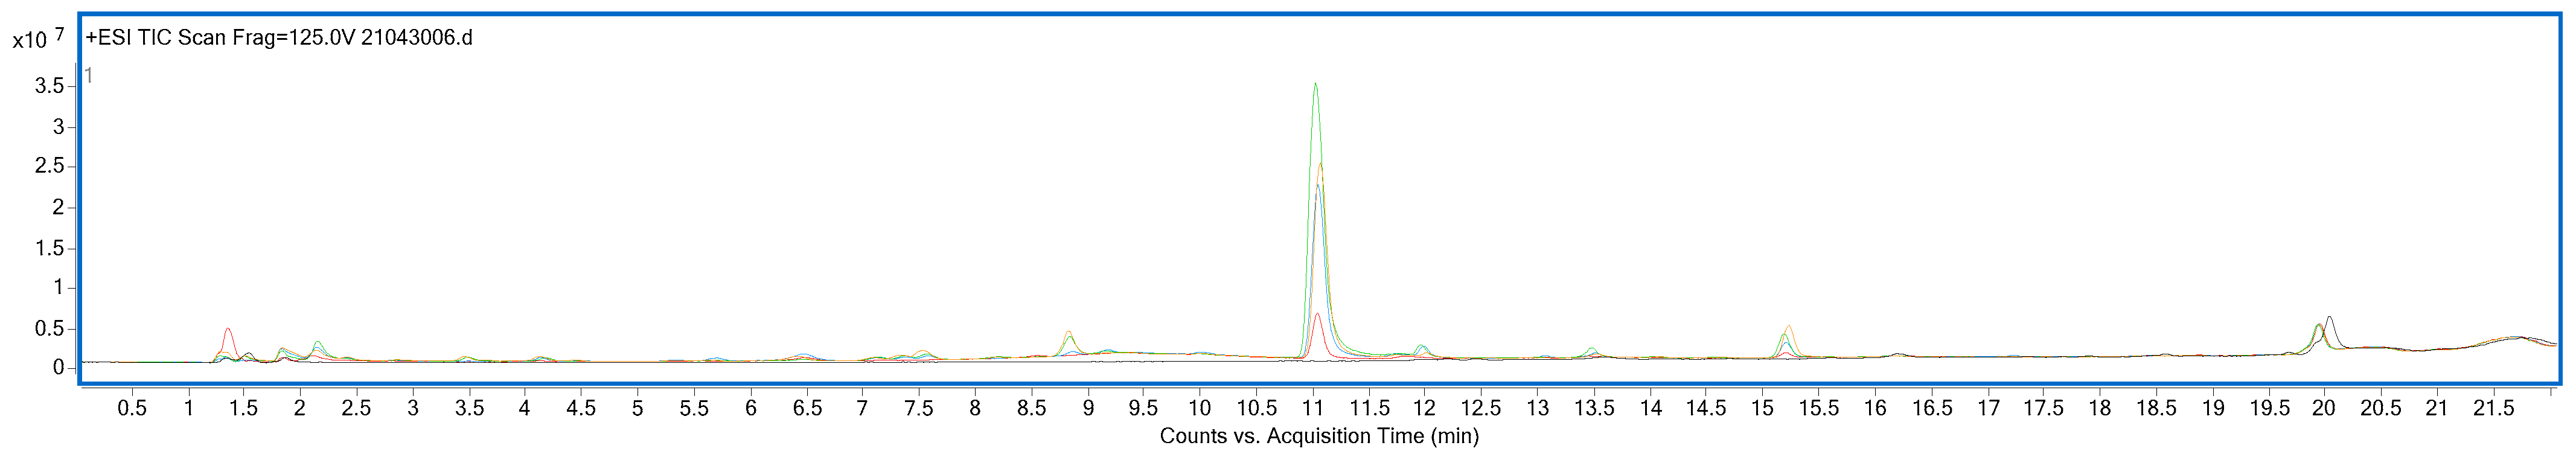
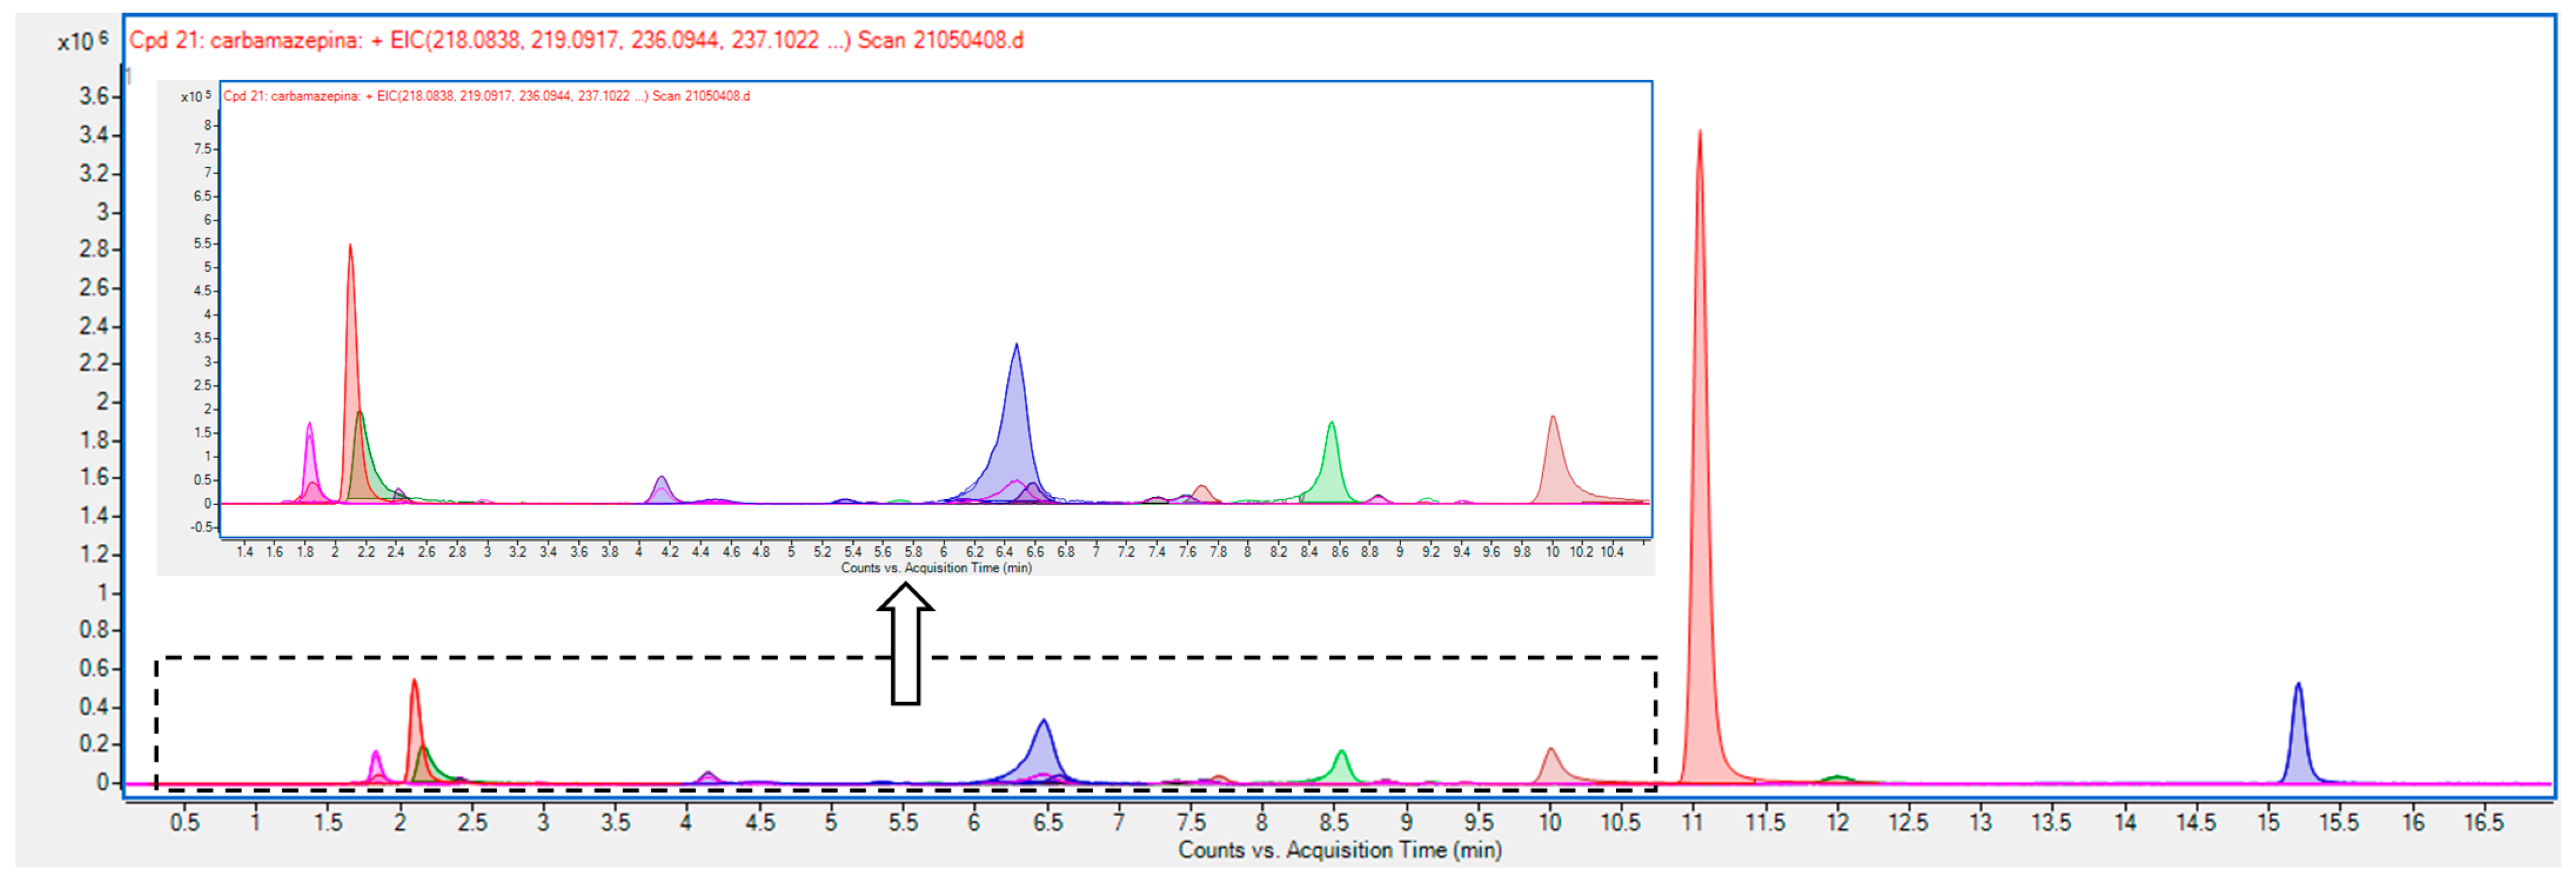
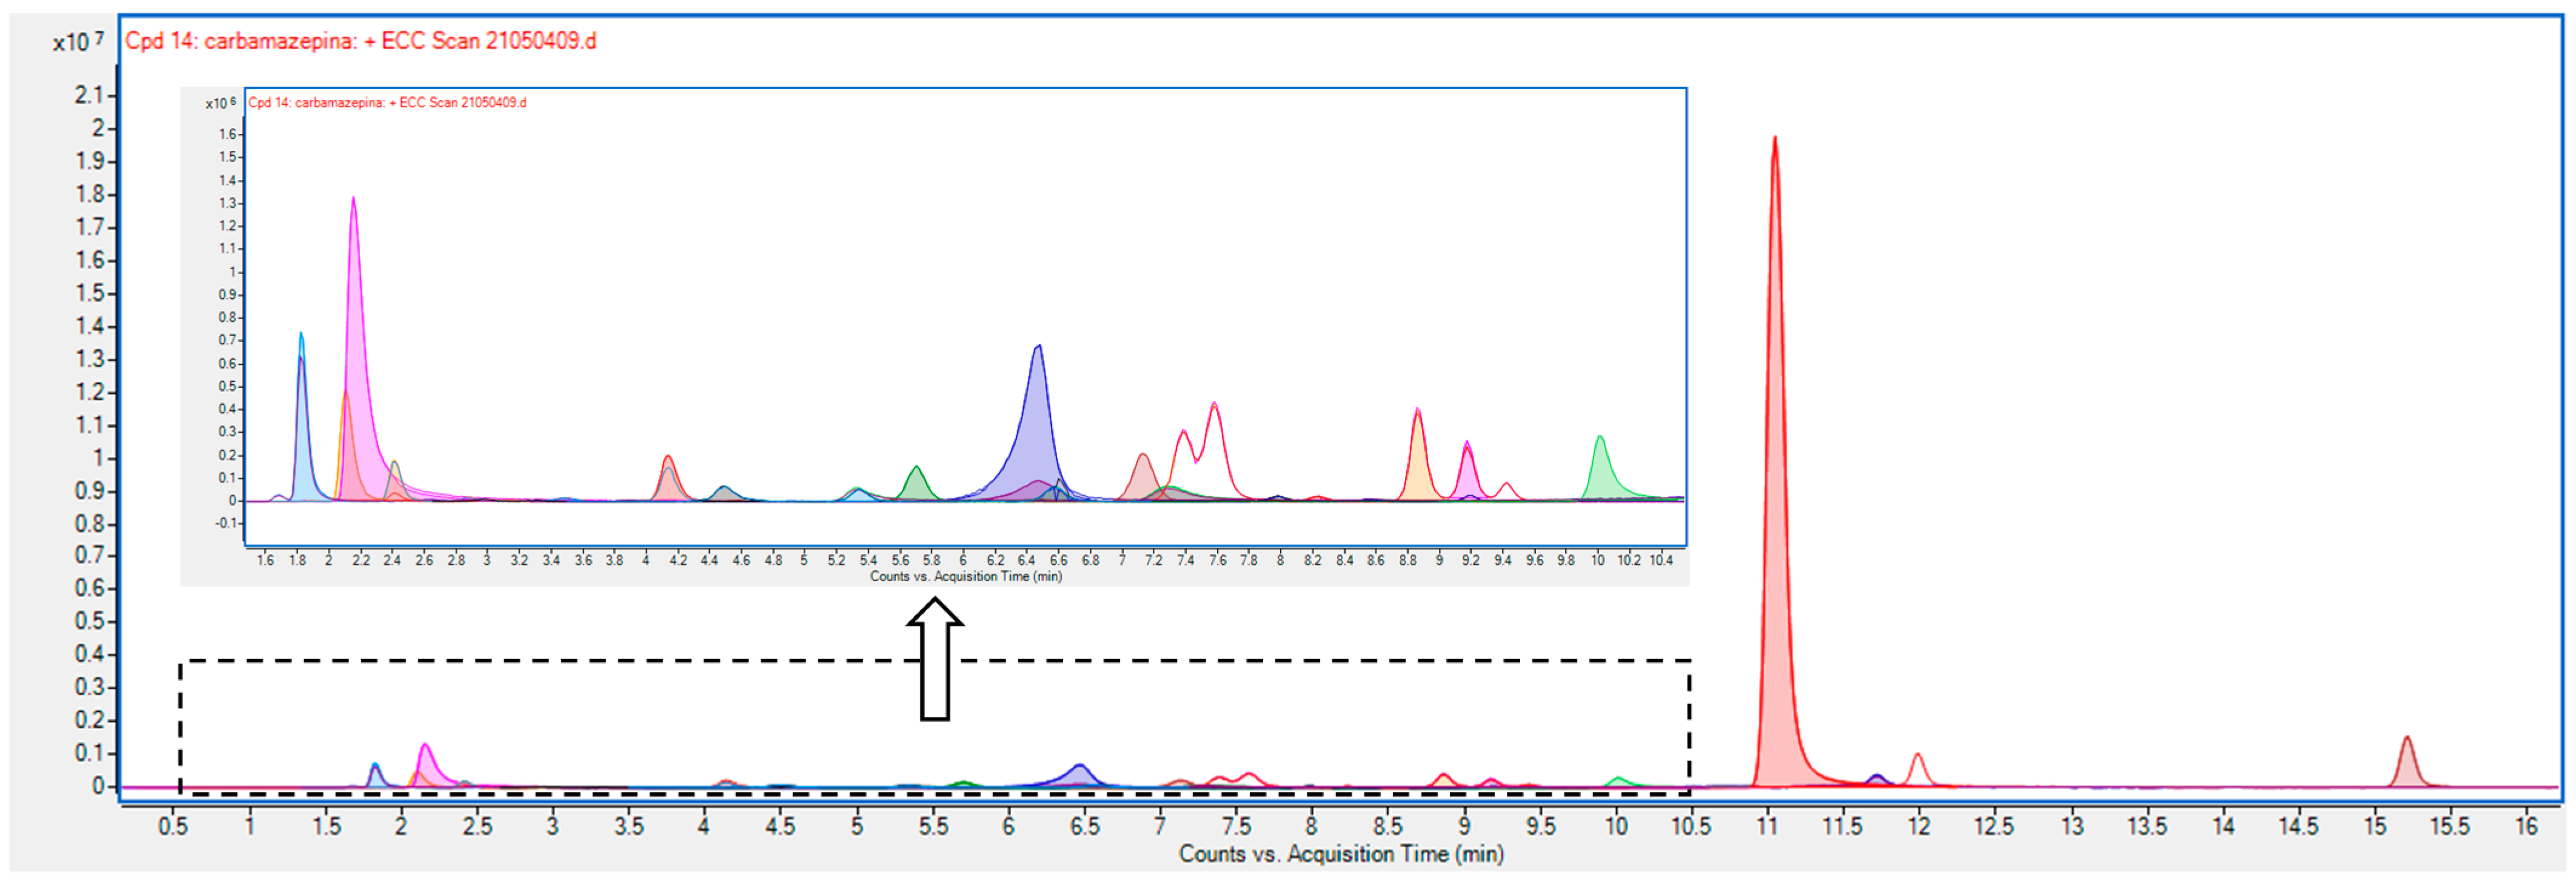
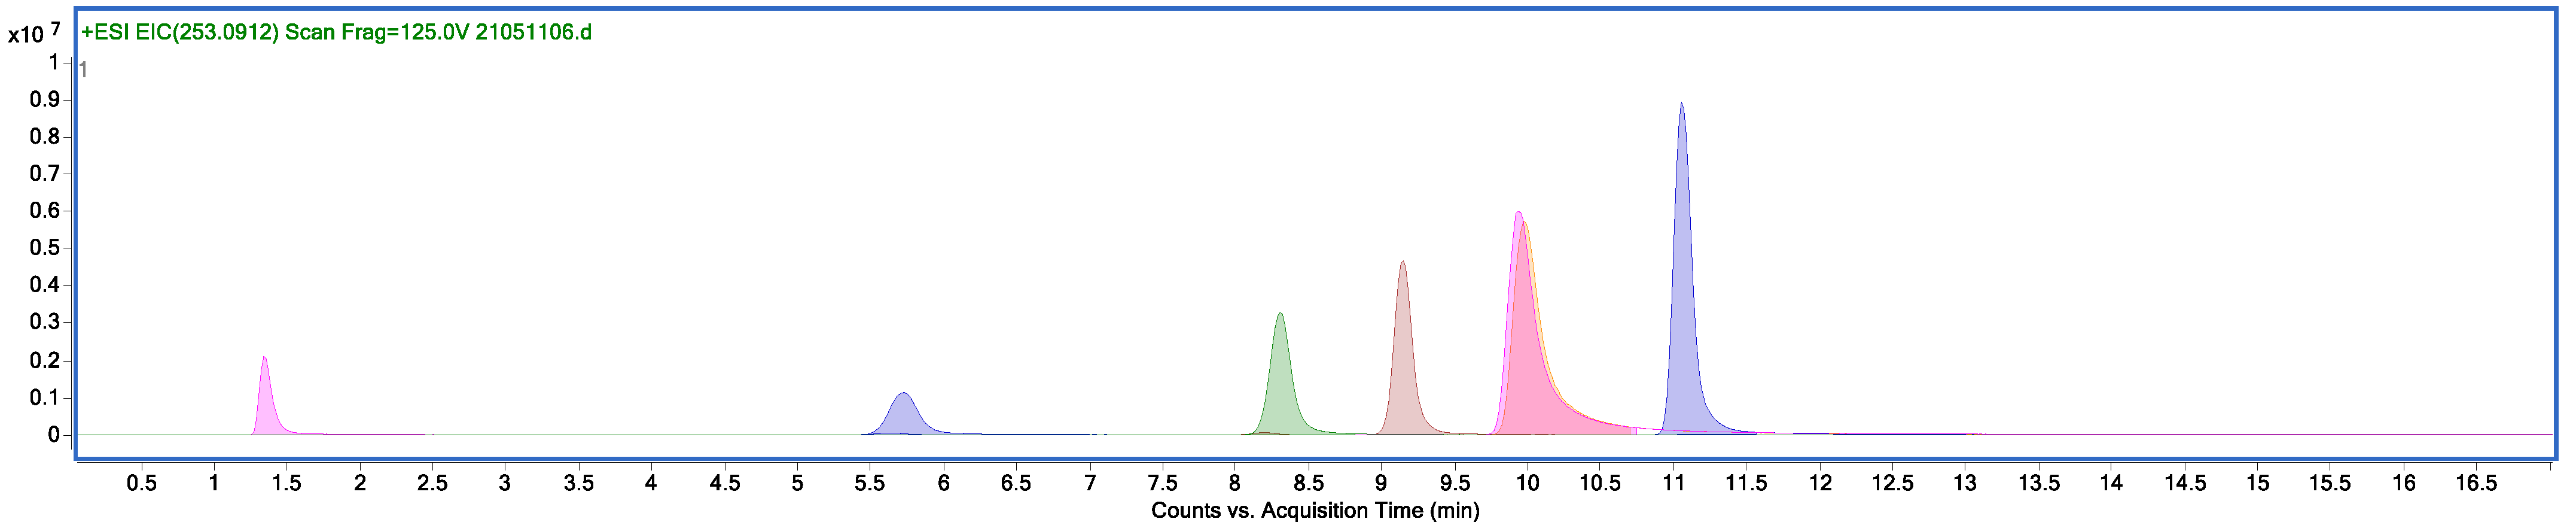
3.3. Liquid Chromatography-Mass Spectrometry to Elucidate the Intermediates of Carbamazepine Degradation

Samples were stored after receipt under refrigeration. Samples were centrifuged and subsequently diluted before starting analysis. The analysis was carried out with an LC/Q-TOF, with ESI+ Agilent Jet Stream ionization source and the following conditions: column: Kinetex EVO C18 HPLC/UHPLC Core-Shell (100 × 3 mm) 2.6 μm (Phenomenex company, Tianjin, China). Mobile phase 0.1% formic acid (A): acetonitrile with 0.1% of formic acid (B). Gradient: %B: 20; 20; 100; 100; 20 vs. time: 0; 2; 24; 28; 30. Flow: 0.3 mL/min. Column temperature: 35 °C. Injection volume: 5 μL. Ionization: Gas T = 300 °C; drying gas 10 L/min; Nebulizer 20 psig; shealt gas T = 350 °C; shealt gas flow 11 L/min; frag 125 V. Vcap 3500 V.
A screening method was developed to allow the elution and ionization of the greater number of compounds present in the sample. The stabilization of the system, the reproducibility of the signals and the correction of the exact mass were checked before starting the analysis. The compounds were searched using the deconvolution algorithm “Find by molecular features” and subsequent filtering of the proposed compounds based on compounds detected in the blank, background noise and minimum abundance of the compound. The following chromatograms show the major compounds observed for each of the samples (Figure 7). Under the proposed conditions, the following chromatograms were obtained for each of samples at pH=2.0, 3.0, 4.0 and 5.0 (Figure 8, Figure 9, Figure 10 and Figure 11).
In order to try to identify the greatest number of compounds, standards of possible carbamazepine degradation compounds were initially prepared to check their retention time and mass spectra. The following commercial standards were used: carbamazepine (CBZ), oxo-carbamazepine (Oxo-CBZ), carbamazepine 10, 12-epoxide (Epoxi-CBZ), 11-dihidro-10-hidroxicarbamazepine (10-OH CBZ), 9-acridanone, acridin-9-ol, 4-aminophenol, malonic acid (Figure 12).
Using the method developed for the screening, the following retention times (Tr) and characteristic ions or mass/charge ratios (m/z) were obtained for each compound (Table 1). Appendix A summarizes the predominant compounds found, as well as their characteristic ions (m/z) and the experimental masses calculated for each sample.
Once the majority of compounds were identified, and in order to determine the concentration of the degradation products in the samples (identified with the commercial standards), calibration was completed. The quantification of the samples was carried out using a calibration at concentrations between 0.001 and 5 μg/mL. The results obtained from the quantitative analysis are shown in Table 2.
Next is explained the validation of the method, wherein Table 3, Table 4, Table 5, Table 6 and Table 7 provide full validation process of the analysis of CBZ and its degradation products with the main validation parameters. The samples were subjected to drastic conditions to acid hydrolysis (1N HCl), basic hydrolysis (1N NaOH), sunlight and temperature (30 °C). Subsequently, the amount recovered was determined in triplicate after 7 days.

4. Conclusions

This work checks the effect of the control parameters of photo-Fenton technology applied to CBZ oxidation. Experimental assays show that during the oxidation of aqueous solutions containing CBZ, the water turbidity shows great changes as a function of the operational conditions (pH, hydrogen peroxide and catalyst concentration). The relationship between turbidity and the control parameters of the photo-Fenton reaction would be caused by the degradation intermediates generated in water as a function of the oxidized degree achieved in the treatment. The analysis of treated waters that show the higher turbidity levels allow establishing a general oxidation mechanism, where the CBZ would be oxidized through four main degradation routes. First, the formation of the epoxide (10,11-Epoxy CBZ) leads to the creation of two dihydroxylated isomers (cis and trans 10,11-DiOH-CBZ), which, in turn, degrade, generating acridin-9-ol and acridone. On the other hand, the creation of the epoxide (2,3-Epoxy CBZ) generates hydroxylated benzene rings (3-OH CBZ and 2-OH CBZ). Moreover, the attack of the aromatic ring of CBZ would lead to the production of BQM, where the reaction of BQM with hydroxyl radicals would direct the generation of BQD. Finally, the aldehyde group of BQD could react with the hydroxyl radicals, generating BaQD. Moreover, it has to be considered that in this system, the iron catalyst has the oxidized form Fe3+. Then, the generation of high turbidity would be explained based on the molecular structure of the degradation intermediates detected, where it would be possible to propose the formation of coordination complexes with ferric ions that enhance the turbidity. This would be the case of coordination compounds between a ferric ion atom with three BaQD molecules that consist of stable supramolecular structures that reduce the passage of light through the water, causing turbidity.

Author Contributions

Experimental design, writing, review, conclusions, N.V.; translation, formatting, references, C.F.; experimental development, H.A.Q.; translation, review, J.M.L.; obtaining sponsors, obtaining funding, J.I.L. All authors have read and agreed to the published version of the manuscript.

Funding

Authors are grateful to the University of the Basque Country UPV/EHU for the financial support to carry out this research study through the scholarship Student Movility for Traineeships in the Erasmus + Programme between the Anadolu University in Eskisehir (Turkey) and the Faculty of Engineering Vitoria-Gasteiz (Spain).

Acknowledgments

The authors thank for technical and human support provided by the Central Service of Analysis from Álava—SGIker—UPV/EHU.

Conflicts of Interest

The authors declare no conflict of interest.

Appendix A

Table A1. Results of screening of major compounds. Sample pH = 2.0. Experimental conditions: [CBZ] = 50.0 mg/L; [Fe] = 10.0 mg/L; [H2O2] = 15.0 mM; T = 25 °C; [UV] = 150 W.
LabelTr, minm/zMassHeightNameScoreDiff (DB,ppm)Ions
Comp 11.8224.0718223.0645146,262---3
Comp 21.8163.0511162.043841,946---2
Comp 32.1147.0557146.0485501,215---2
Comp 42.2180.0811179.0739172565Acridine99.09−2.022
Comp 52.4271.1054270.099133,111CIS-d iOH -CBZ88.394.918
Comp 64.1271.1092270.102358,811CIS-diOH-CBZ94.64−7.037
Comp 74.5267.0781266.07088828BQD87.11−6.511
Comp 85.4267.0779266.07068275BQD89.7−5.782
Comp 95.8255.1158254.10938104---
Comp 106.5251.0828250.0755269,555T125192.29−5.15
Comp 116.6267.0778266.070638,790BQD90.62−5.52
Comp 127.3224.0719223.06391553---3
Comp 137.4253.0989252.091912,2342-OH-CBZ73.88−7.862
Comp 147.6253.0983252.091116,1642-OH-CBZ80.87−4.922
Comp 157.7283.0727282.065432,599BaQD93.23−4.532
Comp 168.5267.0779266.0706147,319BQD90.13−5.653
Comp 178.9253.0994252.092815,5993-OH-CBZ77.71−11.533
Comp 189.2253.1034252.0963526---2
Comp 199.9196.077195.0697184,640Acridone or acridin-9-ol96.9−6.810
Comp 2011.2259.0863236.09713,433,925Carbamazepine94−9.097
Comp 2112.0318.2826317.275329,688---2
Comp 2215.2226.0881225.0808402,491---5
Table A2. Results of screening of major compounds. Sample pH = 3.0. Experimental conditions: [CBZ] = 50.0 mg/L; [Fe] = 10.0 mg/L; [H2O2] = 15.0 mM; T = 25 °C; [UV] = 150W. The compounds indicated in grey are the possible species identified by the database.
LabelTr, minm/zMassHeightNameScoreDiff (DB,ppm)Ions
Comp 11.8224.0716223.0644632,743---3
Comp 22.1147.0563146.0491436,509---3
Comp 32.2180.0818179.07451,149,862Acridine92.86−5.763
Comp 42.4271.1095270.1017147,566TRANS-diOH-CBZ86.39−4.873
Comp 53.5271.109270.10212,320---2
Comp 64.1253.099270.1023169,843TRANS-diOH-CBZ93.57−6.993
Comp 74.5267.0774266.070156,646BQD95.11−3.922
Comp 85.3267.0777266.070445,947BQD91.98−5.072
Comp 95.7237.1033254.1065131,80510-OH-CBZ83.69−4.022
Comp 106.5251.0834250.0761544,371T125184−7.515
Comp 116.6267.0776266.070455,876BQD93.04−4.72
Comp 127.1269.0934268.0861141,392---4
Comp 137.3224.0718223.064452,554---3
Comp 147.4253.0988252.0916256,1822-OH-CBZ95.43−6.618
Comp 157.6253.0989252.0916357,2482-OH-CBZ94.24−6.775
Comp 167.7283.0735282.06629024BaQD82.12−7.582
Comp 177.9267.0784266.070919,667BQD85.55−6.923
Comp 188.2253.0985252.091417,230EP-CBZ73.45−6.072
Comp 198.6267.0795266.07228216---2
Comp 208.8253.0994252.0921330,5352-OH-CBZ90.52−8.924
Comp 219.2253.0988252.0916204,534Oxcarbamazepine94.32−6.725
Comp 2210.0196.0772195.0699280,810Acridone or acridin-9-ol96.78−7.926
Comp 2311.2237.1047236.097410,672,680Carbamazepine88.67−10.0815
Comp 2411.7224.0733223.066276,891---5
Comp 2511.9473.1992472.1919639,344---6
Comp 2615.2226.0889225.08161,183,745---5
Table A3. Results of screening of major compounds. Sample pH = 4.0. Experimental conditions: [CBZ] = 50.0 mg/L; [Fe] = 10.0 mg/L; [H2O2] = 15.0 mM; T = 25 °C; [UV] = 150W. The compounds indicated in grey are the possible species identified by the database.
LabelTr, minm/zMassHeightNameScoreDiff (DB,ppm)Ions
Comp 11.8224.0722223.0649755,262---3
Comp 22.1147.0566146.0493372,649---3
Comp 32.2180.0822179.07491,818,336Acridine87.37−7.783
Comp 42.4271.109270.101867,258TRANS-diOH-CBZ80.63−5.012
Comp 53.5271.1091270.1017178,694TRANS-diOH-CBZ96.59−4.953
Comp 64.2253.0988270.1021236,040TRANS-diOH-CBZ94.47−6.473
Comp 74.5267.0778266.070526,250BQD90.8−5.442
Comp 85.3267.078266.07079285BQD88.48−6.131
Comp 95.7255.1141254.106931,34910-OH-CBZ80.45−5.523
Comp 106.5251.0825250.0753119,415T125194.04−4.463
Comp 116.6267.0779266.070613,942BQD89.97−5.72
Comp 127.1269.0935268.0861166,675---5
Comp 137.4224.0716223.064344,729---2
Comp 147.3253.0985252.0912385,6553-OH CBZ96.47−5.185
Comp 157.6253.099252.0917514,8163-OH CBZ93.53−7.248
Comp 167.9267.0781266.070812,768BDQ87.89−6.292
Comp 178.2253.099252.091870,044EP-CBZ93.04−7.693
Comp 188.8253.0996252.09231,397,3813-OH-CBZ89.34−9.6511
Comp 199.1253.0989252.0916149,274Oxcarbamazepine78.9−6.894
Comp 209.9196.0767195.0696109,794Acridone or acridin-9-ol97.14−5.924
Comp 2111.2237.105236.097315,089,995Carbamazepine83.8−9.819
Comp 2211.7224.0723223.065395,064---2
Comp 2311.9473.1994472.192688,405---8
Comp 2413.5210.0931209.0859635,867---3
Comp 2515.2226.0889225.08171,793,645---8
Table A4. Results of screening of major compounds. Sample pH = 5.0. Experimental conditions: [CBZ] = 50.0 mg/L; [Fe] = 10.0 mg/L; [H2O2] = 15.0 mM; T = 25 °C; [UV] = 150W. The compounds indicated in grey are the possible species identified by the database.
LabelTr, minm/zMassHeightNameScoreDiff (DB,ppm)Ions
Comp 11.8224.0718223.0645520,658---3
Comp 22.1147.0568146.0496588,299---3
Comp 32.2180.0822179.0749693,527Acridine87.18−7.843
Comp 42.4271.1092270.1019141,194TRANS-diOH-CBZ80.16−5.492
Comp 53.5271.1091270.1019432,132CIS-diOH-CBZ96.29−5.387
Comp 64.1271.1091270.1018409,566CIS-diOH-CBZ96.85−5.139
Comp 74.5267.0778266.0705114,157BQD91.47−5.232
Comp 85.3267.0779266.070613,734BQD89.84−5.731
Comp 95.7255.114254.106956,31310-OH-CBZ96.03−5.6910
Comp 106.4251.0827250.0755398,550T125192.37−5.076
Comp 116.5267.0782266.070910,804BQD86.14−6.772
Comp 127.1269.0935268.0862148,854---8
Comp 137.3224.0721223.064851,741---4
Comp 147.3253.0989252.0916473,7372-OH-CBZ95.34−6.626
Comp 157.5253.0995252.0922802,9342-OH-CBZ91.73−9.1710
Comp 167.9267.0775266.070134,402BQD95.57−3.734
Comp 178.2253.0985252.091581,586EP-CBZ97.33−6.518
Comp 188.8253.0996252.09241,722,7572-OH-CBZ90.91−9.7311
Comp 199.1253.0983252.091137,573Oxcarbamazepine80.73-4.92
Comp 2010.0196.0773195.07158,961Acridone or acridin-9-ol95.31−8.416
Comp 2111.2237.1048236.097311,711,134Carbamazepine89.16−9.915
Comp 2211.7224.0731223.0663207,462---5
Comp 2312.0473.1987472.1915239,021---7
Comp 2415.2226.0886225.08142,443,394---11

References

  1. Lapworth, D.J.; Baran, N.; Stuart, M.E.; Ward, R.S. Emerging Organic Contaminants in Groundwater: A Review of Sources, Fate and Occurrence. Environ. Pollut. 2012, 163, 287–303. [Google Scholar] [CrossRef] [PubMed] [Green Version]
  2. Hai, F.I.; Yang, S.; Asif, M.B.; Sencadas, V.; Shawkat, S.; Sanderson-Smith, M.; Gorman, J.; Xu, Z.-Q.; Yamamoto, K. Carbamazepine as a Possible Anthropogenic Marker in Water: Occurrences, Toxicological Effects, Regulations and Removal by Wastewater Treatment Technologies. Water 2018, 10, 107. [Google Scholar] [CrossRef] [Green Version]
  3. Hughes, S.R.; Kay, P.; Brown, L.E. Global Synthesis and Critical Evaluation of Pharmaceutical Data Sets Collected from River Systems. Environ. Sci. Technol. 2013, 47, 661–677. [Google Scholar] [CrossRef]
  4. Gavrilescu, M.; Demnerová, K.; Aamand, J.; Agathos, S.; Fava, F. Emerging Pollutants in the Environment: Present and Future Challenges in Biomonitoring, Ecological Risks and Bioremediation. New Biotechnol. 2015, 32, 147–156. [Google Scholar] [CrossRef]
  5. Brack, W.; Dulio, V.; Ågerstrand, M.; Allan, I.; Altenburger, R.; Brinkmann, M.; Bunke, D.; Burgess, R.M.; Cousins, I.; Escher, B.I.; et al. Towards the Review of the European Union Water Framework Directive: Recommendations for More Efficient Assessment and Management of Chemical Contamination in European Surface Water Resources. Sci. Total Environ. 2017, 576, 720–737. [Google Scholar] [CrossRef]
  6. Kumar, A.; Batley, G.E.; Nidumolu, B.; Hutchinson, T.H. Derivation of Water Quality Guidelines for Priority Pharmaceuticals. Environ. Toxicol. Chem. 2016, 35, 1815–1824. [Google Scholar] [CrossRef] [PubMed] [Green Version]
  7. Marcelo, V.O.; Salette, R.; Jose, L.F.C.L.; Marcela, A.S. Analytical Features of Diclofenac Evaluation in Water as a Potential Marker of Anthropogenic Pollution. Curr. Pharm. Anal. 2016, 13, 39–47. [Google Scholar]
  8. Ferrer, I.; Thurman, E.M. Analysis of 100 Pharmaceuticals and Their Degradates in Water Samples by Liquid Chromatography/Quadrupole Time-of-Flight Mass Spectrometry. J. Chromatogr. A 2012, 1259, 148–157. [Google Scholar] [CrossRef] [PubMed]
  9. Arye, G.; Dror, I.; Berkowitz, B. Fate and Transport of Carbamazepine in Soil Aquifer Treatment (SAT) Infiltration Basin Soils. Chemosphere 2011, 82, 244–252. [Google Scholar] [CrossRef]
  10. Kasprzyk-Hordern, B.; Dinsdale, R.M.; Guwy, A.J. The Removal of Pharmaceuticals, Personal Care Products, Endocrine Disruptors and Illicit Drugs during Wastewater Treatment and Its Impact on the Quality of Receiving Waters. Water Res. 2009, 43, 363–380. [Google Scholar] [CrossRef]
  11. Chen, P.; Lin, J.-J.; Lu, C.-S.; Ong, C.-T.; Hsieh, P.F.; Yang, C.-C.; Tai, C.-T.; Wu, S.-L.; Lu, C.-H.; Hsu, Y.-C.; et al. Carbamazepine-Induced Toxic Effects and HLA-B*1502 Screening in Taiwan. N. Engl. J. Med. 2011, 364, 1126–1133. [Google Scholar] [CrossRef] [PubMed]
  12. Pereira, F.A.; Mudgil, A.V.; Rosmarin, D.M. Toxic Epidermal Necrolysis. J. Am. Acad. Dermatol. 2007, 56, 181–200. [Google Scholar] [CrossRef] [PubMed]
  13. Jentink, J.; Dolk, H.; Loane, M.A.; Morris, J.K.; Wellesley, D.; Garne, E.; de Jong-van den Berg, L.; EUROCAT Antiepileptic Study Working Group. Intrauterine Exposure to Carbamazepine and Specific Congenital Malformations: Systematic Review and Case-Control Study. BMJ 2010, 341, c6581. [Google Scholar] [CrossRef] [PubMed] [Green Version]
  14. Cummings, C.; Stewart, M.; Stevenson, M.; Morrow, J.; Nelson, J. Neurodevelopment of Children Exposed in Utero to Lamotrigine, Sodium Valproate and Carbamazepine. Arch. Dis. Child. 2011, 96, 643–647. [Google Scholar] [CrossRef] [PubMed] [Green Version]
  15. Atkinson, D.E.; Brice-Bennett, S.; D’Souza, S.W. Antiepileptic Medication during Pregnancy: Does Fetal Genotype Affect Outcome? Pediatr. Res. 2007, 62, 120–127. [Google Scholar] [CrossRef]
  16. Hai, F.I.; Nghiem, L.D.; Khan, S.J.; Price, W.E.; Yamamoto, K. Wastewater Reuse: Removal of Emerging Trace Organic Contaminants. In Membrane Biological Reactors: Theory, Modeling, Design, Management and Applications to Wastewater Reuse; IWA Publishing: London, UK, 2014; ISBN 978-1-78040-065-5. [Google Scholar]
  17. Vieno, N.; Tuhkanen, T.; Kronberg, L. Elimination of Pharmaceuticals in Sewage Treatment Plants in Finland. Water Res. 2007, 41, 1001–1012. [Google Scholar] [CrossRef]
  18. Ying, G.-G.; Kookana, R.S.; Kolpin, D.W. Occurrence and Removal of Pharmaceutically Active Compounds in Sewage Treatment Plants with Different Technologies. J. Environ. Monit. 2009, 11, 1498–1505. [Google Scholar] [CrossRef]
  19. Tixier, C.; Singer, H.P.; Oellers, S.; Müller, S.R. Occurrence and Fate of Carbamazepine, Clofibric Acid, Diclofenac, Ibuprofen, Ketoprofen, and Naproxen in Surface Waters. Environ. Sci. Technol. 2003, 37, 1061–1068. [Google Scholar] [CrossRef]
  20. Wijekoon, K.C.; Hai, F.I.; Kang, J.; Price, W.E.; Guo, W.; Ngo, H.H.; Nghiem, L.D. The Fate of Pharmaceuticals, Steroid Hormones, Phytoestrogens, UV-Filters and Pesticides during MBR Treatment. Bioresour. Technol. 2013, 144, 247–254. [Google Scholar] [CrossRef]
  21. Guo, Y.C.; Krasner, S.W. Occurrence of Primidone, Carbamazepine, Caffeine, and Precursors for N-Nitrosodimethylamine in Drinking Water Sources Impacted by Wastewater1. JAWRA J. Am. Water Resour. Assoc. 2009, 45, 58–67. [Google Scholar] [CrossRef]
  22. Luo, Y.; Guo, W.; Ngo, H.H.; Nghiem, L.D.; Hai, F.I.; Zhang, J.; Liang, S.; Wang, X.C. A Review on the Occurrence of Micropollutants in the Aquatic Environment and Their Fate and Removal during Wastewater Treatment. Sci. Total Environ. 2014, 473, 619–641. [Google Scholar] [CrossRef] [PubMed]
  23. Villota, N.; Lombraña, J.I.; Cruz-Alcalde, A.; Marcé, M.; Esplugas, S. Kinetic Study of Colored Species Formation during Paracetamol Removal from Water in a Semicontinuous Ozonation Contactor. Sci. Total Environ. 2019, 649, 1434–1442. [Google Scholar] [CrossRef]
  24. Mijangos, F.; Varona, F.; Villota, N. Changes in Solution Color During Phenol Oxidation by Fenton Reagent. Environ. Sci. Technol. 2006, 40, 5538–5543. [Google Scholar] [CrossRef] [PubMed]
  25. Villota, N.; Lomas, J.M.; Camarero, L.M. Study of the Paracetamol Degradation Pathway That Generates Color and Turbidity in Oxidized Wastewaters by Photo-Fenton Technology. J. Photochem. Photobiol. A Chem. 2016, 329, 113–119. [Google Scholar] [CrossRef]
  26. Villota, N.; Ferreiro, C.; Qulatein, H.A.; Lomas, J.M.; Camarero, L.M.; Lombraña, J.I. Colour Changes during the Carbamazepine Oxidation by Photo-Fenton. Catalysts 2021, 11, 386. [Google Scholar] [CrossRef]
  27. Sun, S.; Yao, H.; Fu, W.; Liu, F.; Wang, X.; Zhang, W. Enhanced Degradation of Carbamazepine in FeOCl Based Photo-Fenton Reaction. J. Environ. Chem. Eng. 2021, 9, 104501. [Google Scholar] [CrossRef]
  28. Yao, W.; Qu, Q.; von Gunten, U.; Chen, C.; Yu, G.; Wang, Y. Comparison of Methylisoborneol and Geosmin Abatement in Surface Water by Conventional Ozonation and an Electro-Peroxone Process. Water Res. 2017, 108, 373–382. [Google Scholar] [CrossRef]
  29. Oturan, M.A.; Aaron, J.-J. Advanced Oxidation Processes in Water/Wastewater Treatment: Principles and Applications. A Review. Crit. Rev. Environ. Sci. Technol. 2014, 44, 2577–2641. [Google Scholar] [CrossRef]
  30. Ahmed, M.M.; Chiron, S. Solar Photo-Fenton like Using Persulphate for Carbamazepine Removal from Domestic Wastewater. Water Res. 2014, 48, 229–236. [Google Scholar] [CrossRef]
  31. Expósito, A.J.; Monteagudo, J.M.; Durán, A.; San Martín, I.; González, L. Study of the Intensification of Solar Photo-Fenton Degradation of Carbamazepine with Ferrioxalate Complexes and Ultrasound. J. Hazard. Mater. 2018, 342, 597–605. [Google Scholar] [CrossRef] [PubMed]
  32. Guo, Q.; Zhu, W.; Yang, D.; Wang, X.; Li, Y.; Gong, C.; Yan, J.; Zhai, J.; Gao, X.; Luo, Y. A Green Solar Photo-Fenton Process for the Degradation of Carbamazepine Using Natural Pyrite and Organic Acid with in-Situ Generated H2O2. Sci. Total Environ. 2021, 784, 147187. [Google Scholar] [CrossRef] [PubMed]
  33. Casierra-Martinez, H.A.; Madera-Parra, C.A.; Vargas-Ramírez, X.M.; Caselles-Osorio, A.; Torres-López, W.A. Diclofenac and Carbamazepine Removal from Domestic Wastewater Using a Constructed Wetland-Solar Photo-Fenton Coupled System. Ecol. Eng. 2020, 153, 105699. [Google Scholar] [CrossRef]
  34. BOE.Es—BOE-A-2003-3596 Royal Decree 140/2003, of February 7th, Establishing Sanitary Criteria for the Quality of Water for Human Consumption. Available online: https://www.boe.es/buscar/doc.php?id=BOE-A-2003-3596 (accessed on 24 June 2021).
  35. BOE.Es—BOE-A-2007-21092 Royal Decree 1620/2007, of December 7th, Establishing the Legal Regime for the Reuse of Purified Waters. Available online: https://www.boe.es/buscar/doc.php?id=BOE-A-2007-21092 (accessed on 24 June 2021).
  36. De Laurentiis, E.; Chiron, S.; Kouras-Hadef, S.; Richard, C.; Minella, M.; Maurino, V.; Minero, C.; Vione, D. Photochemical Fate of Carbamazepine in Surface Freshwaters: Laboratory Measures and Modeling. Environ. Sci. Technol. 2012, 46, 8164–8173. [Google Scholar] [CrossRef] [Green Version]
  37. Krakstrom, M.; Saeid, S.; Tolvanen, P.; Kumar, N.; Salmi, T.; Kronberg, L.; Eklund, P. Ozonation of Carbamazepine and Its Main Transformation Products: Product Determination and Reaction Mechanisms. Environ. Sci. Pollut. Res. 2020, 27, 23258–23269. [Google Scholar] [CrossRef] [PubMed]
  38. McDowell, D.C.; Huber, M.M.; Wagner, M.; von Gunten, U.; Ternes, T.A. Ozonation of Carbamazepine in Drinking Water:  Identification and Kinetic Study of Major Oxidation Products. Environ. Sci. Technol. 2005, 39, 8014–8022. [Google Scholar] [CrossRef] [PubMed]
Figure 1. (a) Turbidity analyzed on aqueous solutions containing different PhACs oxidized by photo-Fenton. Experimental conditions: (C) = 50.0 mg/L; pH = 3.0; (H2O2) = 15.0 mM; (Fe) = 10.0 mg/L; (UV) = 150 W; T = 25 °C. (b) Water quality indicators analyzed during the carbamazepine oxidation by photo-Fenton. Experimental conditions: (CBZ) = 50.0 mg/L; pH = 3.0; (H2O2) = 2.0 mM; (Fe) = 10.0 mg/L; (UV) = 150 W; T = 25 °C.
Catalysts 11 00894 g001
Figure 2. (a) pH effect on turbidity changes in a photo-Fenton system during the carbamazepine oxidation. (b) Equilibrium-species in carbamazepine aqueous solutions oxidized at pH = 4.0 by photo-Fenton treatment. Experimental conditions: (CBZ) = 50.0 mg/L; (H2O2) = 15.0 mM; (Fe) = 10.0 mg/L; (UV) = 150 W; T = 40 °C.
Catalysts 11 00894 g002
Figure 3. Equilibrium-species in carbamazepine aqueous solutions oxidized by photo-Fenton treatment. (a) Operating at pH = 2.0. (b) Operating at pH = 5.0. Experimental conditions: (CBZ) = 50.0 mg/L; (H2O2) = 15.0 mM; (Fe) = 10.0 mg/L; (UV) = 150 W; T = 40 °C.
Catalysts 11 00894 g003
Figure 4. (a) Effect of hydrogen peroxide concentration ((Oxidant), mM) on turbidity changes in a photo-Fenton system during the carbamazepine oxidation. (b) Effect of hydrogen peroxide on the solutions turbidity once achieved the steady state. Experimental conditions: (CBZ) = 50.0 mg/L; pH = 3.0; (Fe) = 10.0 mg/L; (UV) = 150 W; T = 40 °C.
Catalysts 11 00894 g004
Figure 5. (a) Equilibrium-species in carbamazepine aqueous solutions oxidized by photo-Fenton treatment operating at pH = 3.0. (b) Molecular structure in 2D and 3D of possible coordination iron complex BaQD-Fe(III) causing turbidity in water. Experimental conditions: (CBZ) = 50.0 mg/L; pH = 3.0; (H2O2) = 2.0 mM; (Fe) = 10.0 mg/L; (UV) = 150 W; T = 40 °C.
Catalysts 11 00894 g005
Figure 6. (a) Effect of iron catalyst on turbidity changes in a photo-Fenton system during the carbamazepine oxidation. (b) Effect of iron concentration on the solutions turbidity once the steady state is achieved. Experimental conditions: (CBZ) = 50.0 mg/L; pH = 3.0; (H2O2) = 15.0 mM; (UV) = 150 W; T = 40 °C.
Catalysts 11 00894 g006
Figure 7. Chromatographic profile of a methanol blank (black line) and samples (red, blue, orange and green line).
Catalysts 11 00894 g007
Figure 8. Chromatographic profile of the major compounds detected in the sample of carbamazepine oxidized to pH = 2.0. Experimental conditions: (CBZ) = 50.0 mg/L; (Fe) = 10 mg/L; (H2O2) = 15.0 mM; T = 25 °C; (UV) = 150 W.
Catalysts 11 00894 g008
Figure 9. Chromatographic profile of the major compounds detected in the sample of carbamazepine oxidized to pH = 3.0. Experimental conditions: (CBZ) = 50.0 mg/L; (Fe) = 10 mg/L; (H2O2) = 15.0 mM; T = 25 °C; (UV) = 150 W.
Catalysts 11 00894 g009
Figure 10. Chromatographic profile of the major compounds detected in the sample of carbamazepine oxidized to pH = 4.0. Experimental conditions: (CBZ) = 50.0 mg/L; (Fe) = 10 mg/L; (H2O2) = 15.0 mM; T = 25 °C; (UV) = 150 W.
Catalysts 11 00894 g010
Figure 11. Chromatographic profile of the major compounds detected in the sample of carbamazepine oxidized to pH = 5.0. Experimental conditions: (CBZ) = 50.0 mg/L; (Fe) = 10 mg/L; (H2O2) = 15.0 mM; T = 25 °C; (UV) = 150 W.
Catalysts 11 00894 g011
Figure 12. Excerpt chromatogram of standards (EIC) of 1 ppm CBZ, acridone, acridin, Oxo-CBZ, Epoxi-CBZ, 10-OH CBZ, malonic acid and 4-aminophenol.
Catalysts 11 00894 g012
Table 1. Standards analyzed.
CompoundTr, minm/z
4-aminophenol1.3110.0600
Malonic acid1.8105.0182
10-OH CBZ5.8255.1128
Epoxi-CBZ8.2253.0972
Oxo-CBZ9.1253.0972
9-acridanone9.9196.0757
Acridin-9-ol9.9196.0757
CBZ11.2237.1022
Table 2. Results of quantitative analysis, concentrations in μg/mL.
CompoundpH = 2.0pH = 3.0pH = 4.0pH = 5.0
CBZ1.810.834.417.0
Oxo-CBZ˂LQL0.250.210.037
Epoxi-CBZ----
10-OH CBZ˂LQL0.0650.0220.013
9-acridanone and acridin-9-ol0.0130.0260.0040.010
4-aminophenoln.d.n.d.n.d.n.d.
Malonic acidn.d.n.d.n.d.n.d.
n.d.: not detected, LQL: lower quantification limit (0.002 μg/mL).
Table 3. Limit of quantification values (LOQ) and limit of detection values (LOD) of CBZ and the detected degradation intermediates in water.
CompoundLOQ
(ng/mL)
LOD
(ng/mL)
CBZ10030
Oxo-CBZ20.6
10-OH CBZ20.6
9-acridanone10.3
Acridin-9-ol10.3
Table 4. Linearity values of CBZ and the detected degradation intermediates in water.
CompoundRange
(µg/mL)
Regression
Equation
R2
CBZ0.1–50y = 3.580 x + 6.3400.998
Oxo-CBZ0.002–0.5y = 2.933 x + 5.4800.998
10-OH CBZ0.002–0.5y = 2.008 x + 3.1460.993
9-acridanone0.001–0.5y = 5.298 x + 9.6360.998
Acridin-9-ol0.001–0.5y = 5.034 x + 8.9960.998
Table 5. Specificity values of CBZ and the detected degradation intermediates in water.
CompoundParameterAmount Added
(µg/mL)
Amount Recovered
(µg/mL)
Degradation
(%)
CBZAcidic degradation25.0524.581.87
Alkaline degradation25.0524.293.04
Solar light25.0524.870.71
OX-CBZAcidic degradation0.2510.2462.03
Alkaline degradation0.2510.2413.87
Solar light0.2510.2490.98
10-OH CBZAcidic degradation0.2510.2471.54
Alkaline degradation0.2510.2404.20
Solar light0.2510.2490.85
AcridanoneAcidic degradation0.25050.24641.64
Alkaline degradation0.25050.24123.72
Solar light0.25050.24800.99
Acridin 9-olAcidic degradation0.25050.24472.31
Alkaline degradation0.25050.24183.47
Solar light0.25050.24791.02
Table 6. Accuracy values of CBZ and the detected degradation intermediates in water.
CompoundRange
(µg/mL)
Recovery
(Mean ± % RSD)
CBZ0.1–50100.05 ± 0.023
Oxo-CBZ0.002–0.5100.24 ± 0.030
10-OH CBZ0.002–0.5100.56 ± 0.011
9-acridanone0.001–0.5100.08 ± 0.007
Acridin-9-ol0.001–0.5100.91 ± 0.024
Table 7. Precision values of CBZ and the detected degradation intermediates in water.
CompoundConcentration
(µg/mL)
Standard SolutionSample SolutionMeanSD% RSD
Intraday
Precision
Interday
Precision
Intraday
Precision
Inter-Day
Precision
CBZ25.0596.019096.979298.018898.908097.481298.73520.0128
OX-CBZ0.2516.21646.15426.06966.09086.13286.19880.0108
10-OH CBZ0.2513.65003.75953.84753.72643.74593.82790.0118
Acridanone0.250510.963310.634410.802710.799610.800010.9340.0124
Acridin 9-ol0.250510.257010.154410.056010.368810.209110.34310.0131
Publisher’s Note: MDPI stays neutral with regard to jurisdictional claims in published maps and institutional affiliations.

