Article

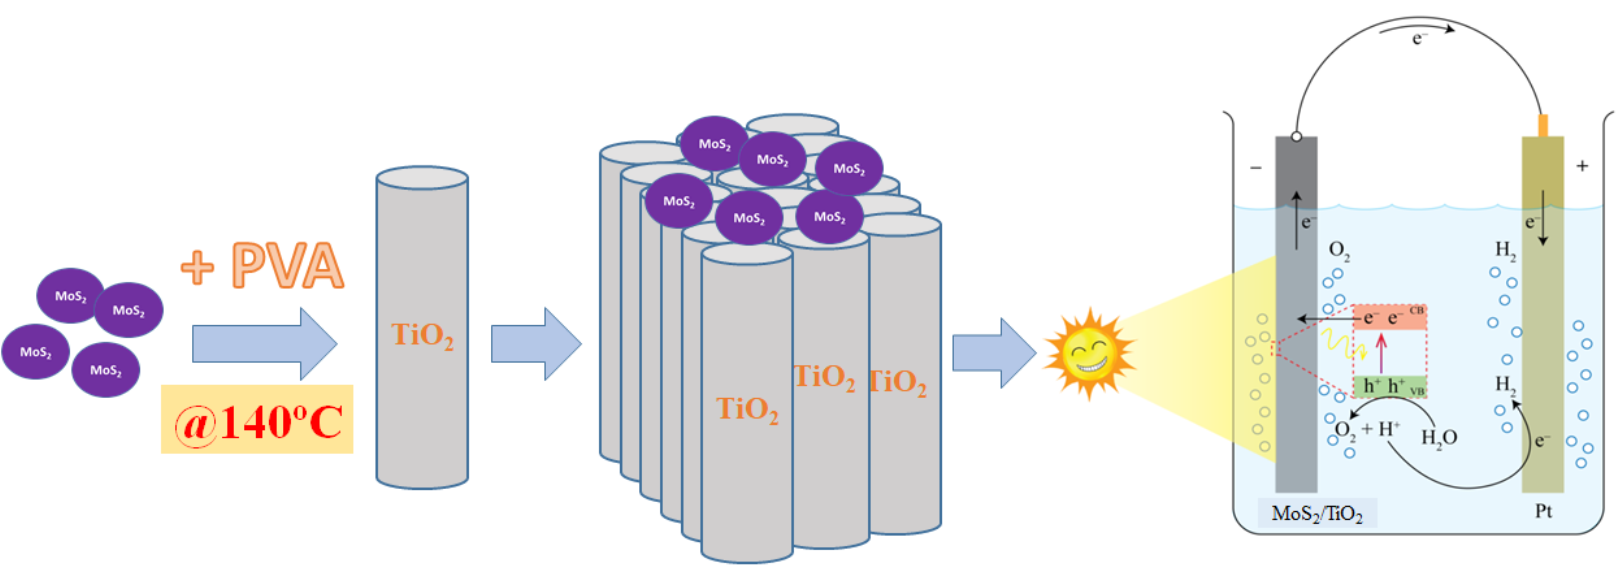
Thermal Treatment of Polyvinyl Alcohol for Coupling MoS2 and TiO2 Nanotube Arrays toward Enhancing Photoelectrochemical Water Splitting Performance

1
Ho Chi Minh City University of Technology (HUTECH), 475A Dien Bien Phu Street, Binh Thanh District, Ho Chi Minh City 700000, Vietnam
2
Faculty of Materials Science and Technology, University of Science, VNU-HCM, 227 Nguyen Van Cu Street, District 5, Ho Chi Minh City 700000, Vietnam
3
Vietnam National University—Ho Chi Minh City, Thu Duc District, Ho Chi Minh City 700000, Vietnam
4
Institute of Technical Chemistry, Gottfried Wilhelm Leibniz University of Hannover, Callinstr. 5, D-30167 Hannover, Germany
*
Authors to whom correspondence should be addressed.
Catalysts 2021, 11(7), 857; https://doi.org/10.3390/catal11070857
Submission received: 27 May 2021 / Revised: 15 July 2021 / Accepted: 16 July 2021 / Published: 17 July 2021
(This article belongs to the Special Issue Recent Advances in Visible-Light-Driven Heterogeneous Photocatalysis)

Abstract

:
Solar-driven photoelectrochemical (PEC) water splitting, using semiconductor photoelectrodes, is considered a promising renewable energy source and solution for environmental sustainability. Herein, we report polyvinyl alcohol (PVA) as a binder material for combining MoS2 and TiO2 nanotube arrays (TNAs) to improve PEC water splitting ability. By a thermal treatment process, the formation of the π conjunction in the PVA structure enhanced the PEC performance of MoS2/TNAs, exhibiting linear sweeps in an anodic direction with the current density over 65 μA/cm2 at 0 V vs. Ag/AgCl. Besides, the photoresponse ability of MoS2/TNAs is approximately 6-fold more significant than that of individual TNAs. Moreover, a Tafel slope of 140.6 mV/decade has been obtained for the oxygen evolution reaction (OER) of MoS2/TNAs materials.

Graphical Abstract

1. Introduction

Photoelectrochemical (PEC) water splitting based on semiconductor photoanodes has rapidly developed as an alternative energy production approach due to its simple fabrication process and environmental friendliness [1,2,3,4]. Fujishima and Honda first discovered the water-splitting in 1972 over TiO2 nanomaterials for the hydrogen evolution reaction (HER) and oxygen evolution reaction (OER). Since then, many studies have focused on developing and improving semiconductor photoelectrode performances and increasing large-scale synthesizing for PEC water splitting [5]. TiO2 nanotube arrays (TNAs) are often modified to extend the photoresponse range by combining with a noble metal, creating self-defects, and coupling with other semiconductors to improve the material working efficiency [6,7]. Especially, TNAs modified by MoS2 demonstrated superior performance in the water-splitting process due to their suitable redox for both HER and OER [8,9,10]. There are many routes to modify TNAs by MoS2 that demonstrated promising results, i.e., the hydrothermal method [11,12], physical vapor deposition [13], and chemical vapor deposition [14]. However, they are challenging for industrial-scale applications because of their complex synthesis conditions and small synthesis scale.
Polyvinyl alcohol (PVA) is an inexpensive and widely used polymer. It is readily synthesized in the form of a semicrystalline polymer, which has remarkable properties such as good film-forming ability, thermal and mechanical stability, etc. [15]. In addition, the substantial dispersion of PVA allows it to perform as a proton exchange membrane in fuel cell applications [16,17]. However, PVA is a nonconductive polymer, making it not easily applied for photoelectronic fields. Modification of PVA to form a conductive polymer throughout π conjugated bonds was proposed as a potential solution. The conjugated PVA (cPVA) connects p orbitals with delocalized electrons in a molecule, lowering the overall energy of the molecule and increasing its stability. In addition, the conjugation is formed by the interaction of unhybridized p atomic orbitals on atoms employing sp2- and sp-hybridization, ensuring that the π system of the molecule is created [18,19]. Therefore, some physical conditions, such as annealing temperature treatment or chemical modifications with the support of cross-linkers, may be employed to generate cPVA from commercial PVA [20,21,22].
In this study, we developed a new strategy for combining MoS2 and TNAs by using the cPVA binding agent that is formed by a low thermal treatment process. To the best of our knowledge, there is no report on using cPVA to combine two semiconductor materials to enhance PEC performance. The formation of cPVA and its effect on the PEC ability of MoS2/TNAs is also clearly explained.

2. Results and Discussion

The FTIR technique was used to evaluate the formation of the π conjugated network in the PVA structure with the C=O and C=C vibration signals. Figure 1 reveals the FTIR spectra of pure PVA and cPVA treated by thermal route from 100 °C to 180 °C. In general, the FTIR spectra of all samples show specific peaks centered at 3400 cm−1 and 1725 cm−1 corresponding to the stretching vibration of the OH group and the C=O stretching, respectively [23]. In addition, the peaks in the 940–670 cm−1 region correspond to the C=C vibration, while the peaks at 1320–1030 cm−1 region correspond to C–O stretching vibrations [23]. The peaks located at the region from 2944 cm−1 to 2907 cm−1 are characterized for stretching vibration of C–H on the backbone of PVA [23,24]. As can be observed, the backbone vibration of PVA remains even after thermal treatment from 100 °C to 160 °C. The peak intensity of the C=O vibration is significantly enhanced, whereas the peak intensity of the O–H vibration is reduced by increasing the thermal treatment temperature from 100 °C to 160 °C. Furthermore, the vibration around 1435 cm−1 corresponds to the bending vibration of the OH radical that directly bonds to the C=O radicals in the cPVA structure, which distinguishes it from intramolecular vibration [22,23]. These results indicated that the formation of acetal bridge (C=O bonds) is directly related to the decrease in OH by thermal treatment. However, vibrations such as C–OH, and C=O are very low or not obtained in pristine PVA. The intensity of C=O vibrations increases with the increasing temperature of the thermal treatment and reaches the highest intensity at 140 °C following the decrease in OH intensity.
The absorbance ratio of C=O and OH vibration was calculated for the thermally treated PVA from 100 °C to 160 °C to support the abovementioned argument. Thus, the peak intensity ratio of C=O and OH vibration for the PVA@100 is about 0.71. Meanwhile, PVA@120 is about 0.81, which is much higher than PVA@140 (1.28). However, when the treated temperature is increased up to 160 °C, the peak intensity of OH vibration is decreased without increasing C=O vibration intensity. Specifically, the peak intensity ratio of the C=O vibration and OH vibration of PVA@160 is around 0.88, much lower than PVA@140. When the temperature reaches 180 °C, the structure of PVA seems to be decomposed. The vibration of the OH groups in a range of 3700–3000 cm−1 cannot be observed clearly, and the vibration of C=O, HO–C bonds almost disappears. The remained vibrations are observed at 842 cm−1, corresponding to the C=C bond, and a band in the range of 1026–1430 cm−1 is attributed to the C–O vibration with a very weak signal. Besides, the colorless state of PVA had been changed into deep yellow after undergoing thermal treatment at 180 °C. All these phenomena above support the hypothesis that self-conjunction occurs through the dehydration process of the OH groups on the PVA chain to form the π conjunction network.
Figure 2 shows the cyclic voltammograms (CV) curves under dark condition of samples that were polarized from the resting potential to 1 V and back to −1 V vs. Ag/AgCl in 1 M Na2SO4 electrolyte solution. As in previous publications, the specific surface area of TNAs is high due to their tubular structures that contribute on an extension of spacing for the rapid diffusion of electrolyte ions leading to an increase the capacitive performance [25,26]. As a result, a characteristic anodic peak in the range −1 < E < −0.5 V appeared relating to the reduction of Ti4+ to Ti3+ ions, indicating that the high density of Ti3+ states causes low resistances and that an increase in current occurred [27,28]. In addition, a cathodic range corresponds to the H+ depolarization region of these materials, expressing more electrochemical activity that was observed [29,30]. Obviously, the electrochemical activity of MoS2@PVA/TNAs@140 is the highest and the anodic peak of this sample is shifted from −0.7 V vs. Ag/AgCl to −0.5 V vs. Ag/AgCl compared to TNAs. The outstanding electrochemical activity of MoS2@PVA/TNAs@140 composites is also shown through the difference in their CV characteristics with the individual materials such as TNAs, MoS2, and cPVA (Figure S1). Moreover, FTIR results (Figure 1) meant that it could be concluded that a high temperature could destroy the structure of PVA, the π conjunction will be destructed, leading to the vanishment of the current density [31].
The XRD patterns of materials are measured and shown in Figure 3. The diffraction peaks of the pristine TNAs (black line) can be easily observed at 2θ = 25.43°, 38.08°, 54.15°, and 55.17° corresponding to the planes of (101), (004), (105), and (211) of the anatase phase, respectively (JCPDS No. 88–1175). The XRD pattern of MoS2 (purple line) shows the crystallization and single phase of MoS2 with the hexagonal crystal structure. In detail, the diffraction peaks (2θ) positioned at 13.96° and 33.49°, correspond to the (002) and (100) planes of the 2H−MoS2 phase, respectively (JCPDS No. 37–1492). The XRD pattern of the pure PVA (green line) exhibits characteristic peaks at 19.55° and 22.70°, corresponding to the (101) and (210) planes, respectively. Besides, a weak diffraction peak is also observed at 2θ = 40.5°, which is related to the semi-crystalline nature of PVA [32]. The XRD result of the MoS2@PVA/TNAs@140 sample (red line) shows that three diffraction peaks at 2θ = 19.85°, 25.45°, and 33.5°, corresponding to cPVA, (100) plane of 2H−MoS2 phase, and (101) plan of anatase TiO2, respectively. The diffraction peak position at 2θ = 19.85° observed at MoS2@PVA/TNAs@140 diffractogram is supposed to correspond to the formation of C=O or C=C bonds in the cPVA [33]. This result confirmed the formation of cPVA after being treated at 140 °C.
Furthermore, the FTIR spectra of TNAs, MoS2, PVA, and MoS2@PVA/TNAs@140 are measured to confirm the vibration of bonds and are shown in Figure 3b. A typical vibration peak at 475 cm−1 represents the Ti–O– bond in TNAs, and characteristic vibrations throughout many broad absorption bands from 1623 cm−1 to 430 cm−1 are seen of the MoS2 sample, attributed to the Mo−S vibration [34,35]. The FTIR spectrum of pristine PVA shows strong absorption bands at the wavenumbers of 2930 cm−1, 1725 cm−1, 1640 cm−1, 1440, and 1030 cm−1 to 1320 cm−1 range, corresponding to the stretching vibration of the C–H on the backbone of PVA, C=O stretching, C=C stretching, C–H bending, and C–O stretching, respectively [36]. The formation of conjugated bonds in the cPVA structure was confirmed by a decrease in the –OH absorbance intensity and a significant increase in the intensity of the characteristic peak of the C=O group at 1725 c cm−1 in MoS2@PVA/TNAs@140 sample. This result is consistent with the result for the effect of thermal treatment on PVA seen in Figure 1.
Figure 4 shows SEM images of materials depicting the morphology and microstructure of the TNAs, MoS2, and MoS2@PVA/TNAs@140 samples. The results demonstrate that the average diameter of the tubular TiO2 is about 80–100 nm (Figure 4a), while the MoS2 has many layers stacked on top of each other, similar to fish-flake structures (Figure 4b). As shown in Figure 4c, TNAs were covered by additional material layers attributed to the MoS2 in the cPVA matrix. In addition, the difference of the MoS2 morphology could be explained due to the contribution of cPVA after the thermal treatment process, as seen in Figure 4b,c.
The LSV of the materials is measured to evaluate the PEC performance. The photoresponse ability of the materials was then evaluated with an applied potential at 0 V vs. Ag/AgCl. Figure 5a shows that the current density of TNAs versus applied potential is higher under visible light than that of dark conditions. In detail, the onset potential of TNAs is obtained at −0.42 V vs. Ag/AgCl in the dark, while it is achieved at −0.55 V vs. Ag/AgCl with the highest current density (11.2 µA) under visible light. Besides, the LSV results of MoS2 in both dark and light conditions are not significantly different. The onset potential was obtained at −0.2 V vs. Ag/AgCl. On the other hand, the combination of MoS2 and TNAs with a cPVA binding agent indicated an efficient result for OER ability compared to other materials such as TNAs, MoS2, and cPVA (Figure S2). In detail, the onset potential of the MoS2@PVA/TNAs@140 sample is obtained at around −0.78 V vs. Ag/AgCl. A current density slope increases from −0.54 V vs. Ag/AgCl and readily reaches saturation at around 0.25 V vs. Ag/AgCl with a current density of about 83.4 μA/cm2. Furthermore, Figure 5b shows that the photoresponse ability of MoS2 is the lowest, with a different current density between dark and light conditions of just about 1.0 μA/cm2. In contrast, the current density of TNAs is around 11.0 μA/cm2, but it is not stable after five cycles. Specifically, the current density of MoS2@PVA/TNAs@140 surpasses 65.0 μA/cm2 at 0 V vs. Ag/AgCl in the first cycle of visible light irradiation, which is double that of MoS2/TNAs@140. Moreover, even after five cycles of “on-off” visible light irradiation, the photoresponse ability of the MoS2@PVA/TNAs@140 sample was highly stable. In addition, the enhanced PEC water splitting potential window of the MoS2@PVA/TNAs@140 composite for the Na2SO4 electrolyte is also indicated as Figure S3.
The EIS plots have been obtained to study the effect of the modified material MoS2@PVA/TNAs@140 on the charge transfer at an electrolyte/electrode interface. Figure 6a shows the single semicircle for all samples in typical Nyquist plots that express the charge transfer resistance equivalent to the polarization resistance [37]. In addition, Figure 6a shows that MoS2 demonstrates the largest radius semicircle, followed by TNAs, indicating a weak interaction between pristine TNAs and MoS2 with electrolytes. Furthermore, Figure 6a shows a depressed semicircle of the MoS2@PVA/TNAs@140 sample compared to the others. This indicates a decrease in the solid-state interface layer resistance and the charge transfer resistance across the solid–liquid junction on the surface by the support of cPVA [38]. The depressed semicircle also indicates an enhancement in carrier density of MoS2@PVA/TNAs@140 due to a decrease in resistance. This proved that the support of the π conjunction in enhancing electrical conduction increases the interaction of the electrode and the electrolyte. The Tafel slope, shown in Figure 6b, is an important parameter for evaluating the PEC activity in water splitting. The small Tafel slope value indicates a rapid increase in the reaction rate, with the applied potential corresponding to the high electrical conduction rate shown in the Nyquist plot. Figure 6b demonstrates that the MoS2@PVA/TNAs@140 has the smallest Tafel slope value of 140.6 mV/decade, while TNAs and MoS2 have 169.4 mV/decade and 1849 mV/decade, respectively. MoS2@PVA/TNAs@140 shows a similar result to previous studies on MoS2/TiO2 materials synthesized by other methods [39]. These results indicate that the MoS2/TNAs could be easily synthesized by combining MosS2 with TNAs with a cPVA binding agent.
Mott–Schottky measurements of TNAs, MoS2, and MoS2@PVA/TNAs@140 samples have been carried out to investigate further the behavior of electrons (e) and holes (h+) on the enhanced PEC activity (Figure 7a). The positive slopes in the Mott–Schottky plots indicate that all samples have n-type semiconductor properties. It is well known that the flat band potential (Efb) measured from the Mott–Schottky plot for n-type semiconductors is attributed to the lowest conduction band (CB) [40,41]. The plot of 1/C2 vs. potential shows an intercept of the x-axis, which corresponds to the flat band potential of the material. As expected, the Efb for TNAs, a well-known n-type semiconductor, is determined to be −0.89 V (V vs. Ag/AgCl, pH 7.3), which is consistent with earlier publications [42]. The Efb level for the MoS2 is determined to be −0.98 V (V vs. Ag/AgCl, pH 7.3), while the Efb of MoS2@PVA/TNAs@140 is found to be −0.94 V (V vs. Ag/AgCl). A negative shift of the flat band potential for MoS2@PVA/TNAs@140 proves that the recombination of the e-h+ pairs has been decreased remarkably [43]. Notably, the MoS2@PVA/TNAs@140 sample shows a substantially smaller slope of the curve than the pristine TNAs and MoS2, indicating a significant increase in the carrier density [43,44].
Figure 7b shows the DRS spectra obtained to evaluate the energy band diagram of materials. As can be seen, the DRS spectrum of TNAs shows a strong absorption band edge at 390–395 nm regions. Meanwhile, the absorption edge of MoS2 extends from the UV to the visible light range. The combination of TNAs and MoS2 possesses a strong light-harvesting ability. In detail, a redshift from 395 nm to 420 nm results in an enhance in photoactivity of MoS2@PVA/TNAs@140 in the visible light region. This demonstrated a crucial role of MoS2 in increasing the photoresponse in the visible light region. Figure 7c depicts the Tauc plots of materials from which the band gaps of TNAs, MoS2, and MoS2@PVA/TNAs @140 were calculated to be 3.2, 1.46, and 2.95 eV, respectively.
According to previous studies, the bandgap of MoS2 can be oscillated from 1.0 eV to 1.9 eV by reducing the atomic-scale thickness from bulk to monolayer [45]. Based on the DRS spectra and Mott–Schottky results, the energy band diagram of the MoS2 and TNAs heterojunction was performed and shown in Figure 7c. The formation of this type II heterojunction could promote the migration of h+ and e under excitation. Additionally, this result indicated the separation of e-h+ pairs. According to Equation (1), the h+ can migrate from the valence band (VB) of the TNAs to the VB of MoS2, and then react with H2O at the electrolyte contact.
2 OH + 2 h +   O 2 + 2 H + + 2 e
It is commonly known that in neutral aqueous media, water splitting involves two processes. The first process is the oxidation process of water, meaning the reaction of the water with the h+ charges to release free H+ ions and O2 [46]. At the same period, the e can move back from the CB of MoS2 to the CB of TNAs. For the second process, free H+ ions are reduced at the cathode according to Equation (2):
2 H + + 2 e     H 2
The more H2O oxidation reactions in Na2SO4 solution occur at WE, the more e and H+ ions are generated. This result strengthens our theory for a reason related to the enhancement of OER at the WE, which subsequently releases free H+ ions to react at the CE to evolve the H2 molecule.

3. Experimental Section

3.1. Chemicals and Materials

Titanium foil (Ti, 0.25 mm of thickness, 99.6%), ammonium fluoride (NH4F, 99.9%), ethylene glycol (C2H6O2, 99.9%), sodium chloride (NaCl, 99.9%), sodium sulfate (Na2SO4, 99.9%), ammonium molybdate (VI) tetrahydrate ((NH4)6Mo7O24•4H2O, 81–83%), N−Acetyl−L−cystine (NAC, C5H9NO3S, 98.0%), thiourea (CH4N2S, 99.9%), polyvinyl alcohol ((C2H4O)n, 99.0%), polyvinyl alcohol (PVA, 99.9%), and deionized water (Milli−Q, 18 MΩcm) were used for the preparation of the composites, solutions and/or for the rinsing steps.

3.2. Synthesis of TNAs by an Anodization Method

TNAs were synthesized by an anodization method, following the previous study [47]. First, Ti foils were cut into 1 × 2 cm and were ultrasonically washed in an acetone solution for 15 min before being soaked in an anhydrous ethanol solution for 15 min. Second, Ti foils were anodized in 2 steps at 30 V for 150 min using a DC power source in 45 mL of an electrolyte containing 40.5 mL of ethylene glycol, 4.5 mL DI water, and 0.25 mg NH4F. Finally, the foils were washed, dried, and annealed at 400 °C for 2 h.

3.3. Synthesis of MoS2 by a Hydrothermal Method

MoS2 powder was synthesized by a hydrothermal method according to the previous study in ref. [48] with the following parameters: The first step was to dissolve 37.08 mg of (NH4)6Mo7O24•4H2O in 40 mL of DI water in an ice bath. Following that, 65.28 mg of NAC and 30.45 mg of thiourea were added. The solution was then stirred for an hour while being purged with Ar gas to remove the oxygen gas. Subsequently, the mixture was transferred into an autoclave and kept at 200 °C for 24 h. Finally, the black precipitates were washed with ethanol and dried at 60 °C in Ar gas conditions for 12 h.

3.4. Thermal Treatment of PVA for the Formation MoS2@PVA/TNAs Materials

Initially, 1 g PVA powder was dissolved in 99 mL DI water to form a PVA solution. Afterward, the MoS2 powder was homogeneously dispersed in 3 mg/L PVA solutions by a sonication treatment for an hour. Finally, 0.2 mL of each solution was dropped onto the surface of TNAs and treated at different temperatures ranging from 100 °C to 180 °C in an Ar gas atmosphere. The samples were denoted as MoS2@PVA/TNAs@100, MoS2@PVA/TNAs@120, MoS2@PVA/TNAs@140, MoS2@PVA/TNAs@160, and MoS2@PVA/TNAs@180, where the numbers represent the treatment temperatures.
To evaluate the thermal effect on the formation of cPVA structure, the pristine PVA was thermally treated from 100 to 180 °C in Ar gas, denoted as PVA@100 to PVA@180, respectively, before being analyzed by FTIR technique.

3.5. Characterizations and PEC Evaluation of Materials

FTIR spectroscopy was used to detect the vibration mode of molecules, the chemical bond of PVA, and the confirmation of the formation of cPVA using an FTIR spectrophotometer (JASCO-4700, Tokyo, Japan). X-ray diffraction (XRD) using Cu−Kα radiation (λ = 0.15405 nm, 45 kV and 40 mA) was employed to determine the crystal structures and phase state of materials. The morphology of the materials was determined by scanning electron microscopy (SEM) using FESEM equipment, Hitachi S-4800 (Tokyo, Japan) at 10.0 kV. The optical bandgap of the materials was characterized by UV-Vis diffuse reflectance spectroscopy (DRS) using a JASCO V–550 (Tokyo, Japan) spectrophotometer. The band gap of materials was determined based on an energy-dependent absorption coefficient α can be expressed by the following Equation (3):
( α h ν ) 1 γ = B ( h ν   E g )
where h, ν, Eg, and B are the Planck constant, the photon’s frequency, band gap, and the constant of band gap energy. The γ = 2 for the nature of the electron transition for indirect transition band gaps of MoS2 and TiO2 [49,50,51].
The PEC characterization was conducted using a three-electrode cell with an electrochemical analyzer (BioLogic SP-200, Paris, France). In detail, the as-prepared samples were used as working electrodes (WE), a Pt wire as the counter electrode (CE), and an Ag/AgCl 3 M KCl electrode as the reference electrode (RE). An electrolyte solution of a 1 M Na2SO4, pH 7.3, was purged with Ar gas to remove the oxygen gas in the OER measurement. All photoactive electrodes were illuminated under a 150 W Xe lamp with a light intensity of 100 mW/cm2 at the PEC cell. A cut-off filter at 380 nm of wavelength was used to avoid the UV rays. The linear sweep voltammogram (LSV) of the materials was obtained by collecting the current density according to the applied linear potential from −1 to 1 V vs. Ag/AgCl. The photoresponse ability of the materials was carried out by using a potential of 0 V vs. Ag/AgCl under the “on-off” illumination condition. The electrochemical impedance spectrum (EIS) was measured by applying a bias of the open-circuit potential over the frequency from 100 kHz to 100 mHz at the applied potential of 1 V vs. Ag/AgCl. Mott–Schottky plots were recorded from the impedance-potential test from −2 to 0.5 V vs. Ag/AgCl at 100 Hz without light irradiation. The potential V vs. Ag/AgCl was converted to the potential V vs. RHE through Equation (4) [52].
E RHE =   E Ag / AgCl + E   Ag / AgCl 0 + 0.059 × pH
where E   Ag / AgCl 0 = 0.210 V at 25 °C, and pH 7.3 is the pH value of the electrolyte in our experiment.

4. Conclusions

In summary, we have successfully combined MoS2 nanoparticles and TNAs by a cPVA binding agent to enhance the PEC water splitting efficiency and the catalyst’s stability. The structure of MoS2@PVA/TNAs is well controlled by adjusting the temperature of the thermal treatment process, with the best performance was obtained at 140 °C. The results reveal that the photocurrent density of the MoS2@PVA/TNAs@140 reaches a maximum value of 65 μA/cm2 at 0 V vs. Ag/AgCl, which is six times higher than that of the TNAs. The combination of MoS2 and TNAs can significantly increase the charge density, hence improving the material’s conductivity. Additionally, MoS2@PVA/TNAs@140 demonstrated excellent PEC efficiency and stability within five cycles. Moreover, by increasing conductivity, cPVA can be used as a binding agent in various semiconducting materials to enhance their properties as a stable and efficient catalyst, especially in PEC water splitting.

Supplementary Materials

The following are available online at https://www.mdpi.com/article/10.3390/catal11070857/s1, Figure S1: CV curve of cPVA under dark condition (Scan rate: 10 mV s−1), Figure S2: LSV of pristine cPVA in the dark and under visible light irradiation., Figure S3: PEC window of MoS2@PVA/TNAs@140.

Author Contributions

T.T.N. designed this work, and T.T.N. prepared the manuscript. The experiments and data analysis were carried out by T.T.N., T.M.C., N.O.B., and V.V.P. All authors discussed the results and implications and commented on the manuscript at all stages. All authors have read and agreed to the published version of the manuscript.

Funding

This research is funded by the Ho Chi Minh City University of Technology (HUTECH) under grant number 63/HĐ-ĐKC (2019/02/19/CNC).

Data Availability Statement

The data that support the findings of this study are available from the corresponding author upon reasonable request.

Acknowledgments

The authors would like to acknowledge the support from the CM Thi Laboratory. This research is funded by the Ho Chi Minh City University of Technology (HUTECH) under grant number 63/HĐ-ĐKC (2019/02/19/CNC).

Conflicts of Interest

The authors declare no conflict of interest.

References

  1. Zhou, L.; Shinde, A.; Guevarra, D.; Haber, J.A.; Persson, K.A.; Neaton, J.B.; Gregoire, J.M. Successes and Opportunities for Discovery of Metal Oxide Photoanodes for Solar Fuels Generators. ACS Energy Lett. 2020, 5, 1413–1421. [Google Scholar] [CrossRef]
  2. Sathre, R.; Greenblatt, J.B.; Walczak, K.; Sharp, I.D.; Stevens, J.C.; Ager, J.W.; Houle, F.A. Opportunities to improve the net energy performance of photoelectrochemical water-splitting technology. Energy Environ. Sci. 2016, 9, 803–819. [Google Scholar] [CrossRef] [Green Version]
  3. Han, H.S.; Park, W.; Hwang, S.W.; Kim, H.; Sim, Y.; Surendran, S.; Sim, U.; Cho, I.S. (0 2 0)-Textured tungsten trioxide nanostructure with enhanced photoelectrochemical activity. J. Catal. 2020, 389, 328–336. [Google Scholar] [CrossRef]
  4. Alam, K.; Sim, Y.; Yu, J.H.; Gnanaprakasam, J.; Choi, H.; Chae, Y.; Sim, U.; Cho, H. In-Situ Deposition of Graphene Oxide Catalyst for Efficient Photoelectrochemical Hydrogen Evolution Reaction Using Atmospheric Plasma. Materials (Basel) 2019, 13, 12. [Google Scholar] [CrossRef] [Green Version]
  5. Fujishima, A.; Honda, K. Electrochemical Photolysis of Water at A Semiconductor Electrode. Nature 1972, 238, 37–38. [Google Scholar] [CrossRef]
  6. Kumar, S.G.; Devi, L.G. Review on Modified TiO2 Photocatalysis Under UV/visible Light: Selected results and related mechanisms on interfacial charge carrier transfer dynamics. J. Phys. Chem. A 2011, 115, 13211–13241. [Google Scholar] [CrossRef]
  7. Xiu, Z.; Guo, M.; Zhao, T.; Pan, K.; Xing, Z.; Li, Z.; Zhou, W. Recent Advances in Ti3+ Self-Doped Nanostructured TiO2 Visible Light Photocatalysts for Environmental and Energy Applications. Chem. Eng. J. 2020, 382. [Google Scholar] [CrossRef]
  8. Le, C.T.; Kim, J.; Ullah, F.; Nguyen, A.D.; Nguyen Tran, T.N.; Le, T.E.; Chung, K.H.; Cheong, H.; Jang, J.I.; Kim, Y.S. Effects of Interlayer Coupling and Band Offset on Second Harmonic Generation in Vertical MoS2/MoS2(1-x)Se2x Structures. ACS Nano 2020, 14, 4366–4373. [Google Scholar] [CrossRef] [PubMed]
  9. Zhang, H.; Yu, L.; Chen, T.; Zhou, W.; Lou, X.W.D. Surface Modulation of Hierarchical MoS2 Nanosheets by Ni Single Atoms for Enhanced Electrocatalytic Hydrogen Evolution. Adv. Funct. Mater. 2018, 28. [Google Scholar] [CrossRef]
  10. Shen, Y.; Ren, X.; Qi, X.; Zhou, J.; Huang, Z.; Zhong, J. MoS2 Nanosheet Loaded with TiO2 Nanoparticles: An Efficient Electrocatalyst for Hydrogen Evolution Reaction. J. Electrochem. Soc. 2016, 163, H1087–H1090. [Google Scholar] [CrossRef]
  11. Lin, Y.; Ren, P.; Wei, C. Fabrication of MoS2/TiO2 heterostructures with enhanced photocatalytic activity. CrystEngComm 2019, 21, 3439–3450. [Google Scholar] [CrossRef]
  12. Zhao, F.; Rong, Y.; Wan, J.; Hu, Z.; Peng, Z.; Wang, B. MoS2 quantum dots@TiO2 nanotube composites with enhanced photoexcited charge separation and high-efficiency visible-light driven photocatalysis. Nanotechnology 2018, 29, 105403. [Google Scholar] [CrossRef]
  13. Guo, L.; Yang, Z.; Marcus, K.; Li, Z.; Luo, B.; Zhou, L.; Wang, X.; Du, Y.; Yang, Y. MoS2/TiO2 heterostructures as nonmetal plasmonic photocatalysts for highly efficient hydrogen evolution. Energy Environ. Sci. 2018, 11, 106–114. [Google Scholar] [CrossRef]
  14. Mawlong, L.P.L.; Paul, K.K.; Giri, P.K. Direct Chemical Vapor Deposition Growth of Monolayer MoS2 on TiO2 Nanorods and Evidence for Doping-Induced Strong Photoluminescence Enhancement. J. Phys. Chem. C 2018, 122, 15017–15025. [Google Scholar] [CrossRef]
  15. Deshmukh, K.; Ahamed, M.B.; Deshmukh, R.R.; Pasha, S.K.K.; Bhagat, P.R.; Chidambaram, K. 3—Biopolymer Composites with High Dielectric Performance. In Interface Engineering. Biopolymer Composites in Electronics; Elsevier: Amsterdam, The Netherlands, 2017; Volume 2017, p. 101. [Google Scholar] [CrossRef]
  16. Song, Y.; Zhang, J.; Yang, H.; Xu, S.; Jiang, L.; Dan, Y. Preparation and visible light-induced photo-catalytic activity of H-PVA/TiO2 composite loaded on glass via sol–gel method. Appl. Surf. Sci. 2014, 292, 978–985. [Google Scholar] [CrossRef]
  17. Khilari, S.; Pandit, S.; Ghangrekar, M.M.; Pradhan, D.; Das, D. Graphene Oxide-Impregnated PVA–STA Composite Polymer Electrolyte Membrane Separator for Power Generation in a Single-Chambered Microbial Fuel Cell. Ind. Eng. Chem. Res. 2013, 52, 11597–11606. [Google Scholar] [CrossRef]
  18. Libby, R.D. Advanced Organic Chemistry, Part A: Structure and Mechanism, 4th Edition (Carey, Francis A.; Sundberg, Richard J.). J. Chem. Educ. 2001, 78. [Google Scholar] [CrossRef] [Green Version]
  19. Cheeseman, J.R.; Carroll, M.T.; Bader, R.F.W. The mechanics of hydrogen bond formation in conjugated systems. Chem. Phys. Lett. 1988, 143, 450–458. [Google Scholar] [CrossRef]
  20. Gebben, B.; van den Berg, H.W.A.; Bargeman, D.; Smolders, C.A. Intramolecular crosslinking of poly(vinyl alcohol). Polymer 1985, 26, 1737–1740. [Google Scholar] [CrossRef] [Green Version]
  21. Jiang, Y.; Chen, W.-F.; Koshy, P.; Sorrell, C.C. Enhanced photocatalytic performance of nanostructured TiO2 thin films through combined effects of polymer conjugation and Mo-doping. J. Mater. Sci. 2019, 54, 5266–5279. [Google Scholar] [CrossRef]
  22. Yang, H.; Xu, S.; Jiang, L.; Dan, Y. Thermal Decomposition Behavior of Poly (Vinyl Alcohol) with Different Hydroxyl Content. J. Macromol. Sci. Part B 2011, 51, 464–480. [Google Scholar] [CrossRef]
  23. Mansur, H.S.; Oréfice, R.L.; Mansur, A.A.P. Characterization of poly(vinyl alcohol)/poly(ethylene glycol) hydrogels and PVA-derived hybrids by small-angle X-ray scattering and FTIR spectroscopy. Polymer 2004, 45, 7193–7202. [Google Scholar] [CrossRef]
  24. Prosanov, I.Y.; Matvienko, A.A. Study of PVA thermal destruction by means of IR and Raman spectroscopy. Phys. Solid State 2010, 52, 2203–2206. [Google Scholar] [CrossRef]
  25. Muzakir, M.M.; Zainal, Z.; Lim, H.N.; Abdullah, A.H.; Bahrudin, N.N.; Sarif@Mohd Ali, M. Electrochemically Reduced Titania Nanotube Synthesized from Glycerol-Based Electrolyte as Supercapacitor Electrode. Energies 2020, 13, 2767. [Google Scholar] [CrossRef]
  26. Nischk, M.; Mazierski, P.; Wei, Z.; Siuzdak, K.; Kouame, N.A.; Kowalska, E.; Remita, H.; Zaleska-Medynska, A. Enhanced photocatalytic, electrochemical and photoelectrochemical properties of TiO2 nanotubes arrays modified with Cu, AgCu and Bi nanoparticles obtained via radiolytic reduction. Appl. Surf. Sci. 2016, 387, 89–102. [Google Scholar] [CrossRef] [Green Version]
  27. Peighambardoust, N.S.; Khameneh Asl, S.; Mohammadpour, R.; Asl, S.K. Band-gap narrowing and electrochemical properties in N-doped and reduced anodic TiO2 nanotube arrays. Electrochim. Acta 2018, 270, 245–255. [Google Scholar] [CrossRef]
  28. Prass, S.; St-Pierre, J.; Klingele, M.; Friedrich, K.A.; Zamel, N. Hydrogen Oxidation Artifact During Platinum Oxide Reduction in Cyclic Voltammetry Analysis of Low-Loaded PEMFC Electrodes. Electrocatalysis 2020, 12, 45–55. [Google Scholar] [CrossRef]
  29. Bisquert, J.; Fabregat-Santiago, F.; Mora-Seró, I.; Garcia-Belmonte, G.; Barea, E.M.; Palomares, E. A review of recent results on electrochemical determination of the density of electronic states of nanostructured metal-oxide semiconductors and organic hole conductors. Inorg. Chim. Acta 2008, 361, 684–698. [Google Scholar] [CrossRef]
  30. Liu, B.; Zhao, X.; Yu, J.; Parkin, I.P.; Fujishima, A.; Nakata, K. Intrinsic intermediate gap states of TiO2 materials and their roles in charge carrier kinetics. J. Photochem. Photobiol. C Photochem. Rev. 2019, 39, 1–57. [Google Scholar] [CrossRef]
  31. Li, C.; Hou, T.; Vongsvivut, J.; Li, Y.; She, X.; She, F.; Gao, W.; Kong, L. Simultaneous crystallization and decomposition of PVA/MMT composites during non-isothermal process. Thermochim. Acta 2015, 618, 26–35. [Google Scholar] [CrossRef]
  32. Chen, X.; Wu, S.; Yi, M.; Ge, J.; Yin, G.; Li, X. Preparation and Physicochemical Properties of Blend Films of Feather Keratin and Poly(vinyl alcohol) Compatibilized by Tris(hydroxymethyl)aminomethane. Polymers (Basel) 2018, 10, 54. [Google Scholar] [CrossRef] [Green Version]
  33. Wijanarko, T.A.W.; Kusumaatmaja, A.; Chotimah, R.; Triyana, K. Effect of heat treatment on morphology and crystallinity of electrospun Poly(vinyl alcohol) nanofibers. AIP Conf. Proc. 2016, 1755, 150010. [Google Scholar] [CrossRef] [Green Version]
  34. Feng, W.; Chen, L.; Qin, M.; Zhou, X.; Zhang, Q.; Miao, Y.; Qiu, K.; Zhang, Y.; He, C. Flower-Like PEGylated MoS2 Nanoflakes for Near-Infrared Photothermal Cancer Therapy. Sci. Rep. 2015, 5, 17422. [Google Scholar] [CrossRef] [Green Version]
  35. Ritika, M.K.; Umar, A.; Mehta, S.K.; Singh, S.; Kansal, S.K.; Fouad, H.; Alothman, O.Y. Rapid Solar-Light Driven Superior Photocatalytic Degradation of Methylene Blue Using MoS(2)-ZnO Heterostructure Nanorods Photocatalyst. Materials (Basel) 2018, 11, 2254. [Google Scholar] [CrossRef] [Green Version]
  36. Sonker, A.K.; Rathore, K.; Nagarale, R.K.; Verma, V. Crosslinking of Polyvinyl Alcohol (PVA) and Effect of Crosslinker Shape (Aliphatic and Aromatic) Thereof. J. Polym. Environ. 2017, 26, 1782–1794. [Google Scholar] [CrossRef]
  37. Premathilake, D.; Outlaw, R.A.; Parler, S.G.; Butler, S.M.; Miller, J.R. Electric double layer capacitors for ac filtering made from vertically oriented graphene nanosheets on aluminum. Carbon 2017, 111, 231–237. [Google Scholar] [CrossRef]
  38. Gurung, A.; Pokharel, J.; Baniya, A.; Pathak, R.; Chen, K.; Lamsal, B.S.; Ghimire, N.; Zhang, W.-H.; Zhou, Y.; Qiao, Q. A review on strategies addressing interface incompatibilities in inorganic all-solid-state lithium batteries. Sustain. Energy Fuels 2019, 3, 3279–3309. [Google Scholar] [CrossRef]
  39. Komba, N.; Zhang, G.; Pu, Z.; Wu, M.; Rosei, F.; Sun, S. MoS2-supported on free-standing TiO2-nanotubes for efficient hydrogen evolution reaction. Int. J. Hydrogen Energy 2020, 45, 4468–4480. [Google Scholar] [CrossRef]
  40. Resasco, J.; Zhang, H.; Kornienko, N.; Becknell, N.; Lee, H.; Guo, J.; Briseno, A.L.; Yang, P. TiO2/BiVO4 Nanowire Heterostructure Photoanodes Based on Type II Band Alignment. ACS Cent. Sci. 2016, 2, 80–88. [Google Scholar] [CrossRef] [PubMed] [Green Version]
  41. Hankin, A.; Bedoya-Lora, F.E.; Alexander, J.C.; Regoutz, A.; Kelsall, G.H. Flat band potential determination: Avoiding the pitfalls. J. Mater. Chem. A 2019, 7, 26162–26176. [Google Scholar] [CrossRef] [Green Version]
  42. Ola, O.; Maroto-Valer, M.M. Review of material design and reactor engineering on TiO2 photocatalysis for CO2 reduction. J. Photochem. Photobiol. C Photochem. Rev. 2015, 24, 16–42. [Google Scholar] [CrossRef] [Green Version]
  43. Bhat, S.S.M.; Pawar, S.A.; Potphode, D.; Moon, C.-K.; Suh, J.M.; Kim, C.; Choi, S.; Patil, D.S.; Kim, J.-J.; Shin, J.C.; et al. Substantially Enhanced Photoelectrochemical Performance of TiO2 nanorods/CdS Nanocrystals Heterojunction Photoanode Decorated with MoS2 Nanosheets. Appl. Catal. B Environ. 2019, 259. [Google Scholar] [CrossRef]
  44. Nan, F.; Li, P.; Li, J.; Cai, T.; Ju, S.; Fang, L. Experimental and Theoretical Evidence of Enhanced Visible Light Photoelectrochemical and Photocatalytic Properties in MoS2/TiO2 Nanohole Arrays. J. Phys. Chem. C 2018, 122, 15055–15062. [Google Scholar] [CrossRef]
  45. Mak, K.F.; Lee, C.; Hone, J.; Shan, J.; Heinz, T.F. Atomically Thin MoS2: A New Direct-Gap Semiconductor. Phys. Rev. Lett. 2010, 105. [Google Scholar] [CrossRef] [PubMed] [Green Version]
  46. Wang, F.; Shifa, T.A.; Zhan, X.; Huang, Y.; Liu, K.; Cheng, Z.; Jiang, C.; He, J. Recent advances in transition-metal dichalcogenide based nanomaterials for water splitting. Nanoscale 2015, 7, 19764–19788. [Google Scholar] [CrossRef]
  47. Tho, N.T.; Thi, C.M.; Van Hieu, L.; Van Viet, P. Visible-light-driven photocatalysis for methylene blue degradation and hydrogen evolution reaction: A case of black TiO2 nanotube arrays. J. Aust. Ceram. Soc. 2019, 56, 849–857. [Google Scholar] [CrossRef]
  48. Liu, Y.; Xu, X.; Zhang, J.; Zhang, H.; Tian, W.; Li, X.; Tade, M.O.; Sun, H.; Wang, S. Flower-like MoS2 on graphitic carbon nitride for enhanced photocatalytic and electrochemical hydrogen evolutions. Appl. Catal. B Environ. 2018, 239, 334–344. [Google Scholar] [CrossRef]
  49. Ritika, M.K.; Umar, A.; Mehta, S.K.; Kansal, S.K.; Khan, M.A.; Algarni, H. Enhanced solar light-mediated photocatalytic degradation of brilliant green dye in aqueous phase using BiPO4 nanospindles and MoS2/BiPO4 nanorods. J. Mater. Sci. Mater. Electron. 2019, 30, 20741–20750. [Google Scholar] [CrossRef]
  50. Paul, K.K.; Sreekanth, N.; Biroju, R.K.; Narayanan, T.N.; Giri, P.K. Solar light driven photoelectrocatalytic hydrogen evolution and dye degradation by metal-free few-layer MoS2 nanoflower/TiO2(B) nanobelts heterostructure. Sol. Energy Mater. Sol. Cells 2018, 185, 364–374. [Google Scholar] [CrossRef]
  51. Steinhoff, A.; Kim, J.H.; Jahnke, F.; Rosner, M.; Kim, D.S.; Lee, C.; Han, G.H.; Jeong, M.S.; Wehling, T.O.; Gies, C. Efficient Excitonic Photoluminescence in Direct and Indirect Band Gap Monolayer MoS2. Nano Lett. 2015, 15, 6841–6847. [Google Scholar] [CrossRef] [PubMed]
  52. Yazici, B. Investigation of suitable cathodes for the production of hydrogen gas by electrolysis. Int. J. Hydrogen Energy 1995, 20, 957–965. [Google Scholar] [CrossRef]
Figure 1. FTIR spectra of PVA (a) and cPVA at 100 °C (b), 120 °C (c), 140 °C (d), 160 °C (e), and 180 °C (f).
Catalysts 11 00857 g001
Figure 2. CV curves of MoS2@PVA/TNAs at different thermal treatment conditions of PVA. (Scan rate: 10 mV s−1).
Catalysts 11 00857 g002
Figure 3. XRD patterns (a) and FTIR spectra (b) of TNAs, MoS2, PVA, and MoS2@PVA/TNAs@140.
Catalysts 11 00857 g003
Figure 4. SEM images of TNAs (a), MoS2 (b), and MoS2@PVA/TNAs@140 (c).
Catalysts 11 00857 g004
Figure 5. LSV curves of materials (a) and photoresponse ability of the materials with an applied potential at 0 V vs. Ag/AgCl (b).
Catalysts 11 00857 g005
Figure 6. Electrochemical impedance spectroscopy (a) and Tafel slopes (b) of TNAs, MoS2, and MoS2@PVA/TNAs@140.
Catalysts 11 00857 g006
Figure 7. Mott–Schottky plots (a), DRS spectra (b), Tauc plots (c) of MoS2, TNAs, and MoS2@PVA/TNAs@140 and the proposed schematic illustration for the energy band alignment of the MoS2/TNAs heterojunction (d).
Catalysts 11 00857 g007
Publisher’s Note: MDPI stays neutral with regard to jurisdictional claims in published maps and institutional affiliations.

