Article

Elucidating Synergistic Effects of Different Metal Ratios in Bimetallic Fe/Co-N-C Catalysts for Oxygen Reduction Reaction

1
German Aerospace Center, Institute for Engineering Thermodynamics, Carl-von-Ossietzky Straße 15, 26129 Oldenburg, Germany
2
Institute of Chemistry, Carl von Ossietzky University Oldenburg, Carl-von-Ossietzky Str. 9-11, 26129 Oldenburg, Germany
3
German Aerospace Center, Institute for Networked Energy Systems, Carl-von-Ossietzky Straße 15, 26129 Oldenburg, Germany
*
Author to whom correspondence should be addressed.
Catalysts 2021, 11(7), 841; https://doi.org/10.3390/catal11070841
Submission received: 24 June 2021 / Revised: 8 July 2021 / Accepted: 10 July 2021 / Published: 13 July 2021
(This article belongs to the Section Electrocatalysis)

Abstract

:
Lowering or eliminating the noble-metal content in oxygen reduction fuel cell catalysts could propel the large-scale introduction of commercial fuel cell systems. Several noble-metal free catalysts are already under investigation with the metal-nitrogen-carbon (Me-N-C) system being one of the most promising. In this study, a systematic approach to investigate the influence of metal ratios in bimetallic Me-N-C fuel cells oxygen reduction reaction (ORR) catalysts has been taken. Different catalysts with varying ratios of Fe and Co have been synthesized and characterized both physically and electrochemically in terms of activity, selectivity and stability with the addition of an accelerated stress test (AST). The catalysts show different electrochemical properties depending on the metal ratio such as a high electrochemical mass activity with increasing Fe ratio. Properties do not change linearly with the metal ratio, with a Fe/Co ratio of 5:3 showing a higher mass activity with simultaneous higher stability. Selectivity indicators plateau for catalysts with a Co content of 50% metal ratio and less, showing the same values as a monometallic Co catalyst. These findings indicate a deeper relationship between the ratio of different metals and physical and electrochemical properties in bimetallic Me-N-C catalysts.

Graphical Abstract

1. Introduction

In the fight against climate change, green technologies are crucial and hydrogen is a promising alternative energy carrier to fossil fuels [1,2]. The conversion of chemical energy stored in hydrogen gas to electrical energy is a technological challenge, for which the proton-exchange membrane fuel cell (PEMFC) is a suitable prospect [3,4,5,6]. Utilizing electrocatalysts, it converts hydrogen and oxygen gas to water under the production of heat and electricity [3]. These catalysts in state-of-the-art PEMFC are predominantly comprised of Pt-nanoparticles supported on carbon blacks like Vulcan. Thus a large-scale commercialization is hindered, in-part, due to the metals scarcity in earths crust and resulting high price [4,5,7]. The development of noble-metal free catalysts could therefore accelerate the wide-spread application of PEMFC. One attractive alternative are metal-nitrogen-carbon (Me-N-C) catalysts, made from abundant and cheap first-row transition metals, like Fe [3,4,7]. A lot of research effort has already been put into these catalyst systems and the most active metals seem to be Fe and Co [3,8,9,10,11]. Different synthesis methods with different types of precursors have been explored, like the combination of metal organic frameworks or distinct carbon supports with nitrogen-containing molecules and heat treatment under inert or reactive atmosphere. However, the long-term durability under operation remains a major challenge for these catalysts [3,8].
The combination of positive properties of Fe and Co in bimetallic Me-N-C catalysts could yield new insights into active sites and produce novel catalysts that tackle the downsides of each individual metal. These include the high ORR activity of Fe and good operational stability of Co. Some research of bimetallic Me-N-C catalysts has been conducted but with the focus on monometallic ones and a systematic approach to the incremental combination of metals is still missing [3,4,8,9,12,13]. Martiniou et al. found the average performance of monometallic Fe and Co catalysts for a bimetallic catalyst with equal parts of the two metals along with Wu et al., who got similar results [8,12]. In contrast, Nallathambi et al. discovered an improved performance for different bimetallic catalysts compared to monometallic ones utilizing Fe and Co in a fuel cell test setting [13].
In this study, we present the investigation of possible effects improving activity and/or stability in bimetallic Me-N-C catalysts utilizing Fe and Co. For that, Fe/Co ratios were systematically varied in the synthesis of each catalyst. The resulting catalysts were physically characterized using transmission electron microscopy (TEM) with energy dispersive spectroscopy (EDS), X-ray photoelectron spectroscopy (XPS) and X-ray diffraction (XRD). Additionally, they were analyzed in a rotating ring-disk electrode (RRDE) setup in acidic electrolyte along with an accelerated stress test (AST), adapted from FCCJ [14], which focused on carbon corrosion.

2. Results and Discussion

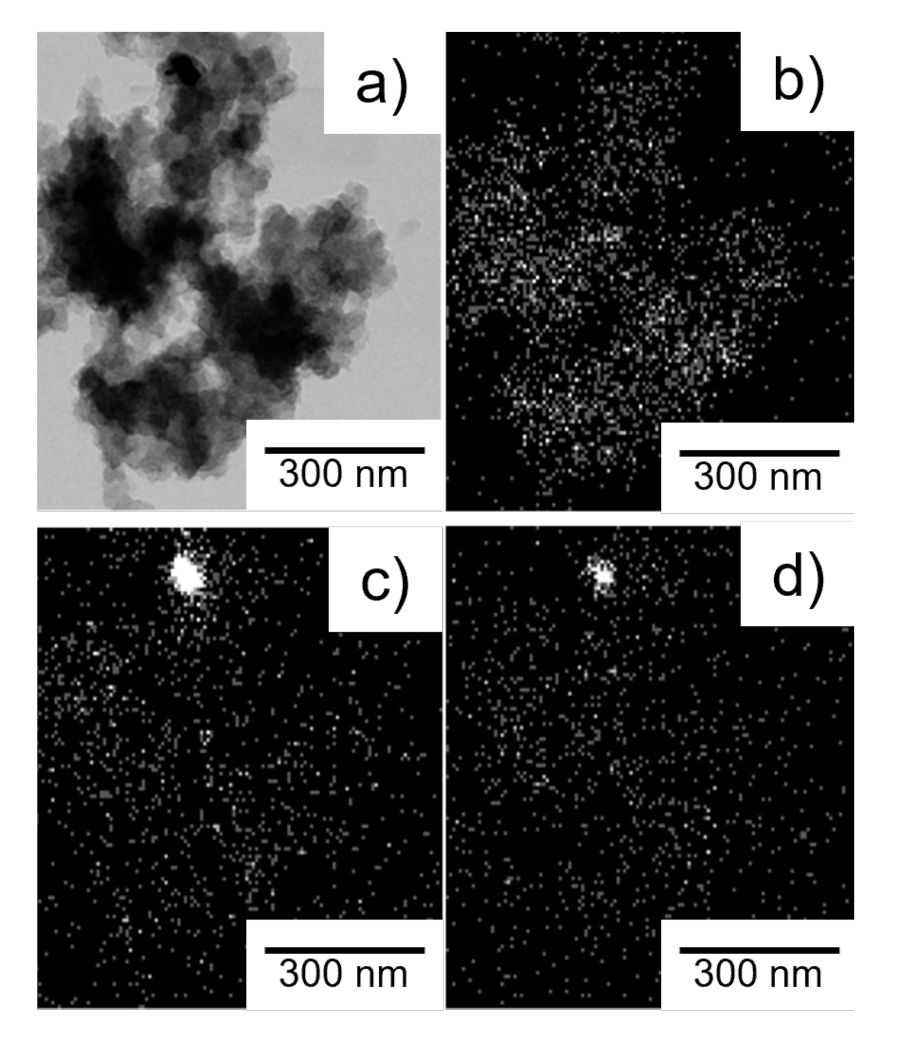
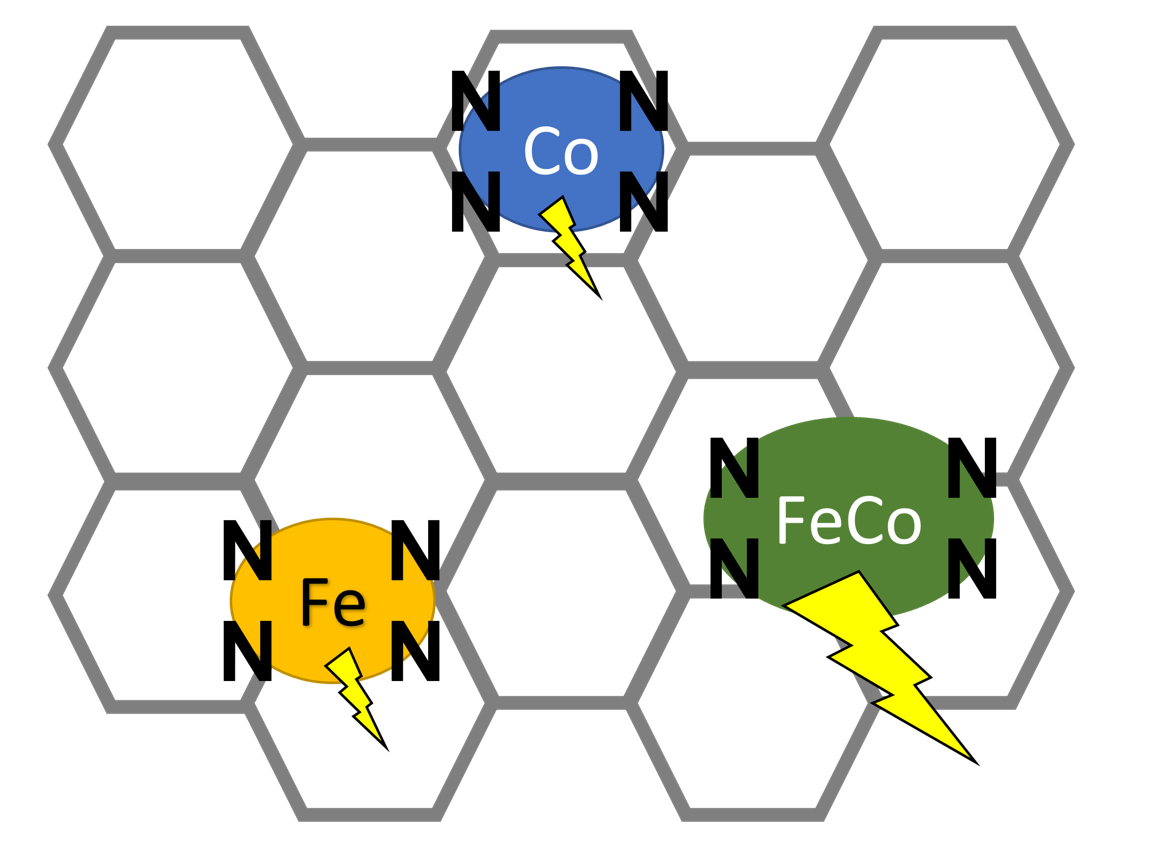
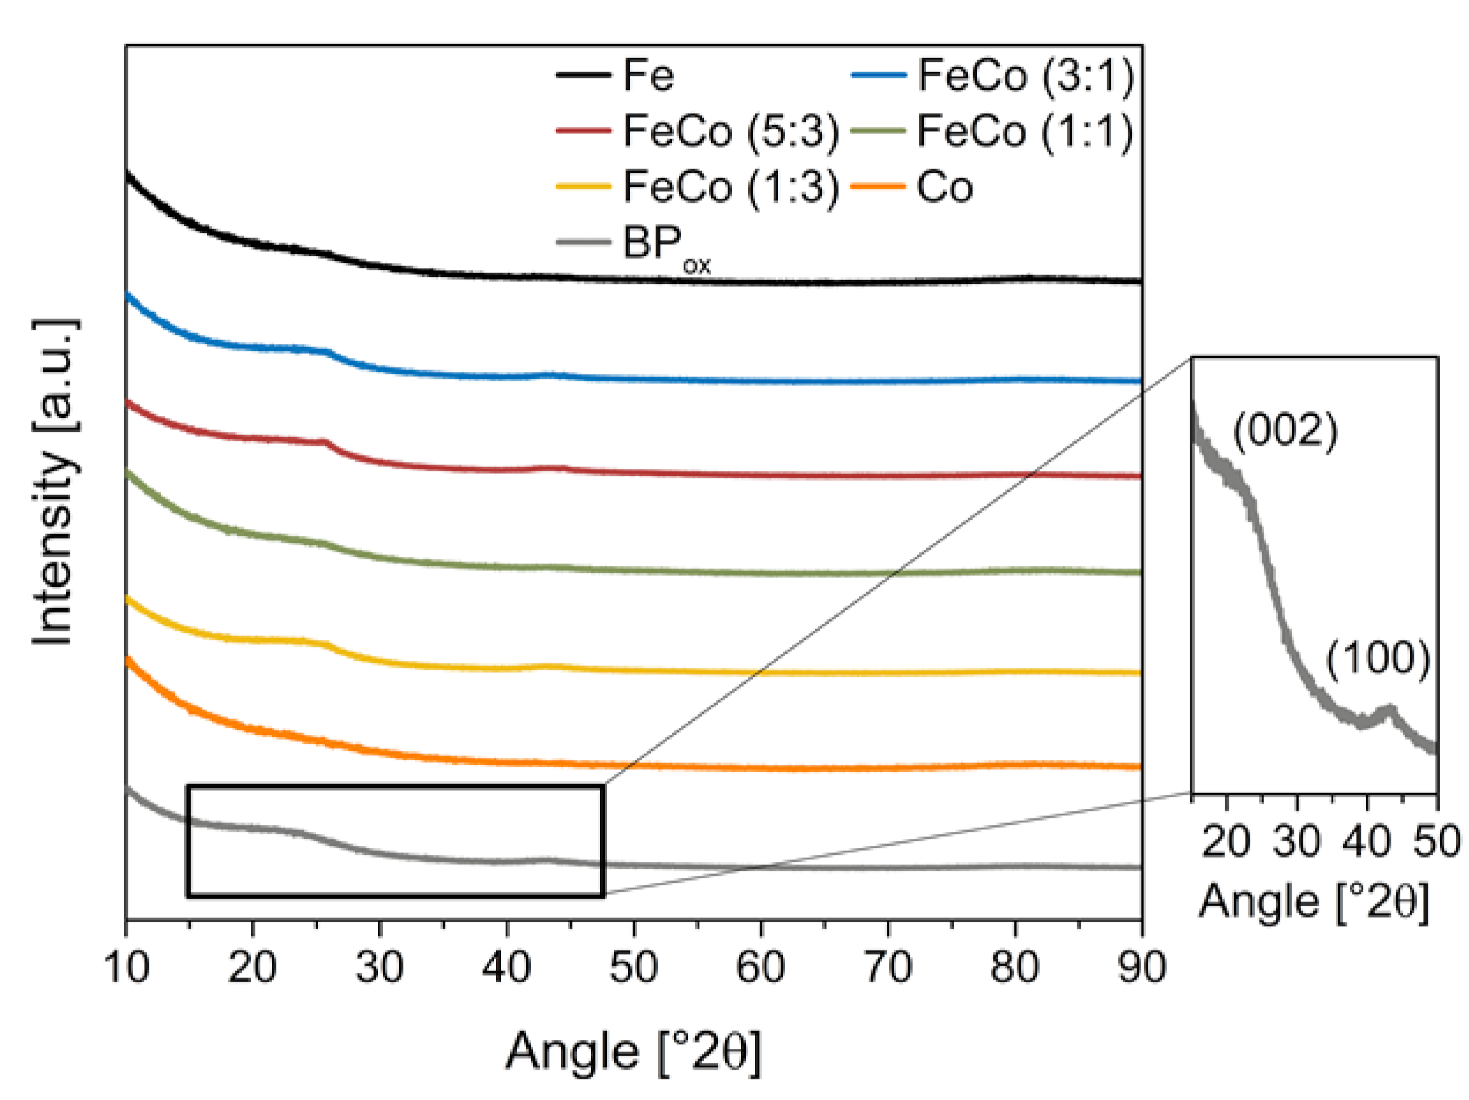
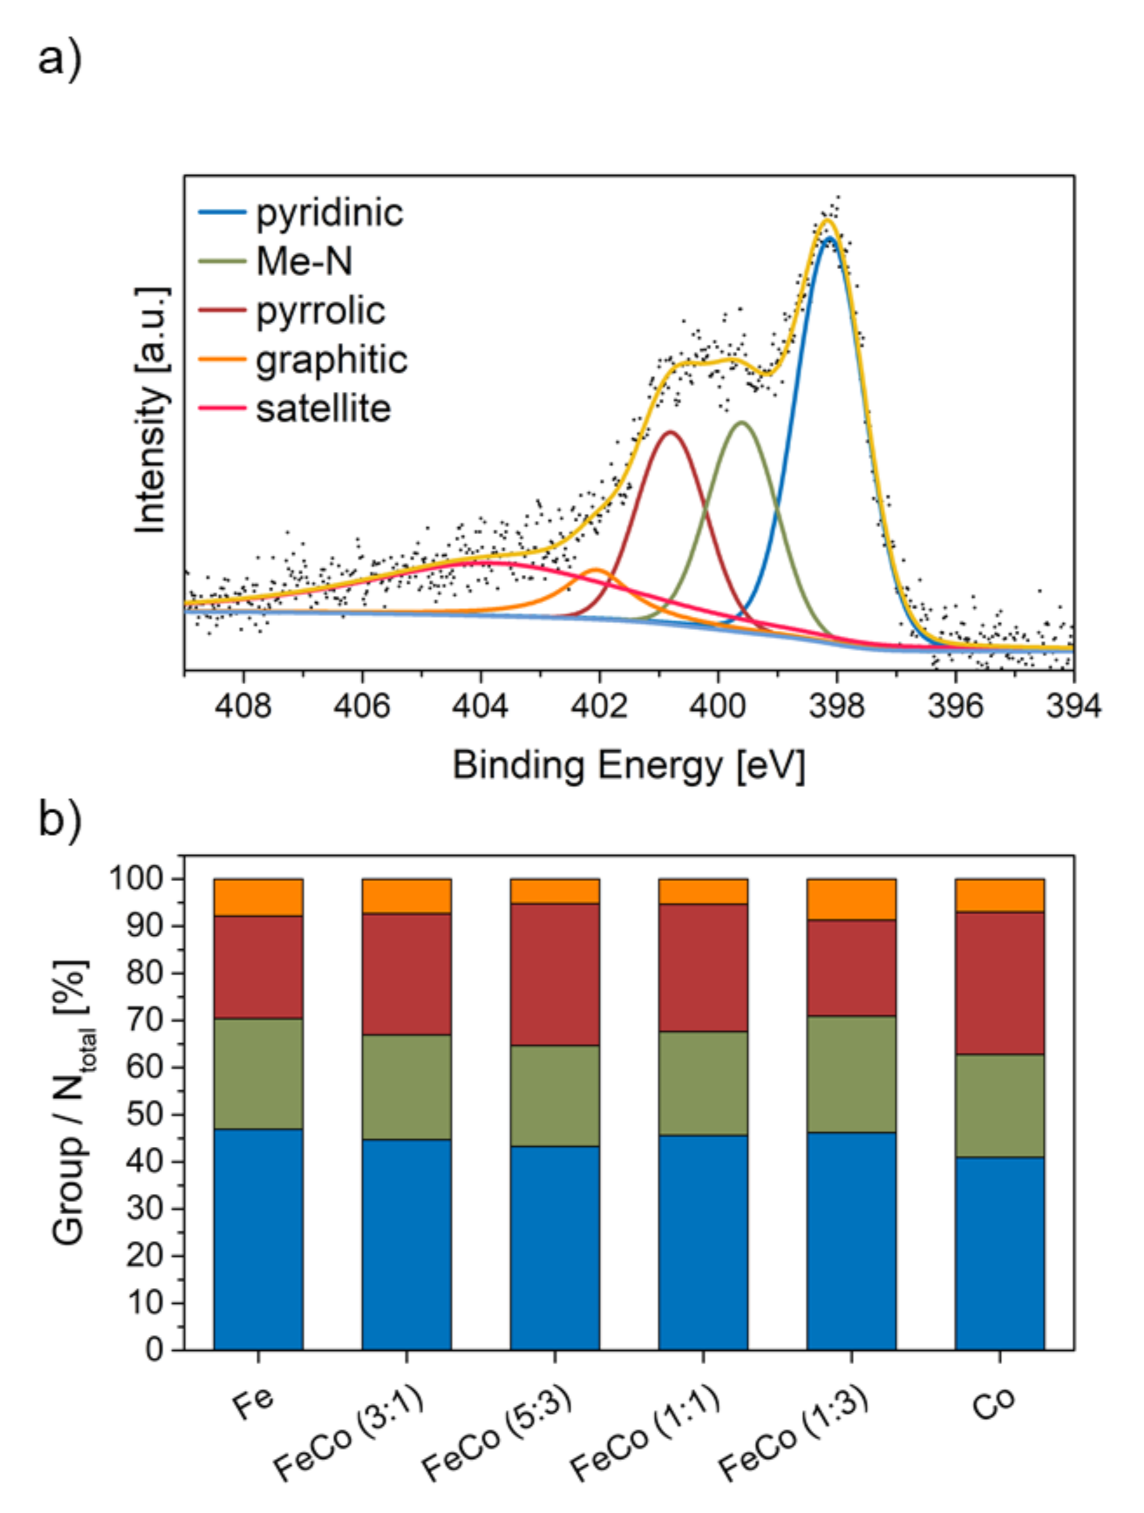
2.1. Influence of Metal Ratio on Structural Properties

Different catalysts have been synthesized through heat-treatment of a carbon support impregnated by a nitrogen and metal precursor. The metallic portion was varied between different ratios of Fe and Co salts but remained constant overall. These catalysts are then investigated by different physical analysis techniques to elucidate synergistic effects of the metal ratio during synthesis.
Crystalline domains present in the catalyst indicate the formation of metal particles and can be investigated by XRD. These particles can be formed during the synthesis but are unstable under acidic and oxidizing conditions in the PEM fuel cell [15]. The XRD analysis of all catalysts in reference to the oxidized Black Pearls support is displayed in Figure 1.
Broad signals can be identified at 2 θ of 25 , 43 and 83 , which correspond to crystalline domains that show amorphous portions or small crystallite sizes. These reflexes correspond to graphitic lattices since they are also present in the reference support and have been identified by Li et al. [16] and Carmo et al. [17]. The specific peaks are displayed in the inlet in the XRD as the (002) at 25 and (100) at 43 2 θ in addition to (112) at 83 2 θ . However, those reflexes are not clearly distinguishable from those present in the oxidized Black Pearl support. Overall, the catalysts show no strong indication for the presence of elemental metal particles or a substantial amount of other metallic phases. The absence of particles hints at atomically distributed metal ions, presumably in form of MeNx and variation of metal ratio additionally shows no negative impact on the formation of undesired metal particles.
For further analysis on the morphology and structure as well as spatial distribution of different elements, HR-TEM with EDS elemental mapping was carried out. A representative example of this analysis is shown in the micrographs and elemental mapping of FeCo-N-C (5:3) in Figure 2b–d.
The carbon particles in the micrograph display expected morphology for turbostratic carbon with no apparent metal particles visible. However, small co-agglomerations of both, Fe and Co, are visible in the elemental mapping in Figure 2d,e. These agglomerations are apparent in most catalyst samples prepared here (see SI Figure S1) for EDS elemental mappings of all catalysts). A small amount of metal particles is thus present, however not enough to show a clear reflection in the XRD as discussed before. Besides the agglomerations, both metals are uniformly dispersed across the carbon. As shown by Chung et al. [18] this distribution indicates the atomic dispersion of metals in MeNx sites.
For near-surface elemental analysis of the catalysts XPS was carried out. An exemplary high-resolution N 1s XP spectrum of Fe-N-C is shown in Figure 3a.
Four different N-containing groups can be identified, namely pyridinic (398 eV), Me-N (399–400 eV), pyrrolic (401 eV) and graphitic (402 eV) nitrogen. These groups have been fitted into the XP spectrum according to the procedure by Artyushkova et al. [19] and others [8,20,21]. In addition to the N-containing groups a satellite signal, due to π π * interaction, is visible around 404 eV [22]. The fraction of each N-group in comparison to the total N content is displayed in Figure 3b. N-group ratios show no strong correlation with the metal ratio used during the synthesis. The XP-spectra of the metal species Fe 2p and Co 2p are shown in the Supporting Information (SI) Figure S3. A fit of these spectra was not possible, due to poor resolution of the spectra, stemming from low amounts of metal present. However, it is clear that the Fe and Co species occur in oxidized states, due to the absence of peaks with EB lower than 710 eV for metallic Fe and 778 eV for metallic Co. Thus the presence of substantial amounts of metallic particles can be disregarded, considering the XPS and EDS analysis.

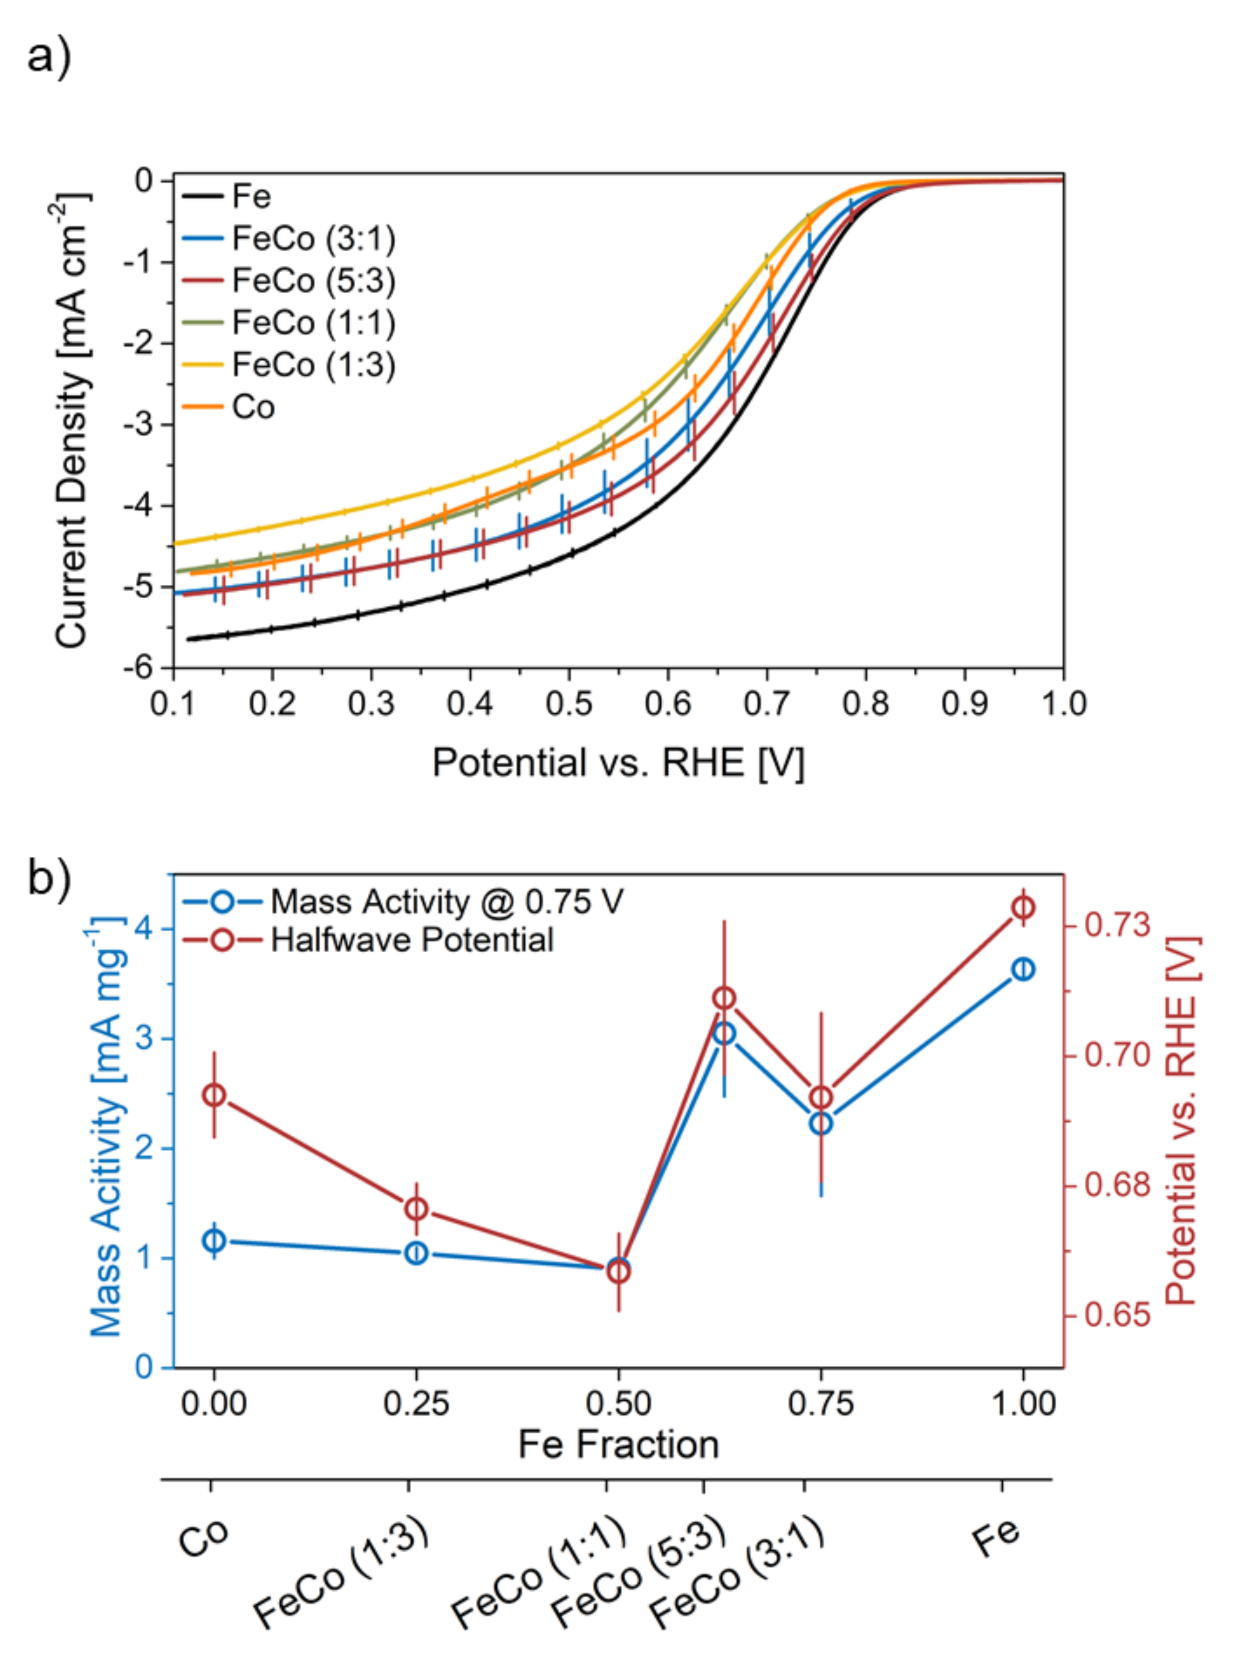
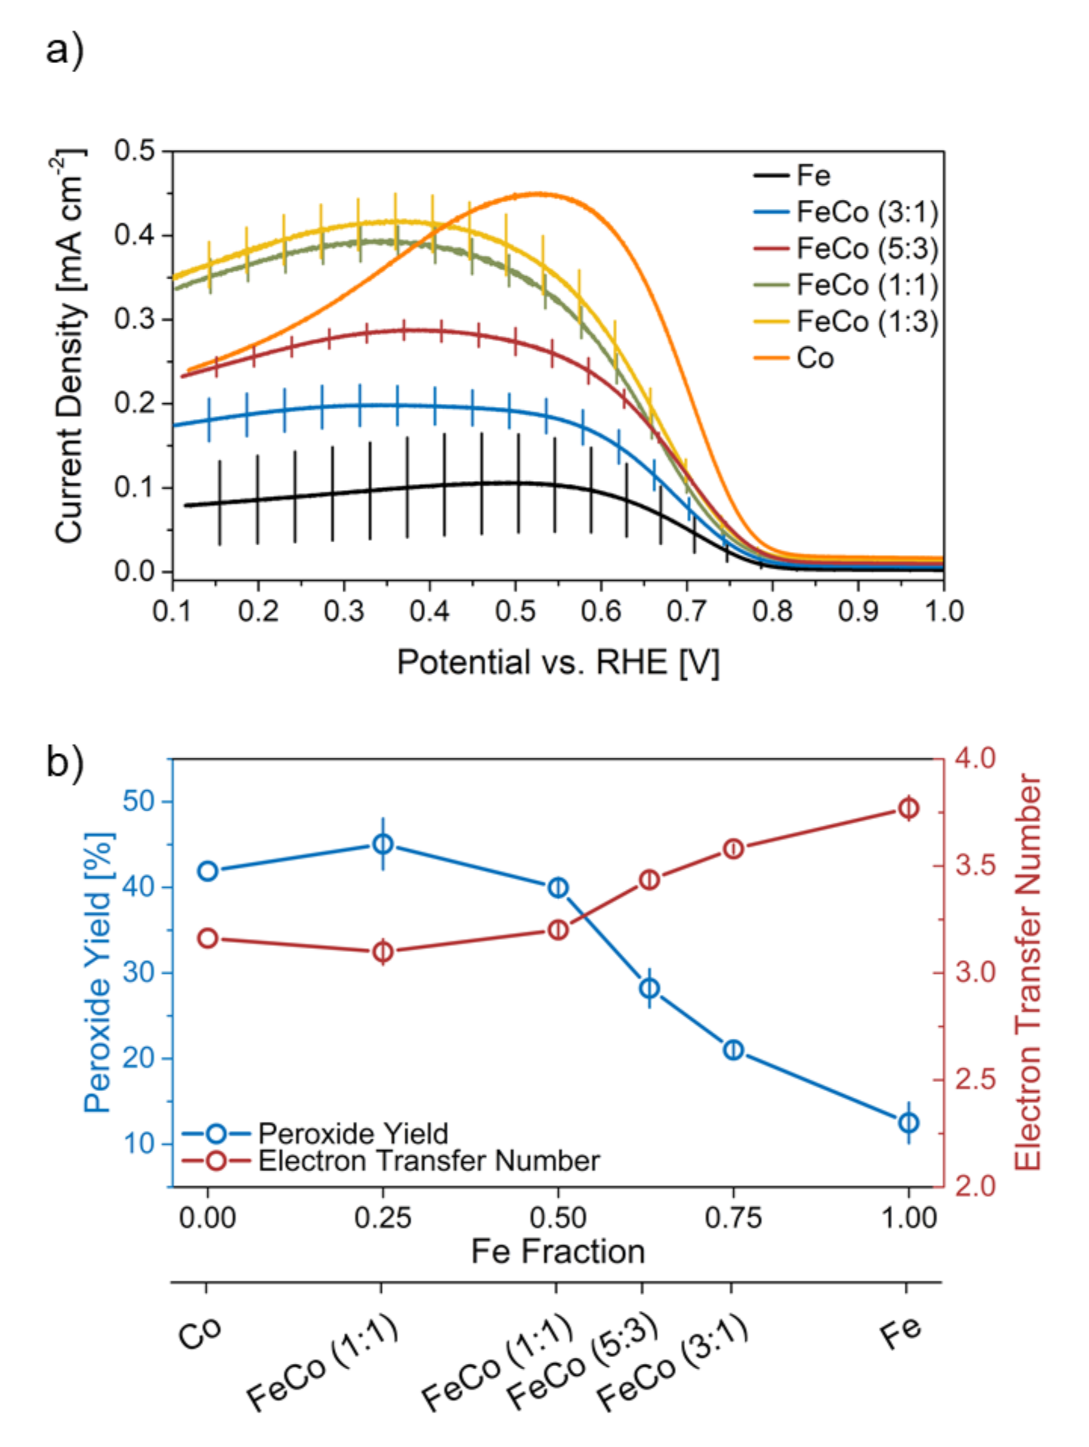
2.2. Electrochemical Characterization

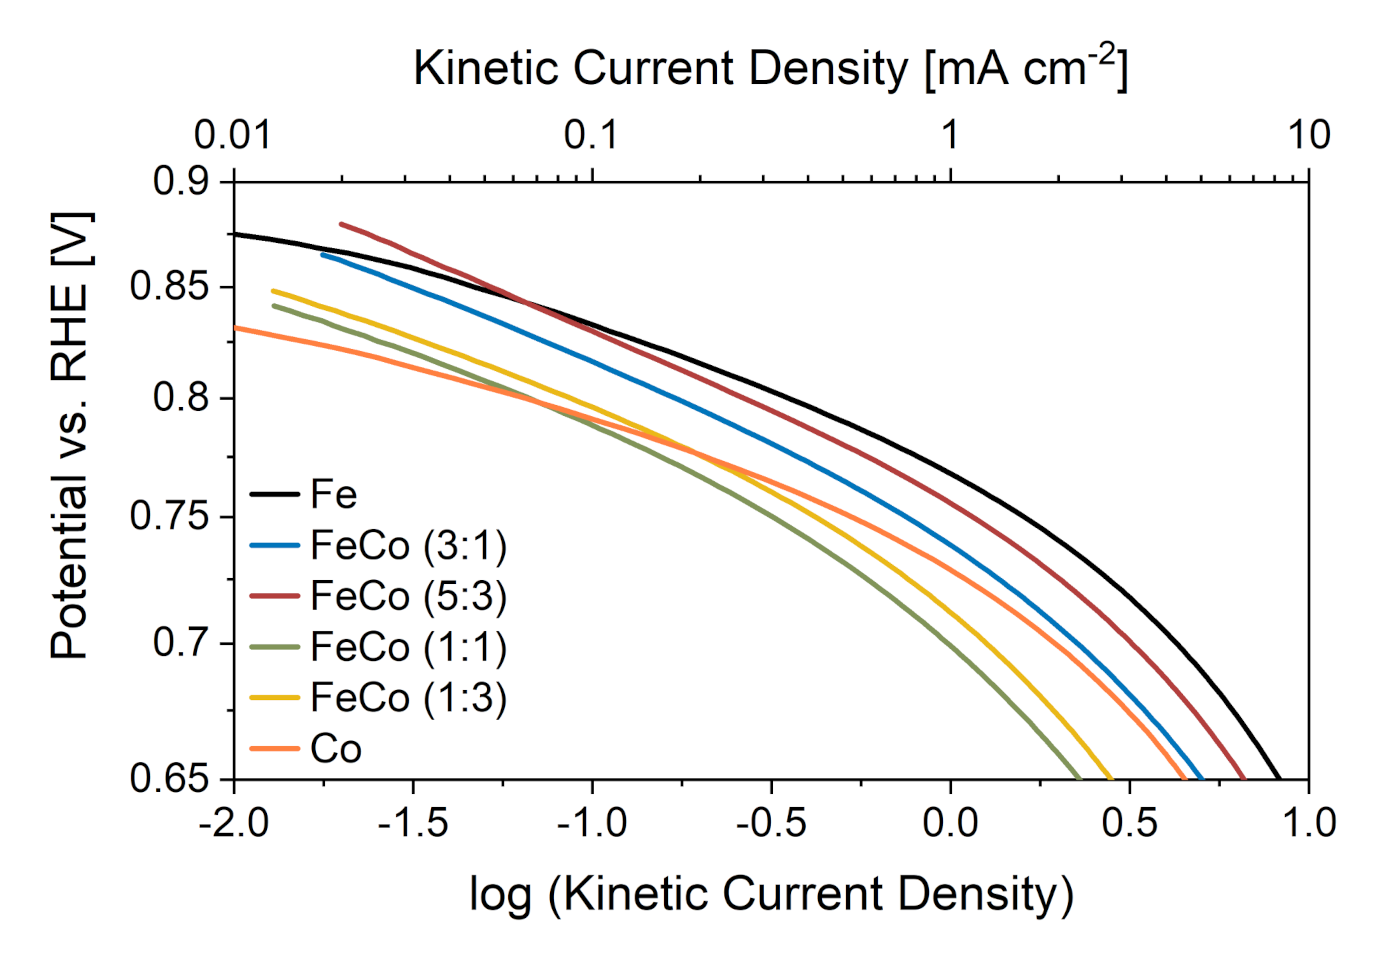
2.2.1. Initial Performance

The impact of the two metals on the electrochemical performance is generally regarded as activity-improving and stability-improving for Fe and Co, respectively [8,13,23]. All here-prepared catalysts were electrochemically characterized before and after an AST and their initial characteristics discussed in the following. The mean value of three ORR curves with individual electrode coatings for the two monometallic and four bimetallic catalysts with indicated standard deviation are displayed in Figure 4a.
Fe-N-C shows the highest current density values across the whole potential range of all catalysts, despite the same mass-loading in all catalysts. The ORR performance however does not decrease linearly with the Fe/Co ratio as reported by Martinaiou [8], since FeCo-N-C (5:3) shows a slightly higher current density in the mixed limited area (0.75–0.4 V) and equal values in the mass-transport limited area (<0.4 V) as FeCo-N-C (3:1). Furthermore, Co-N-C performs better than both bimetallic catalysts with equal to or less than 50% Fe, namely FeCo-N-C (1:1) and FeCo-N-C (1:3) in the mixed limited area.
A comparison of the mass activity and halfwave potential during the initial characterization scan is shown in Figure 4b. The halfwave potential is an indicator for both kinetic and mass-transport properties, and the mass activity rather focuses on kinetic aspects. Both parameters follow the same trend for all catalysts with an Fe fraction of more than 50%, namely Fe-N-C, FeCo-N-C (3:1) and FeCo-N-C (5:3). Fe-N-C shows the highest values for both, followed by FeCo-N-C (5:3), analogous to the ORR curve seen before. At a Fe fraction of 50% and below, the catalysts show a diverging behavior for both parameters. Mass activity-wise these catalysts show almost equal values, while the halfwave potential rises with an increasing amount of Co. This shows, that an increasing Fe/Co ratio above 50% influences the mass-transport properties of the catalyst more than the kinetics.
Figure 5a shows the ring current density during the ORR measurement with indicated standard deviations.
The catalysts show a linear increase of current density measured at the ring with the increasing Co ratio, indicating an increased formation of H2O2 as opposed to H2O, which hints at a lower than 4e overall mechanism. Interestingly, Co-N-C shows a different curve shape with a pronounced maximum and an onset of current density at higher potentials compared to other catalysts. The pronounced peak in ring-current density for Co-N-C indicates a high peroxide production at confined potential values (0.4–0.7 V) but an even lower ring-current density than FeCo-N-C (1:1) and FeCo-N-C (1:3) at potentials below 0.4 V. In-fact, it has been reported before, that Co in Me-N-C catalysts shows a lower selectivity towards the 4e mechanism [10,24]. The lower selectivity results in higher H2O2 formation and therefore an increase in current density measured at the ring electrode. This can also be observed in the catalysts synthesized here and the selectivity displays a linear behavior in terms increasing Co-content in Fe/Co-N-C catalysts.
The ORR selectivity indicators peroxide yield and electron transfer number are displayed in relation to the Fe/Co ratio in Figure 5b. Values for the monometallic catalysts are in agreement with results of a study by Sgarbi et al. showing that Co (42%) exhibits a higher peroxide yield than Fe (13%) [25]. In agreement with the above described observations this hints at a presence of metals in Me−Nx form in contrast to metallic particles, since the Me−Nx peroxide yield is lower than in particle form (around 20% H2O2 for Fe and around 60% H2O2 for Co). Both parameters show almost equal values for catalysts with Fe fraction of 50% or less and thus deviate from a linear decrease in selectivity with decreasing Fe/Co ratio. A higher electron transfer number and concurrent H2O2 production rate can be detrimental to long-term operation of PEM fuel cells, since it degrades the support as well as the membrane material and can destroy active sites. Especially, in case of Fe and Co H2O2 can undergo the Fenton reaction and form reactive oxygen radicals, which oxidize the carbon rapidly [11,24]. However, selectivity indicators based on peroxide collection on the ring electrode may be deceptive for porous catalysts, due to H2O2 being trapped in the pore network and reacting with the carbon support instead of being oxidized on the outer ring [26]. This would result in even higher H2O2 yield values than measured in this setup.
Information regarding the reaction mechanism of the ORR for different metal ratios in the catalysts was obtained from Tafel analysis in the kinetic current density region (>0.8 V). Figure 6 shows the Tafel plots for all catalysts during the initial characterization along with Tafel slope values in the kinetic current density region in Table 1.
The monometallic Co-N-C (57 mV dec 1 ) exhibits a slightly lower Tafel slope than the monometallic Fe-N-C (63 mV dec 1 ), which is consistent with results reported in literature and hints at different mechanistic aspects regarding redox processes between the two metal sites [25]. Interestingly, all bimetallic catalysts show higher Tafel slopes with values between 72 and 83 mV dec 1 compared to the monometallic ones. This could hint at different rate-determining steps in the ORR mechanism for bimetallic catalysts and different active sites. Since the metal ratio does not seem to influence nitrogen groups significantly, metal sites seem to be influenced by the presence of both metals at the same time, which leads to lower kinetic activity hence the higher Tafel slopes.

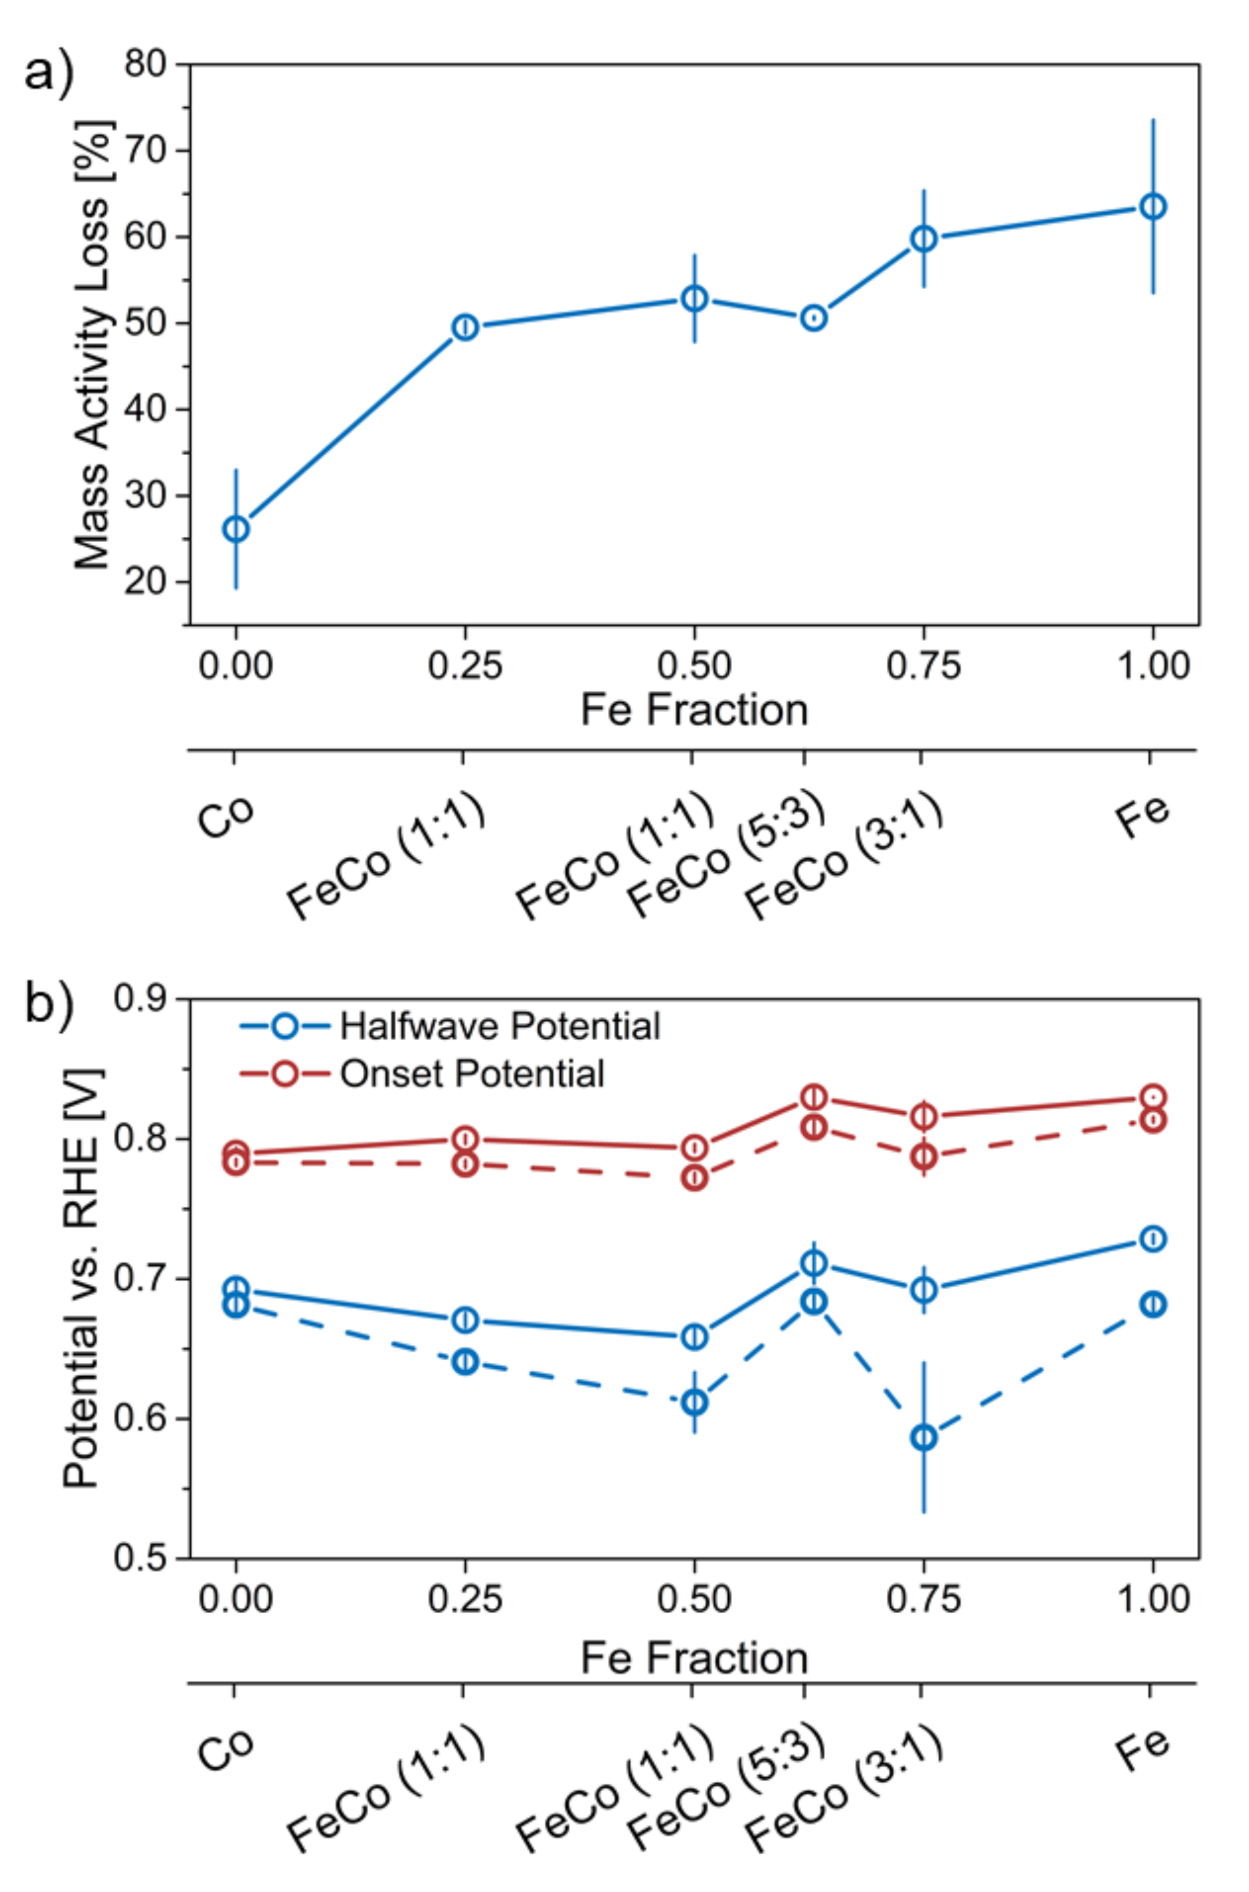
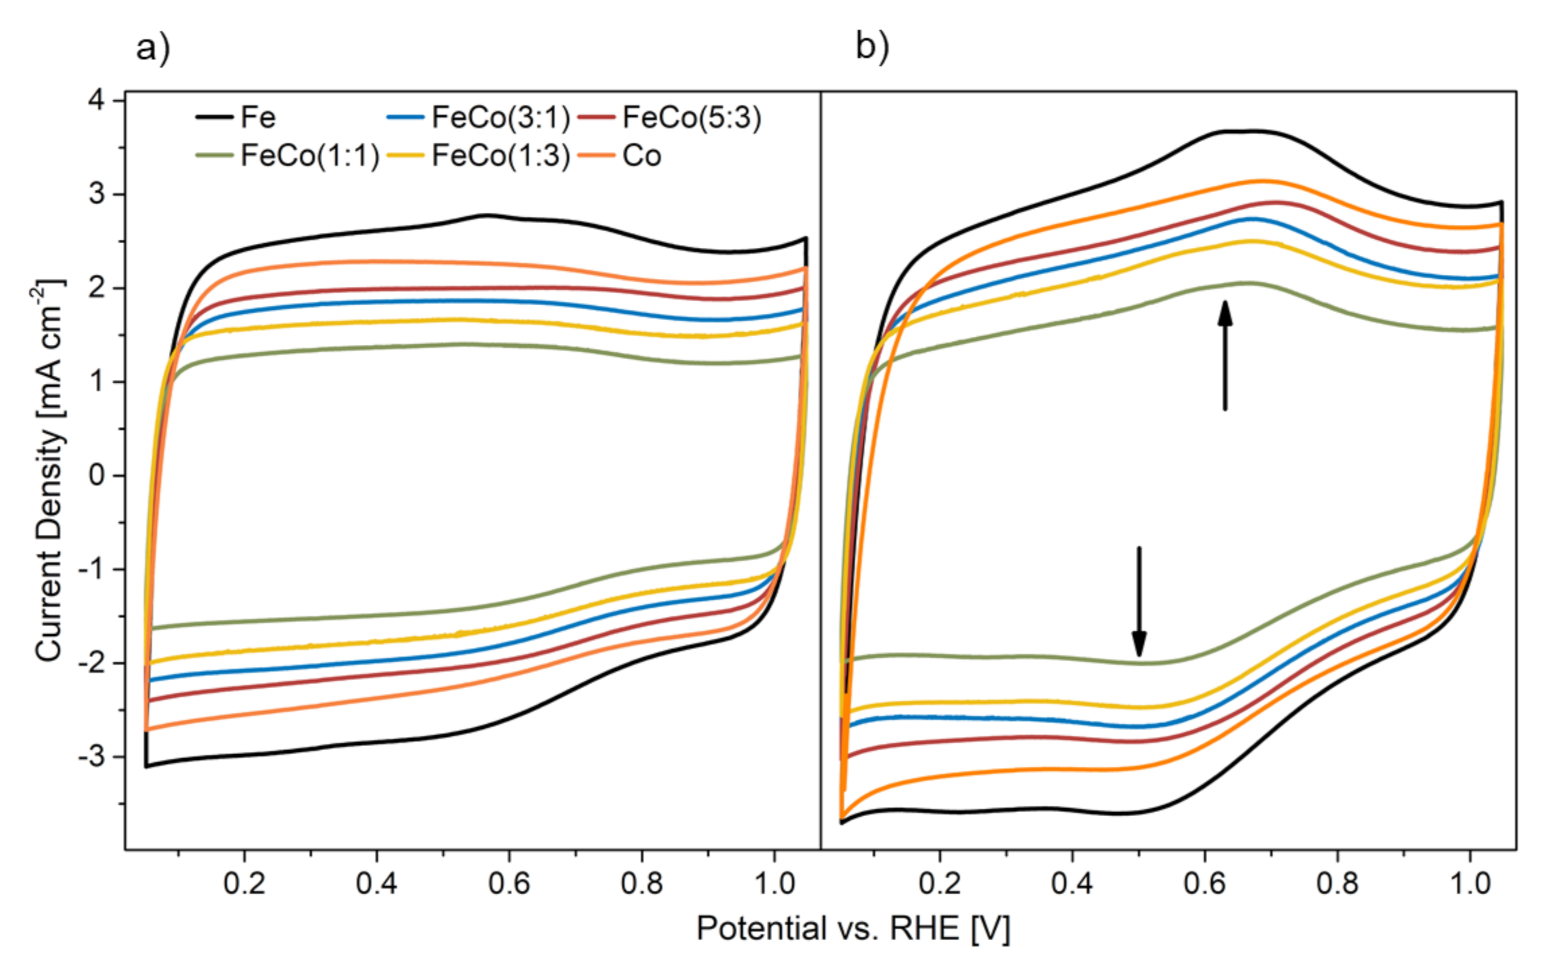
2.2.2. Stress Test Induced Changes

The AST applied high electrode potentials in the range of 1.0–1.5 V, which introduces harsh changes to Me-N-C catalysts, in terms of carbon deterioration and active site degradation [8,27]. This is mainly due to carbon oxidation at these potentials, which in-turn can result in loss of active sites and/or changed mass-transport. The loss of mass activity before and after the AST is shown in Figure 7a.
A linear trend is visible in terms of a lower mass activity loss with an increasing Co content. Co-N-C is an exception to this trend with a significantly lower mass activity loss (25% for Co-N-C vs. 60% for Fe-N-C) confirming the higher stability against carbon corrosion. An increased stability for Co-based catalysts was reported before, which however could in-part also stem from a lower initial mass activity [11,23]. However, no correlation between the exceptional stability of Co-N-C could be made with nitrogen groups, which could have been a structural stability indicator in the catalyst as discussed before [19]. Interestingly, FeCo-N-C (5:3) decreases slightly less in mass activity than the trend would suggest, hinting at an optimal Fe/Co ratio with a notable relative improvement in terms of stability. The mass activity loss observed for the catalysts is comparable with values reported by Kramm et al. of about 70% mass activity loss [28].
Figure 7b shows the changes of onset and halfwave potential after the AST in relation to the Fe/Co ratio. The onset potential decreases more for the four bimetallic catalysts than both monometallic ones. This may be due to a destabilizing interaction between different metal sites present in bimetallic catalysts. Overall the decrease is quite low in relation to the change in halfwave potential. Since the onset potential is mainly attributed to kinetic limited current density and halfwave potential accounts for both kinetic limited and mass-transport limited current density, the larger change in halfwave potential could be assigned to a stronger increase in mass-transport limitations compared to kinetic activity (compare SI Figure S4). Since the AST focuses on carbon corrosion at high potentials (1.0–1.5 V vs. RHE) the apparent increased mass-transport hindrance is reasonable due to degradation of the porous carbon support. Interestingly, the monometallic Fe-N-C does not show the highest onset and halfwave potential decrease as opposed to the highest activity loss. Especially in terms of onset potential, Fe-N-C indicates a potential decrease on-par with all other catalysts with the exception of Co-N-C, which is more stable. FeCo-N-C (5:3) displays a low decrease for both potentials, implying an improved stability in terms of kinetic and mass-transport related current density. The decrease in halfwave potential is almost as low as that of Co-N-C, which shows remarkable stability with a low mass activity loss. The changing stability of the carbon support seems to be induced by the metal ratio with Co rendering the catalyst relatively more stable and interestingly the Fe/Co ratio of 5:3 also showing a high stability.
As an indication to the extent of carbon corrosion after the AST, CVs in nitrogen saturated electrolyte can be considered. Especially in a range of 0.6–0.7 V the quinone /hydroquinone peak can be observed, which acts as a proxy for the oxidation of carbon in the catalysts [28,29]. In Figure 8 the CVs of all catalysts are shown before and after the AST.
It is apparent that all catalysts show an increased current density in the area of the hydroquinone oxidation peak range and in-fact a maximum around 0.6–0.7 V. The sharp increase in hydroquinone oxidation peak height after the AST indicates substantial carbon oxidation during the AST. However, this peak cannot quantify the amount of corroded carbon, due to oxidation to CO2 and subsequent release from the solid carbon matrix. All catalysts show a similar behavior before and after the AST with an increased current density, that can be seen across the whole potential range, which can be attributed to a broadening of the carbon oxidation peak with a concurrent increased double-layer capacitance [28,29]. This is in agreement with a more hindered mass-transport after the AST, as discussed previously, due to disruption of the porous carbon network. N-functionalities in the carbon matrix are discussed to increase its stability against electrochemical oxidative corrosion as recently reported by our group [30]. Additionally, pyrrolic, pyridinic and graphitic N are known to increase the stability because they destabilize surface oxides which are formed during carbon corrosion [31]. However, in our study we observed no correlation of the amount of N-functionalities with the stability of the catalyst, since the N-groups content is similar across all catalysts but the stability differs as discussed above.

3. Materials and Methods

3.1. Catalyst Synthesis

Black Pearls 2000 (Cabot, Boston, MA, USA) support was oxidized according to a procedure by Schmies et al. [32]. The carbon black (2.0 g) was dispersed in concentrated HNO3 (200 mL, 65%, Carl Roth, Karlsruhe, Germany) and held at 90 C for 5 h with subsequent washing using ultra-pure water until pH-neutral. All catalysts were synthesized according to studies by Chung et al. and Tian et al. [33,34] Oxidized Black Pearls (BPox, 19 wt.%) were mixed with ethanol (4.0 mL, Fisher Scientific, Pittsburgh, PA, USA) along-side cyanamide (80 wt.%, Sigma-Aldrich, St. Louis, MO, USA) and the acetate salts of Fe and Co (1 wt.% metal ion, Sigma-Aldrich). Metal weight ratios were varied in a Fe/Co ratio of 1:0, 3:1, 5:3, 1:1, 1:3 and 0:1, respectively, totaling to 1 wt.%. The mixture was ultrasonicated until complete evaporation of ethanol and subsequently dried over night at reduced pressure and 30 C. The impregnated carbon was then heat-treated in a RHTC 80-230/15 tube-furnace (Nabertherm, Lillienthal, Germany) at 900 C with 5 C min 1 under nitrogen atmosphere and held for 1 h with subsequent cooling to room-temperature. Afterwards the catalysts were acid leached with 2 M H2SO4 (Carl Roth) for 16 h at 90 C, followed by a washing with ultra-pure water until pH-neutral. Finally, a second heat-treatment was carried out, identical to the first one. The synthesis route was chosen to be identical across all catalysts to isolate effects stemming from the metal itself rather than the C- and N-precursor.

3.2. Electrochemical Characterization

The catalysts were characterized in a RRDE setup with a 0.2475 cm2 glassy carbon disc and Pt-ring (Pine Research Instrumentation, Durham, NC, USA), reversible hydrogen electrode as reference electrode and Pt-wire, separated from the working electrode by a glas frit as counter electrode. For a discussion on possible catalyst contamination through Pt counter electrode dissolution see Appendix A.1. The electrolyte consisted of 0.1 M HClO4 (Merck, Darmstadt, Germany). Catalyst ink was prepared by ultrasonicating catalyst powder (3.0 mg), ultra-pure water (280.0 μ L) and 2-propanol (63.0 μ L) for 15 min and subsequent addition of Nafion (5 wt.% aliphatic alcohol solution, 38.1 μ L, Sigma-Aldrich) and another ultrasonication for 30 min. The prepared ink (12.6 μ L) was applied to the center of the cleaned glassy carbon electrode, briefly pre-dried at 60 C for 5 min and then completely dried at room-temperature in ambient air, resulting in a final loading of 400 μ g cm 2 .
The initial characterization procedure was started with a cyclic voltammogram (CV) in oxygen saturated electrolyte and 1600 rpm electrode rotation in a potential window of 0.05–1.05 V vs. RHE and a scan rate of 5 mV s 1 to a total of three scans. Afterwards the cell was purged with nitrogen gas for 15 min and subsequent measurements performed in nitrogen saturated electrolyte without electrode rotation. A CV background was measured in the same potential conditions and scan rate as the ORR curve. Then another CV was executed in a potential window of 0.05–1.05 V vs. RHE and 50 mV s 1 and impedance spectroscopy at 0.3 V vs. RHE with an amplitude of 10 mV and a frequency range from 100 kHz to 0.1 Hz has been measured. Additionally, an accelerated stress test was carried out, which was proposed by the Fuel Cell Conference of Japan 2011 [14] and mimics fuel cell start-up and shut-down conditions. This was done in a potential window of 1.0–1.5 V vs. RHE with 500 mV s 1 for 5000 cycles in a triangular-wave. Finally, the measurements from the initial characterization were carried out again.
All potentials were corrected by the electrolyte resistance, which was determined by impedance spectroscopy. Furthermore, CV current densities recorded in oxygen saturated electrolyte were corrected by the subtraction of measured background current density. The onset potential was defined as the maximum potential value below 2% of the maximum current density in the ORR curve. The half-wave potential was calculated from the maximum of the first derivative of the ORR curve. Electrochemical mass activity M A at 0.75 V vs. RHE was calculated according to Equation (1) using the limiting current density j l i m and catalyst mass m.
M A = j @ 0.75 V · j l i m j l i m j @ 0.75 V · m 1
The selectivity indicators electron transfer number n and hydrogen peroxide yield X H 2 O 2 were calculated according to Equations (2) and (3), respectively.
n = 4 · j d i s k j d i s k · j r i n g N
X H 2 O 2 = 2 · j r i n g N j d i s k + j r i n g N · 100

3.3. Physical Characterization

XRD measurements were carried out with a PANalytical EMPYREAN X-ray diffractometer (PANalytical, Kassel, Germany) by applying the catalyst to an amorphous silicon disk. The diffractometer was arranged in a Bragg-Bretano geometry, equipped with a Cu K α anode, and the diffractograms were recorded in the 5–90 2 θ range. The data were analyzed in HighScore Plus software (PANalytical).
XPS measurements were carried out in a ESCALAB 250Xi (Thermo Fisher, Waltham, MA, USA) device with a 1486.6 eV monochromatic Al K α anode. The catalyst was compacted in an aluminum sample holder and irradiated with a 500 μ m diameter ray and high-resolution spectra recorded with a pass energy of 20.0 eV and step size of 0.02 eV. Spectra fitting was done in Avantage software (Thermo Fischer) and a simplex background fitting has been chosen.
HR-TEM samples were applied to a polyvinyl butyral-coated copper grid and then analyzed in a JEM-2100F HR-TEM (Jeol, Akishima, Japan), equipped with an 80 mm2 X-Max80 SDD EDS detector (Oxford Instruments, Abingdon, UK). The measurements were carried out under an 80–200 kV accelerating voltage. Data were analyzed with INCA software (Oxford Instruments).

4. Conclusions

Possible synergistic effects of different Fe/Co ratios in bimetallic FeCo-N-C electrocatalysts were examined in this work. Two monometallic and four bimetallic catalysts have been synthesized and characterized physically and electrochemically. Proposed atomically dispersed Me−N sites have been achieved in the structure of the catalysts with a negligible amount of metal particles. These are not visible in XRD as crystalline phases but in HR-TEM micrographs and EDS as metal agglomerations. Interestingly, both metals seem to agglomerate together in bimetallic catalysts. XPS analysis showed comparable amounts of N-matrix species namely pyridinic, pyrrolic, Me-N and graphitic, across all bimetallic and monometallic catalysts indicating no influence of the metal ratio towards N-incorporation. Only a minor increase of Me-N groups with the Co content was observed. The ORR-activity shows no clear linear trend with decreasing Fe- and increasing Co-content. The monometallic Fe-N-C shows the highest activity towards the ORR, however FeCo-N-C (5:3) performs the second best activity-wise, despite a lower Fe content than FeCo-N-C (3:1). The ring current density as an indication for ORR selectivity displays a linear increase with the Fe/Co ratio, despite the electron transfer number being almost the same value (around 3.1) for all catalysts with less than 50% Fe. After the AST in the range of 1.0–1.5 V, the catalysts show a mass activity loss between 65 and 25 % with decreasing Fe- and increasing Co- content, respectively. Especially, the monometallic Co-N-C and the bimetallic FeCo-N-C (5:3) show high stabilities deviating from the trend. Furthermore, a larger increase in mass-transport limitation after the AST was observed for all catalysts, which was in accordance with carbon oxidation and subsequent degradation of the support. This was also observed in the formation of quinone/hydroquinone species in the CVs of the catalysts. Yet, FeCo-N-C (5:3) displays an exceptional stability in terms of both potential parameters with simultaneous relatively high ORR activity, thus demonstrating a possible trade-off of stability and activity in the application of this particular catalyst.

Supplementary Materials

The following are available at https://www.mdpi.com/article/10.3390/catal11070841/s1, Figure S1:TEM images and EDS, Figure S2: N1s high resolution XP spectra of (a) Fe-N-C, (b) FeCo-N-C (3:1), (c) FeCo-NC (5:3), (d) FeCo-N-C (1:1), (e) FeCo-N-C (1:3) and (f) Co-N-C, Figure S3: Fe 2p (left) and Co 2p (right) high-resolution XP spectra, Figure S4: ORR curves for all catalysts with indicated standard deviation before (left) and after (right) the AST.

Author Contributions

Conceptualization, M.G. and J.M-H.; methodology, M.G. and J.M.-H.; validation, M.G.; formal analysis, M.G.; investigation, M.G.; resources, P.W., A.D. and M.W.; data curation, M.G.; writing—original draft preparation, M.G.; writing—review and editing, M.G., J.M.-H., H.S., D.S., P.W., A.D. and M.W.; visualization, M.G.; supervision, P.W., A.D. and M.W.; project administration, P.W., A.D. and M.W.; funding acquisition, P.W., A.D. and M.W. All authors have read and agreed to the published version of the manuscript.

Funding

The XPS and XRD instruments are funded by DFG through grant INST 184/144-1 FUGG and INST 184/154-1 FUGG.

Acknowledgments

The authors acknowledge the Electron and Light Microscopy Service Unit, Carl von Ossietzky University of Oldenburg, for the use of the imaging facilities.

Conflicts of Interest

The authors declare no conflict of interest. The funders had no role in the design of the study; in the collection, analyses, or interpretation of data; in the writing of the manuscript, or in the decision to publish the results.

Appendix A

Appendix A.1. Discussion on Pt Counter Electrode Dissolution

Recently, the possible Pt contamination of pgm-free catalysts through the utilization of Pt counter electrodes arose as discussion in literature. The dissolution of Pt could occur, if the counter electrode experiences potentials of around 0.85 V vs. RHE [35]. Counter electrode potentials follow the potential of the working electrode in an inverse manner and are influenced by the ratio of geometric area of both electrodes. Therefore, the highest potential experienced by the counter electrodes are induced when the working electrode experience the lowest potential, in the case of this study 0.05 V vs. RHE. Previously, Tian et al. reported a maximum counter electrode potential of 0.62 V vs. RHE with an working electrode potential of 0.05 V vs. RHE and a working electrode to counter electrode geometric area ratio of 1/10 [36]. The ratio of geometric area in this setup is 1/9.7, thus close to the parameters reported by Tian et al. and therefore no potentials of 0.85 V vs. RHE would be experienced by the counter electrode. Pt dissolution is thus not expected to be problematic for the used setup and especially in ORR measurements.

References

  1. Orr, F.M. Addressing Climate Change with Clean Energy Technology. ACS Energy Lett. 2016, 1, 113–114. [Google Scholar] [CrossRef] [Green Version]
  2. Senftle, T.P.; Carter, E.A. The Holy Grail: Chemistry Enabling an Economically Viable CO2 Capture, Utilization, and Storage Strategy. Acc. Chem. Res. 2017, 50, 472–475. [Google Scholar] [CrossRef]
  3. Jaouen, F.; Jones, D.; Coutard, N.; Artero, V.; Strasser, P.; Kucernak, A. Toward Platinum Group Metal-Free Catalysts for Hydrogen/Air Proton-Exchange Membrane Fuel Cells. Johns. Matthey Technol. Rev. 2018, 62, 231–255. [Google Scholar] [CrossRef]
  4. Osmieri, L. Transition Metal–Nitrogen–Carbon (M–N–C) Catalysts for Oxygen Reduction Reaction. Insights on Synthesis and Performance in Polymer Electrolyte Fuel Cells. ChemEngineering 2019, 3, 16. [Google Scholar] [CrossRef] [Green Version]
  5. Borup, R.; Meyers, J.; Pivovar, B.; Kim, Y.S.; Mukundan, R.; Garland, N.; Myers, D.; Wilson, M.; Garzon, F.; Wood, D.; et al. Scientific Aspects of Polymer Electrolyte Fuel Cell Durability and Degradation. Chem. Rev. 2007, 107, 3904–3951. [Google Scholar] [CrossRef]
  6. Suha-Yazici, M.; Yavasoglu, H.A.; Eroglu, M. A mobile off-grid platform powered with photovoltaic/wind/battery/fuel cell hybrid power systems. Int. J. Hydrogen Energy 2013, 38, 11639–11645. [Google Scholar] [CrossRef]
  7. Wu, G.; Johnston, C.M.; Mack, N.H.; Artyushkova, K.; Ferrandon, M.; Nelson, M.; Lezama-Pacheco, J.S.; Conradson, S.D.; More, K.L.; Myers, D.J.; et al. Synthesis–structure–performance correlation for polyaniline–Me–C non-precious metal cathode catalysts for oxygen reduction in fuel cells. J. Mater. Chem. 2011, 21, 11392–11405. [Google Scholar] [CrossRef]
  8. Martinaiou, I.; Shahraei, A.; Grimm, F.; Zhang, H.; Wittich, C.; Klemenz, S.; Dolique, S.J.; Kleebe, H.J.; Stark, R.W.; Kramm, U.I. Effect of metal species on the stability of Me-N-C catalysts during accelerated stress tests mimicking the start-up and shut-down conditions. Electrochim. Acta 2017, 243, 183–196. [Google Scholar] [CrossRef]
  9. Barkholtz, H.M.; Liu, D.J. Advancements in rationally designed PGM-free fuel cell catalysts derived from metal–organic frameworks. Mater. Horiz. 2017, 4, 20–37. [Google Scholar] [CrossRef]
  10. Peng, H.; Liu, F.; Liu, X.; Liao, S.; You, C.; Tian, X.; Nan, H.; Luo, F.; Song, H.; Fu, Z.; et al. Effect of Transition Metals on the Structure and Performance of the Doped Carbon Catalysts Derived From Polyaniline and Melamine for ORR Application. ACS Catal. 2014, 4, 3797–3805. [Google Scholar] [CrossRef]
  11. Liu, J.; Jin, Z.; Wang, X.; Ge, J.; Liu, C.; Xing, W. Recent advances in active sites identification and regulation of M-N/C electro-catalysts towards ORR. Sci. China Chem. 2019, 62, 669–683. [Google Scholar] [CrossRef]
  12. Wu, G.; More, K.L.; Johnston, C.M.; Zelenay, P. High-Performance Electrocatalysts for Oxygen Reduction Derived from Polyaniline, Iron, and Cobalt. Science 2011, 332, 443–459. [Google Scholar] [CrossRef] [Green Version]
  13. Nallathambi, V.; Lee, J.W.; Kumaraguru, S.P.; Wu, G.; Popov, B.N. Development of high performance carbon composite catalyst for oxygen reduction reaction in PEM Proton Exchange Membrane fuel cells. J. Power Sour. 2008, 183, 34–42. [Google Scholar] [CrossRef]
  14. Ohma, A.; Shinohara, K.; Iiyama, A.; Yoshida, T.; Daimaru, A. Membrane and Catalyst Performance Targets for Automotive Fuel Cells by FCCJ Membrane, Catalyst, MEA WG. ECS Trans. 2011, 41, 775–784. [Google Scholar] [CrossRef]
  15. Hu, Y.; Jensen, J.O.; Zhang, W.; Martin, S.; Chenitz, R.; Pan, C.; Xing, W.; Bjerrum, N.J.; Li, Q. Fe3C-based oxygen reduction catalysts: Synthesis, hollow spherical structures and applications in fuel cells. J. Mater. Chem. A 2015, 3, 1752–1760. [Google Scholar] [CrossRef]
  16. Li, Z.Q.; Lu, C.J.; Xia, Z.P.; Zhou, Y.; Luo, Z. X-ray diffraction patterns of graphite and turbostratic carbon. Carbon 2007, 45, 1686–1695. [Google Scholar] [CrossRef]
  17. Carmo, M.; dos Santos, A.R.; Poco, J.G.R.; Linardi, M. Physical and electrochemical evaluation of commercial carbon black as electrocatalysts supports for DMFC applications. J. Power Sour. 2007, 173, 860–866. [Google Scholar] [CrossRef]
  18. Chung, H.T.; Cullen, D.A.; Higgins, D.; Sneed, B.T.; Holby, E.F.; More, K.L.; Zelenay, P. Direct atomic-level insight into the active sites of a high-performance PGM-free ORR catalyst. Science 2017, 357, 479. [Google Scholar] [CrossRef] [Green Version]
  19. Artyushkova, K.; Serov, A.; Rojas-Carbonell, S.; Atanassov, P. Chemistry of Multitudinous Active Sites for Oxygen Reduction Reaction in Transition Metal–Nitrogen–Carbon Electrocatalysts. J. Phys. Chem. C 2015, 119, 25917–25928. [Google Scholar] [CrossRef]
  20. Jaouen, F.; Herranz, J.; Lefèvre, M.; Dodelet, J.P.; Kramm, U.I.; Herrmann, I.; Bogdanoff, P.; Maruyama, J.; Nagaoka, T.; Garsuch, A.; et al. Cross-Laboratory Experimental Study of Non-Noble-Metal Electrocatalysts for the Oxygen Reduction Reaction. ACS Appl. Mater. Interfaces 2009, 1, 1623–1639. [Google Scholar] [CrossRef]
  21. Wu, G.; Zelenay, P. Nanostructured Nonprecious Metal Catalysts for Oxygen Reduction Reaction. Acc. Chem. Res. 2013, 46, 1878–1889. [Google Scholar] [CrossRef]
  22. Leiro, J.A.; Heinonen, M.H.; Laiho, T.; Batirev, I.G. Core-level XPS spectra of fullerene, highly oriented pyrolitic graphite, and glassy carbon. J. Electron. Spectrosc. Relat. Phenom. 2003, 128, 205–213. [Google Scholar] [CrossRef]
  23. Cheng, Q.; Yang, L.; Zou, L.; Zou, Z.; Chen, C.; Hu, Z.; Yang, H. Single Cobalt Atom and N Codoped Carbon Nanofibers as Highly Durable Electrocatalyst for Oxygen Reduction Reaction. ACS Catal. 2017, 7, 6864–6871. [Google Scholar] [CrossRef]
  24. Wang, X.X.; Prabhakaran, V.; He, Y.; Shao, Y.; Wu, G. Iron-Free Cathode Catalysts for Proton-Exchange-Membrane Fuel Cells: Cobalt Catalysts and the Peroxide Mitigation Approach. Adv. Mater. 2019, 31, 1805126. [Google Scholar] [CrossRef] [PubMed]
  25. Sgarbi, R.; Kumar, K.; Jaouen, F.; Zitolo, A.; Ticianelli, E.A.; Maillard, F. Oxygen reduction reaction mechanism and kinetics on M-NxCy and M@N-C active sites present in model M-N-C catalysts under alkaline and acidic conditions. J. Solid State Electrochem. 2019. [Google Scholar] [CrossRef]
  26. Bonakdarpour, A.; Lefevre, M.; Yang, R.; Jaouen, F.; Dahn, T.; Dodelet, J.P.; Dahn, J.R. Impact of Loading in RRDE Experiments on Fe–N–C Catalysts: Two- or Four-Electron Oxygen Reduction? Electrochem. Solid-State Lett. 2008, 11, B105–B108. [Google Scholar] [CrossRef]
  27. Kumar, K.; Dubau, L.; Mermoux, M.; Li, J.; Zitolo, A.; Nelayah, J.; Jaouen, F.; Maillard, F. On the Influence of Oxygen on the Degradation of Fe-N-C Catalysts. Angew. Chem. Int. Ed. 2019. [Google Scholar] [CrossRef]
  28. Kramm, U.I.; Zana, A.; Vosch, T.; Fiechter, S.; Arenz, M.; Schmeißer, D. On the structural composition and stability of Fe–N–C catalysts prepared by an intermediate acid leaching. J. Solid State Electrochem. 2016, 20, 969–981. [Google Scholar] [CrossRef]
  29. Gojkovic, S.L.; Gupta, S.; Savinell, R.F. Heat-Treated Iron(III) Tetramethoxyphenyl Porphyrin Supported on High-Area Carbon as an Electrocatalyst for Oxygen Reduction: I. Characterization of the Electrocatalyst. J. Electrochem. Soc. 1998, 145, 3493–3499. [Google Scholar] [CrossRef]
  30. Müller-Hülstede, J.; Schonvogel, D.; Schmies, H.; Wagner, P.; Dyck, A.; Wark, M. Incorporation of Activated Biomasses in Fe–N–C Catalysts for Oxygen Reduction Reaction with Enhanced Stability in Acidic Media. ACS Appl. Energy Mater. 2021. [Google Scholar] [CrossRef]
  31. Li, Y.; Li, J.; Wang, Y.G.; Chen, X.; Liu, M.; Zheng, Z.; Peng, X. Carbon corrosion mechanism on nitrogen-doped carbon support—A density functional theory study. Int. J. Hydrog. Energy 2021, 46, 13273–13282. [Google Scholar] [CrossRef]
  32. Schmies, H.; Hornberger, E.; Anke, B.; Jurzinsky, T.; Nong, H.N.; Dionigi, F.; Kühl, S.; Drnec, J.; Lerch, M.; Cremers, C.; et al. Impact of Carbon Support Functionalization on the Electrochemical Stability of Pt Fuel Cell Catalysts. Chem. Mater. 2018, 30, 7287–7295. [Google Scholar] [CrossRef]
  33. Chung, H.T.; Zelenay, P. Non-Precious Metal Catalysts Prepared from Precursor Comprising Cyanamide. U.S. Patent 9,169,140, 27 October 2015. [Google Scholar]
  34. Tian, J.; Birry, L.; Jaouen, F.; Dodelet, J.P. Fe-based catalysts for oxygen reduction in proton exchange membrane fuel cells with cyanamide as nitrogen precursor and/or pore-filler. Electrochim. Acta 2011, 56, 3276–3285. [Google Scholar] [CrossRef]
  35. Furuya, Y.; Mashio, T.; Ohma, A.; Tian, M.; Kaveh, F.; Beauchemin, D.; Jerkiewicz, G. Influence of Electrolyte Composition and pH on Platinum Electrochemical and/or Chemical Dissolution in Aqueous Acidic Media. ACS Catal. 2015, 5, 2605–2614. [Google Scholar] [CrossRef]
  36. Tian, M.; Cousins, C.; Beauchemin, D.; Furuya, Y.; Ohma, A.; Jerkiewicz, G. Influence of the Working and Counter Electrode Surface Area Ratios on the Dissolution of Platinum under Electrochemical Conditions. ACS Catal. 2016, 6, 5108–5116. [Google Scholar] [CrossRef]
Figure 1. XRD of all catalysts with neat BP reference.
Catalysts 11 00841 g001
Figure 2. Exemplary HR-TEM (a) micrograph of FeCo-N-C (5:3), (b) EDS N elemental mapping of FeCo-N-C (5:3), (c) EDS Fe elemental mapping of FeCo-N-C (5:3) and (d) EDS Co elemental mapping of FeCo-N-C (5:3).
Catalysts 11 00841 g002
Figure 3. (a) An example of a fitted high-resolution N 1s XP spectrum of Fe-N-C and (b) percentage ratio of N-species in all catalysts.
Catalysts 11 00841 g003
Figure 4. (a) ORR curves for all catalysts with indicated standard deviation and (b) comparison of mass activity and halfwave potential in relation to the Fe content in the catalyst synthesis.
Catalysts 11 00841 g004
Figure 5. (a) Ring current density during ORR measurement with indicated standard deviation and (b) comparison of peroxide yield and electron transfer number in relation to the Fe content in the catalyst synthesis.
Catalysts 11 00841 g005
Figure 6. Tafel plots of all monometallic and bimetallic catalysts in the kinetic current density region.
Catalysts 11 00841 g006
Figure 7. (a) Loss of mass activity after the AST for all catalyst in relation to the Fe content in the catalyst synthesis and (b) comparison of halfwave and onset potential in relation to the Fe content in the catalyst synthesis before (full) and after (dashed) the AST.
Catalysts 11 00841 g007
Figure 8. CVs of all mono-and bimetallic catalysts (a) before and (b) after the AST.
Catalysts 11 00841 g008
Table 1. Tafel slopes in the kinetic current density region for all synthesized catalysts.
CatalystTafel Slope [mV dec 1 ]
Fe-N-C63
FeCo-N-C (3:1)75
FeCo-N-C (5:3)72
FeCo-N-C (1:1)83
FeCo-N-C (1:3)78
Co-N-C57
Publisher’s Note: MDPI stays neutral with regard to jurisdictional claims in published maps and institutional affiliations.

