Article

Unraveling Structural Details in Ga-Pd SCALMS Systems Using Correlative Nano-CT, 360° Electron Tomography and Analytical TEM

1
Institute of Micro- and Nanostructure Research (IMN) & Center for Nanoanalysis and Electron Microscopy (CENEM), Interdisciplinary Center for Nanostructured Films (IZNF), Friedrich-Alexander-Universität Erlangen-Nürnberg (FAU), 91058 Erlangen, Germany
2
Department of Chemical and Biological Engineering, Chemical Engineering I (Reaction Engineering), Friedrich-Alexander-Universität Erlangen-Nürnberg, 91058 Erlangen, Germany
*
Author to whom correspondence should be addressed.
Catalysts 2021, 11(7), 810; https://doi.org/10.3390/catal11070810
Submission received: 1 June 2021 / Revised: 25 June 2021 / Accepted: 29 June 2021 / Published: 1 July 2021
(This article belongs to the Special Issue Characterization Analysis of Heterogeneous Catalysts)

Abstract

:
We present a comprehensive structural and analytical characterization of the highly promising supported catalytically active liquid metal solutions (SCALMS) system. This novel catalyst shows excellent performance for alkane dehydrogenation, especially in terms of resistance to coking. SCALMS consists of a porous support containing catalytically active low-melting alloy particles (e.g., Ga-Pd) featuring a complex structure, which are liquid at reaction temperature. High-resolution 3D characterization at various length scales is required to reveal the complex pore morphology and catalytically active sites’ location. Nano X-ray computed tomography (nano-CT) in combination with electron tomography (ET) enables nondestructive and scale-bridging 3D materials research. We developed and applied a correlative approach using nano-CT, 360°-ET and analytical transmission electron microscopy (TEM) to decipher the morphology, distribution and chemical composition of the Ga-Pd droplets of the SCALMS system over several length scales. Utilizing ET-based segmentations of nano-CT reconstructions, we are able to reliably reveal the homogenous porous support network with embedded Ga-Pd droplets featuring a nonhomogenous elemental distribution of Ga and Pd. In contrast, large Ga-Pd droplets with a high Ga/Pd ratio are located on the surface of SCALMS primary particles, whereas the droplet size and the Ga/Pd ratio decreases while advancing into the porous volume. Our studies reveal new findings about the complex structure of SCALMS which are required to understand its superior catalytic performance. Furthermore, advancements in lab-based nano-CT imaging are presented by extending the field of view (FOV) of a single experiment via a multiple region-of-interest (ROI) stitching approach.

Graphical Abstract

1. Introduction

In today’s world, the development of improved catalyst systems is crucial to tackle some of the biggest challenges of this century regarding industrial processes, energy, the environment and lifestyle [1,2]. A high number of modern industrial catalysis processes take place via two main approaches. On the one hand, catalysis can be categorized as homogeneous, which implies only a single phase, i.e., catalysis in a solution by a soluble catalyst [3]. On the other hand, in heterogeneous catalysis, the catalytic process derives from the immediate surface area between different phases: for instance, solid catalysts acting within gaseous or liquid reactants [4]. Starting in the 1960s [5], liquid-phase catalysis was demonstrated to have a high potential by merging homogeneous and heterogeneous catalysis. Here, a catalytically active phase is adsorbed onto a porous support material in the form of a film or droplets [6]. This concept was later improved in the so-called supported ionic liquid-phase catalysis (SILP) [7]. With the main characteristics of a state-of-the-art catalyst system being the activity and selectivity combined with the reproducibility, high-temperature stability and capacity for easy regeneration [8], the SILP concept expanded into a new concept published by Taccardi et al. in 2017: supported catalytically active liquid metal solutions (SCALMS) [9]. The SCALMS concept features extraordinary catalytic properties and significant resistance to coke formation. As stated by Taccardi et al. [9], the liquid metal solution is highly dynamic, and the catalytic reactions take place at the isolated, homogeneously distributed, active metal atoms, e.g., Pd, Pt and Rh, on the surface of the liquid metallic phase, as with Ga [9,10,11]. In particular, the Pd-Ga system is very well studied since Ga is characterized by its low melting point (29.7 °C) [12] and is also known to dissolve most transition metals [13]. Furthermore, it has been reported that the distinctive surface texture of Pd-Ga causes the excellent catalytic performance of this type of material [14], although other material compositions, such as Pt-Ga [15,16] or Rh-Ga [10], are promising alternatives. The abovementioned catalyst systems exhibit complex three-dimensional (3D) structures which govern the catalyst properties [17]. The porous support material and the distribution and size of the catalytically active metal–metal complexes cover important structural and morphological features on different length scales, whose 3D characterization to date has not been comprehensively addressed.
On the atomic scale, atom probe tomography (APT) allows the investigation of samples with diameters below 100 nm at atomic resolution [18]. Moving to larger samples, a quite flexible approach can be pursued in a focused ion beam (FIB) scanning electron microscopy (SEM) dual-beam instrument, resulting in the so-called slice and view tomography or FIB-SEM tomography [19]. This technique allows the investigation of variable sample sizes and geometries with a depth resolution down to 3 nm and a lateral resolution of about 1 nm [20]. Both APT and FIB-SEM tomography are destructive methods, so the exact same position of the sample cannot be used for further complementary characterization or in situ measurements, such as investigating structural changes happening upon catalytic conversion in a reactor. Such experiments necessitate a nondestructive workflow enabling the use of one single sample for different consecutive experiments. Electron tomography (ET) allows the nondestructive 3D investigation with a nm resolution of samples up to a few microns in size. In particular, 360°-ET, where the sample geometry allows a tilt-angle range of at least 180°, is able to provide artifact-free (i.e., without missing-wedge artifacts) 3D reconstructions. 360°-ET allows for very high and uniform spatial resolution and features a well-interpretable enhanced mass-thickness contrast in high-angle annular dark-field (HAADF) scanning transmission electron microscopy (STEM) mode while allowing experiments to be conducted in a rather short time of typically a few hours [21]. Whereas ET is limited to a sample size of a few µm depending on the material’s density and porosity [22], micro and nano X-ray computed tomography (CT) enable nondestructive 3D imaging of larger sample volumes, albeit at reduced spatial resolution. While micro-CT covers sample sizes from several hundred µm up to cm with a spatial resolution of down to a few µm [23,24], intermediately sized samples of a few dozen µm with a homogenous spatial resolution down to (50 nm)³ can be assessed by nano-CT. These methods are usually historically realized at synchrotron facilities [25,26]. However, with the development and transfer of synchrotron optics to lab instruments in recent years, micro-CT and nano-CT can be performed in the lab with amazingly comparable performance, except for the X-ray source brilliance [27,28,29,30,31,32,33,34]. State-of-the-art lab nano-CT instruments like the ZEISS Xradia 810 Ultra typically offer several imaging modalities. On the one hand, the large-field-of-view (LFOV) mode, featuring a pixel size of 63.89 nm, a spatial resolution of (150 nm)³ and a resulting field of view (FOV) of 65 µm, enables imaging of comparably large samples beneficial to gather statistically relevant data. On the other hand, the high-resolution (HRES) mode with a pixel size of 16.09 nm and a FOV of 16 µm offers highly precise scans with a spatial resolution of around (50 nm)³. Therefore, by combining these imaging modalities, scale-bridging studies can already be performed on exclusively one modern lab-based X-ray microscope.
Usually, nano-CT imaging is realized in conventional absorption contrast (AC) mode. Therein, the contrast formation is based on the attenuation of X-rays transmitting the sample volume, described by the Beer–Lambert law. AC imaging is commonly utilized for samples featuring heavy elements (high atomic number Z) resulting in sufficient contrast by X-ray attenuation. For lighter elements (low atomic number Z) or constituent materials of similar density, a second nano-CT imaging mode can be utilized by inserting a Zernike phase ring into the beam path near the back-focal plane of the Fresnel zone plate [35]. This so-called phase contrast (PC) mode enhances the contrast of transient regions between different constituent material phases or sharp edges, which is particularly beneficial for porous materials [36]. The downside of PC imaging is the introduction of halo-like contrast enhancements in sample regions with abrupt changes of material density or projected thickness and shade-off artifacts, which are nonmonotonically related to sample properties. These artifacts do not satisfy the projection-slice theorem, and, if one does not correct for them, they lead to errors in the 3D reconstruction and complicate quantitative data analysis [37,38]. In the literature, several approaches to correct these PC artifacts are shown: e.g., Kumar et al. [36] presented an optic-based segmentation of Zernike PC by modeling the X-ray PC optics in a nano-CT instrument, or Yang et al. [37] who did so by reversely correcting for the PC components in the X-ray projections by determining the CTF of the utilized optical setup. In our approach, we address the halo-like PC variations by utilizing high-resolution 360°-ET reconstructions without PC artifacts (Figure 3F) to inform and enhance the interpretation and segmentation quality of the PC nano-CT datasets (Figures 5 and 6).
Several approaches for scale-bridging 3D analysis have been demonstrated. For instance, a semidestructive workflow combining nano-CT with FIB-SEM tomography enabled a superior segmentation of 3D datasets and thorough analysis of samples of several microns in size [39,40]. As a nondestructive approach, the combination of 360°-ET and nano-CT proved to reliably reveal the structure of complex material systems [41,42], e.g., macroporous zeolite particle agglomerates, with nm resolution, while, at the same time, covering decently sized volumes up to (40 µm)³, enabling the acquisition of statistically relevant information [43].
The complex structure of SCALMS on different length scales with its porous support and active sites embedded in Ga requires a correlative 3D microscopy approach. The focus of previous SCALMS studies was set primarily on a detailed analysis of the catalytic properties [9,10,
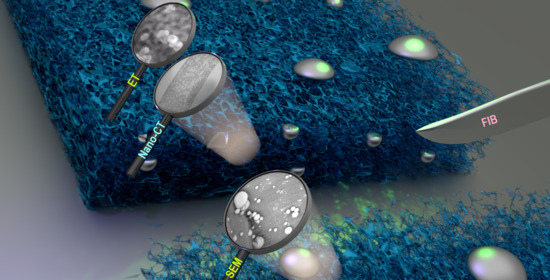
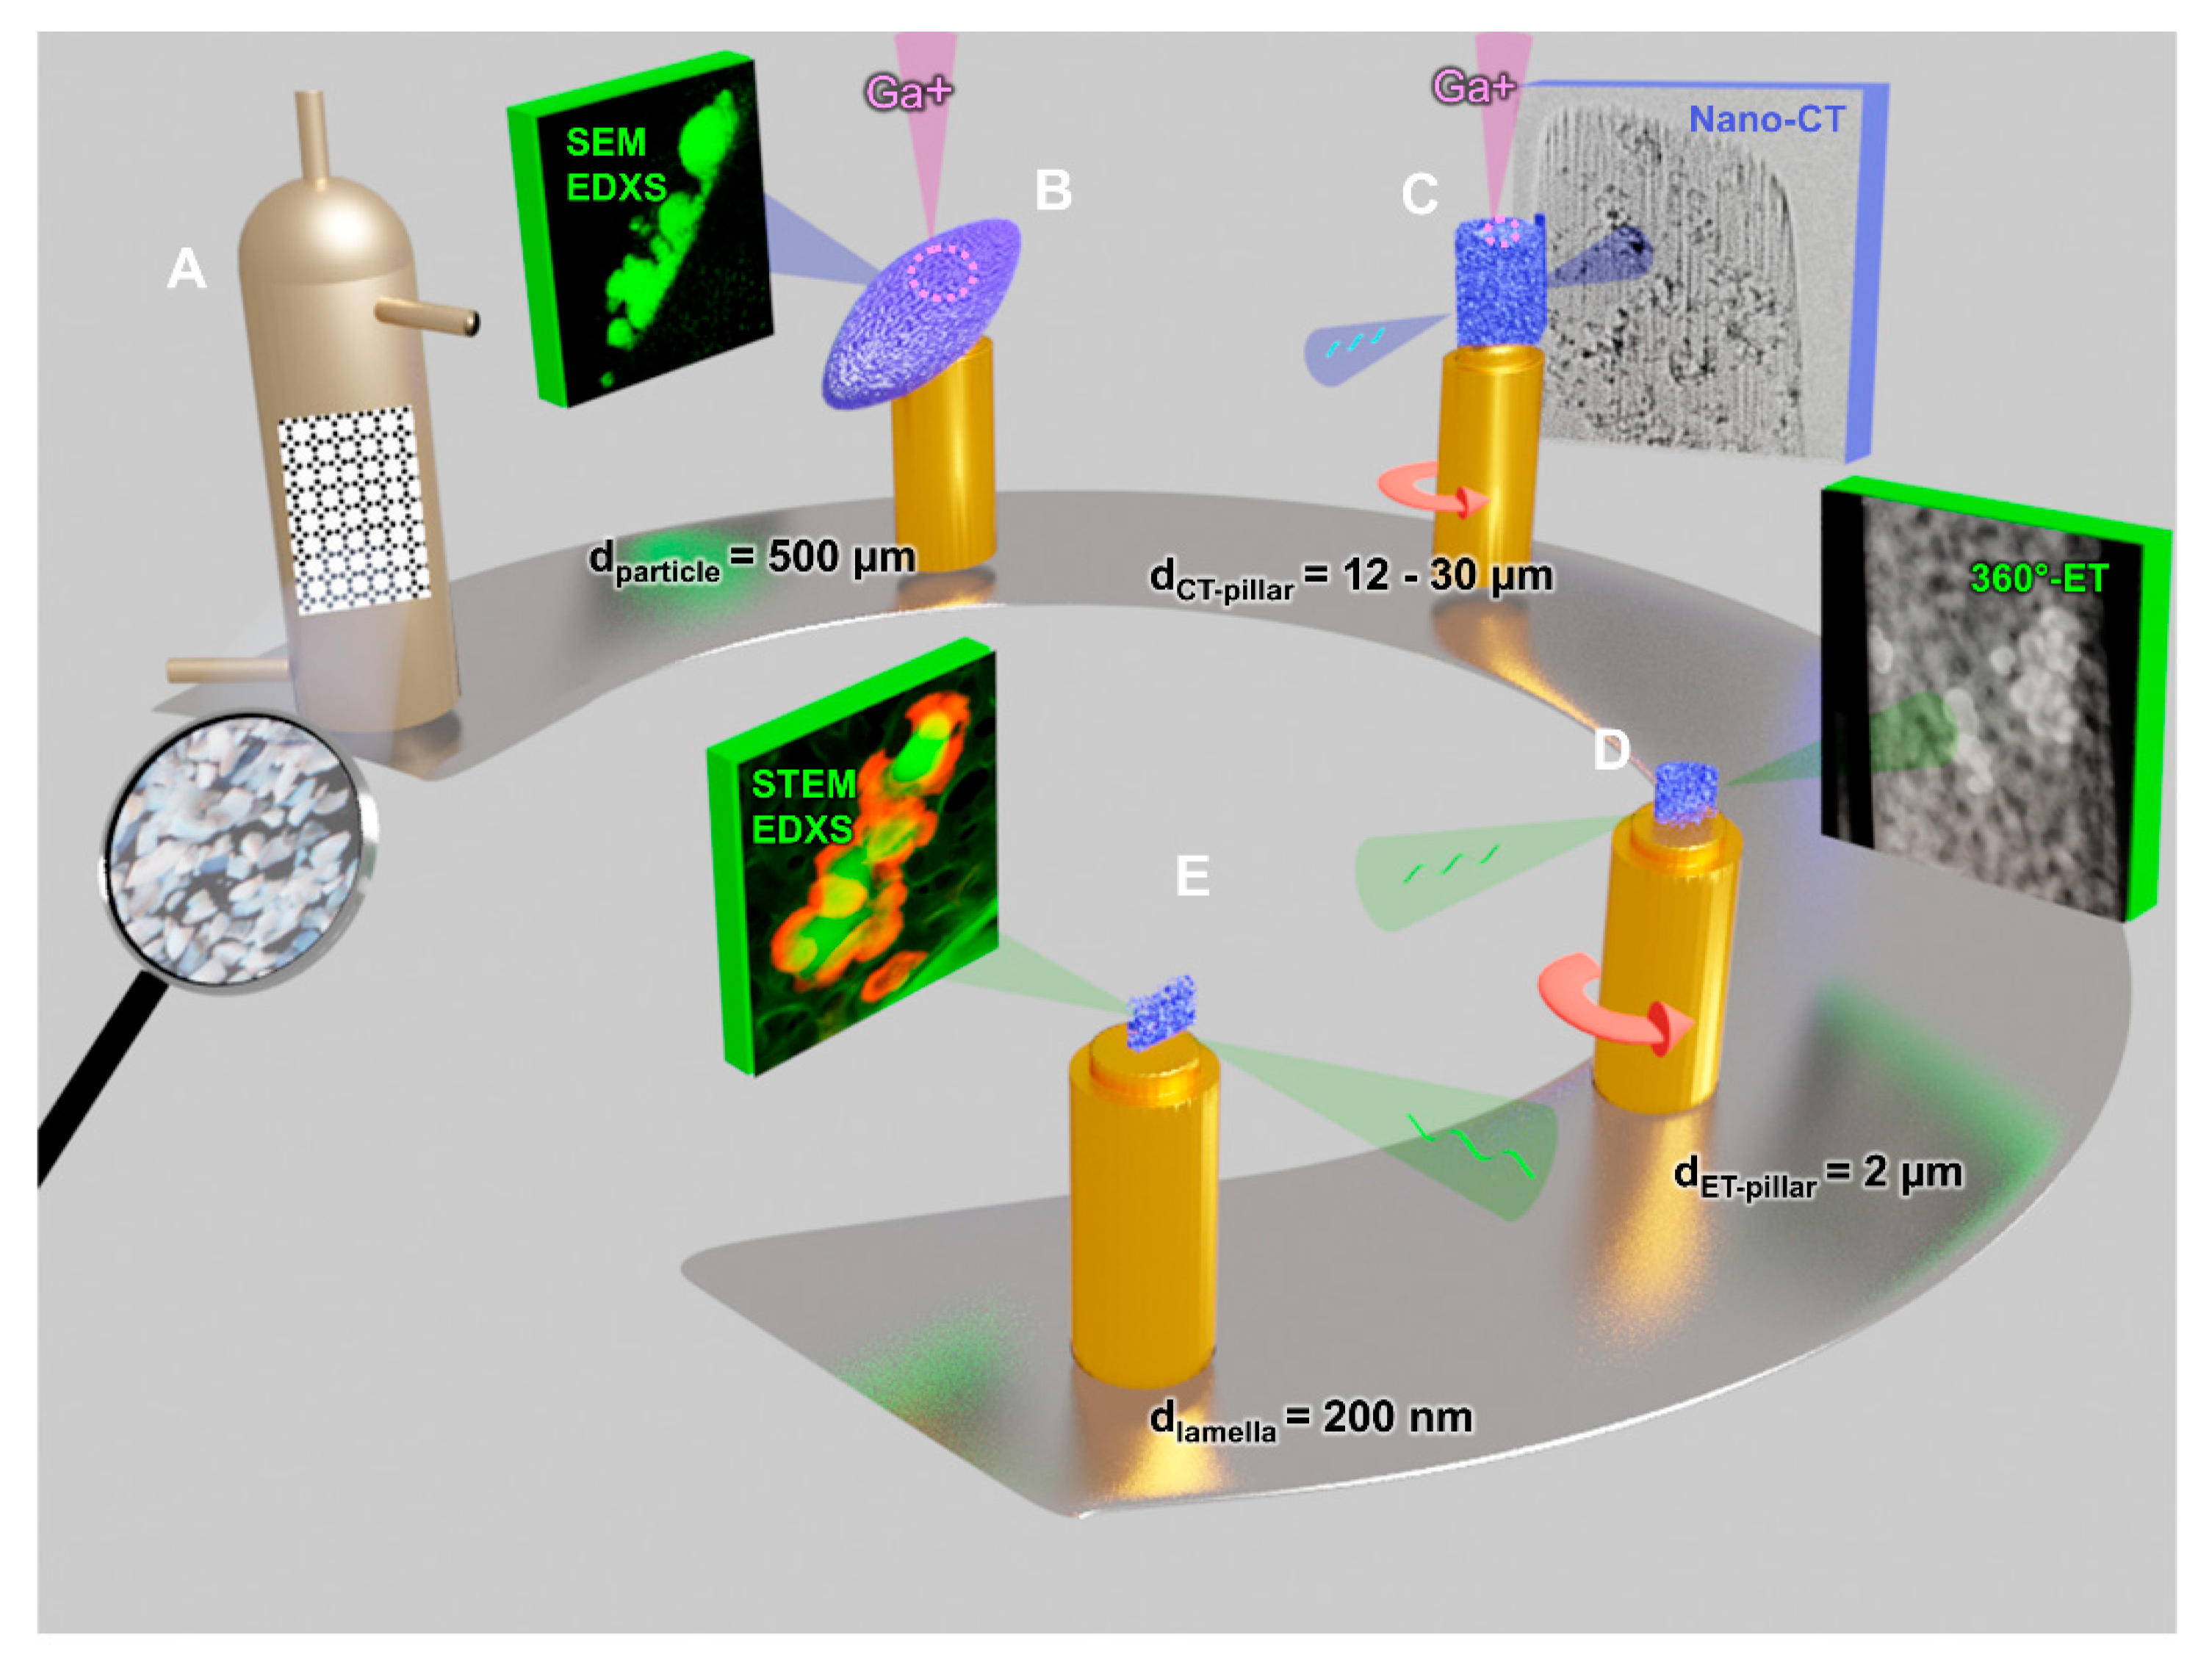
16]. In this study, we present a comprehensive and in-depth structural and analytical characterization of a Ga-Pd SCALMS system in the as-prepared state. Thus, the sample system was not yet exposed to the conditions in the catalytic reactor. We developed a correlative workflow by combining lab nano-CT, 360°-ET, transmission electron microscopy (TEM) and energy-dispersive X-ray spectroscopy (EDXS) tailored to characterize the complex and scale-bridging structure of novel SCALMS systems (Figure 1). This comprehensive material’s characterization helps to further unravel and understand the underlying mechanisms and structural peculiarities leading to the reported superior catalytic performance.

2. Results

We investigated a novel, exemplary SCALMS system as developed by Taccardi et al. [9] which exhibits an outstanding coke resistance during several chemical processes such as alkane dehydrogenation. Commercially available TRISOPOR® silicon oxide glass with its macroporous interconnected pore system and with a mean pore size in the range of 150 nm (Figure 6C,D) is utilized as catalyst support. The SCALMS system of this study is obtained by intruding Ga and subsequently Pd into the porous glass support (refer to Section 4 for more details). The combination of 360°-ET and nano-CT provides a unique opportunity to explore the complex 3D structure of SCALMS in detail, whilst exploiting the limits of both techniques. The sample size for ET experiments is typically limited to a few hundred nanometers due to strong electron–matter interactions, such as inelastic scattering [44]. However, in the present case, the sample size can be extended to 2–3 µm due to the high porosity and rather low density of the glass support, while still preserving a high spatial resolution of <10 nm. Hence, we have access to detailed information about the pore system (Figure 6B) and the structure of single Ga-Pd droplets (Figure 3F). Nano-CT, on the other hand, offers the opportunity to investigate sample volumes with diameters up to around 60 µm at a spatial resolution of about 50 nm, allowing one to study thousands of Ga-Pd droplets in the macroporous glass network while still resolving the pore structure (Figure 3E).

2.1. Correlative Nano-CT and 360°-ET Workflow

Figure 1 shows a schematic representation of the correlative workflow for the SCALMS system. We start with a powder of primary particles of sizes around 150–500 µm (Figure 1A and Figure 2A). After dispersion onto a suitable substrate (e.g., standard aluminum FIB stub), the particles can be directly inserted into the scanning electron microscope (SEM), enabling an analysis of the particle surface (Figure 1B and Figure 2B). Subsequently, single primary particles are transferred onto a tomography tip (Figure 1B and Figure 2C) and processed into suitable dimensions for nano-CT investigation using FIB milling (Figure 1C and Figure 2D). For correlative ET and STEM-EDXS experiments at higher spatial resolution, a smaller pillar (diameter ≈ 2–3 µm; Figure 1D and Figure 2E) and, optionally, a thin lamella (thickness ~450 nm; Figure 1E and Figure 2F) are site-specifically prepared via FIB milling.

2.2. Application of Correlative Workflow to SCALMS Samples

Figure 2 shows the realization of the correlative workflow for a SCALMS sample. Firstly, we used SEM imaging and SEM-EDXS to obtain information about the surface structure and composition of the primary particles (Figure 2A,B). In a next step, we transferred two representative primary particles onto a suitable tomography tip (Figure 2C) and used FIB milling to prepare a pillar with a diameter of about 28 µm suited for LFOV-PC and HRES-PC nano-CT investigation (Figure 2D and Figure 3A,B). To enhance the standard field of view (FOV) of 16 µm × 16 µm of a single HRES-PC nano-CT tilt series, we stitched several HRES tilt series of adjacent sample regions before reconstruction (Figure 3B and Video; see Section 4 for more details) [45]. This stitched-HRES-PC nano-CT approach extends the accessible FOV to about (31 µm)², while preserving a high spatial resolution of 46.66/37.01 nm calculated by Fourier shell correlation (FSC) using the one-bit/half-bit criterion (Table 1) [46]. In the next step, we applied 360°-ET and STEM-EDXS to a smaller pillar with a 3 µm diameter (Figure 2E), which was site-specifically prepared out of the larger pillar via FIB milling (sample routine 1, Table 1). For further in-depth analytical (S)TEM analysis, a 450 nm thin FIB lamella was prepared and investigated as shown in Figure 2F and Figure 7D (sample routine 3, Table 1). We repeated the 360°-ET and HRES-PC nano-CT experiments for a second FIB-milled pillar (sample routine 2, Table 1), where we performed identical location correlative microscopy to improve the overall 3D segmentation and interpretation quality (Figure 4).

2.3. 3D Analysis of Correlative Tomography Data

The acquired datasets from the correlative workflow allow for a qualitative and quantitative analysis of the pore space and the embedded Ga-Pd droplets and for a simultaneous direct comparison of the 3D structure and the reconstruction quality of the LFOV-PC, stitched-HRES-PC and 360°-ET reconstructions.

2.3.1. Comparison of LFOV Nano-CT, Stitched-HRES Nano-CT and 360°-ET

Firstly, we compare the LFOV-PC nano-CT, stitched-HRES-PC nano-CT and 360°-ET reconstructions regarding their capability to resolve Ga-Pd droplets in the porous glass network. The FIB-prepared SCALMS pillars of different size and diameter (Table 1) were reconstructed from LFOV nano-CT (Figure 3A), HRES nano-CT (Figure 3B after the stitching process) and 360°-ET (Figure 3C) tilt series. Corresponding virtual slices of the volume renderings are depicted in Figure 3D–F. The complete tilt series, animated slicings through the reconstructed volumes and volume renderings (maximum intensity rendering) of sample routines 1 and 2 are provided as Videos S1–S12.
As demonstrated in Figure 3D, the LFOV nano-CT mode can clearly reveal the location and nonspherical morphology of most Ga-Pd droplets inside the 3D volume but is limited in terms of its optical resolution to resolve the finer macroporous support network. The resolution of the LFOV reconstruction is calculated to be 134.17/102.22 nm applying the one-bit/half-bit criterion of the FSC. For a more detailed 3D reconstruction of the droplet morphology and the porous glass network, the HRES mode of the ZEISS Xradia 810 Ultra is applied (Figure 3E). The FSC resolution is determined to 53.10 nm/46.66 nm using the one-bit/half-bit criterion (sample routine 2, Table 1). Since the FOV of a single HRES tilt series is restricted to 16 µm × 16 µm, we lose the possibility of imaging the complete SCALMS pillar with a diameter of 28 µm. To enlarge the FOV while keeping a high spatial resolution, we applied the stitched-HRES method, as introduced in Section 2.2 and explained in more detail in Section 4. After the reconstruction of the stitched-HRES tilt series, the macroporous support system and the embedded Ga-Pd droplets are resolved throughout the complete pillar volume (Figure 3E). A closer comparison of matching regions (indicated by colored arrows in Figure 3D,E) shows that the stitched-HRES dataset exhibits more detailed spatial information compared to the LFOV. Not only is the macroporous glass network clearly visible, but, most importantly, the size and morphology of individual Ga-Pd droplets are revealed with higher precision. Both methods enable the analysis of 3D features with dimensions larger than about 150 nm, including defects in the porous support structure such as voids or cracks (yellow arrows in Figure 3D,E). However, more detailed information can be exclusively assessed using the HRES mode: for instance, how the Ga-Pd droplets are embedded in the porous support network (red and blue arrows in Figure 3D,E). These qualitative differences concerning the resolving power of both imaging modes are supported by the quantitative FSC resolutions calculated for the corresponding 3D reconstructions (Table 1).
The FSC of the stitched-HRES nano-CT dataset determines a resolution of 46.66 nm/37.01 nm at the half-bit/one-bit criterion, which is almost better by a factor of three than the resolution of the LFOV nano-CT dataset determined to 134.17 nm/102.22 nm (Table 1). Both datasets are acquired in Zernike PC mode. As described earlier, we address the halo-like phase contrast variations by utilizing high-resolution 360°-ET reconstructions without PC artifacts (Figure 3F) to inform and enhance the interpretation and segmentation quality of the PC nano-CT datasets (Figure 5 and Figure 6). We applied 360°-ET to a smaller pillar with ~3 µm diameter (Figure 2E and Figure 3C). The FSC of the 360°-ET dataset results in a resolution of 5.44/3.18 nm at the half-bit/one-bit criterion, which is almost one order of magnitude better compared to stitched-HRES nano-CT. With its HAADF STEM mass-thickness contrast and higher resolution, the 360°-ET reconstruction reveals yet hidden information. The Ga-Pd droplets completely fill the channels of the porous glass network at certain locations. The droplets even extend into several pore channels featuring a branch-like structure (Figure 3F, Figure 4B,C). Furthermore, the interior of the droplets exhibits a lower reconstructed intensity than their surface regions, indicating a Ga-rich phase in the interior and a Pd-rich phase on their surface (Figure 3C,F). In addition to 360°-ET, we performed complementary STEM-EDXS analyses to reveal the chemical composition of individual Ga-Pd droplets (Figure 7B), which will be discussed in further detail in Section 2.3.5. The FSC resolution cannot meaningfully be calculated for a single 2D HAADF STEM image. Hence, no resolution is provided for sample routine 3. All calculated FSC plots are presented in Figure S6.

2.3.2. Direct Correlation of HRES-PC Nano-CT and 360°-ET

Since the reconstructed volume of the 360°-ET pillar of the first sample (sample routine 1) in Figure 3C was included in the LFOV nano-CT reconstruction (Figure 3A), but not in the stitched-HRES volume (Figure 3B), we investigated a second sample (sample routine 2) of the same SCALMS system for a direct correlation of HRES-PC nano-CT and 360°-ET. Whereas for the first sample, we compared LFOV and stitched-HRES nano-CT of the same sample volume (pillar with 28 µm diameter), we were now able to directly correlate data from a specific site in a larger volume with data from that same location included in a significantly smaller volume reconstructed from both HRES nano-CT and 360°-ET datasets. Figure 4A shows a slice through the HRES-PC nano-CT reconstruction of this second larger pillar (d = 12 µm) resolving the Ga-Pd droplets in the porous support network.
Similar to the first sample, we prepared a smaller pillar with a diameter of ~2 µm by FIB milling from the larger pillar, as indicated by a red rectangle in Figure 4A. Figure 4B,C show slices through the HRES-PC nano-CT and 360°-ET reconstructions of the smaller pillar, respectively. The morphology of the porous network and the Ga-Pd droplets are clearly visible in both reconstructed volumes. The FSC analysis determines a resolution at a half-bit/one-bit criterion of 11.88 nm/8.10 nm for the 360°-ET dataset and 53.09 nm/48.27 nm for the HRES nano-CT dataset (Table 1). As for the first sample in Figure 3C,F, the 360°-ET volume exhibits a significantly higher resolution, less artifacts and a higher fidelity of the local reconstructed density due to the pronounced mass-thickness contrast of HAADF STEM imaging. On the contrary, the nano-CT dataset shows a much smaller contrast difference between droplets and the glass network and furthermore exhibits Zernike PC artifacts (see red arrow in Figure 4B,C and Figure S3). We address these PC artifacts in the HRES nano-CT reconstructions (Figure 4A,C) by comparing corresponding slices through the 360°-ET (Figure 4C) and HRES-PC nano-CT (Figure 4B) volumes and directly utilize the higher reconstruction fidelity of 360°-ET to inform the segmentation of the pore space and the Ga-Pd droplets in the nano-CT volumes (Figure S3).

2.3.3. Comparison of Particle Size and Distribution Calculated from LFOV and Stitched-HRES Nano-CT

In a next step, we used the segmented nano-CT datasets of sample routine 1 in Figure 3 to perform a comprehensive 3D analysis of the particle size and distribution (Figure 5B), since the catalytic activity is highly dependent on these measures [47]. Figure 5C shows the particle size distributions of the LFOV (green) and stitched-HRES nano-CT (red) reconstructions determined by voxel segmentation in Arivis Vision4D. Overall, the stitched-HRES and LFOV data are in good agreement for particle diameters of 250–750 nm. Since the LFOV reconstruction exhibits a lower resolution, the machine-learning segmentation algorithm partly falsely detects larger interconnected regions, which are clearly separated in reality, as revealed by HRES nano-CT (Figure S5). This leads to a general overestimation of the particle size using the LFOV mode and cannot be completely avoided even by utilizing the higher-resolution informed segmentation routine.
Due to the higher spatial resolution of the stitched-HRES nano-CT dataset, the segmentation of individual droplets is more precise. As result, the mean particle size is lower since more individual droplets are now detected as separated. The particle size distribution of the stitched-HRES dataset features a sharper peak indicating a more uniform size distribution. This is also expected since the macroporous glass support is very homogeneous (Figure 6), which enables uniform material transport of Ga and Pd throughout the pore space during the synthesis routine. Taking a closer look at Figure 5A, in which cuts through segmented Ga-Pd droplets (yellow areas) within the reconstructed slices are highlighted, dark areas around the droplets become evident, as indicated by the green arrow. These dark halos are artifacts of Zernike PC which result in an erroneously detected bigger pore volume around the droplets, leading to an overestimation of the pore size (Figure 6C). Another PC-related issue which affects the segmentation is contrast fluctuations in the porous glass network. In some cases, the segmentation algorithm erroneously assigns such fluctuations to Ga-Pd droplets, since the grey values and morphology are similar to the trained model (see blue and red arrows in Figure 5A). Altogether, this type of error is quite rare, since the average size of the droplets is about five times larger than the average pore diameter. An additional manual inspection and correction of the segmentation using higher-resolution information of the 360°-ET reconstruction further reduces these errors (see Section 4).
An analysis of the nearest neighbor distance of all segmented droplets of the stitched-HRES nano-CT dataset (Figure 5D) shows a homogenous statistical distribution, which fits to a Poisson distribution (red curve in Figure 5D).

2.3.4. Quantitative 3D Analysis of the Glass Network Using Stitched-HRES Nano-CT and 360°-ET

The quantitative analysis of the pore structure in the segmented tomography datasets using the maximum sphere inscription (MSI) technique is illustrated in Figure 6 (for a full illustration of the virtual slices through the MSI volumes see Videos S13 and S14). In this segmentation routine, a binary dataset is created with one data group being the pore volume and the other group being formed by the glass and Ga-Pd droplet volume. To have an independent reference measurement of the pore size distribution (PSD), mercury intrusion porosimetry has been applied to the unloaded glass support (Figure 6D). Using the MSI method, median pore diameters of 189 nm and 164 nm are determined from the stitched-HRES nano-CT data set and the 360°-ET dataset, respectively, which are in quite good agreement (in particular the ET result) with the value of 156 nm obtained from porosimetry. (The MSI analyses have been restricted to sample routine 1 since sample routine 2 uses a different primary particle.) The course of the curves of the pore size distribution of the nano-CT dataset (Figure 6C) and the porosimetry measurements (Figure 6D) are especially in very good agreement, albeit with a shifted peak position. Therefore, we can assume that the selected nano-CT volume is statistically significant since the porosimetry experiments have been performed with several grams, i.e., several hundred primary particles, of the support material. The difference of the shifted peak position in the nano-CT distribution towards higher pore sizes can be explained by a general overestimation of the pore volume due to PC imaging artifacts, which create an asymmetric contrast in pore wall-pore space transition regions (Figure S3). We reduced the influence of these artifacts by introducing prior knowledge of the 360°-ET reconstructions into the segmentation routine by machine learning (cf. Section 4 for a detailed description). The peak width of the stitched-HRES nano-CT distribution is broader than for mercury intrusion towards a pore size of 200–300 nm (Figure 6C). This can be attributed to halo Zernike PC artifacts falsely detected as pore space around larger Ga-Pd droplets embedded in the porous network (larger blue areas with red center areas in Figure 6A; this effect is also emphazised in Figure S4). The curve of the 360°-ET distribution shows a broader onset for smaller meso- and macropores (~5–100 nm), but a rather abrupt drop at higher pore sizes >170 nm (Figure 6C). On the one hand, this can be explained by the higher resolution of 360°-ET (sample routine 1) compared to stitched-HRES nano-CT and mercury porosimetry, such that smaller pores of the glass network and pore cavities towards the embedded Ga-Pd droplets are additionally detected. These smaller volumes are detected together as one during segmentation in the nano-CT data due to the lower spatial resolution resulting in an elevated peak at larger pore diameters. On the other hand, the nonsymmetric shape and abrupt decrease at higher pore sizes of the 360°-ET distribution can be mainly ascribed to the limited investigated volume. The 360°-ET distribution further features peaks at larger diameters >350 nm. These can be assigned to artificial pore space connected to the external empty space around the pillar volume, which was included in the MSI analysis (blue to red regions in Figure 6B).
The findings derived from the pore size distributions confirm the segmentation quality of the 3D datasets and, more importantly, demonstrate that the stitched-HRES volume already covers a statistically relevant volume and at the same time exhibits a high spatial resolution to resolve macroporous networks. Whereas the 360°-ET reconstruction exclusively enables the analysis of smaller pores, it is limited in the reconstructable volume, so that a statistical significance is not always guaranteed and needs to be checked very carefully. All applied pore analysis techniques confirm that the glass network exhibits a homogenous and interconnected pore space with a well-defined and sharp pore size distribution.

2.3.5. Chemical Composition Analysis of Embedded and Surface Ga-Pd Droplets Using EDXS

The primary particles feature larger droplets on their surface (Figure 2B, Figure 8) and smaller droplets inside the porous glass network (Figure 3). Apart from particle size and morphology, the chemical composition of SCALMS droplets is of key importance for their catalytic activity [9]. We therefore performed EDXS analysis of both droplet types, inside the pores and on the surface of primary particles. Regarding the first type, we carried out STEM-EDXS measurements on particles inside the pillar sample of sample routine 1 and on particles in the thin TEM lamella of sample routine 3 (Table 1). The reduced thickness of about 450 nm of the TEM lamella compared to the pillar with a diameter of 3 µm is advantageous for obtaining a higher spatial resolution in HAADF STEM and STEM-EDXS measurements. As visible in the HAADF STEM images and EDXS maps in Figure 7, the embedded Ga-Pd droplets feature a core/shell-like structure with a Ga-rich phase in the center and a Pd-rich phase in the outer droplet regions towards the pore walls and the open pore space. This confirms the expected structure and elemental distribution for SCALMS systems at room temperature after synthesis [9]. Hence, a core/shell-like behavior is expected due to the subsequent introduction of Ga and Pd. The local composition varies quite heavily as depicted in Figure 7C. The Ga/Pd ratio is in the range of 0.14–1.98, and the average Ga/Pd ratio is 1.05 for six analyzed particles. This value is significantly lower compared to the overall ratio of 29.33 derived from inductively coupled plasma-atomic emission spectroscopy (ICP-AES) after synthesis (see Section 4). Although the number of analyzed particles by STEM-EDXS is limited, we can safely state that a pronounced Pd enrichment is representative for particles embedded in the porous glass network since these particles show a homogenous size and spatial distribution (see Figure 5), and random particles have been chosen for the measurements. Moreover, as the samples investigated by STEM-EDXS were prepared using a Ga+-ion FIB which is known to introduce minor amounts of Ga by ion implantation, the real Ga/Pd content of the particles might be even lower. This further contradicts the determined ratios by ICP-AES. In addition to the STEM-EDXS experiments, selected area electron diffraction (SAED) experiments (Figure S1) have been performed, allowing for the identification of whether pure metallic and/or possible intermetallic Ga-Pd phases are present in the droplets [12]. As a preliminary result, the possible occurrence of intermetallic phases in addition to the pure metal phases can be shown.
To complement the HAADF STEM and STEM-EDXS measurements of the embedded particles, we performed SEM imaging and SEM-EDXS to analyze the morphology and chemical composition of the Ga-Pd droplets on the surface of the primary particles. One exemplary SCALMS primary particle with diameter of around 400 µm was investigated without any additional FIB preparation and therefore excluding the influence of the Ga+-ion beam. The SEM images in Figure 8A,C reveal mostly spherical droplets with bright surface contrast. The spherical shape points to liquid Ga (or liquid Ga-Pd) which maintains its morphology when changing to the solid state [48], thus already indicating a high Ga content. Furthermore, the surface droplets exhibit a significant size variation with diameters typically ranging from 0.1 µm to 4 µm, but even particles with diameters of >50 µm are detected (Figure 8C,D).
SEM-EDXS reveals the chemical composition of these droplets and identifies two different classes (Figure 8B). The first and most frequent class consists of droplets with sizes between 0.1 µm and 4 µm and a Ga/Pd ratio in the range 3.0–95.8 (black data bars in Figure 8B), featuring a much higher Ga content compared to the droplets inside the glass network (Figure 7). The other droplet class is constituted by very large structures with sizes >15 µm (even structures > 50 µm are detected), as exemplarily depicted in Figure 8C, exhibiting no detectable Pd signal in the sum spectrum of the respective SEM-EDXS analysis (green data bars in Figure 8B).
The high amount of Ga in the surface droplets explains the discrepancy in chemical composition determined by ICP-AES and STEM-EDXS. The ICP-AES measurement does not allow for discriminating between smaller particles inside the pore network and large particles on the surface but rather provides an average Ga/Pd ratio for all particles with different Ga content. Since the larger surface particles constitute a higher fraction of the total Ga-Pd droplet volume than the smaller embedded particles, the Ga/Pd ratio of 29.33 derived from ICP-AES is more similar to the Ga/Pd ratio of 24.78 for the surface droplets than the ratio of 1.05 for the embedded particles. Whereas the size difference between the surface and volume droplets is not very surprising, since the support network with a pore size of about 150 nm restricts the volume of the droplets, the huge difference in Ga/Pd content was not expected and is a new finding. While it is likely that droplet size and location change under the conditions of the catalytic reaction (due to liquid metal mobility in the pore network and dissolution processes), our results show that the extraordinary catalytic properties presented by Taccardi et al. [9] could be attributed to different species of droplets. The results reported here instead suggest the need for continuative, comprehensive studies regarding the fate of the material under reaction conditions and the influence of the droplet location, size, morphology and chemical composition on the catalytic activity of SCALMS.

3. Discussion

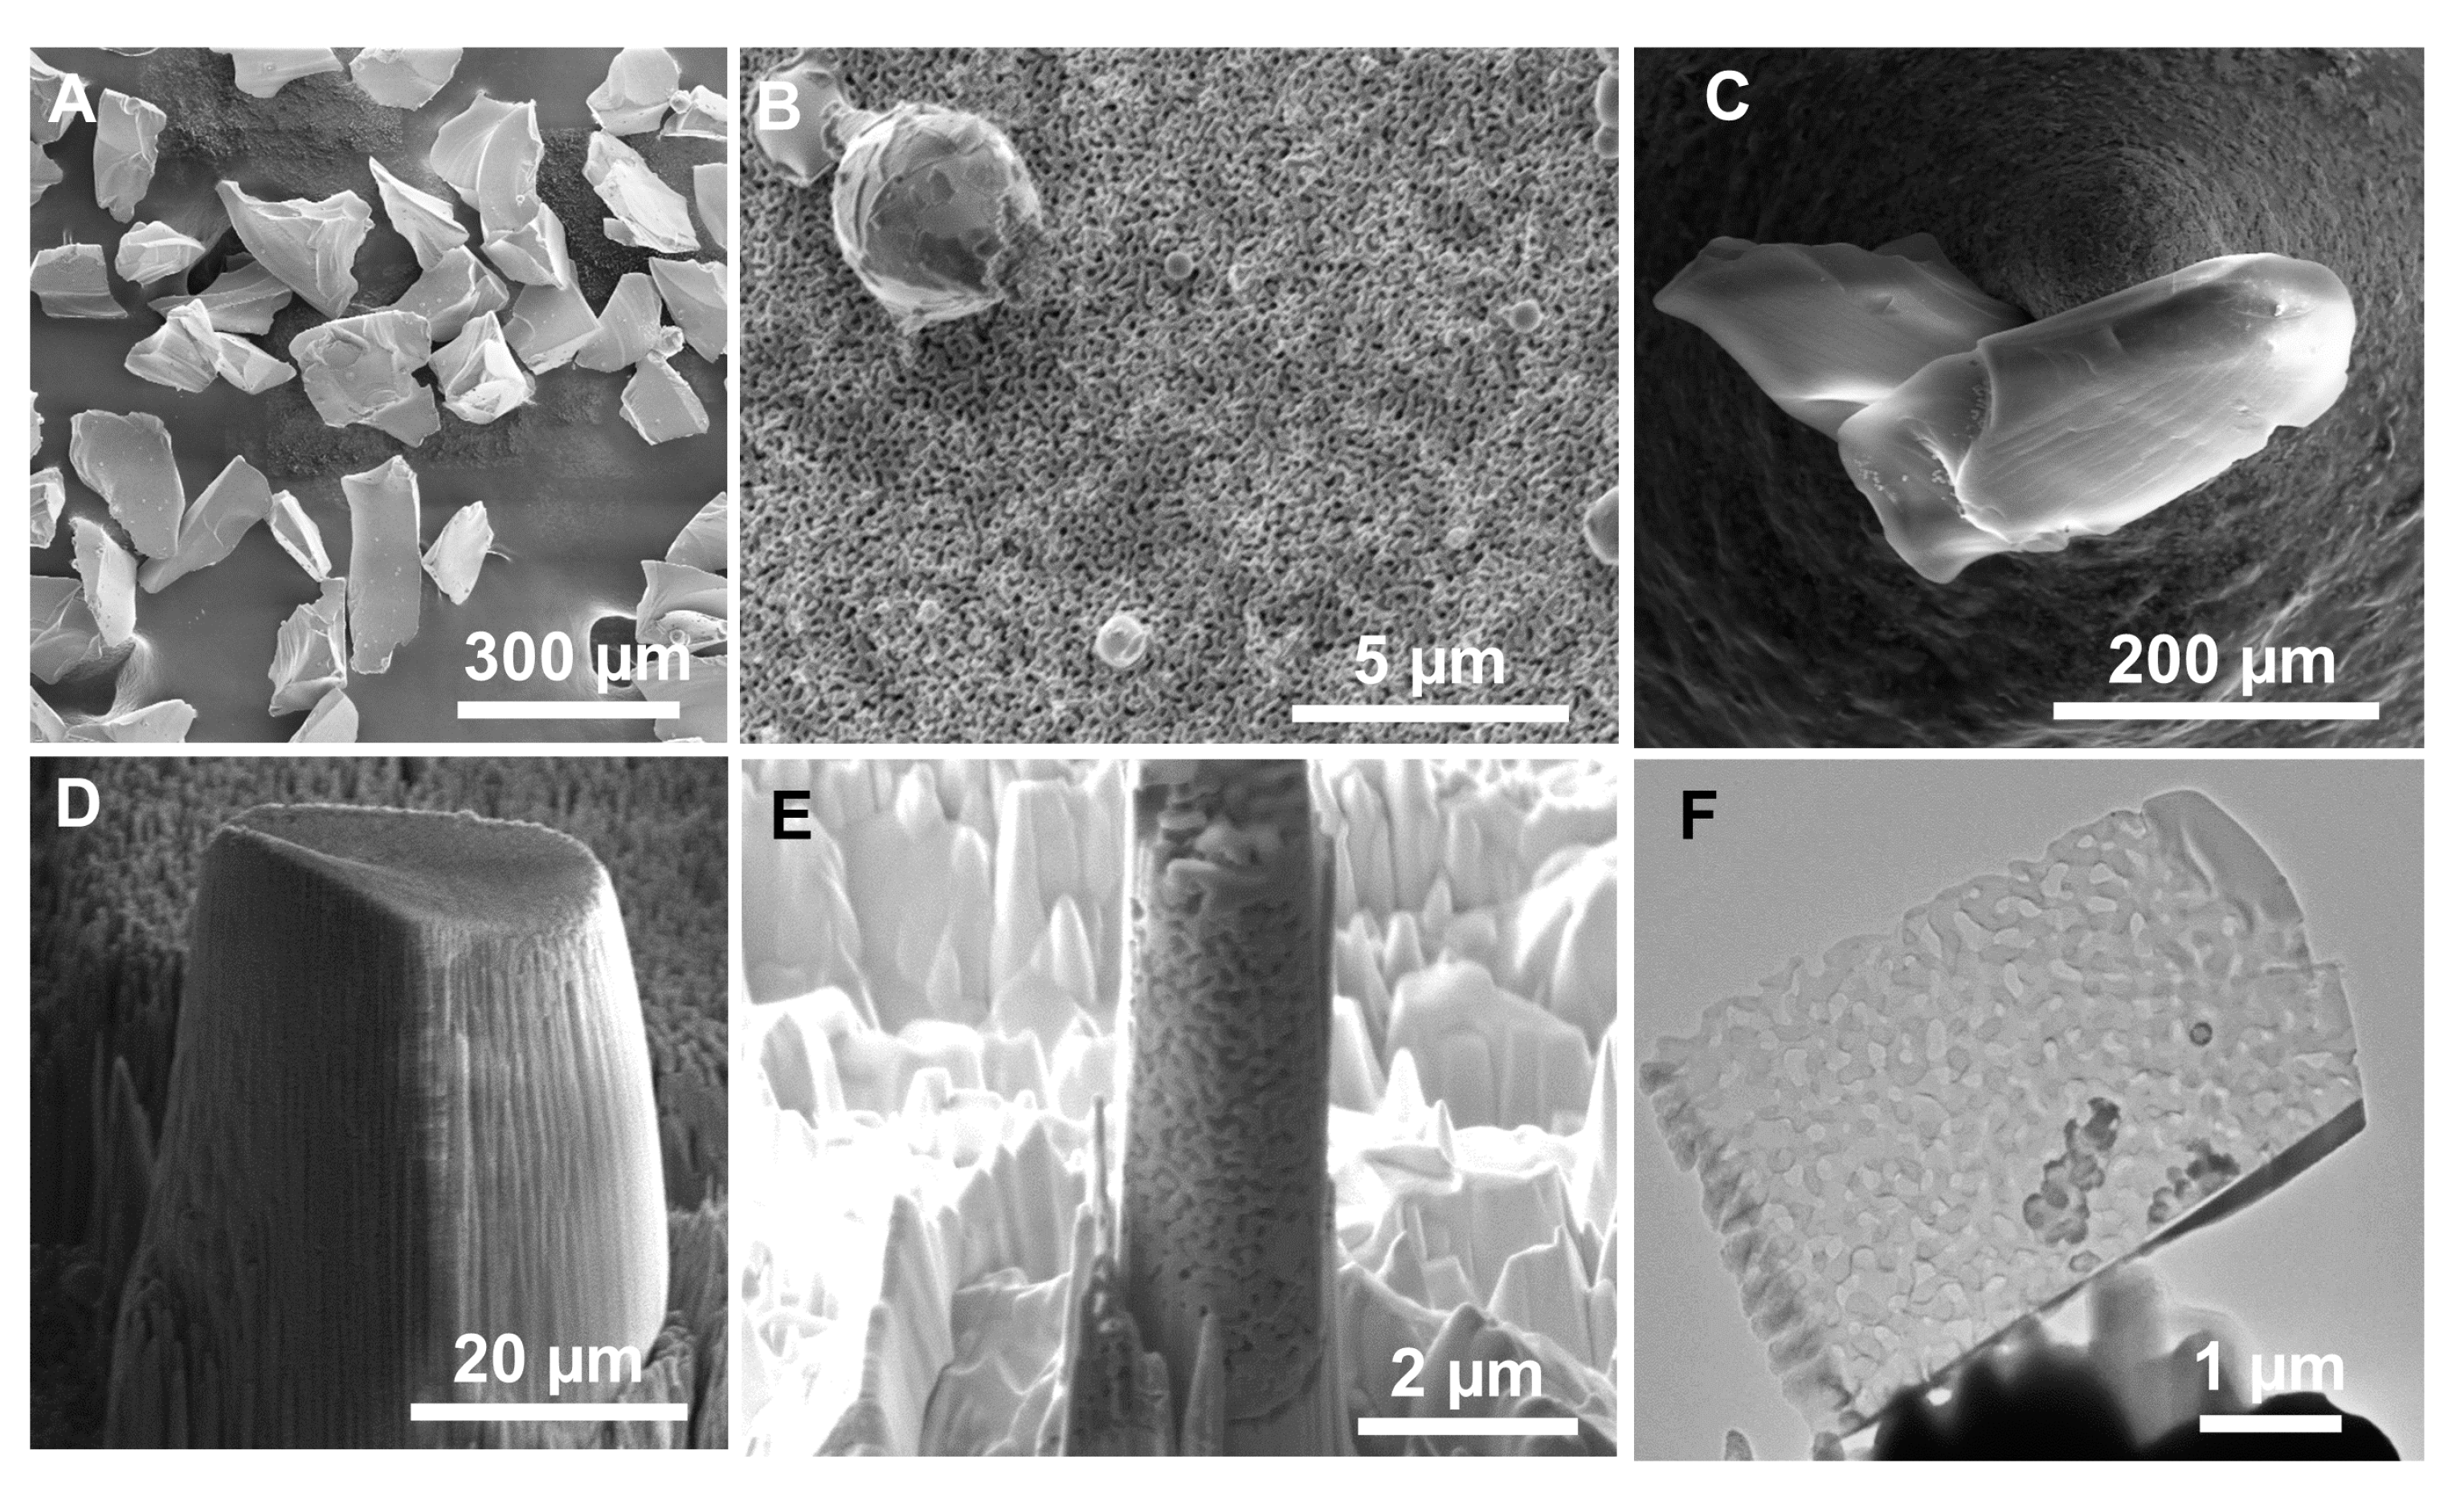
This work combined 360°-ET, HRES and LFOV nano-CT complemented by SEM/STEM imaging and EDXS to comprehensively decipher the structure, morphology and chemical composition of an exemplary SCALMS system from primary particles of several 100 µm in size down to nm-sized details. The quantitative analysis of droplet size, distribution and chemical composition inside the pore volume and on the surface of the primary particles provides an important contribution to a better understanding of how these properties may influence the catalytic performance of SCALMS systems.
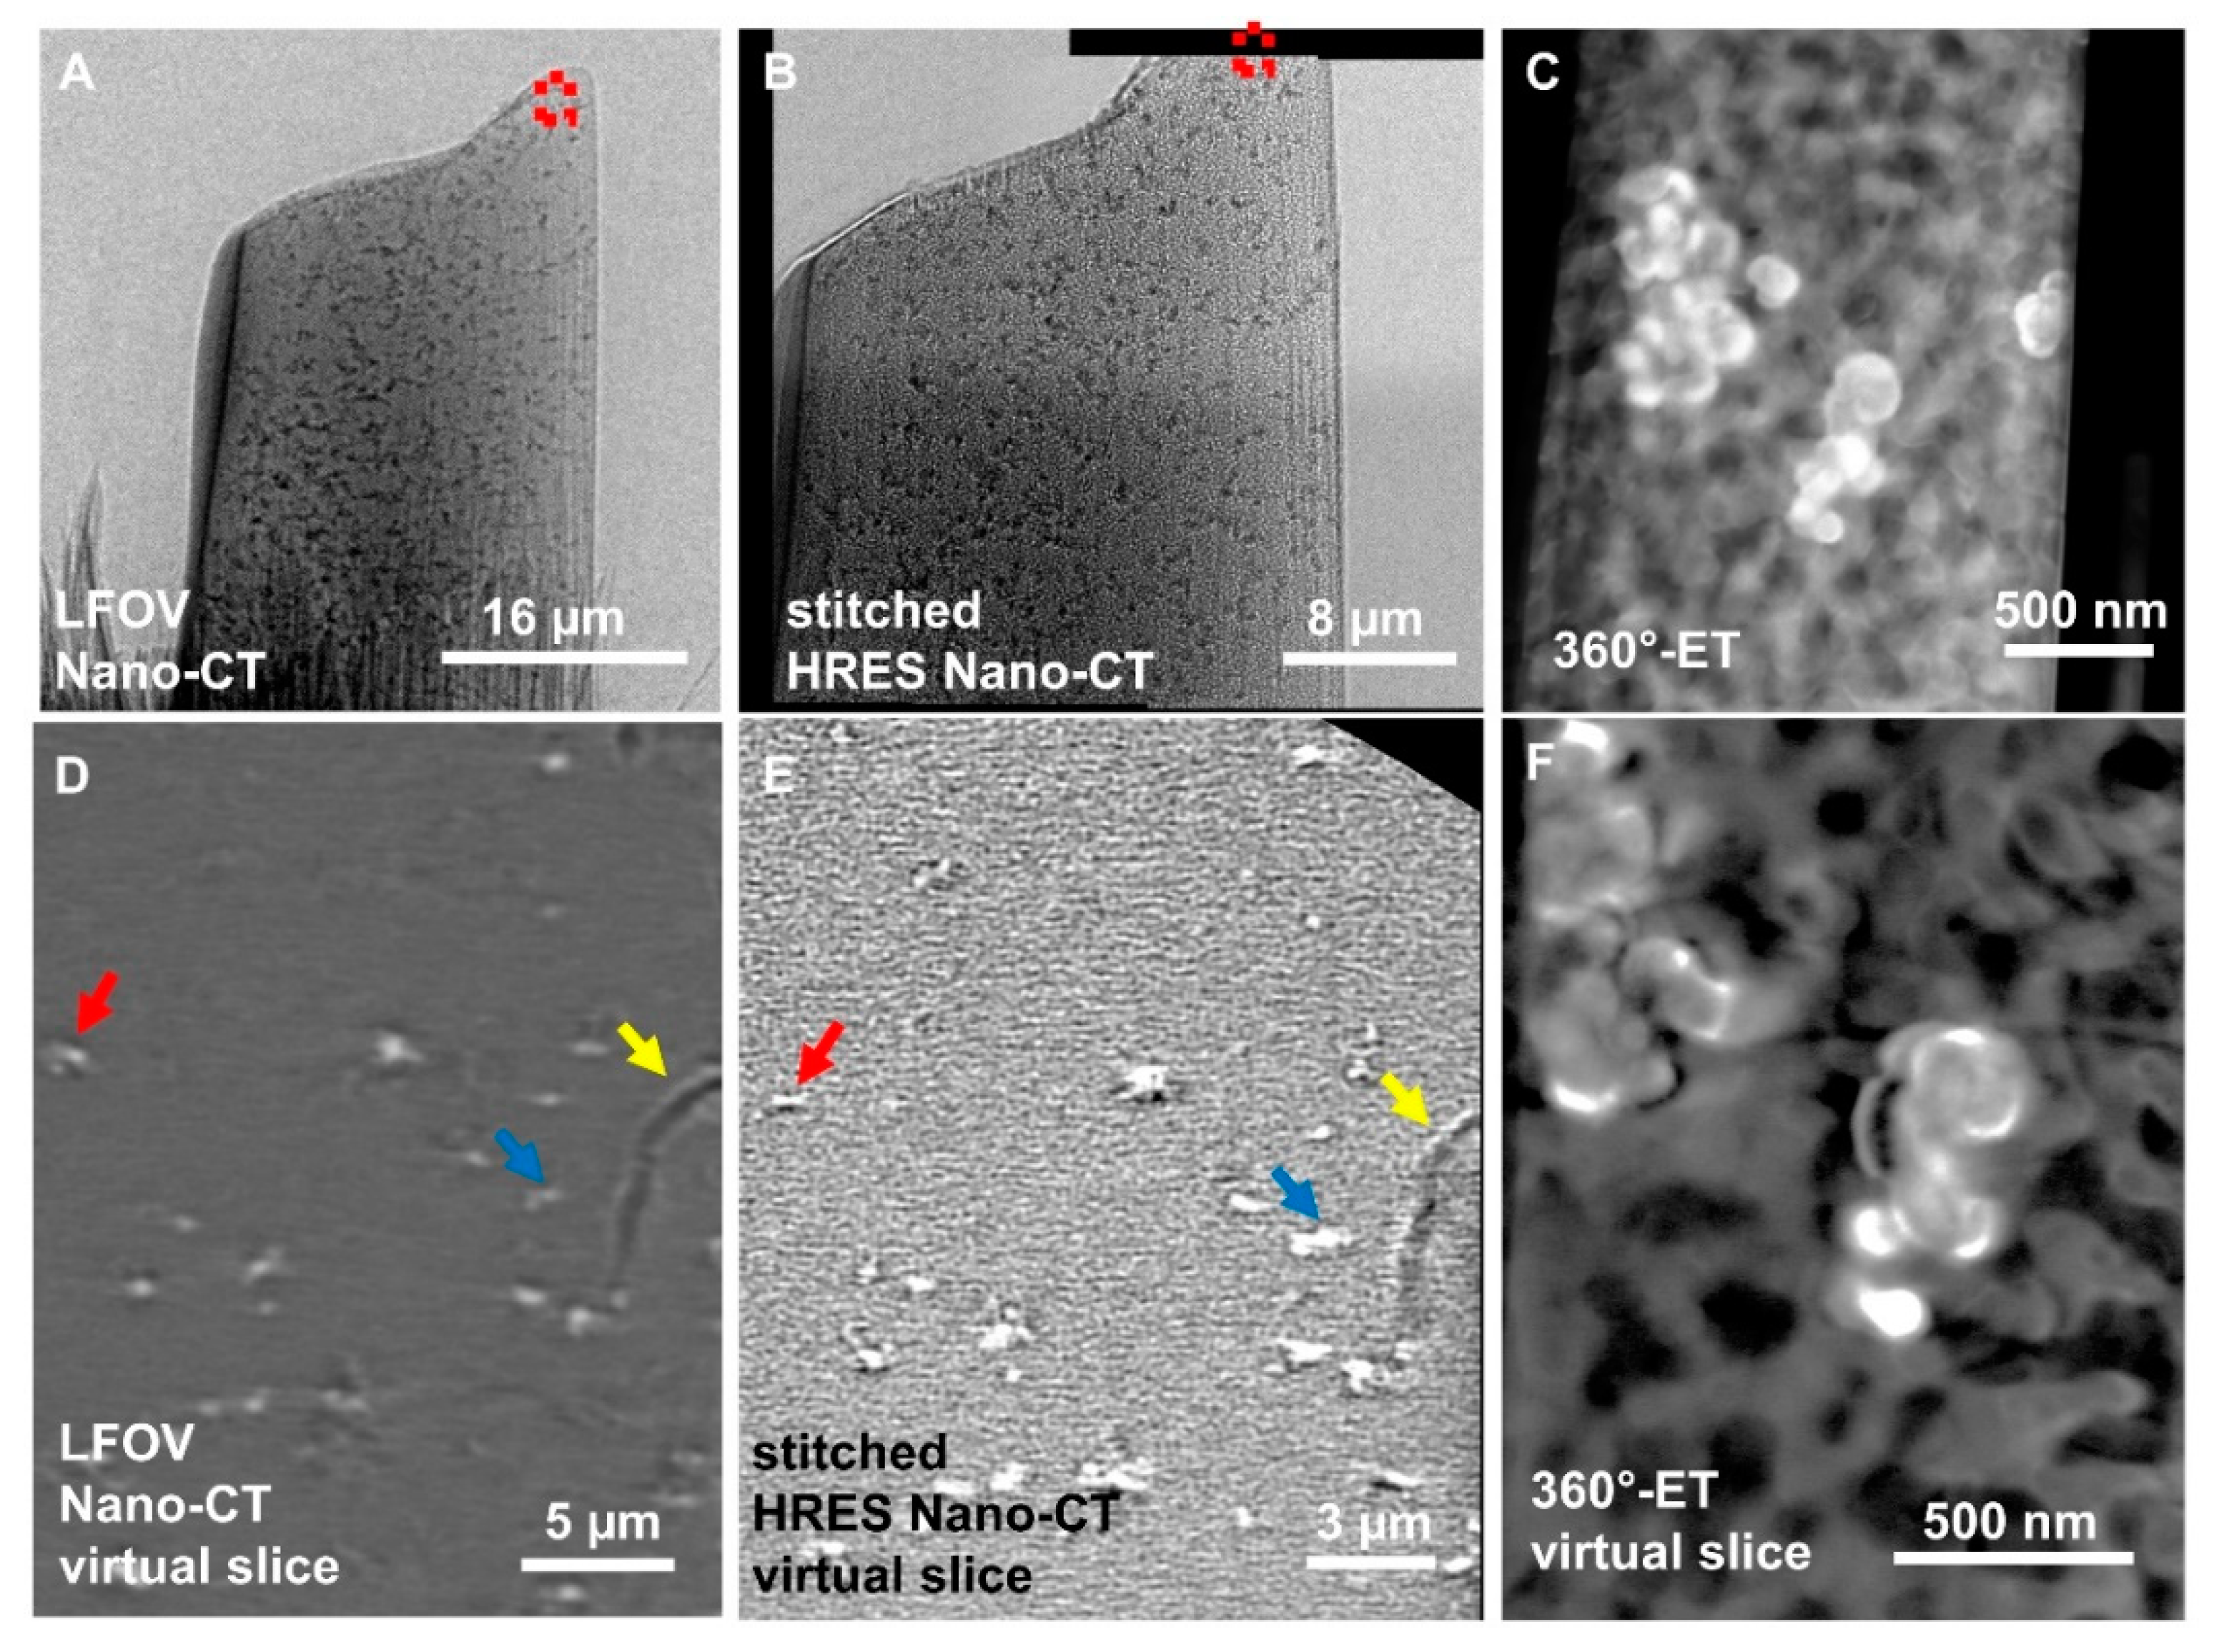
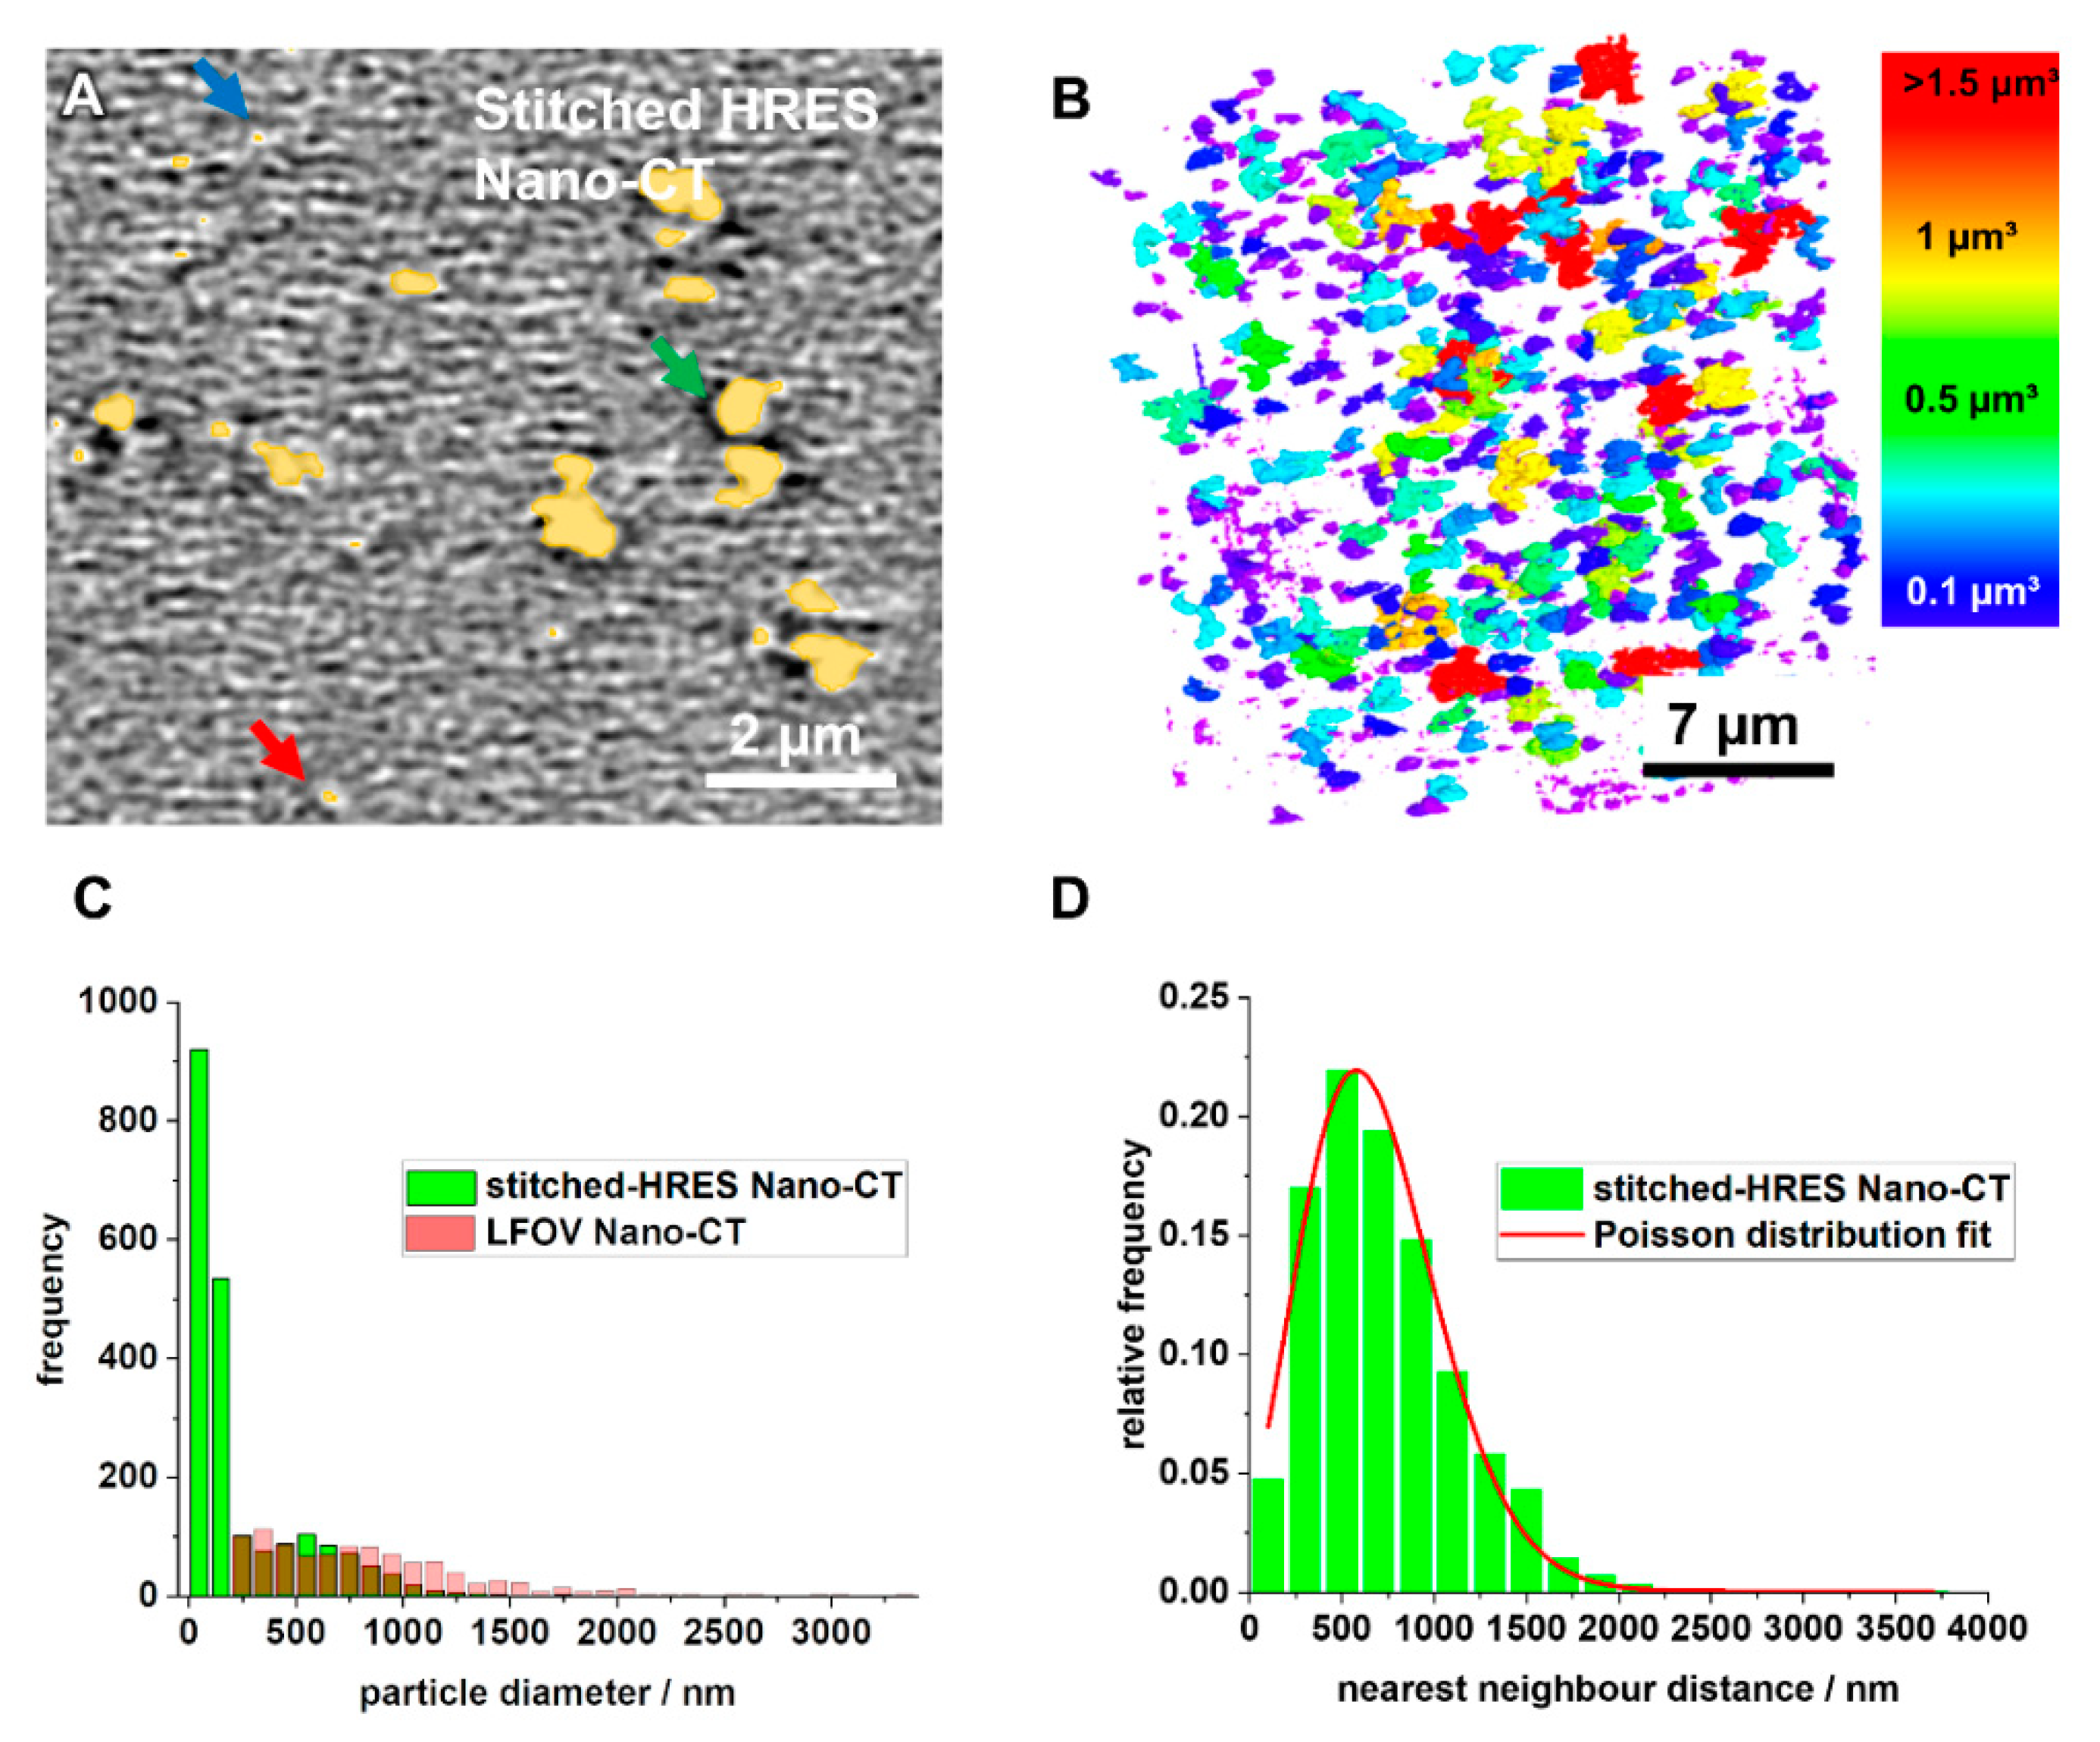
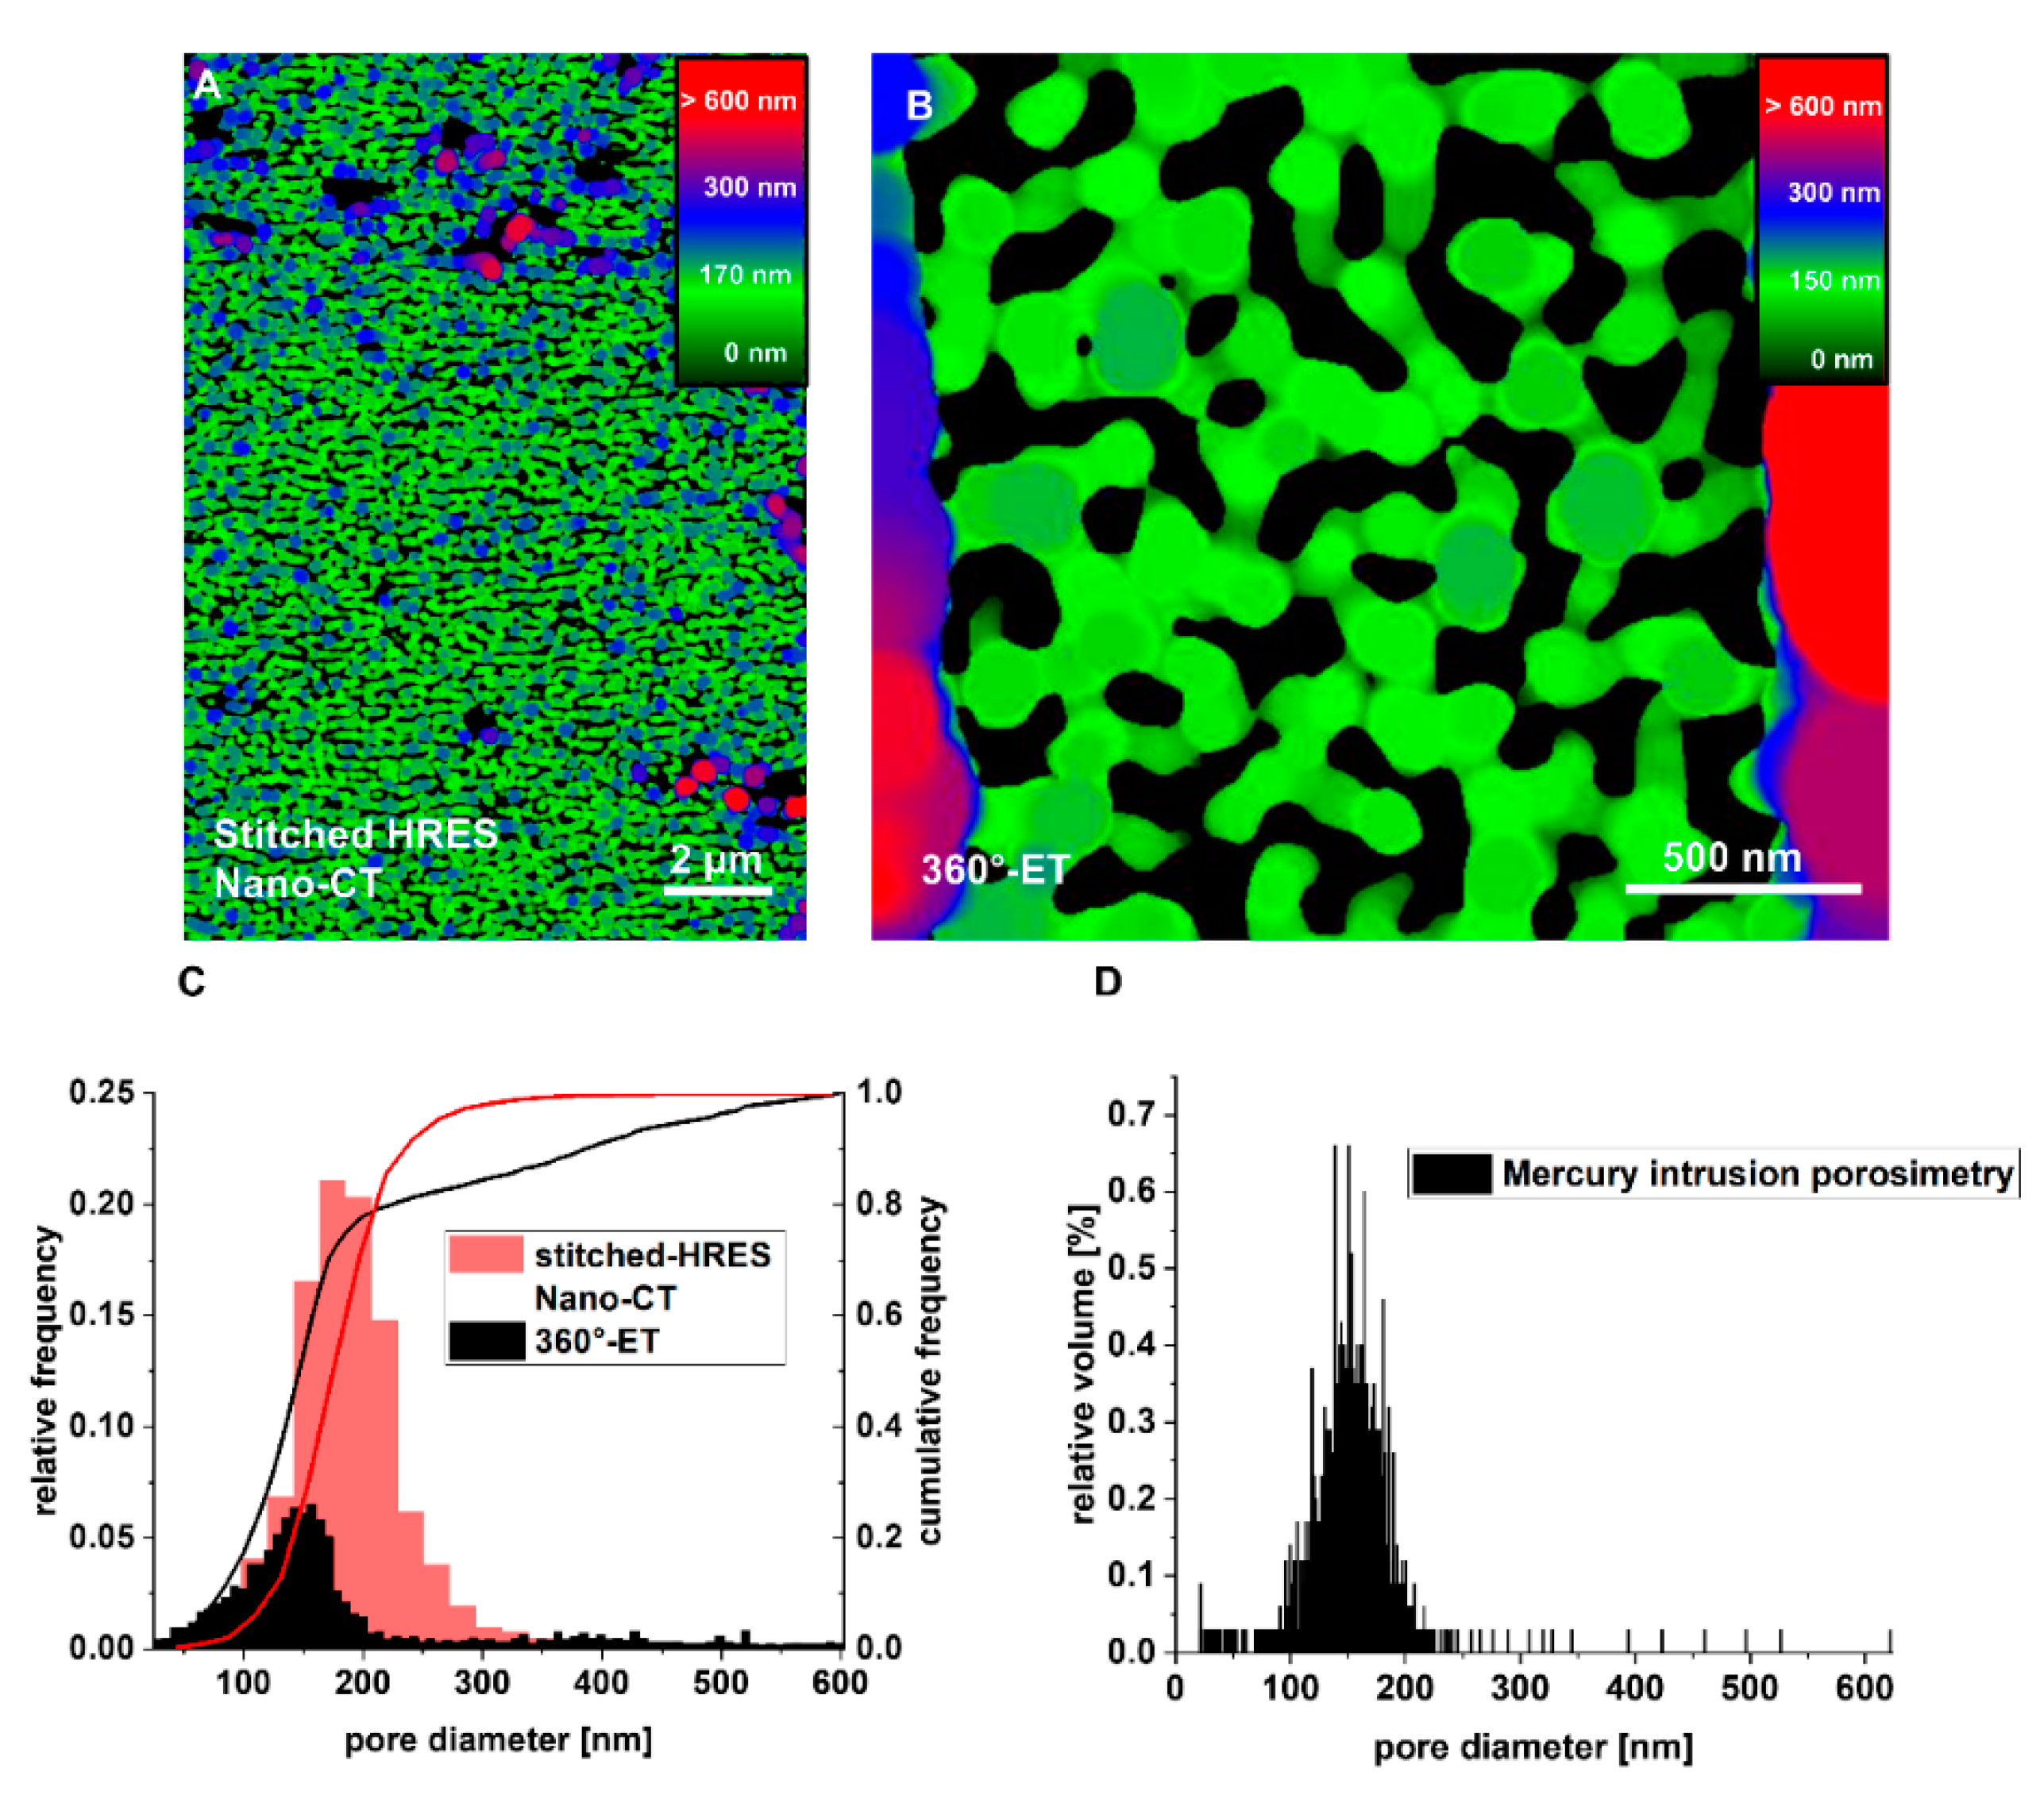
The application of the stitched-HRES nano-CT enabled the 3D analysis of comparably large volumes of several tens of microns in diameter while maintaining a high spatial resolution of about 50 nm, demonstrating its general superior performance compared to LFOV nano-CT, except for the much higher acquisition time. We minimized the influence of Zernike PC artifacts and improved the overall segmentation quality and subsequent analysis precision by using 360°-ET reconstructions of site-specifically prepared, same location samples at a higher resolution and without PC artifacts. This correlative approach enabled us to derive reliable quantitative data with statistical significance. The latter could be verified by comparing the pore size distributions derived from our 3D reconstructions to independently derived results from mercury intrusion porosimetry. The stitched-HRES nano-CT reconstructions revealed a homogenous porous glass support with a narrow pore size distribution. Moreover, the Ga-Pd droplets inside the pore network are statistically distributed in 3D and exhibit a rather uniform size distribution with around 70% of the droplets showing sizes between 0 nm and 250 nm.
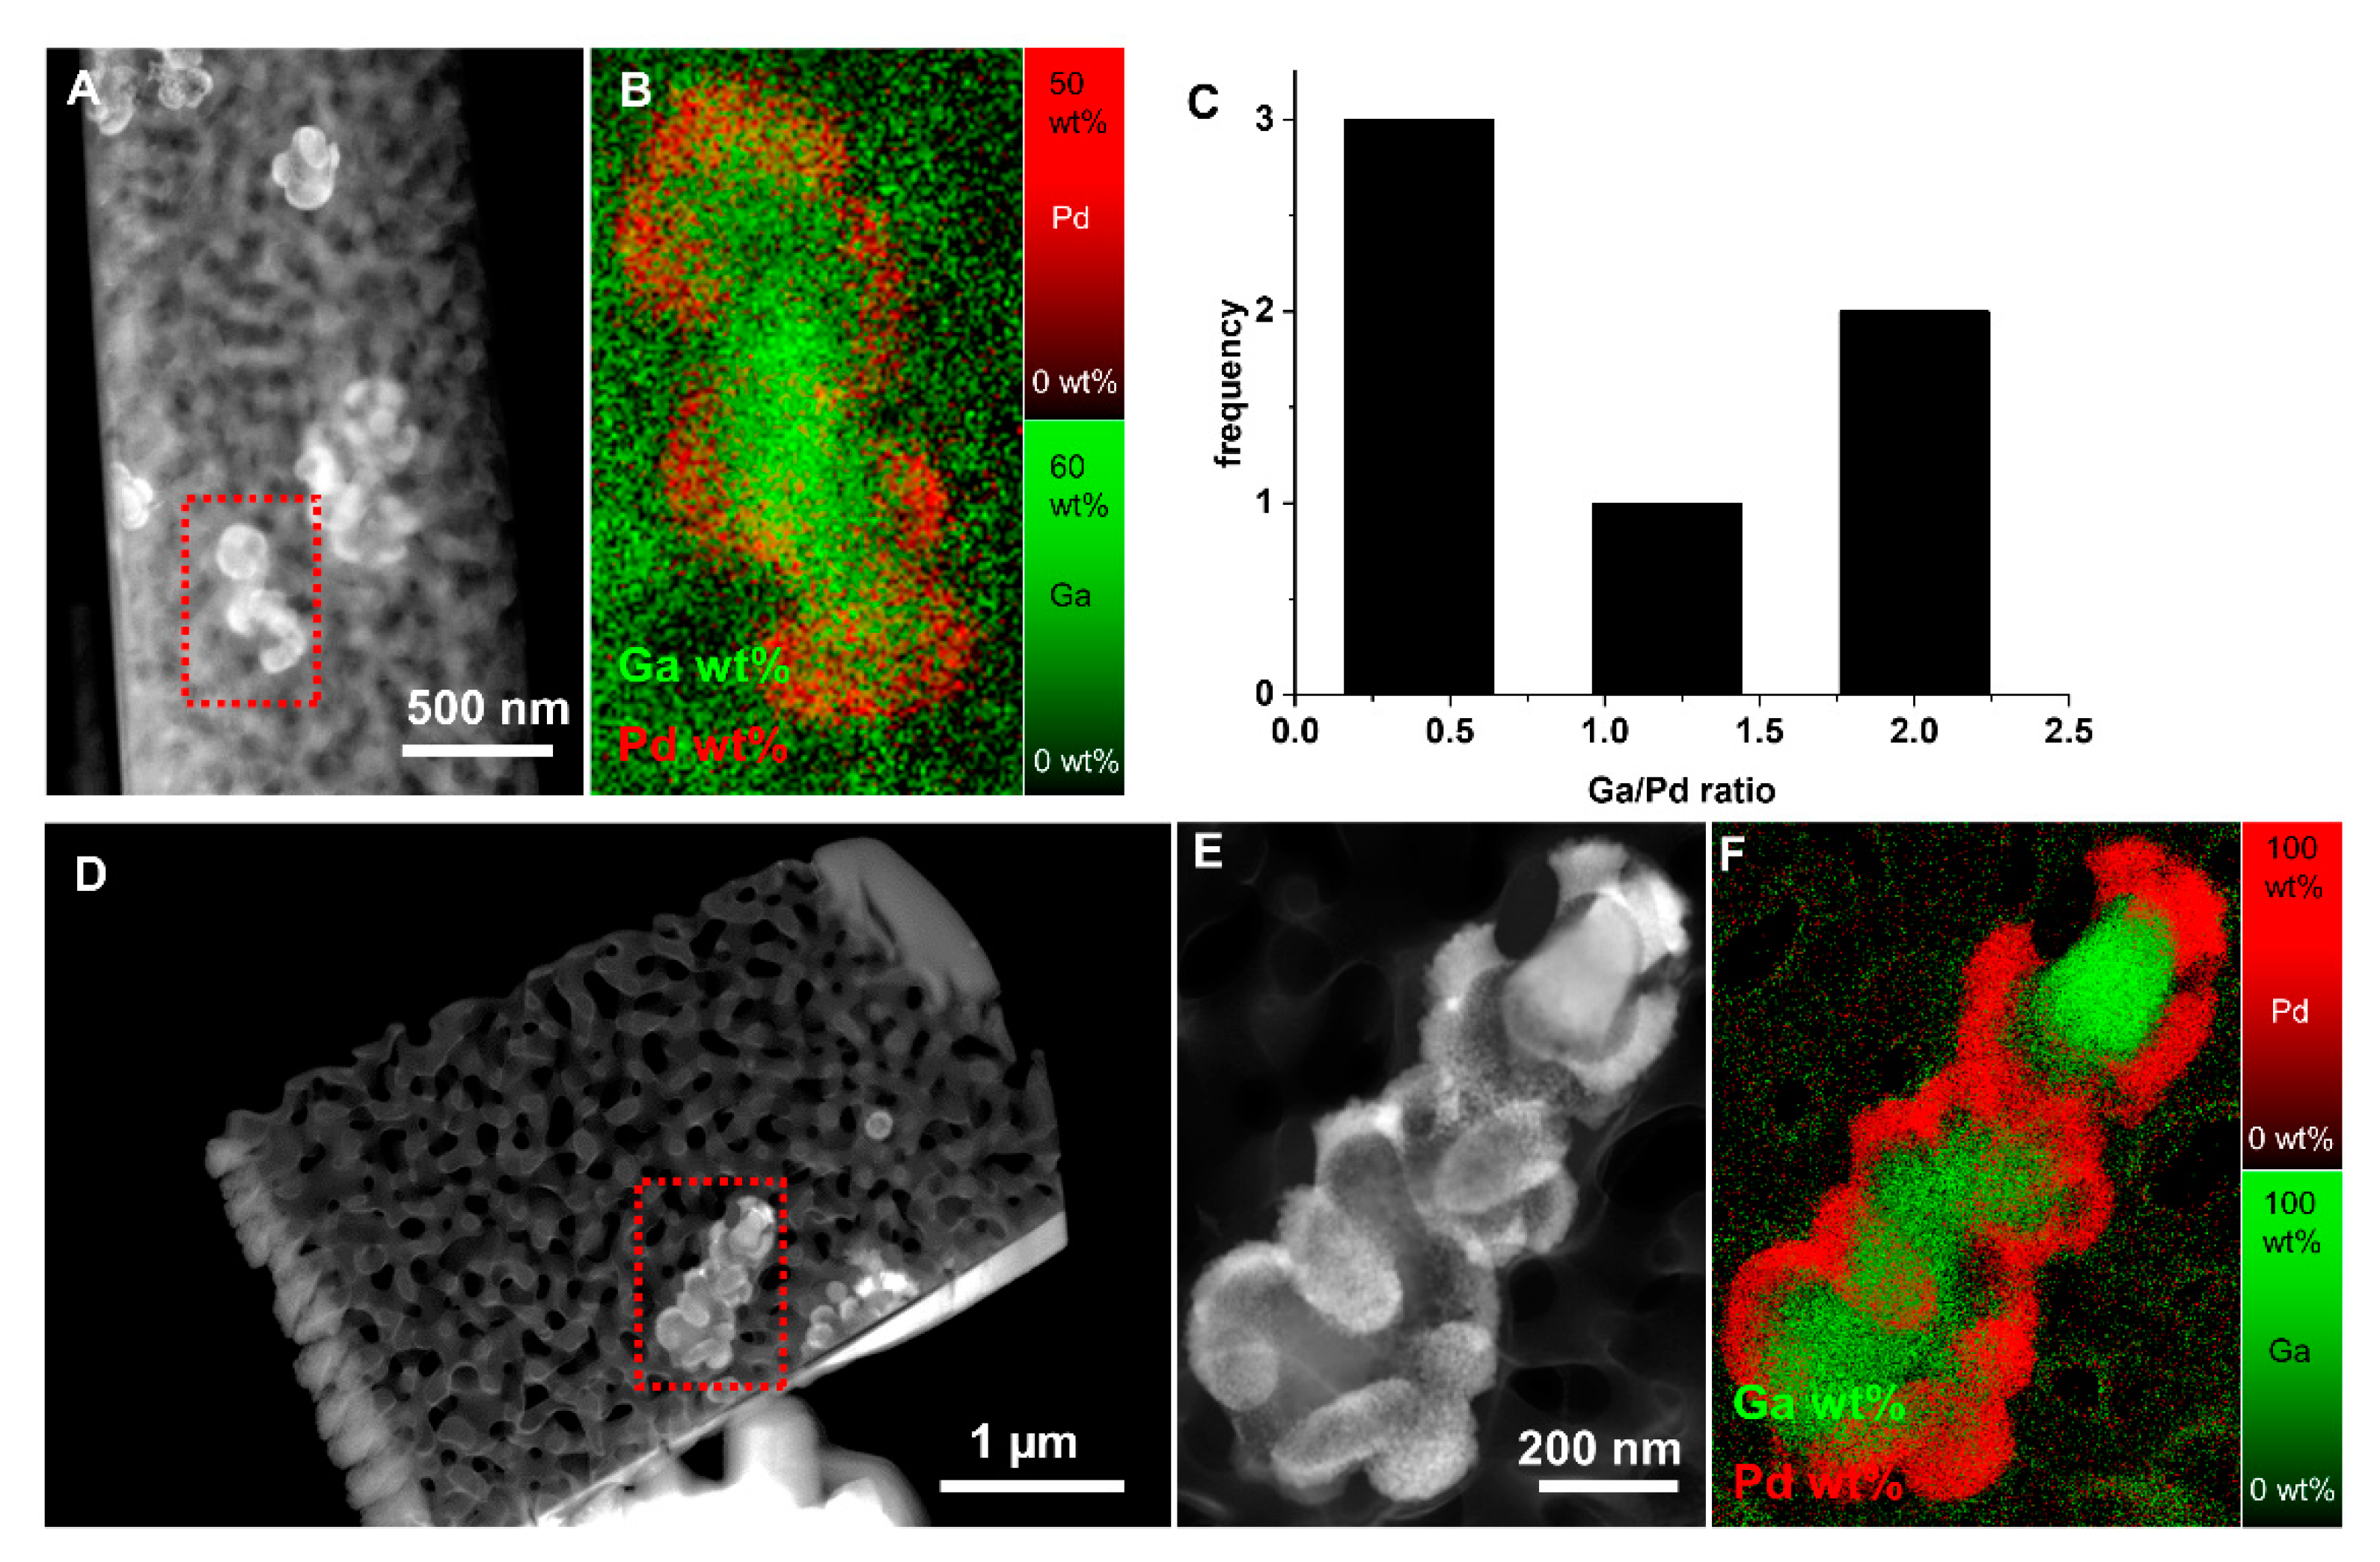
In addition to using 360°-ET to improve the segmentation quality of nano-CT datasets, we combined 360°-ET with complementary STEM-EDXS to analyze the morphology and chemical composition of droplets inside the porous glass network with higher spatial resolution and less artifacts than nano-CT. The Ga-Pd droplets locally fill the macropores of the porous glass network and even extend into several pore channels featuring a branch-like structure. Furthermore, HAADF STEM and STEM-EDXS reveal a Ga-rich phase in the droplet interior and a Pd-rich phase on their surface towards the pore walls or the open pore space. Most importantly, the Ga/Pd ratio of the embedded particles is much lower than the overall Ga/Pd ratio measured after synthesis (by ICP-AES), indicating a pronounced Pd enrichment in these particles. STEM EDXS reveals Ga-rich (central droplet regions) and Pd-rich (droplet shell) regions. According to the Ga-Pd phase diagram [12], intermetallic phases are expected to form at low temperatures but may also be present at the catalytic operation temperature, depending on the local Ga-Pd ratio. Further detailed research addressing the (intermetallic) phase formation and melting behavior of Ga-Pd particles in the temperature range spanning from room temperature to synthesis temperature to catalytic operation temperature is required to further understand their contribution to catalytic activity [49].
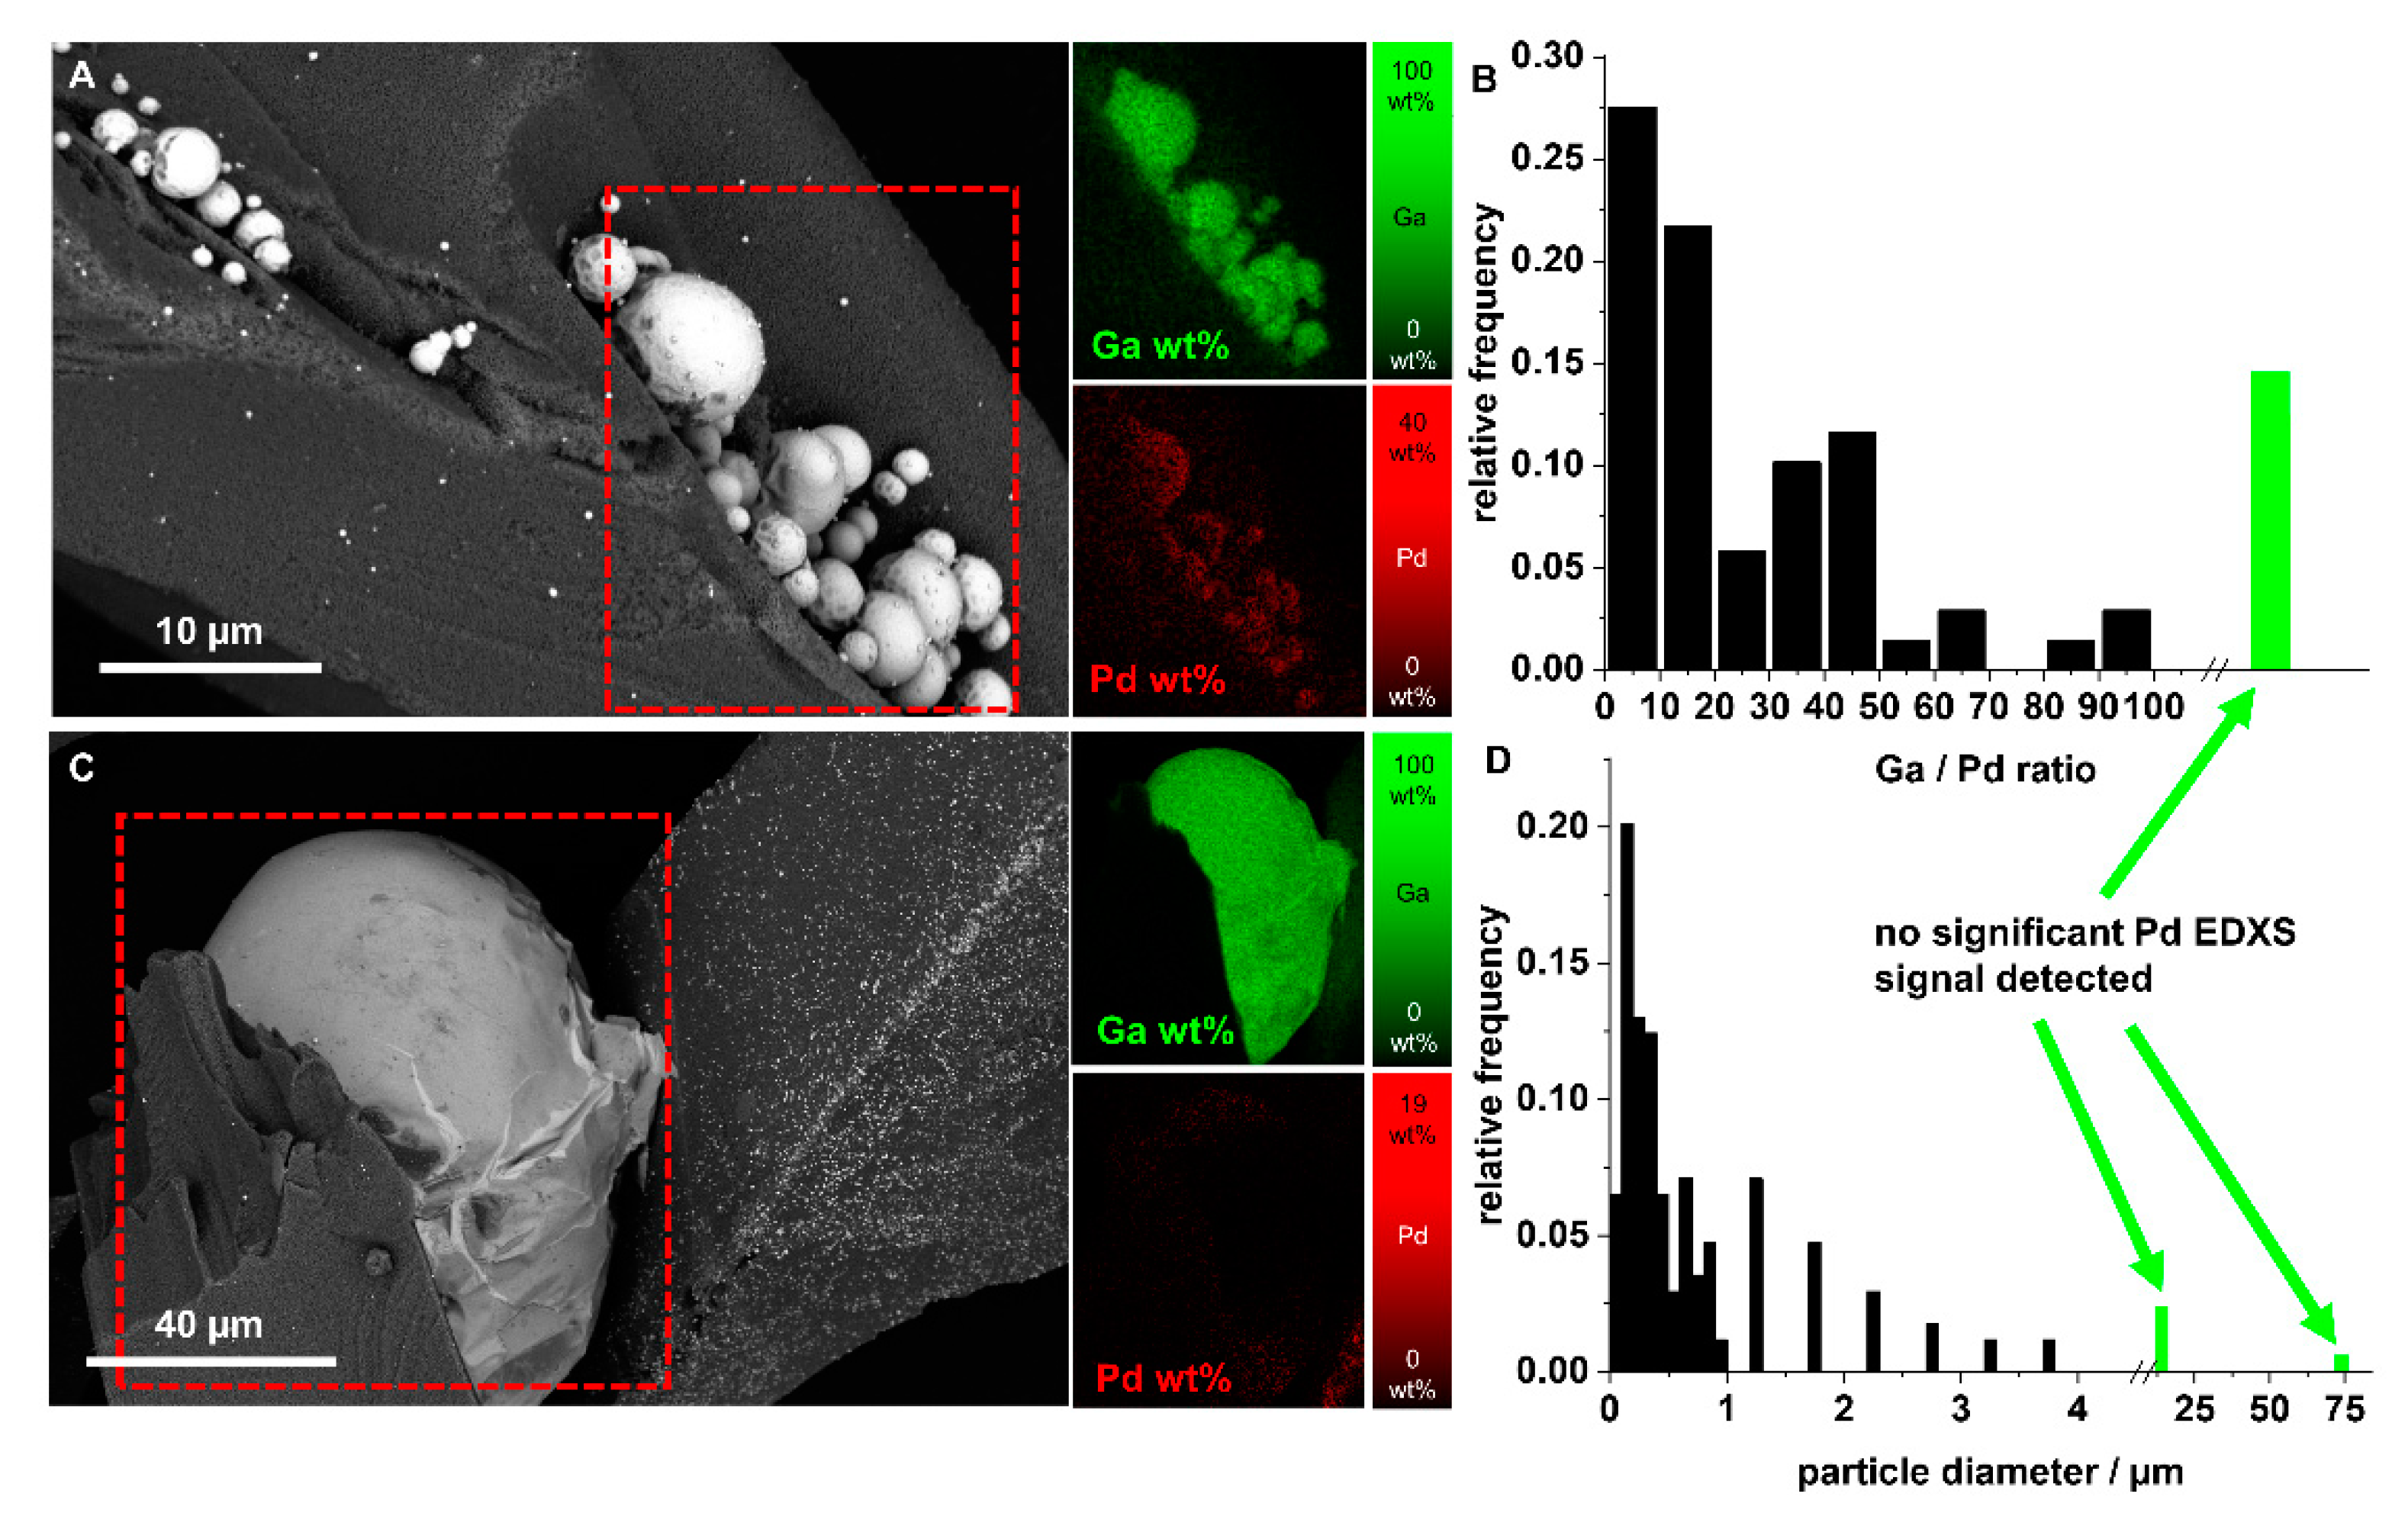
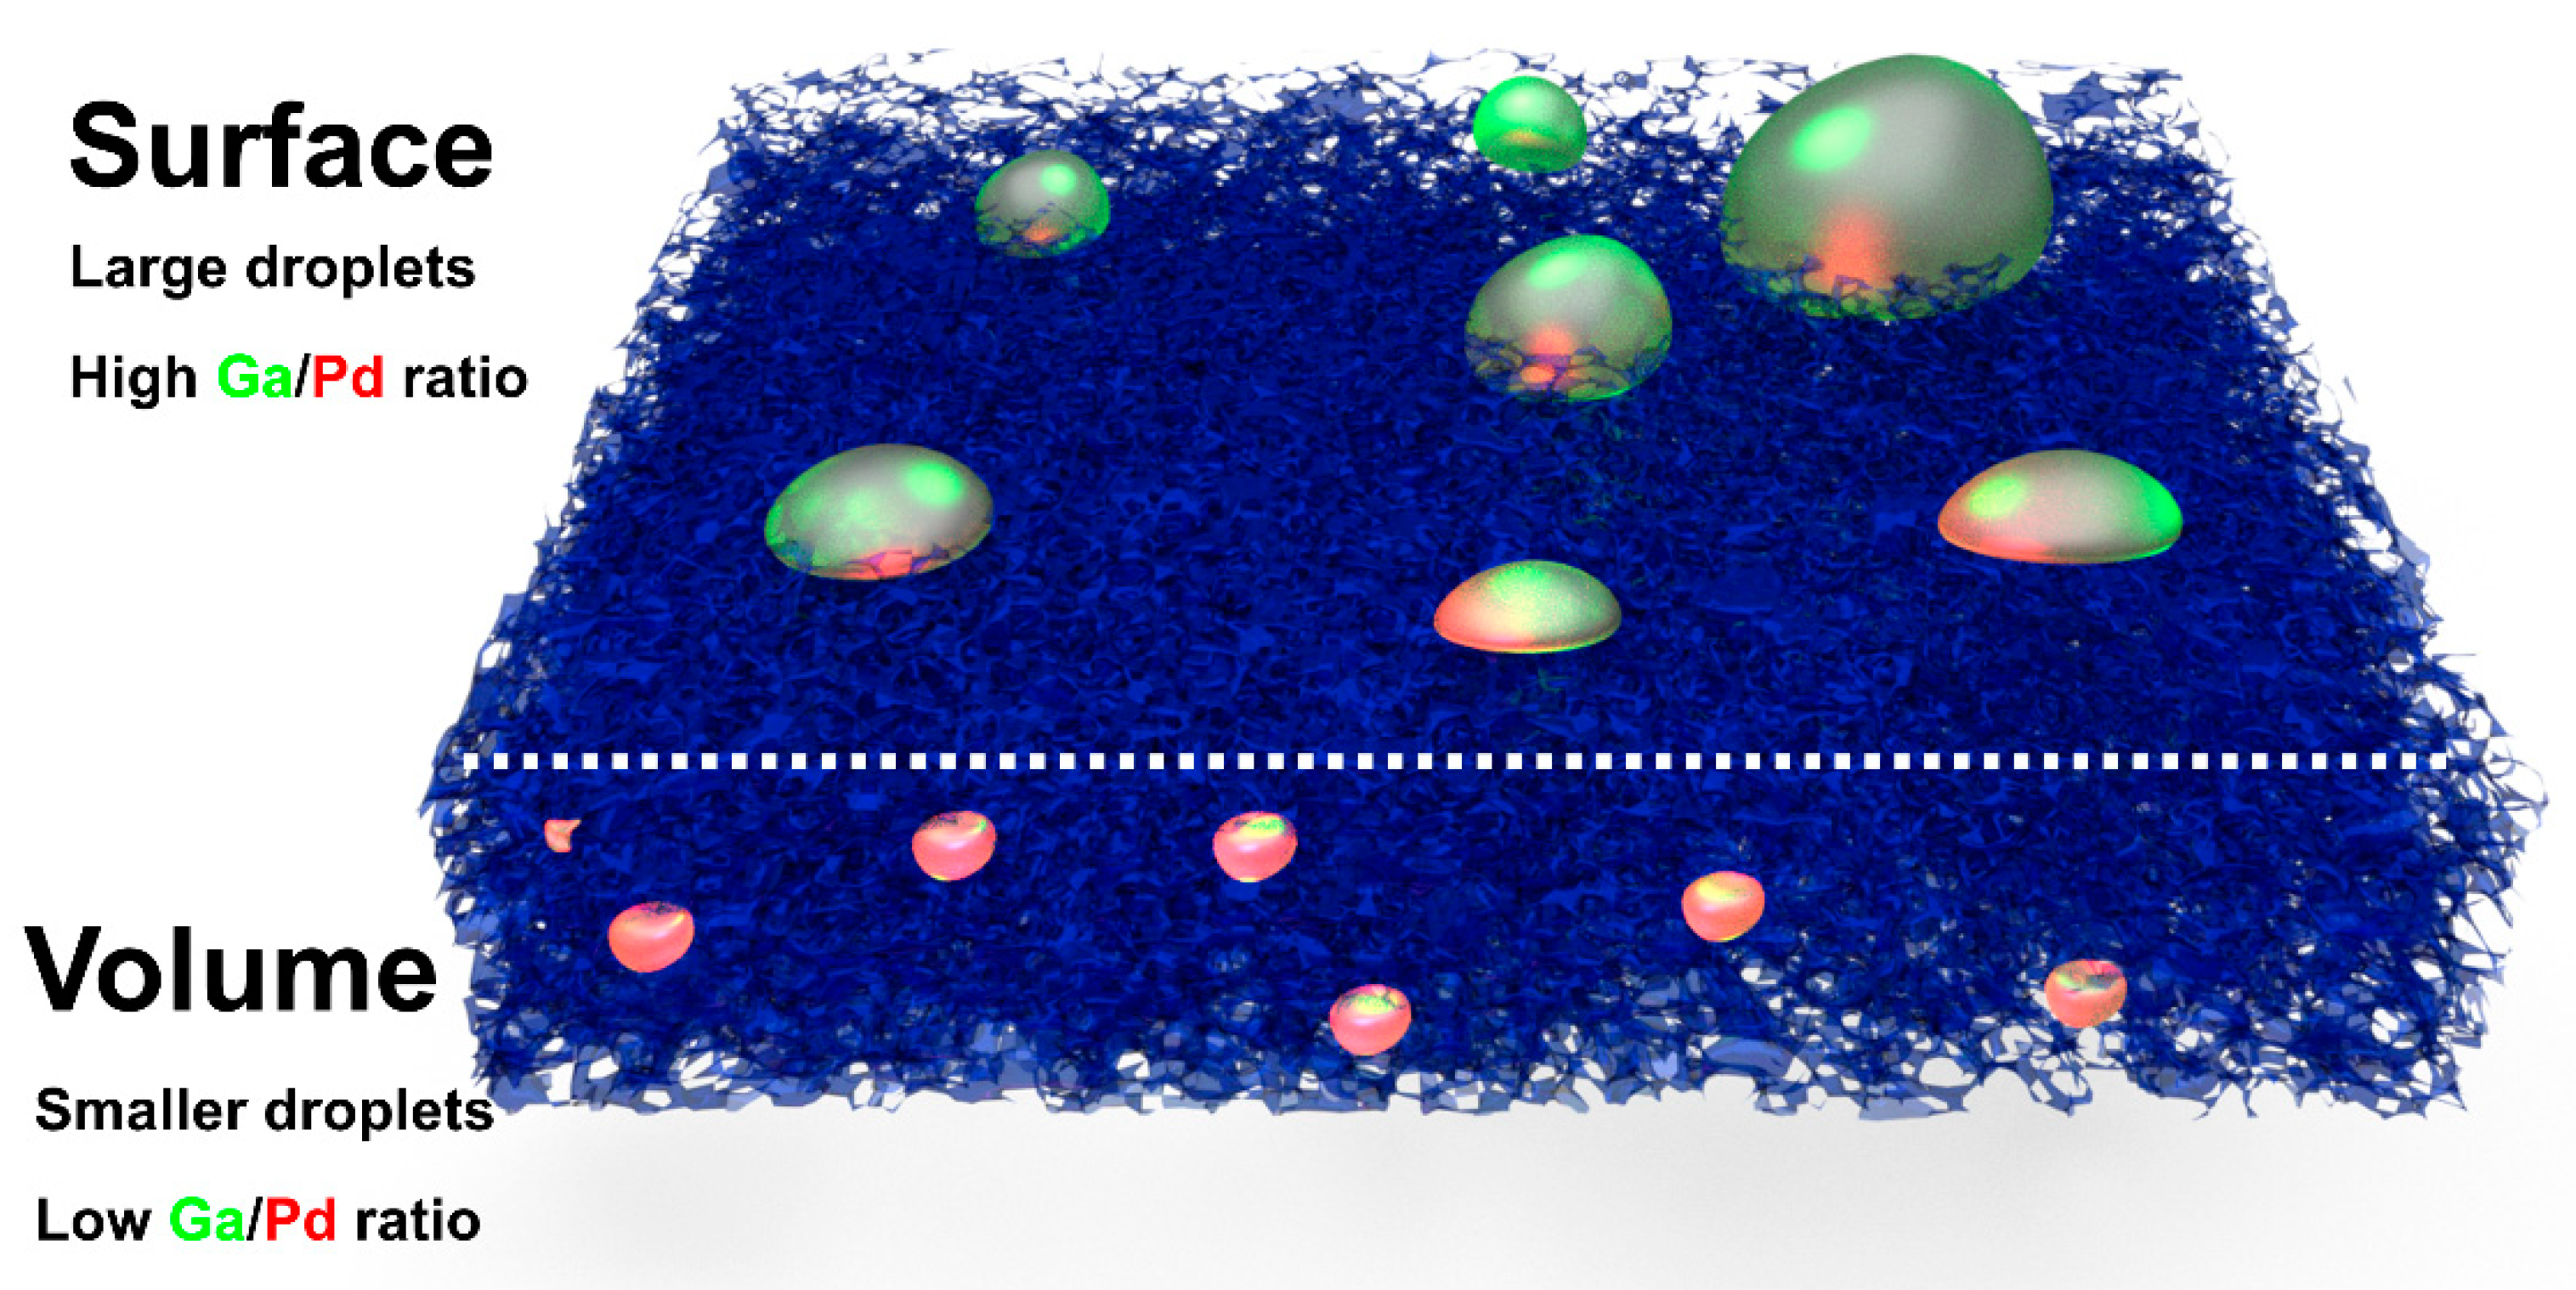
SEM imaging and SEM-EDX contribute important findings on the larger scale when investigating extended surface areas of the SCALMS primary particles. The surface Ga-Pd droplets are much larger than the embedded particles and, in contrast to the latter, consist of mainly Ga. Since our findings allow a clear assignment of Ga-Pd droplets to different classes with respect to their location, size and chemical composition, the existing SCALMS model might require reconsideration. The SCALMS model according to Taccardi et al. [9] proposes that the high catalytic activity and resistance to coke formation have their cause in the mobility of the Pd atoms in the liquid Ga volume, assuming the structural similarity of all Ga-Pd droplets. An adjusted structural model is illustrated in Figure 9. On the surface, large and Ga-rich droplets are present, whereas smaller droplets with strongly increased Pd content (or much lower Ga/Pd ratio) occur inside the volume. How this bimodal particle distribution in size and composition evolves during synthesis and whether or not it is sustained during the operation conditions of the catalytic alkane dehydrogenation (i.e., with reaction temperatures > 450 °C) are important questions which have to be addressed in subsequent studies. We emphasize here that the melting temperature and the relative amount of intermetallic phase and liquid Ga-Pd at temperatures below the liquidus line sensitively depend on the Ga/Pd ratio in a single droplet [12].
Our previous catalytic studies on the Ga-Pd system clearly indicated that the observed excellent catalytic activity and stability over a long time on the stream in butane dehydrogenation rely on the existence of a liquid metallic phase. Catalysts with a low overall Ga to Pd ratio, where only solid PdGa and Pd2Ga phases are expected at process temperatures, quickly deactivated [9]. Analogously, in a related study on Rh-Ga SCALMS [10], a boost in activity was observed when the concentration of Rh in Ga was lowered to such an extent that a fully liquid system under the applied condition for propane dehydrogenation can be anticipated.
Based on these results, we expect that our finding of a nonuniform droplet composition has a major impact on the microscopic interpretation of the SCALMS process.
At present, it is not clear which of the two classes of particles is mainly responsible for the outstanding catalytic activity and coke resistance of the Ga-Pd SCALMS system. This important question can only be answered by a combined catalytic and scale-bridging microscopic/tomographic study. Such a study is currently underway and will allow us to systematically tune the structure of the SCALMS system towards higher activity and better coke resistance at the reduced material consumption of Ga and precious Pd.
Our study manifests that comprehensive and scale-bridging 3D investigation is indispensable to unravel the complex structural peculiarities of SCALMS. Since many retrieved structural properties, such as droplet location, size and chemical composition, are suspected to highly influence the catalytic performance, these findings are, moreover, crucial to understanding and further optimizing SCALMS systems. Future studies should cover further promising SCALMS material combinations besides Ga-Pd, such as Ga-Pt or Ga-Rh. In this regard, the Ga-Rh system exhibits similar excellent catalytic properties compared to Ga-Pd SCALMS [10,50]. In situ heating TEM studies have already given important insight into structure, chemical composition and temperature-dependent phase properties of Ga-Rh nanoparticles. However, continuative, comprehensive studies of the 3D structure are still necessary for a full comprehension of this promising SCALMS material.
Another parameter with potential high impact on catalytic activity is the pore size and morphology of the support material, hence necessitating detailed studies of the effect of the support on the composition of the droplets and, furthermore, on the turnover frequency of specific SCALMS systems. In a study on Pt-Ga SCALMS, it could be evidenced that the nature of the supporting material plays a key role in determining the degree of deactivation in propane dehydrogenation [16]. Moreover, a site-specific and same-location comparison of structural details before and after an exemplary dehydrogenation process is important to comprehend the catalysis process in every respect. Such experiments could be realized by (“interrupted”) in situ and/or operando TEM experiments or, on a larger scale, by combined “interrupted” SEM and nano-CT experiments of SCALMS directly before and after exposing the material to the catalysis reactor environment. Another route could be the development of custom-built experimental in situ 3D imaging setups, such as a small exemplary reactor [51].
In summary, we demonstrated the potential of and necessity for in-depth 3D analyses to investigate important material properties of the SCALMS system by applying a comprehensive, correlative and scale-bridging microscopy workflow. Our approach pushes the boundaries of lab-based nano-CT regarding sample size and spatial resolution through the application of stitched-HRES nano-CT and utilizes ET-informed nano-CT segmentation and 360°-ET reconstructions, combined with SEM-/STEM-EDXS, to unravel crucial structural details needed to understand the material’s performance, which is necessary for further material development.

4. Materials and Methods

4.1. SCALMS Synthesis

Porous glass (TRISOPOR®; pore volume 1.23 mm3/g; surface 35.5 m2/g; pore diameter 154 nm) was purchased from LGC-Biosearch Technologies. All other reagents were purchased from Sigma-Aldrich (St. Louis, MO, US) and used as received. The Ga-decorated porous glass was prepared according to a published method [9]. The metal content was determined via inductively coupled plasma-atomic emission spectroscopy (ICP-AES) using a SPECTRO CIROS-CCP instrument. The material (ca. 150 mg) was microwave digested at 180 °C with 10 mL of concentrated HF/HNO3/HCl (1/1/3) and the resulting solution diluted at 100 mL with deionized water. The Ga and Pd concentrations were determined using the emission line at 417.206 nm and at 340.458 nm, respectively. In a 250 mL flask, Ga-decorated porous glass (2.633 g; 10.5 wt% Ga) was suspended in 50 mL of deionized water under stirring. To this suspension, 9.3 mL of a solution of (NH4)2[PdCl4] (containing 1 mg/mL of Pd) was drop wisely added and the whole suspension and subsequently stirred until the orange-colored solution turned colorless (<1 min), indicating that the [PdCl4]2− ions had reacted. The resulting solid was filtered and washed with 250 mL of deionized water and 250 mL acetone, and then vacuum dried (<1 mbar) overnight. The resulting solid had a Ga and Pd loading of 8.8 wt% and 0.3 wt%, respectively, with a Ga/Pd wt% ratio of 29.33. This Ga/Pd ratio renders the nominal value for comparison with the determined chemical composition by EDXS.

4.2. Sample Preparation for LFOV and HRES Nano-CT Measurements

The SCALMS primary particle used for the nano-CT experiments shown in Figure 3 was transferred to the tip of a suitable tomography needle according to the following approach. First, the dry particle powder, which contained particle agglomerates of different sizes, was distributed on a glass plate. Subsequently, a stainless-steel needle (fixing pin) covered with UV light-sensitive adhesive (LOCTITE® 4305) was mounted onto an tweezer and carefully brought into contact with the dispersed particles on the glass surface by hand, so that some primary particles stuck to the tip of the needle. Then, we fixed the needle with the sample attached in a nano-CT sample holder and proceeded with direct particle inspection utilizing the Zeiss prealignment microscope, which consists of two light microscopes each equipped with a micromanipulation table. This setup allows the sample position on the tomography tip to be slightly adjusted by using a single hair mounted onto the micromanipulation table and bringing it in contact with the sample. As soon as the sample was in a suitable position, the adhesive was completely cured under the UV light irradiation using a UV flashlight. The steel needle was inserted into a custom-built, FIB-compatible sample holder with a capacity of up to four needles. This sample holder was inserted into a FEI Helios NanoLab 660 DualBeam FIB-SEM instrument equipped with a micromanipulator (MM3A, Kleindiek Nanotechnik GmbH). The micromanipulator was also equipped with an insertion tool (ROTIP-EM, Kleindiek Nanotechnik GmbH), whose tip can be rotated 360° around its long axis (tilt angle increment 0.1°), allowing for precise adjustments as well as flexible sample positioning within the FIB-SEM chamber. At a suitable position on the primary particle surface, a free-standing pillar structure (without surrounding sample regions) with a diameter of 28 µm (sample routine 1) was milled using the Ga+-ion beam at 30 kV acceleration voltage. This process was repeated at another position on a different primary particle for a second independent pillar with a diameter of around 12 µm (sample routine 2).

4.3. Sample Preparation for 360° Electron Tomography

After the nano-CT experiments, the SCALMS pillar structure on the stainless-steel needle (d = 28 µm) was inserted again in the FEI Helios NanoLab 660 DualBeam FIB-SEM instrument using the before mentioned custom-built sample holder. From the initial 28 µm pillar, a smaller pillar with a diameter of 3 µm (sample routine 1) was prepared and transferred onto standard brass 360° electron tomography tips (E.A. Fischione Instruments, Inc. Pittsburgh, PA, US) following a pillar lift-out using an EasyLift Nanomanipulator. This process was repeated for a pillar with a diameter of 2 µm prepared from the 12 µm nano-CT pillar (sample routine 2). For sample routine 2, the volume of the 2 µm pillar is approximately 6 µm below the surface of the larger pillar. During removal of this volume, a high mount of Ga+ ions were implanted into the sample, which is also visible in the partly distorted pore space at the top of the pillar in Figure 4B and not utilized for EDXS analysis.

4.4. Nano X-ray Computed Tomography (Nano-CT)

The nano-CT experiments were performed with a ZEISS Xradia 810 Ultra laboratory-scale X-ray microscope equipped with a 5.4 keV rotating anode Cr source and a Zernike phase ring for phase contrast (PC) imaging. With the large-field-of-view (LFOV) and high-resolution (HRES) mode, two imaging modes at different magnification are available, providing a field of view (FOV) of 65 µm × 65 µm and 16 µm × 16 µm with an optical resolution down to 150 nm (63.89 nm pixel size) and 50 nm (16.09 nm pixel size), respectively. The SCALMS pillar sample of sample routine 1 was prepared to fit into the FOV of the LFOV mode, but at the same time exceeding the FOV of the HRES mode. For sample routine 2, the pillar size was adjusted to fit into the FOV of the HRES mode. The nano-CT tilt series contains a total number of 901 projections (both LFOV and HRES) with 0.2° tilt increment and an acquisition time of 240 s/frame (HRES) and 100 s/frame (LFOV), respectively. The tilt series were aligned along the rotation axis perpendicular to the X-ray beam. The tilt series were recorded in the native ZEISS microscope software (XMController and Scout and Scan). The ImageJ plugin “Linear Stack Alignment with SIFT” [52] was used to align the tilt series of the stitched-HRES and the LFOV series of sample routine 1. For sample routine 2, the active motion compensation (AMC; based on Wang et al. [53]) procedure implemented in the native ZEISS software (XMController) was utilized for alignment. The 3D reconstruction was performed using the simultaneous iterative reconstruction technique (SIRT) algorithm [54] (100 iterations), implemented using an in-house Python script based on the Astra Toolbox [55,56,57]. The non-negative boundary condition provided by the Astra Toolbox was utilized to improve the reconstruction quality. Arivis Vision4D and ImageJ [58] were used for visualization, segmentation and quantitative 3D analysis.

4.5. Stitched-HRES Nano-CT

To be able to reconstruct the complete volume of the 28 µm SCALMS pillar of sample routine 1, eight subsequent HRES-PC nano-CT tilt series with 901 projections were acquired and stitched to one combined tilt series. Therefore, multiple HRES scans of adjacent sample areas were performed (4 × 2 = 8 HRES scans, see experimental part about stitching) to increase the total FOV with almost unchanged spatial resolution and were recorded and stitched together in a postprocessing step using the Stitching Toolbox implemented in ImageJ [59]. More precisely, at every tilt angle, 8 adjacent projections (with two-dimensional coordinates u and v) were acquired providing a small overlap of about 10% along u- and v-direction with respect to all projections from the neighboring tilt series. Starting from the projection of the first tilt series at each tilt angle, the other seven corresponding projections were aligned and stitched by averaging the overlapping pixel values [59]. The final tilt series of single stitched projections was aligned by SIFT [52] for subsequent SIRT reconstruction (100 iterations). Both the pixel averaging and the SIFT algorithm are implemented in ImageJ [58]. The stitching approach increases the total reconstructable volume by a factor of about eight (23). The increased FOV requires a reconsideration of the accessible depth of field. The depth of field was calculated according to the relationship depth of field = 2(resolution)²/wavelength [60] to 21.8 µm for the HRES mode at 50.0 nm resolution and 196.0 µm at 150 nm resolution for the LFOV mode at a quasimonochromatic wavelength of 229 pm. Hence, all regions of the 28 µm pillar could not be considered to be completely in focus in the stitched-HRES tilt series, leading to an estimated decrease in resolution to 60.5 nm for the HRES mode. The defocus influence was partly averaged due to the geometry.

4.6. 360° Electron Tomography (ET)

360°-ET was carried out using the prepared pillar structures on standard 360°-ET tips (E.A. Fischione Instruments, Inc., Pittsburgh, PA, US) of sample routines 1 and 2 mounted onto a Fischione Model 2050 On-Axis Rotation Tomography Holder (E.A. Fischione Instruments, Inc. Pittsburgh, PA, US). Tilt series within a full tilt angle range of at least 180° were acquired with a double aberration-corrected FEI Titan³ Themis 60-300 transmission electron microscope at an acceleration voltage of 300 kV in HAADF STEM imaging mode. The camera length was reduced for both routines to 91 mm to obtain mainly mass-thickness contrast conditions (Rutherford scattering) and to keep nonlinear contrast contributions (diffraction contrast) very low. The convergence angle of the STEM probe was reduced for both sample routines to 0.8 mrad (microprobe STEM) in order to be able to image all parts of the sample completely in focus during the entire tilt series acquisition procedure. The corresponding resolution limit defined by the Raleigh criterion with a half-convergence angle of 0.8 mrad is 1.5 nm [61]. The tilt series were acquired with 36 kx magnification, 2048 × 2048 pixels, pixel size of 1.36 nm and a dwell time of 2 µs for sample routine 1 and 18 kx magnification, 2048 × 2048 pixels, pixel size of 2.70 nm and dwell time of 2 µs for sample routine 2. For this purpose, FEI Tomography 4.0 software was utilized to acquire images in a tilt angle range of 180° with 1° tilt increment, continuous and linear tilt scheme, autofocus and tracking before acquisition. For each 180° tilt series, two successive tilt series were recorded in a tilt angle range of ±55° each. After recording the first tilt series, the specimen was rotated 90° along the tilt axis by internally rotating the sample holder (the holder has 4 preset 90° step positions). In the next step, the tilt series were combined with ImageJ [58] and the FEI Inspect 3D software. Overlapping and double projections for the same tilt angles were deleted from the merged tilt series. The alignment of the tilt series was performed with ImageJ plugin “Linear Stack Alignment with SIFT” [52]. The 3D reconstruction was performed using the SIRT algorithm [54] with 100 iterations, implemented by an internal Python script based on the Astra Toolbox [57]. For visualization, segmentation and quantitative 3D analysis, Arivis Vision4D was used in combination with ImageJ [58] (see Section 4.7).

4.7. Data Evaluation and Analysis

Data processing and analysis were realized by a combination of in-house Java and Python coding together with ImageJ [58] and the commercial software package Arivis Vision4D. The machine-learning algorithm (based on [62]) of the software Arivis Vision4D was used for segmentation of the Ga-Pd droplets in all 360°-ET and nano-CT reconstructions. The segmentation information of data sets acquired with higher resolution was used to inform the segmentation of data sets acquired with lower resolution, i.e., 360°-ET reconstructions for HRES nano-CT reconstructions and HRES nano-CT reconstructions for LFOV nano-CT reconstructions. Since the nano-CT data was recorded in PC mode, halo-like edge enhancement artifacts at pores and droplets hampered the thresholding and segmentation procedure and therefore introduced a small error of around 13.5% calculated from direct comparison of 360°-ET and nano-CT of the small pillar volume of sample routine 2. In order to suppress the influence of these artifacts, the reconstructed nano-CT data was preprocessed in Arivis Vision 4D by adjusting the median pore space in selected volume regions to match the determined pore space (porosity) of the ET experiments. Moreover, the direct correlation approach of the same pillar volume using both 360°-ET and HRES nano-CT (sample routine 2, Figure 4) was used to improve the overall segmentation precision of droplets and pores in the nano-CT reconstructions. In general, nano-CT is able to correctly reconstruct the pore space of the macroporous glass support, but pores in close proximity to Ga-Pd droplet structures are not correctly interpreted due to PC artifacts (halo formation around the droplets overlaps with the pore space), and therefore, the visible pore size in these regions is inflated in single projections and 3D reconstructions. By adjusting the segmentation by employing prior knowledge from 360°-ET, as illustrated in Figures S2 and S3, the previously overestimated pore space in the nano-CT reconstructions was corrected, but at the same time, the Ga-Pd droplet volume was slightly underestimated, which could not be completely corrected further.
The PSDs were calculated from the 360°-ET and 360°-ET-informed nano-CT segmentations with the maximum sphere inscription (MSI) technique [63], which was realized using the ImageJ plugin “local thickness” [64]. In a binarized data set, the MSI determines for each voxel the largest inscribable sphere (pore diameter) in the pore space before contact with the pore walls. The relative frequencies of the assigned pore diameters in the resulting PSDs (Figure 6) are calculated by dividing the number of voxels to which a given MSI pore diameter is assigned by the total number of pore voxels. The less spherical the pores are, e.g., elongated pore channels, and the rougher their pore surface is, the wider the resulting PSD is. Since, in this calculation, cubic voxels are divided by spheres, a small systematic error is to be expected.
The resolution of the reconstructed volumes was estimated by utilizing the Fourier shell correlation (FSC) according to van Heel and Schatz [46], implemented by in-house python coding. As input data sets for the FSC and the corresponding threshold curve, so-called subtomograms of even and odd members of each previous aligned tilt series were used, reconstructed by the SIRT algorithm as described above. The threshold curve was calculated according to van Heel and Schatz [46] for a signal-to-noise (SNR) ratio of 0.2071, which is referred to as the half-bit criterion threshold curve, whereas a SNR ratio of 0.5 is referred to as the one-bit criterion. The intersection of the FSC curve and the one-bit/half-bit criteria threshold curves determines the resolution (inverse of the spatial frequency at the intersection) of each reconstructed dataset. The half-bit criterion is usually suitable for cryo-ET measurements featuring a similar optical setup to 360°-ET and nano-CT with typically low SNR, whereas the one-bit criterion is the standard approach in X-ray crystallography [
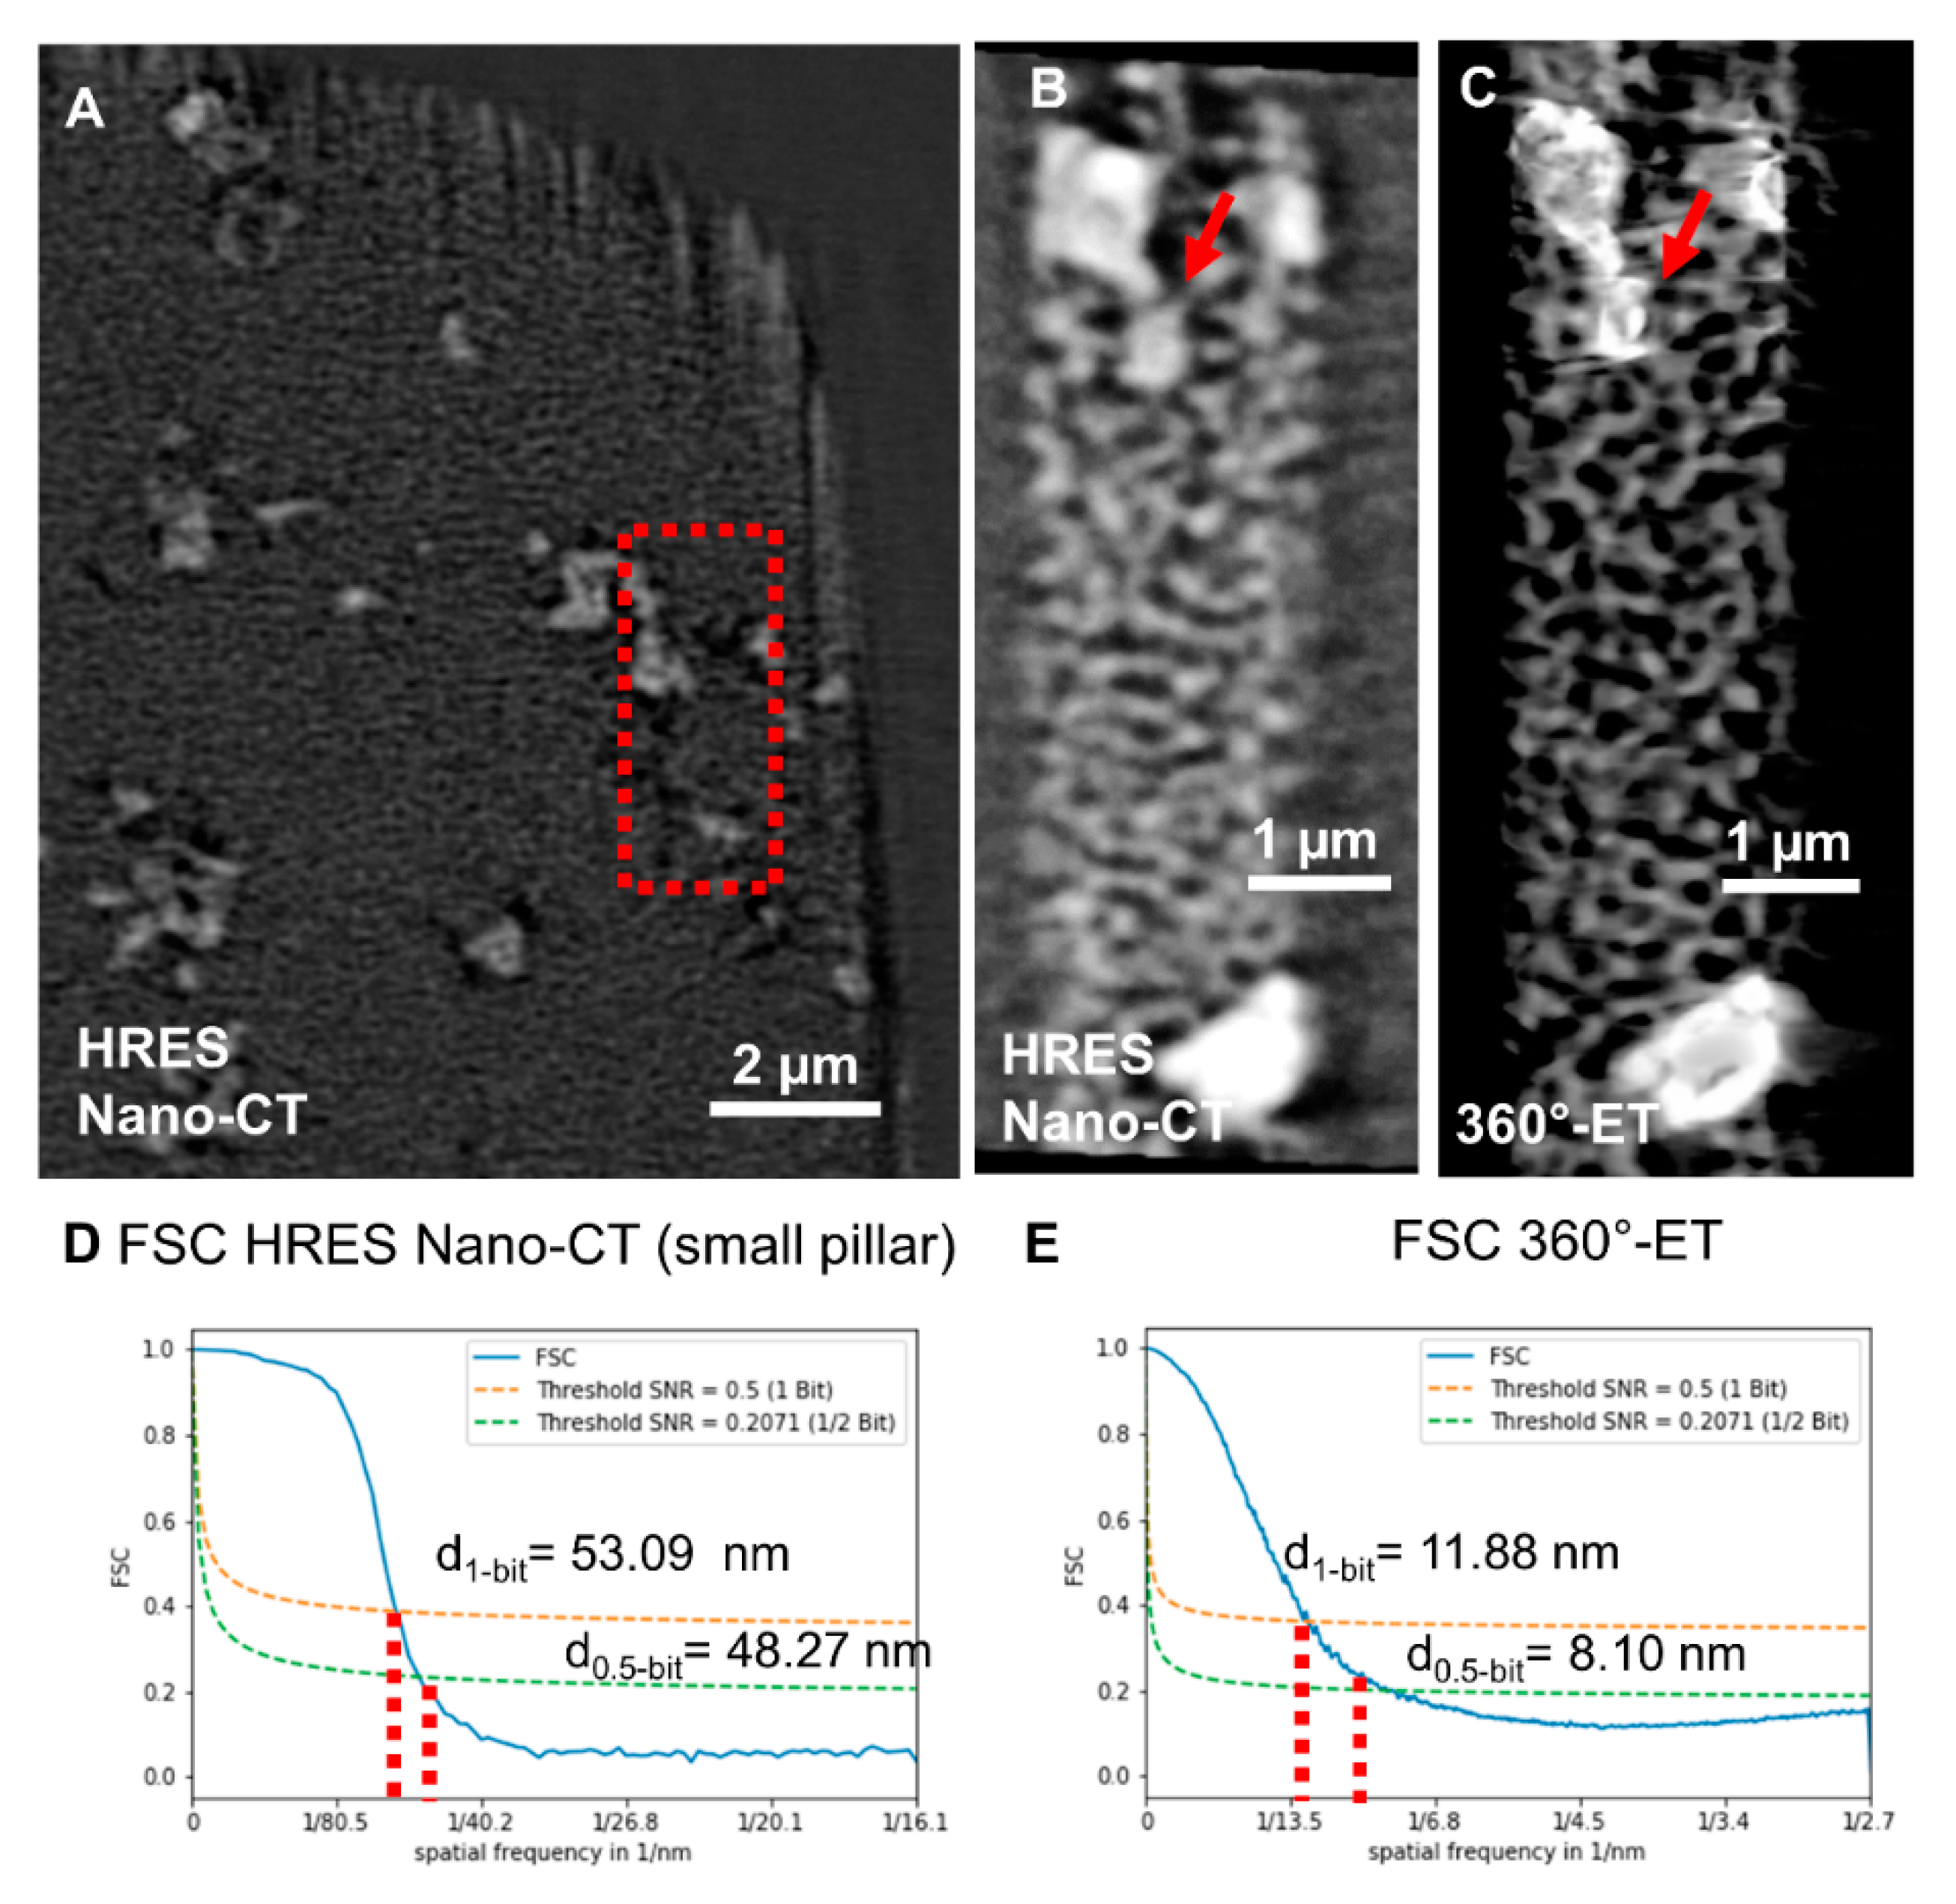
65]. The FSC values calculated for the nano-CT datasets are typically lower than the nominal optical resolution of the X-ray microscope: here, 50 nm for the HRES mode and 150 nm for the LFOV mode. Comparing the FSC values for the stitched-HRES data (sample routine 1) with 46.66 nm/37.01 nm (one-bit/half-bit criterion) and the HRES nano-CT data from the 12 µm pillar (sample routine 2) with 53.10 nm/46.66 nm (one-bit/half-bit criterion), the stitched-HRES value is lower due to the alignment procedure. The stitched-HRES data was aligned via the SIFT procedure [52], where the “noise” was artificially aligned between each image of the tilt series [66]. The HRES nano-CT data was aligned via AMC, where the noise is not additionally aligned. Furthermore, the FSC value of the HRES nano-CT of the small pillar (d = 2 µm) with 53.09 nm/48.27 nm from the direct correlation with the 360°-ET data is in perfect agreement with the stitched-HRES nano-CT FSC value of the larger pillar. The reason for this is the selected volume for FSC calculation, which requires congruent ratio in the compared reconstructed volumes of the sample volume to surrounding volume without the sample only containing noise. In the small pillar of sample routine 2, the regions containing no sample volume, and therefore exclusively representing noise, are cropped in the nano-CT dataset because the pillar diameter of 2 µm is comparably small to the FOV. Similar to this, we ensure a congruent volume ratio to the 360°-ET dataset. The 12 µm pillar almost completely fills out the FOV of HRES nano-CT resulting in fewer areas without imaged sample, but the same ratio of volumes is used for the FSC calculation. Hence, the FSC resolution requires careful consideration.
In general, the FSC value is not equivalent to the actual spatial resolution of the imaging system but is a suitable method to compare several 3D imaging techniques regarding their reconstruction quality when considering the abovementioned guidelines.

4.8. Mercury Porosimetry

Mercury porosimetry of the pristine glass (TRISOPOR®) was performed using a Pore-Master® from Quantachorme Instruments at contact angle of 140 ° and a temperature of 21.7 °C. A cylindrical pore model has been assumed. The total cumulative volume was measured to be 2.71 cc/g featuring a total specific surface area of 34.52 m2/g. The determined average pore diameter was calculated to be 155.56 nm with a total porosity of 83.43%.

4.9. Nearest Neighbor Analysis

The nearest neighbor (NN) analysis is a method to analyze the 3D distribution and position of objects, e.g., SCALMS droplets, towards each other. The center of mass was determined for each droplet in Arivis Vision4D and utilized as particle center for the NN analysis. The coordinates of the particle centers are then used to determine the distances between each other. The shortest distance between one particle and the next is then considered as the nearest neighbor distance.
As a reference to evaluate the NN analysis, a Poisson fit with an expected value of 3.4 (3.4 × 200 nm = 680 nm) is assumed. The latter is performed using the software package Origin 2019.

4.10. SEM-EDXS and Particle Size Calculations

The SEM and SEM-EDXS measurements were performed using a FEI Helios NanoLab 660 DualBeam FIB-SEM instrument equipped with an Oxford Instruments X-max 150 detector for EDXS. The particle diameter has been calculated from 2D SEM micrographs (secondary electron imaging) of surface regions on a SCALMS primary particle. The images were imported in ImageJ [58] and transformed into a binary image after automatic thresholding utilizing the IsoData algorithm [65]. The particle diameter was subsequently calculated using the “Analyze Particles” tool in the 2D binary images by determining the area of the droplets and assuming a circular shape.
The EDXS scans were performed at an acceleration voltage of 30 kV and an electron beam current of 0.8 A at a working distance of 4.12 mm. The quantitative analysis of EDXS maps was performed using the Aztec software by Oxford Instruments. For each droplet located on the surface, a spectral image was performed and the fraction of Ga and Pd (wt%) was calculated.

4.11. STEM-EDXS

STEM-EDXS of the SCALMS sample was carried out on a double aberration-corrected FEI Titan³ Themis 60-300 transmission electron microscope operated at 300 kV. A 360°-ET pillar (sample routine 1) and an FIB lamella (sample routine 3) attached to 360°-ET tips were mounted onto a Fischione Model 2050 On-Axis Rotation Tomography Holder (E.A. Fischione Instruments, Inc. Pittsburgh, PA, US). HAADF STEM images with a camera length of 91 mm and STEM-EDXS maps were acquired using FEI Velox (Version 2.13.0.1138) in drift correction mode and with a screen current of around 100 pA. The EDXS experiments of the pillar-shaped sample were performed with a STEM semiconvergence angle of 0.8 mrad and a dwell time of 16 µs for 170 frames. On the contrary, a semiconvergence angle of 15.7 mrad and a dwell time of 50 µs over 35 frames was used for the lamella sample. Acquisition, processing and quantification of the chemical composition of the droplets were performed utilizing FEI Velox (Version 2.13.0.1138). The resulting Ga/Pd ratios (wt%) were utilized as a comparison to SEM-EDXS and ICP-AES measurements.

4.12. SAED

Selection area electron diffraction (SAED) patterns were captured on the Titan microscope operating at 300 kV. An aperture including about 160 nm area (diameter) was used, and the patterns were recorded using the camera at the end of Gatan GIF Quantum ERS. An energy slit of 10 eV around the zero-loss peak was applied to allow only the elastically scattered electrons, which greatly improves the visibility and contrast of spots at small diffraction/scattering angles.

Supplementary Materials

The following are available online at https://www.mdpi.com/article/10.3390/catal11070810/s1. Figure S1: SAED analysis, Figure S2: Comparison of the segmentation of the 3D datasets, Figure S3: ET-informed thresholding of the nano-CT dataset, Figure S4: MSI calculation of the stitched-HRES-PC nano-CT dataset of the 28 µm pillar, Figure S5: Comparison of segmentation for LFOV and stitched-HRES-PC nano-CT, Figure S6: FSC 3D resolution calculations for all acquired datasets, Figure S7: Statistical 3D distribution of the Ga-Pd droplets in the 3D volume, Video S1: 360°-ET tilt series of sample routine 1, Video S2: 360°-ET reconstruction of sample routine 1, Video S3: Stitched-HRES-PC nano-CT tilt series of sample routine 1, Video S4: Stitched-HRES-PC nano-CT reconstruction of sample routine 1, Video S5: LFOV-PC nano-CT tilt series of sample routine 1, Video S6: LFOV-PC nano-CT reconstruction of sample routine 1, Video S7: 360°-ET tilt series of sample routine 2, Video S8: 360°-ET reconstruction of sample routine 2, Video S9: HRES-PC nano-CT tilt series of sample routine 2, Video S10: HRES-PC nano-CT reconstruction of sample routine 2, Video S11: HRES-PC nano-CT (ET pillar) tilt series of sample routine 2, Video S12: HRES-PC nano-CT (ET pillar) reconstruction of sample routine 2, Video S13: MSI calculation for Stitched-HRES-PC nano-CT data of sample routine 1, Video S14: MSI calculation for 360°-ET data of sample routine 1.

Author Contributions

Conceptualization, J.W., B.A.Z. and E.S.; methodology, J.W. and S.E.; software, J.W. and S.E.; validation, J.W., B.A.Z. and E.S.; formal analysis, J.W., D.D., M.W. and N.T.; investigation, J.W., S.E., D.D., M.W., N.T. and N.R.; resources, N.T., N.R. and P.W.; data curation, J.W.; writing-original draft preparation, J.W., B.A.Z. and E.S.; writing-review and editing, J.W., B.A.Z., N.T., N.R., P.W. and E.S.; visualization, J.W., S.E., B.A.Z. and E.S.; supervision, B.A.Z., P.W. and E.S.; project administration, P.W. and E.S.; funding acquisition, P.W. and E.S. All authors have read and agreed to the published version of the manuscript.

Funding

We gratefully acknowledge financial support by the German Research Foundation (DFG) within the frameworks of the research training group GRK1896 “In situ Microscopy with Electrons, X-rays and Scanning Probes” (Project-ID: 218975129), the project SP648/8 “High-resolution X-ray microscopy for correlative tomography, high throughput screening and in situ mechanical testing of structural and functional materials” (Project-ID 316992193), the Collaborative Research Centre 1411 “Design of Particulate Products” (Project-ID 416229255) and the Collaborative Research Centre 1452 “Catalysis at Liquid Interfaces” (Project-ID 431791331).

Data Availability Statement

The tilt series and corresponding 3D reconstruction data are provided as Supplementary Videos S1–S12. Relevant primary data are provided by the authors on request.

Acknowledgments

The authors thank Johannes Will for fruitful discussions and Christian Wiktor for preliminary TEM studies on SCALMS.

Conflicts of Interest

The authors declare no conflict of interest.

References

  1. Leach, B.E. Applied Industrial Catalysis; Academic Press: New York, NY, USA, 1983. [Google Scholar]
  2. Roduner, E. Understanding catalysis. Chem. Soc. Rev. 2014, 43, 8226–8239. [Google Scholar] [CrossRef] [PubMed] [Green Version]
  3. Leeuwen, P.W.N.M.V.; Chadwick, J.C. Homogeneous Catalysts: Activity, Stability, Deactivation; Wiley-VCH: Weinheim, Germany, 2011. [Google Scholar]
  4. Muhler, M.J.M. Principles and Practice of Heterogeneous Catalysis. Ber. Bunsenges. Phys. Chem. 1997, 101, 1560. [Google Scholar] [CrossRef]
  5. Acres, G.J.K.; Bond, G.C.; Cooper, B.J.; Dawson, J.A. The use of supported solutions of rhodium trichloride for homogeneous catalysis. J. Catal. 1966, 6, 139–141. [Google Scholar] [CrossRef]
  6. Fengyu, Z.; Shin-Ichiro, F.; Masahiko, A. Developments and Applications of Supported Liquid Phase Catalysts. Curr. Org. Chem. 2006, 10, 1681–1695. [Google Scholar]
  7. Mehnert, C.P.; Cook, R.A.; Dispenziere, N.C.; Afeworki, M. Supported Ionic Liquid Catalysis—A New Concept for Homogeneous Hydroformylation Catalysis. J. Am. Chem. Soc. 2002, 124, 12932–12933. [Google Scholar] [CrossRef]
  8. Ertl, G. Preparation of Solid Catalysts; Wiley-VCH: Weinheim, Germany; New York, NY, USA; Chichester, UK; Brisbane, Australia; Singapore; Toronto, ON, Canada, 1999. [Google Scholar]
  9. Taccardi, N.; Grabau, M.; Debuschewitz, J.; Distaso, M.; Brandl, M.; Hock, R.; Maier, F.; Papp, C.; Erhard, J.; Neiss, C.; et al. Gallium-rich Pd-Ga phases as supported liquid metal catalysts. Nat. Chem. 2017, 9, 862–867. [Google Scholar] [CrossRef]
  10. Raman, N.; Maise, S.; Grabau, M.; Taccardi, N.; Debuschewitz, J.; Wolf, M.; Wittkamper, H.; Bauer, T.; Wu, M.J.; Haumann, M.; et al. Highly Effective Propane Dehydrogenation Using Ga-Rh Supported Catalytically Active Liquid Metal Solutions. ACS Catal. 2019, 9, 9499–9507. [Google Scholar] [CrossRef]
  11. Bauer, T.; Maisel, S.; Blaumeiser, D.; Vecchietti, J.; Taccardi, N.; Wasserscheid, P.; Bonivardi, A.; Görling, A.; Libuda, J. Operando DRIFTS and DFT Study of Propane Dehydrogenation over Solid- and Liquid-Supported GaxPty Catalysts. ACS Catal. 2019, 9, 2842–2853. [Google Scholar] [CrossRef]
  12. Okamoto, H. Ga-Pd (Gallium-Palladium). J. Phase Equilibria Diffus. 2008, 29, 466–467. [Google Scholar] [CrossRef]
  13. Yatsenko, S.P. Gallium. Interaction with Metals; Nauka: Moscow, Russia, 1974. [Google Scholar]
  14. Prinz, J.; Pignedoli, C.A.; Stöckl, Q.S.; Armbrüster, M.; Brune, H.; Gröning, O.; Widmer, R.; Passerone, D. Adsorption of Small Hydrocarbons on the Three-Fold PdGa Surfaces: The Road to Selective Hydrogenation. J. Am. Chem. Soc. 2014, 136, 11792–11798. [Google Scholar] [CrossRef]
  15. Wirth, J.; Englisch, S.; Wiktor, C.; Taccardi, N.; Zubiri, B.A.; Wasserscheid, P.; Spiecker, E. Structural Analysis of Liquid Metal Catalysts in Porous Silica Utilizing Nano-CT and Analytical Transmission Electron Microscopy. Microsc. Microanal. 2019, 25, 422–423. [Google Scholar] [CrossRef] [Green Version]
  16. Wolf, M.; Raman, N.; Taccardi, N.; Horn, R.; Haumann, M.; Wasserscheid, P. Capturing spatially resolved kinetic data and coking of Ga-Pt Supported Catalytically Active Liquid Metal Solutions during propane dehydrogenation in situ. Faraday Discuss. 2020, 229, 359–377. [Google Scholar] [CrossRef] [PubMed] [Green Version]
  17. Schwieger, W.; Machoke, A.G.; Weissenberger, T.; Inayat, A.; Selvam, T.; Klumpp, M.; Inayat, A. Hierarchy concepts: Classification and preparation strategies for zeolite containing materials with hierarchical porosity. Chem. Soc. Rev. 2016, 45, 3353–3376. [Google Scholar] [CrossRef] [PubMed] [Green Version]
  18. Devaraj, A.; Perea, D.E.; Liu, J.; Gordon, L.M.; Prosa, T.J.; Parikh, P.; Diercks, D.R.; Meher, S.; Kolli, R.P.; Meng, Y.S.; et al. Three-dimensional nanoscale characterisation of materials by atom probe tomography. Int. Mater. Rev. 2018, 63, 68–101. [Google Scholar] [CrossRef] [Green Version]
  19. Bae, K.; Kim, J.W.; Son, J.-W.; Lee, T.; Kang, S.; Prinz, F.B.; Shim, J.H. 3D Evaluation of Porous Zeolite Absorbents Using FIB-SEM Tomography. Int. J. Precis. Eng. Manuf. Technol. 2018, 5, 195–199. [Google Scholar] [CrossRef]
  20. van der Hoeven, J.E.S.; van der Wee, E.B.; de Winter, D.A.M.; Hermes, M.; Liu, Y.; Fokkema, J.; Bransen, M.; van Huis, M.A.; Gerritsen, H.C.; de Jongh, P.E.; et al. Bridging the gap: 3D real-space characterization of colloidal assemblies via FIB-SEM tomography. Nanoscale 2019, 11, 5304–5316. [Google Scholar] [CrossRef] [PubMed] [Green Version]
  21. Ercius, P.; Alaidi, O.; Rames, M.J.; Ren, G. Electron Tomography: A Three-Dimensional Analytic Tool for Hard and Soft Materials Research. Adv. Mater. 2015, 27, 5638–5663. [Google Scholar] [CrossRef] [Green Version]
  22. Przybilla, T.; Zubiri, B.A.; Beltrán, A.M.; Butz, B.; Machoke, A.G.F.; Inayat, A.; Distaso, M.; Peukert, W.; Schwieger, W.; Spiecker, E. Transfer of Individual Micro- and Nanoparticles for High-Precision 3D Analysis Using 360° Electron Tomography. Small Methods 2018, 2, 1700276. [Google Scholar] [CrossRef]
  23. Larrue, A.; Rattner, A.; Peter, Z.-A.; Olivier, C.; Laroche, N.; Vico, L.; Peyrin, F. Synchrotron Radiation Micro-CT at the Micrometer Scale for the Analysis of the Three-Dimensional Morphology of Microcracks in Human Trabecular Bone. PLoS ONE 2011, 6, e21297. [Google Scholar] [CrossRef] [Green Version]
  24. Fonseca, M.D.C.; Araujo, B.H.S.; Dias, C.S.B.; Archilha, N.L.; Neto, D.P.A.; Cavalheiro, E.; Westfahl, H.; da Silva, A.J.R.; Franchini, K.G. High-resolution synchrotron-based X-ray microtomography as a tool to unveil the three-dimensional neuronal architecture of the brain. Sci. Rep. 2018, 8, 12074. [Google Scholar] [CrossRef]
  25. Peyrin, F.; Dong, P.; Pacureanu, A.; Langer, M. Micro- and nano-CT for the study of bone ultrastructure. Curr. Osteoporos. Rep. 2014, 12, 465–474. [Google Scholar] [CrossRef] [PubMed]
  26. Zhao, Y.; Sun, Y.; Liu, S.; Chen, Z.; Yuan, L. Pore structure characterization of coal by synchrotron radiation nano-CT. Fuel 2018, 215, 102–110. [Google Scholar] [CrossRef]
  27. Silva, J.; Wehrspohn, R.; Liao, X.; Agarwal, S.; Greiner, A.; Khoshkho, M.; Zhou, F. Microscopic Characterization of Polymer Fibers with Mechanical Properties Similar to Dragline Spider Silk; Carl Zeiss AG: Jena, Germany, 2020. [Google Scholar]
  28. White, R.T.; Ramani, D.; Eberhardt, S.; Najm, M.; Orfino, F.P.; Dutta, M.; Kjeang, E. Correlative X-ray Tomographic Imaging of Catalyst Layer Degradation in Fuel Cells. J. Electrochem. Soc. 2019, 166, F914–F925. [Google Scholar] [CrossRef]
  29. Niehaus, W.L.; Howlin, R.P.; Johnston, D.A.; Bull, D.J.; Jones, G.L.; Calton, E.; Mavrogordato, M.N.; Clarke, S.C.; Thurner, P.J.; Faust, S.N.; et al. Development of X-ray micro-focus computed tomography to image and quantify biofilms in central venous catheter models in vitro. Microbiology 2016, 162, 1629–1640. [Google Scholar] [CrossRef] [PubMed]
  30. Neumann, A.; Randau, S.; Becker-Steinberger, K.; Danner, T.; Hein, S.; Ning, Z.; Marrow, J.; Richter, F.H.; Janek, J.; Latz, A. Analysis of Interfacial Effects in All-Solid-State Batteries with Thiophosphate Solid Electrolytes. ACS Appl. Mater. Interfaces 2020, 12, 9277–9291. [Google Scholar] [CrossRef]
  31. Pan, C.; Markvicka, E.J.; Malakooti, M.H.; Yan, J.; Hu, L.; Matyjaszewski, K.; Majidi, C. A Liquid-Metal-Elastomer Nanocomposite for Stretchable Dielectric Materials. Adv. Mater. 2019, 31, e1900663. [Google Scholar] [CrossRef] [PubMed]
  32. Mostafavi, M.; Bradley, R.; Armstrong, D.E.; Marrow, T.J. Quantifying yield behaviour in metals by X-ray nanotomography. Sci. Rep. 2016, 6, 34346. [Google Scholar] [CrossRef]
  33. Lu, X.; Fernandez, M.P.; Bradley, R.S.; Rawson, S.D.; O’Brien, M.; Hornberger, B.; Leibowitz, M.; Tozzi, G.; Withers, P.J. Anisotropic crack propagation and deformation in dentin observed by four-dimensional X-ray nano-computed tomography. Acta Biomater. 2019, 96, 400–411. [Google Scholar] [CrossRef]
  34. Lu, X.; Bertei, A.; Finegan, D.P.; Tan, C.; Daemi, S.R.; Weaving, J.S.; O’Regan, K.B.; Heenan, T.M.M.; Hinds, G.; Kendrick, E.; et al. 3D microstructure design of lithium-ion battery electrodes assisted by X-ray nano-computed tomography and modelling. Nat. Commun. 2020, 11, 2079. [Google Scholar] [CrossRef]
  35. Tkachuk, A.; Duewer, F.; Cui, H.T.; Feser, M.; Wang, S.; Yun, W.B. X-ray computed tomography in Zernike phase contrast mode at 8 keV with 50-nm resolution using Cu rotating anode X-ray source. Z. Krist. 2007, 222, 650–655. [Google Scholar] [CrossRef]
  36. Kumar, A.S.; Mandal, P.; Zhang, Y.; Litster, S. Image segmentation of nanoscale Zernike phase contrast X-ray computed tomography images. J. Appl. Phys. 2015, 117, 183102. [Google Scholar] [CrossRef]
  37. Yang, Y.; Heine, R.; Cheng, Y.; Wang, C.-C.; Song, Y.-F.; Baumbach, T. Approaching quantitative Zernike phase contrast in full-field transmission hard X-ray microscopy: Origin and reduction of artifacts. Appl. Phys. Lett. 2014, 105, 094101. [Google Scholar] [CrossRef]
  38. Zoofan, B.; Kim, J.Y.; Rokhlin, S.I.; Frankel, G.S. Phase-contrast x-ray imaging for nondestructive evaluation of materials. J. Appl. Phys. 2006, 100, 14502. [Google Scholar] [CrossRef]
  39. Schurch, R.; Rowland, S.; Bradley, R.; Withers, P. Comparison and Combination of Imaging Techniques for Three Dimensional Analysis of Electrical Trees. IEEE Trans. Dielectr. Electr. Insul. 2015, 22, 709–719. [Google Scholar] [CrossRef]
  40. Lenz, M.; Wirth, J.; Englisch, S.; Rosiwal, J.; Buchinger, N.; Weiser, M.; Virtanen, S.; Zubiri, B.A.; Spiecker, E. Correlative Nano-Computed Tomography and Focused Ion-Beam Sectioning: A Case Study on a Co-Base Superalloy Oxide Scale. Adv. Eng. Mater. 2019, 22, 1900823. [Google Scholar] [CrossRef] [Green Version]
  41. Burnett, T.L.; McDonald, S.A.; Gholinia, A.; Geurts, R.; Janus, M.; Slater, T.; Haigh, S.J.; Ornek, C.; Almuaili, F.; Engelberg, D.L.; et al. Correlative Tomography. Sci. Rep. 2014, 4, 4711. [Google Scholar] [CrossRef] [PubMed] [Green Version]
  42. Maire, E.; Withers, P.J. Quantitative X-ray tomography. Int. Mater. Rev. 2014, 59, 1–43. [Google Scholar] [CrossRef] [Green Version]
  43. Zubiri, B.A.; Wirth, J.; Drobek, D.; Englisch, S.; Przybilla, T.; Weissenberger, T.; Schwieger, W.; Spiecker, E. Correlative Laboratory Nano-CT and 360° Electron Tomography of Macropore Structures in Hierarchical Zeolites. Adv. Mater. Interfaces 2021, 8, 2001154. [Google Scholar] [CrossRef]
  44. Tanuma, S.; Powell, C.J.; Penn, D.R. Calculation of electron inelastic mean free paths (IMFPs) VII. Reliability of the TPP-2M IMFP predictive equation. Surf. Interface Anal. 2003, 35, 268–275. [Google Scholar] [CrossRef]
  45. Du, M.; Vescovi, R.; Fezzaa, K.; Jacobsen, C.; Gursoy, D. X-ray tomography of extended objects: A comparison of data acquisition approaches. J. Opt. Soc. Am. A 2018, 35, 1871–1879. [Google Scholar] [CrossRef]
  46. van Heel, M.; Schatz, M. Fourier shell correlation threshold criteria. J. Struct. Biol. 2005, 151, 250–262. [Google Scholar] [CrossRef] [PubMed]
  47. Boukezoula, T.F.; Bencheikh, L. Theoretical investigation of non-uniform bifunctional catalyst for the aromatization of methyl cyclopentane. React. Kinet. Mech. Catal. 2018, 124, 15–25. [Google Scholar] [CrossRef]
  48. Hardy, S.C. The surface tension of liquid gallium. J. Cryst. Growth 1985, 71, 602–606. [Google Scholar] [CrossRef]
  49. Chu, M.; Pan, Q.; Bian, W.; Liu, Y.; Cao, M.; Zhang, C.; Lin, H.; Zhang, Q.; Xu, Y. Strong metal–support interaction between palladium and gallium oxide within monodisperse nanoparticles: Self-supported catalysts for propyne semi-hydrogenation. J. Catal. 2021, 395, 36–45. [Google Scholar] [CrossRef]
  50. Wu, M.; Grabau, M.; Taccardi, N.; Papp, C.; Steinrück, H.P.; Wasserscheid, P.; Spiecker, E. Advanced and In-Situ Electron Microscopy Investigation of Phase Composition and Phase Transformation in Ga-Rh Liquid Metal Catalysts. Microsc. Microanal. 2019, 25, 1878–1879. [Google Scholar] [CrossRef] [Green Version]
  51. Fam, Y.; Sheppard, T.L.; Becher, J.; Scherhaufer, D.; Lambach, H.; Kulkarni, S.; Keller, T.F.; Wittstock, A.; Wittwer, F.; Seyrich, M.; et al. A versatile nanoreactor for complementary in situ X-ray and electron microscopy studies in catalysis and materials science. J. Synchrotron Radiat. 2019, 26, 1769–1781. [Google Scholar] [CrossRef] [Green Version]
  52. Lowe, D.G. Distinctive Image Features from Scale-Invariant Keypoints. Int. J. Comput. Vis. 2004, 60, 91–110. [Google Scholar] [CrossRef]
  53. Wang, J.; Chen, Y.-C.K.; Yuan, Q.; Tkachuk, A.; Erdonmez, C.; Hornberger, B.; Feser, M. Automated markerless full field hard X-ray microscopic tomography at sub-50 nm 3-dimension spatial resolution. Appl. Phys. Lett. 2012, 100, 143107. [Google Scholar] [CrossRef] [Green Version]
  54. Gilbert, P. Iterative methods for the three-dimensional reconstruction of an object from projections. J. Theor. Biol. 1972, 36, 105–117. [Google Scholar] [CrossRef]
  55. van Aarle, W.; Palenstijn, W.J.; De Beenhouwer, J.; Altantzis, T.; Bals, S.; Batenburg, K.J.; Sijbers, J. The ASTRA Toolbox: A platform for advanced algorithm development in electron tomography. Ultramicroscopy 2015, 157, 35–47. [Google Scholar] [CrossRef] [Green Version]
  56. Palenstijn, W.J.; Batenburg, K.J.; Sijbers, J. Performance improvements for iterative electron tomography reconstruction using graphics processing units (GPUs). J. Struct. Biol. 2011, 176, 250–253. [Google Scholar] [CrossRef] [Green Version]
  57. van Aarle, W.; Palenstijn, W.J.; Cant, J.; Janssens, E.; Bleichrodt, F.; Dabravolski, A.; De Beenhouwer, J.; Batenburg, K.J.; Sijbers, J. Fast and flexible X-ray tomography using the ASTRA toolbox. Opt. Express 2016, 24, 25129–25147. [Google Scholar] [CrossRef] [PubMed]
  58. Schindelin, J.; Arganda-Carreras, I.; Frise, E.; Kaynig, V.; Longair, M.; Pietzsch, T.; Preibisch, S.; Rueden, C.; Saalfeld, S.; Schmid, B.; et al. Fiji: An open-source platform for biological-image analysis. Nat. Methods 2012, 9, 676–682. [Google Scholar] [CrossRef] [PubMed] [Green Version]
  59. Preibisch, S.; Saalfeld, S.; Tomancak, P. Globally optimal stitching of tiled 3D microscopic image acquisitions. Bioinformatics 2009, 25, 1463–1465. [Google Scholar] [CrossRef] [PubMed]
  60. Feser, M.; Gelb, J.; Chang, H.; Cui, H.; Duewer, F.; Lau, S.H.; Tkachuk, A.; Yun, W. Sub-micron resolution CT for failure analysis and process development. Meas. Sci. Technol. 2008, 19, 094001. [Google Scholar] [CrossRef]
  61. Biskupek, J.; Leschner, J.; Walther, P.; Kaiser, U. Optimization of STEM tomography acquisition—A comparison of convergent beam and parallel beam STEM tomography. Ultramicroscopy 2010, 110, 1231–1237. [Google Scholar] [CrossRef]
  62. Sommer, C.; Straehle, C.; Köthe, U.; Hamprecht, F.A. Ilastik: Interactive learning and segmentation toolkit. In Proceedings of the 2011 IEEE International Symposium on Biomedical Imaging: From Nano to Macro, Chicago, IL, USA, 30 March–2 April 2011; pp. 230–233. [Google Scholar]
  63. Novák, V.; Štěpánek, F.; Kočí, P.; Marek, M.; Kubíček, M. Evaluation of local pore sizes and transport properties in porous catalysts. Chem. Eng. Sci. 2010, 65, 2352–2360. [Google Scholar] [CrossRef]
  64. Hildebrand, T.; Ruegsegger, P. A new method for the model-independent assessment of thickness in three-dimensional images. J. Microsc. 1997, 185, 67–75. [Google Scholar] [CrossRef]
  65. Ridler, T.; Calvard, S. Picture thresholding using an iterative selection method. IEEE Trans. Syst. Man Cybern. 1978, 8, 630–632. [Google Scholar]
  66. Penczek, P.A. Resolution Measures in Molecular Electron Microscopy. Methods Enzymol. 2010, 482, 73–100. [Google Scholar]
Figure 1. Schematic illustration of the correlative tomography workflow. Combination of several imaging methods enables an in-depth analysis of the SCALMS system over several length scales. (A) Single SCALMS primary particle (from a batch of primary particle powder, as shown in Figure 2A) in a reactor. Usually, a high number of primary particles (several grams of material) are part of one batch in the reactor (cf. Section 4). (B) Single SCALMS primary particle on top of tomography tip. A pillar is cut via FIB milling to obtain suitable sample dimensions (diameter d ≈ 28 µm) for subsequent (C) LFOV and stitched-HRES nano-CT imaging. In the next step, a smaller pillar (d ≈ 2–3 µm) for (D) 360°-ET is site-specifically prepared via FIB milling. (E) Complementary high-resolution analytical TEM is performed on a site-specifically prepared FIB lamella (thickness ~ 450 nm).
Catalysts 11 00810 g001
Figure 2. Correlative tomography workflow applied to SCALMS sample. (A) SEM overview image of the SCALMS primary particles after synthesis. (B) SEM image revealing the surface structure of the SCALMS system. Large droplets are dispersed on the surface of the macroporous glass. (C) SEM image showing two arbitrarily selected primary particles glued onto a tomography tip for further FIB preparation (top view). (D) SEM image of a FIB-prepared pillar (d ≈ 28 µm) for LFOV and stitched-HRES nano-CT experiments (reprinted with permission from Wirth et al., Cambridge University Press 2019 [15]). (E) SEM image of a smaller pillar (d ≈ 2 µm), prepared from the larger pillar in (D), suitable for 360°-ET experiments. (F) Bright-field (BF) TEM image of a FIB-prepared lamella structure out of the pillar in (D) suitable for STEM-EDXS experiments.
Catalysts 11 00810 g002
Figure 3. Comparison of the utilized correlative tomography techniques: (A) LFOV–PC image of the FIB-prepared SCALMS pillar structure (Figure 2D, sample routine 1) with a diameter of ~28 µm. The red rectangle indicates the position of the pillar structure prepared for the 360°-ET experiment. (B) Stitched-HRES-PC nano-CT projection image showing the same pillar as in (A). The distribution of Ga-Pd droplets (dark spots) is clearly revealed. The position, where the smaller pillar for the 360°-ET experiment was cut out via FIB milling (red rectangle), is not contained in the FOV. (C) HAADF STEM image of the pillar prepared for 360°-ET experiments. Distinct Ga droplets with Pd (bright areas at the edges of the droplets) are revealed. (D) Virtual slice through the reconstructed LFOV-PC nano-CT dataset. The red and blue arrows indicate Ga-Pd droplets in the 3D volume being resolved but with very low detail. Material defects like cracks (yellow arrow) in the glass network are resolved as well. (E) Virtual slice through the reconstructed stitched-HRES-PC nano-CT dataset of the same area as in (D). Ga-Pd droplets (red and blue arrows) and material defects (yellow arrow) are represented with higher precision. Moreover, the macropores of the glass network are resolved and the Ga-Pd droplets are revealed to be embedded in the porous network in a branch-like manner. (F) Virtual slice through the reconstructed 360°-ET dataset revealing bright contrast in the outer and darker contrast in the central areas of the Ga-Pd droplets indicating Pd-rich and Ga-rich regions, respectively. The droplets are embedded in the porous support network in several interconnected pores.
Catalysts 11 00810 g003
Figure 4. Direct comparison of HRES-PC Nano-CT and 360°-ET reconstructions (sample routine 2 in Table 1). (A) Virtual slice through the HRES Nano-CT reconstruction of a pillar with a diameter of 12 µm revealing the structure of the porous support network and of the distributed Ga-Pd droplets. (B) Virtual slice through the HRES Nano-CT reconstruction of a smaller pillar with a diameter of 2 µm, site-specifically prepared from the region indicated with a red rectangle in (A). The data is in excellent agreement with the corresponding virtual slice of (C) the 360°-ET reconstruction of the same pillar volume, but also with the corresponding location in the larger pillar volume in (A). Due to the pronounced Z-contrast and higher resolution, 360°-ET provides a more detailed reconstruction of the embedded Ga-Pd droplets (red arrow) than the corresponding HRES Nano-CT data. (D) FSC calculation determines a resolution of 53.09 nm/48.27 nm at one-bit/half-bit criterion for the Nano-CT dataset in (B). (E) FSC calculation determines a resolution of 11.88 nm/8.10 nm at one-bit/half-bit criterion for the 360°-ET reconstruction in (C).
Catalysts 11 00810 g004
Figure 5. Evaluation of the size and spatial distribution of the Ga-Pd droplets in the LFOV and stitched-HRES nano-CT reconstructions. (A) Virtual slice through the reconstructed stitched-HRES nano-CT volume. The yellow areas indicate the segmented Ga-Pd droplets. (B) 3D rendering of the segmented Ga-Pd droplets within the stitched-HRES nano-CT volume with the color code indicating their size. (C) Particle size distribution (left y-axis, bar chart) of the Ga-Pd droplets (green: stitched-HRES nano-CT, red: LFOV nano-CT). (D) Nearest neighbor (NN) distance distribution of all Ga-Pd droplets calculated from the segmented stitched-HRES nano-CT dataset. The droplet distribution is further illustrated in Figure S7.
Catalysts 11 00810 g005
Figure 6. Pore size evaluation utilizing the maximum sphere inscription (MSI) technique. (A) Color map representation of a virtual slice through the stitched-HRES nano-CT data (sample routine 1) with pore diameters ranging from green to red representing 0–600 nm. (B) Color map representation of a virtual slice through the 360°-ET data (sample routine 1) using the same color scale. (C) PSD (left y-axis, bar chart) determined from the 360°-ET and stitched-HRES nano-CT 3D reconstructions using the MSI method. The cumulative frequency curves (right y-axis) describe the number of pores summed up to the corresponding pore diameter divided by the total number of particles. (D) PSD of the unloaded support framework Trisopor ® 150 (porous silica) using the mercury intrusion technique.
Catalysts 11 00810 g006
Figure 7. STEM-EDXS analysis of the 360°-ET pillar and the thin lamella of sample routines 1 and 3 (Table 1). (A) HAADF STEM image of the pillar of sample routine 1 revealing the distinct structure of the Ga-Pd droplets embedded in the porous glass network. (B) STEM-EDXS map of an exemplary particle marked in (A) showing a core/shell structure with a Ga-rich phase in the center and a Pd-rich phase in the surrounding areas (chemical composition is displayed in wt% scaling with the color intensity from dark to bright). (C) Frequency of measured Ga-Pd ratios ranging from 0.14 to 1.98 determined from 6 individual droplets. (D) HAADF STEM image of the TEM lamella (450 nm thickness) from sample routine 3, enabling STEM-EDXS with higher resolution and precision due to reduced beam broadening and electron/X-ray absorption. (E) HAADF STEM image and (F) STEM-EDXS map (chemical composition is displayed in wt% scaling with the color intensity from dark to bright) of one droplet from the lamella marked with a red rectangle in (D) at higher magnification.
Catalysts 11 00810 g007
Figure 8. SEM-EDXS analysis of the surface area of a SCALMS primary particle. (A) SEM image (secondary electrons) of an exemplary sample area revealing spherically shaped Ga-Pd structures on the surface (bright contrast). The corresponding elemental maps for Ga (green) and Pd (red) reveal a high amount of Ga with dispersed Pd. (B) Bar plot displaying the relative frequency of surface droplets with a certain Ga/Pd ratio determined by SEM-EDXS (69 analyzed droplets). The Ga/Pd ratio varies between 3.00 and 95.83 (black bars). (C) SEM image of another region on the primary particle surface of an exemplary very large structure with a very high Ga/Pd ratio. (D) Particle size distribution of the Ga/Pd droplets on the surface determined from SEM images (169 analyzed droplets). The size varies quite significantly, and especially large structures (green bars) can be correlated to a very high Ga/Pd ratio.
Catalysts 11 00810 g008
Figure 9. Adjusted structural SCALMS model featuring smaller Ga-Pd droplets with a comparably low Ga/Pd ratio inside the porous glass network (volume). The droplets on the surface are typically much larger featuring a very high Ga content.
Catalysts 11 00810 g009
Table 1. Overview of the analyzed SCALMS samples with important parameters of image acquisition and 3D reconstruction.
Sample RoutineCharacterization MethodPillar Diameter
(µm)
Pixel Size of Projection (nm)Number of
Projections
Acquisition Time
(s/projection)
FSC Resolution of 3D Reconstruction
One-Bit/Half-Bit Criterion (nm)
1360°-ET31.3618010.435.44/3.18
Stitched-HRES-PC nano-CT2816.0990124046.66/37.01
LFOV-PC nano-CT2863.89901100134.17/102.22
2360°-ET22.7018010.4311.88/8.10
HRES-PC nano-CT1216.0990124053.10/46.66
HRES-PC nano-CT (ET pillar) correlation216.0990124053.09/48.27
3 (lamella)HAADF STEM450 nm2.218.6--
Publisher’s Note: MDPI stays neutral with regard to jurisdictional claims in published maps and institutional affiliations.

