Article

Pragmatic Approach toward Catalytic CO Emission Mitigation in Fluid Catalytic Cracking (FCC) Units

BASF Corporation, 25 Middlesex/Essex Turnpike, Iselin, NJ 08830, USA
*
Authors to whom correspondence should be addressed.
Catalysts 2021, 11(6), 707; https://doi.org/10.3390/catal11060707
Submission received: 16 May 2021 / Revised: 29 May 2021 / Accepted: 1 June 2021 / Published: 3 June 2021

Abstract

:
The need to mitigate the environmental footprints of refineries in a sustainable and economical way is widely accepted, yet there appears to be a lack of a unilateral pragmatic approach towards CO oxidation to CO2 among the refining community. In this work we share CO promoter design strategies that can afford a tangible and immediate CO conversion efficiency increase without a need for additional precious metal loading. The key focus is on the support material architecture that is essential to boost the CO conversion and reduce the NOx generation in the FCC unit. It was demonstrated that the suppression of Pt sintering as well as the enhancement of the oxygen mobility on the catalyst surface can afford an ~40% lower cost of Pt and ~20% lower usage rate compared to current industry-standard designs.

Graphical Abstract

1. Introduction

The ever-more stringent environmental regulations on air pollution, especially that caused by the oil refining industry, are drawing more efforts by refineries to combat these harmful emissions [1]. Some examples of the emissions of concern are CO, NOx, HCN, and SOx, to name a few—all of which can cause substantial harm to the environment, and human and animal health.
In this work, we focus on the CO and NOx emissions as these are common and critical concerns during FCC catalyst regeneration as part of oil cracking. Moreover, the mitigation of such pollutants is now part of most oil refiners’ commitment to sustainability [2]. The regenerator and related catalyst logistics are schematically presented in Figure 1. Specifically, incomplete coke combustion in the FCC unit regenerator may lead to CO and O2 breakthrough into the dilute phase [3,4]. The resulting combustion of CO in the dilute phase, referred to as afterburn, can produce high temperatures, which can damage regenerator internal hardware, and, therefore, cause an FCC unit outage [5]. While seemingly minor, such a sequence of events would cause a major disruption in a refinery operation and would also lead to substantial financial loss. Even without an outage, concerns around afterburn would lead refiners to run their FCC units at suboptimal conditions, hindering them from reaching full potential of their process and catalyst.
To mitigate CO emissions, refineries typically use CO promoters that catalyze CO oxidation to CO2 in the dense bed. An additional benefit for CO promoters is improved air utilization. A CO promoter can typically be introduced as part of the FCC catalyst formulation or as a standalone additive. The CO promoter is usually based on highly dispersed supported platinum or palladium that can catalyze the oxidation reaction. The choice of metal is driven by a combination of regulatory certification, current emissions as well as budget for a given FCC unit operation. Typical CO promoter addition rates are 2–5 pounds of additive per short ton fresh FCC catalyst, which often corresponds to ~1–3 ppm platinum group metal (PGM) level in the circulating catalyst inventory [6].
Over the past years there have been numerous contributions to the field of CO oxidation chemistry. These include extensive and fundamental studies using advanced techniques, many summarized in recent review articles [7,8]. In this contribution, however, we focus predominantly on the CO promoter designs relevant to the refining industry with a focus on actual real-life industrial performance rather than fundamental mechanistic insights as to the nature of the occurring chemistry. Pt has been selected as the PGM of choice for this set of experiments. We aim to share the conceptual approach to pragmatic Pt-based CO promoter design as well as the underlying considerations and concepts that are economically viable and can find applications in actual FCC units worldwide.

2. Experimental

2.1. Material Synthesis

A series of reference and experimental catalysts was prepared, the full list is provided in Table 1. In all cases, γ-Al2O3 microspheres with a typical D50 of 80 µm and a total surface area (TSA) of 90 m2/g were used as the alumina support. Commercially available cerium nitrate and strontium nitrate, industrial grade in all cases, were used as precursors to form the doping package for the alumina support. An aqueous solution of Pt-nitrate, with a typical Pt content of 10 wt % was used as the PGM source. Both dopants as well as PGM were deposited via incipient wetness impregnation to afford even metal distribution on the support.
Reference catalysts 1–3 were prepared by impregnating the alumina support with the aqueous platinum nitrate solution such that the desired final metal concentration was achieved. Experimental Catalysts A–D were prepared by first impregnating the alumina support with cerium-nitrate such that the desired final CeO2 concentration was achieved. The support was then calcined at 550 °C for 2 h. Subsequently, the desired amount of the Pt nitrate solution was impregnated onto the ceria/alumina support. Catalysts E-F were prepared by first impregnating the alumina support with an aqueous mixture of cerium- and strontium-nitrates such that the desired final CeO2 and SrO concentrations were achieved. The support was then calcined at 550 °C for 2 h. Subsequently, the desired amount of the Pt nitrate solution was impregnated onto the ceria/strontia/alumina support. For all presented catalysts, upon Pt deposition, all samples were calcined at 550 °C for 2 h.

2.2. Catalyst Characterization

All catalysts were characterized after synthesis. The surface area measurements were performed using Micromeritics TriStar models 3030/3020. The surface area in all cases was quite similar with the Pt/Al2O3 samples having a typical TSA of 90 m2/g, Pt/CeO2/Al2O3 as well as the Pt/SrO/CeO2/Al2O3 catalysts having a typical TSA of 80–85 m2/g. The catalyst composition was determined using the Inductively Coupled Plasma (ICP) test on a Thermo iCAP 7400. The compositions of each presented catalyst are summarized in Table 1.

2.3. Catalyst Testing

Catalysts were tested as-is, also referred to as “fresh” state, as well as after a simulated aging, referred to as “aged”. The aging conditions as well as details of the experimental setup are reported in the description of the specific experiment in the results section. The absolute conversion levels were measured at the Chemical Process and Energy Resources Institute (CPERI) located in Thessaloniki, Greece. A spent FCC catalyst was used for the base case tests, while for the evaluation studies mixtures of 1 wt % of the additive and 99 wt % of the spent catalyst were loaded on the reactor. All presented data is reported as the difference compared to the promoter-free base emission. Prior to testing, all catalytic materials were sieved to 63–106 μm. The accuracy of the reported CO and NOx emissions values was determined by performing a statically relevant number of repetitions. For the chosen reactor setup and under the specific experimental conditions reported in this study, an average variation of ±5% was determined. The reaction conditions for the chosen test protocol are reported in Table 2.
The CO conversion (%) as well as NOx generation (%) values were calculated using the formula reported in Equation (1).
CO   or   NO x   % = 100 × CO   or   NO x Base   Case CO   or   NO x Promoter CO   or   NO x Base   Case
Equation (1). The formula used to determine the CO conversion (%) as well as NOx generation (%) values is reported.

3. Results and Discussion

3.1. Promoter Pt-Loading

The impact of Pt-loading on the activity of a typical CO promoter is demonstrated using the example of the reference catalysts 1–3 (Pt/Al2O3) with different Pt-loadings (see Table 1). Overall, there appears to be essentially no difference between the three chosen Pt-loadings when the overall catalyst design is identical. At first, this result may be somewhat surprising as this observation would suggest that a large fraction of the precious metal is apparently not contributing to the catalytic activity. However, the observation may relate to the chosen synthetic pathway and the resulting relative size of the Pt-clusters on the support surface. From prior reports on spectroscopic studies of precious metal catalysts [9,10], in a 1 nm Pt particle the ratio of surface Pt to Pt forming the core of the particle is ~1:1. With growing particle size, the average Pt coordination number will grow and, as a result, in a 20 nm Pt particle the surface Pt atoms account for approximately 5% of the total metal forming the said particle. Considering the particle size for a typical industrial catalyst, such as those presented here, increasing Pt loading on the support further leads to ever-diminishing returns as the available Pt surface area is essentially unchanged as the diameter of the Pt clusters is increased. Therefore, while some refineries may choose to increase the precious metal levels to combat growing CO emissions, the benefit of such an approach is limited and inherently inefficient.
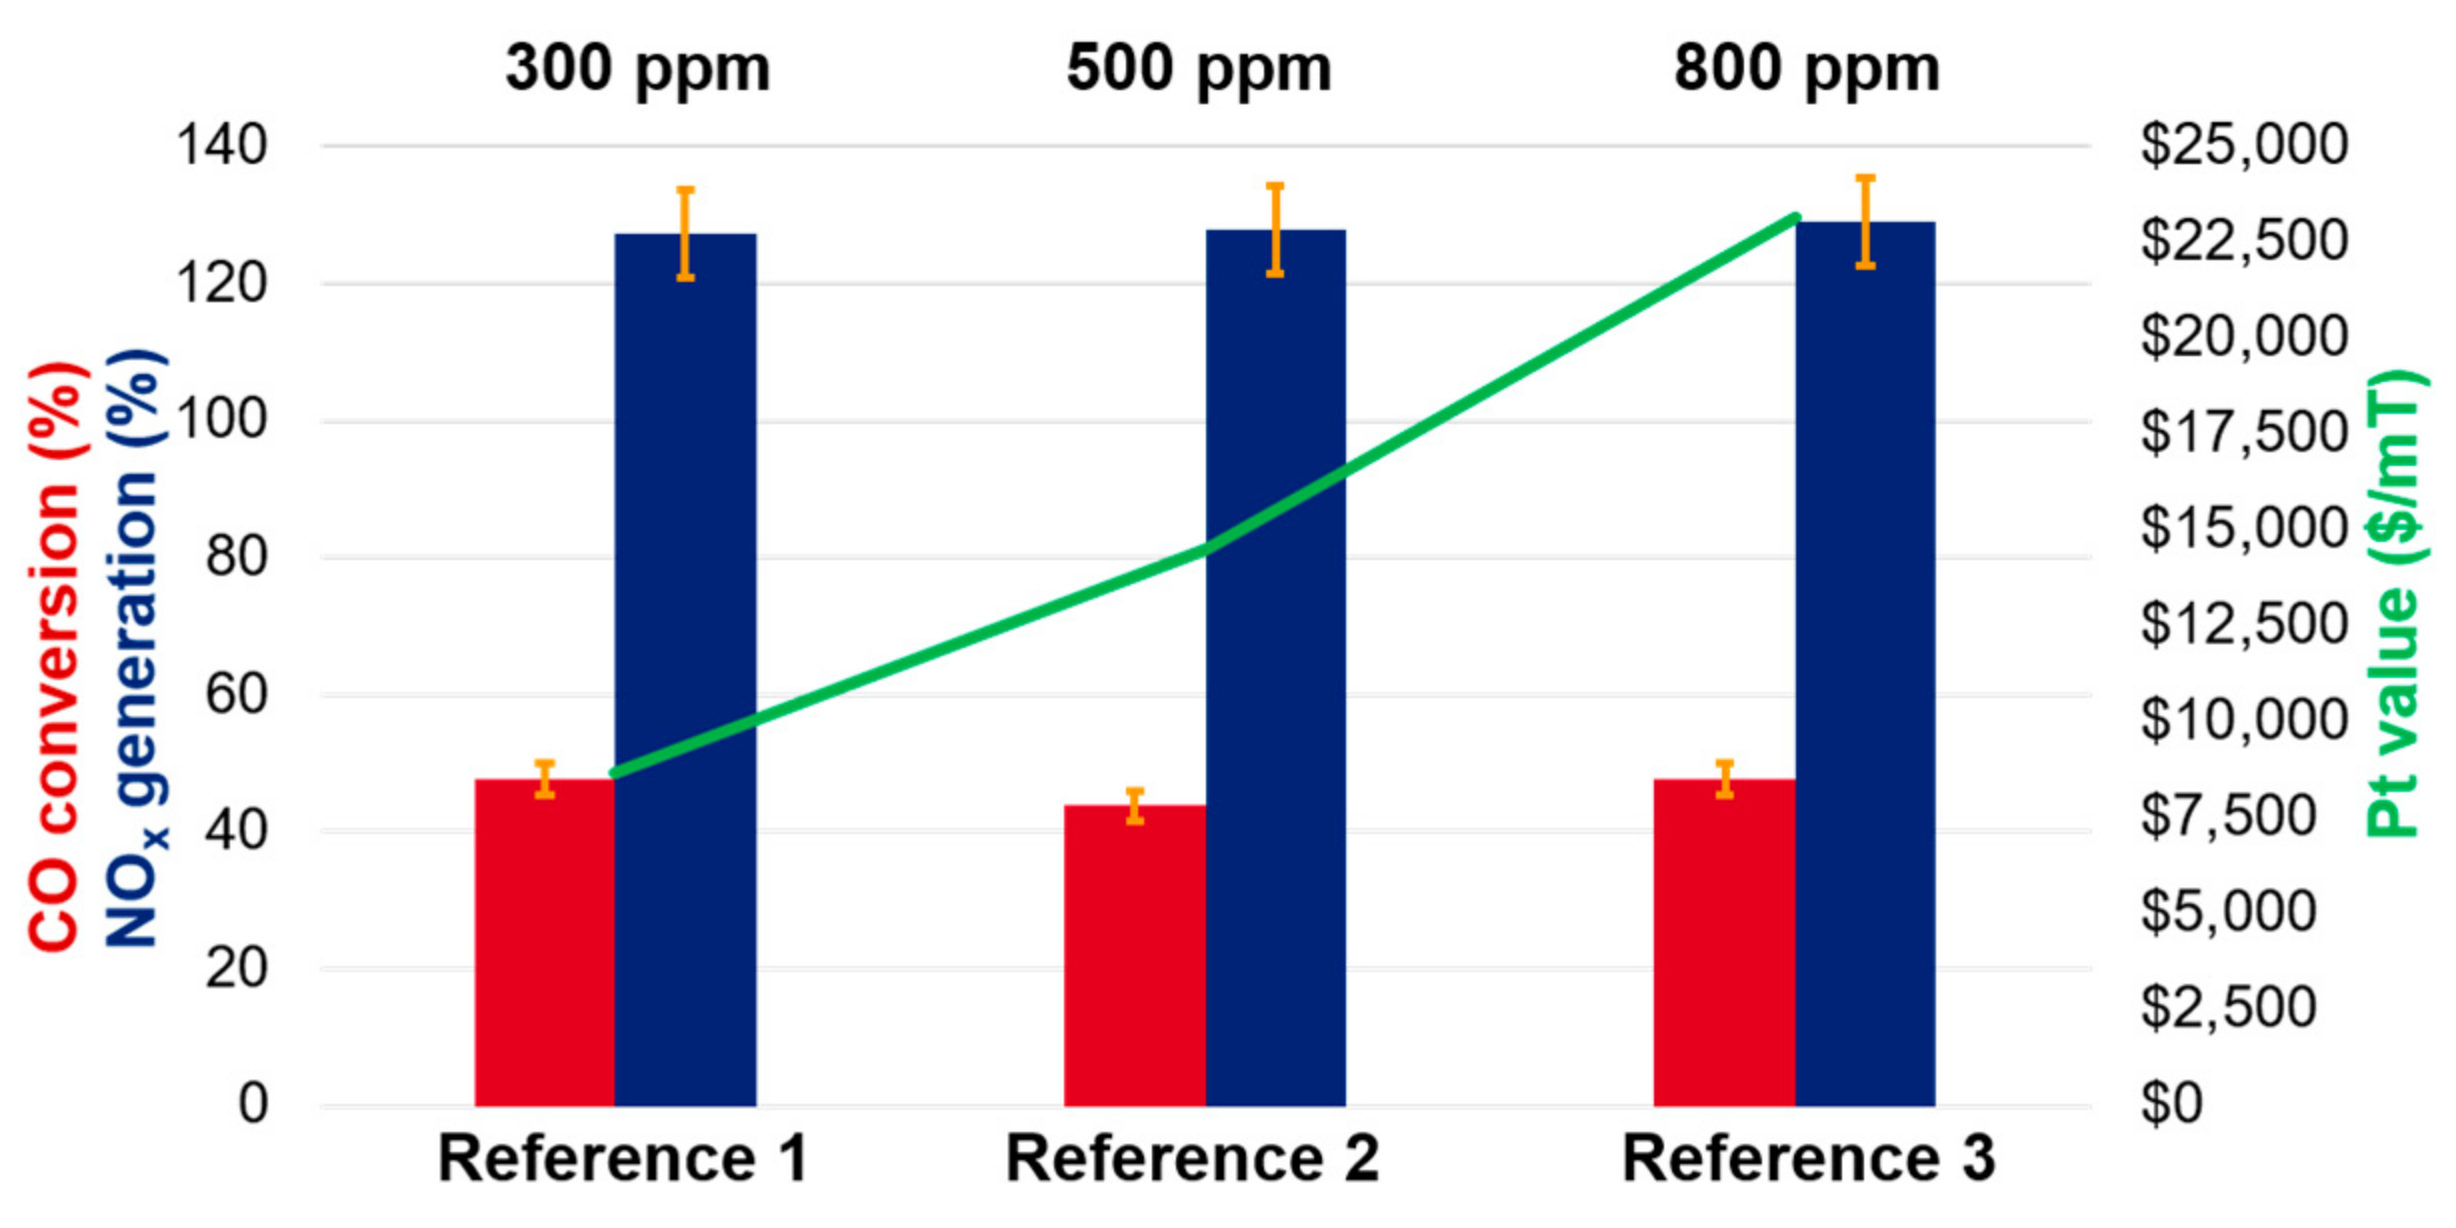
An example of this is demonstrated using reference catalysts 1–3, which differ only in the amount of Pt deposited onto the support. From Figure 2, within the experimental uncertainty, the efficiency for CO conversion as well as NOx generation in the fresh state is similar in all cases. The key difference is in the actual cost to the refiner ($/mT) of Pt used, which ranges from ~8700 $/mT to ~23000 $/mT (at 900 $/oz t Pt market price, a reasonable average value in the 2016–2020 timeframe) [11]. Note that the financial impact increases with the growing (USD ~1200/oz t) Pt market price, as has been experienced in late 2020 and early 2021 [11].
Therefore, while a refinery may be under the impression that superior performance is obtained through a higher amount of metal, the actual value proposition diminishes substantially with increasing Pt loading. That is, on a relative basis, when the support material is identical in all cases, the oxidation of a CO molecule to CO2 is ~2.6-times more cost-effective with reference-1 than with reference-3, when the value of the Pt is considered. These considerations, of course, are true when the total concentration of the CO promoter component in an FCC blend is constant and only the PGM amount allocated on this component is increased. An alternative scenario would be for a refinery to increase the total Pt content by increasing the amount of CO promoter in the blend. For example, instead of using 0.25 wt % CO promoter with 1000 ppm Pt, the FCC blend could be formulated using 0.5 wt % CO promoter with 500 ppm Pt. In this case, the benefit of increasing the total Pt in the FCC unit is more pronounced, and in certain cases may lead to the desired improvement of the apparent CO conversion. However, such an approach will typically also lead to a significant NOx emission increase, a much undesired side-effect that in certain areas with very tight emissions regulations, e.g., California, would not be a viable solution. Beyond the NOx concern, most of the precious metal in such an FCC blend would still remain inactive since it forms the core of the PGM-particles. Overall, such an approach could be considered a better of the two poor solutions. Indeed, there are many other, cost-efficient, means to consider before the Pt content is increased, as we will discuss in subsequent paragraphs.
We note at this point that the support used for the catalyst adds further, in some cases significant, costs to the overall Pt promoter design. As Pt loading has limited benefit, we hence focus on the maximization of Pt utilization through support tuning, which is a far more efficient and cost-effective way to reduce CO emissions when the total refinery spend on environmental compliance is considered.

3.2. Promoter Doping

To demonstrate the potential of catalyst support modification towards improved activity, we explore the impact of support doping. In this work, the impact of catalyst doping with ceria is demonstrated using the 300 ppm Pt reference-1 as well as a series of catalysts A–D composed of 300 ppm Pt supported on alumina with different levels of CeO2 (see Table 1 for details). The reference CO promoter achieves a 47.6% conversion of CO to CO
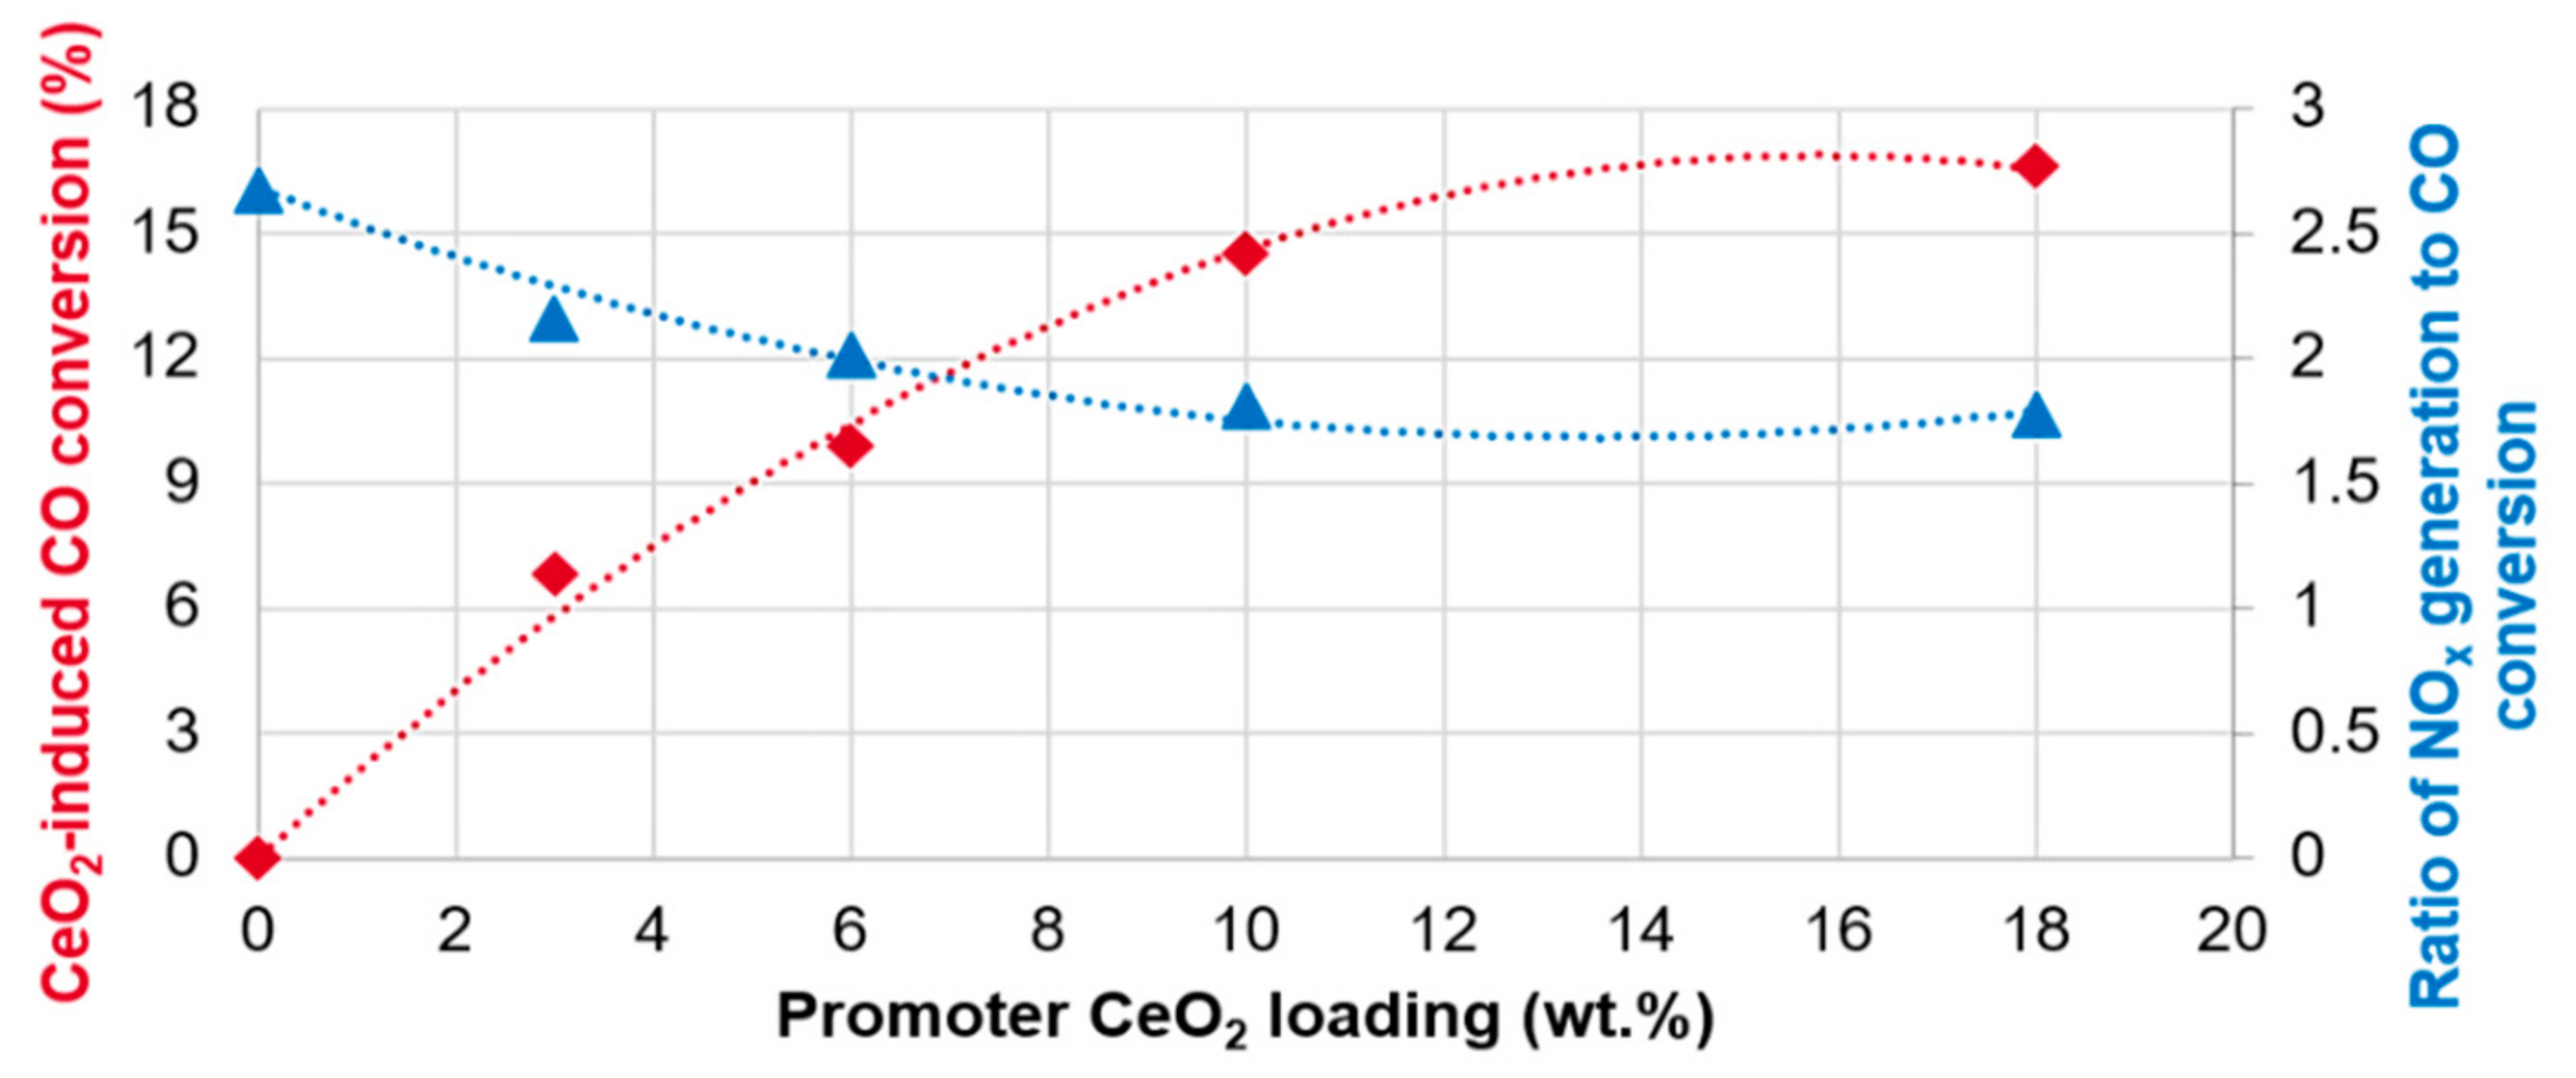
2 under chosen experimental conditions. This will be used as baseline for further assessment of the impact of ceria as an improvement of the CO conversion is observed with increasing amounts of ceria. These results are summarized in Figure 3.
We observe a nearly linear CO conversion improvement between 0% and ~10% CeO2 doping of the CO promoter. Beyond ~10%, the impact of ceria is greatly diminished with only minor improvement in ever-increasing CeO2 loading. There are at least two possible reasons why the addition of ceria is beneficial to the promoter performance when measured in fresh state. First, ceria itself is known as an oxidation catalyst [12,13] that can convert CO to CO2 at elevated temperatures, either by itself or as a mixture with further oxides, e.g., CuO [14]. Second, the chosen aging and testing conditions may be quite favorable for the doped CO promoter. The testing temperature of 700 °C, when the thermal stability of ceria is considered, is quite mild and does not affect the ability of ceria to serve as an oxygen storage component (OSC) [15]. The addition of OSC, whether in the form of ceria/zirconia or ceria by itself, to PGM is a well-known concept in the field of mobile emissions control [16] and has been shown to allow for optimized surface O2 concentration on the PGM surface, thus maximizing the metal efficacy for CO oxidation [17].
The diminishing benefit of increasing ceria content above ~10% is explained by several factors: (1) kinetic limitation of the reaction under chosen testing conditions and (2) the way the discussed promoters were prepared. As an example, the degree of the OSC capacity utilization is expected to decrease with increasing CeO2 content due to mass transfer limitations and the inaccessibility of a portion of ceria in the CeO2-particle core.
Another important observation for the presented sample set is that the addition of ceria leads to a decrease in NOx generation by as much as ~10% (Table 1). This feature is important as some refineries, especially those with a high Nelson complexity index (NCI), prefer to view the CO promoter performance as a ratio of CO conversion benefit balanced by the NOx penalty. That is, one can assess promoter efficiency based on how much NOx is generated per molecule CO that is oxidized. The ratio of NOx generation to CO conversion for the studied sample-set is reported in Figure 3. Interestingly, while for every 1% of CO conversion the reference, ceria-free, promoter generates ~2.7% additional NOx emission, the addition of 10% ceria allows one to decrease the NOx generation to ~1.8% per 1% CO conversion. Therefore, the addition of ceria has not only allowed boosting the absolute CO conversion levels, but also to decrease the relative NOx emissions by as much as ~33%, a very significant value for most oil refineries. Again, it should be noted that, similar to CO conversion, the NOx benefit becomes marginal beyond ~10% CeO2 content.
While there is a multitude of factors affecting the NOx generation, there are at least two that we propose relevant to explain the observations in this work. Suggested causes are surmised and are the focus of an ongoing research project outside the frame of the current contribution. First, the addition of ceria is suggested to affect the rates of CO and NO oxidation shifting the balance in favor of CO. Second, under chosen reaction conditions ceria can contribute to the apparently lower NOx emissions by trapping a portion of the NO2, a product of NO oxidation, in the form of ceria-nitrate. Examples of NOx-traps using PGM/ceria components have been previously reported in the field of mobile emissions control [18,19]. Such a mechanism is suggested favorable for a CO promoter geared towards applications in the oil refining industry. As an example, the promoter can trap a portion of the generated NOx in the regenerator. Subsequently, as the promoter circulates through the FCC unit, cerium nitrate can be regenerated in the riser to ceria while releasing NOx, which in turn can be converted to ammonia and thus removed at the top of the riser column. The regenerated ceria is then ready for the subsequent regenerator cycle. It is worth noting that while the effect is likely significant to help boost CO conversion, the typical amounts of promoter in the FCC catalyst blends (often around 1 wt %) are generally insufficient to dramatically shift the refinery NOx emission. Therefore, the proposed NOx emissions reduction is generally considered less efficient than the installation of a stationary NOx-scrubber that operates via selective catalytic reduction (SCR) of NOx with ammonia [20].

3.3. NOx Emission Suppression

To supplement the NOx observations discussed in the previous chapter, a series of experiments were performed using formulations that in addition to ceria also incorporated further NOx-trapping components, similar to those typically reported for Lean NOx Trap (LNT) diesel applications in mobile emissions control [
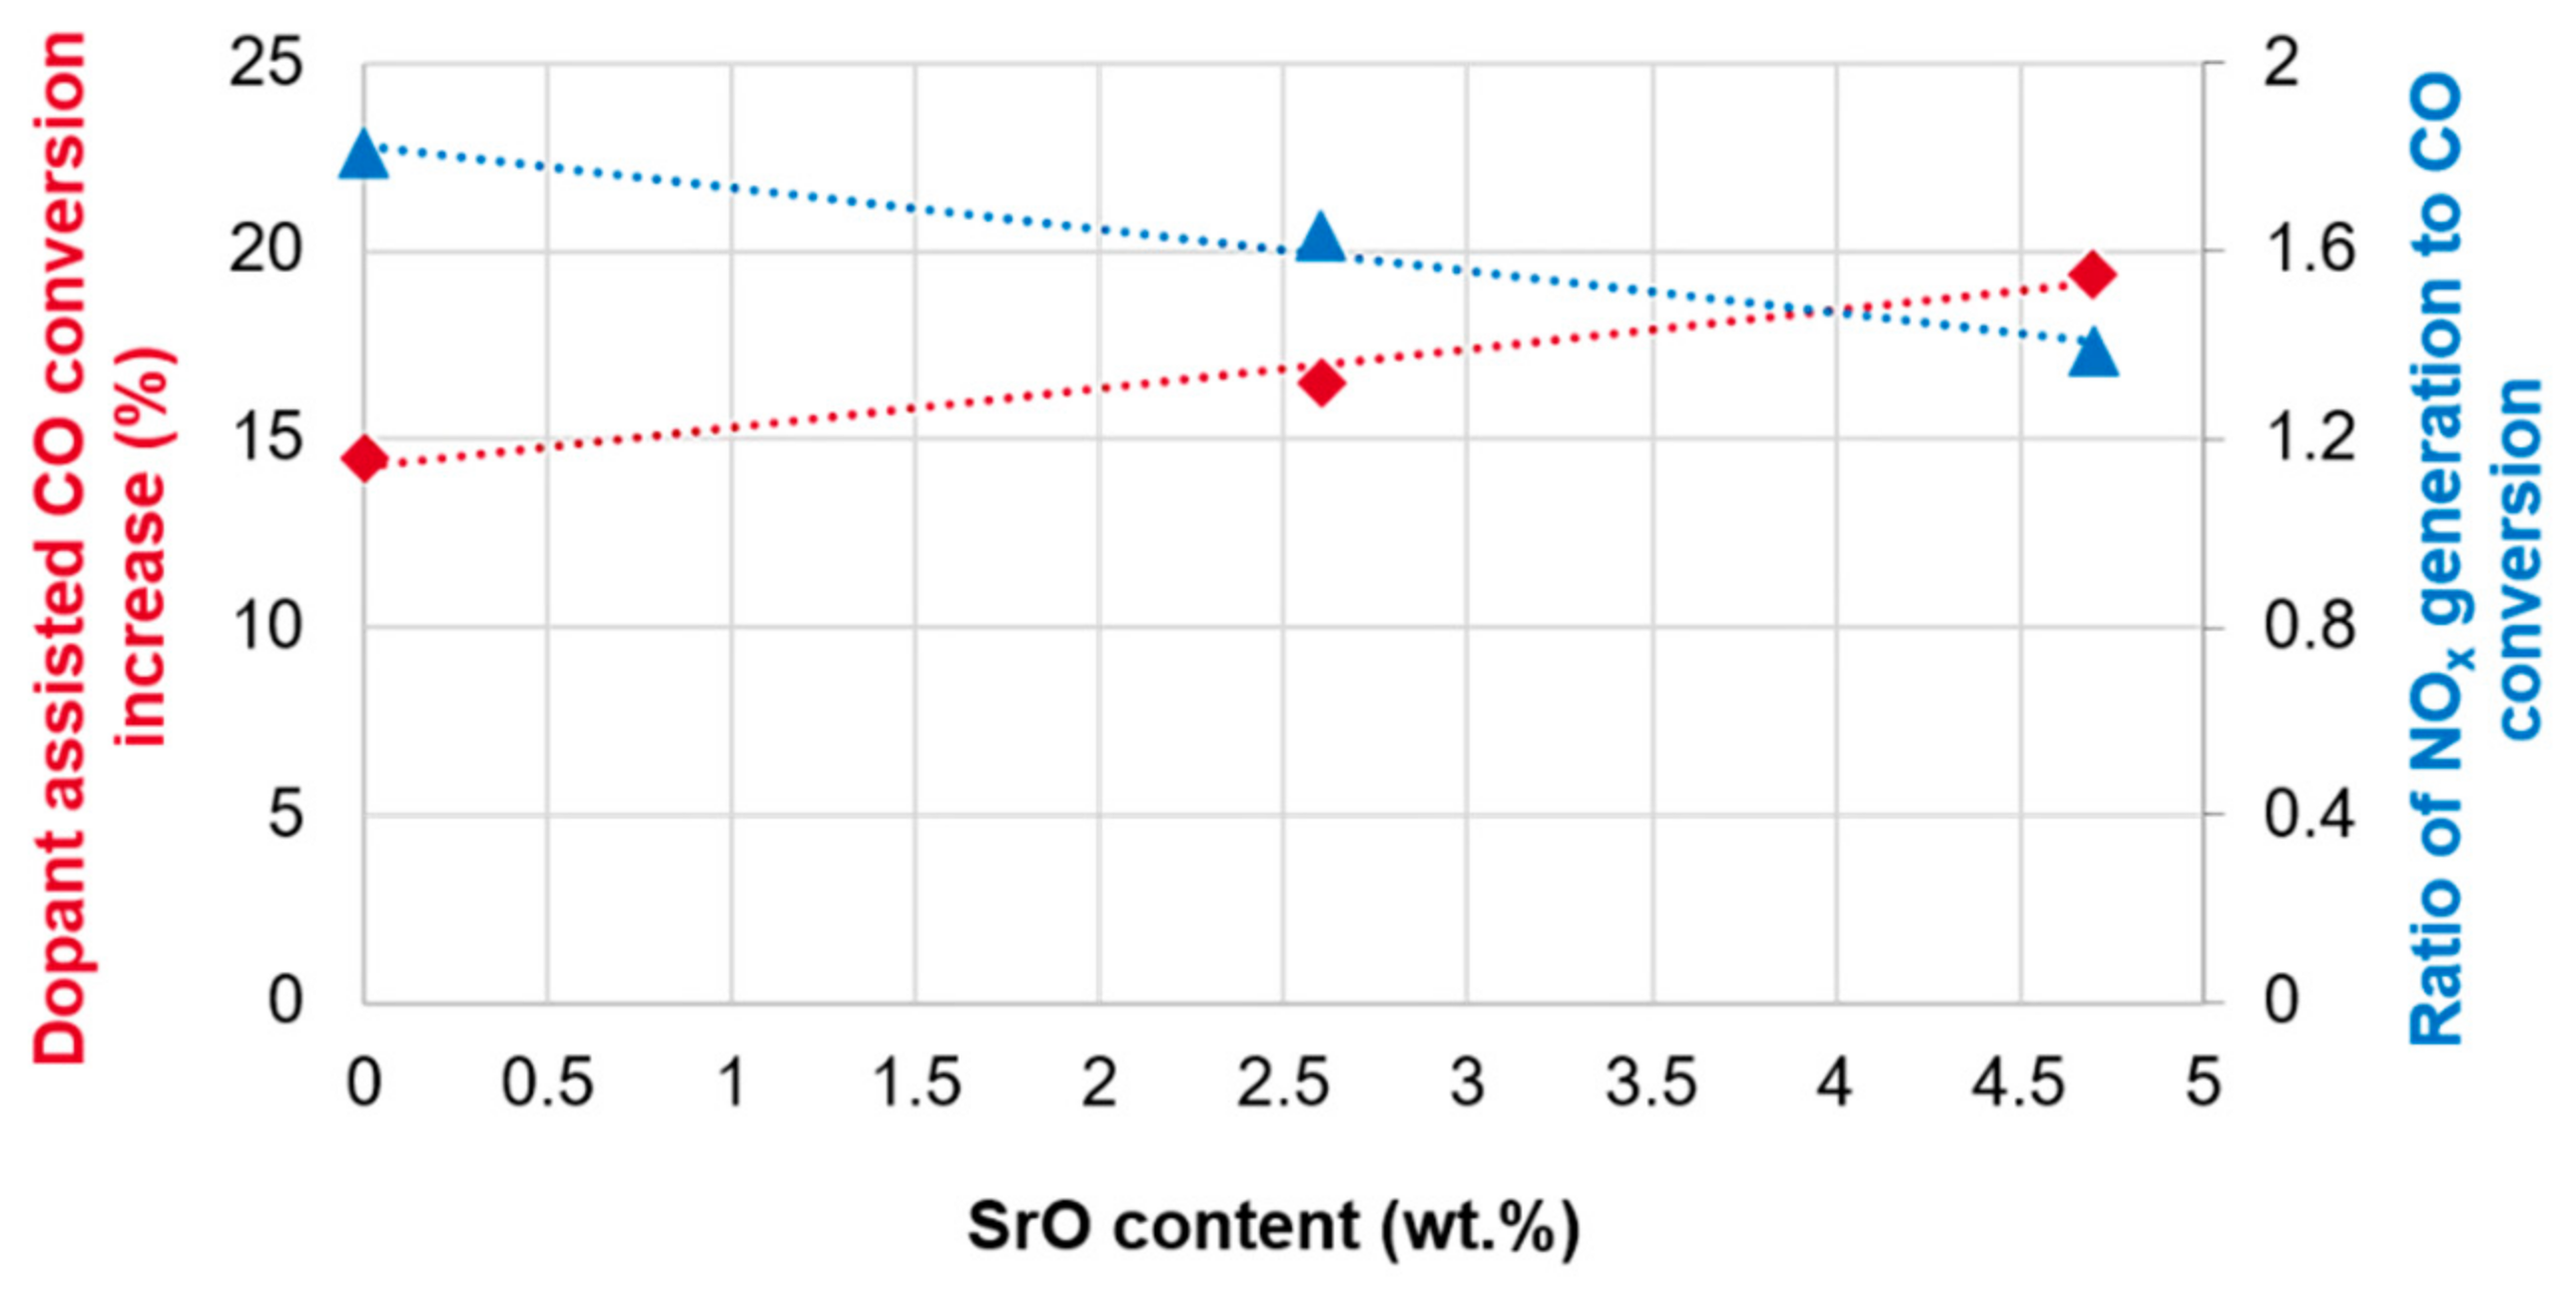
21]. Two additional samples, catalyst E (catalyst C doped with 2.6% SrO) and catalyst F (catalyst C doped with 4.7% SrO), see Table 1, were prepared and compared in their CO conversion as well as NOx generation activity to catalyst C, which is one of more active promoter designs discussed in present work. The CO conversion and NOx generation values for these catalysts are reported in Table 1. Sr, specifically in the form of SrO, has been widely proposed to manage NOx emissions in the past and is hence a suitable example of such chemistry [22,23]. Further comparison of the impact of SrO on overall activity is shown in Figure 4.
It should be noted that the addition of SrO to catalyst C leads to a near-linear improvement (Figure 4) in both CO conversion increase and NOx generation reduction, which suggests these reactions are closely coupled. The observation is explained by the ability of SrO to trap NO2 in the form of strontium nitrate, which can then be decomposed in the riser to yield ammonia and the regenerated SrO, much like the mechanism described for CeO2 in the previous chapter. The key difference here is that SrO, due to its nature, cannot contribute to CO oxidation. In turn, this means that while SrO selectively stores NO2, a larger amount of the ceria remains available to oxidize CO rather than be “deactivated” by NO2 adsorption. This operation is very similar to that of a typical LNT design for diesel emissions system applications, where the NOx-trapping function is partially decoupled from CO and hydrocarbon oxidation to maximize catalytic efficiency [24].
With the potential NOx emissions suppression in mind, it is not obvious that the addition of a dedicated NOx-trapping component is the most practical approach towards NOx management in a refinery since the necessary amount of such SrO-based trap would need to comprise a substantial amount, e.g., 10–20%, of the FCC formulation, which is not a viable approach towards NOx mitigation in most existing FCC units.

3.4. Impact of Aging

Two catalysts are chosen for further testing to assess the impact of promoter aging on performance under conditions typical of an FCC unit. Specifically, two designs are compared here, these are reference-2, a 500 ppm Pt containing promoter that is similar to those designs often used in commercial applications, and catalyst C, 300 ppm Pt and 10% CeO2 containing promoter design that has shown optimal NOx/CO ratio, as discussed in previous chapter. Additional information on these two catalysts is provided in Table 1. It is important to note that while at first glance the comparison may not seem direct or fair, we focus on a real-life type of application, where a refinery would consider one or two catalysts at most when selecting the CO promoter for their application. Ultimately, what is most critical, is the highest efficiency per unit catalyst, i.e., lb or kg, rather than specific elemental composition, as this approach allows for a minimization of the monthly CO promoter spend at the refinery.
There are two types of aging tests that were developed for this workstream. First, a steam-aging, which is used to simulate the regenerator portion of the FCC operation cycle. Here, we chose a 12 h aging duration with a Tmax = 787 °C using a sealed steam reactor that is filled with a 90% H2O-steam/10% N2 mixture. Second, Lean/Rich (L/R) aging, which is more typical for a mobile emissions control testing setup, e.g., for a very lean diesel engine, that mimics the full FCC unit operation cycle. This aging is also 12 h in duration, reaches a Tmax = 780 °C and is performed using a flow-through reactor that cycles with 10 min Air, followed by 10 min N2, followed by 10 min H2, followed by 10 min N2, while at a constant 10% H2O-steam in every step. Due to powder bed penetration difference between air and H2, the 10 min H
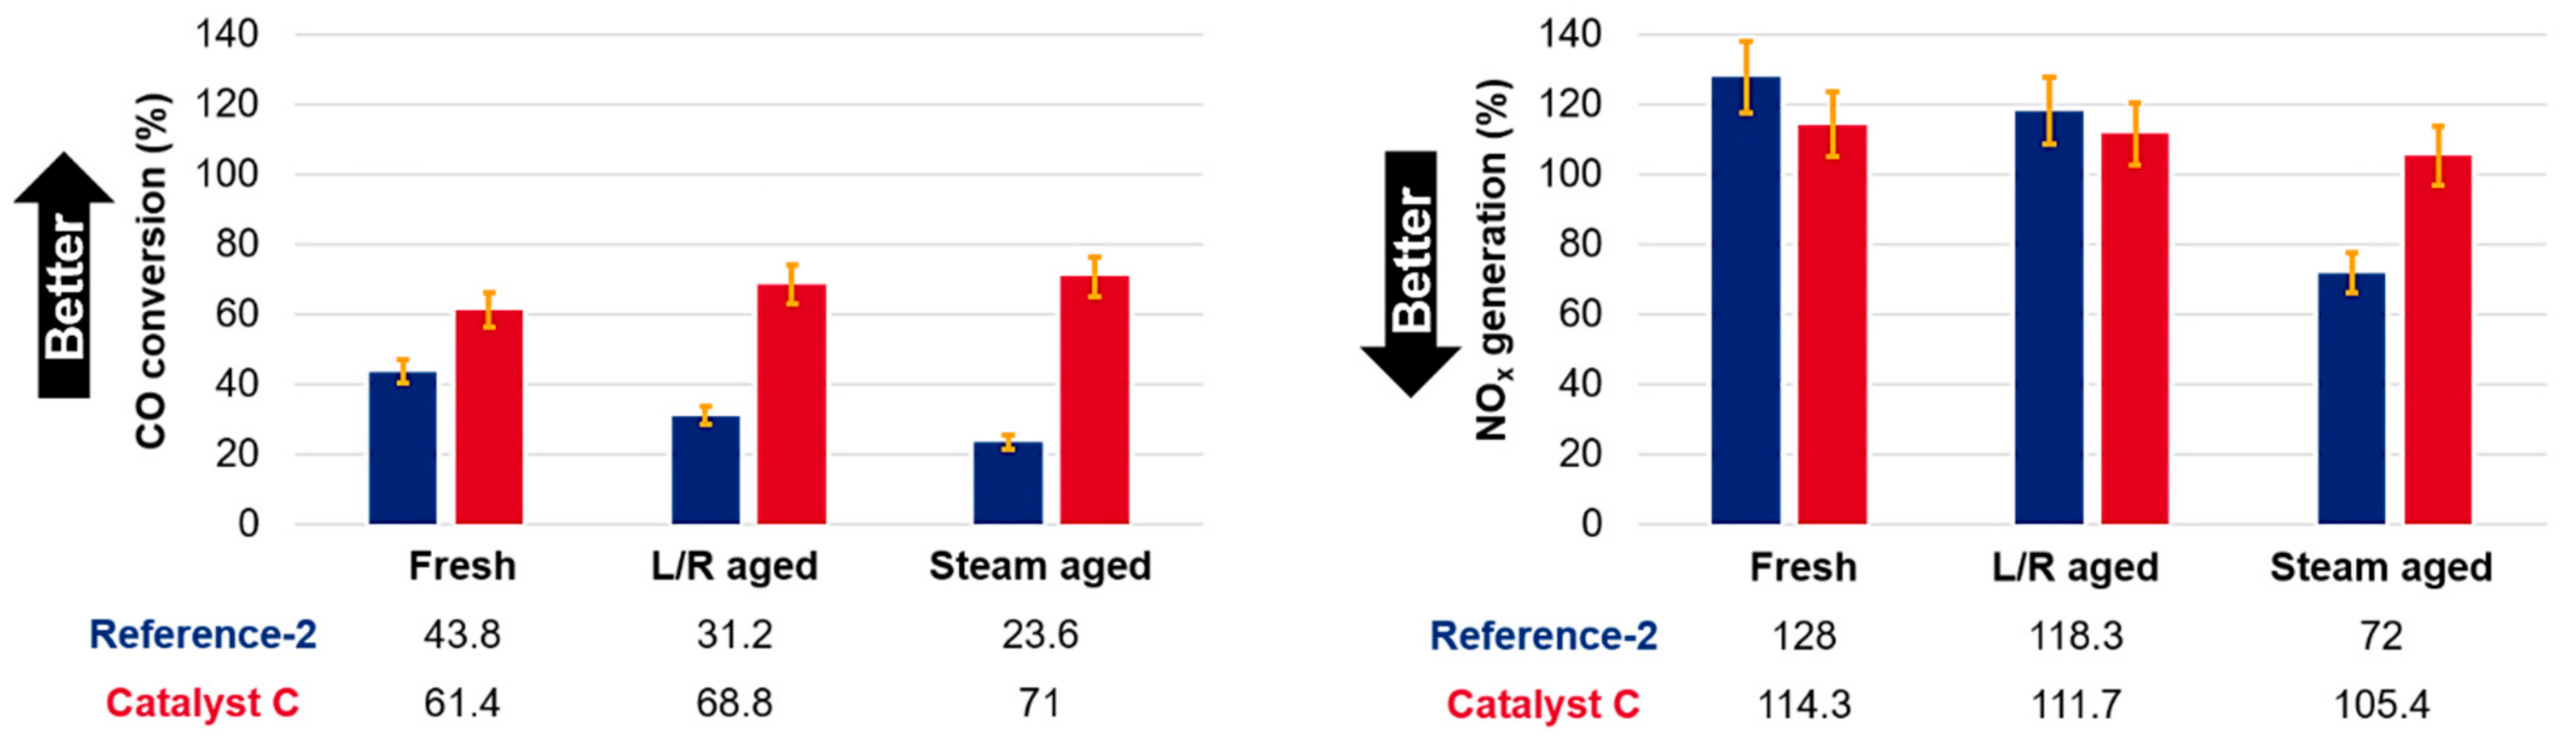
2 reduction is equivalent to ~1 min reduction using hydrocarbons. This point is important as it simulates the relative time a CO promoter spends in the FCC unit, i.e., ~90% of the lifetime in the regenerator and ~10% lifetime in the riser, where the promoter can be regenerated. The comparison of the said two samples in fresh as well as aged form is shown in Figure 5.
The superiority of catalyst C to the reference-2, regardless of the lower Pt content in the experimental sample was expected based on fresh testing. However, the extent of the aging on the said catalysts was not obvious prior to testing. For CO conversion, the CO activity of the reference-2 design is decreased by 25–50% depending on the aging type, with steam aging being particularly harmful.
At this point we believe it is necessary to provide a side note on the nature of Pt aging as often observed in mobile emissions control, e.g., for diesel-type emissions mitigation systems. Pt is quite mobile in the oxide form and stable in metallic form when it comes to sintering or Ostwald ripening [25,26]. What this translates to is an elevated degree of mobility on the surface that ultimately leads to a higher extent of agglomeration upon aging in the absence of reductants. Therefore, while both aging protocols in this work had a nominal duration of 12 h, the actual time Pt was subject to oxidation was different, with more favorable conditions in the L/R aging case. Since Pt was offered the occasional regeneration step, that in turn has led to an apparent higher degree of CO activity after the 12 h L/R aging cycle compared to steam aging. The key learning here is that the promoter aging protocol must be chosen such to best suit the actual refinery operation. In turn, this approach not only allows the correct promoter dosing and durability estimate, but also a fair comparison of competing catalyst technologies (e.g., as part of catalyst vendor bids).
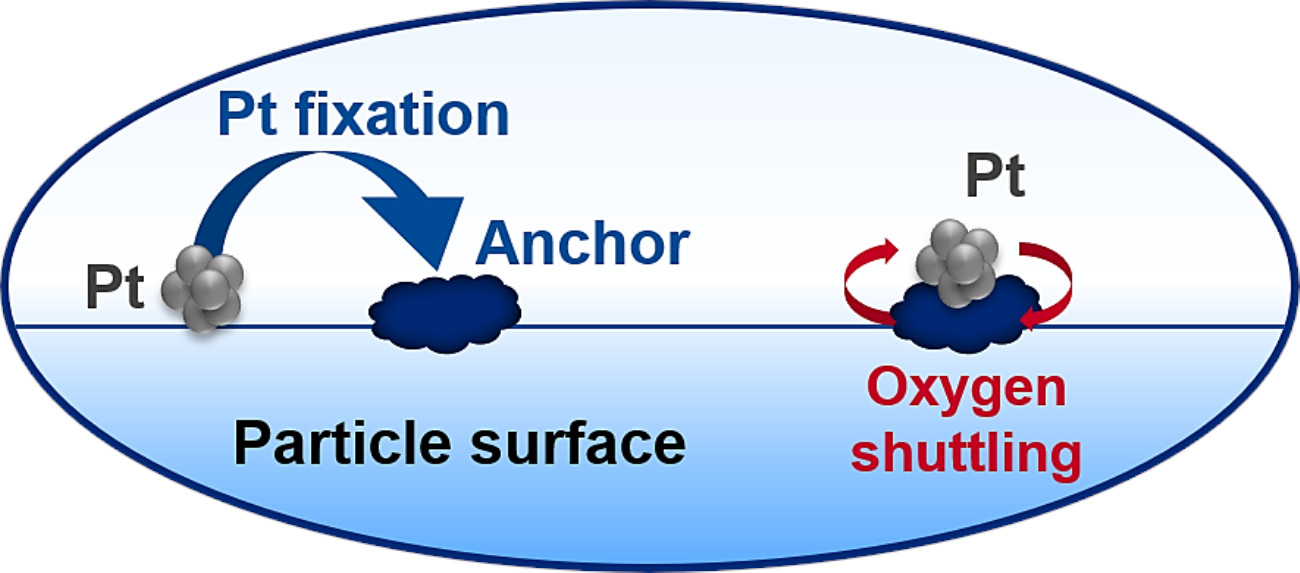
With the above in mind, the remarkable stability of catalyst C after both aging protocols deserves a further explanation as the performance appears to improve slightly with aging. There are two key reasons for this observation. First, the CeO2 that is present in catalyst C will exhibit some CO activity on its own, as discussed previously. The aging conditions chosen in this work are generally below temperatures that are considered harmful to ceria, i.e., cause structural collapse and stop oxygen mobility [27]. Therefore, the CeO2-contribution to CO oxidation is essentially unaffected. Second, likely even more prominent, ceria when introduced to the promoter design in an appropriate manner, can serve as an anchoring point for Pt as the affinity of Pt to CeO2 is known to exceed that of Pt to Al2O3 [28]. Therefore, as the aging begins, Pt that may be randomly distributed on the surface of the promoter particle, is quickly anchored on the surface of ceria domains. This in turn means that Pt is given little opportunity to find further Pt particles and sinter into larger Pt clusters on the promoter surface. The large number of small anchored Pt particles offers a significantly larger apparent Pt surface area that is available for the CO oxidation reaction. Additionally, ceria can stabilize Pt at atomic dispersion which is active for CO oxidation but not for dehydrogenation chemistry [29,30]. Finally, while it is not possible to completely exclude some degree of Pt encapsulation with ceria, the relatively mild aging temperatures [31], as compared to some of the most aggressive environmental catalysis type aging conditions [32], lead us to surmise that the anchoring of Pt with ceria has a significant net-benefit effect over a simpler Pt/Al2O3 type design under operation conditions typical of a refinery FCC unit.
As for NOx generation, the same general observations and explanations as those discussed for CO conversion are still valid. The decrease of the Pt surface area due to sintering leads to diminishing NOx emissions. For Catalyst C, the NOx generation is much more stable, regardless of aging, which serves as an indication of the excellent stability and durability of this promoter design. The latter observation is critical when it comes to real-life applications: refiners are interested in a stable mode of operation with little to no fluctuation of the emissions performance. A promoter such as reference-2 would need to be continuously dosed, either via loader or as part of additional FCC catalyst to maintain average CO conversion activity. In contrast, a design such as catalyst C will allow the refinery to reduce the overall tonnage of the promoter needed monthly. Specifically, for the case exemplified here, one could use ~20% less CO promoter on a weight basis when switching from reference-2 to catalyst C without a sacrifice in CO activity. At the same time, the NOx emissions would be reduced by ~10–15%. Most importantly, not only would the price per unit promoter ($/kg) be reduced by 40% based on the Pt-loading related value, but the overall cost of CO promotion would be reduced as a function of lower monthly consumption. Furthermore, the improved durability of the promoter would reduce the risk of non-compliance and the amount of effort, especially in regard to monitoring as well as the actual staffing necessary to maintain promoter levels in the unit, thus simplifying the day-to-day operations for the refinery.

4. Conclusions

We have demonstrated that the best strategy to mitigate CO emissions from an FCC unit is to focus on the underlying chemistry rather than PGM dosing. Pt can be effectively anchored on the support by a choice of an appropriate doping package that can suppress Pt sintering. The resulting synergy between the largely retained Pt surface area and the intrinsic activity of the support allows for a substantial increase in promoter efficiency without increasing the Pt content. For instance, CeO2 is shown to greatly affect CO conversion as well as to have a positive effect on apparent NOx emission, while at the same time allowing prolonged promoter durability. SrO can be employed to tune the NOx emissions for refineries operating close to the allowed emissions limit. In turn, the correct choice of more advanced CO promoter systems allows streamlined operations and lower dosage into the FCC unit, which directly contributes to the refinery bottom line.

Author Contributions

Conceptualization, A.V. and K.C.K.; investigation, V.K. and A.D.; writing—original draft preparation, A.V., K.C.K. and C.C.Z.; writing—review and editing, A.V. and B.Y. All authors have read and agreed to the published version of the manuscript.

Funding

This research received no external funding.

Data Availability Statement

The data presented in this study are available on request from the corresponding author. The data are not publicly available due to BASF Corporation Confidentiality policy.

Acknowledgments

The authors would like to recognize the support and high quality of performed CO promoter testing by Angelos Lappas and Eleni Pachatouridou at the Chemical Process and Energy Resources Institute (CPERI) located in Thessaloniki, Greece.

Conflicts of Interest

The authors declare no conflict of interest.

Abbreviations

Platinum group metal (PGM), oxygen storage component (OSC), fluid catalytic cracking (FCC).

References

  1. Petroleum Sector (NAICS 324), US EPA. Available online: https://www.epa.gov/regulatory-information-sector/petroleum-sector-naics-324 (accessed on 5 May 2021).
  2. Air Emissions -Protecting Air Quality, Chevron Sustainability Roadmap. Available online: https://www.chevron.com/sustainability/environment/air-emissions (accessed on 5 May 2021).
  3. Chester, A.W. Chapter 6 CO combustion promoters: Past and present. Stud. Surf. Sci. Cat. 2007, 166, 67–77. [Google Scholar] [CrossRef]
  4. Stockwell, D.M. Chapter 6 CO combustion promoters: Past and present. Stud. Surf. Sci. Cat. 2007, 166, 79–102. [Google Scholar] [CrossRef]
  5. Gary, J.H.; Handwerk, G.E. Petroleum Refining: Technology and Economics, 4th ed.; CRC Press: New York, NY, USA, 2001; ISBN 0-8247-0482-7. [Google Scholar]
  6. BASF USPTM CO Promoter. Available online: https://catalysts.basf.com/products/ultra-stable-promoter-ups (accessed on 5 May 2021).
  7. Lin, J.; Wang, X.; Zhang, T. Recent progress in CO oxidation over Pt-group-metal catalysts at low temperatures. Chin. J. Catal. 2016, 37, 1805–1813. [Google Scholar] [CrossRef]
  8. Van Spronsen, M.A.; Frenken, J.W.M.; Groot, I.M.N. Surface science under reaction conditions: CO oxidation on Pt and Pd model catalysts. Chem. Soc. Rev. 2017, 46, 4347–4374. [Google Scholar] [CrossRef] [PubMed] [Green Version]
  9. Jentys, A. Estimation of mean size and shape of small metal particles by EXAFS. Phys. Chem. Chem. Phys. 1999, 1, 4059–4063. [Google Scholar] [CrossRef]
  10. Frenkel, A.I.; Yevick, A.; Cooper, C.; Vasic, R. Modeling the Structure and Composition of Nanoparticles by Extended X-Ray Absorption Fine-Structure Spectroscopy. Annu. Rev. Anal. Chem. 2011, 4, 23–39. [Google Scholar] [CrossRef] [PubMed] [Green Version]
  11. APMEX Precious Metals Trading. Available online: https://www.apmex.com/platinum-price (accessed on 5 May 2021).
  12. Bunluesin, T.; Putna, E.S.; Gorte, R.J. A comparison of CO oxidation on ceria-supported Pt, Pd, and Rh. Cat. Lett. 1996, 41, 1–5. [Google Scholar] [CrossRef]
  13. Ferré, G.; Aouine, M.; Bosselet, F.; Burel, L.; Cadete Santos Aires, F.J.; Geantet, C.; Ntais, S.; Maurer, F.; Casapu, M.; Grunwaldt, J.-D.; et al. Exploiting the dynamic properties of Pt on ceria for low-temperature CO oxidation. Catal. Sci. Technol. 2020, 10, 3904–3917. [Google Scholar] [CrossRef]
  14. Soliman, N.K. Factors affecting CO oxidation reaction over nanosized materials: A review. J. Mat. Res. Tech. 2019, 8, 2395–2407. [Google Scholar] [CrossRef]
  15. Ozawa, M.; Hattori, M.; Yamaguchi, T. Thermal stability of ceria catalyst on alumina and its surface oxygen storage capacity. J. Alloy Comp. 2008, 451, 621–623. [Google Scholar] [CrossRef]
  16. Li, J.; Liu, X.; Zhan, W.; Guo, Y.; Guo, Y.; Li, G. Preparation of high oxygen storage capacity and thermally stable ceria–zirconia solid solution. Catal. Sci. Technol. 2016, 6, 897–907. [Google Scholar] [CrossRef] [Green Version]
  17. Courtois, X.; Bion, N.; Marecot, P.; Duprez, D. Past and Present in DeNOx Catalysis: From Molecular Modelling to Chemical Engineering. Stud. Surf. Sci. Cat. 2007, 171, 235–259. [Google Scholar]
  18. Campbell, L.E.; Danzinger, R.; Guth, E.D.; Padron, S. Process for the Reaction and Absorption of Gaseous Air Pollutants, Apparatus Therefor and Method of Making the Same. US Patent 5,451,558, 19 September 1995. [Google Scholar]
  19. Theis, J.; Lambert, C. The Effects of CO, C2H4, and H2O on the NOx Storage Performance of Low Temperature NOx Adsorbers for Diesel Applications. SAE Technical Paper 2017. [Google Scholar] [CrossRef]
  20. Han, L.; Cai, S.; Gao, M.; Hasegawa, J.; Wang, P.; Zhang, J.; Shi, L.; Zhang, D. Selective Catalytic Reduction of NOx with NH3 by Using Novel Catalysts: State of the Art and Future Prospects. Chem. Rev. 2019, 119, 10916–10976. [Google Scholar] [CrossRef]
  21. Wittka, T.; Holderbaum, B.; Dittmann, P.; Pischinger, S. Experimental Investigation of Combined LNT + SCR Diesel Exhaust Aftertreatment. Emiss. Contr. Sci. Technol. 2015, 1, 167–182. [Google Scholar] [CrossRef] [Green Version]
  22. Onrubia-Calvo, J.A.; Pereda-Ayo, B.; Caravca, A.; De-La-Torre, U.; Vernoux, P.; Gonzalez-Velasco, J.R. Tailoring perovskite surface composition to design efficient lean NOx trap Pd–La1-xAxCoO3/Al2O3-type catalysts (with A = Sr or Ba). Appl. Catal. B Enviromental 2020, 266, 118628. [Google Scholar] [CrossRef]
  23. Zhang, Y.; Liu, D.; Meng, M.; Jiang, Z.; Zhang, S. A Highly Active and Stable Non-Platinic Lean NOx Trap Catalyst MnOx-K2CO3/K2Ti8O17 with Ultra-Low NOx to N2O Selectivity. Ind. Eng. Chem. Res. 2014, 53, 8416–8425. [Google Scholar] [CrossRef]
  24. Heck, R.M.; Farrauto, R.J.; Gulati, S.T. Catalytic Air Pollution Control; John Wiley and Sons: Hoboken, NJ, USA, 2009; ISBN 9781118397749. [Google Scholar] [CrossRef]
  25. Borgna, A.; Le Normand, F.; Garetto, T.; Apesteguia, C.R.; Moraweck, B. Sintering of Pt/Al2O3 reforming catalysts: EXAFS study of the behavior of metal particles under oxidizing atmosphere. Catal. Lett. 1992, 13, 175–188. [Google Scholar] [CrossRef]
  26. Hansen, T.W.; DeLaRiva, A.T.; Challa, S.R.; Datye, A.K. Sintering of Catalytic Nanoparticles: Particle Migration or Ostwald Ripening? Acc. Chem. Res. 2013, 46, 1720–1730. [Google Scholar] [CrossRef]
  27. Lee, J.; Ryou, Y.; Kim, J.; Chan, X.; Kim, T.J.; Kim, D.H. Influence of the Defect Concentration of Ceria on the Pt Dispersion and the CO Oxidation Activity of Pt/CeO2. J. Phys. Chem. C 2018, 122, 4972–4983. [Google Scholar] [CrossRef]
  28. Nagai, Y.; Hirabayashi, T.; Dohmae, K.; Takagi, N.; Minami, T.; Shinjoh, H.; Matsumoto, S. Sintering inhibition mechanism of platinum supported on ceria-based oxide and Pt-oxide–support interaction. J. Catal. 2006, 242, 103–109. [Google Scholar] [CrossRef]
  29. Nie, L.; Mei, D.; Xiong, H.; Peng, B.; Ren, Z.; Pereira Hernandez, X.I.; DeLaRiva, A.T.; Wang, M.; Engelhard, M.H.; Kovarik, L.; et al. Activation of surface lattice oxygen in single-atom Pt/CeO2 for low-temperature CO oxidation. Science 2017, 358, 1419–1423. [Google Scholar] [CrossRef] [PubMed] [Green Version]
  30. Jones, J.; Xiong, H.; DeLaRiva, A.T.; Peterson, E.J.; Pham, H.; Challa, S.R.; Qi, G.; Oh, S.; Wiebenga, M.H.; Pereira Hernández, X.I.; et al. Thermally stable single-atom platinum-on-ceria catalysts via atom trapping. Science 2016, 353, 150–154. [Google Scholar] [CrossRef] [PubMed] [Green Version]
  31. Yeung, C.M.Y.; Yu, K.M.K.; Fu, Q.J.; Thompsett, D.; Petch, M.I.; Tsang, S.C. Engineering Pt in Ceria for a Maximum Metal−Support Interaction in Catalysis. J. Am. Chem. Soc. 2005, 127, 18010–18011. [Google Scholar] [CrossRef] [PubMed]
  32. Sala, R.; Bielaczyc, P. Accelerated Ageing Method of Three Way Catalyst Run on Test Bed with Emission Performance and Oxygen Storage Capacity Evaluation. SAE Technical. Paper 2020. [Google Scholar] [CrossRef]
Figure 1. The FCC unit regenerator as well as the associated catalyst logistic streams are schematically shown.
Catalysts 11 00707 g001
Figure 2. The CO conversion and NOx generation observed for reference catalysts with varying Pt loadings are reported. The respective value of Pt ($/mT) at a 2016–2020 average market price of 900 $/oz t Pt [11] is also reported for reference.
Catalysts 11 00707 g002
Figure 3. The CeO2-induced CO conversion as well as the ratio of NOx generation to CO conversion are reported as a function of promoter CeO2 content. The lines are intended for trend visualization purposes only. Catalysts were tested by mixing 99% spent FCC catalyst and 1% fresh promoter using a plug flow reactor operating at 1 L/min flow rate with a feed of 2 vol.% O2 in N2 at 700 °C. The emissions values determined by comparing to a promoter-free base case experiment. The method used to calculate CO conversion and NOx generation is reported in the experimental section. The color-coding is reported in the plot.
Catalysts 11 00707 g003
Figure 4. The dopant-assisted CO conversion as well as the ratio of NOx generation to CO conversion are reported as a function of promoter SrO content. The color-coding is reported in the plot alongside with fitted curves exemplifying the discussed trends. Catalysts were tested by mixing 99% spent FCC catalyst and 1% fresh promoter using a plug flow reactor operating at 1 L/min flow rate with a feed of 2 vol.% O2 in N2 at 700 °C. The emissions values determined by comparing to a promoter-free base case experiment. The method used to calculate CO conversion and NOx generation is reported in the experimental section.
Catalysts 11 00707 g004
Figure 5. The activity of reference-2 and catalyst C in fresh as well as aged form for CO conversion and NOx generation are reported. The color-coding as well as the actual measured values are reported in the plots. Catalysts were tested by mixing 99% spent FCC catalyst and 1% fresh promoter using a plug flow reactor operating at 1 L/min flow rate with a feed of 2 vol.% O2 in N2 at 700 °C. The emissions values determined by comparing to a promoter-free base case experiment. The method used to calculate CO conversion and NOx generation is reported in the experimental section.
Catalysts 11 00707 g005
Table 1. The sample composition as well as measured CO conversion and NOx generation values for the catalysts discussed in this contribution are reported.
PromoterCeO2 (wt %)SrO (wt %)Al2O3 (wt %)Pt (ppm)CO Conversion (%) 1NOx Generation (%) 1
Reference-10099.9730047.6 ± 2.4127.3 ± 6.4
Reference-20099.9550043.8 ± 2.2128 ± 6.4
Reference-30099.9280047.6 ± 2.4129 ± 6.5
Catalyst A3096.9730054.4 ± 2.7117.4 ± 5.9
Catalyst B6093.9730057.5 ± 2.9115.8 ± 5.8
Catalyst C10089.9730062.1 ± 3.1112.3 ± 5.6
Catalyst D18081.9730064.2 ± 3.2113.9 ± 5.7
Catalyst E102.687.3730064.1 ± 3.2104.7 ± 5.2
Catalyst F104.785.2730067.0 ± 3.493.0 ± 4.7
1 Test: 99% spent FCC catalyst + 1% fresh promoter, plug flow reactor operating at 1 L/min flow rate with a feed of 2 vol.% O2 in N2 at 700 °C. Values determined by comparing to a promoter-free base case experiment. The method used to calculate CO conversion and NOx generation is reported in the next chapter. The accuracy of the reported CO and NOx emissions values was determined by performing a statically relevant number of repetitions. For the chosen reactor setup and under the specific experimental conditions reported in this study, an average variation of ±5% was determined.
Table 2. The CO promoter testing parameters are reported.
Reactor TypeFluid Bed
Reactor loading10 gr
Catalyst mixture99 wt % spent FCC catalyst + 1 wt % CO promoter
Inlet gas flow rate1 L/min
Inlet gas composition2 vol.% O2 in N2
Reactor bed temperature700 °C
Publisher’s Note: MDPI stays neutral with regard to jurisdictional claims in published maps and institutional affiliations.

