Article

Synthesis of Highly Porous Cu2O Catalysts for Efficient Ozone Decomposition

1
Power Control Department, Navy Submarine Academy, Qingdao 266199, China
2
State Key Laboratory of Multiphase Complex Systems, Institute of Process Engineering, Chinese Academy of Sciences, Beijing 100190, China
*
Author to whom correspondence should be addressed.
Catalysts 2021, 11(5), 600; https://doi.org/10.3390/catal11050600
Submission received: 6 April 2021 / Revised: 27 April 2021 / Accepted: 28 April 2021 / Published: 6 May 2021
(This article belongs to the Special Issue Current State-of-the-Art of Catalysts)

Abstract

:
At present, it is urgent to synthesize highly active ozone decomposition catalysts to cope with the ever-increasing ozone concentration in the atmosphere. In this study, a highly porous Cu2O catalyst was prepared by using combined surfactants of triblock copolymer P123 and n-butanol through a simple solution reduction method by ascorbic acid. Transmittance electron microscopy, X-ray diffraction, and N2 adsorption–desorption characterizations verify the highly porous structure with a relatively high surface area of 79.5 m2·g−1 and a small crystallite size of 2.7 nm. The highly porous Cu2O shows 90% ozone conversion activity in harsh conditions, such as a high space velocity of 980,000 cm3·g−1·h−1, or a high relative humidity of 90% etc., which is not only attributable to the high surface area but also to the high concentration of surface oxygen vacancy. The results show the promising prospect of the easily synthesized, highly porous Cu2O for effective ozone decomposition applications.

1. Introduction

Though the ozone is beneficial in the stratosphere as it protects organisms from the damage of ultraviolet radiation, on the earth’s surface it is one of the main pollutants of the atmosphere, enhancing photochemical smog and causing respiratory diseases [1,2,3]. Because of its toxicity to organisms, its threshold is regulated to be about 0.10 ppm for 8 h all over the world [4]. The ozone is also easily produced by electrostatic discharge in indoor environments such as airplane cabins, offices and submarines. Due to its low natural degradation rate, it is necessary and challenging to develop highly efficient ozone decomposition technology. At present, the main ozone treatment methods are adsorption and catalytic decomposition and, compared with activated carbon adsorption, catalytic decomposition of the ozone, especially by transition metal oxides, has more advantages as it is highly efficacious and low cost [5].
Oyama et al. proposed the reaction process of ozone decomposition on the surface of Mn3O4 by in-situ Raman spectroscopy and theoretical calculation. In this series of reactions, the last step (where O22− releases electrons and desorbs them from the surface) is relatively difficult, so its rate determines the rate of the whole series [6]. In this context, oxygen vacancies on metal oxides are proposed as the main active sites for ozone adsorption and decomposition [7], which is also verified by He et al. [8,9]. Zhu et al. introduced Na+ into the tunnel framework of octahedral manganese oxide molecular sieves (OMS-2), and facilitated lattice defect formation, which significantly enhanced oxygen vacancies. The Na-OMS-2 catalyst synthesized by this method exhibited an ozone conversion of 92.5% at 25 °C after a reaction for 6 h under an initial ozone concentration of 45 ppm, a relative humidity of 30%, and a space velocity of 660,000 h−1 [10]. Meanwhile, p-type oxides possess the ability to catalyze on account of electron holes that can be combined with the electrons produced in the rate-determining step [11]. Therefore, many studies are devoted to developing ozone decomposition catalysts based on p-type oxides.
Cuprous oxide (Cu2O) is a narrow band gap p-type semiconductor that has attracted considerable attention in the past few decades because of its unexpected physical and chemical properties, as well as its potentially important applications in multidisciplinary fields such as energy conversion, electrics, catalysts and sensors [12,13,14,15,16,17]. Gong et al. synthesized single crystalline Cu2O nanocubes for the efficient decomposition of the ozone at 0 °C [18,19]. It should be noted that the reported Cu2O nanomaterial often has low surface areas, for example 26.67 m2·g−1, as reported by Zhang et al. [20], 42.7 m2·g−1 by Gong et al. [21], and 58 m2·g−1 by Gao et al. [22]. In this study, P123 and n-butanol are selected as the surfactants to enhance the surface area of Cu2O. This as-obtained material has a relatively high surface area of 79.5 m2·g−1, which can converse O3 with a high efficacy of >90% in harsh conditions such as at a high space velocity of 980,000 cm3·g−1·h−1, a high relative humidity of 90% and a long duration of 18 h, showing the potency of this highly porous material for ozone decomposition.

2. Results and Discussion

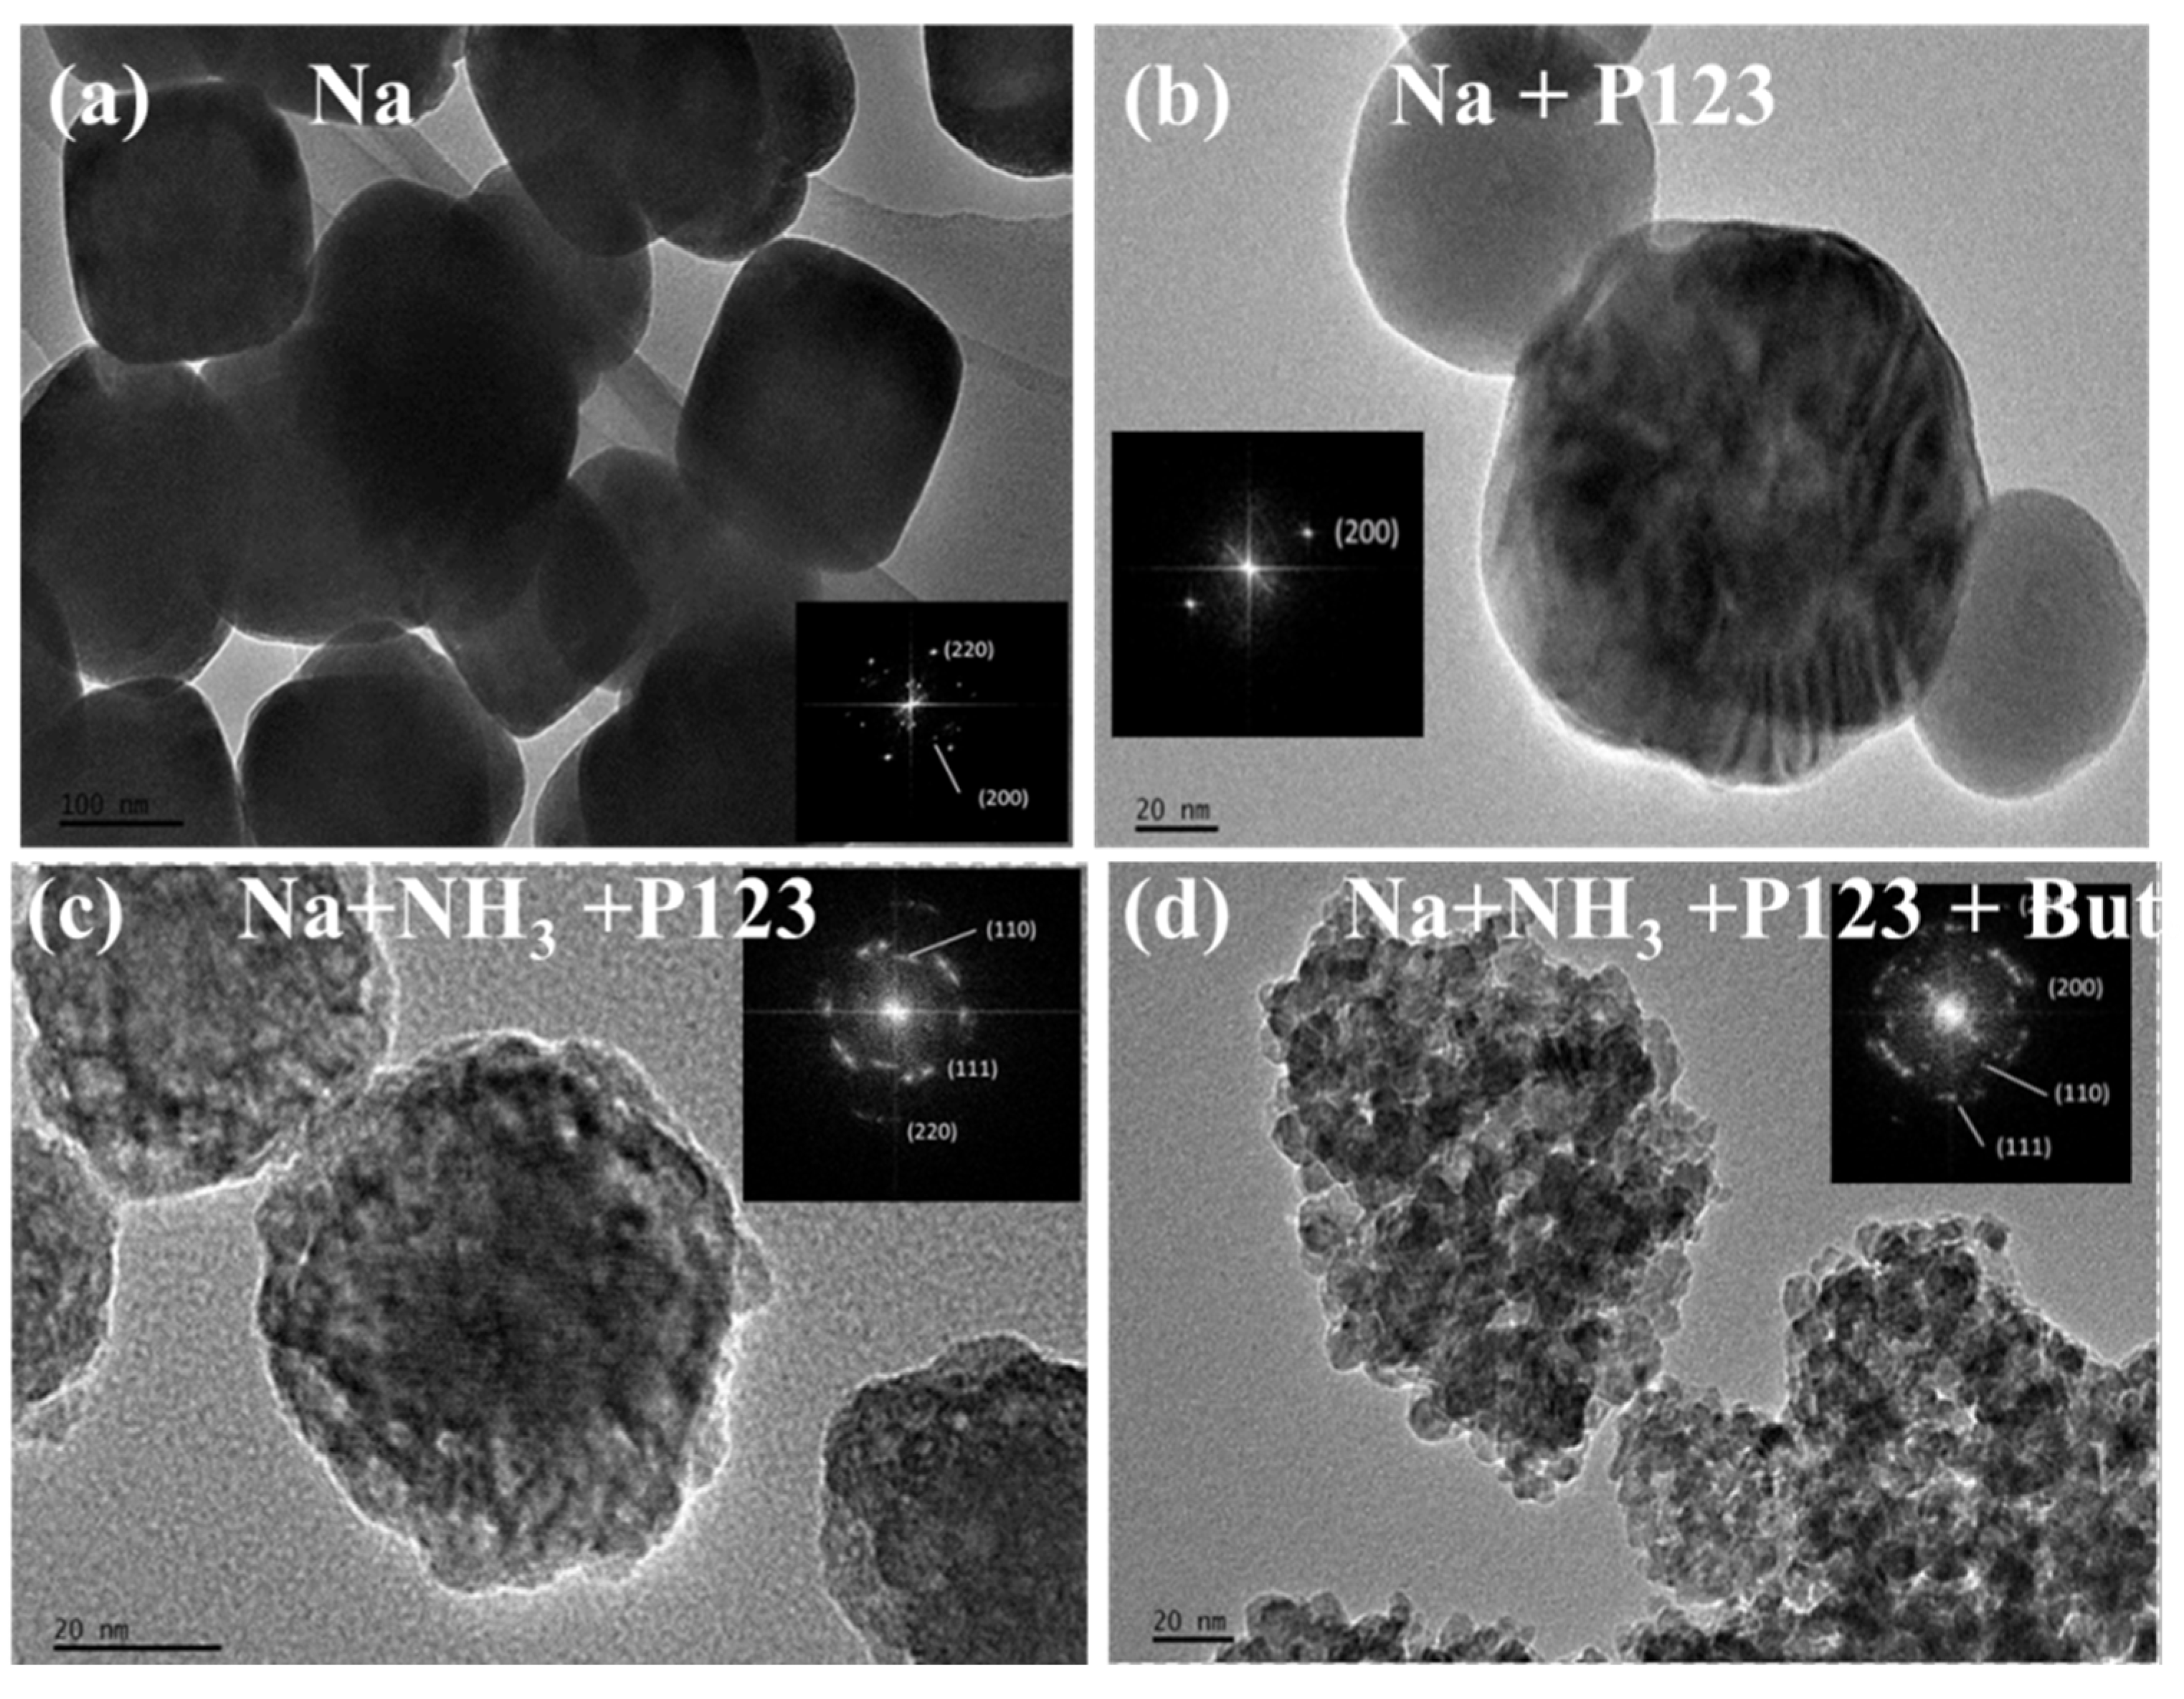
It is widely reported that Cu2O can be easily obtained via a reduction in Cu(OH)2 precipitate by ascorbic acid (AA) as shown in reactions ((1)–(2)) [23,24]. The morphologies of the products can also be well controlled by using different alkali, surfactants and precursors [25,26,27]. In this study, porous Cu2O catalysts were synthesized as shown in Figure 1. Quasi-cubic shaped Cu2O was obtained if only NaOH was employed as an alkali without any surfactants, as shown in Figure 2a. The surfactant P123 made the Cu2O spherical morphology as shown in Figure 2b. It should be noted that although no pores are observable in Figure 2b, its surface area is increased from 4.8 to 13.2 m2·g−1, as shown in Table 1. When NH3 was adopted together with NaOH as the alkali, porous Cu2O spheres were synthesized, as shown in Figure 2c, with a surface area of 41.5 m2·g−1. Finally, when n-butanol was used together with P123 as the surfactant, the Cu2O spheres showed a more porous structure with small granules, as shown in Figure 2d, with a high surface area of 79.2 m2·g−1.
Micelles were formed by the triblock copolymer of P123 with the action of a hydrogen bond. Cu2O was linked to the framework of the triblock copolymer, then crystallized and accumulated, which formed a porous structure as shown in Figure 1. Meanwhile, NH3 can coordinate with Cu2+, as shown in reaction (3), and the coordinate Cu(NH3)42+ has a comparable stability product of 1013.32 to that of Cu(OH)2 (1013.68). Therefore, reaction (2) is slowed down with fewer available Cu(OH)2 precursors after NH3 is added, forming the porous structure. However, if pure NH3 was adopted as the alkali without NaOH, no precipitate was obtained due to the stable coordination, as summarized in Table 1.
N-butanol is widely used as a pore-expanding agent in the synthesis of mesoporous molecular sieves [28,29]. In the process of Cu2O synthesis, a similar role would be played, as shown in Figure 1. Through combination with the hydrophilic group of the outer layer, n-butanol occupied a certain space in the stacked crystal structure. Under the action of combined surfactants, Cu2O crystallized into smaller grains and aggregated into a highly porous structure, increasing the specific surface area, which is considered beneficial to the catalytic activity. The results were verified by Brunauer–Emmett–Teller (BET) analysis, indicating that the pore size decreased from 6.4 to 3.7 nm, as shown in Figure S1. However, n-butanol itself is not an effective surfactant without P123, as the obtained Cu2O showed a similar morphology and surface area to Na, as shown in Figures S1 and S2 and Table 1.
Cu2+ + 2OH → Cu(OH)2
2Cu(OH)2 + AA → Cu2O + 2H2O + AA-O (Oxidized AA)
Cu2+ + 4NH3 → Cu(NH3)42+
All of the reflection peaks in these patterns can be readily indexed to a pure cubic phase of Cu2O Joint Committee on Powder Diffraction Standards (JCPDS) Reference code: 00-003-0898). However, it can be noticed that the peaks become wider after NH3, P123 and n-butanol are added, implying that the size of the nanocrystal becomes smaller [30]. According to the Scherrer formula, D = 0.89 λ/βcosθ, where λ is the wavelength of X-ray 0.154 nm, β is the full width at half maximum, θ is the diffraction angle, the crystallite size of each sample can be calculated, as shown in Table 1. The decreasing trend of the crystallite size agrees well with the surface area increase, showing that the effective surface area, pore and grain size is tailored by the combination of NH3, P123 and n-butanol.
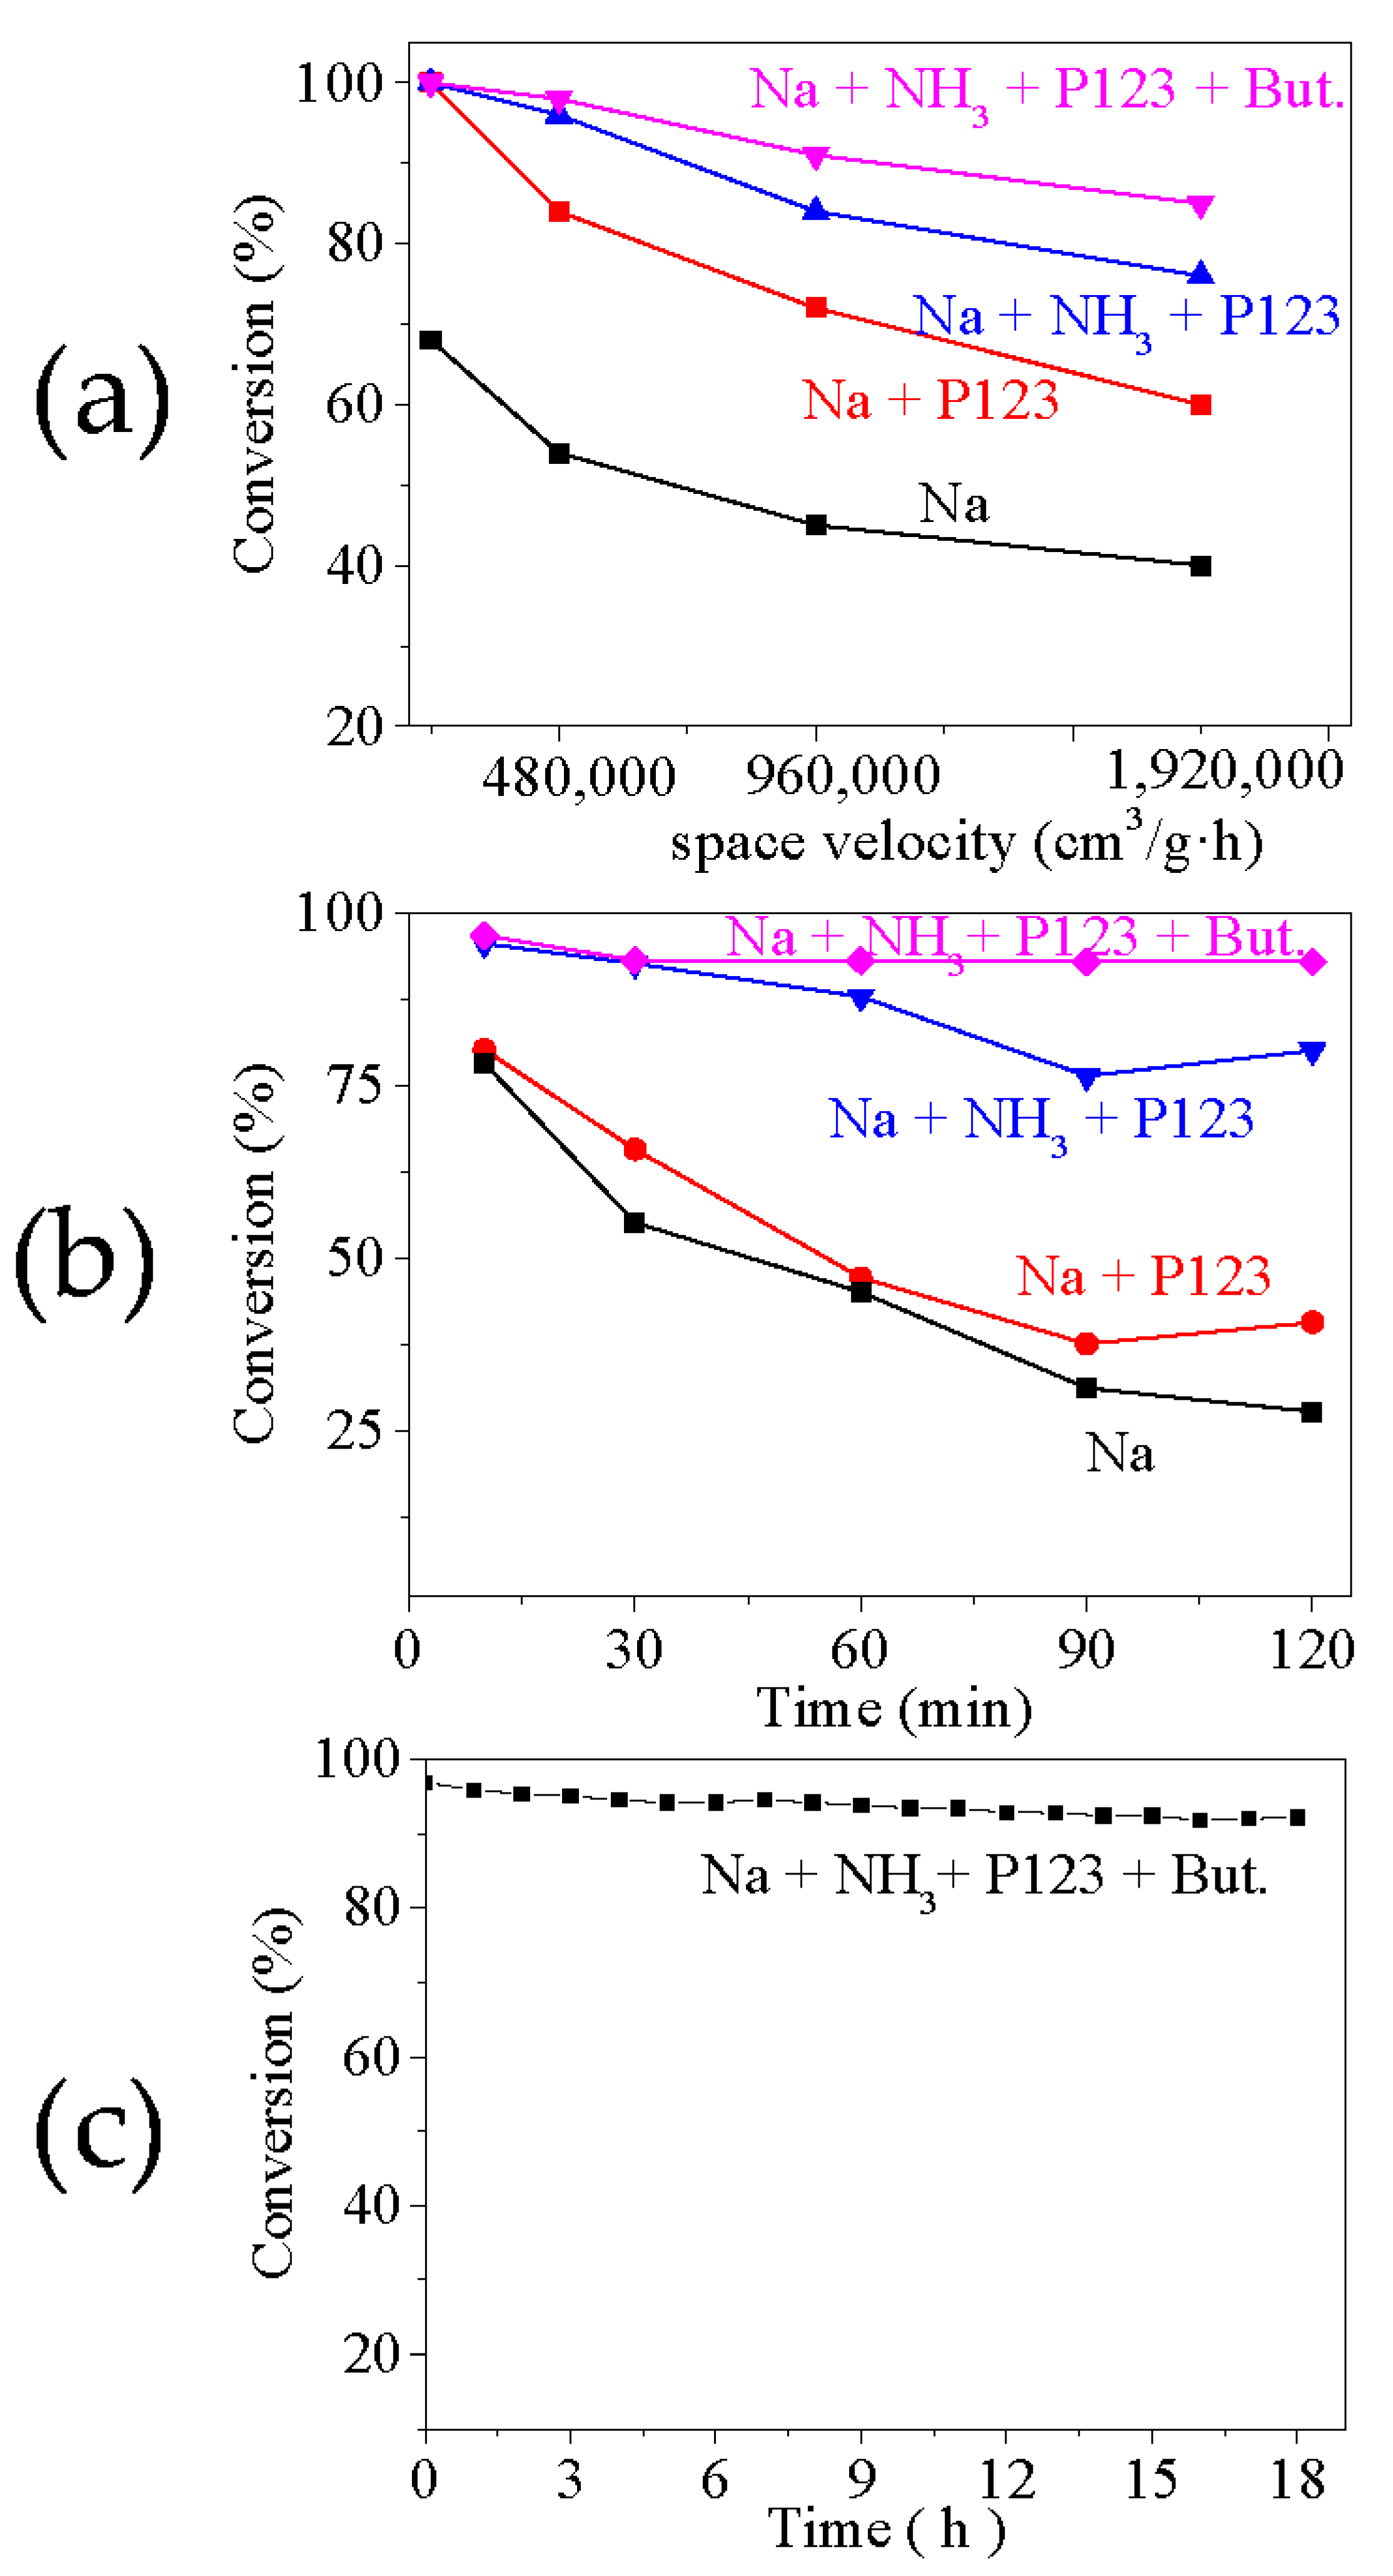
In general, the catalytic performance corresponded to the specific surface area. As illustrated in Figure 4a, in dry air, Cu2O synthesized by Na + NH3 + P123 + But. demonstrated the highest activity among these catalysts, with an ozone conversion of over 90% at 960,000 cm3 g−1 h−1. The humidity resistance of the catalyst is also an important index to measure its practical application ability. As shown in Figure 4b, the performance of different samples at 90% relative humidity was basically consistent with the drying condition. Their activities were all decreased due to the competitive adsorption of aqueous vapour, yet a larger specific surface area can provide more active sites to reduce the impact. In addition, the durability test results of the catalyst Cu2O by using Na + NH3 + P123 + But. (in Figure 4c) displayed that the Cu2O catalyst still has a high catalytic activity after 18 h of continuous use. At this space velocity, the total amount of ozone treated by 1 g catalyst for 18 h can be calculated as follows:
1 g   × 480 , 000   cm 3   g 1   h 1 × 18 h 1000 × 200 1 , 000 , 000 × 22.4   L   mol 1 0.077   mol
However, 1 g of Cu2O is only about 0.007 mol, which indicates that Cu2O is a catalyst rather than a chemical absorbent.
As the surface structure of the catalysts plays a key role in the gas-solid reaction, the surfaces of the synthesized catalysts were characterized by XPS, as shown in Figure 5, with the spectra calibrated with C1s peak at 284.6 eV. Figure 5a shows the Cu2p spectra, with main peaks centered at 932.4 eV and 952.4 eV, attributable to the Cu (I). However, the outmost surface of Cu2O oxidized as Cu (II) peaks also appeared at 932.6 eV(2p3/2) and 952.5 eV(2p1/2), whilst satellite peaks of CuO centered at 941.9, 943.8 and 944.8 eV, as shown in Figure 5b [31]. Thus, there is no significant difference in the Cu2p spectra between these Cu2O samples.
The chemical bonds of oxygen in the Cu2O samples are also characterized, as shown in the O1s spectra in Figure 5c,d. There are two main peaks centered at 530.3 and 531.5 eV, inferring that two different reactive oxygen species could be distinguished [32]. The state at 530.3 eV O(I) is related to lattice oxygen, while the oxygen at 531.5 eV (O(II)) is considered to be a low-coordinated oxygen species adsorbed on oxygen vacancies [33]. Generally, the relative intensity of O(II) represents the surface oxygen vacancy concentration in catalysts [10]. It is obvious that the OII peak intensity is the highest for Na + NH3 + P123 + But., while the lowest is for Na, which is in good agreement with the tendency of the O3 conversion performance. Therefore, the high activity of the sample Na + NH3 + P123 + But. is not only attributed to its high surface area, but also to the high concentration surface oxygen vacancy.
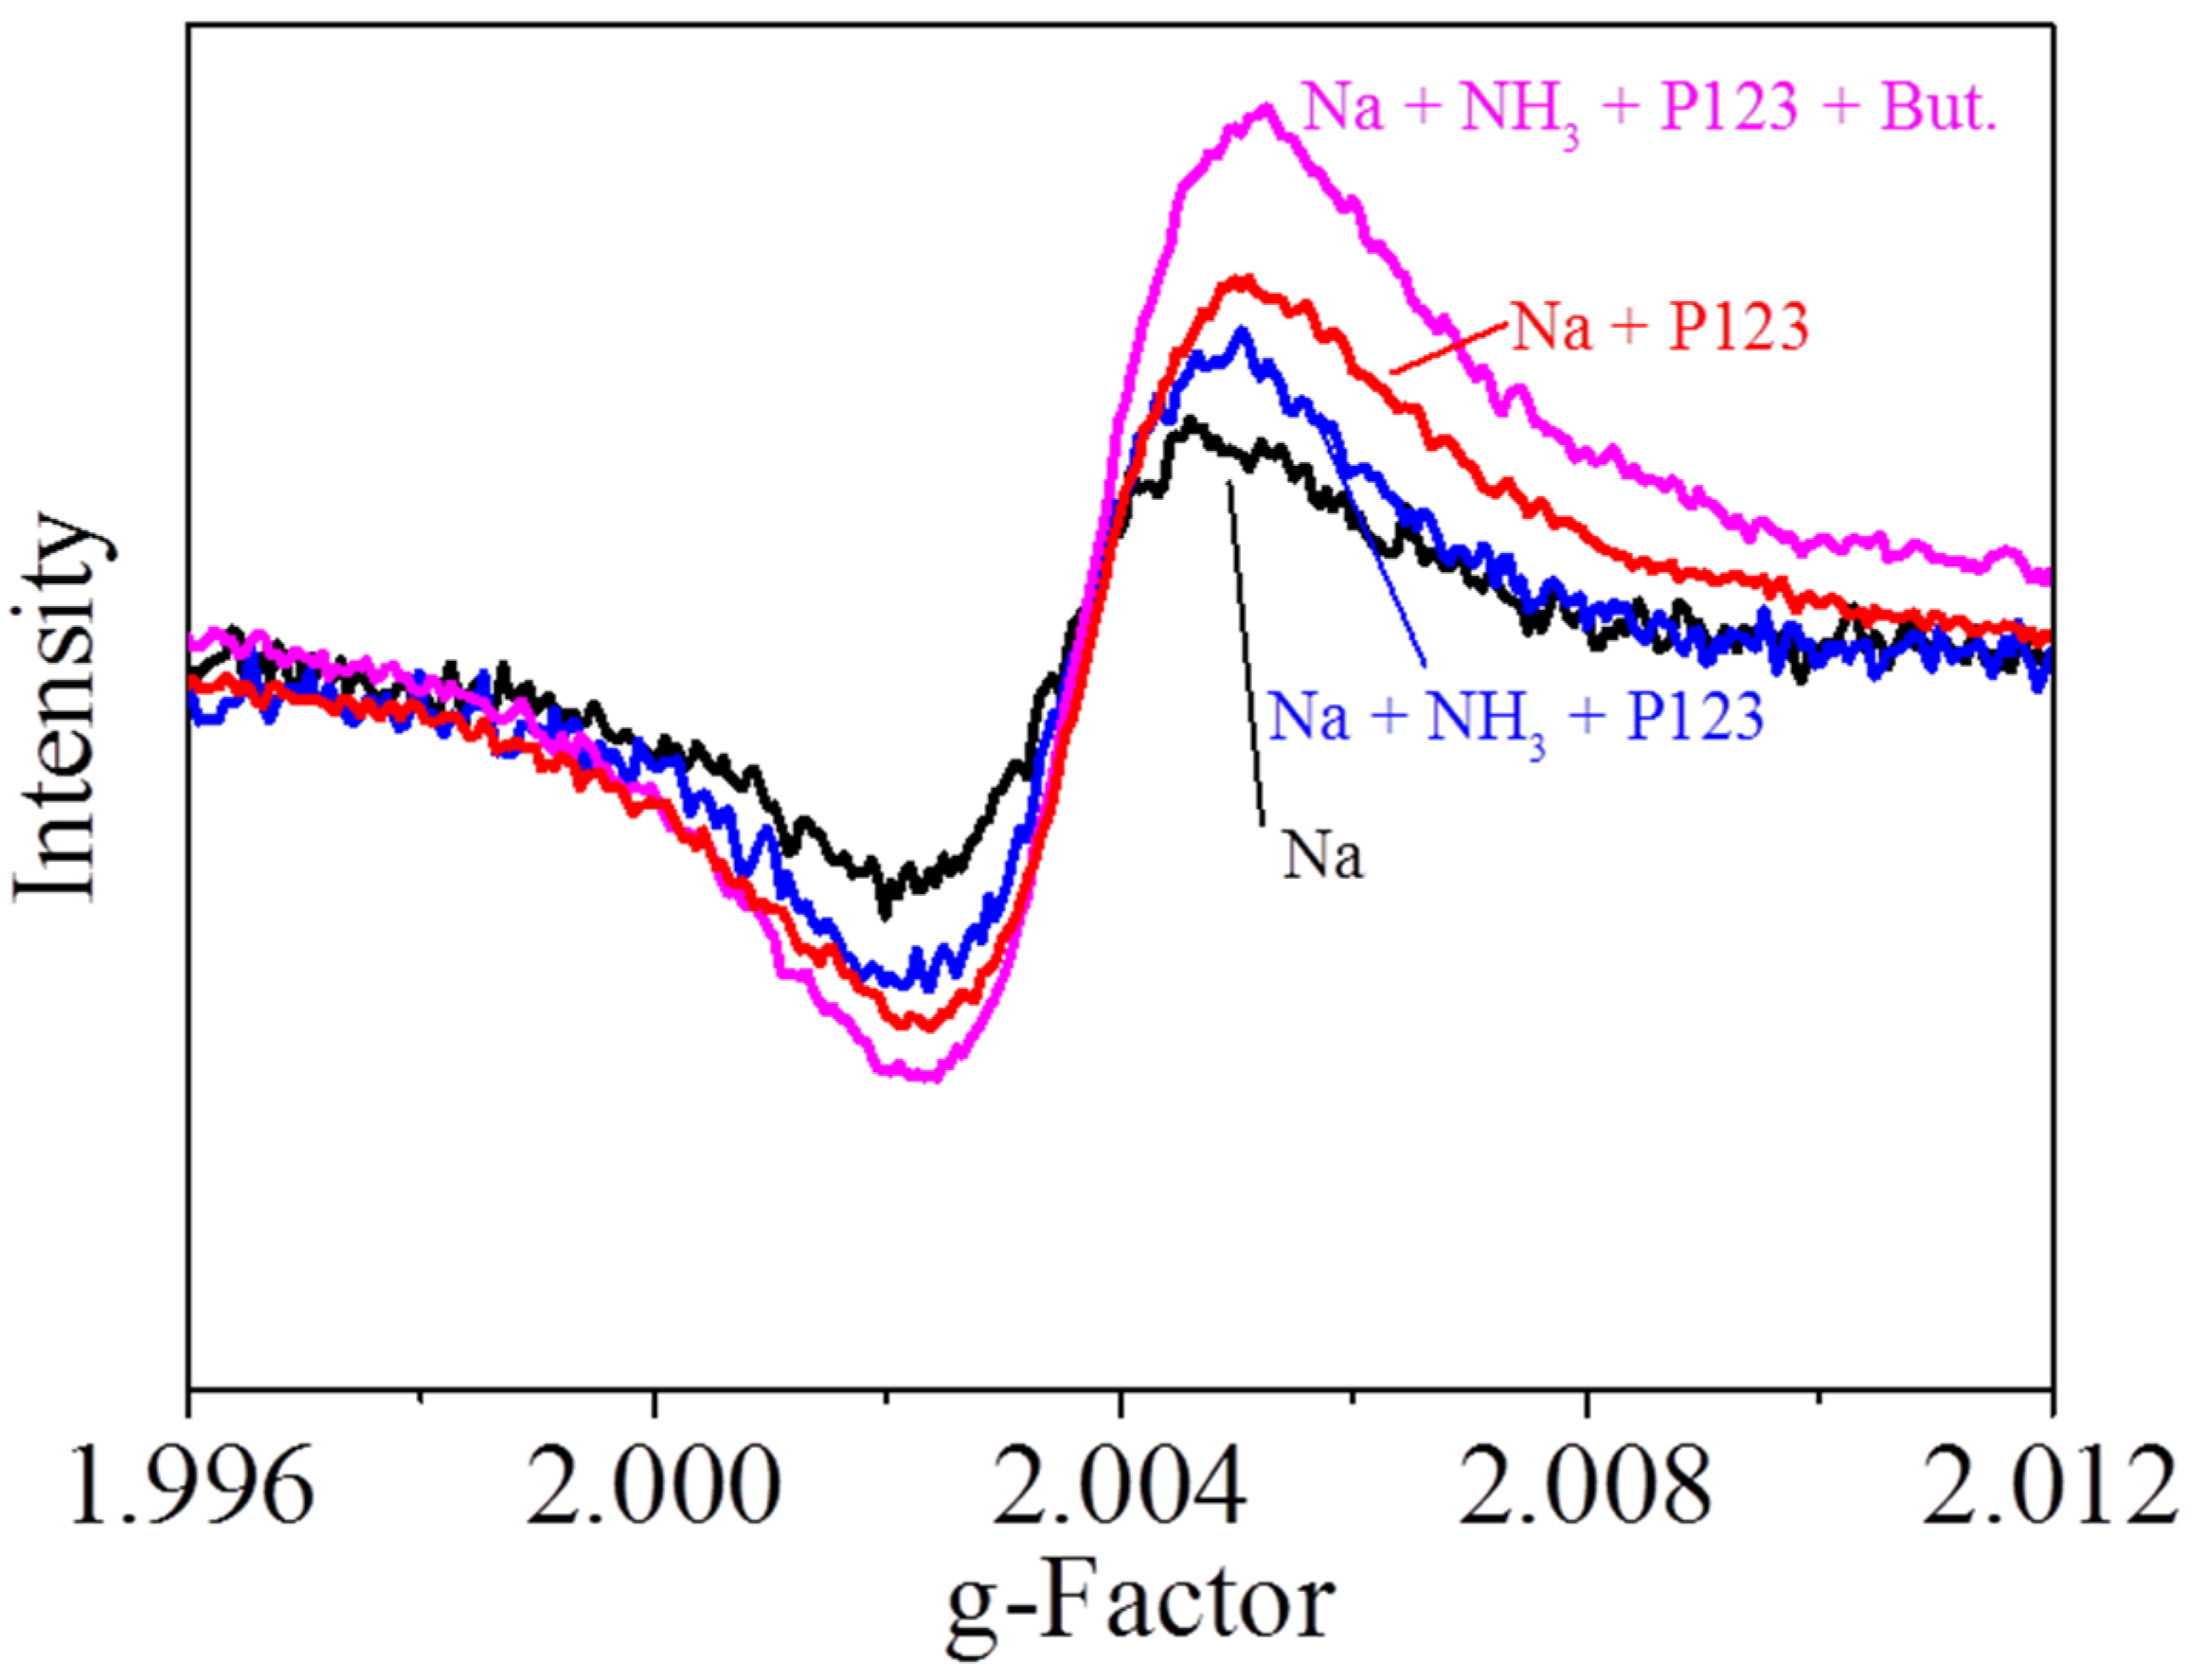
In order to further study the oxygen vacancies in different catalysts, Electron paramagnetic resonance (EPR) characterization was employed, as shown in Figure 6. According to the literature, EPR signals at g = 2.004 can be considered as the electron bounded to the oxygen vacancy [34,35]. The signal intensity of the catalyst Na + NH3 + P123 + But. is the strongest, inferring more oxygen vacancies therein. However, the EPR signal is attributable to the overall oxygen vacancies including the surface and the bulk. Therefore, though sample Na + P123 has the second largest oxygen vacancy related to peak intensity, most of the bulk oxygen vacancy might not be effective in the surface O3 decomposition due to its relatively low surface area (13.2 m2·g−1) compared with sample Na + NH3 + P123 (41.5 m2·g−1).
As reported in the literature, ozone decomposition on catalyst surfaces includes three steps, as shown in reactions ((4)–(6)). Firstly, O3 adsorbs on the active site (*) of the catalyst surface and then reduces to O2 leaving an ion-adsorbed oxygen O shown in reaction (4). Then, O3 reacts with O further to release O2 and forms O22− on the active site, as shown in reaction (5). The O22− is hard to desorb, and thus (6) is the slowest step in O3 decomposition. Oxygen vacancy contributes electrons, facilitating the O3 decomposition, as investigated in the ZnO catalyst, as shown in ((7)–(8)) [36]. Due to the p-type property of Cu2O, there would also be holes [16] which can then neutralize the electron from O22− to release O2 as shown in (9). These results show the potency of this highly porous Cu2O for highly effective O3 decomposition applications.
O3 + * → O2 + O
O3 + O + * → O2 + O22−
O22− → O2 + 2*
VOx → VO + e
2O3 + 2e→ 2O2 + O22−
O22− + 2h → O2

3. Experimental Procedure

3.1. Preparation of Catalysts

In a typical synthesis process, 6.0 g of surfactant P123 was dissolved in 60 mL of distilled water for 4 h, and 8.0 mL n-butanol was added into the solution. Then, 10 mmol (2.5 g) of CuSO4·5H2O, 40 mmol of NaOH (1.6 g) and 40 mmol of NH3 solution (3.0 mL, 13.4 mol L−1) was added. After the blue suspension was stirred further for 10 min, 60 mL of ascorbic acid (AA) aqueous solution (1 mol L−1) was added dropwise. With the addition of ascorbic acid, the suspension gradually turned orange. The product was separated by centrifugation and washed with water and ethanol 3 times, and then dried for 8 h at 80 °C. This Cu2O product was named Na + NH3 + P123 + But. Similar products were prepared and named, including: Na + NH3 + P123 without adding n-butanol, Na + P123 without adding NH3 and n-butanol, and Na without adding NH3, n-butanol and P123.

3.2. Characterization of Catalysts

The microstructure of the samples was observed by transmission electron microscopy JEOL JEM-2100F (JEOL, Aichi, Japan) with an accelerating voltage of 200 kV. The samples were dispersed in ethanol on a copper grid covered with microgrid carbon films. The fast Fourier transform was carried out by software DigitalMicrograph.
The crystal structure of the catalyst was analyzed by an X-ray diffractometer (X’pert Pro System) made by the Panalytical company of the Netherlands (Almelo, Netherlands) (40 kV, 40 mA). Cu Kα was used as a diffraction source (incident wavelength was 0.154 nm). The scanning angle range was 5–90° and the scanning speed was 17 min−1. The data were analyzed by X’pert highscore software 5.1, and the average particle size and cell parameters were calculated according to Scherrer’s formula.
Chemical states of the surface elements were characterized by X-ray photoelectron spectroscopy (ESCALAB 250XI, Thermo Fisher company, Waltham, MA, USA) with a monochromatic Al Kα X-ray source (1486 eV) and beam size of 200 μm. Charge compensation was achieved by the dual beam charge neutralization and the binding energy was corrected by setting the binding energy of the hydrocarbon C 1s feature to 284.8 eV. The surface atomic composition ratio was calculated by software XPSPEAK41 and the deconvolution peak was optimized by Schofield sensitivity factors after normalization of the individual peak’s areas.
N2 adsorption desorption isotherms of the catalyst were measured at 77 K by an automatic surface analyzer (SSA-7300, Aode-beijing, Beijing, China). The specific surface area, pore volume and pore diameter distribution of the catalyst were obtained by Brunauer–Emmett–Teller (BET) and Barrett-Joyner-Halenda (BJH) methods at liquid nitrogen temperature (−196 °C) using N2 gas as the adsorbate. Prior to determination, the samples were dried and then degassed at 120 °C for 5 h. The BET specific surface area (SBET) was determined by a multipoint BET method, using the adsorption data in the relative pressure (P/P0) from 0.05 to 0.95.
The active species of the Cu2O structure catalyst was detected on a Bruker model E500 electronic paramagnetic resonance spectrometer (EPR; Bruker Corp., Billerica, MA, USA) by using 5, 5-dimethyl-1-pyrroline N-oxide (DMPO)as a free radical trapping agent.

3.3. Ozone Catalytic Decomposition Test

The ozone is produced by pure oxygen flow through a commercial ozone generator (COM-AD-01-OEM, Anseros, Tieling, China). The ozone generator can be adjusted to control the ozone concentration at 200 ppm. The total gas flow rate was 200–700 cm3 min−1, including 100–200 cm3 min−1 oxygen and 100–500 cm3 min−1 air. The test space velocity (SV) was from 240,000 to 1,680,000 cm3 g−1 h−1. A total of 25 mg (40–60 mesh) catalyst and 475 mg quartz sand were mixed into a U-shaped quartz tube reactor (5.5 mm in diameter). The reaction temperature could be controlled by a water bath. The concentration at the inlet (Ci) and outlet (Co) of the reactor was detected by the ozone concentration detector (model 106M, 2B technologies, Boulder, Colorado 80301, USA). The conversion rate of the ozone can be expressed as (Ci − Co)/Ci × 100%, as seen in Figure 7.

4. Conclusions

The specific surface area of the Cu2O catalyst can be significantly increased by using a combined surfactant of P123 and n-butanol, and a highly porous Cu2O was successfully obtained with a high surface area of 79.5 m2·g−1. It shows high ozone decomposition activity of >90% in harsh environments such as a high space velocity of 980,000 cm3·g−1·h−1 or a high relative humidity of 90% etc. The high performance is not only attributable to the high surface area, but also a high concentration of surface oxygen vacancies, as demonstrated by X-ray photoelectron spectroscopy and electron paramagnetic resonance spectroscopy. These results demonstrate the promise of this surfactant combination strategy for highly porous and active O3 degradation Cu2O catalysts, which would also be suitable for the liquid phase synthesis of other metal oxide materials.

Supplementary Materials

The following are available online at https://www.mdpi.com/article/10.3390/catal11050600/s1, Figure S1: Nitrogen adsorption desorption characterizations of the Cu2O catalysts using (a) Na, (b) Na + P123, (c) Na + NH3 + P123, (d) Na + NH3 + P123 + But.; Figure S2: TEM images of Cu2O catalysts synthesized by Na + Butanol; Figure S3: Nitrogen adsorption desorption characterizations of the Cu2O synthesized by Na + Butanol.

Author Contributions

Conceptualization, methodology and writing—original draft, Y.J. Investigation and Validation, J.C. and G.M. Formal analysis and software, X.Z. All authors have read and agreed to the published version of the manuscript.

Funding

This research received no external funding.

Conflicts of Interest

The authors declare no conflict of interest.

References

  1. Cleveland, W.S.; Graedel, T.E. Photochemical Air Pollution in the Northeast United States. Science 1979, 204, 1273–1278. [Google Scholar] [CrossRef]
  2. Liang, G.Y. Supported gold catalysts used for ozone decomposition and simultaneous elimination of ozone and carbon monoxide at ambient temperature. Appl. Catal. B Environ. 2001, 33, 217–222. [Google Scholar]
  3. Lu, X.; Zhang, L.; Wang, X.L.; Gao, M.; Li, K.; Zhang, Y.Z.; Yue, X.; Zhang, Y.H. Rapid Increases in Warm-Season Surface Ozone and Resulting Health Impact in China Since 2013. Environ. Sci. Technol. Lett. 2020, 7, 240–247. [Google Scholar] [CrossRef]
  4. Heisig, C.; Zhang, W.; Oyama, S.T. Decomposition of ozone using carbon-supported metal oxide catalysts. Appl. Catal. B Environ. 1997, 14, 117–129. [Google Scholar] [CrossRef]
  5. Li, X.; Ma, J.; He, H. Recent advances in catalytic decomposition of ozone. J. Environ. Sci. 2020, 94, 14–31. [Google Scholar] [CrossRef]
  6. Li, W.; Gibbs, G.V.; Oyama, S.T. Mechanism of ozone decomposition on a manganese oxide catalyst. I. In situ Raman spectroscopy and ab initio molecular orbital calculations. J. Am. Chem. Soc. 1998, 120, 9041–9046. [Google Scholar] [CrossRef]
  7. Dhandapani, B.; Oyama, S.T. Gas phase ozone decomposition catalysts. Appl. Catal. B Environ. 1997, 11, 129–166. [Google Scholar] [CrossRef]
  8. Li, X.T.; Ma, J.Z.; Yang, L.; He, G.Z.; Zhang, C.B.; Zhang, R.D.; He, H. Oxygen Vacancies Induced by Transition Metal Doping in γ-MnO2 for Highly Efficient Ozone Decomposition. Environ. Sci. Technol. 2018, 52, 12685–12696. [Google Scholar] [CrossRef] [PubMed]
  9. Yang, L.; Ma, J.Z.; Li, X.T.; Zhang, C.B.; He, H. Enhancing Oxygen Vacancies of Ce-OMS-2 via Optimized Hydrothermal Conditions to Improve Catalytic Ozone Decomposition. Ind. Eng. Chem. Res. 2020, 59, 118–128. [Google Scholar] [CrossRef]
  10. Hong, W.; Zhu, T.; Sun, Y.; Wang, H.; Li, X.; Shen, F. Enhancing Oxygen Vacancies by Introducing Na+ into OMS-2 Tunnels to Promote Catalytic Ozone Decomposition. Environ. Sci. Technol. 2019, 53, 13332–13343. [Google Scholar] [CrossRef]
  11. Queisser, H.J.; Haller, E.E. Defects in Semiconductors: Some Fatal, Some Vital. Science 1998, 281, 945–950. [Google Scholar] [CrossRef]
  12. Chen, X.; Shen, S.; Guo, L.; Mao, S.S. Semiconductor-based Photocatalytic Hydrogen Generation. Chem. Rev. 2010, 110, 6503–6570. [Google Scholar] [CrossRef]
  13. Burda, C.; Chen, X.; Narayanan, R.; El-Sayed, M.A. Chemistry and Properties of Nanocrystals of Different Shapes. Chem. Rev. 2005, 105, 1025–1102. [Google Scholar] [CrossRef] [PubMed]
  14. Hochbaum, A.I.; Yang, P. Semiconductor Nanowires for Energy Conversion. Chem. Rev. 2010, 110, 527–546. [Google Scholar] [CrossRef]
  15. Wang, H.; Rogach, A.L. Hierarchical SnO2 Nanostructures: Recent Advances in Design, Synthesis, and Applications. Chem. Mater. 2014, 26, 123–133. [Google Scholar] [CrossRef]
  16. Nolan, M.; Elliott, S.D. The p-type conduction mechanism in Cu2O: A first principles study. Phys. Chem. Chem. Phys. 2006, 8, 5350–5358. [Google Scholar] [CrossRef] [PubMed]
  17. Rahimi, M.G.; Wang, A.Q.; Ma, G.J.; Han, N.; Chen, Y.F. A one-pot synthesis of a monolithic Cu2O/Cu catalyst for efficient ozone decomposition. RSC Adv. 2020, 10, 40916–40922. [Google Scholar] [CrossRef]
  18. Gong, S.Y.; Li, W.H.; Xie, Z.; Ma, X.; Liu, H.D.; Han, N.; Chen, Y.F. Low temperature decomposition of ozone by facilely synthesized cuprous oxide catalyst. New J. Chem. 2017, 41, 4828–4834. [Google Scholar] [CrossRef]
  19. Gong, S.; Chen, J.; Wu, X.; Han, N.; Chen, Y. In-situ synthesis of Cu2O/reduced graphene oxide composite as effective catalyst for ozone decomposition. Catal. Commun. 2018, 106, 25–29. [Google Scholar] [CrossRef]
  20. Zhang, Y.; Wang, D.; Zhang, X.; Qu, F. Template-Free Synthesis of Porous Cu2O Nanospheres at Room Temperature and Investigation on Their Adsorption Property. J. Nanomater. 2013, 2013, 378919. [Google Scholar] [CrossRef]
  21. Gong, S.Y.; Wang, A.Q.; Zhang, J.L.; Guan, J.; Han, N.; Chen, Y.F. Gram-scale synthesis of ultra-fine Cu2O for highly efficient ozone decomposition. RSC Adv. 2020, 10, 5212–5219. [Google Scholar] [CrossRef] [Green Version]
  22. Liu, J.; Gao, Z.; Han, H.; Wu, D.; Xu, F.; Wang, H.; Jiang, K. Mesoporous Cu2O submicro-spheres, facile synthesis and the selective adsorption properties. Chem. Eng. J. 2012, 185–186, 151–159. [Google Scholar] [CrossRef]
  23. Zoolfakar, A.S.; Rani, R.A.; Morfa, A.J.; O’Mullane, A.P.; Kalantar-Zadeh, K. Nanostructured copper oxide semiconductors: A perspective on materials, synthesis methods and applications. J. Mater. Chem. C 2014, 2, 5247–5270. [Google Scholar] [CrossRef] [Green Version]
  24. Kuo, C.H.; Huang, M.H. Morphologically controlled synthesis of Cu2O nanocrystals and their properties. Nano Today 2010, 5, 106–116. [Google Scholar] [CrossRef]
  25. Xu, Y.Y.; Jiao, X.L.; Chen, D.R. PEG-Assisted Preparation of Single-Crystalline Cu2O Hollow Nanocubes. J. Phys. Chem. C 2008, 112, 16769–16773. [Google Scholar] [CrossRef]
  26. Chen, K.F.; Xue, D.F. pH-assisted crystallization of Cu2O: Chemical reactions control the evolution from nanowires to polyhedra. Crystengcomm 2012, 14, 8068–8075. [Google Scholar] [CrossRef]
  27. Leng, M.; Liu, M.Z.; Zhang, Y.B.; Wang, Z.Q.; Yu, C.; Yang, X.G.; Zhang, H.J.; Wang, C. Polyhedral 50-Facet Cu2O Microcrystals Partially Enclosed by {311} High-Index Planes: Synthesis and Enhanced Catalytic CO Oxidation Activity. J. Am. Chem. Soc. 2010, 132, 17084–17087. [Google Scholar] [CrossRef]
  28. Kleitz, F.; Solovyov, L.A.; Anilkumar, G.M.; Choi, S.H.; Ryoo, R. Transformation of highly ordered large pore silica mesophases (Fm3m, Im3m and p6mm) in a ternary triblock copolymer-butanol-water system. Chem. Commun 2004, 1536–1537. [Google Scholar] [CrossRef]
  29. Kleitz, F.; Kim, T.W.; Ryoo, R. Phase domain of the cubic im3m mesoporous silica in the EO106PO70EO106-butanol-H2O system. Langmuir 2006, 22, 440–445. [Google Scholar] [CrossRef]
  30. Sun, S.; Kong, C.; You, H.; Song, X.; Ding, B.; Yang, Z. Facet-selective growth of Cu–Cu2O heterogeneous architectures. CrystEngComm 2012, 14, 40–43. [Google Scholar] [CrossRef]
  31. Parmigiani, F.; Pacchioni, G.; Illas, F.; Bagus, P.S. Studies of the Cu2O bond in cupric oxide by X-ray photoelectron spectroscopy and ab initio electronic structure models. J. Electron. Spectrosc. Relat. Phenom. 1992, 59, 255–269. [Google Scholar] [CrossRef]
  32. Komarneni, M.; Shan, J.; Chakradhar, A.; Kadossov, E.; Cabrini, S.; Burghaus, U. Adsorption Dynamics of CO on Silica Supported CuOx Clusters: Utilizing Electron Beam Lithography To Study Methanol Synthesis Model Systems. J. Phys. Chem. C 2012, 116, 5792–5801. [Google Scholar] [CrossRef]
  33. Jia, J.; Zhang, P.; Chen, L. Catalytic decomposition of gaseous ozone over manganese dioxides with different crystal structures. Appl. Catal. B Environ. 2016, 189, 210–218. [Google Scholar] [CrossRef]
  34. Wang, Q.; Wang, W.; Zhong, L.; Liu, D.; Cao, X.; Cui, F. Oxygen vacancy-rich 2D/2D BiOCl-g-C3N4 ultrathin heterostructure nanosheets for enhanced visible-light-driven photocatalytic activity in environmental remediation. Appl. Catal. B Environ. 2018, 220, 290–302. [Google Scholar] [CrossRef]
  35. Bi, W.; Ye, C.; Xiao, C.; Tong, W.; Zhang, X.; Shao, W.; Xie, Y. Spatial Location Engineering of Oxygen Vacancies for Optimized Photocatalytic H2 Evolution Activity. Small 2014, 10, 2820–2825. [Google Scholar] [CrossRef]
  36. Wang, A.; Zhang, L.; Rahimi, M.G.; Gong, S.; Nie, L.; Han, N.; Chen, Y. Defect engineering of ZnO for electron transfer in O3 catalytic decomposition. Appl. Catal. B Environ. 2020, 277, 119223. [Google Scholar] [CrossRef]
Figure 1. Schematics of the Cu2O catalyst synthesis process.
Catalysts 11 00600 g001
Figure 2. Transmission electron microscope (TEM) images of Cu2O catalysts synthesized by: (a) NaOH, (b) NaOH + P123, (c) NaOH + NH3 + P123, and (d) NaOH +NH3 + P123 + n-butanol.
Catalysts 11 00600 g002
Figure 3. XRD patterns of the sample differentiated from their synthetic conditions.
Catalysts 11 00600 g003
Figure 4. Ozone decomposition performance of Cu2O. (a) Ozone conversion at different space velocities in dry air, (b) ozone decomposition at space velocity of 480,000 cm3·g−1·h−1 and relative humidity 90%, and (c) stability test of Cu2O prepared by NaOH, NH3, P123 and n-butanol at 480,000 cm3·g−1·h−1 in dry air.
Catalysts 11 00600 g004
Figure 5. XPS spectra of Cu2O catalysts. (a) Cu2p spectra, (b) deconvoluted Cu2p spectrum of sample Na + NH3 + P123 + But. (c) O1s spectra, and (d) deconvoluted O1s spectrum of sample Na + NH3 + P123 + But.
Catalysts 11 00600 g005
Figure 6. EPR spectra of Cu2O samples.
Catalysts 11 00600 g006
Figure 7. Schematic diagram of the ozone detection device.
Catalysts 11 00600 g007
Table 1. The morphology and structure of the Cu2O catalysts obtained by different conditions.
CatalystAlkaliSurfactantMorphology aaBET
(m2·g−1)
Barrett-Joyner-Halenda (nm)Crystallite-Size (nm) 1
--NH3P123No precipitation
NaNaOH--Cube4.88945.4
--NaOHN-butanolCube27.49.642.8
Na + P123NaOHP123Sphere13.21.734.4
Na + NH3 + P123NaOH + NH3P123Porous sphere41.56.45.5
Na + NH3 + P123 + But.NaOH + NH3P123 + N-butanolAmorphous granules79.53.72.7
1 The Crystallite-size was calculated using the Scherrer formula using XRD data; 2 TEM image is presented in Figure S3; aa The phase purity of the products was investigated using XRD, as shown in Figure 3.
Publisher’s Note: MDPI stays neutral with regard to jurisdictional claims in published maps and institutional affiliations.