
Catalytic Elimination of Carbon Monoxide, Ethyl Acetate, and Toluene over the Ni/OMS-2 Catalysts


Abstract
:
1. Introduction
2. Experimental
2.1. Catalyst Preparation
2.2. Catalyst Characterization
2.3. Catalytic Activity Evaluation
3. Results and Discussion
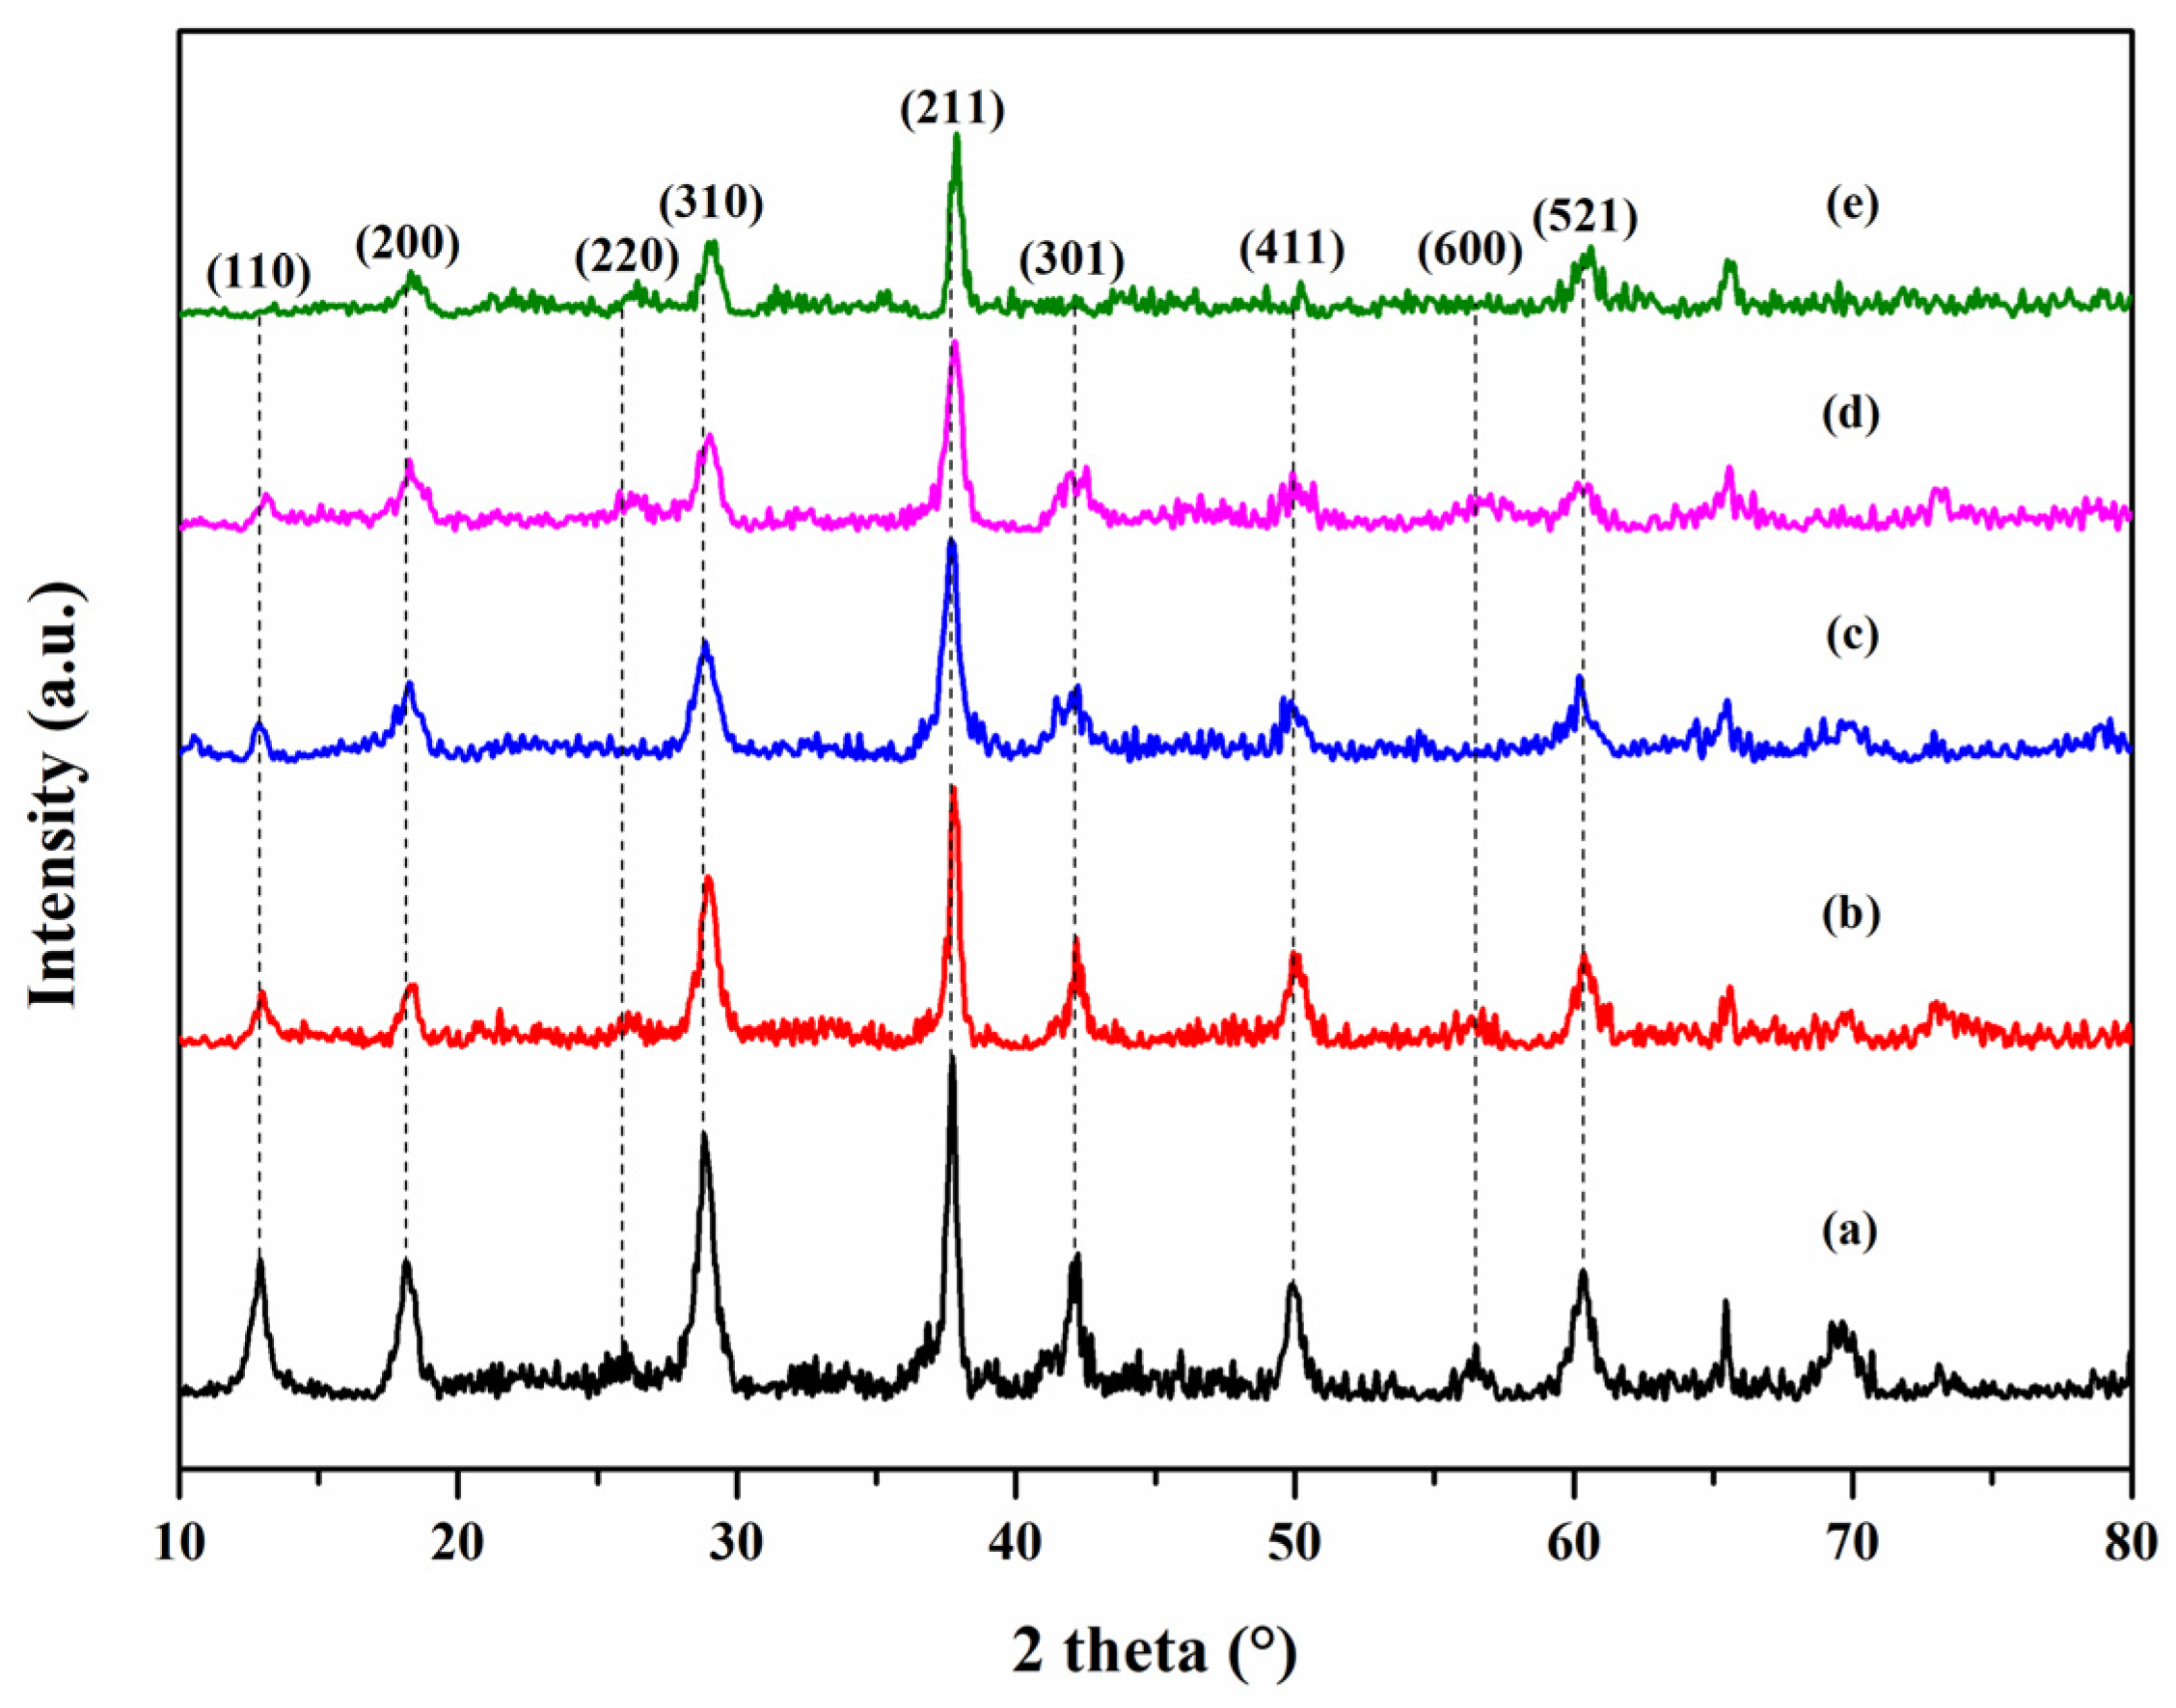
3.1. XRD Analysis
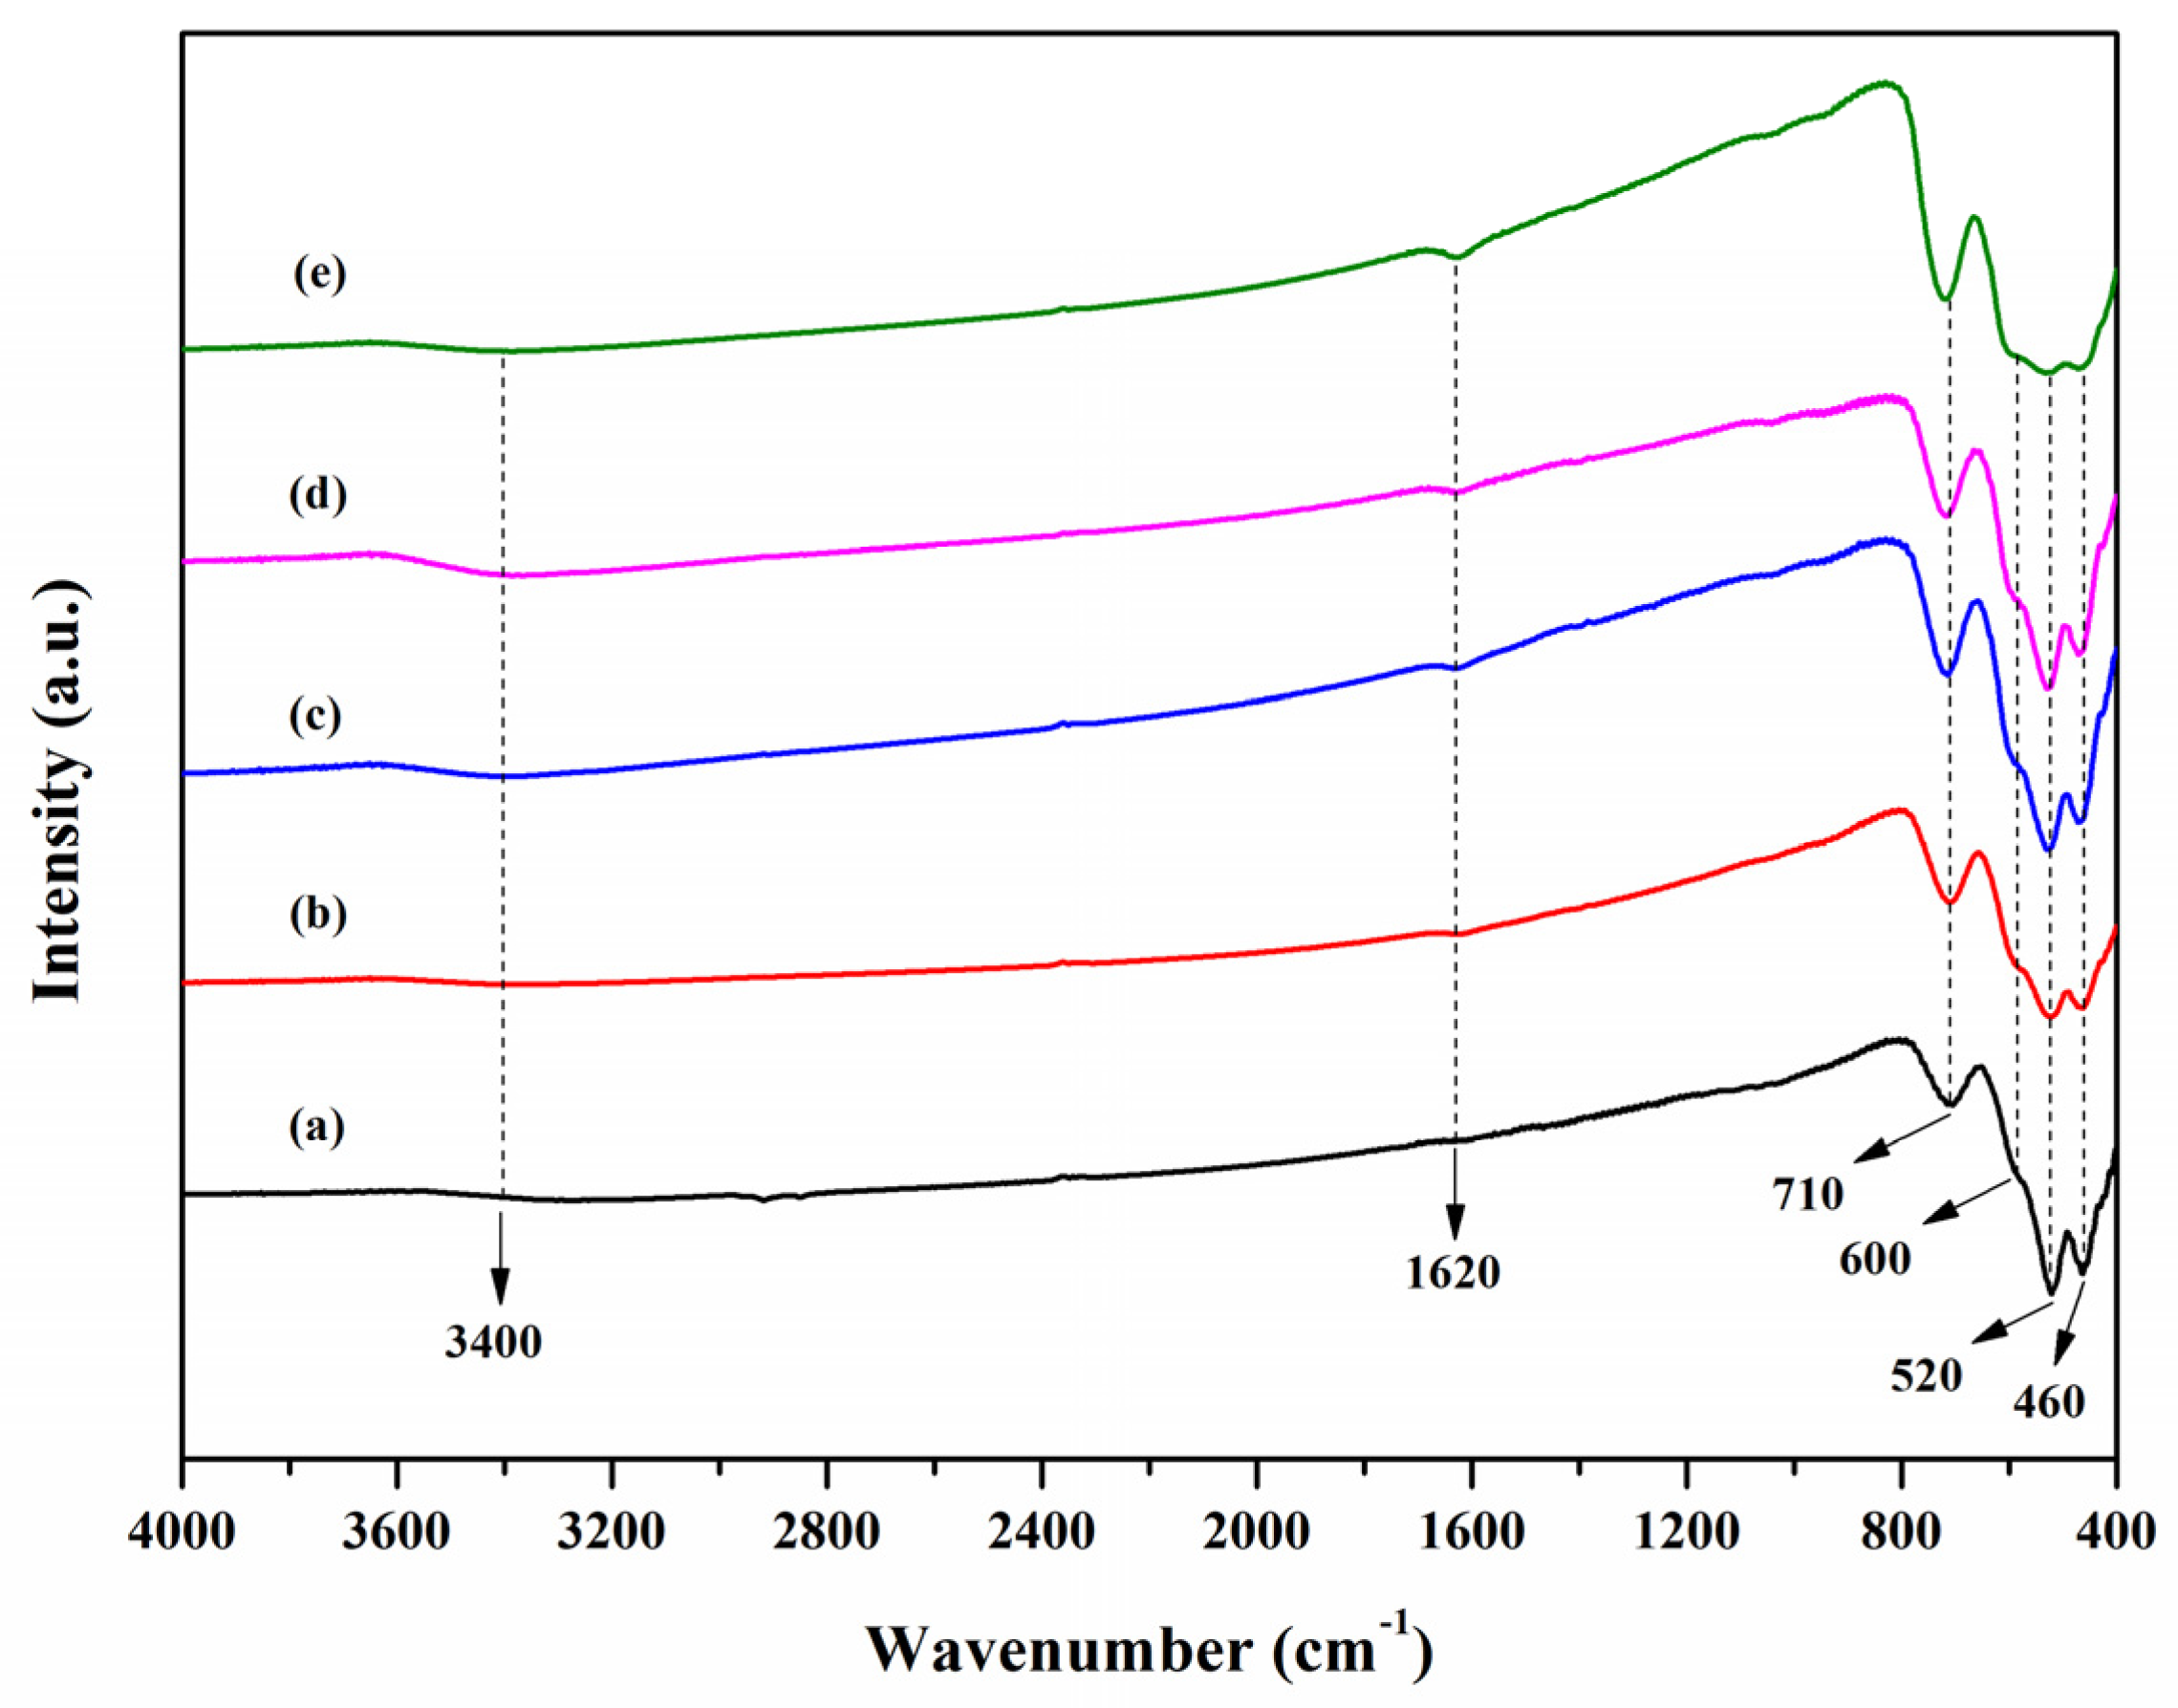
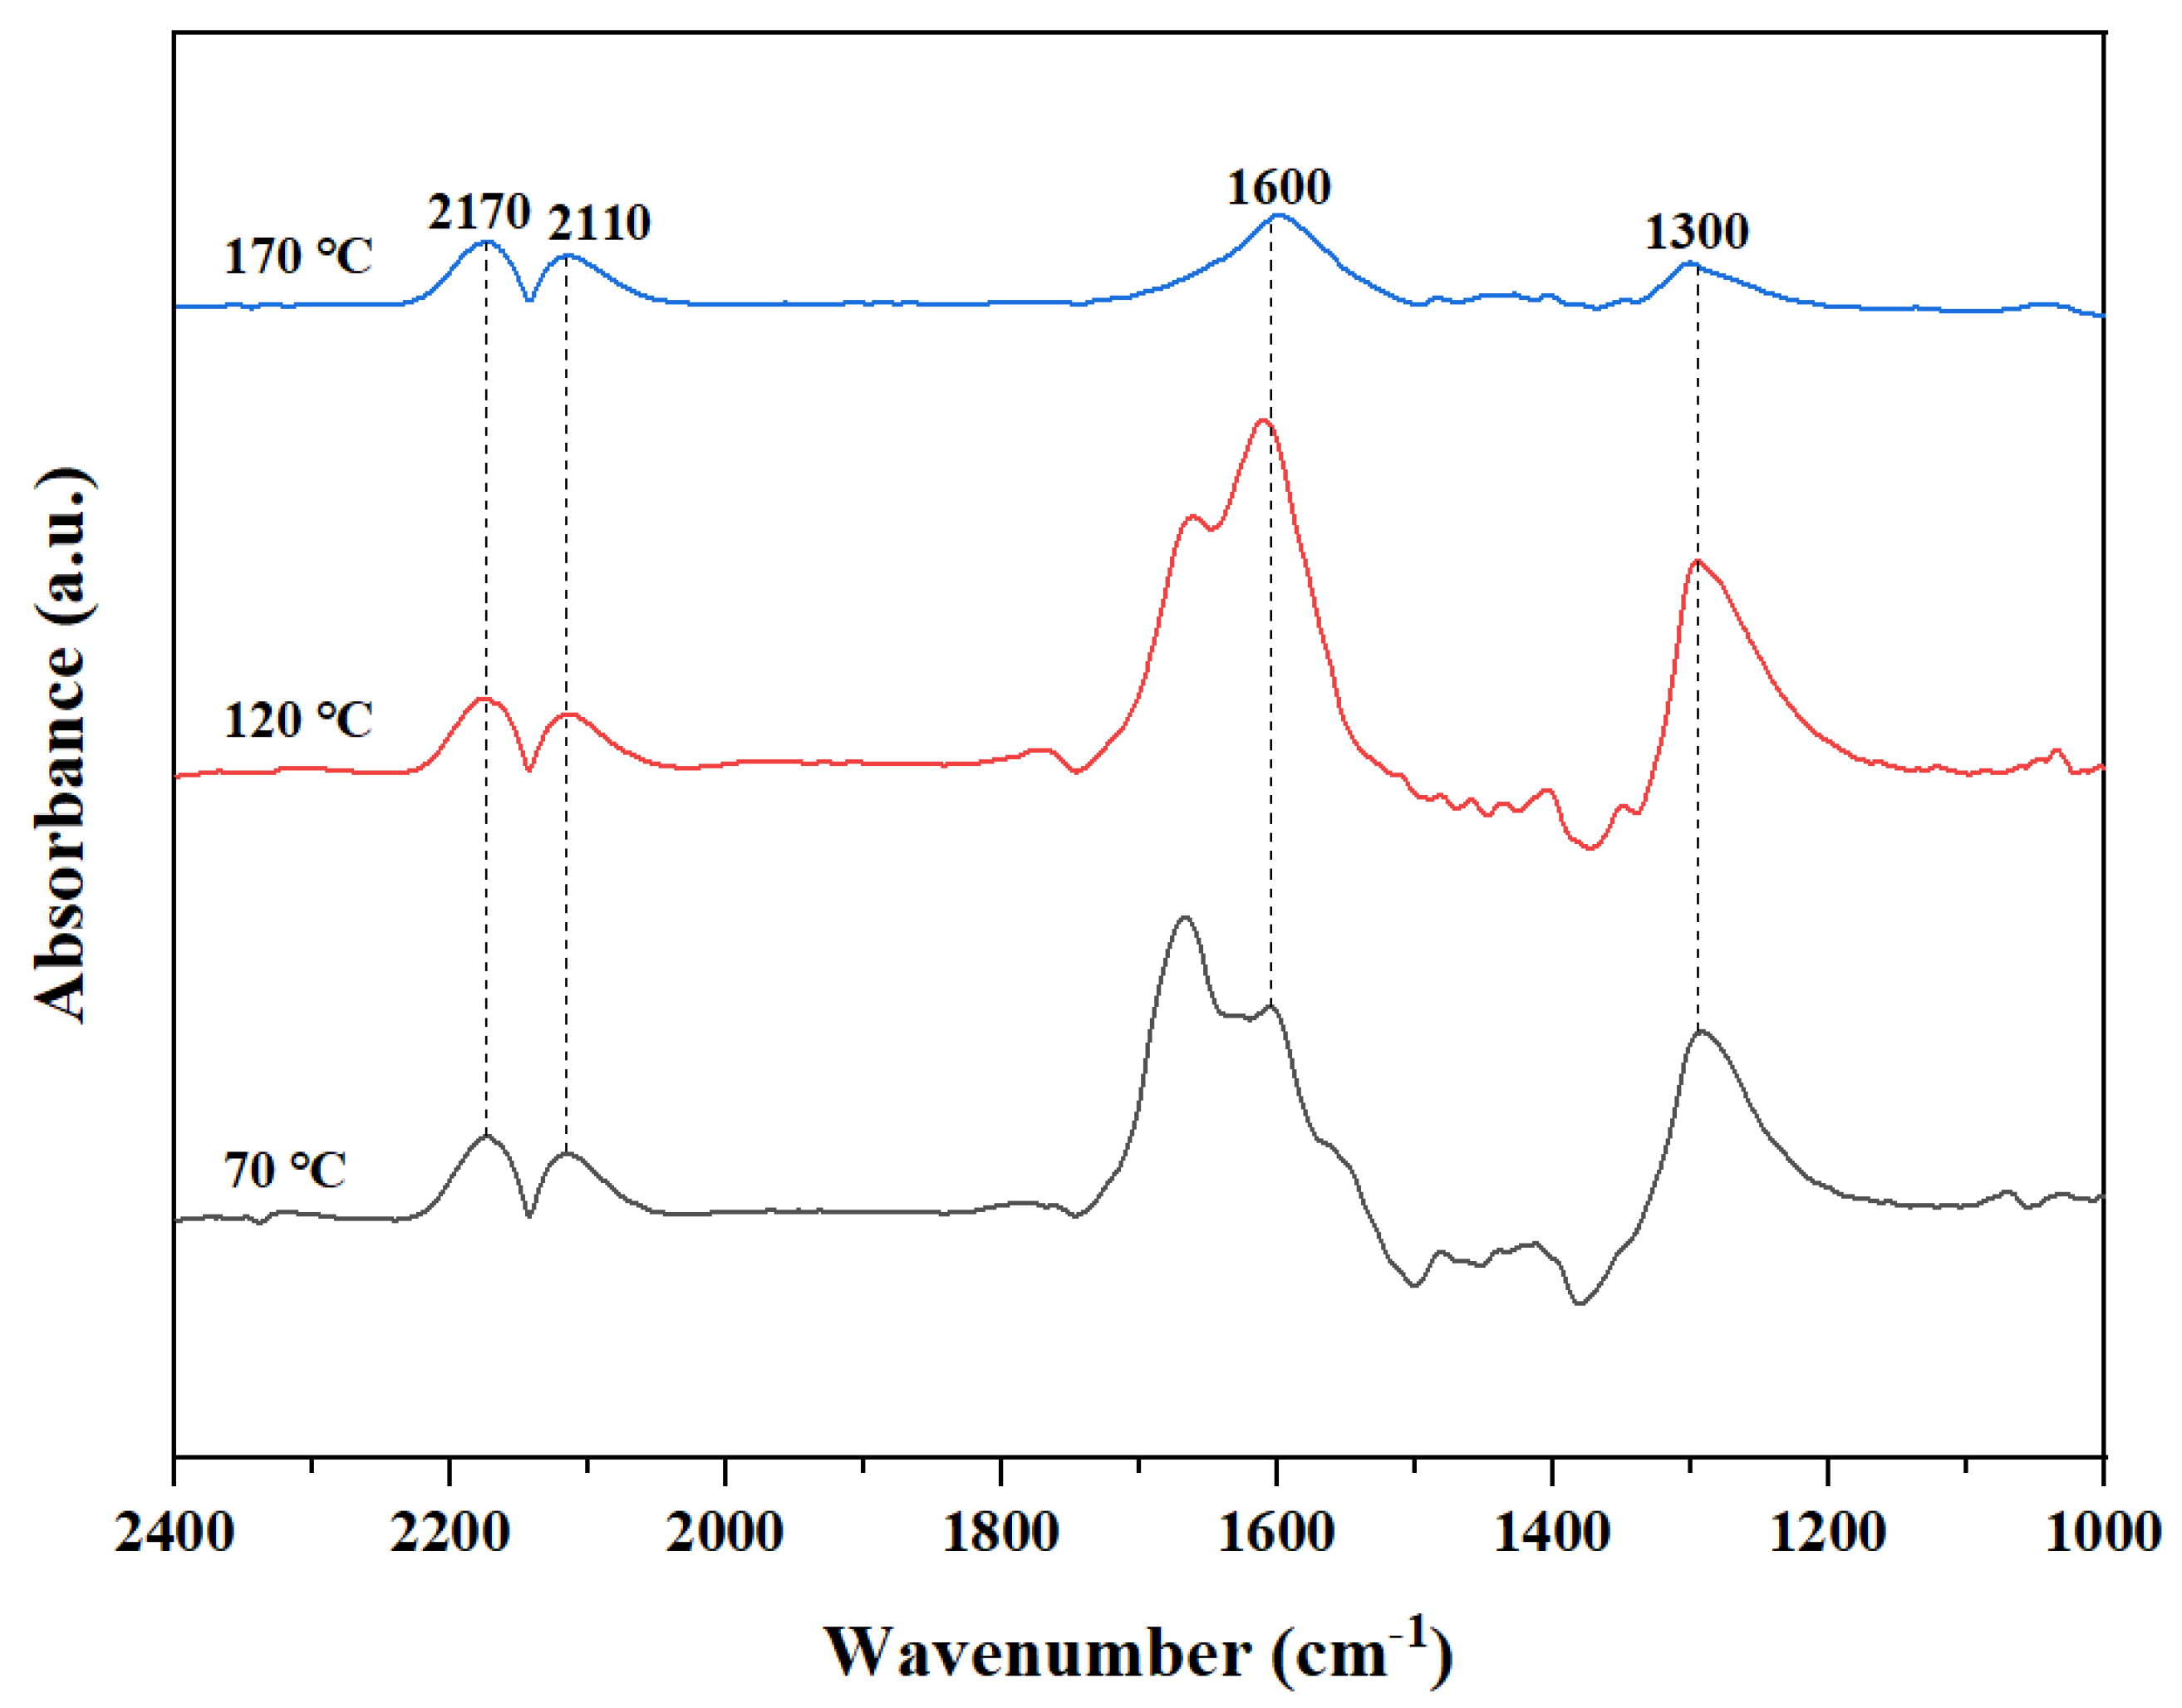
3.2. FT-IR Analysis
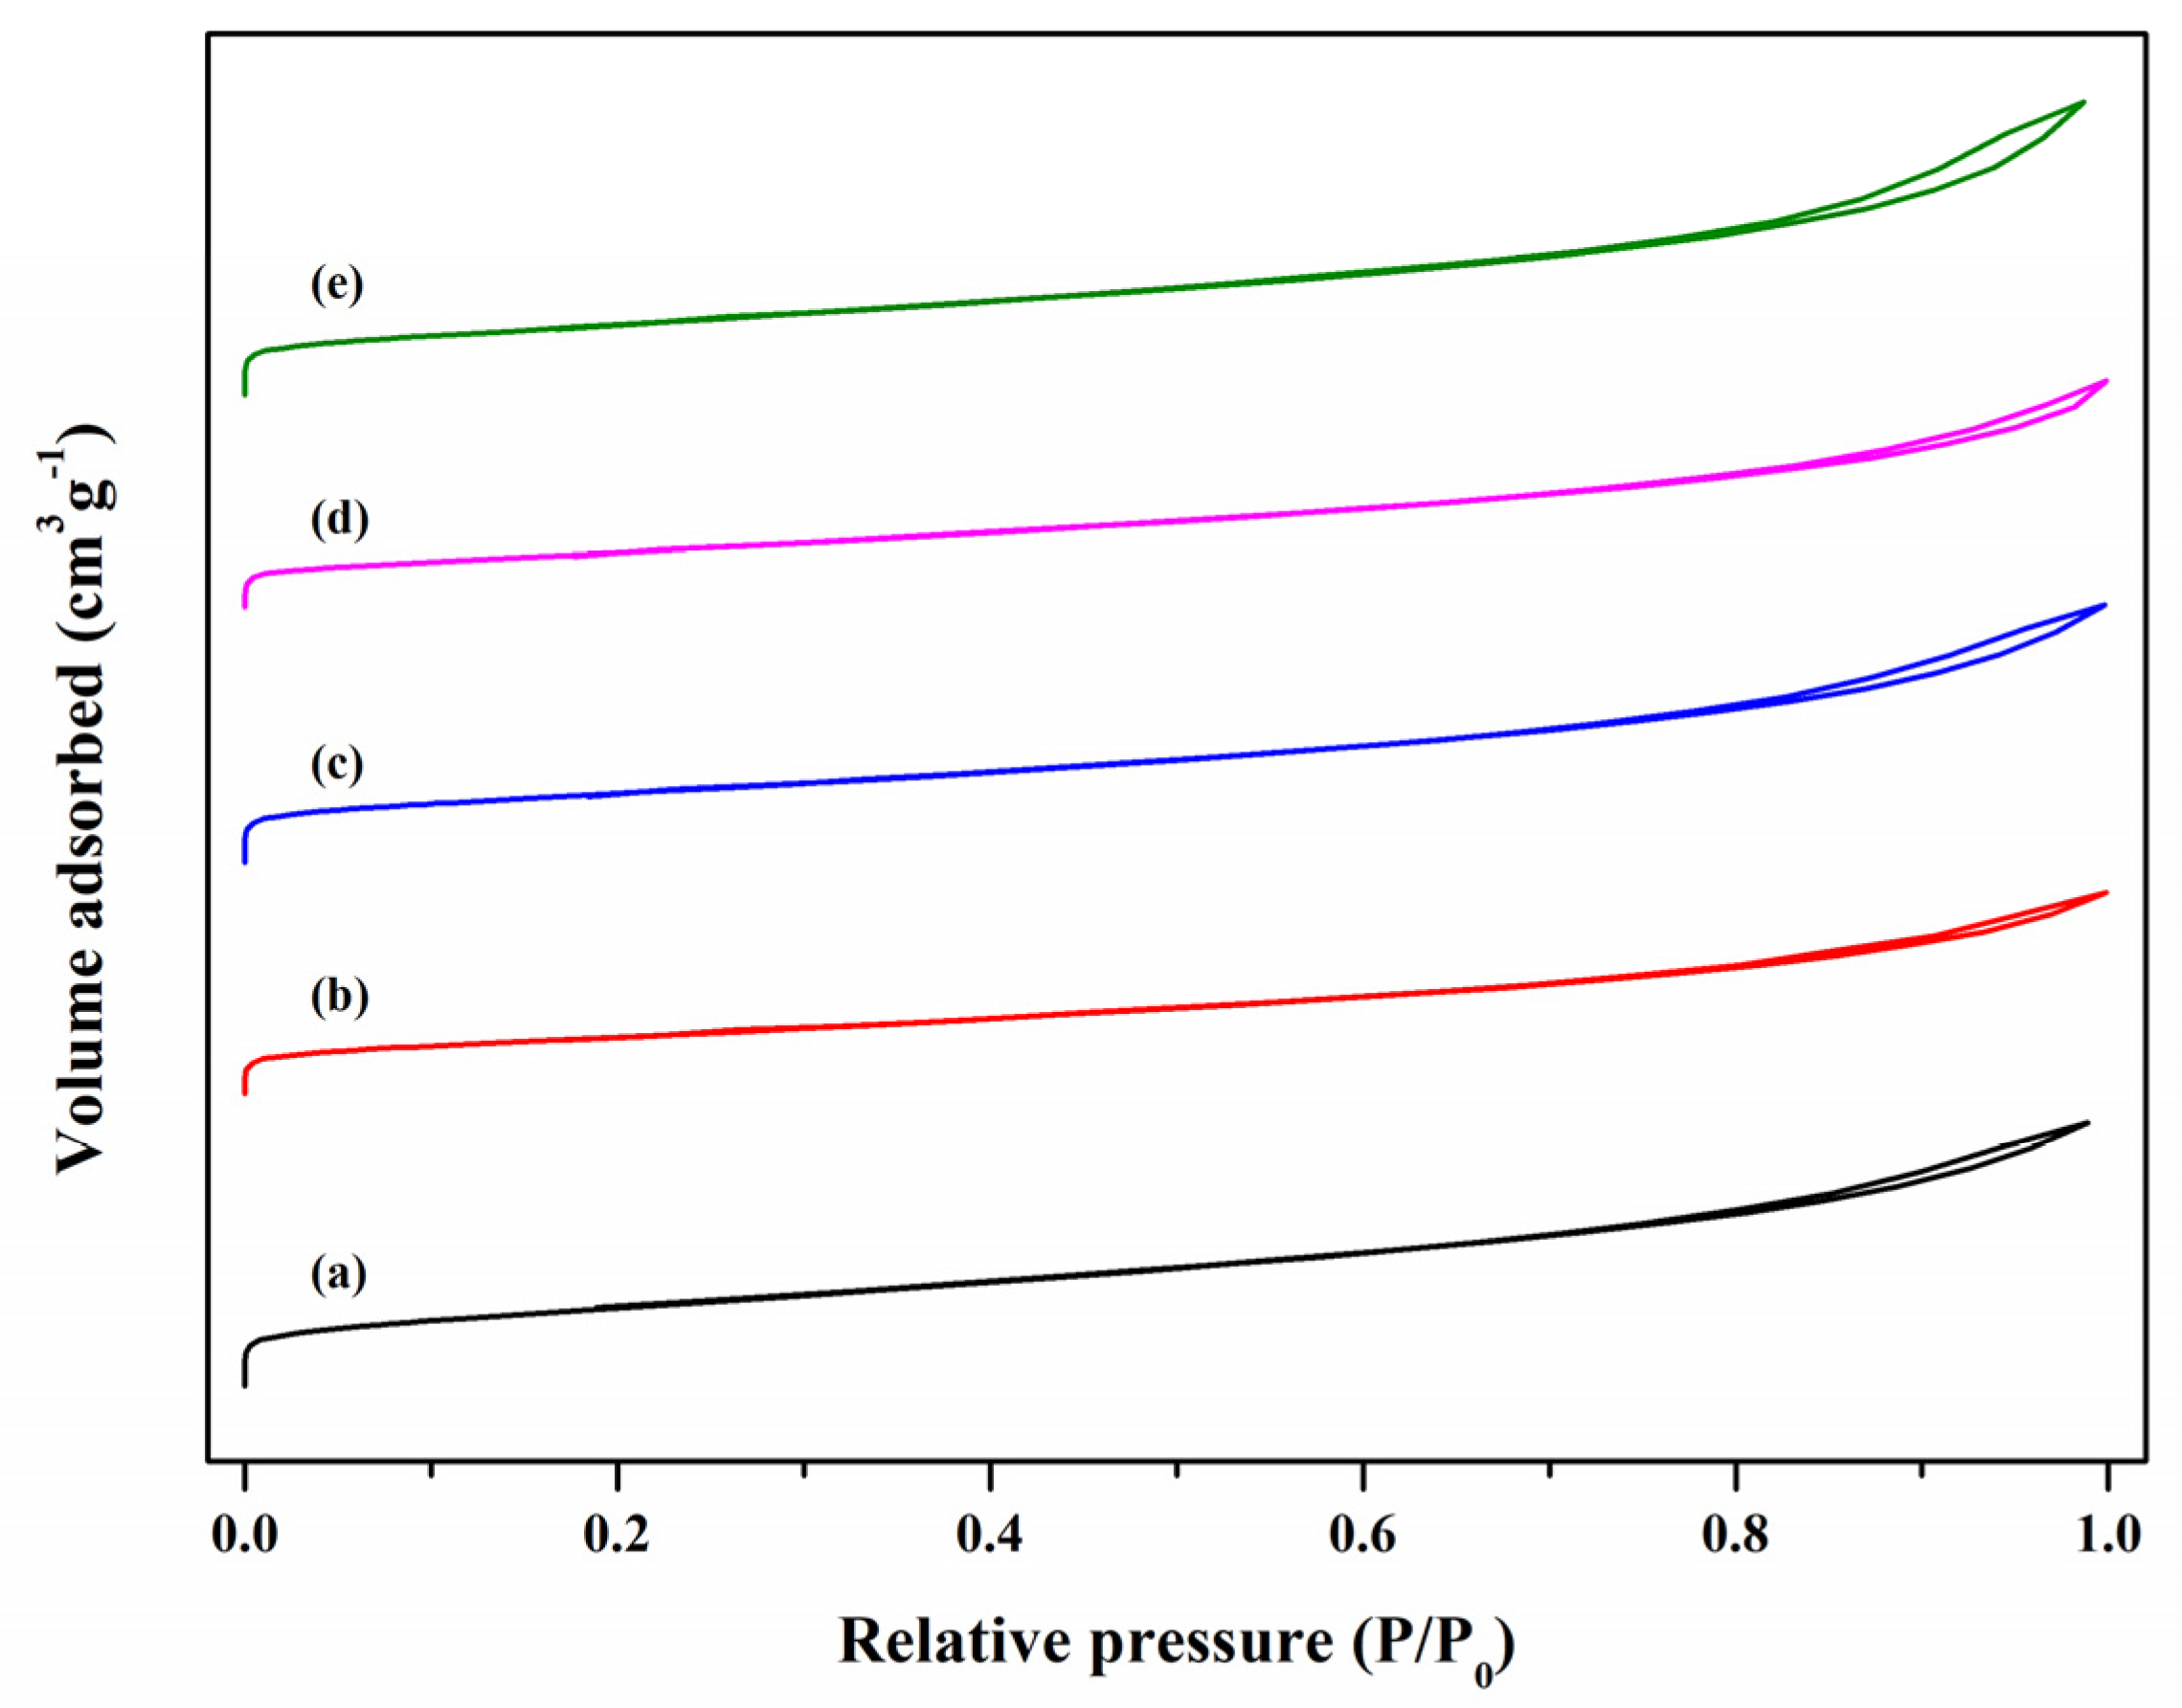
3.3. N2Adsorption–Desorption Analysis
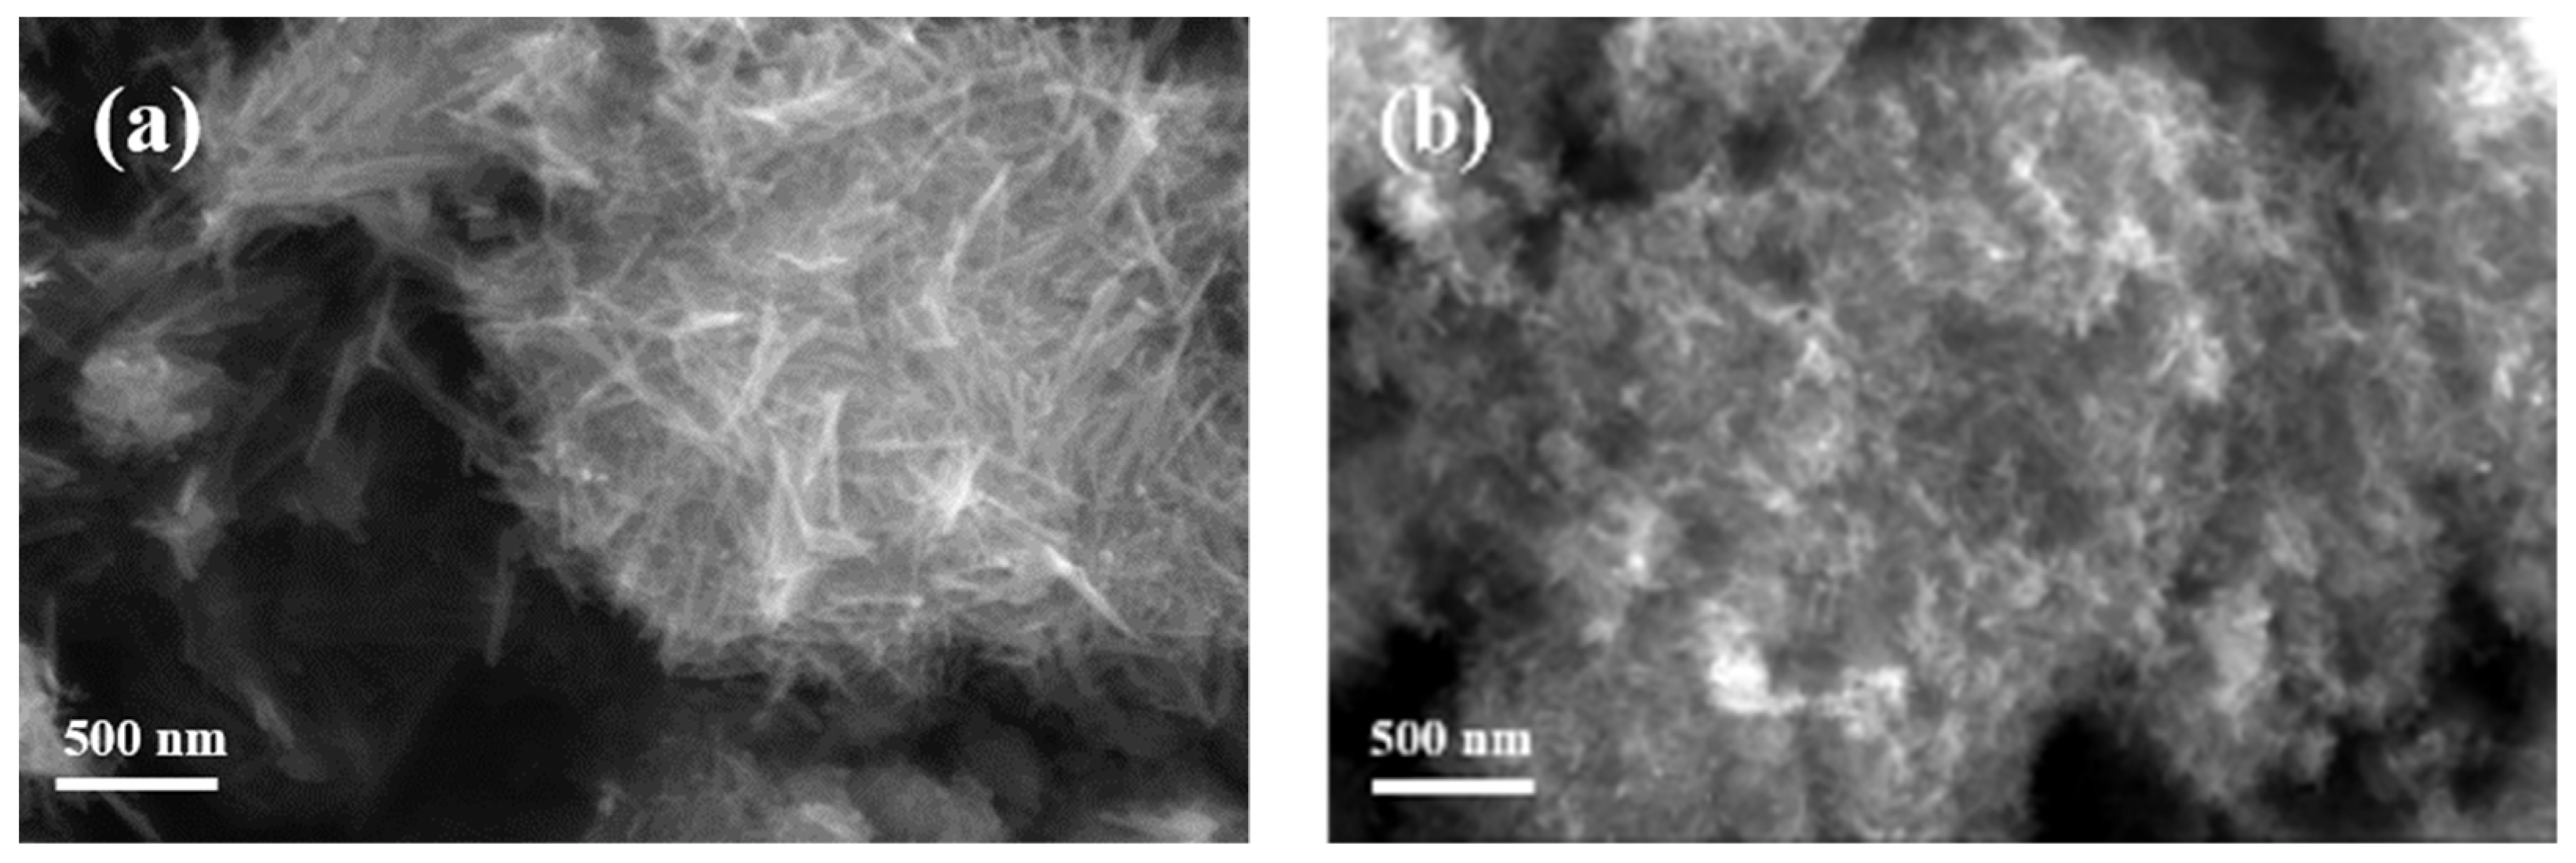
3.4. SEM Analysis
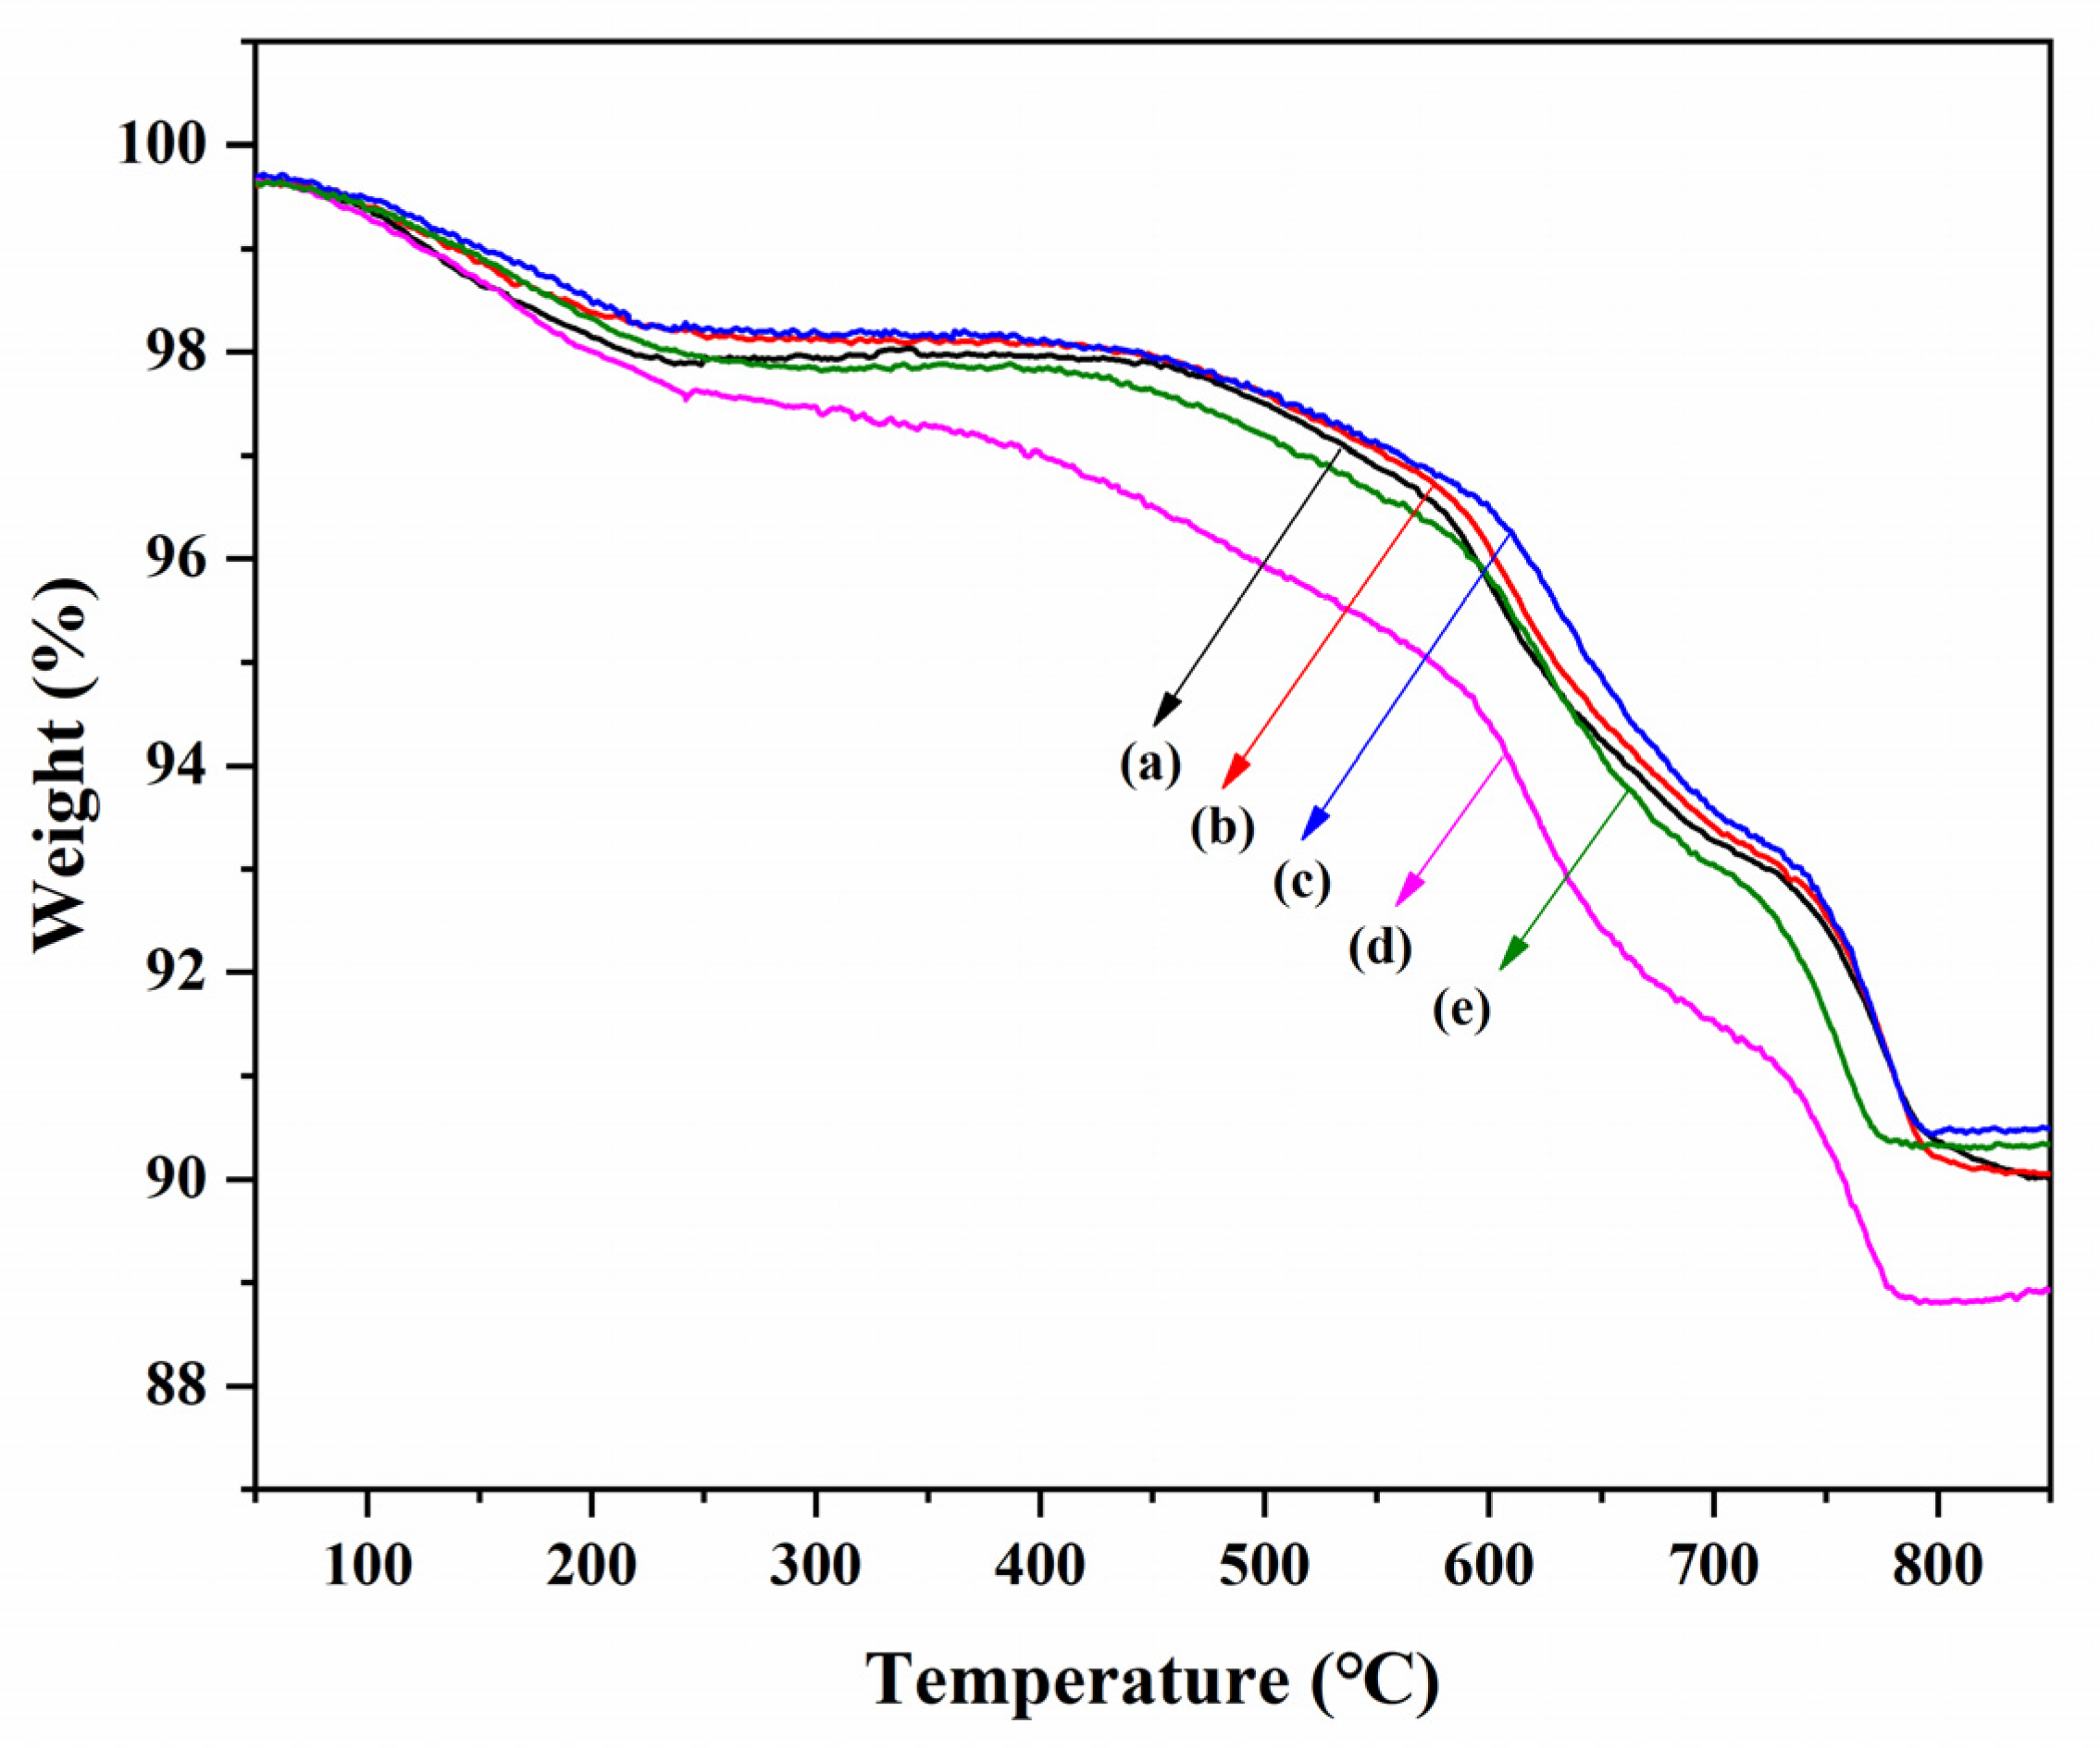
3.5. TG Analysis
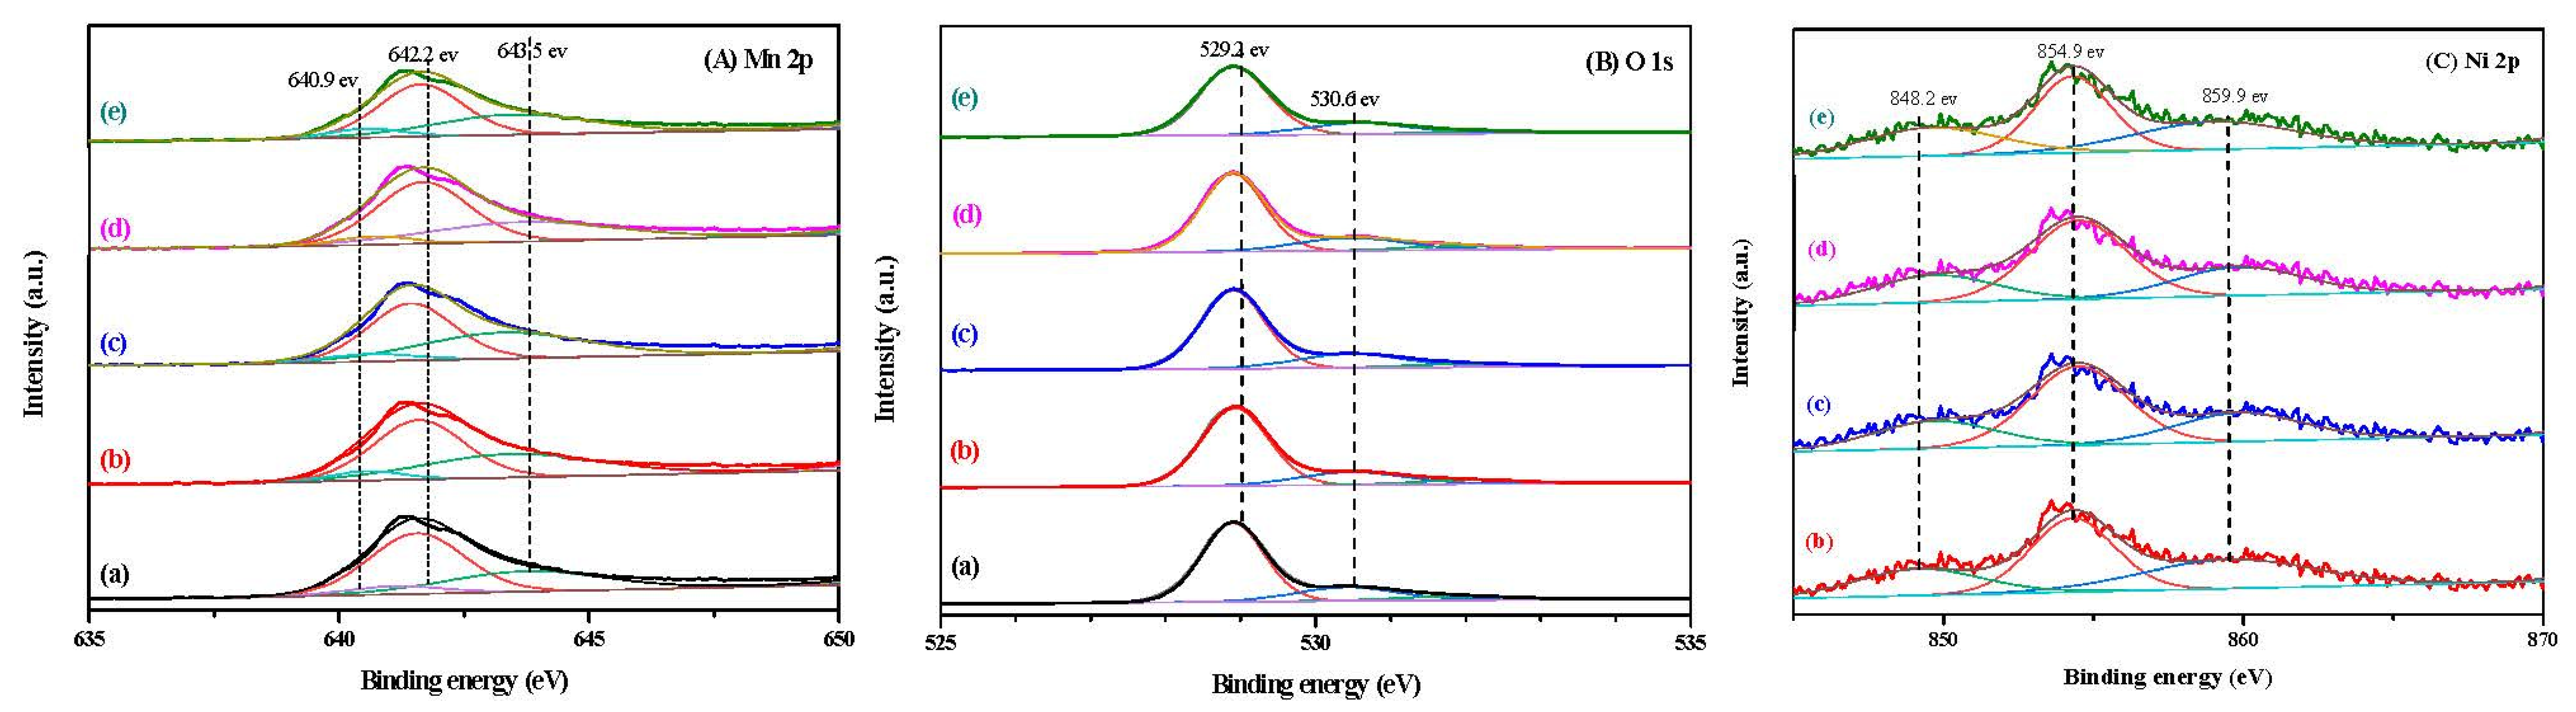
3.6. XPS Analysis
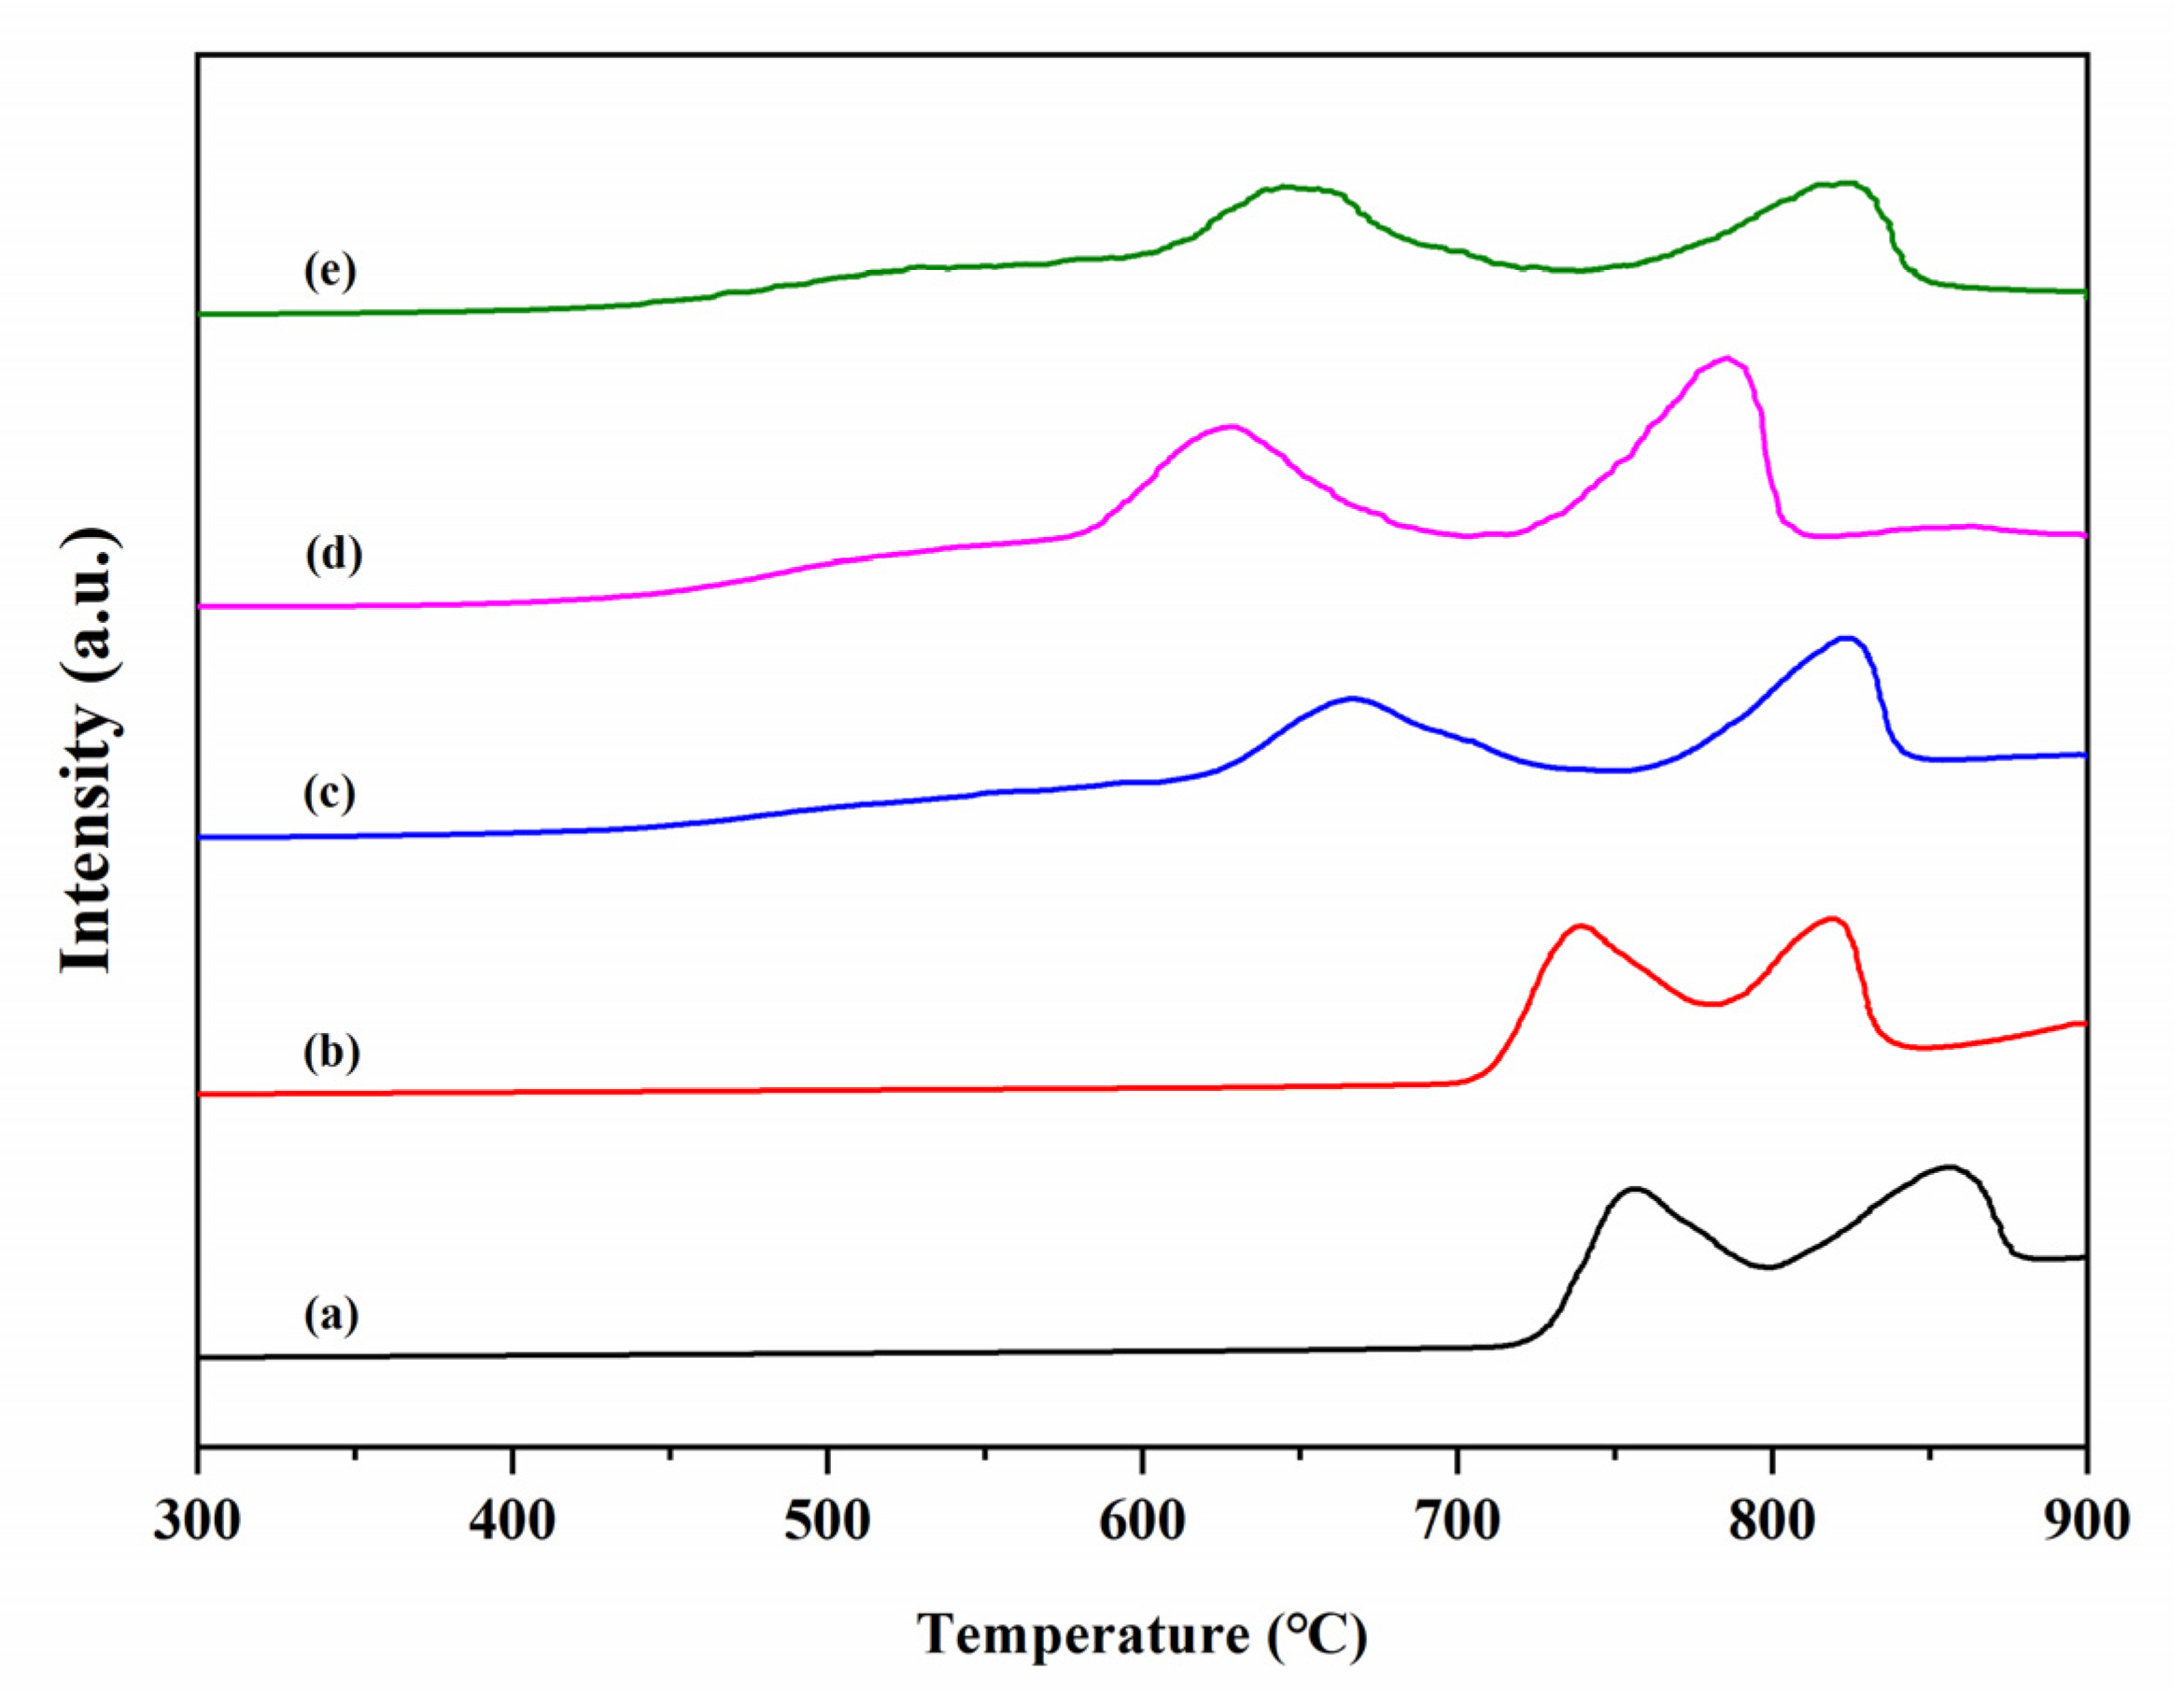
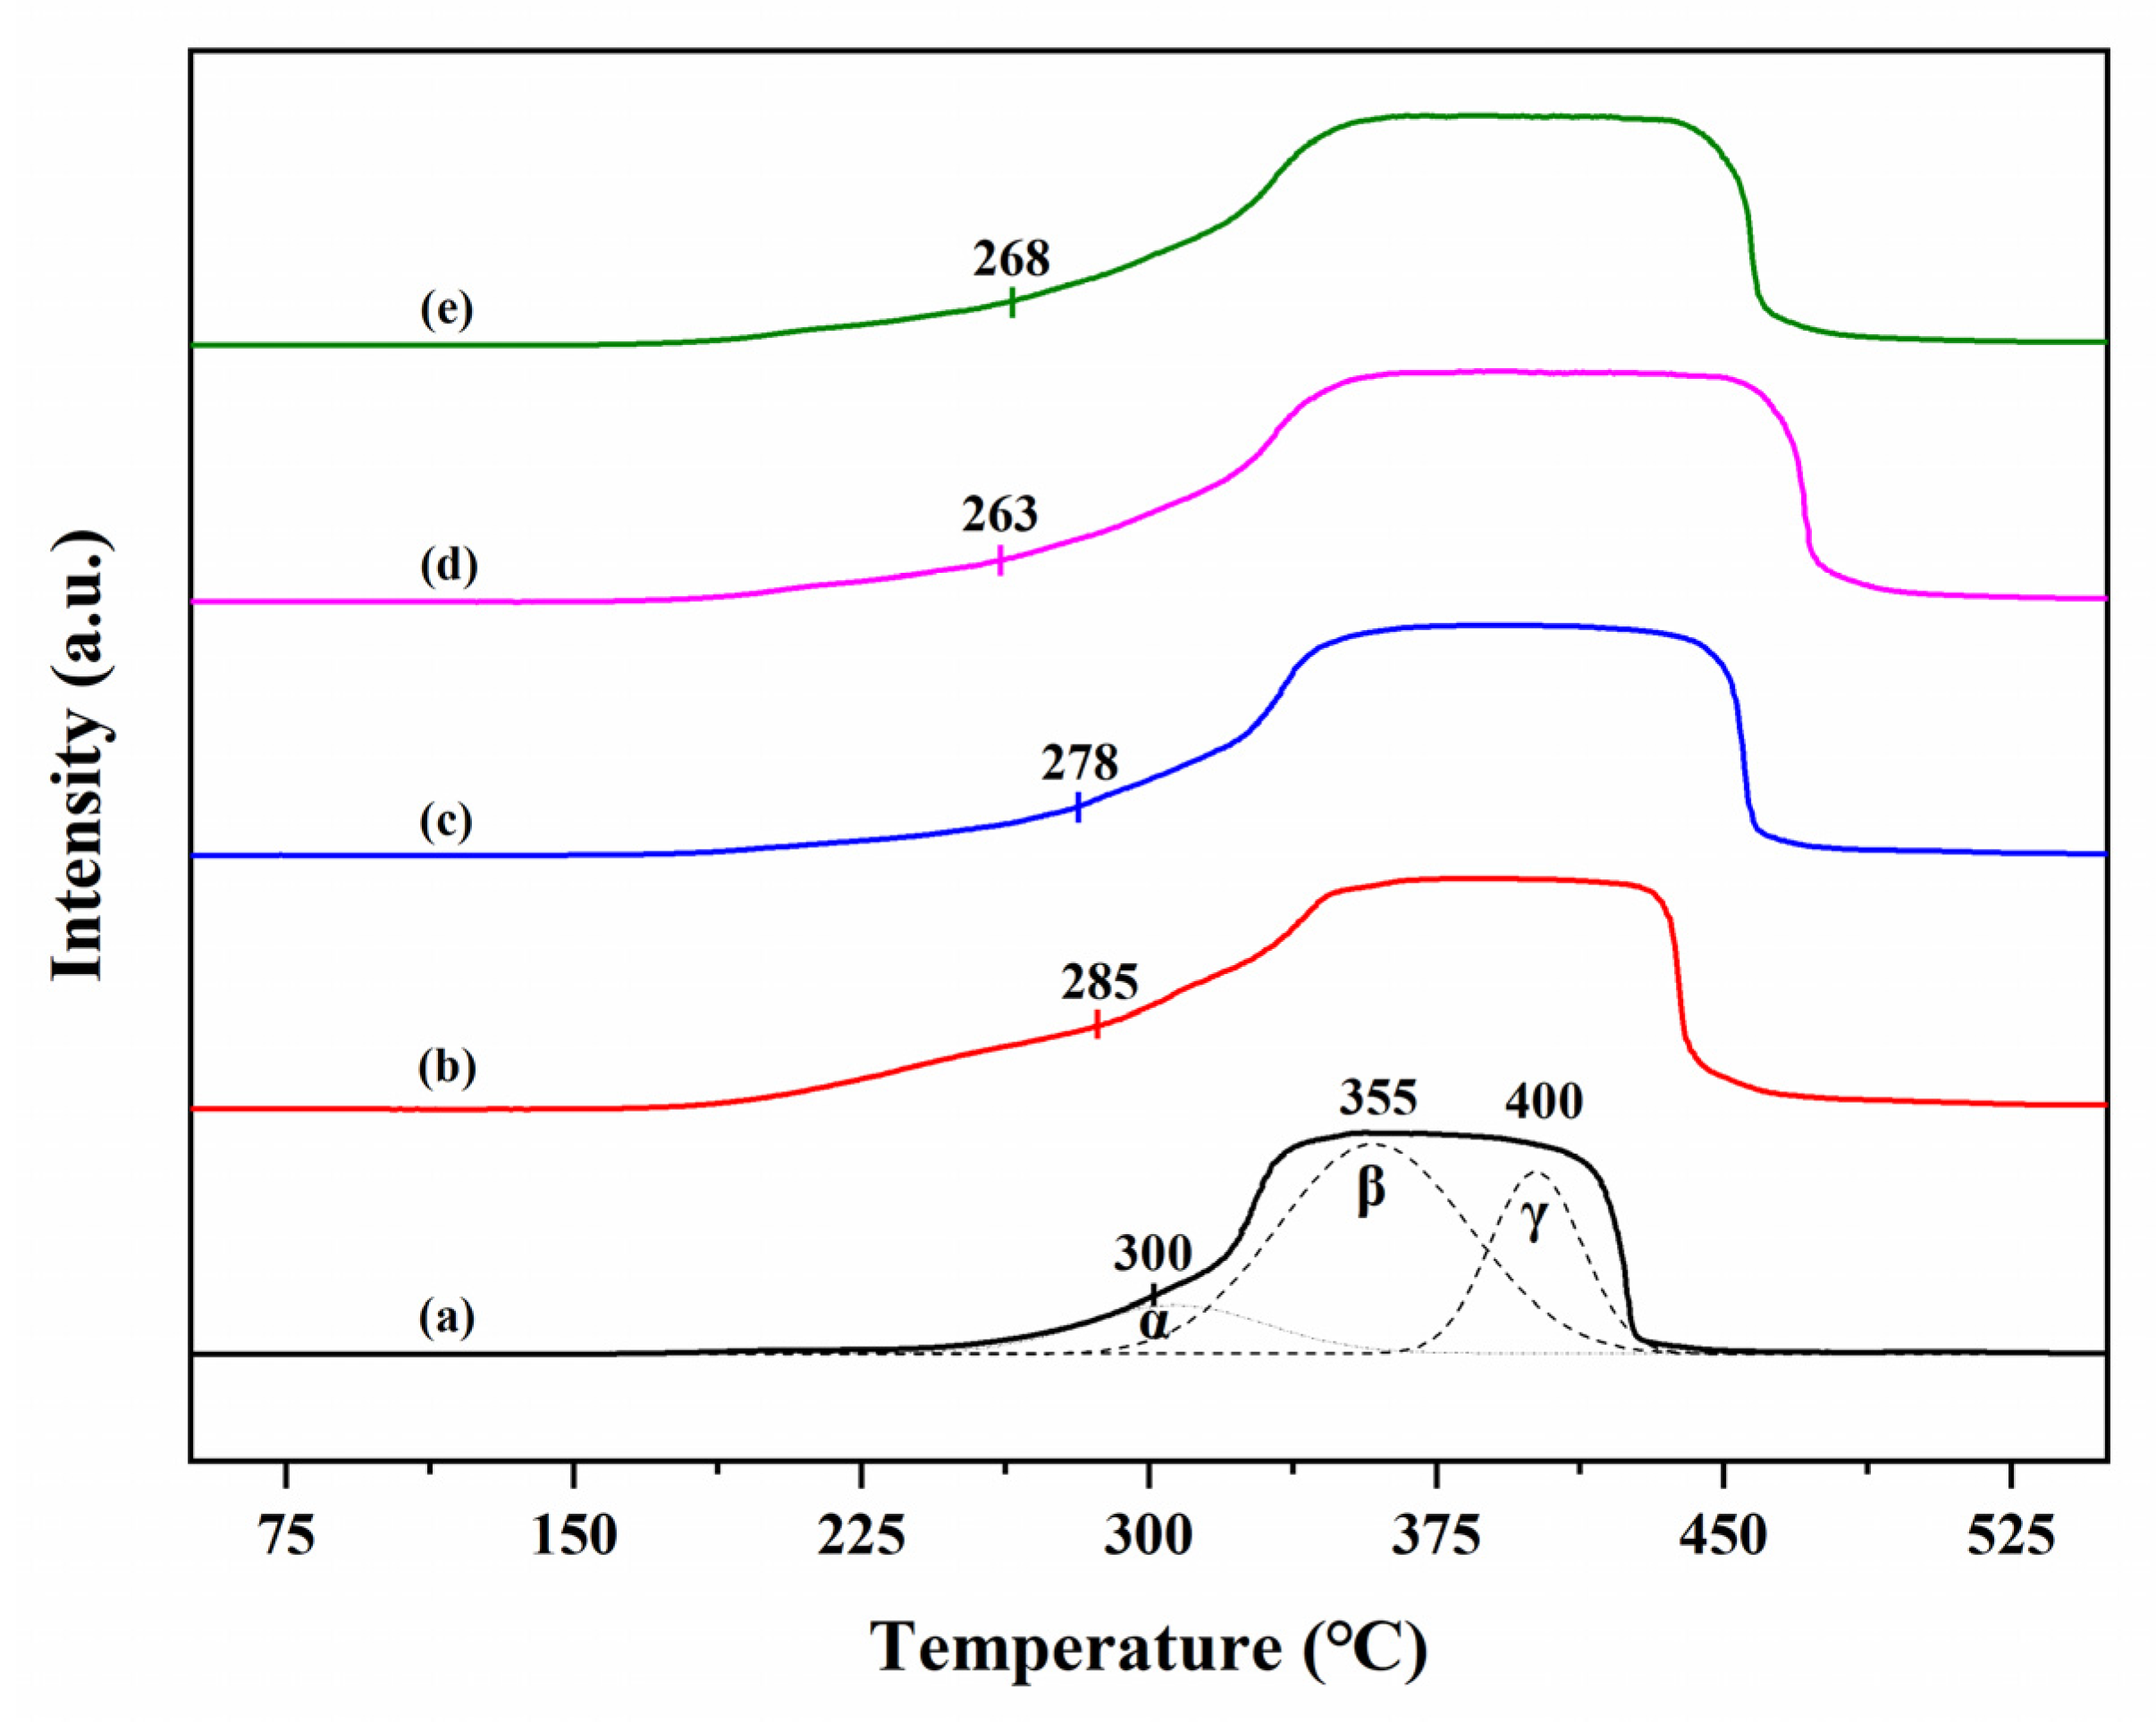
3.7. O2-TPD Analysis
3.8. H2-TPR Analysis
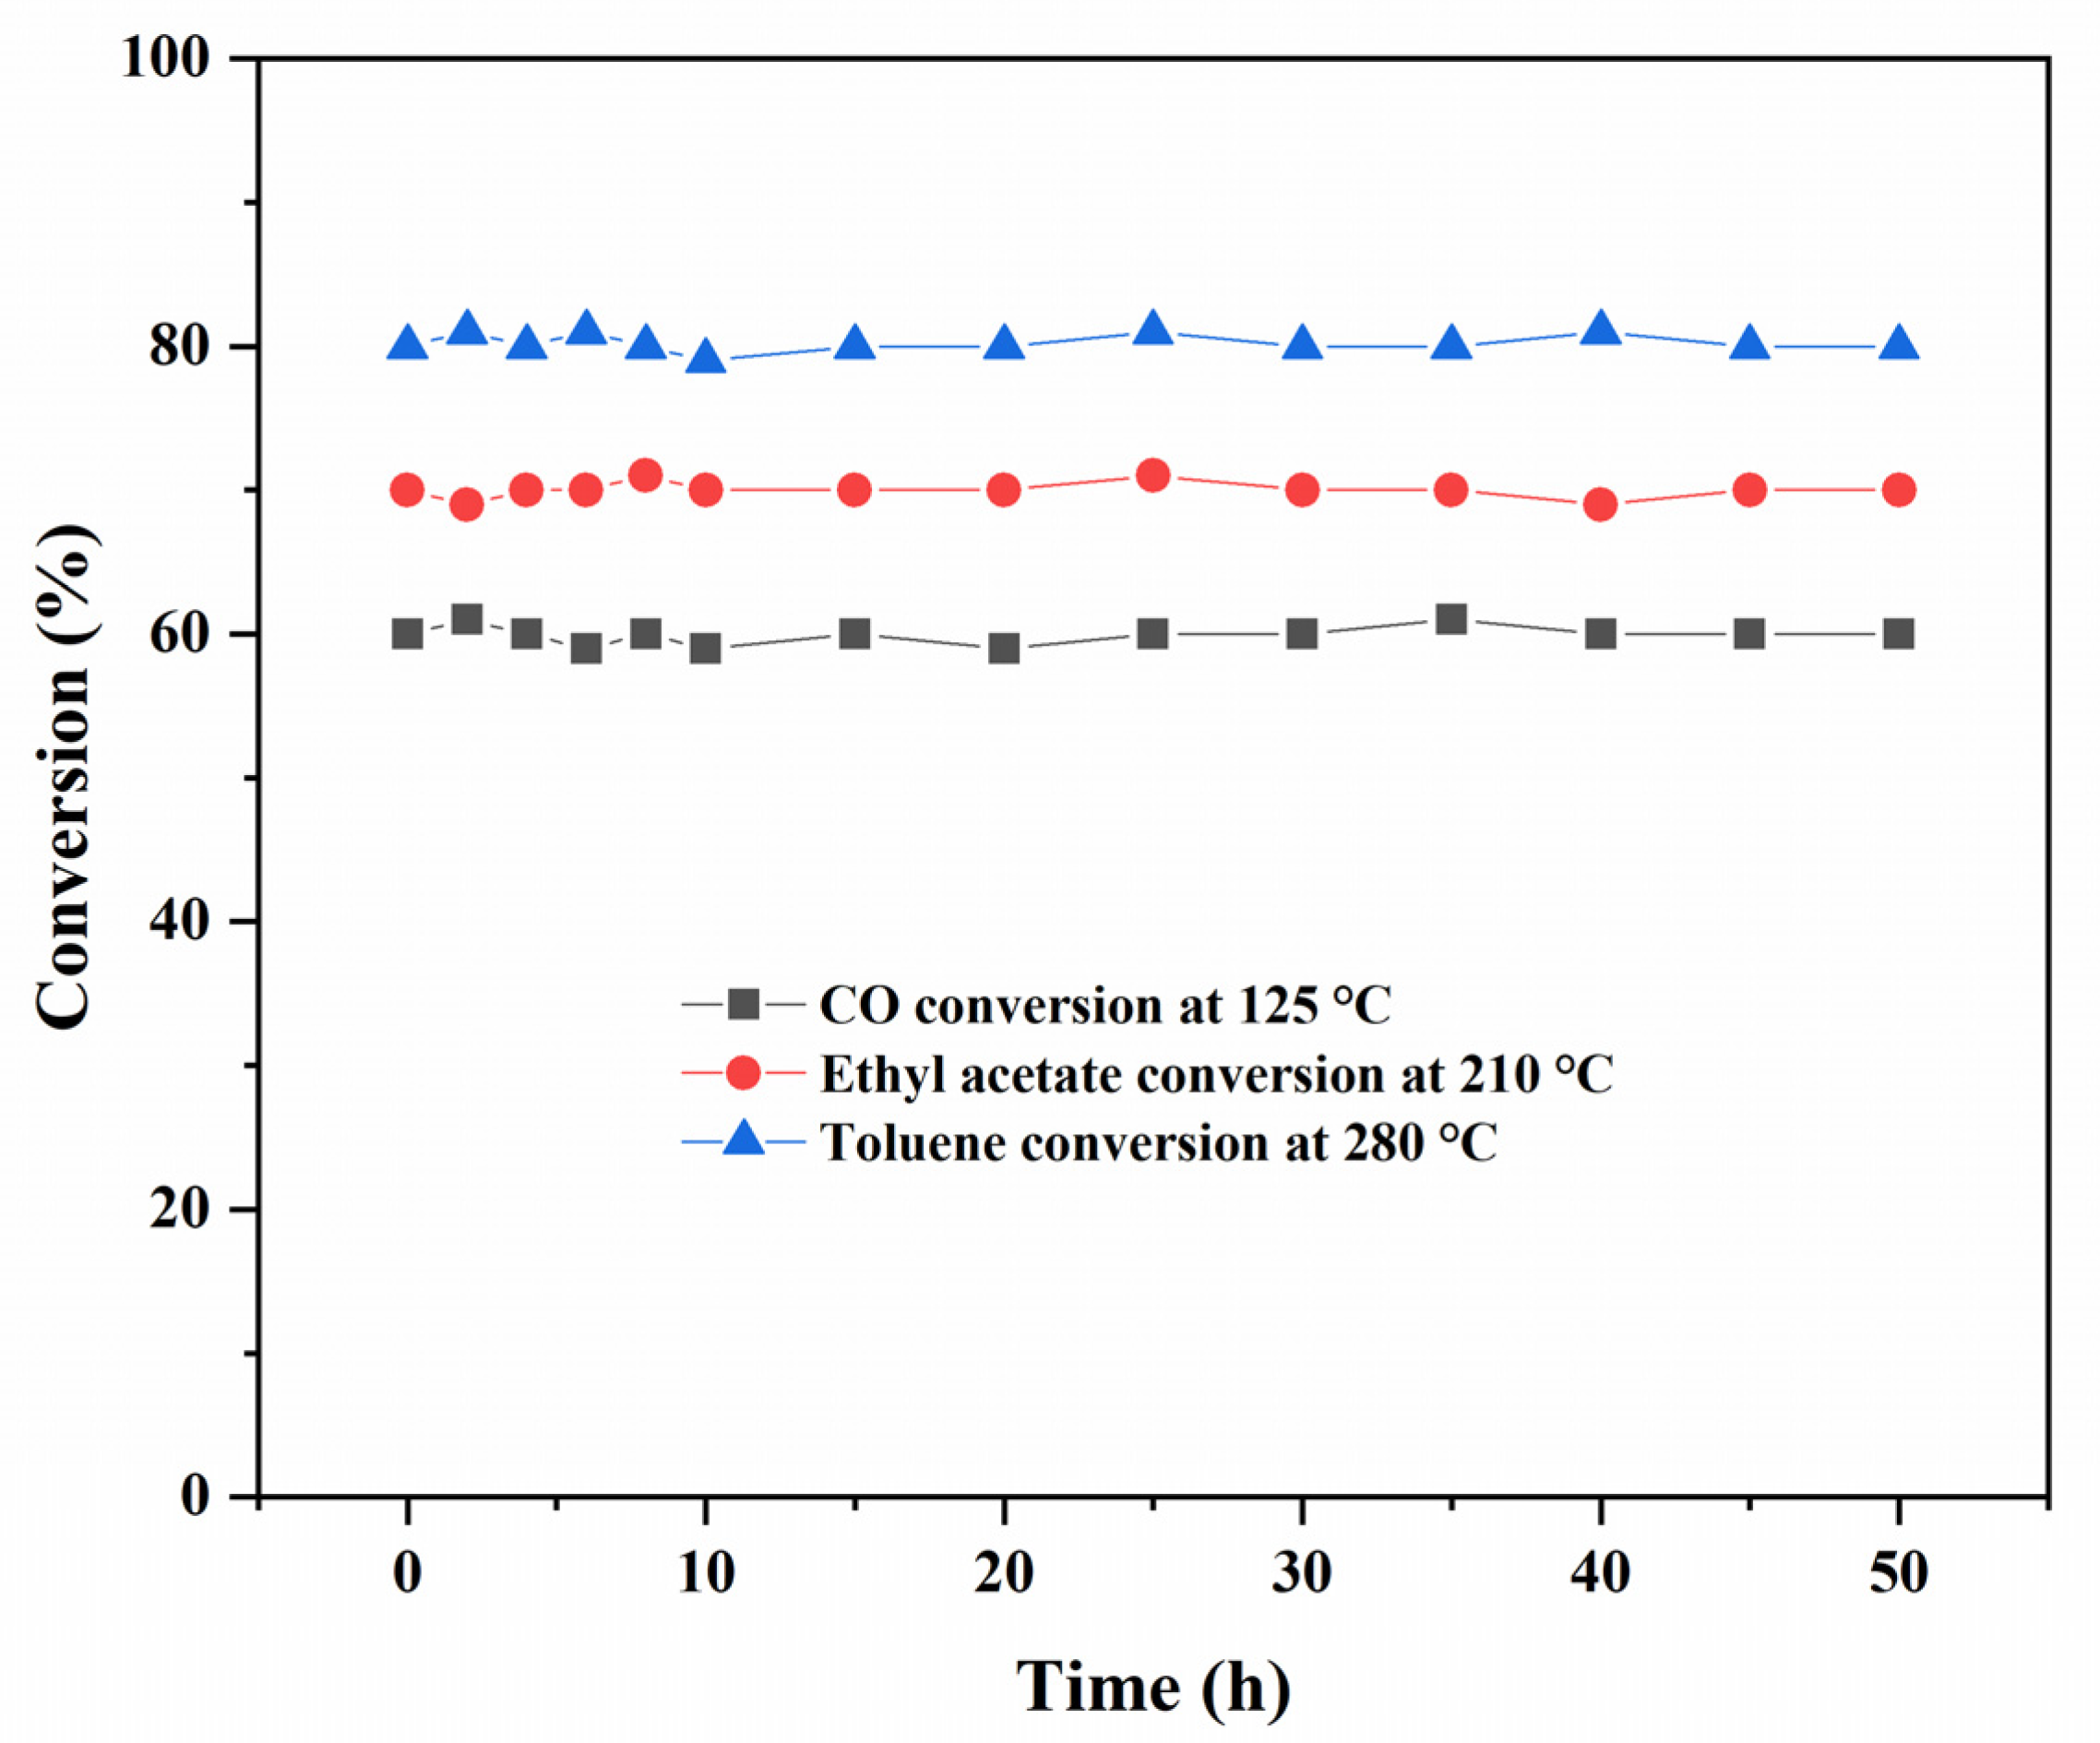
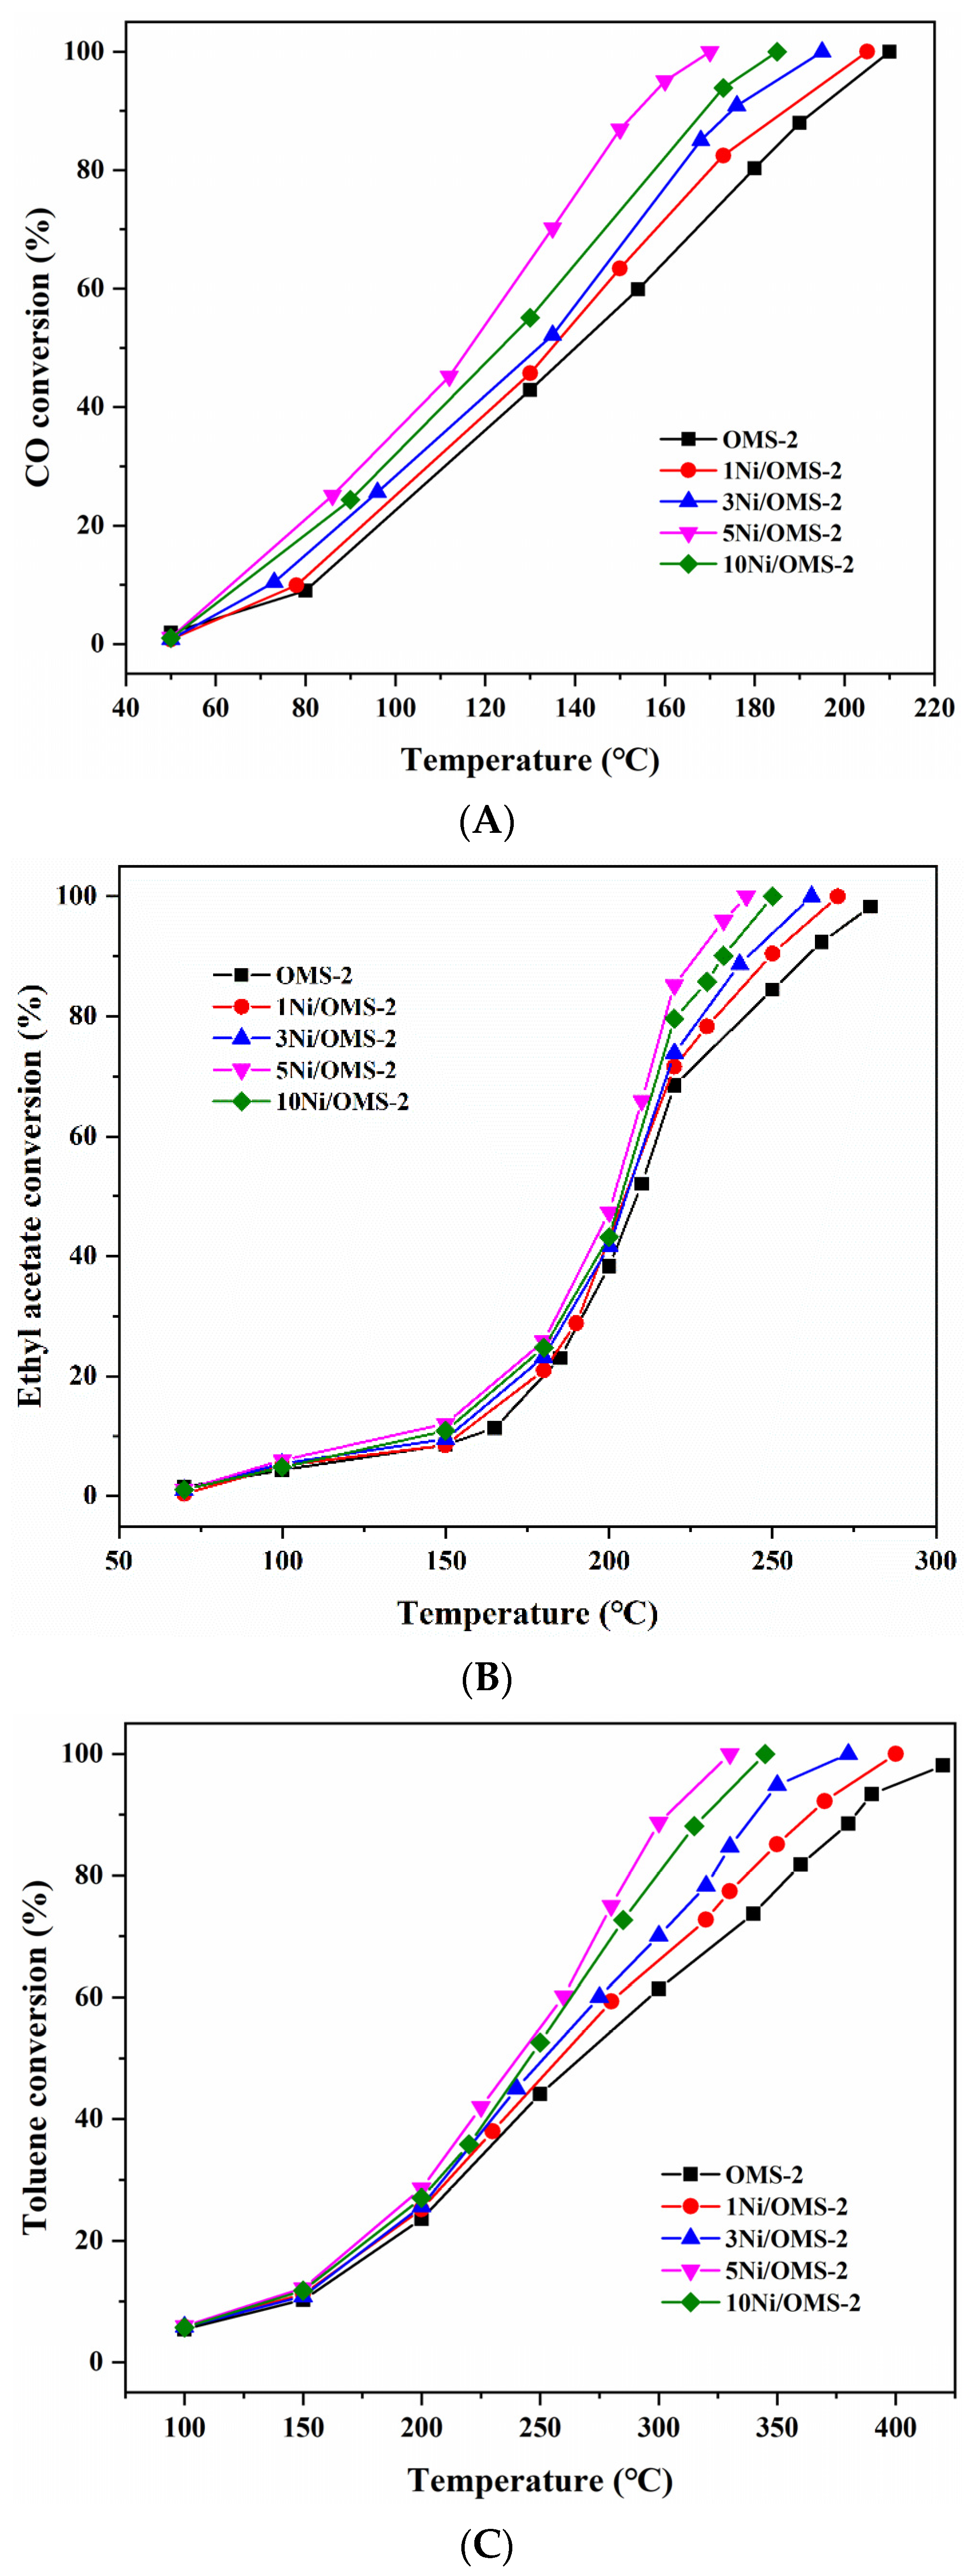
3.9. Catalytic Activity
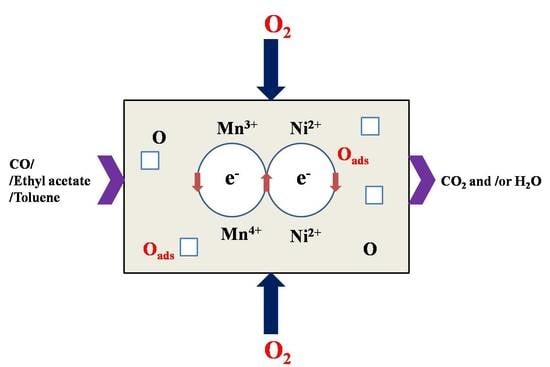
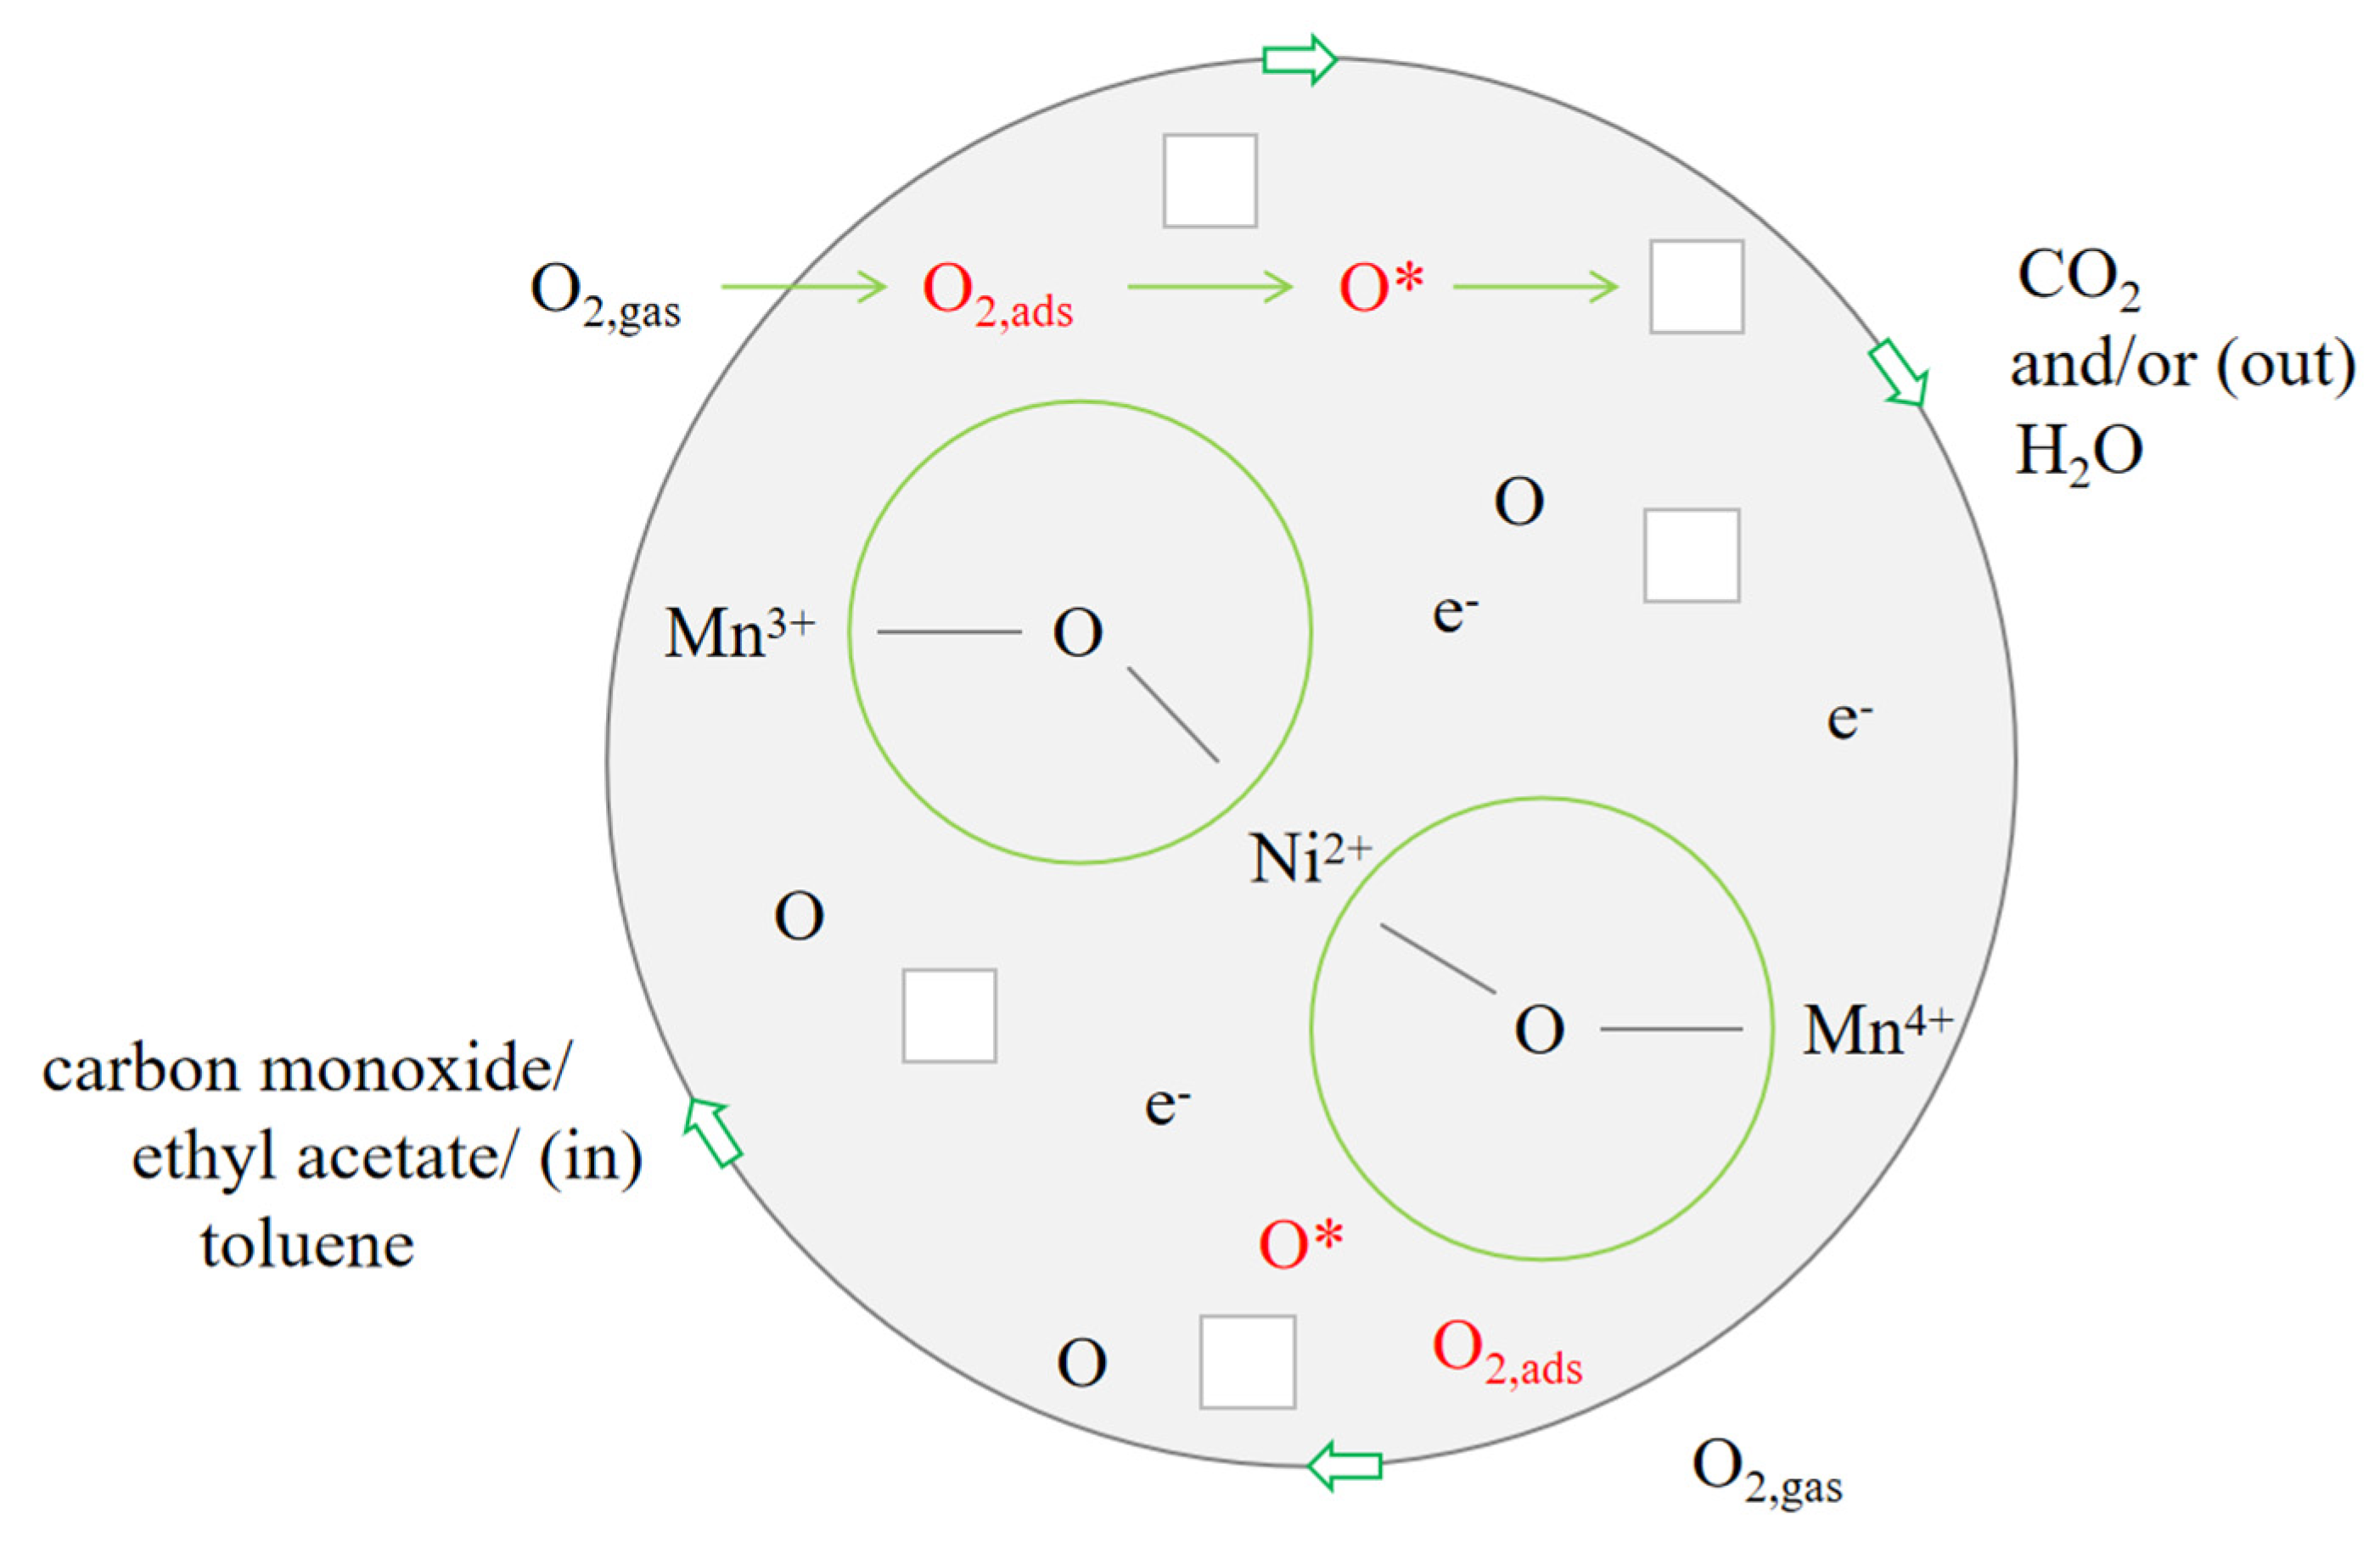
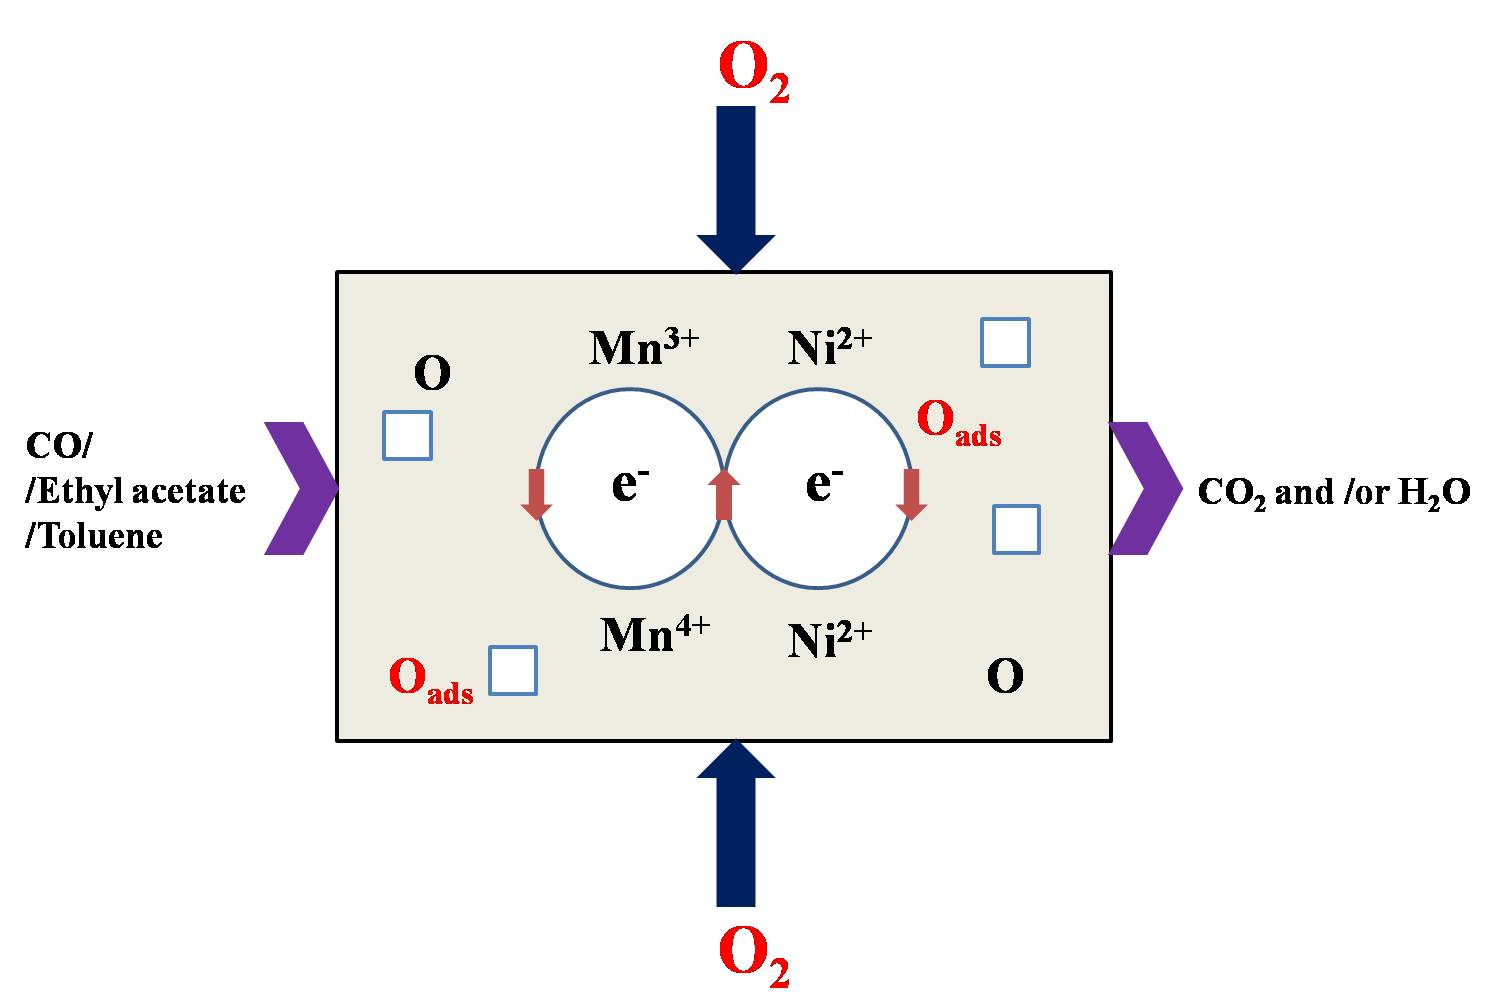
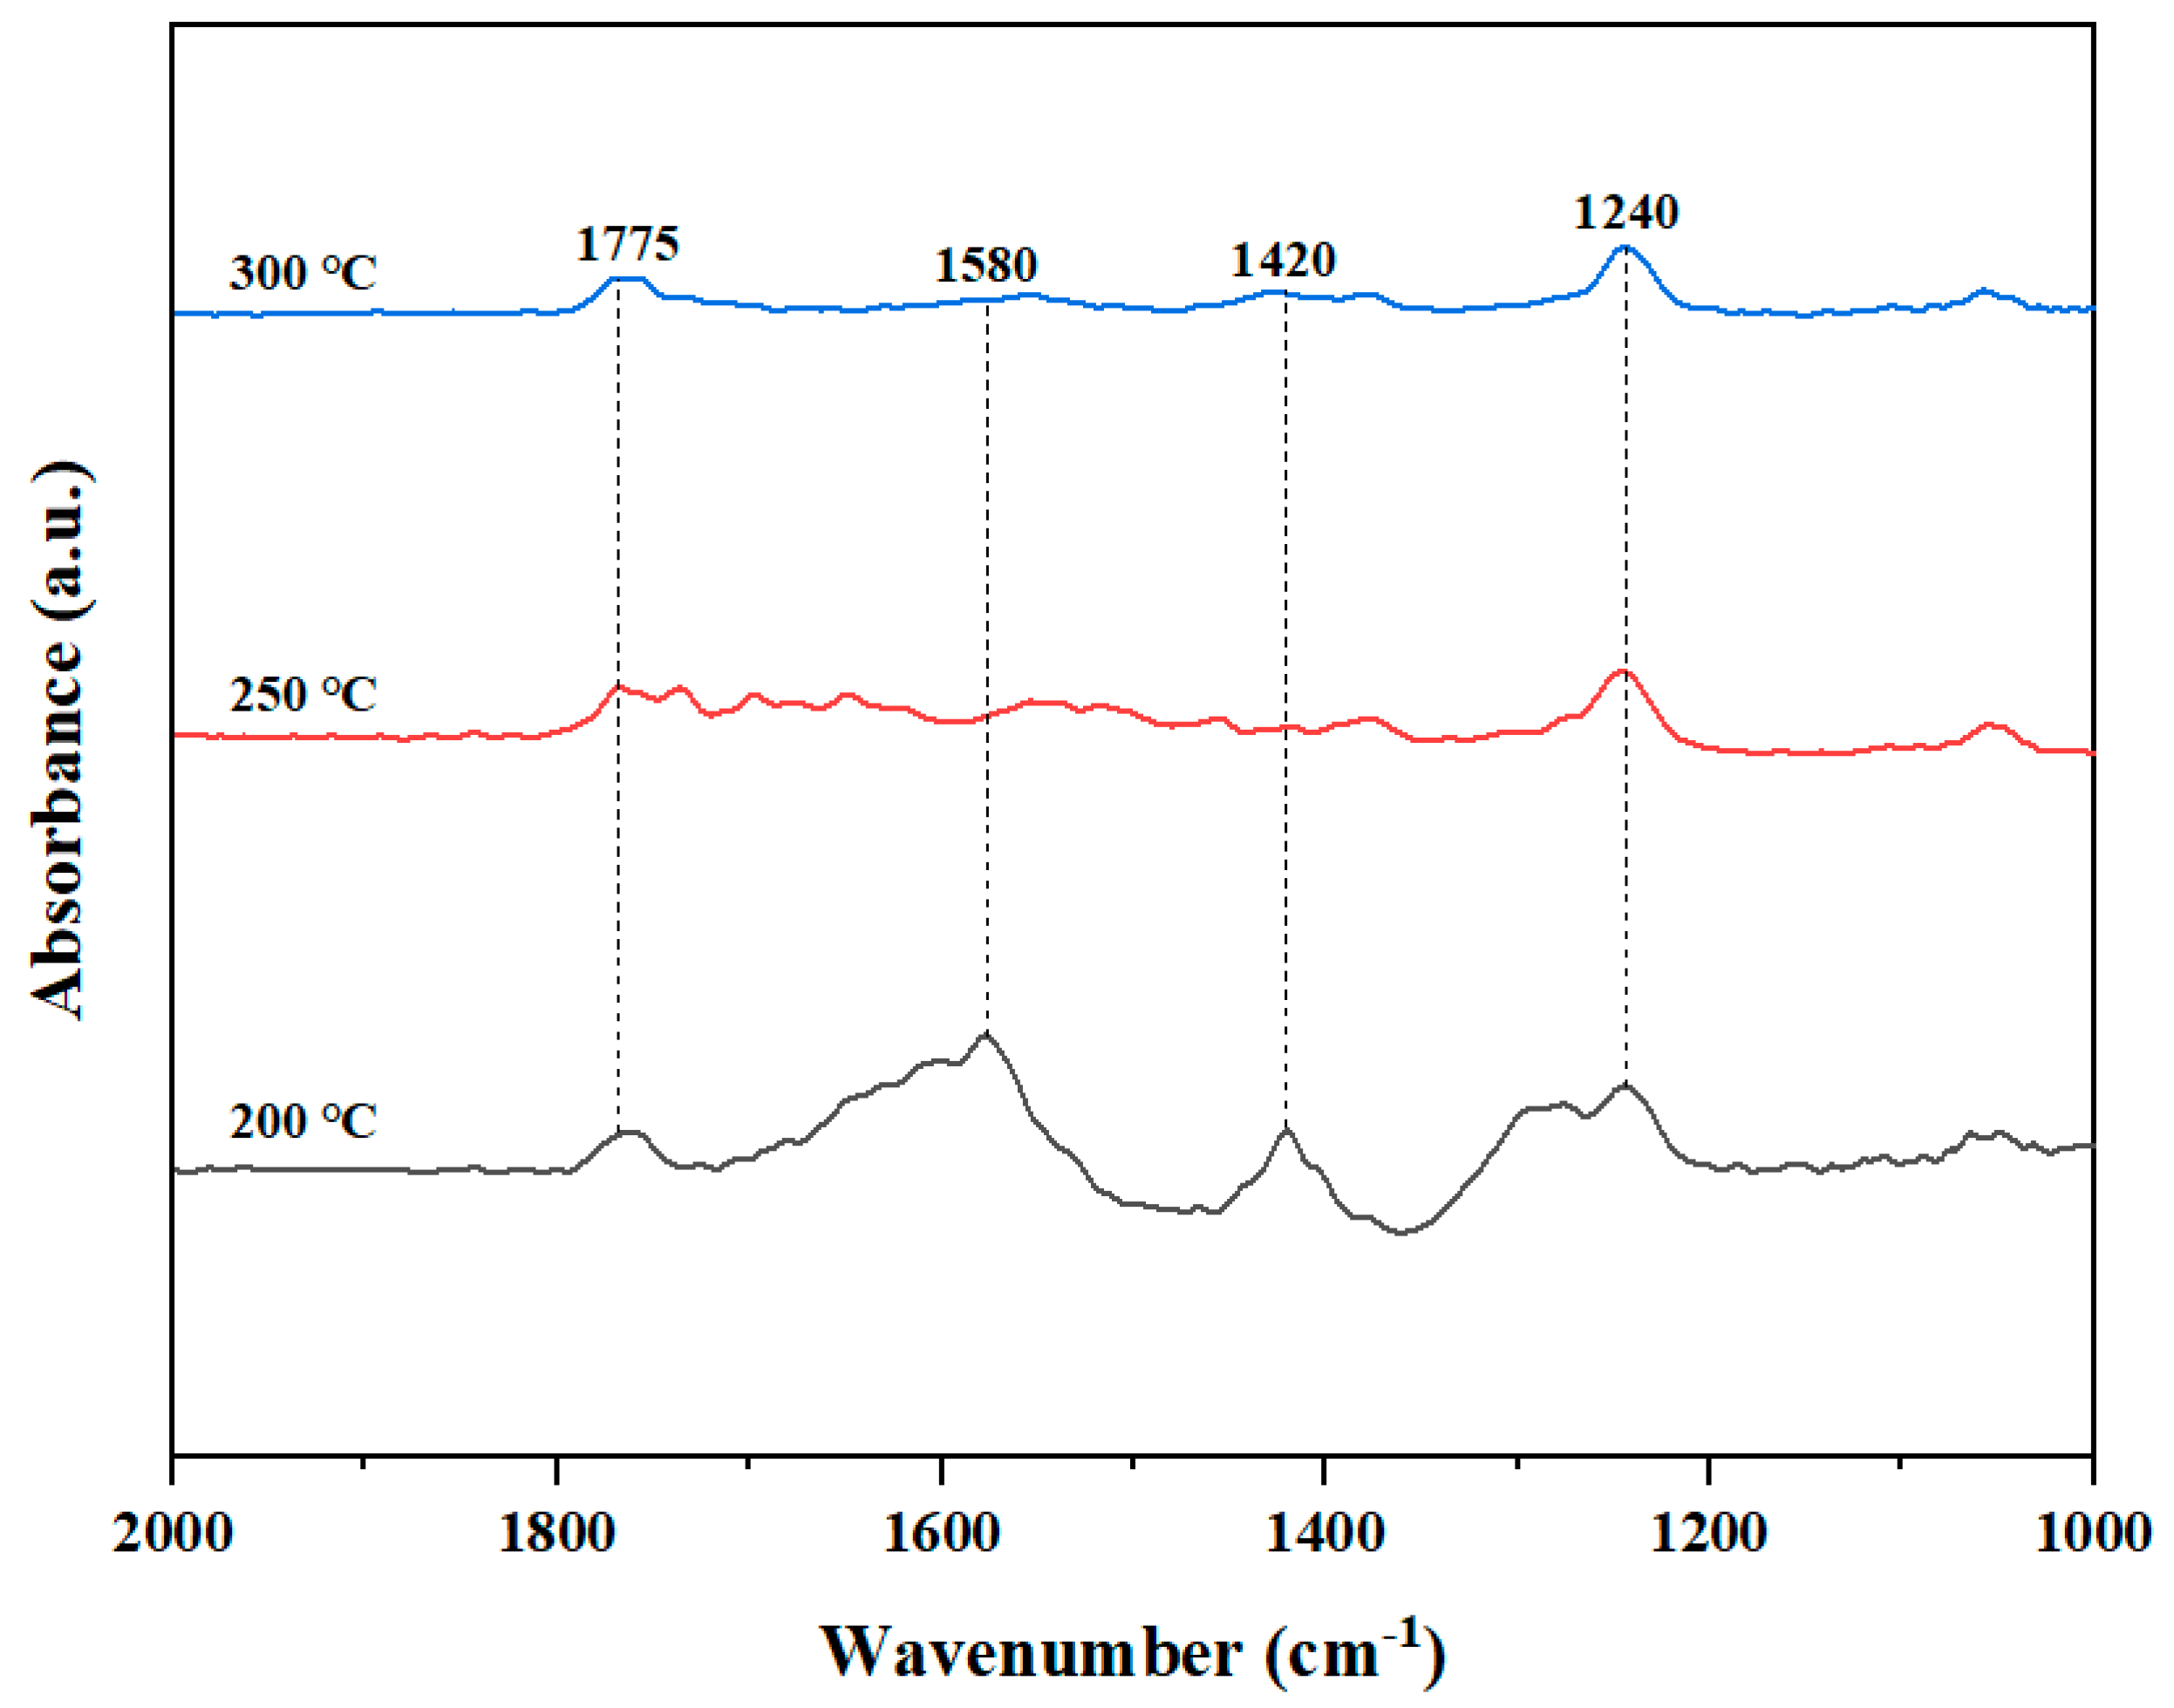
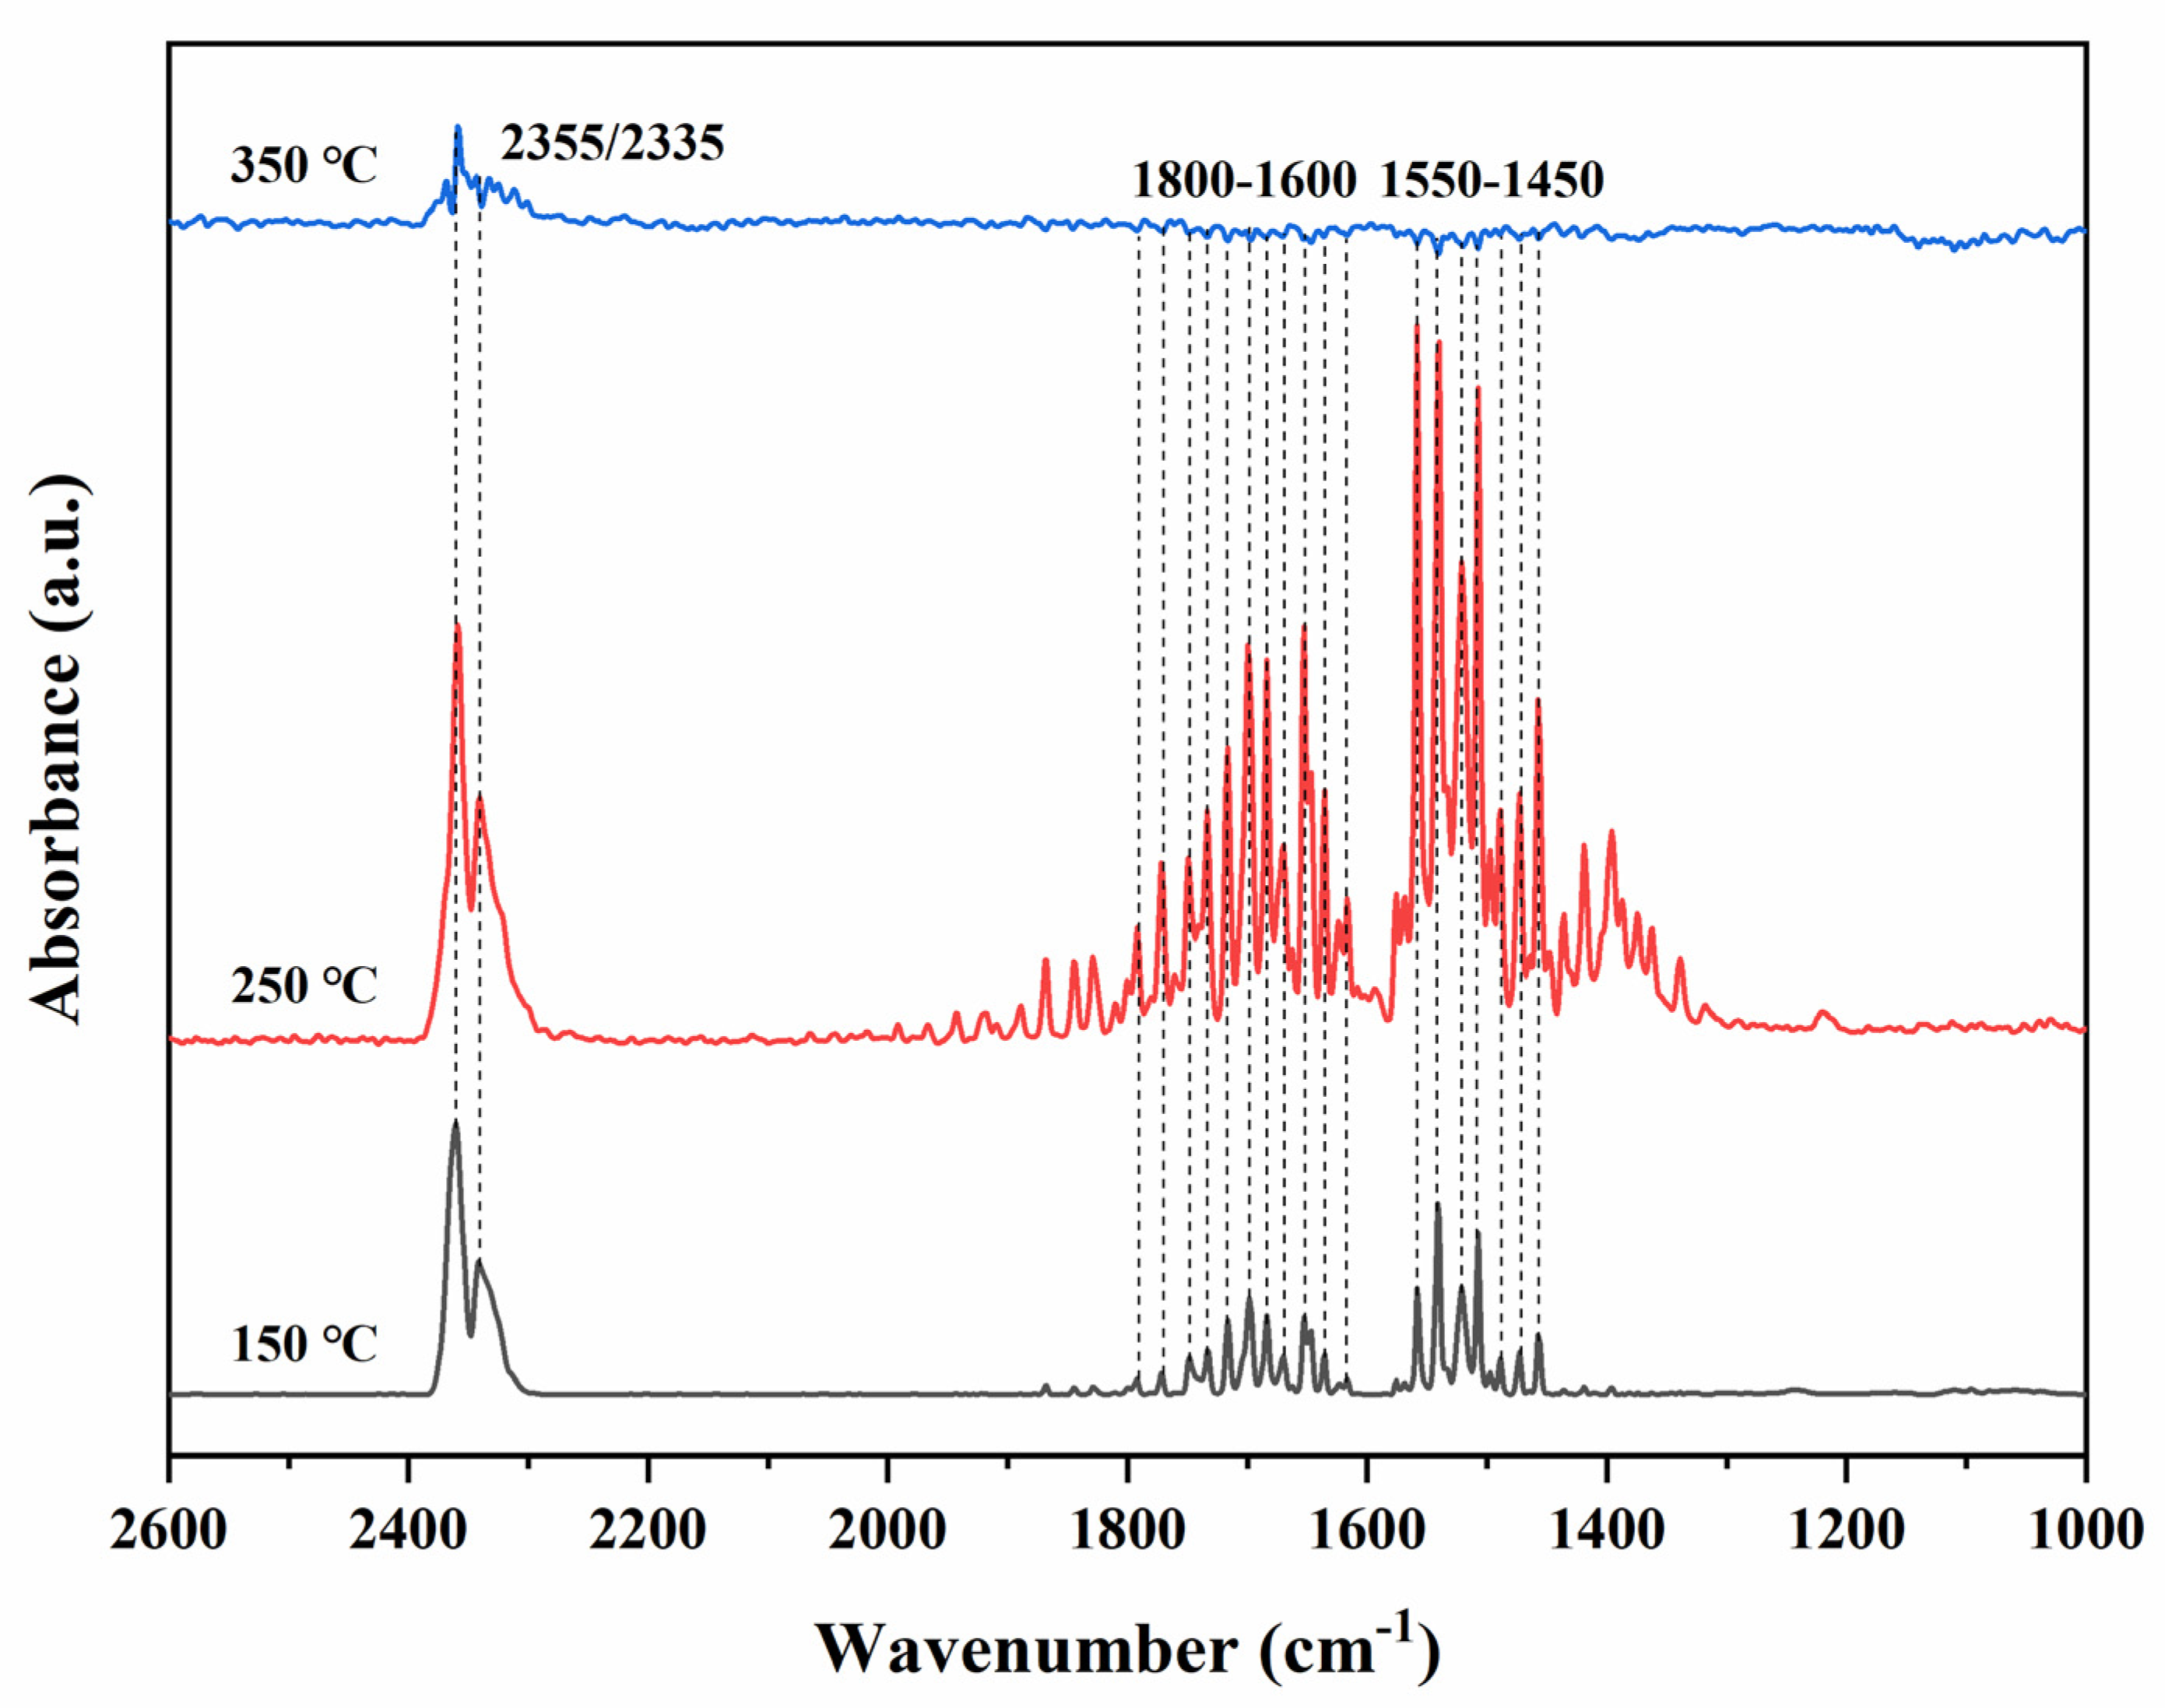
3.10. Possible Reaction Mechanism
4. Conclusions
Author Contributions
Funding
Data Availability Statement
Conflicts of Interest
References
- Yang, C.; Miao, G.; Pi, Y.; Xia, Q.; Wu, J.; Li, Z.; Xiao, J. Abatement of various types of VOCs by adsorption/catalytic oxidation: A review. Chem. Eng. J. 2019, 370, 1128–1153. [Google Scholar] [CrossRef]
- Carrillo, A.M.; Carriazo, J.G. Cu and Co oxides supported on halloysite for the total oxidation of toluene. Appl. Catal. B Environ. 2015, 164, 443–452. [Google Scholar] [CrossRef]
- Sharma, A.; Lee, B. Structure and activity of TiO2/FeO co-doped carbon spheres for adsorptive-photocatalytic performance of complete toluene removal from aquatic environment. Appl. Catal. A Gen. 2016, 523, 272–282. [Google Scholar] [CrossRef]
- Liotta, L. Catalytic oxidation of volatile organic compounds on supported noble metals. Appl. Catal. B Environ. 2010, 100, 403–412. [Google Scholar] [CrossRef]
- Delimaris, D.; Ioannides, T. VOC oxidation over CuO-CeO2 catalysts prepared by a combustion method. Appl. Catal. B Environ. 2009, 89, 295–302. [Google Scholar] [CrossRef]
- Yang, M.; Ling, Q.; Rao, R.; Yang, H.; Zhang, Q.; Liu, H.; Zhang, A. Mn3O4-NiO-Ni/CNTs catalysts prepared by spontaneous redox at high temperature and their superior catalytic performance in selective oxidation of benzyl alcohol. J. Mol. Catal. A Chem. 2013, 380, 61–69. [Google Scholar] [CrossRef]
- Wu, Y.; Shi, S.; Yuan, S.; Bai, T.; Xing, S. Insight into the enhanced activity of Ag/NiOx-MnO2 for catalytic oxidation of o-xylene at low temperatures. Appl. Surf. Sci. 2019, 479, 1262–1269. [Google Scholar] [CrossRef]
- Guo, H.; Li, Y.; Jiang, Z.; Zhang, Z.; Chen, M.; Einagac, H.; Shangguan, W. Effective low-temperature catalytic abatement of benzene over porous Mn-Ni composite oxides synthesized via the oxalate route. J. Chem. Technol. Biotechnol. 2020, 95, 1008–1015. [Google Scholar] [CrossRef]
- Dong, Y.; Zhao, J.; Ye Zhang, J.; Chen, Y.; Yang, X.; Song, W.; Wei, L.; Li, W. Synergy of Mn and Ni enhanced catalytic performance for toluene combustion over Ni-doped α-MnO2 catalysts. Chem. Eng. J. 2020, 388, 124244. [Google Scholar] [CrossRef]
- Sithambaram, S.; Nyutu, E.K.; Suib, S.L. OMS-2 catalyzed oxidation of tetralin: A comparative study of microwave and conventional heating under open vessel conditions. Appl. Catal. A Gen. 2008, 348, 214–220. [Google Scholar] [CrossRef]
- Liu, X.; Jin, Z.; Lu, J.; Wang, X.; Luo, M. Highly active CuO/OMS-2 catalysts for low-temperature CO oxidation. Chem. Eng. J. 2010, 162, 151–157. [Google Scholar] [CrossRef]
- Fu, Z.; Liu, L.; Song, Y.; Ye, Q.; Cheng, S.; Kang, T.; Dai, H. Catalytic oxidation of carbon monoxide, toluene, and ethyl acetate over the xPd/OMS-2 catalysts: Effect of Pd loading. Front. Chem. Sci. Eng. 2017, 11, 185–196. [Google Scholar] [CrossRef]
- Iyer, A.; Galindo, H.; Sithambaram, S.; King’Ondu, C.; Hu Chen, C.; Suib, S.L. Nanoscale manganese oxide octahedral molecular sieves (OMS-2) as efficient photocatalysts in 2-propanol oxidation. Appl. Catal. A Gen. 2010, 375, 295–302. [Google Scholar] [CrossRef]
- Fu, J.; Dong, N.; Ye, Q.; Cheng, S.; Kang, T.; Dai, H. Enhanced performance of the OMS-2 catalyst by Ag loading for the oxidation of benzene, toluene, and formaldehyde. New J. Chem. 2018, 42, 18117–18127. [Google Scholar] [CrossRef]
- Parikh, S.J.; Chorover, J. FTIR spectroscopic study of biogenic Mn-oxide formation by Pseudomonas putida GB-1. Geomicrobiol. J. 2005, 22, 207–218. [Google Scholar] [CrossRef]
- Sun, M.; Yu, L.; Ye, F.; Diao, G.; Yu, Q.; Hao, Z.; Zheng, Y.; Yuan, L. Transition metal doped cryptomelane-type manganese oxide for low-temperature catalytic combustion of dimethyl ether. Chem. Eng. J. 2013, 220, 320–327. [Google Scholar] [CrossRef]
- Yang, J.; Zhou, H.; Wang, L.; Zhang, Y.; Chen, C.; Hu, H.; Li, G.; Zhang, Y.; Ma, Y.; Zhang, J. Cobalt-doped K-OMS-2 nanofibers: A novel and efficient water-tolerant catalyst for the oxidation of carbon monoxide. ChemCatChem 2017, 9, 1163–1167. [Google Scholar] [CrossRef]
- Huang, Y.; Wang, Y.; Meng, X.; Liu, X. Highly efficient Co-OMS-2 catalyst for the degradation of reactive blue 19 in aqueous solution. Inorg. Chem. Commun. 2020, 112, 107757. [Google Scholar] [CrossRef]
- Sun, H.; Chen, S.; Wang, P.; Quan, X. Catalytic oxidation of toluene over manganese oxide octahedral molecular sieves (OMS-2) synthesized by different methods. Chem. Eng. J. 2011, 178, 191–196. [Google Scholar] [CrossRef]
- Delimaris, D.; Ioannides, T. VOC oxidation over MnOx–CeO2 catalysts prepared by a combustion method. Appl. Catal. B Environ. 2008, 84, 303–312. [Google Scholar] [CrossRef]
- Jiratova, K.; Mikulova, J.; Klempa, J. Modification of Co-Mn-Al mixed oxide with potassium and its effect on deep oxidation of VOC. Appl. Catal. A Gen. 2009, 361, 106–116. [Google Scholar] [CrossRef]
- Dong, N.; Ye, Q.; Chen, M.; Cheng, S.; Kang, T.; Dai, H. Sodium-treated sepiolite-supported transition metal (Cu, Fe, Ni, Mn, or Co) catalysts for HCHO oxidation. Chin. J. Catal. 2020, 41, 1734–1744. [Google Scholar] [CrossRef]
- Li, X.; Ma, J.; Jia, X.; Xia, F.; Huang, Y.; Xu, Y.; Xu, J. Al-doping promoted aerobic amidation of 5-hydroxymethylfurfural to 2,5-furandicarboxamide over cryptomelane. ACS Sustain. Chem. Eng. 2018, 6, 8048–8054. [Google Scholar] [CrossRef]
- Li, Y.; Fan, Z.; Shi, J.; Liu, Z.; Zhou, J.; Shangguan, W. Modified manganese oxide octahedral molecular sieves M-OMS-2 (M = Co,Ce,Cu) as catalysts in post plasma-catalysis for acetaldehyde degradation. Catal. Today 2015, 256, 178–185. [Google Scholar] [CrossRef]
- Song, Y.; Liu, L.; Fu, Z.; Ye, Q.; Cheng, S.; Kang, T.; Dai, H. Excellent performance of Cu-Mn/Ti-sepiolite catalysts for low-temperature CO oxidation. Front. Environ. Sci. Eng. 2017, 11, 5. [Google Scholar] [CrossRef]
- Wang, X.; Huo, W.; Xu, Y.; Guo, Y.; Jia, Y. Modified hierarchical birnessite-type manganese oxide nanomaterials for CO catalytic oxidation. New J. Chem. 2018, 42, 13803. [Google Scholar] [CrossRef]
- Huang, Q.; Yan, X.; Li, B.; Xu, X.; Chen, Y.; Zhu, S.; Shen, S. Activity and stability of Pd/MMnOx (M = Co, Ni, Fe and Cu) supported on cordierite as CO oxidation catalysts. J. Ind. Eng. Chem. 2013, 19, 438–443. [Google Scholar] [CrossRef]
- Liu, X.; Han, Q.; Shi, W.; Zhang, C.; Li, E.; Zhu, T. Catalytic oxidation of ethyl acetate over Ru–Cu bimetallic catalysts: Further insights into reaction mechanism via in situ FTIR and DFT studies. J. Catal. 2019, 369, 482–492. [Google Scholar] [CrossRef]
- Dou, B.; Li, S.; Liu, D.; Zhao, R.; Liu, J.; Hao, Q.; Bin, F. Catalytic oxidation of ethyl acetate and toluene over Cu–Ce–Zr supported ZSM-5/TiO2 catalysts. RSC Adv. 2016, 6, 53852. [Google Scholar]
- Feng, B.; Shi, M.; Liu, J.; Han, X.; Lan, Z.; Gu, H.; Wang, X.; Sun, H.; Zhang, Q.; Li, H.; et al. An efficient defect engineering strategy to enhance catalytic performances of Co3O4 nanorods for CO oxidation. J. Hazard. Mater. 2020, 394, 122540. [Google Scholar] [CrossRef] [PubMed]
- Qin, Y.; Liu, X.; Zhu, T.; Zhu, T. Catalytic oxidation of ethyl acetate over silver catalysts supported on CeO2 with different morphologies. Mater. Chem. Phys. 2019, 229, 32–38. [Google Scholar] [CrossRef]
- Li, M.; Hui, K.N.; Hui, K.S.; Lee, S.K.; Cho, Y.R.; Lee, H.; Zhou, W.; Cho, S.; Chao, C.Y.H.; Li, Y. Influence of modification method and transition metal type on the physicochemical properties of MCM-41 catalysts and their performances in the catalytic ozonation of toluene. Appl. Catal. B Environ. 2011, 107, 245–252. [Google Scholar] [CrossRef]
- Sun, H.; Liu, Z.; Chen, S.; Quan, X. The role of lattice oxygen on the activity and selectivity of the OMS-2 catalyst for the total oxidation of toluene. Chem. Eng. J. 2015, 270, 58–65. [Google Scholar] [CrossRef]


| Sample | Thermal Analysis (wt% Weight Loss) | |||
|---|---|---|---|---|
| 40–250 (°C) | 250–550 (°C) | 550–700 (°C) | 700–850 (°C) | |
| OMS-2 | 1.56 | 1.09 | 3.69 | 3.27 |
| 1Ni/OMS-2 | 1.41 | 1.03 | 3.75 | 3.35 |
| 3Ni/OMS-2 | 1.36 | 1.05 | 3.55 | 3.02 |
| 5Ni/OMS-2 | 2.07 | 2.21 | 3.73 | 2.55 |
| 10Ni/OMS-2 | 1.66 | 1.47 | 3.58 | 2.63 |
| Sample | Atomic Ratio | ||
|---|---|---|---|
| Mn3+/Mn4+ | Oads/Olatt | Ni2+/Ni0 | |
| OMS-2 | 1.35 | 0.25 | – |
| 1Ni/OMS-2 | 1.38 | 0.26 | 2.65 |
| 3Ni/OMS-2 | 1.60 | 0.28 | 2.86 |
| 5Ni/OMS-2 | 1.88 | 0.31 | 2.95 |
| 10Ni/OMS-2 | 1.79 | 0.29 | 3.34 |
| Sample | CO Oxidation | Ethyl Acetate Oxidation | Toluene Oxidation |
|---|---|---|---|
| T50/T90 (°C) | T50/T90 (°C) | T50/T90 (°C) | |
| OMS-2 | 140/194 | 202/260 | 270/375 |
| 1Ni/OMS-2 | 135/188 | 200/245 | 255/360 |
| 3Ni/OMS-2 | 130/175 | 198/240 | 250/335 |
| 5Ni/OMS-2 | 115/155 | 195/225 | 240/300 |
| 10Ni/OMS-2 | 120/170 | 197/235 | 245/315 |
| Catalyst | rcat (μmolCO/(gcat·s)) | rcat (μmolethyl acetate/(gcat·s)) | rcat (μmoltoluene/(gcat·s)) | Reference |
|---|---|---|---|---|
| OMS-2 | 3.75 | 2.34 | 2.73 | This study |
| 1Ni/OMS-2 | 3.95 | 3.82 | 3.22 | This study |
| 3Ni/OMS-2 | 4.23 | 3.98 | 3.33 | This study |
| 5Ni/OMS-2 | 5.45 | 4.58 | 3.60 | This study |
| 10Ni/OMS-2 | 4.57 | 4.36 | 3.49 | This study |
| Ni/MnO2 | 1.64 | – | – | [26] |
| Pd/NiMnOx/Cord | 0.0852 | – | – | [27] |
| 1Ru-5Cu/TiO2 | – | 0.341 | – | [28] |
| Cu–Ce–Zr/TiO2 | – | 0.324 | 0.243 | [29] |
| Ni/α-MnO2 | – | – | 0.227 | [9] |
Publisher’s Note: MDPI stays neutral with regard to jurisdictional claims in published maps and institutional affiliations. |
© 2021 by the authors. Licensee MDPI, Basel, Switzerland. This article is an open access article distributed under the terms and conditions of the Creative Commons Attribution (CC BY) license (https://creativecommons.org/licenses/by/4.0/).
Share and Cite
Dong, N.; Chen, M.; Ye, Q.; Zhang, D.; Dai, H. Catalytic Elimination of Carbon Monoxide, Ethyl Acetate, and Toluene over the Ni/OMS-2 Catalysts. Catalysts 2021, 11, 581. https://doi.org/10.3390/catal11050581
Dong N, Chen M, Ye Q, Zhang D, Dai H. Catalytic Elimination of Carbon Monoxide, Ethyl Acetate, and Toluene over the Ni/OMS-2 Catalysts. Catalysts. 2021; 11(5):581. https://doi.org/10.3390/catal11050581
Chicago/Turabian StyleDong, Ning, Mengyue Chen, Qing Ye, Dan Zhang, and Hongxing Dai. 2021. "Catalytic Elimination of Carbon Monoxide, Ethyl Acetate, and Toluene over the Ni/OMS-2 Catalysts" Catalysts 11, no. 5: 581. https://doi.org/10.3390/catal11050581
APA StyleDong, N., Chen, M., Ye, Q., Zhang, D., & Dai, H. (2021). Catalytic Elimination of Carbon Monoxide, Ethyl Acetate, and Toluene over the Ni/OMS-2 Catalysts. Catalysts, 11(5), 581. https://doi.org/10.3390/catal11050581