Abstract
Ca poisoning behavior is inevitable for high-calcium content flue gas, so V2O5-WO3/TiO2 (VWT) and V2O5-WO3-CeO2/TiO2 (VWCeT) catalysts with different vanadium content have been prepared and the Ca-doped catalysts are compared in this manuscript. The result shows Ce addition can both promote the NO conversion and the alkali resistance. Lower Ca addition for 0.1VWCeT catalyst promotes its oxidability and Ce modification is more suitable for low vanadium catalysts. The total acidity and the reducibility of catalysts decline after Ca doping, and the reducibility of the active species on catalysts has been strengthened by Ce addition. CeO2 based catalysts with lower Ca loading struggle to resist sulfur poisoning, while higher Ca loading favors SO2 adsorption and also physically reduces the cerium acidification process. In the presence of SO2, additional Brønsted acid sites are formed in Ca rich catalyst. The dynamic NH3 adsorption has been investigated, shows that Ca doping content on catalyst is critical for SCR reaction, and the catalyst is more susceptible to SO2 initially in alkali flue gas during the actual application, but the sulfur resistance may increase with the alkali-poisoning effect aggravated by Ca doping.
1. Introduction
Nitrogen oxide (NOx) causes great harm to the ecosystem and human health. The recent NOx emission in China has decreased due to the ultra-low emission control of coal-fired power plants, while the cement industry has become the largest source of NOx emission [1]. So, the NOx reduction of the cement industry has become imperative in the environmental field.
Selective catalytic reduction with NH3 (NH3-SCR) has been widely used as an effective method to control stationary source NOx emissions [2] and V2O5-WO3/TiO2 catalyst has mainly used due to its high deNOx activity and good resistance to SO2, while its activity can gradually reduce after long time exposing to fly ash with poisonous substances like alkali metal or alkaline-earth metal [3], especially the extremely high calcium content (60~80%) in cement flue gas, constraints its further application in cement industry [4].
In fact, compared to the study of the SO2 and H2O resistances of the catalyst, the alkali metal especially Ca poising effect has rarely been investigated [5,6,7], although the deposition of Ca species on the SCR catalysts was inevitable in cement flue gas [8]. Most of the previous research is about K and Na poisoning, and it is generally recognized that the poison effect of V2O5-WO3/TiO2 catalyst by alkali metal is caused by the decrease of the amount of Brønsted acid sites and the reducibility of active V5+ sites, which reduce the adsorption of NH3 [9]. Tang et al. compared the poisoning effect of Na+ and Ca2+ ions on the V2O5/TiO2 catalysts and found that Ca2+ ions combined with vanadia species weakly and slightly affected the Brønsted acid sites [10]. Li et al. found that high contents of CaO can lead to CaWO4 formation and thus passivate bulk tungsten species and surface acid sites of fresh catalyst, while the surface oxygen species and reducibility are also greatly suppressed by CaO species [11].
The ceria modification of the V2O5-WO3/TiO2 catalyst has been widely investigated, and the good oxygen storage capacity of ceria can enhance the alkali poisoning resistance of the catalyst after doping with K and Na [12,13,14]. Liu et al. investigated the effects of Ce on the activity and alkali resistance of low vanadium content V2O5/TiO2 catalyst, found that the existence of Ce on the V0.5Ce5Ti catalyst can promote the formation of NO2 and monodentate nitrate species [15]. V1W5Ce10Ti catalyst exhibited higher NH3-SCR activity and better Na resistance than the V1W5Ti catalyst, due to the higher surface chemisorbed oxygen and the intensity of Brϕnsted acid sites [16]. The Ce effect is usually connected with the vanadium content. Kong et al. studied the effect of vanadium content on the resistance to K+ deactivation of V2O5-WO3/TiO2 SCR catalyst [17] and proposed that the 3VWTi catalyst is preferable for flue gas with high alkali contents because of both monomeric and polymeric vanadium species.
Recently, cerium based oxides have attracted much attention for their use as NH3-SCR catalysts due to the high oxygen storage capacity and excellent redox property. The addition of Ce to V2O5–WO3/TiO2 led to improved activity and alkali-resistance [15]. Some studies have shown that the low content vanadium is mainly dispersed and high content vanadium is concentrated [18], but few studies have paid attention to the effect of vanadium content change on the alkali poisoning performance. Two commercial catalysts with different optimum reaction temperature have been investigated in our previous work [19], and the CaO-ash has shown an obvious inhibitive effect on de-NOx activity, the higher vanadium content on catalyst shows better performance, and the atmospheres like SO2 has been investigated. As the Ca poisoning behavior is inevitable for high-calcium content flue gas, the ceria modified catalyst with different vanadium content should be considered to improve the alkali poisoning resistance.
2. Results and Discussion
2.1. Catalytic Activity
Figure 1 shows the catalytic activity of fresh and Ca-poisoned catalysts from 100 °C to 400 °C, the NO conversion of the VWT catalysts increases with the increase of vanadium content, the maximum NO conversion shifts to the lower temperature from 360 °C to 200 °C. Ceria makes remarkable promotion on 0.1VWT, as for the NO conversion rises from 12.9% to 97.7% at 250 °C after ceria addition, while the promotive effect becomes less obvious for 1.5VWT and 3VWT, even shows inhibitive effect for 3VWT below 200 °C.
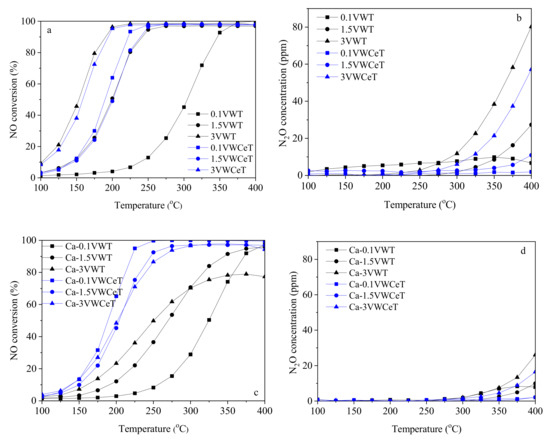
Figure 1.
NO conversion and N2O concentration of the catalysts. ((a,b): fresh catalysts with different loadings, (c,d): Ca-poisoned catalysts with different loadings. Reaction condition: [NH3] = [NO] = 500 ppm, [O2] = 5 vol %, and GHSV = 100,000 h−1)
For the Ca-poisoned catalyst, the VWCeT catalysts show better resistance than the VWT catalysts, the NO conversion for Ca-VWT catalysts shows accordant order to the vanadium content at lower temperature, but the high-temperature performance for Ca-3VWT is weakened. The NO conversion for the Ca-VWCeT catalysts shows exactly the opposite order to the vanadium content in general, and the 0.1VWCeT catalyst shows the best alkali resistance.
As for the side reaction of catalysts, the N2O concentration obviously rises with the increase of vanadium content, which is consistent with the previous literature. The ceria addition decreased the N2O formation relatively, while the VWCeT catalysts also follow the order of vanadium content, indicates that the side reaction is mainly happened on the vanadia surface, the strong combination of vanadia and NH3 can be weakened after ceria addition. Compared with ceria, calcium addition shows more obvious decrease in N2O formation, as the highest N2O concentration of 80.24 ppm for 3VWT at 400 °C decreases to 26.03 ppm for Ca-3VWT, which might be caused by the combined effect of calcium and NH3 at high temperature.
To better clarify the Ca-poisoning effect, the NO turnover frequency (TOF) has been calculated and compared in Figure 2, showing the NO removal ability per mole vanadium per minute at 250 °C. The TOF values of the most catalysts decrease distinctly after calcium added, except that for 0.1VWCeT, its TOF increases 63% after calcium added, showing the activity of per mole vanadia for 0.1VWCeT is greatly enhanced by the ceria, the alkali resistance is also improved. The TOFs for VWCeT catalysts are all bigger than that for VWT, which is in accordance with the NO conversion results, and the alkali resistance is promoted after ceria addition, decreasing by 83% and 46% respectively on 3VWT catalyst compared to the 3VWCeT. It is notable that the TOF shows opposite relationship with the increase of vanadium content. Although the 3V catalysts performs highest NO conversion, the activity of per mole vanadia is weakened.
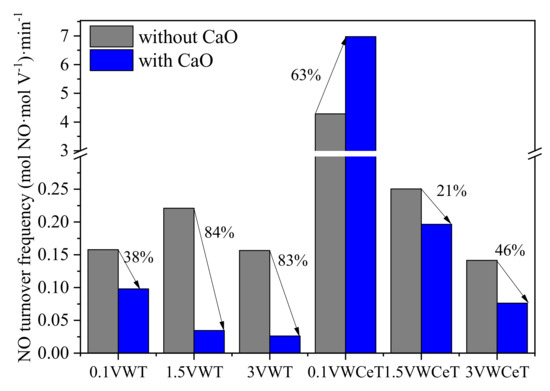
Figure 2.
NO turnover frequencies (TOF) of the catalysts at 250 °C. (Reaction condition: [NH3] = [NO] = 500 ppm, [O2] = 5 vol %, and GHSV = 100,000 h−1)
2.2. Characterization of Catalysts
2.2.1. XRD
The XRD patterns of catalysts are shown in Figure 3, where the main diffraction peaks of all catalysts (2θ = 25.3°, 37.8°, 48.1°, 53.8°, 55.1°, 62.7°, 68.8°, 70.3°, 75.0° and 82.7°) are assigned to the anatase phase TiO2 [16].The weak cubic fluorite phase of CeO2 (111) [20] is detected when ceria is added. After calcium addition, the scheelite phase CaWO4 (PDF-ICDD 41-1431) observed on Ca-3VWT catalyst, showing Ca species can react with WOx to form CaWO4, which has also been reported by Li et al. [21].
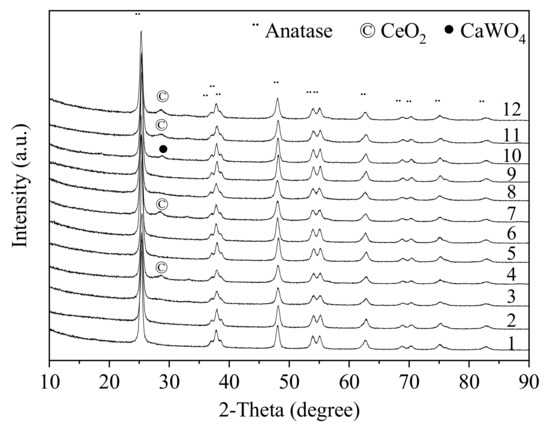
Figure 3.
XRD patterns of the catalysts. (1-0.1VWT 2-Ca-0.1VWT 3-0.1VWCeT 4-Ca-0.1VWCeT 5-1.5VWT 6-Ca-1.5VWT 7-1.5VWCeT 8-Ca-1.5VWCeT 9-3VWT 10-Ca-3VWT 11-3VWCeT 12-Ca-3VWCeT)
2.2.2. BET and XPS
The surface atomic concentration determined by XPS and surface area are presented in Table 1, it can be seen that the BET surface of catalysts tend to decrease after doping CaO, especially that for 1.5VWT, the BET surface area decreased 25.5% for Ca-1.5VWT. The BET surface decreases more obvious with the higher vanadium content, indicates that the BET surface is not directly related to the NO conversion.

Table 1.
Surface atomic concentration of the various catalysts as determined by the XPS results (atomic %) and BET surface area (m2/g).
Based on the XPS analysis results, the surface atomic ratios of Oα/(Oα + Oβ) and Ce3+/(Ce3+ + Ce4+) are compiled in Table 1, and the O1s and Ce3d spectra are shown in Figure 4 and Figure 5.
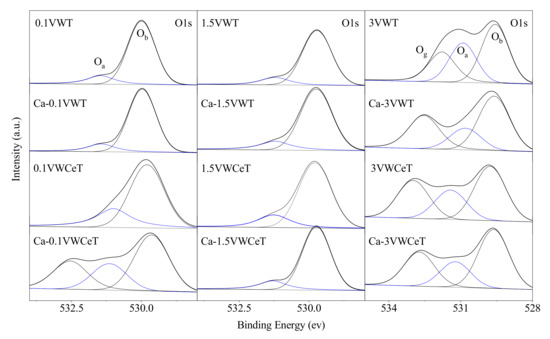
Figure 4.
O1s XPS spectra of catalysts.
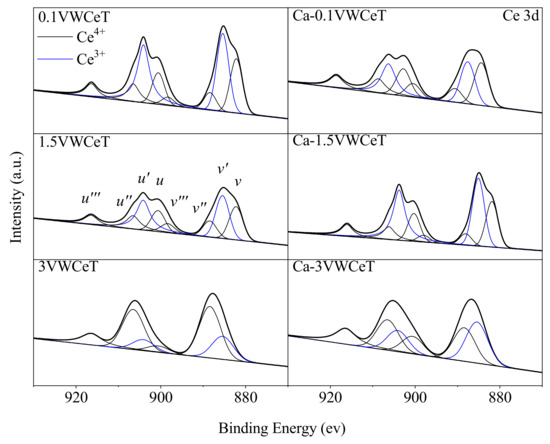
Figure 5.
Ce3d XPS spectra of catalysts.
As Figure 4 shows, the peaks at 529.2~530.3 eV and 531.1~532.5 eV contribute to the lattice oxygen (denoted as Oβ) and surface adsorbed oxygen (denoted as Oα), the peaks over 532 eV is the adsorbed molecular water (denoted as Oγ) [22]. Based on the viewpoints in the previous researches, the surface chemisorbed labile oxygen (Oα) was more active than lattice oxygen, and it always played a key role in oxidation reactions [23]. According to the Oα/(Oα + Oβ) ratio of catalysts in Table 1 calculated from deconvoluted O1s XPS spectra, the Oα/(Oα + Oβ) ratio is consistent with the vanadium content on VWT catalysts, shows the vanadium content increases the catalyst oxidability. The Oα/(Oα + Oβ) ratio of Ce-doped catalyst is higher than that of the undoped catalyst, which indicates that the doping of Ce enhances surface adsorbed oxygen ratio. For the Ca-doped catalysts, the Oα/(Oα + Oβ) ratio for most catalysts declines differently except that for 0.1VWCeT catalyst, which increases by 18.5%, the result is consistent with the SCR activity of these catalysts.
As can be seen from Figure 5, the deconvoluted Ce 3d XPS results of catalysts could be divided into the Ce 3d5/2 spin–orbit components (‘‘v’’) and the Ce 3d3/2 spin–orbit components (‘‘u’’). Moreover, the bands v’ and u’ (representing the 3d104f1 initial electronic state) with blue color curves could be ascribed to surface Ce3+ species, the other (implying the 3d104f0 initial electronic state) with black color curves were attributed to surface Ce4+ atoms [24]. It was reported that Ce3+ came from the ceria defects and was accompanied by the formation of oxygen vacancies, the ratio of Ce3+/(Ce3+ + Ce4+) promotes the oxidation of NO to NO2, thus increases the faster kinetics in SCR reaction [21]. According to the deconvoluted result in Table 1, the Ce3+/(Ce3+ + Ce4+) ratio decreases obviously with vanadium content increases, which indicates that V2O5 species were electron withdrawing groups and it decreases the formation of the reduced Ce species, the Ce3+/(Ce3+ + Ce4+) ratio for 0.1VWCeT is the highest, verified that the Ce modification is more suitable for low vanadium catalyst [15,25]. One interesting point that should be mentioned is the Ce3+/(Ce3+ + Ce4+) ratio decreases from 0.51 to 0.38 for 0.1VWCeT after Ca-doping, while it increases both for 1.5VWCeT and 3VWCeT. Generally, CaO was electron donating groups and it could promote the reduced Ce species, so the alkali resistance has been promoted after ceria addition. The ratio decrease for 0.1VWCeT after Ca-doped might be related to the vanadium status, as the isolated vanadyl (V=O) mainly exists in the low vanadium loaded catalyst [17], showing more resistance to the alkali species.
2.2.3. NH3-TPD
NH3-TPD is adopted to test the surface acidity, Figure 6 shows the NH3-TPD curves of the catalysts, the peak fit of each curve are presented in Figure S1, and the quantity of the acid sites are showed in Figure 7. According the Figure 6 and Figure S1, the total acidity decreases after Ca doping, it also declines with the increase of vanadium content, especially the high temperature at 400–500 °C. The bond strength between ammonia and acid sites becomes weaker with increasing vanadium content [17], might be due to V2O5 covering WO3, hence decreasing surface WO3 exposure.
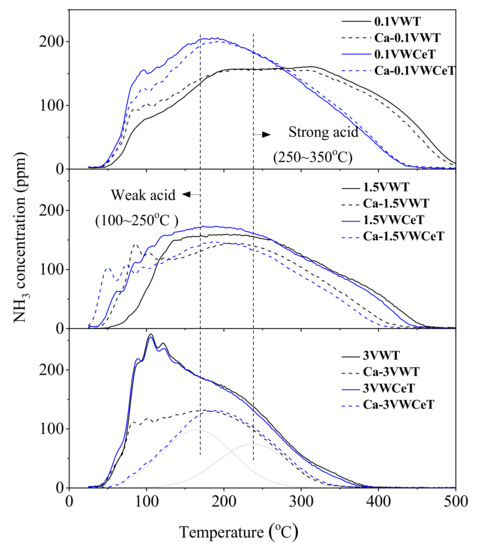
Figure 6.
NH3-TPD curves of the catalysts.
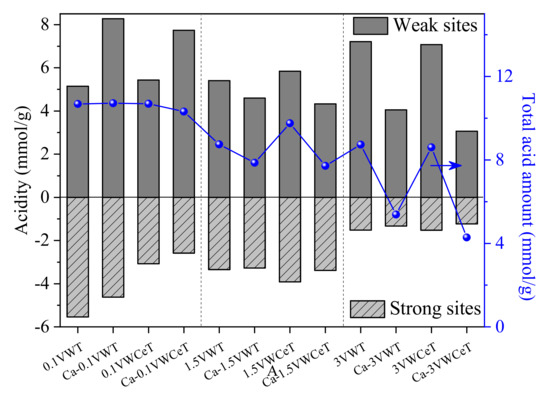
Figure 7.
Quantity of NH3 desorbed from weak and strong acid sites.
The peaks can be divided into two parts, that peaks below 250 °C and at peaks at 250~350 °C, which corresponded to the adsorbed ammonia on weak and strong acid sites, respectively [26]. It can be found that the Ce addition has not change the acid sites obviously, the Ca shows different affects, the strong acid sites for 0.1 V decreases and the weak acid sites increases with Ca-doped, while the strong acid sites for 3 V decreases slightly and the weak acid sites declines obviously. The results of NH3-TPD results correspond well with the SCR performance.
2.2.4. H2-TPR
H2-TPR is adopted to explore the redox properties, Figure 8 shows the H2-TPR profiles on catalysts. Two apparent reduction peaks can be observed on 0.1VWT catalyst centered at 448 °C and 783 °C, which can be assigned to the reduction of V5+ to V3+ and W6+ to W0, respectively [27]. The reduction peaks for 0.1VWCeT catalyst turns stronger and the temperature shifts to higher temperature at 524 °C and 820 °C, shows the combine effect of surface Ce4+ to Ce3+ and the bulk Ce4+ to Ce3+ [9], Ce addition is beneficial to oxygen migration. As vanadium content increases, the reduction peak for both V5+ (to V3+) and W6+ (to W0) shifts slightly to a lower temperature for VWT catalysts, indicating that increasing vanadium content could slightly enhance the reducibility of the vanadium and tungsten oxides [28], Ce addition enhances the reduction peaks with vanadium content increases, and the temperature for reduction peaks shifts to a lower temperature obviously, which shows the reducibility of the active species greatly strengthened.
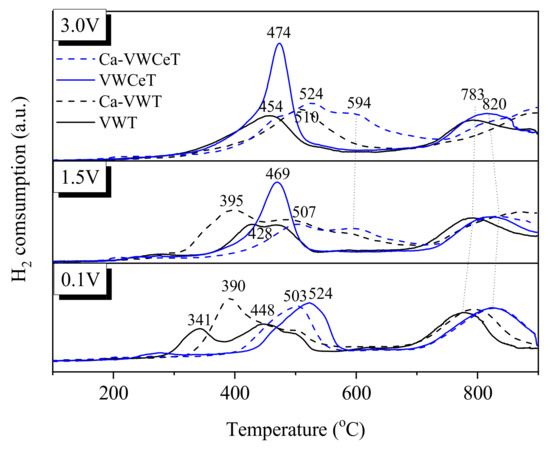
Figure 8.
H2-TPR profiles of the catalysts.
With the addition of Ca, apart for the reduction peaks of 0.1 V catalysts change slightly, that for 1.5 V and 3 V all become weaker, and the reduction temperature shifts to higher temperature, especially to the Ce-doped catalysts, showing the Ca poisoning lessens the reducibility of the active species, which demonstrates the decline of N2O formation after Ca addition.
2.3. SO2 and Water Vapor Effect on Catalysts
Apart from ash, water and SO2 in flue gas may also affect the SCR reaction, so SO2 and water vapor effects on catalysts are also investigated, with the results shown in Figure 9.
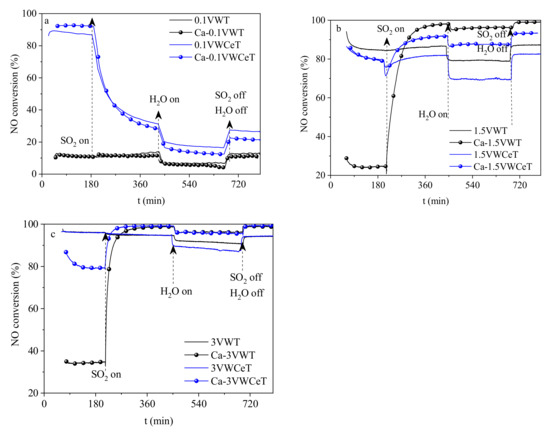
Figure 9.
SO2 and water vapor effect on catalysts. (a) 0.1V, (b) 1.5V, (c) 3V.
As shown in Figure 9, the introduction of SO2 and water shows different effects on catalysts, the SO2 existence greatly decreased the NO conversion on 0.1VWCeT and Ca-0.1VWCeT catalysts [29], water existence can intense this inhibitive effect while it is reversible, shows the CeO2 based catalysts with lower vanadium is hard to resist the sulfur poisoning, Ca-doped 0.1 V catalysts shows nearly no difference with the fresh catalyst. With vanadium increases, the SO2 addition shows quite different effects on the Ca-doped catalysts, the NO conversions for Ca-1.5VWT and Ca-3VWT catalysts clearly increase with SO2 added, even over passed the fresh catalysts, water shows the same effect with the 0.1 V catalysts, apart for the higher water resistance for the high vanadium catalyst. It can be concluded that the vanadium content affects the initial NO conversion, the tendency after SO2 and water addition is similar, the quantity of loaded Ca is the key factor for SO2 resistance, for it favors SO2 adsorption and also physically reduces the cerium acidification process.
2.4. DRIFT Characterization of Adsorbed NH3
NH3 adsorption is much critical to SCR reaction, so the in situ DRIFT was adopted and the 1.5 V catalysts have been selected to investigate the NH3 adsorption profiles on catalysts.
For 1.5VWT catalyst, the negative band at 3660 cm−1 is ascribed to doubly coordinated and bridging O-H stretching modes [30,31,32], the broad bands in the range of 3100–3400 cm−1, 1100–1300 cm−1, and peaks at 1600 cm−1 belong to NH3 adsorption on the Lewis acid sites, whereas peaks at 3060 cm−1, 1669 cm−1 and 1429 cm−1can be assigned to the NH4+ on the Brønsted acid sites [27,33,34]. The region between 1900 cm−1 and 2150 cm−1, centering at around 2000 cm−1 is typical V5+=O [35]. Compared with the fresh catalyst, the intensity of all peaks corresponding to adsorbed ammonia decreases obviously after Ca-doped, especially the L-NH3 at 1100–1300 cm−1 and 1600 cm−1, and B-NH4+ at 1429 cm−1, which corresponds to the weak acid sites, in agreement with the result in Figure 7. As for the catalysts pre-adsorbed with SO2, the intensity of most peaks decreased continuously, except the B-NH4+ at 1429 cm−1, which increases slightly, showing the addition of SO2 mainly attributed to the adsorption of NH4+ bound to the Brønsted acid site at 1429 cm−1.
The equilibrium state of the NH3 adsorption has been shown above, the dynamic changes of NH3 + O2 adsorption over Ca-1.5VWT is measured as Figure S2 and Figure 11 shows, Ca-0.1VWT is also detected for comparison, with the results in Figure S3 and Figure 12, the NH3 + O2 adsorption spectra for Ca-1.5VWT and Ca-0.1VWT are shown in Figures S2 and S3, their absorbance intensity changes are concluded in Figure 11 and Figure 12, respectively. The negative bands at 1383 cm−1 in Figure 10 were attributed to the asymmetric stretching frequencies of O=S=O species for surface sulfates adsorbed on metal oxide [36].
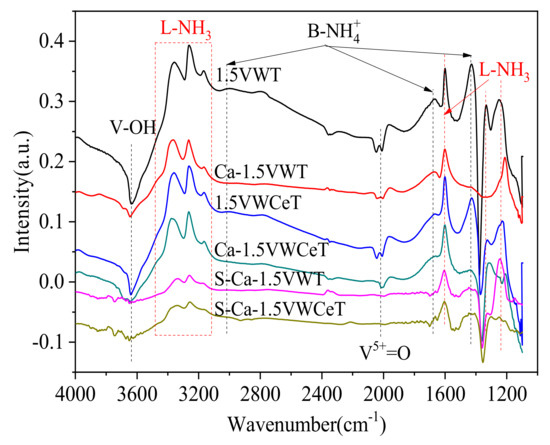
Figure 10.
NH3 adsorption in situ DRIFTS spectra of catalysts (S-Ca-1.5VWT and S-Ca-1.5VWCeT are Ca-1.5VWT and Ca-1.5VWCeT pre-adsorbed with SO2 for 12 h, Reaction temperature: 250 °C).
As Figure 11 shows, the addition of SO2 obviously promotes the NH3 adsorption, for the slop of changes for the bands at 1227 cm−1, 1249 cm−1, 1436 cm−1 sharply increased moving to step 2, while the slop of changes for some of the other band is similar in last stage of step 1 and step 2, this phenomena indicates the NH3 intensity of most peaks are increased, the Ca-doping on 1.5VWT catalyst enhances SO2 adsorption, more acid sites are formed and promotes NH3 adsorption. Most of these acid sites are instantaneous except the B-NH4+ sites at 1436 cm−1, which still can be detected in Figure 10. The intensity of all peaks decreased slowly after SO2 cut off, showing the instantaneous acid sites formed by SO2 is consumed gradually. It can be inferred that the SO2 adsorption product has been changed on Ca-doped catalyst [37], and the newly formed B-NH4+ sites promote NH3 adsorption and SCR reaction.
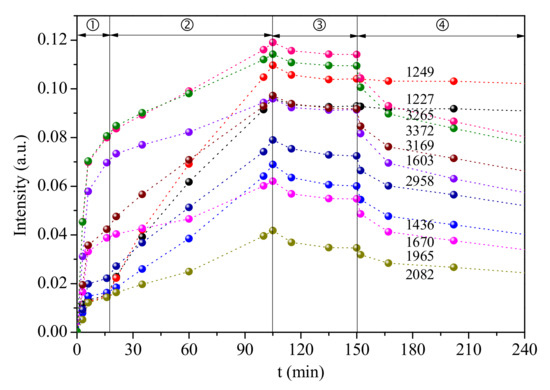
Figure 11.
Dynamic changes of the in situ DRIFT spectra peaks over Ca-1.5VWT catalyst under different gas flow (①N2 + NH3 + O2 ② N2 + NH3 + SO2 + O2 ③ N2 + NH3 + O2 ④N2, Reaction temperature: 250 °C).
Similar experiments were carried out on the Ca-0.1VWT catalyst, while the dynamic changes shown in Figure 12 are different to the illustration in Figure 11. The SO2 addition shows a negligible impact on NH3 adsorption, indicating the Ca content on catalyst is critical for this effect, as the lower Ca-doping can promote the oxidation property of the catalyst, and while it cannot prevent the CeO2 sulfating, higher Ca-doping obviously can be adapted to the high SO2 flue gas, while the alkali poison effect will be aggravated without SO2.
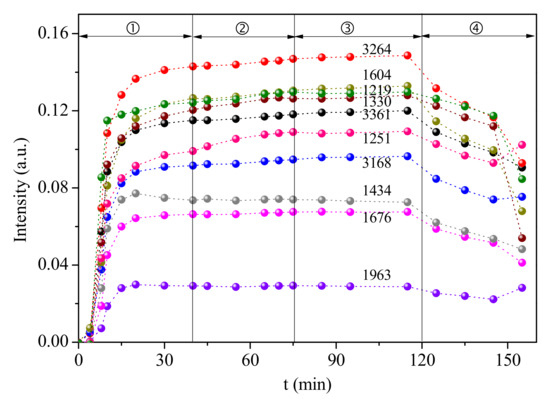
Figure 12.
Dynamic changes of the in situ DRIFT spectra peaks over Ca-0.1VWT catalyst under different gas flow (①N2 + NH3 + O2 ② N2 + NH3 + SO2 + O2 ③ N2 + NH3 + O2 ④N2).
3. Materials and Methods
3.1. Catalysts Pretreatment and Poisoning
The V2O5-WO3/TiO2 and V2O5-WO3-CeO2/TiO2 catalysts with different V2O5 content (0.1 wt%, 1.5 wt%, 3 wt%), 5 wt% CeO2 (when used) and 5 wt% WO3 were prepared by the wet impregnation method. Ammonium metavanadate (NH4VO3, Aladdin, shanghai, China), ammonium metatungstate ((NH4)10H2(W2O7)6∙5H2O, Aladdin, shanghai, China), and cerium nitrate (Ce(NO3)3∙6H2O, Aladdin, shanghai, China) were mixed in the oxalic acid solution in desired proportions, and the commercial TiO2 (P25, Evonik Industries AG, Germany) was used as the support to obtain a slurry. The slurry was then stirred for 4 h, dried at 110 °C for 12 h and calcined at 500 °C for 4 h in air. The fresh catalysts, denoted as xV, where x is the weight percent of vanadia, were then ground and sieved to particles of 0.45~0.3 mm.
Ca poisoned catalysts were prepared by impregnating fresh catalysts into Ca(NO3)2 solution, and then stirred at room temperature for 4 h, dried at 110 °C for 12 h and calcined at 500 °C for 4 h in air. The Ca loadings were evaluated by molar Ca/V ratio, the Ca/V molar ratio was set as 1:1.
3.2. Catalysts Characterization
(1) XRD: X-ray powder diffraction (XRD) patterns were recorded on Rigaku (D/max-2200, Bruker, Billerica, MA, USA) X-ray diffractionmeter by using Cu Kα radiation (K = 0.15405 nm, 40 kV and 200 mA) with the 2θ range from 10–90° at a step of 5° min−1.
(2) XPS: X-ray photoelectron spectroscopy experiments (XPS) were performed by using an ESCALAB 250Xi high performance electron spectrometer (Thermo Fisher Scientific, Waltham, MA, USA). The spectrometer used Al Kα (1486.8 eV) radiation as the excitation source (10 mA, 15 kV). The sample charging effects were compensated for by calibrating all binding energies (BE) with the adventitious C 1s peak at 284.6 eV.
(3) BET: Specific surface areas of samples were measured by nitrogen adsorption at 77 K by using an Autosorb iQ system (version 5.20.17081, Düsseldorf, NRW, Germany). Before each adsorption measurement, approximately 0.1 g of the sample was degassed in N2 (40 mL/min) at 300 °C for 3 h. The specific surface area (SBET) was calculated from the N2 adsorption isotherms by using the BET equation.
(4) NH3-TPD: Temperature programmed desorption of NH3 (NH3-TPD) was conducted in a fixed-bed quartz reactor. For this, 100 mg of each catalyst was loaded in the reactor and preheated at 400 °C under 400 mL/min 5% O2 (N2 balance) for 1 h as the pretreatment. Samples were then cooled down to 20 °C and exposed to a 400 mL/min flow with 1% NH3 in the N2 gas for 1 h. After that, a 400 mL/min N2 purge was performed to sweep the physiosorbed NH3 and the temperature was elevated from 20 °C to 600 °C at a rate of 10 °C/min. The desorbed NH3 was monitored continuously with a Tensor 27 Fourier transformed infrared (FTIR) spectrometer.
(5) H2-TPR: The H2-TPR experiments were performed on automated chemisorption analyzer (Auto Chem II 2920, Micromeritics Instrument Corp., Norcross, GA, USA). Specifically, 50 mg catalyst was pretreated at 150 °C for 1 h. After saturated at 50 °C for 1 h in a purge of 10% H2/He, the catalyst was heated to 900 °C at a rate of 10 °C/min. The consumed H2 was analyzed using Thermal Conductivity Detector (TCD).
(6) In-situ DRIFT: The in-situ DRIFTS experiments were carried out using Tensor 27 Fourier transform infrared. Samples were pretreated with 5% O2 (N2 balance) at 400 °C for 2 h, then cooled to 100 °C. For NH3 adsorption under 100 °C, the samples were treated with 500 ppmv NH3/N2 and the DRIFTS were collected at different temperatures to identify the surface adsorbed species. Spectra were collected with the parameter of 32 scans at a resolution of 4 cm−1. The procedures of the NO and the DRIFTS study under actual conditions were the same with the NH3 adsorption tests except the atmosphere and temperature applied.
3.3. Catalysts Activity
The catalytic tests for the selective catalytic reduction of NO by NH3 were carried out in a fixed-bed quartz reactor with catalyst samples of about 0.1 g and 0.25–0.42 mm in diameter. The catalytic reaction was carried out from 100 °C to 400 °C in the intervals of 25 °C, the reaction pressure was atmospheric pressure, with a total flow rate 100 mL/min and gaseous hourly space velocity (GHSV) was 100,000 h−1. The inlet concentrations of reactants were 500 ppm NO, 500 ppm NH3, 5 vol. % O2, and N2 is the remainder. The effluent gas was continuously detected using a FTIR spectrometer (Nicolet, 6700). The catalytic activities were evaluated by NO conversion (%) and NO turnover frequency (TOF) according to the following equation:
where Fo is the NO feed rate (mol/min), M is the molar V content (mol), and x is the relative NO conversion.
4. Conclusions
Ca poisoned VWT and VWCeT catalysts with different vanadium content were investigated and compared in this study. Ce addition can not only promote the NO conversion, also the alkali resistance has greatly promoted, Ce makes more remarkable promotion effect on 0.1VWT catalyst, and the 0.1VWCeT catalyst shows the best alkali resistance as its TOF increases 63% after calcium added. The formation of the by-product N2O has been inhibited by Ce or Ca addition, and Ca addition shows more obvious decrease in N2O formation.
The decrease of BET surface area after Ca-doping is not directly related to the NO conversion, the Oα/(Oα + Oβ) and Ce3+/(Ce3+ + Ce4+) ratios on catalysts detected by XPS have been affected, the Oα/(Oα + Oβ) ratio on catalysts declines with Ca addition, except that for 0.1VWCeT catalyst, which increases by 18.5%, shows its oxidability has been promoted by Ca addition. Ce modification is more suitable for low vanadium catalyst because the Ce3+/(Ce3+ + Ce4+) ratio decreases obviously with vanadium content increases. The total acidity declines after Ca doping, and Ca shows different effects on weak and strong acids for 0.1~3 V catalysts. Ce addition has no obvious effect on acid sites, while the reducibility of the active species on catalysts has been strengthened by Ce addition. Also, there is an increase vanadium content, but Ca poisoning lessens the reducibility of the active species.
The introduction of SO2 and water greatly decreased the NO conversion for 0.1VWCeT and Ca-0.1VWCeT catalysts, while it shows great promotion for Ca-1.5V and Ca-3V catalysts, shows the CeO2 based catalysts with lower vanadium is hard to resist the sulfur poisoning, and the amount of loaded Ca is the key factor for SO2 resistance, higher Ca loading favors SO2 adsorption and also physically reduces the cerium acidification process.
Based on the in-situ DRIFT, new Brønsted acid sites have formed for Ca-doped catalysts with SO2, and the NH3 adsorption intensity obviously increases for Ca-1.5VWT catalyst, while that for Ca-0.1VWT catalyst is hardly changed. This indicates that the SO2 adsorption product has been changed on the higher Ca-doped catalyst, and the newly formed B-NH4+ sites promote NH3 adsorption and SCR reaction.
Ca doping content on catalyst is critical for SCR reaction, lower Ca-doping can promote the oxidation property of the catalyst, while it cannot prevent the CeO2 sulfating, higher Ca-doping obviously can be adapted to the high SO2 flue gas, while the alkali poison effect will be aggravated without SO2. The conclusion above reminds that during the actual SCR application in cement flue gas, the catalyst is more susceptible to SO2 initially. With gradual Ca doping, the sulfur resistance may increase while the alkali poison effect will be aggravated.
Supplementary Materials
The following are available online at https://www.mdpi.com/article/10.3390/catal11040445/s1, Figure S1: The peak fit of NH3-TPD profiles of the different catalysts, Figure S2: NH3 + O2 adsorption in situ DRIFTS of Ca-1.5VWT catalyst, Figure S3: NH3 + O2 adsorption in situ DRIFTS of Ca-0.1VWT catalyst.
Author Contributions
Conceptualization, T.Z. and Y.G.; methodology, T.Z., Y.G. and X.X.; formal analysis, X.X.; investigation, T.Z., Y.G. and X.X.; writing—original draft preparation, T.Z. and Y.G.; writing—review and editing, H.G., Y.Z. and L.L.; funding acquisition, T.Z. and Y.G., All authors have read and agreed to the published version of the manuscript.
Funding
This research was funded by National Key Research and Development Program of China (No.2017YFC021080401), the National Science Foundation of China (No.51778600), the Key Research and Development Program of Hebei Province (No.19273715D) and the National Engineering Laboratory for Flue Gas Pollutants Control Technology and Equipment (grant no. NEL-KF-2019017).
Data Availability Statement
Data are contained within the article or Supplementary Material.
Conflicts of Interest
The authors declare no conflict of interest.
References
- Guo, Y.; Mu, B.; Liu, P.; Luo, L.; Hao, L.; Li, Y.; Zhu, T. Ammonia emission estimation for the cement industry in northern China. Atmos. Pollut. Res. 2020, 11, 1738–1742. [Google Scholar] [CrossRef]
- Liu, Z.; Ihl Woo, S. Recent advances in catalytic deNOx science and technology. Catal. Rev. 2006, 48, 43–89. [Google Scholar] [CrossRef]
- Kröcher, O.; Elsener, M. Chemical deactivation of V2O5/WO3–TiO2 SCR catalysts by additives and impurities from fuels, lubrication oils, and urea solution: I. Catalytic studies. Appl. Catal. B Environ. 2008, 77, 215–227. [Google Scholar] [CrossRef]
- Liu, H.B.; Chen, X.D.; Gu, J. Research on selective catalytic reduction (SCR) in cement kiln. Adv. Mater. Res. 2014, 864–867, 1441–1444. [Google Scholar] [CrossRef]
- Chen, C.; Cao, Y.; Liu, S.; Chen, J.; Jia, W. Review on the latest developments in modified vanadium-titanium-based SCR catalysts. Chin. J. Catal. 2018, 39, 1347–1365. [Google Scholar] [CrossRef]
- Putluru, S.S.R.; Jensen, A.D.; Riisager, A.; Fehrmann, R. Heteropoly acid promoted V2O5/TiO2 catalysts for NO abatement with ammonia in alkali containing flue gases. Catal. Sci. Technol. 2011, 1, 631–637. [Google Scholar] [CrossRef]
- Xie, X.; Lu, J.; Hums, E.; Huang, Q.; Lu, Z. Study on the Deactivation of V2O5-WO3/TiO2 Selective Catalytic Reduction Catalysts through Transient Kinetics. Energy Fuels 2015, 29, 3890–3896. [Google Scholar] [CrossRef]
- Fu, S.L.; Qiang, S.; Qiang, Y. Mechanism study on the adsorption and reactions of NH3, NO, and O2 on the CaO surface in the SNCR deNOx process. Chem. Eng. J. 2016, 285, 137–143. [Google Scholar] [CrossRef]
- Peng, Y.; Li, J.; Si, W.; Luo, J.; Wang, Y.; Fu, J.; Li, X.; Crittenden, J.; Hao, J. Deactivation and regeneration of a commercial SCR catalyst: Comparison with alkali metals and arsenic. Appl. Catal. B Environ. 2015, 168–169, 195–202. [Google Scholar] [CrossRef]
- Tang, F.; Xu, B.; Shi, H.; Qiu, J.; Fan, Y. The poisoning effect of Na+ and Ca2+ ions doped on the V2O5/TiO2 catalysts for selective catalytic reduction of NO by NH3. Appl. Catal. B Environ. 2010, 94, 71–76. [Google Scholar] [CrossRef]
- Li, X.; Li, X.; Chen, J.; Li, J.; Hao, J. An efficient novel regeneration method for Ca-poisoning V2O5 -WO3 /TiO2 catalyst. Catal. Commun. 2016, 87, 45–48. [Google Scholar] [CrossRef]
- Peng, Y.; Li, J.H.; Chen, L.; Chen, J.H.; Han, J.; Zhang, H.; Han, W. Alkali metal poisoning of a CeO2-WO3 catalyst used in the selective catalytic reduction of NOx with NH3: An experimental and theoretical study. Environ. Sci. Technol. 2012, 46, 2864–2869. [Google Scholar] [CrossRef]
- Yan, Z.; Shi, X.; Yu, Y.; He, H. Alkali resistance promotion of Ce-doped vanadium-titanic-based NH3-SCR catalysts. J. Environ. Sci. 2018, 73, 155–161. [Google Scholar] [CrossRef]
- Wang, H.; Chen, X.; Gao, S.; Wu, Z.; Liu, Y.; Weng, X. Deactivation mechanism of Ce/TiO2 selective catalytic reduction catalysts by the loading of sodium and calcium salts. Catal. Sci. Technol. 2013, 3, 715–722. [Google Scholar] [CrossRef]
- Liu, Z.; Zhang, S.; Li, J.; Zhu, J.; Ma, L. Novel V2O5–CeO2/TiO2 catalyst with low vanadium loading for the selective catalytic reduction of NOx by NH3. Appl. Catal. B Environ. 2014, 158–159, 11–19. [Google Scholar] [CrossRef]
- Hu, G.; Yang, J.; Tian, Y.; Kong, B.; Liu, Q.; Ren, S.; Li, J.; Kong, M. Effect of Ce doping on the resistance of Na over V2O5-WO3/TiO2 SCR catalysts. Mater. Res. Bull. 2018, 104, 112–118. [Google Scholar] [CrossRef]
- Kong, M.; Liu, Q.; Jiang, L.; Tong, W.; Yang, J.; Ren, S.; Li, J.; Tian, Y. K+ deactivation of V2O5-WO3/TiO2 catalyst during selective catalytic reduction of NO with NH3: Effect of vanadium content. Chem. Eng. J. 2019, 370, 518–526. [Google Scholar] [CrossRef]
- Ji, F.; Li, C.; Wang, J.; Wang, J.; Shen, M. New insights into the role of vanadia species as active sites for selective catalytic reduction of NO with ammonia over VOX/CeO2 catalysts. J. Rare Earths 2020, 38, 719–724. [Google Scholar] [CrossRef]
- Guo, Y.; Luo, L.; Mu, B.; Wang, J.; Zhu, T. Ash and alkali-poisoning mechanisms for commercial vanadium-titanic-based catalysts. Ind. Eng. Chem. Res. 2019, 58, 22418–22426. [Google Scholar] [CrossRef]
- Li, P.; Xin, Y.; Li, Q.; Wang, Z.; Zhang, Z.; Zheng, L. Ce-Ti amorphous oxides for selective catalytic reduction of NO with NH3: Confirmation of Ce-O-Ti active sites. Environ. Sci. Technol. 2012, 46, 9600–9605. [Google Scholar] [CrossRef]
- Li, X.; Li, X.S.; Li, J.H.; Hao, J.M. High calcium resistance of CeO2-WO3 SCR catalysts: Structure investigation and deactivation analysis. Chem. Eng. J. 2017, 317, 70–79. [Google Scholar] [CrossRef]
- Boningari, T.; Ettireddy, P.R.; Somogyvari, A.; Liu, Y.; Vorontsov, A.; McDonald, C.A.; Smirniotis, P.G. Influence of elevated surface texture hydrated titania on Ce-doped Mn/TiO2 catalysts for the low-temperature SCR of NOx under oxygen-rich conditions. J. Catal. 2015, 325, 145–155. [Google Scholar] [CrossRef]
- Gu, T.; Liu, Y.; Weng, X.; Wang, H.; Wu, Z. The enhanced performance of ceria with surface sulfation for selective catalytic reduction of NO by NH3. Catal. Commun. 2010, 12, 310–313. [Google Scholar] [CrossRef]
- Zhang, S.; Zhong, Q.; Shen, Y.; Zhu, L.; Ding, J. New insight into the promoting role of process on the CeO2–WO3/TiO2 catalyst for NO reduction with NH3 at low-temperature. J. Coll. Interface 2015, 448, 417–426. [Google Scholar] [CrossRef] [PubMed]
- Liu, X.; Zhao, Z.; Ning, R.; Qin, Y.; Zhu, T.; Liu, F. Ce-Doped V2O5-WO3/TiO2 with Low Vanadium Loadings as SCR Catalysts and the Resistance of H2O and SO2. Catal. Lett. 2019, 150, 375–383. [Google Scholar] [CrossRef]
- Peng, Y.; Li, J.; Si, W.; Luo, J.; Dai, Q.; Luo, X.; Liu, X.; Hao, J. Insight into deactivation of commercial SCR catalyst by arsenic: An experiment and DFT Study. Environ. Sci. Technol. 2014, 48, 13895–13900. [Google Scholar] [CrossRef]
- Wang, C.; Yang, S.; Chang, H.; Peng, Y.; Li, J. Dispersion of tungsten oxide on SCR performance of V2O5-WO3/TiO2: Acidity, surface species and catalytic activity. Chem. Eng. J. 2013, 225, 520–527. [Google Scholar] [CrossRef]
- Xiang, J.; Du, X.; Wan, Y.; Chen, Y.; Ran, J.; Zhang, L. Alkali-driven active site shift of fast SCR with NH3 on V2O5-WO3/TiO2 catalyst via a novel Eley-Rideal mechanism. Catal. Sci. Technol. 2019, 9, 6085–6091. [Google Scholar] [CrossRef]
- Hu, W.; Zhang, Y.; Liu, S.; Zheng, C.; Gao, X.; Nova, I.; Tronconi, E. Improvement in activity and alkali resistance of a novel V-Ce(SO4)2/Ti catalyst for selective catalytic reduction of NO with NH3. Appl. Catal. B Environ. 2017, 206, 449–460. [Google Scholar] [CrossRef]
- Ganjkhanlou, Y.; Janssens, T.V.W.; Vennestrøm, P.N.R.; Mino, L.; Paganini, M.C.; Signorile, M.; Bordiga, S.; Berlier, G. Location and activity of VOx species on TiO2 particles for NH3-SCR catalysis. Appl. Catal. B 2020, 278. [Google Scholar] [CrossRef]
- Song, I.; Lee, J.; Lee, G.; Han, J.W.; Kim, D.H. Chemisorption of NH3 on Monomeric Vanadium Oxide Supported on Anatase TiO2: A Combined DRIFT and DFT Study. J. Phys. Chem. C 2018, 122, 16674–16682. [Google Scholar] [CrossRef]
- Lai, J.-K.; Wachs, I.E. A Perspective on the Selective Catalytic Reduction (SCR) of NO with NH3 by Supported V2O5-WO3/TiO2 Catalysts. ACS Catal. 2018, 8, 6537–6551. [Google Scholar] [CrossRef]
- Topsoe, N.Y.; Topsoe, H.; Dumesic, J.A. Vanadia/Titania catalysts for selective catalytic reduction (SCR) of nitric-oxide by ammonia: I. Combined temperature-programmed in-situ FTIR and on-line mass-spectroscopy studies. J. Catal. 1995, 151, 226–240. [Google Scholar] [CrossRef]
- Topsøe, N. Mechanism of the selective catalytic reduction of nitric oxide by ammonia elucidated by in situ on-line fourier transform infrared spectroscopy. Science 1994, 265, 1217–1219. [Google Scholar] [CrossRef]
- Li, X.; Li, J.; Peng, Y.; Si, W.; He, X.; Hao, J. Regeneration of commercial SCR catalysts: Probing the existing forms of arsenic oxide. Environ. Sci. Technol. 2015, 49, 9971–9978. [Google Scholar] [CrossRef]
- Wang, Y.; Yi, W.; Yu, J.; Zeng, J.; Chang, H. Novel Methods for Assessing the SO2 Poisoning Effect and Thermal Regeneration Possibility of MOx-WO3/TiO2 (M = Fe, Mn, Cu, and V) Catalysts for NH3-SCR. Environ. Sci. Technol. 2020, 54, 12612–12620. [Google Scholar] [CrossRef]
- Yu, Y.; Meng, X.; Chen, J.; Yin, L.; Qiu, T.; He, C. Deactivation mechanism and feasible regeneration approaches for the used commercial NH3-SCR catalysts. Environ. Technol. 2016, 37, 828–836. [Google Scholar] [CrossRef]
Publisher’s Note: MDPI stays neutral with regard to jurisdictional claims in published maps and institutional affiliations. |
© 2021 by the authors. Licensee MDPI, Basel, Switzerland. This article is an open access article distributed under the terms and conditions of the Creative Commons Attribution (CC BY) license (https://creativecommons.org/licenses/by/4.0/).